RADAR Rainfall Calibration of Flood Models The Future...
12
A Case Study of the Stanley River Catchment Daly Stormwater 2016 - Daly 1 , Reichard 2 , Hansell 3 , Clark 4 1 of 12 RADAR Rainfall Calibration of Flood Models – The Future for Catchment Hydrology? A Case Study of the Stanley River catchment in Moreton Bay, Qld A Daly 1 Principal Engineer, Water Technology Pty Ltd, Brisbane, QLD, Australia Email: [email protected] L Reichard 2 International Business Developer, HydroLogic BV, Amersfoort, Netherlands Email: [email protected] G Hansell 3 Project Engineer, Water Technology Pty Ltd, Brisbane, QLD, Australia Email: [email protected] S Clark 4 Director, Senior Principal Engineer, Water Technology Pty Ltd, Brisbane, QLD, Australia Email: [email protected] Abstract The calibration of flood models is a fundamental component of informing flood risk management and planning relating to flood hydrology. Traditional calibration techniques are heavily reliant on the availability of historical rainfall data sourced from existing, discrete location rainfall gauges. Typically, these include a combination of Council, Bureau of Meteorology (BoM) and Department of Natural Resources and Mines (DNRM) rain gauges. Even with such a network and available data sets, spatial variation in rainfall distribution can still lead to significant uncertainty in hydrologic estimates. The use of calibrated RADAR rainfall data for model calibration represents a relatively new and innovative approach in the area of catchment hydrology in Australia, which can overcome some of the limitations of using discrete location gauge data. While quantitative RADAR rainfall estimates have been possible for some time, recent advances in calibrated RADAR rainfall data are of specific interest in improving our understanding of catchment rainfall patterns, which ultimately contributes to greater certainty in the overall calibration process. This paper considers the use of calibrated RADAR rainfall data in the model calibration process and is presented based on a case study of the Stanley River catchment located in Moreton Bay Regional Council (MBRC). This paper concludes that calibrated RADAR rainfall data can contribute to calibration outcomes and represents a further source of information that should be used where available as part of the overall model calibration process. 1. INTRODUCTION The Stanley River catchment is located approximately 28km north-west of the Caboolture Central Business District (CBD), is some 65km north of the Brisbane CBD and is more than 480km 2 in area. Part of the larger Brisbane River catchment, the Stanley River discharges to Somerset Dam which in turn is released into Wivenhoe Dam. A general illustration of the catchment is shown in Figure 1.
Transcript of RADAR Rainfall Calibration of Flood Models The Future...

A Case Study of the Stanley River Catchment Daly
Stormwater 2016 - Daly1, Reichard2, Hansell3, Clark4 1 of 12
RADAR Rainfall Calibration of Flood Models – The Future for Catchment Hydrology? A Case Study of the Stanley River
catchment in Moreton Bay, Qld
A Daly1
Principal Engineer, Water Technology Pty Ltd, Brisbane, QLD, Australia Email: [email protected]
L Reichard2
International Business Developer, HydroLogic BV, Amersfoort, Netherlands Email: [email protected]
G Hansell3 Project Engineer, Water Technology Pty Ltd, Brisbane, QLD, Australia
Email: [email protected]
S Clark4 Director, Senior Principal Engineer, Water Technology Pty Ltd, Brisbane, QLD, Australia
Email: [email protected] Abstract The calibration of flood models is a fundamental component of informing flood risk management and planning relating to flood hydrology. Traditional calibration techniques are heavily reliant on the availability of historical rainfall data sourced from existing, discrete location rainfall gauges. Typically, these include a combination of Council, Bureau of Meteorology (BoM) and Department of Natural Resources and Mines (DNRM) rain gauges. Even with such a network and available data sets, spatial variation in rainfall distribution can still lead to significant uncertainty in hydrologic estimates. The use of calibrated RADAR rainfall data for model calibration represents a relatively new and innovative approach in the area of catchment hydrology in Australia, which can overcome some of the limitations of using discrete location gauge data. While quantitative RADAR rainfall estimates have been possible for some time, recent advances in calibrated RADAR rainfall data are of specific interest in improving our understanding of catchment rainfall patterns, which ultimately contributes to greater certainty in the overall calibration process. This paper considers the use of calibrated RADAR rainfall data in the model calibration process and is presented based on a case study of the Stanley River catchment located in Moreton Bay Regional Council (MBRC). This paper concludes that calibrated RADAR rainfall data can contribute to calibration outcomes and represents a further source of information that should be used where available as part of the overall model calibration process.
1. INTRODUCTION
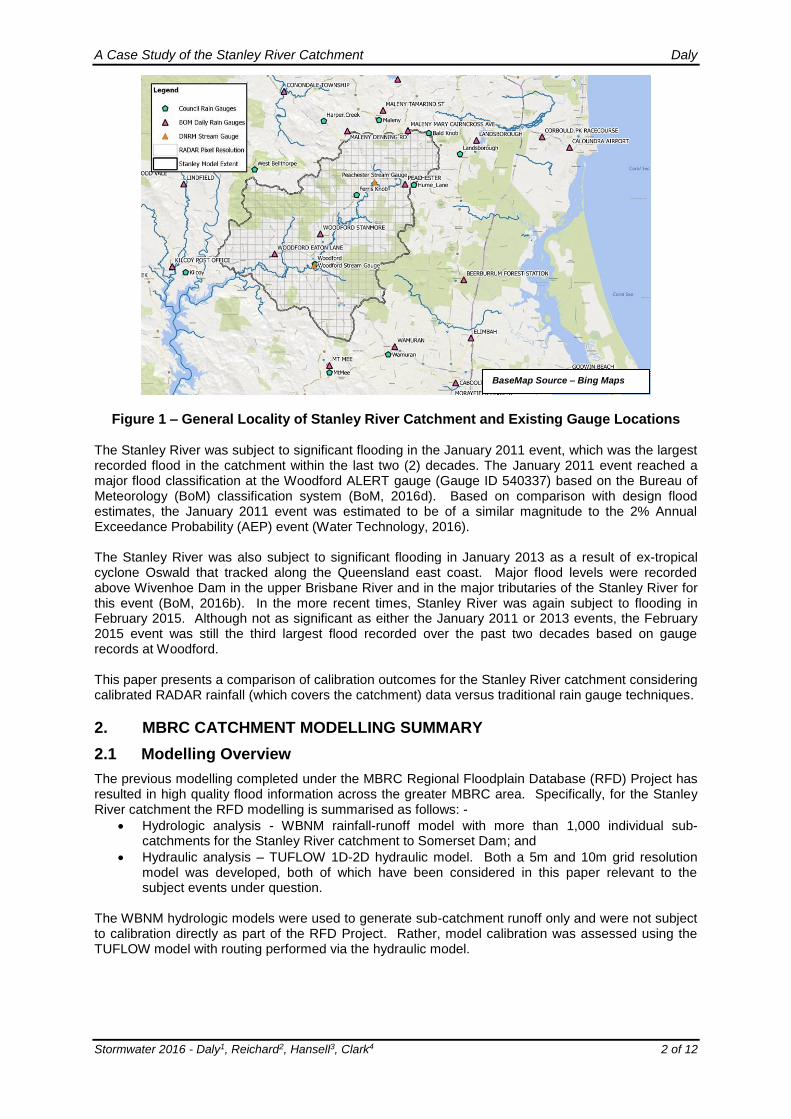
The Stanley River catchment is located approximately 28km north-west of the Caboolture Central Business District (CBD), is some 65km north of the Brisbane CBD and is more than 480km2 in area. Part of the larger Brisbane River catchment, the Stanley River discharges to Somerset Dam which in turn is released into Wivenhoe Dam. A general illustration of the catchment is shown in Figure 1.
A Case Study of the Stanley River Catchment Daly
Stormwater 2016 - Daly1, Reichard2, Hansell3, Clark4 2 of 12
Figure 1 – General Locality of Stanley River Catchment and Existing Gauge Locations The Stanley River was subject to significant flooding in the January 2011 event, which was the largest recorded flood in the catchment within the last two (2) decades. The January 2011 event reached a major flood classification at the Woodford ALERT gauge (Gauge ID 540337) based on the Bureau of Meteorology (BoM) classification system (BoM, 2016d). Based on comparison with design flood estimates, the January 2011 event was estimated to be of a similar magnitude to the 2% Annual Exceedance Probability (AEP) event (Water Technology, 2016). The Stanley River was also subject to significant flooding in January 2013 as a result of ex-tropical cyclone Oswald that tracked along the Queensland east coast. Major flood levels were recorded above Wivenhoe Dam in the upper Brisbane River and in the major tributaries of the Stanley River for this event (BoM, 2016b). In the more recent times, Stanley River was again subject to flooding in February 2015. Although not as significant as either the January 2011 or 2013 events, the February 2015 event was still the third largest flood recorded over the past two decades based on gauge records at Woodford. This paper presents a comparison of calibration outcomes for the Stanley River catchment considering calibrated RADAR rainfall (which covers the catchment) data versus traditional rain gauge techniques.
2. MBRC CATCHMENT MODELLING SUMMARY
2.1 Modelling Overview
The previous modelling completed under the MBRC Regional Floodplain Database (RFD) Project has resulted in high quality flood information across the greater MBRC area. Specifically, for the Stanley River catchment the RFD modelling is summarised as follows: -
Hydrologic analysis - WBNM rainfall-runoff model with more than 1,000 individual sub-catchments for the Stanley River catchment to Somerset Dam; and
Hydraulic analysis – TUFLOW 1D-2D hydraulic model. Both a 5m and 10m grid resolution model was developed, both of which have been considered in this paper relevant to the subject events under question.
The WBNM hydrologic models were used to generate sub-catchment runoff only and were not subject to calibration directly as part of the RFD Project. Rather, model calibration was assessed using the TUFLOW model with routing performed via the hydraulic model.
BaseMap Source – Bing Maps

A Case Study of the Stanley River Catchment Daly
Stormwater 2016 - Daly1, Reichard2, Hansell3, Clark4 3 of 12
2.2 Rainfall and Water Level Gauge Summary
Figure 1 previously provides a summary of the existing rainfall gauge and water level gauges in the general locality of the Stanley River catchment. These gauges include a mixture of gauges owned and maintained by DNRM, BoM as well as MBRC directly, with MBRC advising that the MBRC gauge data is additionally shared with the BoM. Depending on the event, there is between two (2) to five (5) rainfall gauges within the Stanley River catchment, two (2) of which are MBRC gauges as illustrated in Figure 1. There are several additional rainfall gauges located up to 2km outside of the catchment boundary, the majority of which are located to the north of the catchment. In comparison, there are 530 radar pixels that intersect the Stanley River Catchment. Due to the large catchment area involved, and the relatively (compared to other areas within MBRC) smaller development pressure, there correspondingly fewer resources have been provided for understanding and treating flood risk within the Stanley River catchment, and this is reflected in that there are fewer rainfall gauges installed within the catchment.
3. CALIBRATED RADAR RAINFALL DATA
3.1 Availability and Use
At present, calibrated RADAR availability is reported by BoM to be available at BoM Doppler RADAR sites (BoM, 2016c), which covers nearly all capital cities across Australia. For coverage in the greater Brisbane area, this includes the Mt Stapylton RADAR site.
3.2 HydroNET
Calibrated RADAR rainfall data products are available through the HydroNET software platform developed by HydroLogic Systems in the Netherlands. Water Technology is the distributer of HydroNET in Australia. HydroNET provides a platform for delivery of a range of the commercially available RADAR data products that are available from the BoM. In the context of this paper, this specifically includes the Mt Stapylton “Rainfields” calibrated RADAR rainfall product based on a 1km by 1km grid and with a 30 minute rainfall period. The calibrated RADAR data in HydroNET can also be downscaled from 30 minute product to a 6 minute product to further enhance rainfall temporal pattern.
3.3 Potential Benefits of RADAR
Appreciation of rainfall and subsequent catchment runoff processes within a hydrologic context is typically limited by the availability of existing rain gauge data. This is a result of both the relatively short history of rainfall gauge records, but also the limited number of rainfall gauges (which can only quantify rainfall at a specific location). In the context of hydrological assessments generally, it is considered that there are significant benefits in considering RADAR data to enhance our understanding of the overall catchment rainfall-runoff processes and moreover to improve certainty in outcomes. The benefits include: -
High spatial distribution;
Good coverage across Australia and particularly along the east coast;
A source of data to inform catchment rainfall and in the absence of any available rain gauges;
Ease of use (i.e. RADAR readily accessible via the HydroNET platform); and
RADAR sites are maintained by BoM. For Council’s, there are no additional hardware or infrastructure requirements, including future maintenance costs or additional effort in utilising the data.
The potential for RADAR to inform catchment studies is perhaps best summarised in the following quote by Ashton (1963): - “No discussion of studies on areal rainfall for hydrometeorological purposes is complete without reference to the potential of radar scanning. Application of radar to the problem of estimating area and intensity of rainfall in a series of observations is only at a rudimentary stage in Australia. The potential value is so great, however, that all improvements, as soon as available, should be applied in the field on a continuing basis. Here we have something so obviously useful that neglect of it is unthinkable”

A Case Study of the Stanley River Catchment Daly
Stormwater 2016 - Daly1, Reichard2, Hansell3, Clark4 4 of 12
4. METHOD AND RESULTS
4.1 Method Overview
This paper compares the use of calibrated RADAR rainfall data with traditional techniques using the Stanley River catchment as the case study. The following summary of the method is provided: -
A hydrologic model for the January 2011 events was prepared as outlined in Section 2. The previous model included a WBNM hydrologic model, with the January 2011 calibration completed using traditional calibration processes based on available rain and water level gauges as presented in Section 2.2 and Figure 1. The WBNM model output files for the January 2011 event were used to extract total rainfall depths for each sub-catchment throughout the Stanley River catchment and for comparison with the calibrated RADAR rainfall data.
Calibrated RADAR rainfall data for the subject events, event periods and sub-catchment breakdowns were extracted using HydroNET and the BoM Mt Stapylton Rainfields data product. Spatial and temporal rainfall variation was then compared against selected rain gauge data.
The Rainfields calibrated RADAR rainfall data was then applied to the WBNM model and analysed to generate sub-catchment runoff for each of the events. No change was made to the WBNM model calibration parameters through this process (i.e. routing, rainfall loss model, etc).
The WBNM sub-catchment runoff was then applied to the TUFLOW hydraulic model developed as part of the RFD Project as outlined in Section 2. This included a series of source inflows based on “SA” inflows from individual WBNM sub-catchments. The TUFLOW models were re-analysed and in the absence of any other model changes in order to directly compare hydraulic calibration outcomes between rain gauge data versus calibrated RADAR rainfall data.
4.2 January 2011 Event Result Comparison
The comparison of results for the January 2011 event are illustrated separately below and include: -
Figure 2 - Spatial comparison of rainfall event totals (gauge data versus calibrated RADAR rainfall data) across the Stanley Creek catchment;
Figure 3 - Temporal pattern comparison including cumulative rainfall totals between selected daily rain gauge records (i.e. Ferris Knob and Woodford gauges, both located within the catchment) versus calibrated RADAR rainfall data;
Figure 4 – Comparison of flow and water levels based on TUFLOW hydraulic models (i.e. traditional calibration versus calibrated RADAR rainfall data) against recorded conditions at both the Peachester and Woodford gauges.
Figure 2 – January 2011 Event – Event Rainfall Totals
WBNM Processed Data RADAR Data

A Case Study of the Stanley River Catchment Daly
Stormwater 2016 - Daly1, Reichard2, Hansell3, Clark4 5 of 12
Figure 3 – January 2011 Event – Temporal and Cumulative Rainfall Comparisons (Red = RADAR, Black = Gauge)
0
100
200
300
400
500
600
700
800
900
1000
126.0
127.0
128.0
129.0
130.0
131.0
132.0
133.0
134.0
135.0
136.0
Disc
harg
e (m
3/s)
Wat
er L
evel
(mAH
D)
0
200
400
600
800
1000
1200
1400
1600
1800
2000
108.0
109.0
110.0
111.0
112.0
113.0
114.0
115.0
116.0
117.0
118.0
09/01/2011 03:00 09/01/2011 15:00 10/01/2011 03:00 10/01/2011 15:00 11/01/2011 03:00 11/01/2011 15:00 12/01/2011 03:00
Dis
char
ge (
m3/
s)
Wat
er L
evel
(mA
HD
)
DNRM_Gauged_Height TUFLOW_Gauge_Height TUFLOW_Radar_Height
DNRM_Gauged_Flow TUFLOW_Gauge_Flow TUFLOW_Radar_Flow
Figure 4 – January 2011 Event – Flow and Water Level Time Series
Ferris Knob Gauge
Discharge
Level
Level
Discharge
Peachester
Woodford
Woodford Gauge

A Case Study of the Stanley River Catchment Daly
Stormwater 2016 - Daly1, Reichard2, Hansell3, Clark4 6 of 12
4.3 January 2013 Event Result Comparison
The comparison of results for the January 2013 event are illustrated separately below and include: -
Figure 5 - Spatial rainfall event totals for calibrated RADAR rainfall data across the Stanley Creek catchment;
Figure 6 - Temporal pattern comparison including cumulative rainfall totals between selected daily rain gauge records (i.e. Woodford Stanmore and Peachester gauges) versus calibrated RADAR rainfall data;
Figure 7 – Comparison of flow and water levels based on TUFLOW calibrated RADAR rainfall data against that recorded at both the Peachester and Woodford gauges.
Figure 5 – January 2013 Event – Calibrated RADAR Rainfall Event Totals
0
100
200
300
400
500
600
700
0
5
10
15
20
25
30
35
24/01/2013 00:00 25/01/2013 00:00 26/01/2013 00:00 27/01/2013 00:00 28/01/2013 00:00 29/01/2013 00:00 30/01/2013 00:00
Cu
mu
lati
ve E
ven
t R
ain
fall
To
tal (
mm
)
Ra
infa
ll In
ten
sity
(mm
/hr)
0
100
200
300
400
500
600
700
0
5
10
15
20
25
30
35
24/01/2013 00:00 25/01/2013 00:00 26/01/2013 00:00 27/01/2013 00:00 28/01/2013 00:00 29/01/2013 00:00 30/01/2013 00:00
Cu
mu
lati
ve E
ven
t R
ain
fall
To
tal (
mm
)
Ra
infa
ll In
ten
sity
(mm
/hr)
Figure 6 – January 2013 Event – Temporal and Cumulative Rainfall Comparisons (Red = RADAR, Black = Gauge)
Woodford Stanmore Gauge Peachester Gauge

A Case Study of the Stanley River Catchment Daly
Stormwater 2016 - Daly1, Reichard2, Hansell3, Clark4 7 of 12
0
100
200
300
400
500
600
700
800
900
1000
126.0
127.0
128.0
129.0
130.0
131.0
132.0
133.0
134.0
135.0
136.0
Dis
char
ge (
m3/
s)
Wat
er L
evel
(mA
HD
)TUFLOW_RADAR_Height
DNRM_Height (derrived from DNRM rating)
DNRM_Discharge
TUFLOW_RADAR_Flow
0
100
200
300
400
500
600
700
800
108.0
109.0
110.0
111.0
112.0
113.0
114.0
115.0
116.0
26/01/2013 12:00 27/01/2013 12:00 28/01/2013 12:00 29/01/2013 12:00
Disc
harg
e (m
3/s)
Wat
er L
evel
(mAH
D)
Figure 7 – January 2013 Event – Flow and Water Level Time Series
4.4 February 2015 Event Result Comparison
The comparison of results for the May 2015 event are illustrated separately below and include: -
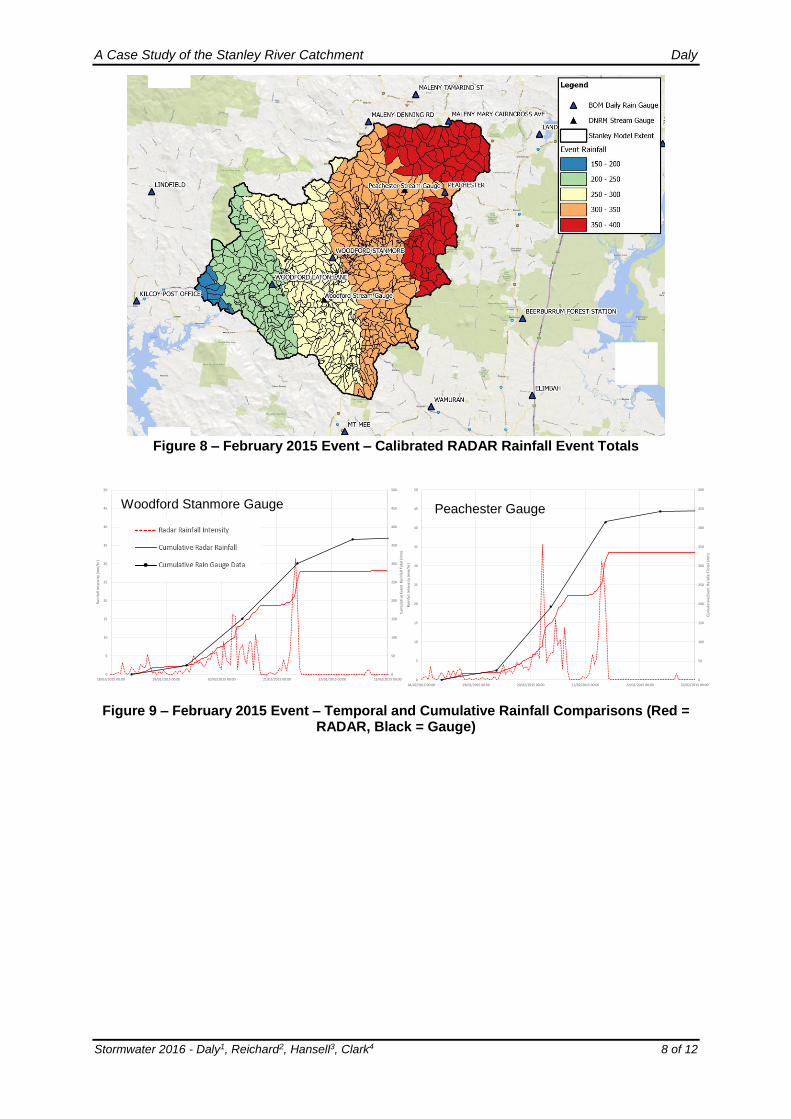
Figure 8 - Spatial comparison of rainfall event totals (gauge data versus RADAR data) across the Stanley River catchment;
Figure 9 - Temporal pattern comparison including cumulative rainfall totals between daily rain gauge records versus calibrated RADAR rainfall data; and
Figure 10 - Comparison of flow and water levels based on TUFLOW calibrated RADAR rainfall data against that recorded at both the Peachester and Woodford gauges.
Discharge
Level
Discharge
Level
Woodford
Peachester
A Case Study of the Stanley River Catchment Daly
Stormwater 2016 - Daly1, Reichard2, Hansell3, Clark4 8 of 12
Figure 8 – February 2015 Event – Calibrated RADAR Rainfall Event Totals
0
50
100
150
200
250
300
350
400
450
500
0
5
10
15
20
25
30
35
40
45
50
18/02/2015 00:00 19/02/2015 00:00 20/02/2015 00:00 21/02/2015 00:00 22/02/2015 00:00 23/02/2015 00:00
Cu
mu
lati
ve E
ven
t R
ain
fall
To
tal (
mm
)
Ra
infa
ll In
ten
sity
(mm
/hr)
0
50
100
150
200
250
300
350
400
450
500
0
5
10
15
20
25
30
35
40
45
50
18/02/2015 00:00 19/02/2015 00:00 20/02/2015 00:00 21/02/2015 00:00 22/02/2015 00:00 23/02/2015 00:00
Cu
mu
lati
ve E
ven
t R
ain
fall
To
tal (
mm
)
Ra
infa
ll In
ten
sity
(mm
/hr)
Figure 9 – February 2015 Event – Temporal and Cumulative Rainfall Comparisons (Red = RADAR, Black = Gauge)
Woodford Stanmore Gauge Peachester Gauge

A Case Study of the Stanley River Catchment Daly
Stormwater 2016 - Daly1, Reichard2, Hansell3, Clark4 9 of 12
0
50
100
150
200
250
300
350
400
450
126.0
127.0
128.0
129.0
130.0
131.0
132.0
133.0
134.0
135.0
Dis
char
ge (
m3/
s)
Wat
er L
evel
(mA
HD
)DNRM_Gauge_Height (m)
TUFLOW_RADAR_Height
DNRM_Discharge (m3/s)
TUFLOW_RADAR_Flow
0
100
200
300
400
500
600
700
800
108.0
109.0
110.0
111.0
112.0
113.0
114.0
115.0
116.0
19/02/2015 00:00 20/02/2015 00:00 21/02/2015 00:00 22/02/2015 00:00 23/02/2015 00:00 24/02/2015 00:00D
isch
arge
(m
3/s)
Wat
er L
evel
(mA
HD
)
Figure 10 – February 2015 Event – Flow and Water Level Time Series
4.5 Discussion
4.5.1 Spatial and Temporal Rainfall There is a significant spatial difference in rainfall event totals for the Stanley River catchment when comparing rain gauge data processed using WBNM versus calibrated RADAR rainfall data for the January 2011 event as presented in Figure 2. This is particularly the case in the eastern catchment areas where there is an absence of existing rain gauge data. The calibrated RADAR rainfall data results in higher cumulative rainfall depth throughout a large portion of the catchment when compared to the rain gauge data included in the WBNM model for the same event. The use of calibrated RADAR rainfall data for the January 2011 event has shown there to be a significant contrast in spatial rainfall variability across the catchment that is unable to be shown with consideration of existing rain gauge data alone. Total rainfall depths from the calibrated RADAR rainfall data for both the January 2011 and 2013 events shown in Figures 3 and 6 were found to be on average approximately 10% lower compared to the rain gauge records based on the cumulative totals at two (2) gauge locations. For the February 2015 event shown in Figure 9, the calibrated RADAR rainfall was found to be approximately 25% lower in cumulative total rainfall compared to gauge data. Cumulative rainfall depth comparisons will however be very much dependent on the spatial location selected and when considering the variation in spatial pattern of rainfall across the catchment as shown in Figures 2, 5 and 8. While the calibrated RADAR rainfall is very similar to the available gauge data for the January 2011 and 2013 events, there
Discharge
Level
Discharge
Level
Woodford
Peachester

A Case Study of the Stanley River Catchment Daly
Stormwater 2016 - Daly1, Reichard2, Hansell3, Clark4 10 of 12
are significant differences for the February 2015 event, especially towards the end of the event temporal pattern. For the February 2015 event, the difference appears to occur in combination with the periods of highest rainfall intensities. There is good consistency in the rainfall temporal patterns shown between the calibrated RADAR rainfall data and the rainfall gauge records as presented in Figure 3. There are numerous factors (that are not the subject of this paper) that may be contributing to the differences between the calibrated RADAR rainfall and the observed rainfall gauge observations. Reference is made to Seed et al (2002) which provides a more extensive discussion relating to the potential issues and errors associated with RADAR rainfall and gauge rainfall differences. In respect to the Rainfields calibrated RADAR product prepared by the BoM, BoM have advised that only the 1-minute Automatic Weather Station (AWS) data is used in the calibration process. The pluviometer hourly METAR data and daily gauge data sets are not considered in the RADAR calibration products. There is no 1-minute AWS rainfall gauges located directly within the catchment. The closest 1-minute AWS rainfall gauge is located at Nambour some 15km to the NNE. The 2011 and 2013 calibration events show similar outcomes in respect to the comparisons and match between the gauge rainfall versus the calibrated RADAR rainfall. However, the 2015 event shows an increased discrepancy and appears to be inconsistent with either of the 2011 and 2013 events, the cause of which may again be dependent on a number of factors. The 2015 event therefore warrants further review which is outside the scope of this paper. Irrespective of the above, it is suggested that the calibrated RADAR rainfall data could be significantly enhanced where the local existing gauge network is included in the calibration process. An optimum calibration outcome would likely result where the local rain gauge data is considered and to provide a re-calibrated product. Such a calibration outcome is able to be achieved through the HydroNET platform but has not been done so for the purposes of this paper. 4.5.2 Discharge Comparison Comparisons of event discharges have been made for all three (3) events at both the Woodford and Peachester gauge locations as presented in Figures 4, 7 and 10 and the following provides a summary of the results: -
January 2011 event – Peak discharges are larger based on the calibrated RADAR rainfall compared to either of the MBRC gauge WBNM model (WT, 2015) as well as the DNRM gauge records (DNRM, 2016). It is considered that the calibrated RADAR rainfall data results in a very good match to the overall shape of the hydrograph, including the dual peak nature of the event and associated event timing;
January 2013 event - Peak discharges utilising calibrated RADAR rainfall are larger based on the compared to the DNRM gauge records (DNRM, 2016). There is no MBRC WBNM model calibration available for comparison to this event. Again, it is considered that the calibrated RADAR rainfall data results in a very good match to the overall shape and timing of the hydrograph;
February 2015 event - Peak discharges utilising calibrated RADAR as compared to traditional rain gauge techniques were lower at the Peachester gauge and approximately the same at the Woodford gauge when compared to the gauge records. There is again however a very good match to the overall shape and timing of the hydrograph using the calibrated RADAR rainfall data.
In considering the flow comparisons to gauge records as outlined above, flow records are derived using the site rating curve at the subject gauge location. The highest gaugings undertaken at the Peachester and Woodford gauges were in 2016 and 1992 at flows of approximately 300m3/s and 540m3/s respectively for the gauges (DNRM, 2016). We note for the Woodford gauge the highest gauge rating is not used in the current rating curve. For comparison, this is approximately equivalent to the magnitude of the February 2015 event, with the January 2011 event being some two (2) times larger than the highest gauged flow. In considering the derived rating through the hydraulic model, the hydraulic model was found to consistently over-estimate the flow for the same water level and in comparison to the DNRM rating curves at both gauge sites (DNRM, 2016). Further investigation is therefore warranted in respect to the rating curves at the gauges which is beyond the scope of this paper.

A Case Study of the Stanley River Catchment Daly
Stormwater 2016 - Daly1, Reichard2, Hansell3, Clark4 11 of 12
4.5.3 Water Level Comparison In addition to the flow comparisons outlined above, comparisons have also been made in respect to water levels recorded at the gauges and across all three (3) events previously presented in Figures 4, 7 and 10. The following provides a summary of the results (subject to the qualification around rating curve investigations mentioned in the previous paragraph): -
January 2011 event – water levels using calibrated RADAR rainfall were 600mm lower at the Woodford gauge and 200mm lower at the Peachester gauge compared to the gauge records. By comparison, the MBRC RFD model (WT, 2015) was also low by 1000mm and 400mm respectively at the same gauge sites. There was a good overall match to the recorded water level time series however.
January 2013 event - water levels using calibrated RADAR rainfall were 400mm lower at the Woodford gauge and 100mm lower at the Peachester gauge compared to the gauge records. Again, there was a good overall match to the recorded water level time series.
February 2015 event - water levels using calibrated RADAR rainfall were found to be 500mm low at both gauges compared to the gauge records. There is likely to be an underestimate of flow for this event as discussed previously. Despite the difference, there was again a good overall match to the recorded water level time series and including the dual peaks to the event.
The hydraulic model results using the calibrated RADAR rainfall data predicted consistently lower water levels, (as a result of the consistently lower flows) compared to the recorded water level gauge records for the same events. As noted previously, further investigation work and model re-calibration is necessary to clarify discrepancies associated with gauge ratings and such is beyond the scope of this paper. For all the event comparisons outlined above, it should be noted that the consistent calibration parameter set as developed during MBRC RFD process has been applied to both the hydrologic and hydraulic models to enable a direct comparison in between calibrated RADAR rainfall and gauge rainfall. No attempt has been made to otherwise re-calibrate the model outcomes.
5. CONCLUSIONS
The key conclusions made from this paper are summarised as follows: -
The use of calibrated RADAR rainfall in model calibration and catchment investigations represents a relatively new and innovative approach in hydrologic processes in Australia.
Calibrated RADAR rainfall data provides significant improvements in our understanding and appreciation of spatial and temporal rainfall variability throughout a catchment that is unable to be detected in the absence of an extensive existing rain gauge network.
Calibrated RADAR rainfall data has the potential (subject to RADAR location) to provide a complete rainfall spatial and temporal coverage of a catchment compared to consideration of rain gauges in isolation.
For the Stanley River case study presented in this paper, the use of calibrated RADAR rainfall data was found to produce outcomes that, within the bounds of uncertainty, provided similar accuracy with no calibration effort for catchments that have relatively few or no rain gauge information.
For catchments with one or many rainfall gauges it is suggested that the calibrated RADAR rainfall data could be significantly enhanced with the inclusion of the extensive gauge network and to otherwise provide an optimum calibration outcome.
Calibrated RADAR rainfall data has the potential to significantly enhance calibration outcomes and represents a further source of information that should be considered in hydrologic assessments and in addition to the local rain gauge network.
In respect to the question posed “RADAR Rainfall Calibration of Flood Models – The Future for Catchment Hydrology?”, it is considered that RADAR has the potential to significantly enhance catchment related studies. In this context alone, the use of RADAR is unable to be ignored. With further development and refinement of RADAR based products in Australia, and the subsequent availability made of the same, it is considered that RADAR will transition to become a mainstream approach that will become standard practice in catchment related investigations in the future. This is perhaps best stated by Ashton (1963)

A Case Study of the Stanley River Catchment Daly
Stormwater 2016 - Daly1, Reichard2, Hansell3, Clark4 12 of 12
“The potential value is so great, however, that all improvements, as soon as available, should be applied in the field on a continuing basis. Here we have something so obviously useful that neglect of it is unthinkable”. This paper is one of a series of papers that will be ultimately prepared on this topic. Future papers will provide extensions to the subject matter considered and will additionally include future RADAR calibration processes that includes consideration of the local rain gauge network to further enhance calibration outcomes. This is subject to current and ongoing investigations through the HydroNET platform.
6. ACKNOWLEDGEMENTS
The author wishes to acknowledge the assistance provided to this paper by Moreton Bay Regional Council, Water Technology staff (Greg Hansell and Andrew Thompson) and HydroLogic Systems including the HydroNET Software Platform.
7. REFERENCES
Ashton, H.T., (1963), A review of hydrometeorological studies and planned Bureau activities in hydrometeorology, Proceedings of the Hydrometeorology Discussion Group, Melbourne, Bureau of Meteorology, 1967.
Bureau of Meteorology, Mt Stapylton RADAR technical details, available at http://www.bom.gov.au/australia/radar/info/qld_info.shtml#mt-stapylton66 [15 June 2016] (BoM, 2016a).
Bureau of Meteorology, Known Floods in the Brisbane & Bremer River Basin, available at http://www.bom.gov.au/qld/flood/fld_history/brisbane_history.shtml [25 June 2016] (BoM, 2016b).
Bureau of Meteorology, About Radar-Derived Rainfall Accumulations, available at http://www.bom.gov.au/australia/radar/about/using_rainfall_accumulations.shtml [17 June 2016] (BoM, 2016c).
Bureau of Meteorology, Flood Warning Services, available at http://www.bom.gov.au/water/floods/floodWarningServices.shtml [25 June 2016] (BoM, 2016d).
Cooperative Research Centre for Catchment Hydrology, Technical Report 02/7 (2002), Seed, A et al, On the Calibration of Australian Weather RADARS, September 2002.
HydroLogic Systems (2015), Validation of operational Radar based and satellite based precipitation estimators in extreme events in Australia, October 2015 (unpublished).
Moreton Bay Regional Council (2015), Regional Floodplain Database Project, available from https://www.moretonbay.qld.gov.au/general.aspx?ekfrm=114179 [15 June 2016].
The Centre for Australian Weather and Climate Research (CAWCR) Technical Report No. 055 (2012), Susan J Rennie, Doppler weather radar in Australia, November 2012.
Water Monitoring Information Portal, Queensland Government, Department of Natural Resources and Mines (DNRM, 2016) available at https://water-monitoring.information.qld.gov.au/, Gauge 143901A – Stanley River at Woodford and Gauge 143303A – Stanley River at Peachester, [25 June 2016]
Water Technology (2015), Regional Floodplain Database – 2014 Model Maintenance Report – Stanley River, prepared for Moreton Bay Regional Council, June 2015.
World Meteorological Organization (2008), Guide to Hydrological Practices – Volume 1 – Hydrology – From Measurement to Hydrological Information, Sixth Edition, 2008.
WP (2012), Regional Floodplain Database – Hydrologic and Hydraulic Modelling Report – Stanley River STA, prepared for Moreton Bay Regional Council by Worley Parsons, August 2012.