
RAC Performance myths - Oracle database internals by Riyaj · PDF fileRAC performance tuning...
45
©OraInternals Riyaj Shamsudeen RAC performance tuning By Riyaj Shamsudeen
Transcript of RAC Performance myths - Oracle database internals by Riyaj · PDF fileRAC performance tuning...
©OraInternals Riyaj Shamsudeen
RAC performance tuning
By
Riyaj Shamsudeen
©OraInternals Riyaj Shamsudeen 2
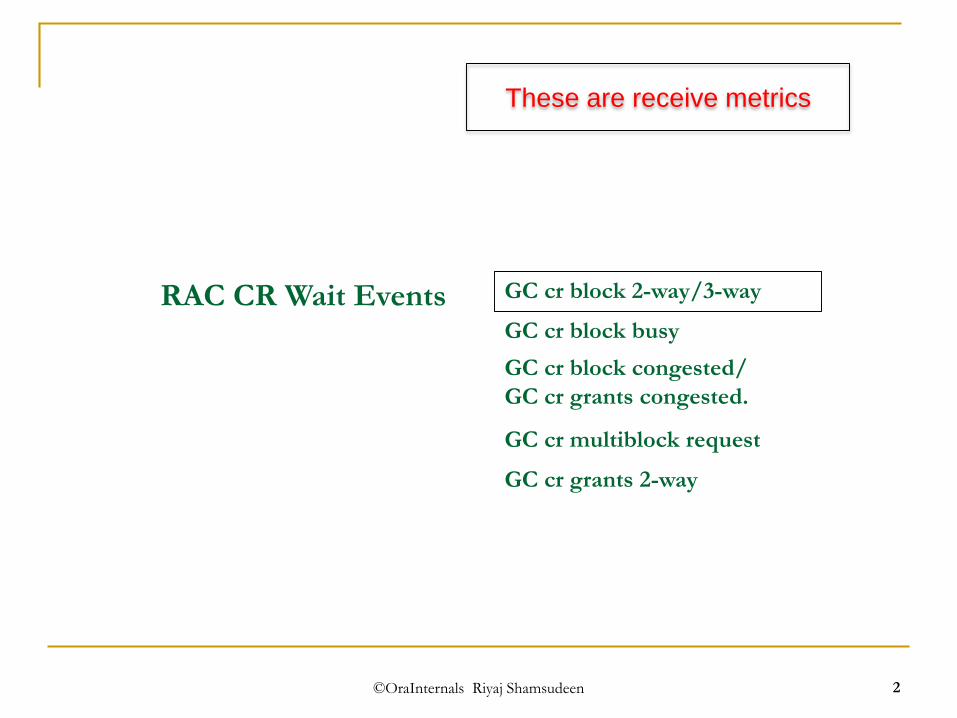
RAC CR Wait Events GC cr block 2-way/3-way
GC cr block busy
GC cr block congested/
GC cr grants congested.
GC cr multiblock request
GC cr grants 2-way
These are receive metrics
©OraInternals Riyaj Shamsudeen 3
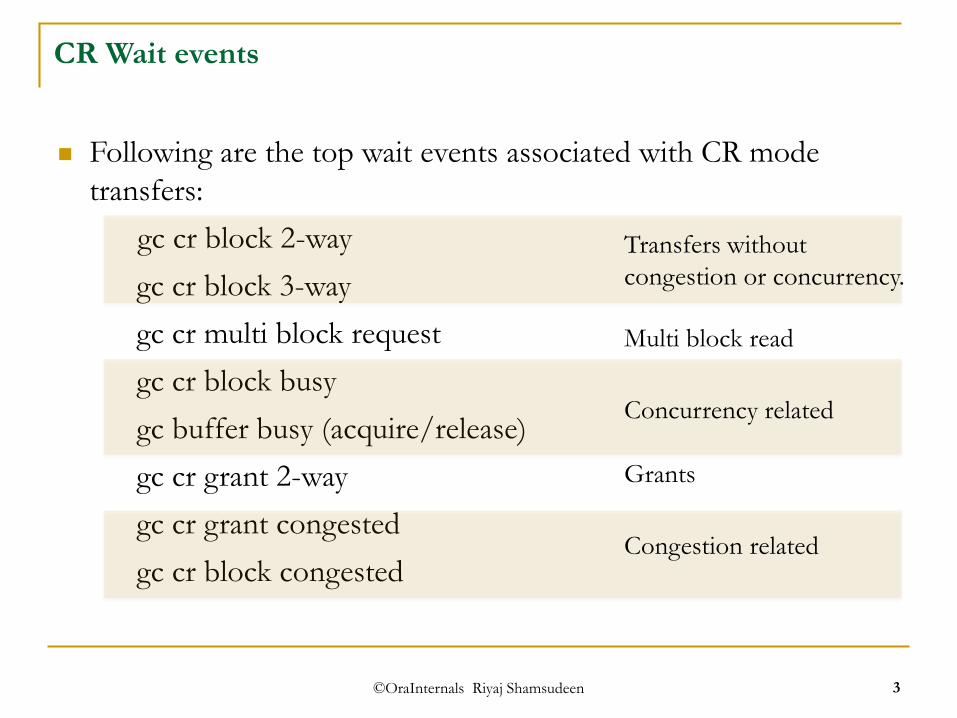
CR Wait events
Following are the top wait events associated with CR mode
transfers:
gc cr block 2-way
gc cr block 3-way
gc cr multi block request
gc cr block busy
gc buffer busy (acquire/release)
gc cr grant 2-way
gc cr grant congested
gc cr block congestedCongestion related
Concurrency related
Multi block read
Transfers without
congestion or concurrency.
Grants
©OraInternals Riyaj Shamsudeen 4
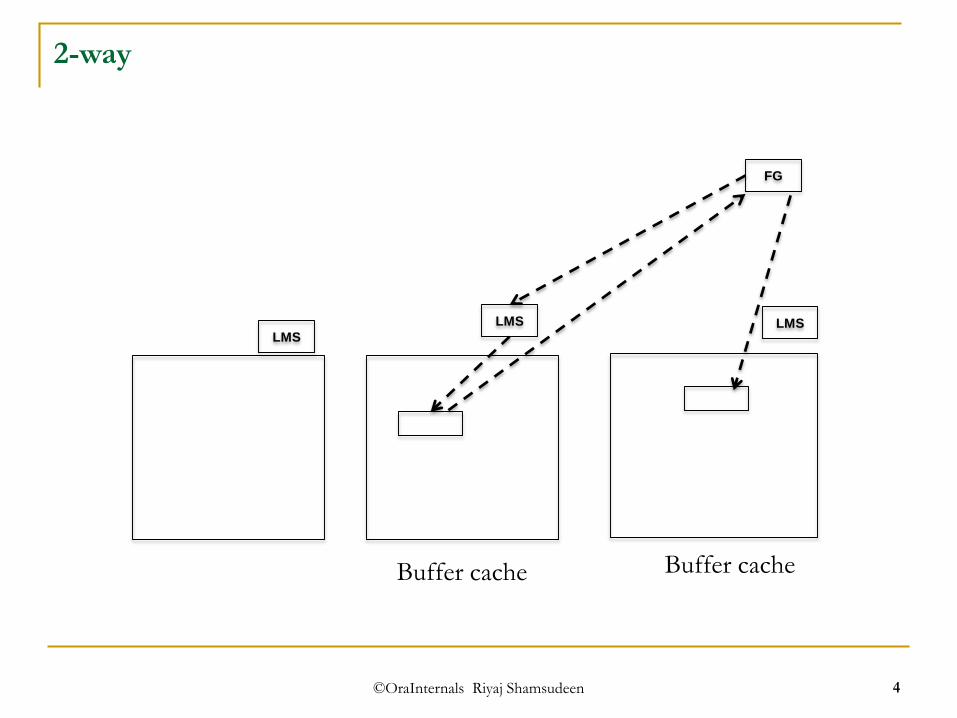
2-way
LMS LMS
FG
Buffer cache Buffer cache
LMS
©OraInternals Riyaj Shamsudeen 5
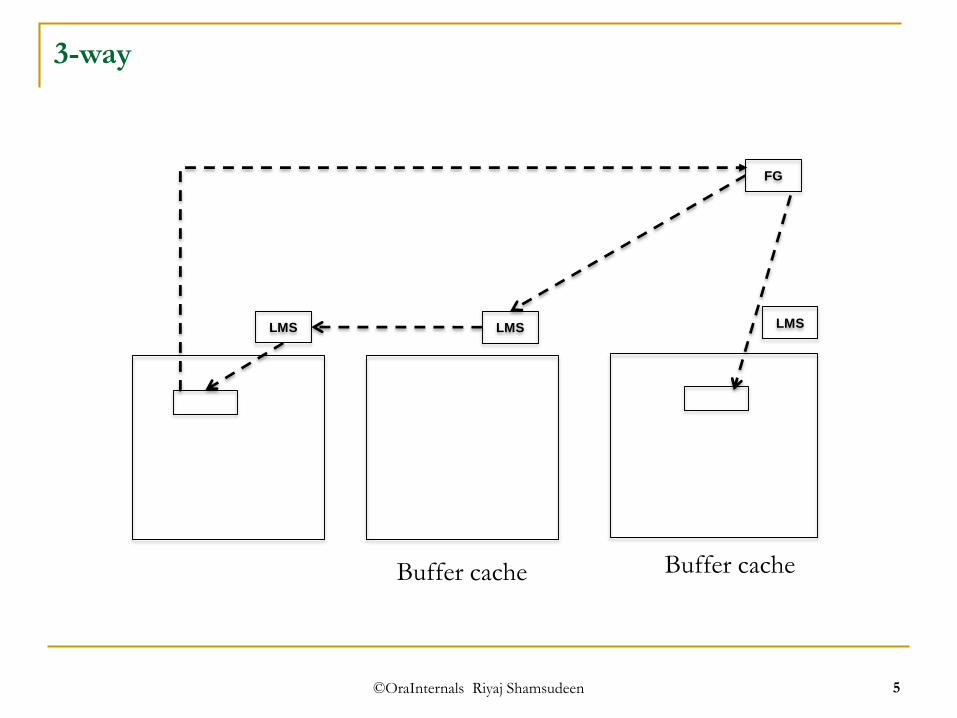
3-way
LMS LMS
FG
Buffer cache Buffer cache
LMS
©OraInternals Riyaj Shamsudeen 6
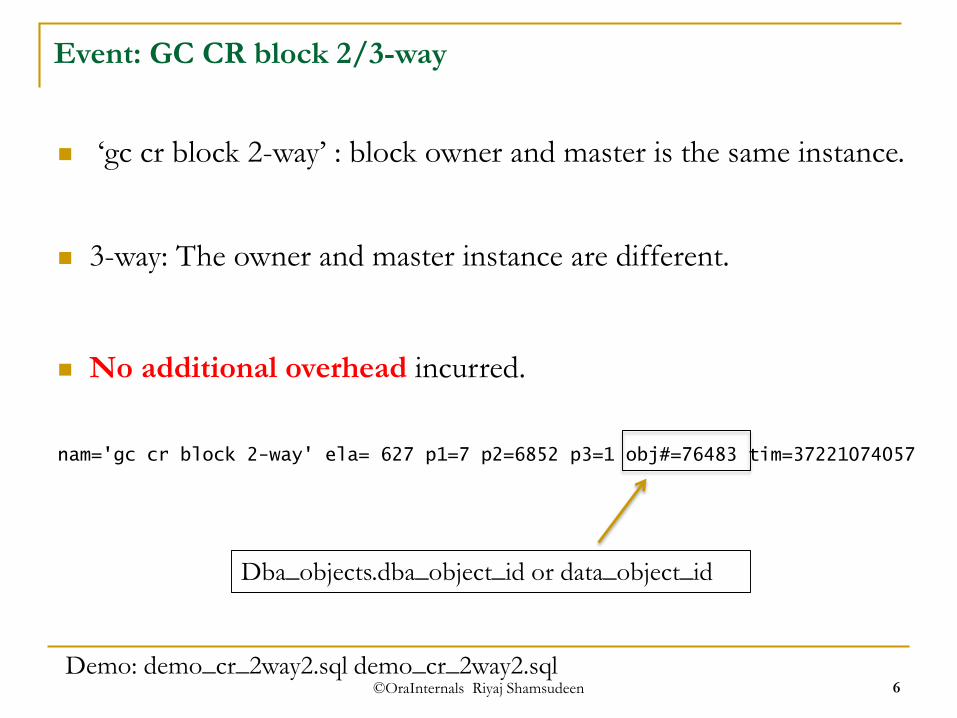
Event: GC CR block 2/3-way
‘gc cr block 2-way’ : block owner and master is the same instance.
3-way: The owner and master instance are different.
No additional overhead incurred.
nam='gc cr block 2-way' ela= 627 p1=7 p2=6852 p3=1 obj#=76483 tim=37221074057
Dba_objects.dba_object_id or data_object_id
Demo: demo_cr_2way2.sql demo_cr_2way2.sql

©OraInternals Riyaj Shamsudeen 7
Analysis
gc cr block 2-way/3-way are baseline wait events.
Concurrency or congestion issues are not included in to these
events.
If these events have higher impact, then
differentiate.
Elapsed time per event wait is
high.Numerous waits for these events.
©OraInternals Riyaj Shamsudeen 8
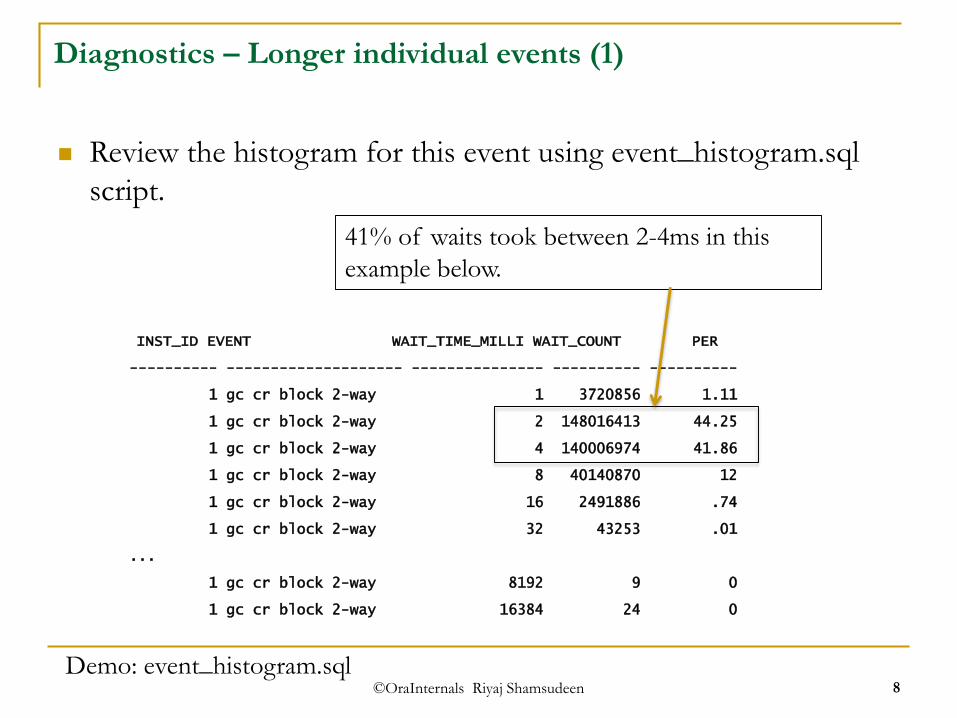
Diagnostics – Longer individual events (1)
Review the histogram for this event using event_histogram.sql
script.
INST_ID EVENT WAIT_TIME_MILLI WAIT_COUNT PER
---------- -------------------- --------------- ---------- ----------
1 gc cr block 2-way 1 3720856 1.11
1 gc cr block 2-way 2 148016413 44.25
1 gc cr block 2-way 4 140006974 41.86
1 gc cr block 2-way 8 40140870 12
1 gc cr block 2-way 16 2491886 .74
1 gc cr block 2-way 32 43253 .01
...
1 gc cr block 2-way 8192 9 0
1 gc cr block 2-way 16384 24 0
Demo: event_histogram.sql
41% of waits took between 2-4ms in this
example below.
©OraInternals Riyaj Shamsudeen 9
Possible reasons
High CPU usage in the nodes.
Network performance or Network configuration issue.
Platform issues as SMP scaling or NUMA related.
Good baseline indicators for cache fusion performance.
©OraInternals Riyaj Shamsudeen 10
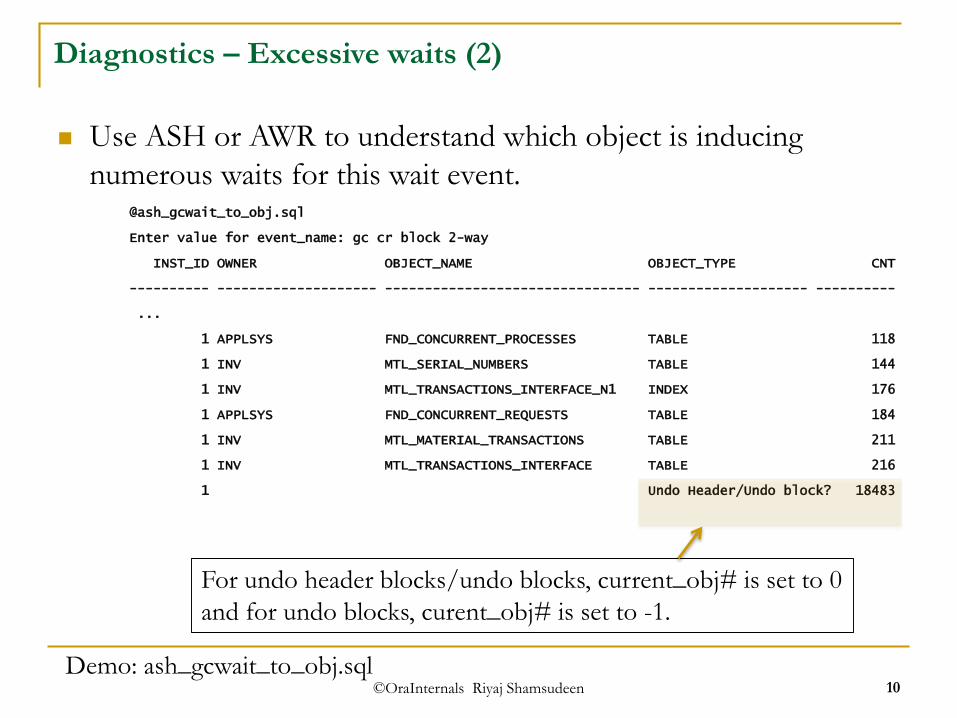
Diagnostics – Excessive waits (2)
Use ASH or AWR to understand which object is inducing
numerous waits for this wait event.@ash_gcwait_to_obj.sql
Enter value for event_name: gc cr block 2-way
INST_ID OWNER OBJECT_NAME OBJECT_TYPE CNT
---------- -------------------- -------------------------------- -------------------- ----------
...
1 APPLSYS FND_CONCURRENT_PROCESSES TABLE 118
1 INV MTL_SERIAL_NUMBERS TABLE 144
1 INV MTL_TRANSACTIONS_INTERFACE_N1 INDEX 176
1 APPLSYS FND_CONCURRENT_REQUESTS TABLE 184
1 INV MTL_MATERIAL_TRANSACTIONS TABLE 211
1 INV MTL_TRANSACTIONS_INTERFACE TABLE 216
1 Undo Header/Undo block? 18483
Demo: ash_gcwait_to_obj.sql
For undo header blocks/undo blocks, current_obj# is set to 0
and for undo blocks, curent_obj# is set to -1.
©OraInternals Riyaj Shamsudeen 11
Recommendations
Consider application affinity.
Increase SGA size.
©OraInternals Riyaj Shamsudeen 12
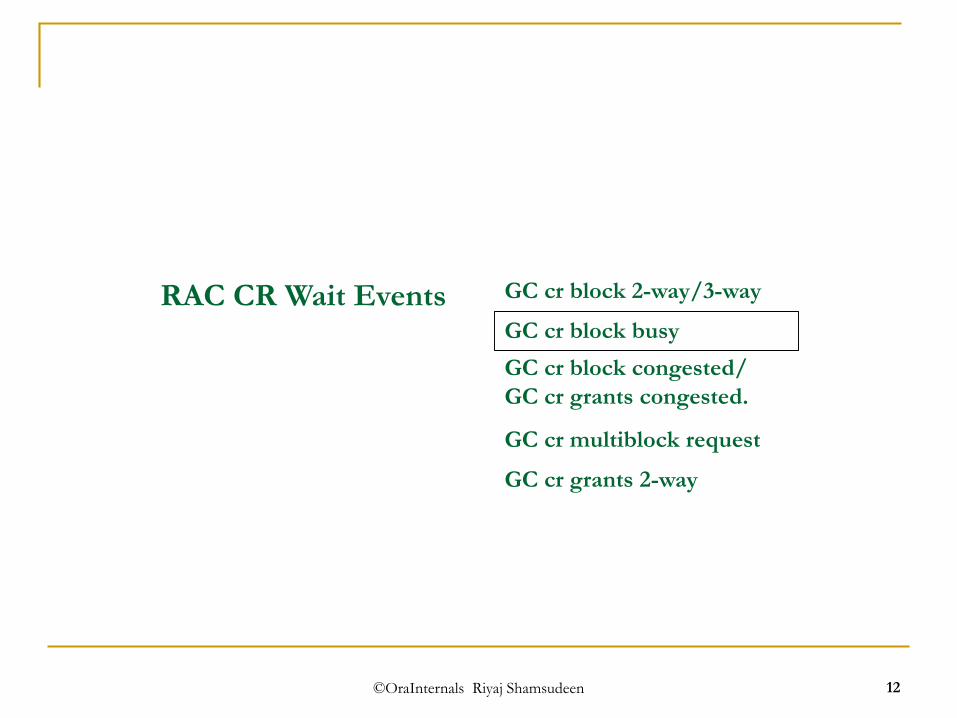
RAC CR Wait Events GC cr block 2-way/3-way
GC cr block busy
GC cr block congested/
GC cr grants congested.
GC cr multiblock request
GC cr grants 2-way
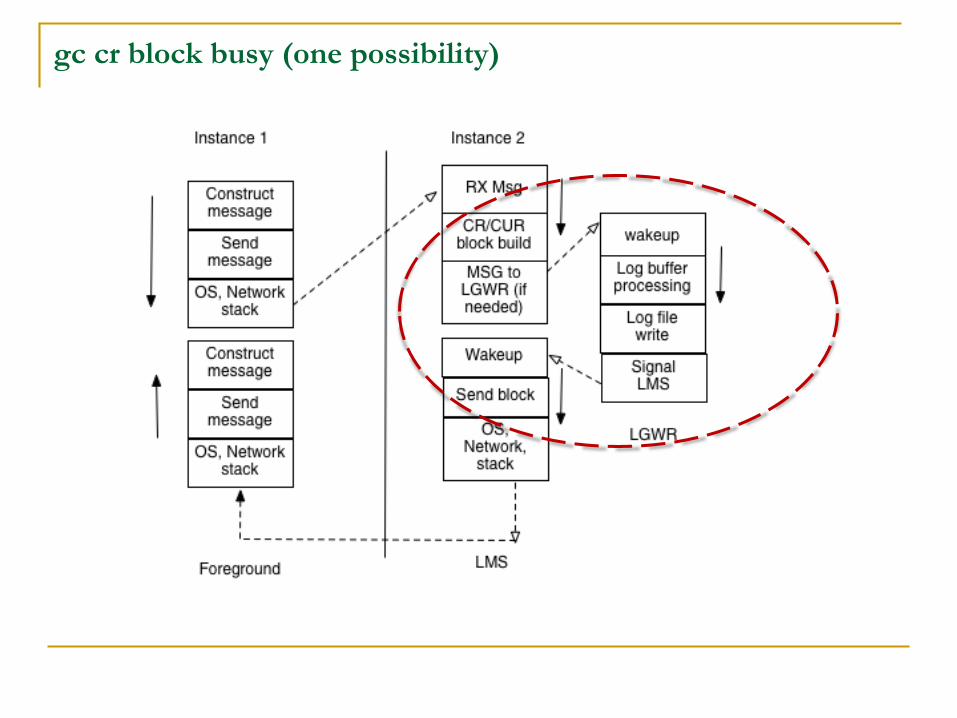
gc cr block busy (one possibility)
©OraInternals Riyaj Shamsudeen 14
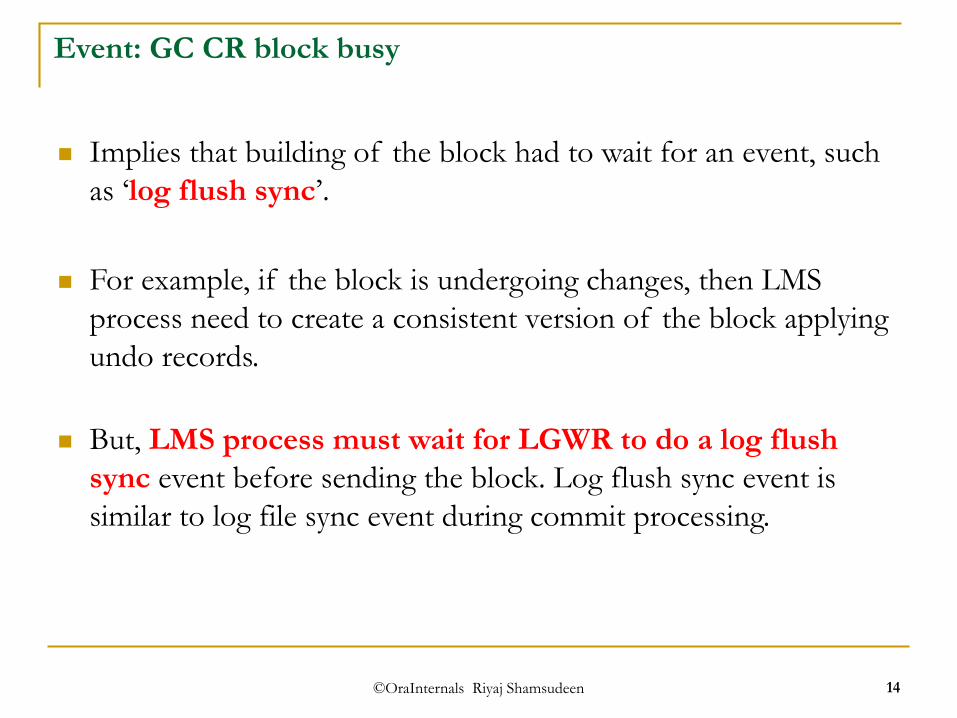
Event: GC CR block busy
Implies that building of the block had to wait for an event, such
as ‘log flush sync’.
For example, if the block is undergoing changes, then LMS
process need to create a consistent version of the block applying
undo records.
But, LMS process must wait for LGWR to do a log flush
sync event before sending the block. Log flush sync event is
similar to log file sync event during commit processing.
©OraInternals Riyaj Shamsudeen 15
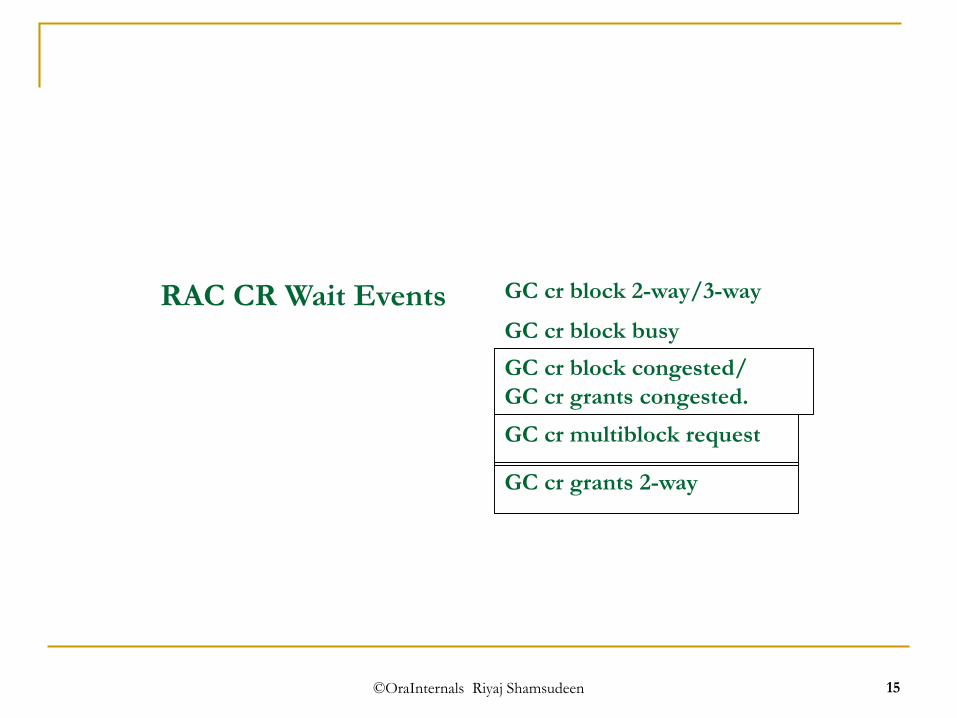
RAC CR Wait Events GC cr block 2-way/3-way
GC cr block busy
GC cr block congested/
GC cr grants congested.
GC cr multiblock request
GC cr grants 2-way
©OraInternals Riyaj Shamsudeen 16
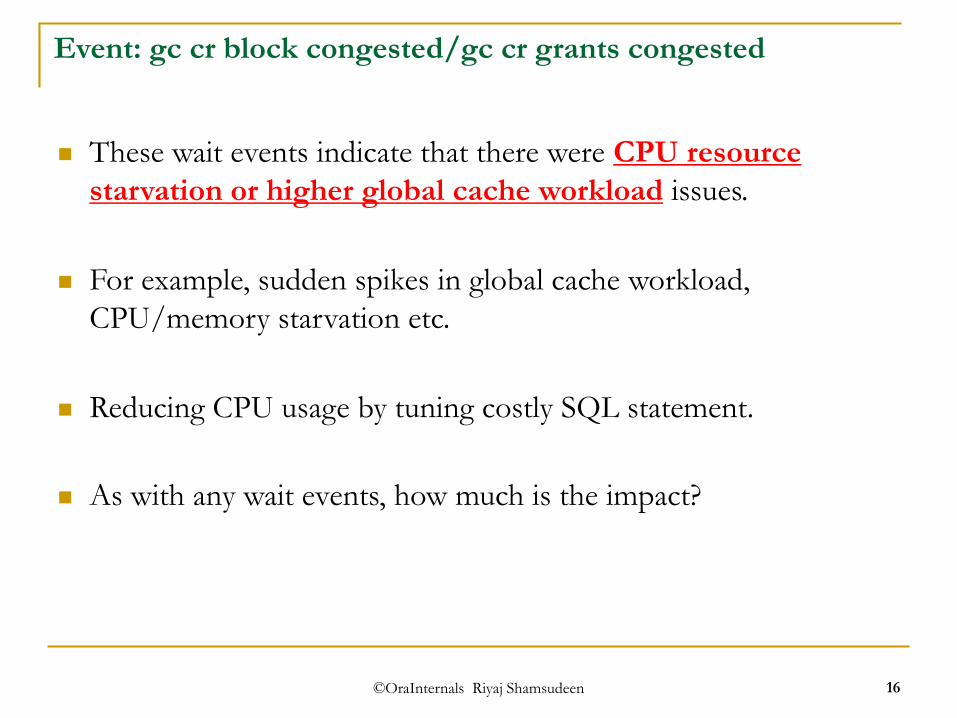
Event: gc cr block congested/gc cr grants congested
These wait events indicate that there were CPU resource
starvation or higher global cache workload issues.
For example, sudden spikes in global cache workload,
CPU/memory starvation etc.
Reducing CPU usage by tuning costly SQL statement.
As with any wait events, how much is the impact?
©OraInternals Riyaj Shamsudeen 17
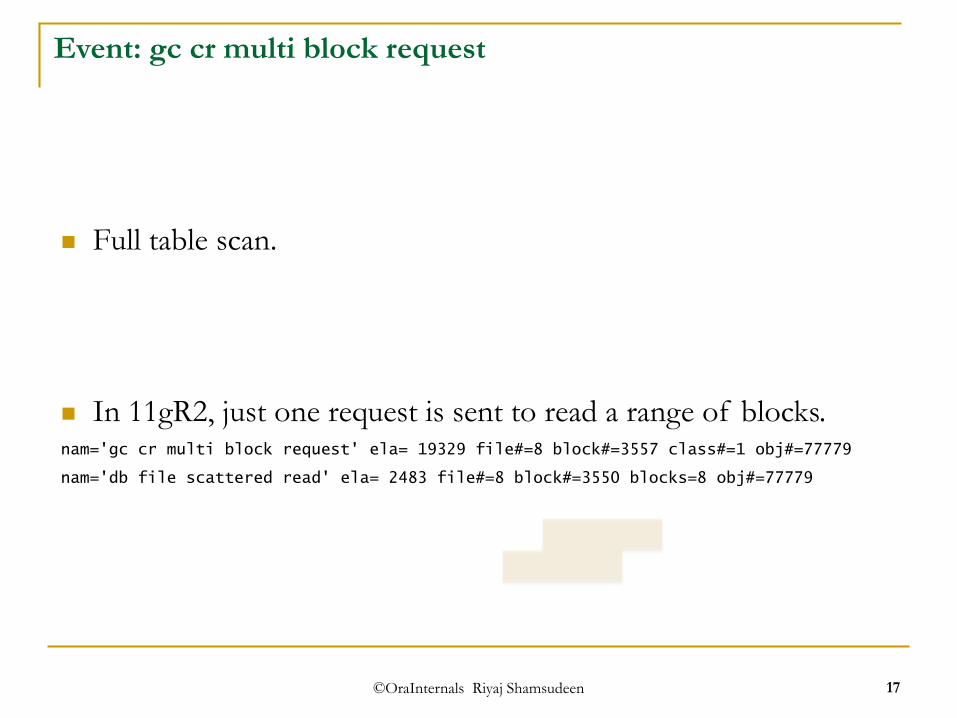
Event: gc cr multi block request
Full table scan.
In 11gR2, just one request is sent to read a range of blocks.nam='gc cr multi block request' ela= 19329 file#=8 block#=3557 class#=1 obj#=77779
nam='db file scattered read' ela= 2483 file#=8 block#=3550 blocks=8 obj#=77779
©OraInternals Riyaj Shamsudeen 18
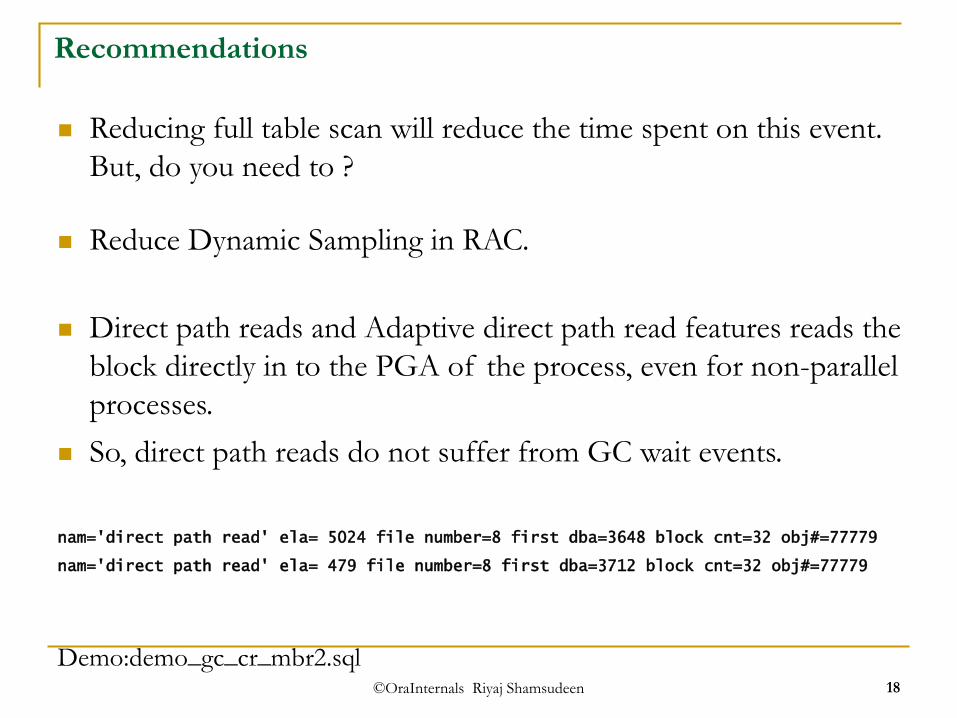
Recommendations
Reducing full table scan will reduce the time spent on this event.
But, do you need to ?
Reduce Dynamic Sampling in RAC.
Direct path reads and Adaptive direct path read features reads the
block directly in to the PGA of the process, even for non-parallel
processes.
So, direct path reads do not suffer from GC wait events.
nam='direct path read' ela= 5024 file number=8 first dba=3648 block cnt=32 obj#=77779
nam='direct path read' ela= 479 file number=8 first dba=3712 block cnt=32 obj#=77779
Demo:demo_gc_cr_mbr2.sql
©OraInternals Riyaj Shamsudeen 19
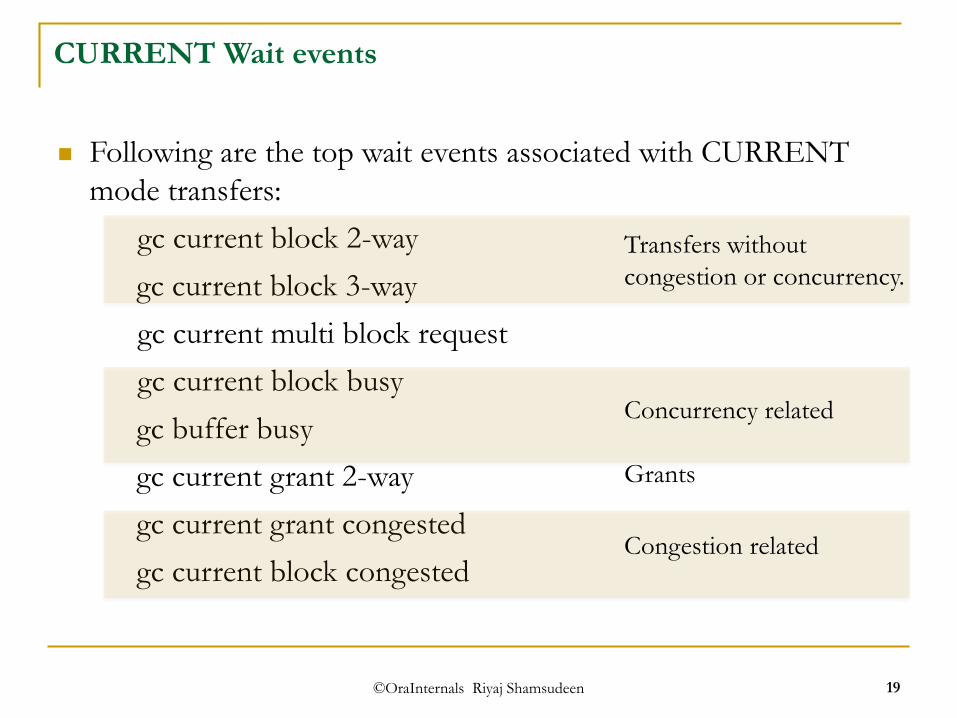
CURRENT Wait events
Following are the top wait events associated with CURRENT
mode transfers:
gc current block 2-way
gc current block 3-way
gc current multi block request
gc current block busy
gc buffer busy
gc current grant 2-way
gc current grant congested
gc current block congestedCongestion related
Concurrency related
Transfers without
congestion or concurrency.
Grants
©OraInternals Riyaj Shamsudeen
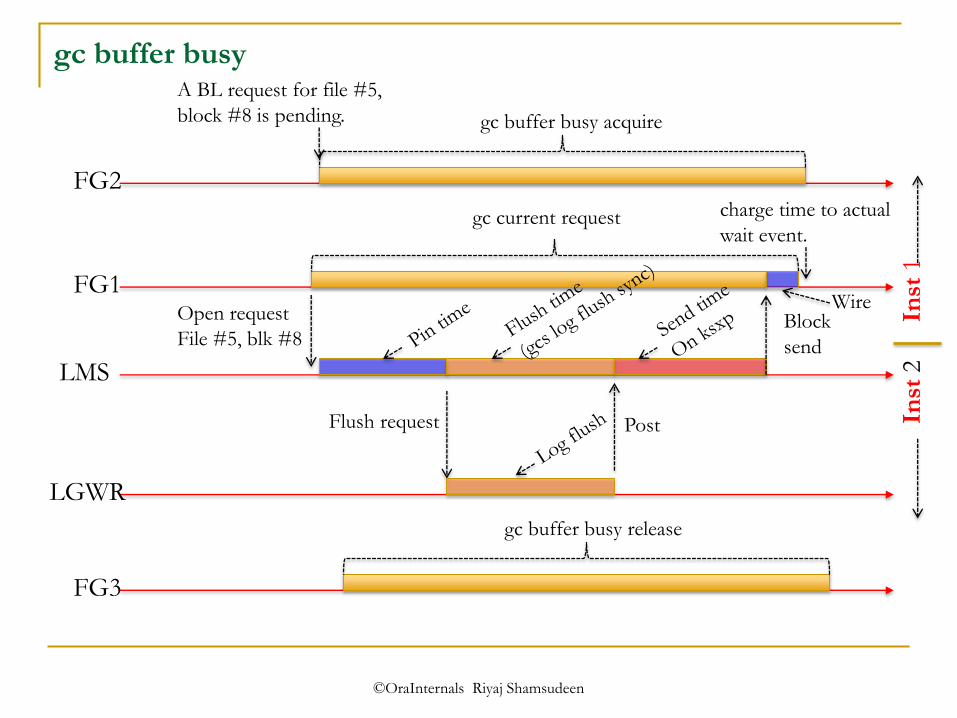
gc buffer busy
gc current request
FG1
LMS
LGWR
Open request
File #5, blk #8
Flush request Post
Block
send
FG2
A BL request for file #5,
block #8 is pending. gc buffer busy acquire
gc buffer busy release
FG3
Inst
1In
st2
charge time to actual
wait event.
Wire
©OraInternals Riyaj Shamsudeen 21
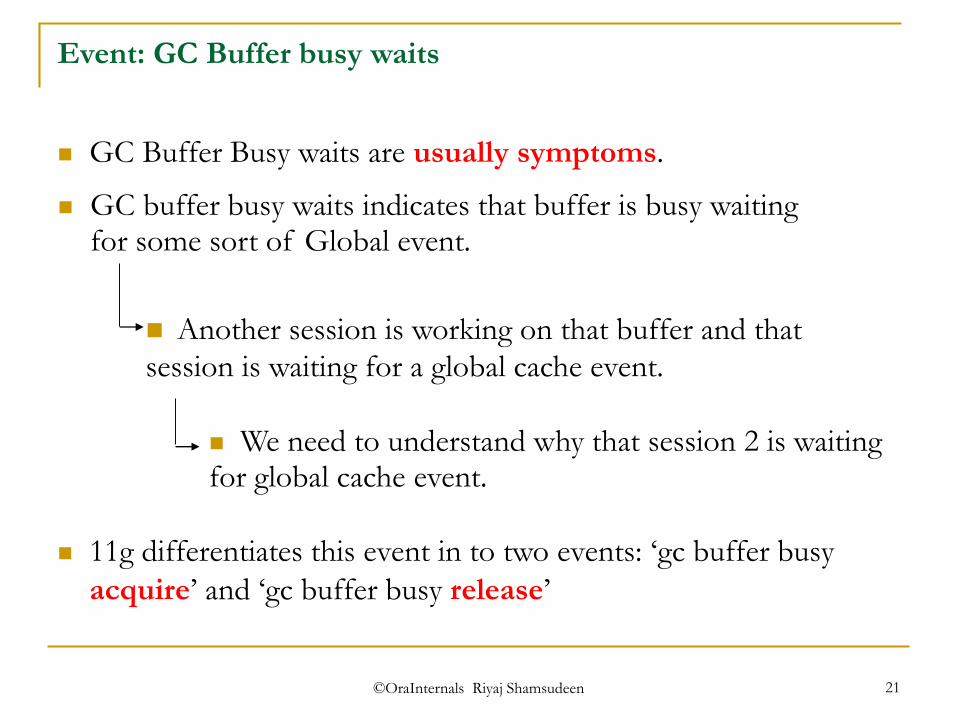
Event: GC Buffer busy waits
GC buffer busy waits indicates that buffer is busy waiting for some sort of Global event.
Another session is working on that buffer and that
session is waiting for a global cache event.
We need to understand why that session 2 is waiting for global cache event.
GC Buffer Busy waits are usually symptoms.
11g differentiates this event in to two events: ‘gc buffer busy
acquire’ and ‘gc buffer busy release’
©OraInternals Riyaj Shamsudeen22
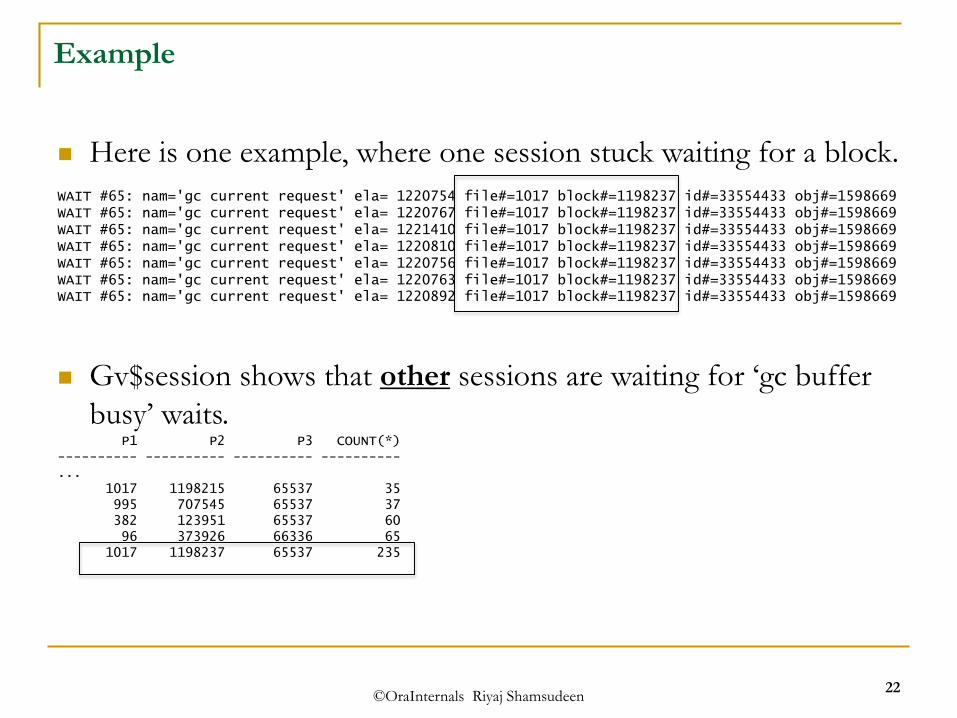
Example
Here is one example, where one session stuck waiting for a block.
WAIT #65: nam='gc current request' ela= 1220754 file#=1017 block#=1198237 id#=33554433 obj#=1598669 WAIT #65: nam='gc current request' ela= 1220767 file#=1017 block#=1198237 id#=33554433 obj#=1598669 WAIT #65: nam='gc current request' ela= 1221410 file#=1017 block#=1198237 id#=33554433 obj#=1598669 WAIT #65: nam='gc current request' ela= 1220810 file#=1017 block#=1198237 id#=33554433 obj#=1598669 WAIT #65: nam='gc current request' ela= 1220756 file#=1017 block#=1198237 id#=33554433 obj#=1598669 WAIT #65: nam='gc current request' ela= 1220763 file#=1017 block#=1198237 id#=33554433 obj#=1598669 WAIT #65: nam='gc current request' ela= 1220892 file#=1017 block#=1198237 id#=33554433 obj#=1598669
Gv$session shows that other sessions are waiting for ‘gc buffer
busy’ waits.P1 P2 P3 COUNT(*)
---------- ---------- ---------- ----------...
1017 1198215 65537 35995 707545 65537 37382 123951 65537 6096 373926 66336 65
1017 1198237 65537 235
©OraInternals Riyaj Shamsudeen 23
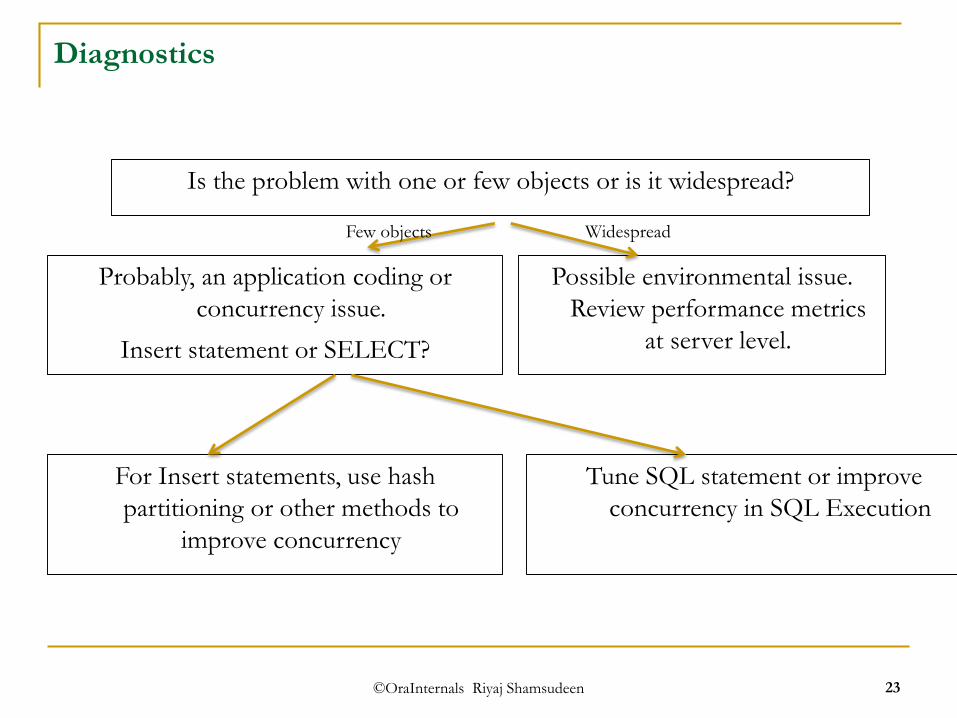
Diagnostics
Is the problem with one or few objects or is it widespread?
Probably, an application coding or
concurrency issue.
Insert statement or SELECT?
Possible environmental issue.
Review performance metrics
at server level.
Few objects Widespread
For Insert statements, use hash
partitioning or other methods to
improve concurrency
Tune SQL statement or improve
concurrency in SQL Execution
©OraInternals Riyaj Shamsudeen 24
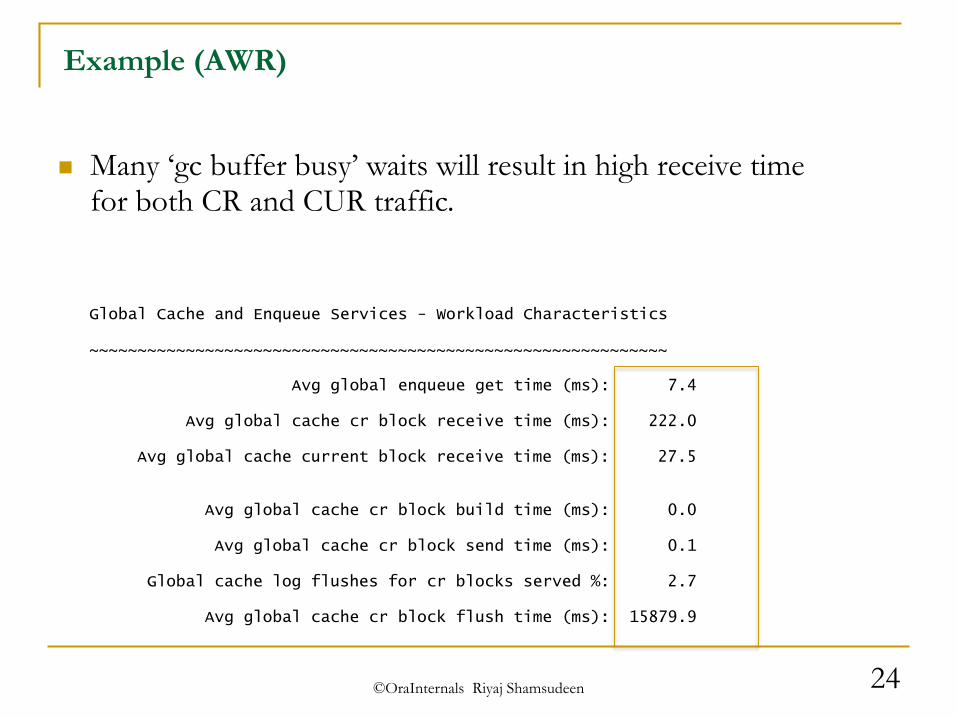
Example (AWR)
Global Cache and Enqueue Services - Workload Characteristics
~~~~~~~~~~~~~~~~~~~~~~~~~~~~~~~~~~~~~~~~~~~~~~~~~~~~~~~~~~~~
Avg global enqueue get time (ms): 7.4
Avg global cache cr block receive time (ms): 222.0
Avg global cache current block receive time (ms): 27.5
Avg global cache cr block build time (ms): 0.0
Avg global cache cr block send time (ms): 0.1
Global cache log flushes for cr blocks served %: 2.7
Avg global cache cr block flush time (ms): 15879.9
Many ‘gc buffer busy’ waits will result in high receive time for both CR and CUR traffic.
©OraInternals Riyaj Shamsudeen 25
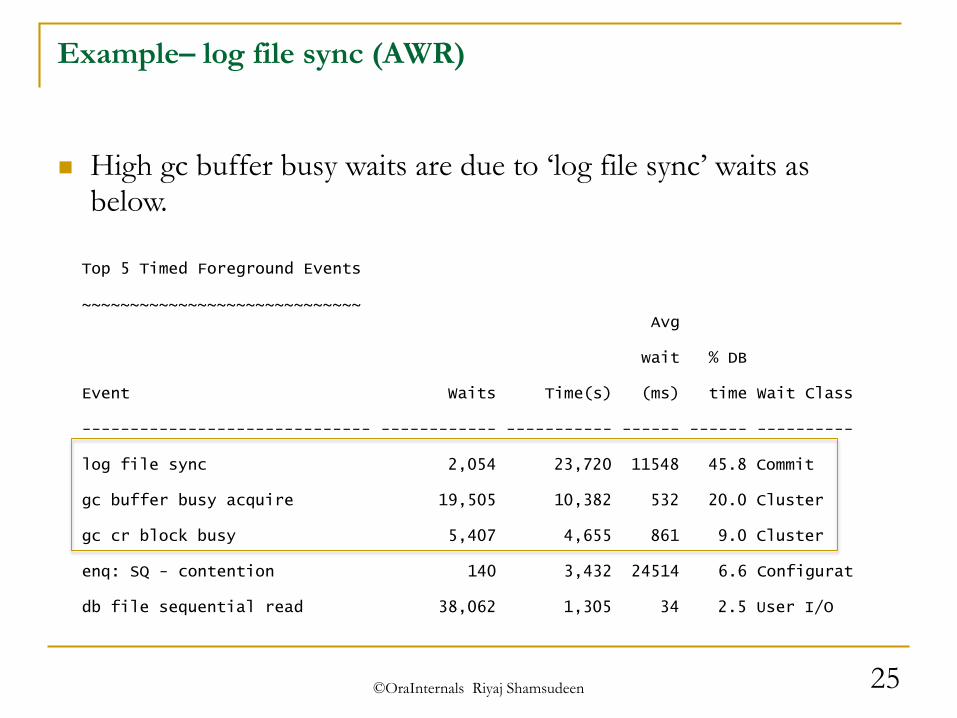
Example– log file sync (AWR)
Top 5 Timed Foreground Events
~~~~~~~~~~~~~~~~~~~~~~~~~~~~~ Avg
wait % DB
Event Waits Time(s) (ms) time Wait Class
------------------------------ ------------ ----------- ------ ------ ----------
log file sync 2,054 23,720 11548 45.8 Commit
gc buffer busy acquire 19,505 10,382 532 20.0 Cluster
gc cr block busy 5,407 4,655 861 9.0 Cluster
enq: SQ - contention 140 3,432 24514 6.6 Configurat
db file sequential read 38,062 1,305 34 2.5 User I/O
High gc buffer busy waits are due to ‘log file sync’ waits as below.
©OraInternals Riyaj Shamsudeen 26
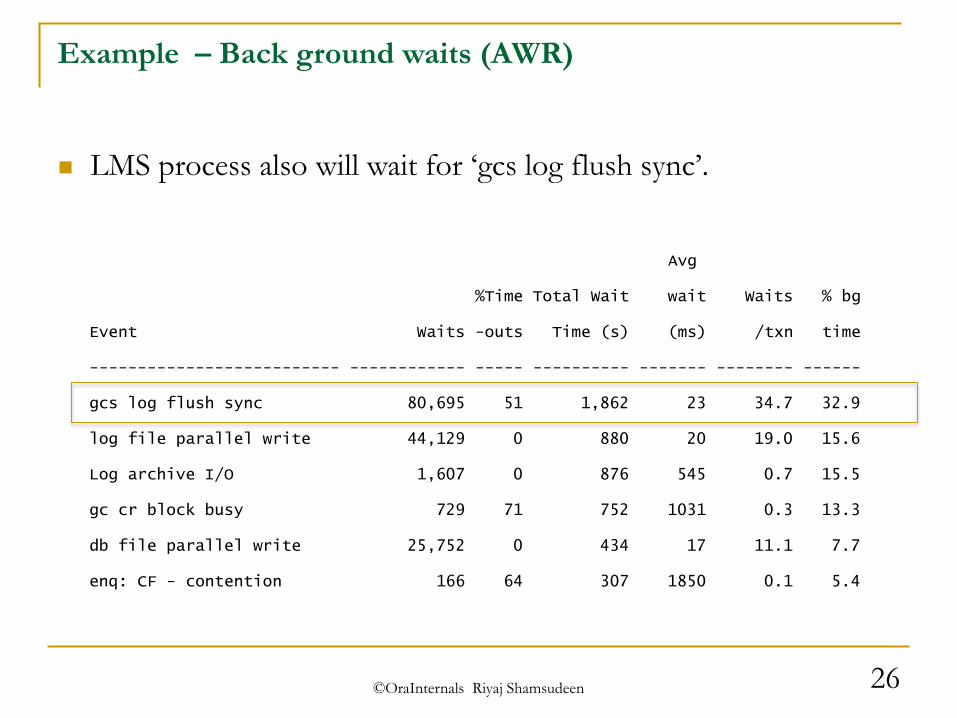
Example – Back ground waits (AWR)
Avg
%Time Total Wait wait Waits % bg
Event Waits -outs Time (s) (ms) /txn time
-------------------------- ------------ ----- ---------- ------- -------- ------
gcs log flush sync 80,695 51 1,862 23 34.7 32.9
log file parallel write 44,129 0 880 20 19.0 15.6
Log archive I/O 1,607 0 876 545 0.7 15.5
gc cr block busy 729 71 752 1031 0.3 13.3
db file parallel write 25,752 0 434 17 11.1 7.7
enq: CF - contention 166 64 307 1850 0.1 5.4
LMS process also will wait for ‘gcs log flush sync’.
©OraInternals Riyaj Shamsudeen 27
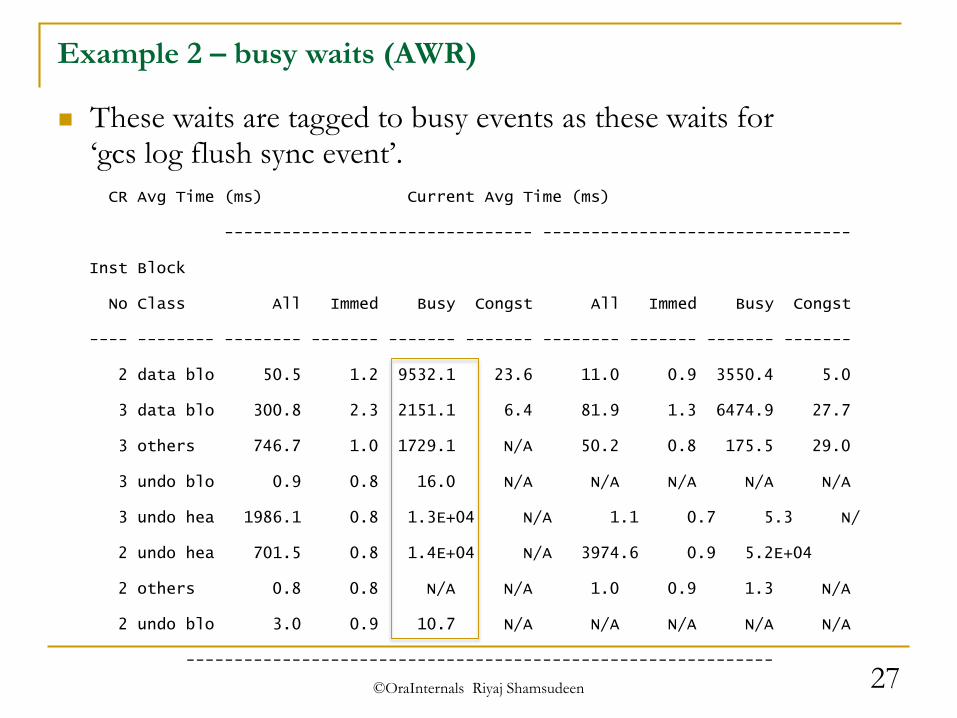
Example 2 – busy waits (AWR)
CR Avg Time (ms) Current Avg Time (ms)
-------------------------------- --------------------------------
Inst Block
No Class All Immed Busy Congst All Immed Busy Congst
---- -------- -------- ------- ------- ------- -------- ------- ------- -------
2 data blo 50.5 1.2 9532.1 23.6 11.0 0.9 3550.4 5.0
3 data blo 300.8 2.3 2151.1 6.4 81.9 1.3 6474.9 27.7
3 others 746.7 1.0 1729.1 N/A 50.2 0.8 175.5 29.0
3 undo blo 0.9 0.8 16.0 N/A N/A N/A N/A N/A
3 undo hea 1986.1 0.8 1.3E+04 N/A 1.1 0.7 5.3 N/
2 undo hea 701.5 0.8 1.4E+04 N/A 3974.6 0.9 5.2E+04
2 others 0.8 0.8 N/A N/A 1.0 0.9 1.3 N/A
2 undo blo 3.0 0.9 10.7 N/A N/A N/A N/A N/A
-------------------------------------------------------------
These waits are tagged to busy events as these waits for ‘gcs log flush sync event’.

©OraInternals Riyaj Shamsudeen 28
Gc buffer busy – Objects related
Demo: generate_insert_setup.sql ash_gcwait_to_obj.sql, ash_gcwait_to_obj_timed.sqlGenerate_insert.ksh 1 10 and 11, 20
ASH or trace files can be used to identify the blocks suffering from excessive ‘gc buffer busy’ waits.
Only use this method if there is no other issue affecting background processes.
To understand gc buffer busy waits:
Identify the object and object type
Identify the block type
Ash_gcwait_to_obj.sql can be used to identify the object name and type.
©OraInternals Riyaj Shamsudeen 29
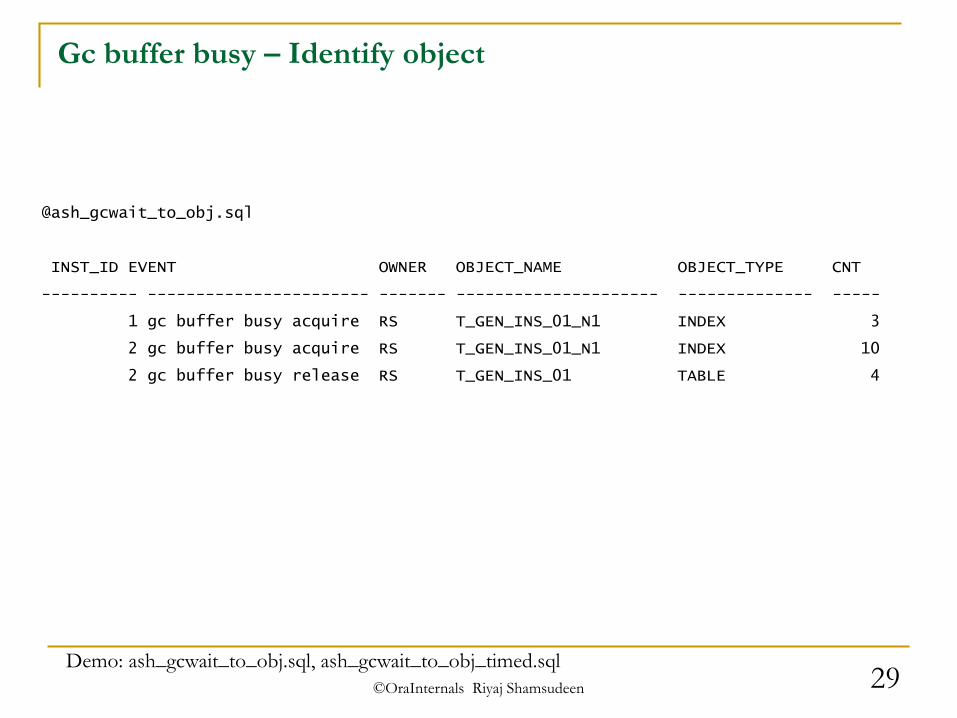
Gc buffer busy – Identify object
Demo: ash_gcwait_to_obj.sql, ash_gcwait_to_obj_timed.sql
@ash_gcwait_to_obj.sql
INST_ID EVENT OWNER OBJECT_NAME OBJECT_TYPE CNT
---------- ----------------------- ------- --------------------- -------------- -----
1 gc buffer busy acquire RS T_GEN_INS_01_N1 INDEX 3
2 gc buffer busy acquire RS T_GEN_INS_01_N1 INDEX 10
2 gc buffer busy release RS T_GEN_INS_01 TABLE 4
©OraInternals Riyaj Shamsudeen 30
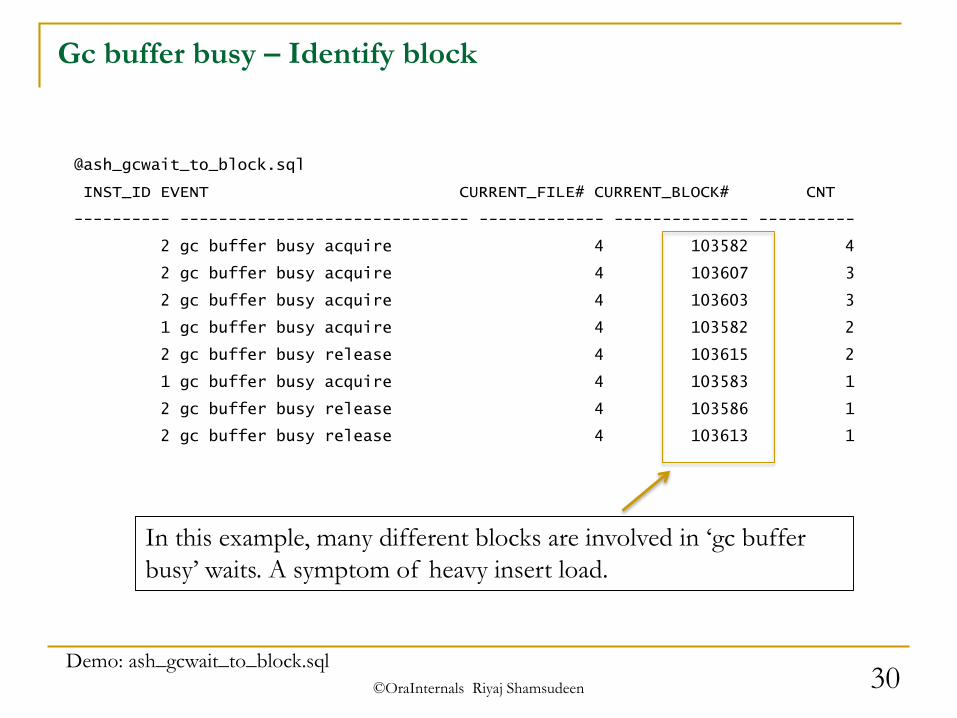
Gc buffer busy – Identify block
Demo: ash_gcwait_to_block.sql
@ash_gcwait_to_block.sql
INST_ID EVENT CURRENT_FILE# CURRENT_BLOCK# CNT
---------- ------------------------------ ------------- -------------- ----------
2 gc buffer busy acquire 4 103582 4
2 gc buffer busy acquire 4 103607 3
2 gc buffer busy acquire 4 103603 3
1 gc buffer busy acquire 4 103582 2
2 gc buffer busy release 4 103615 2
1 gc buffer busy acquire 4 103583 1
2 gc buffer busy release 4 103586 1
2 gc buffer busy release 4 103613 1
In this example, many different blocks are involved in ‘gc buffer
busy’ waits. A symptom of heavy insert load.
©OraInternals Riyaj Shamsudeen 31
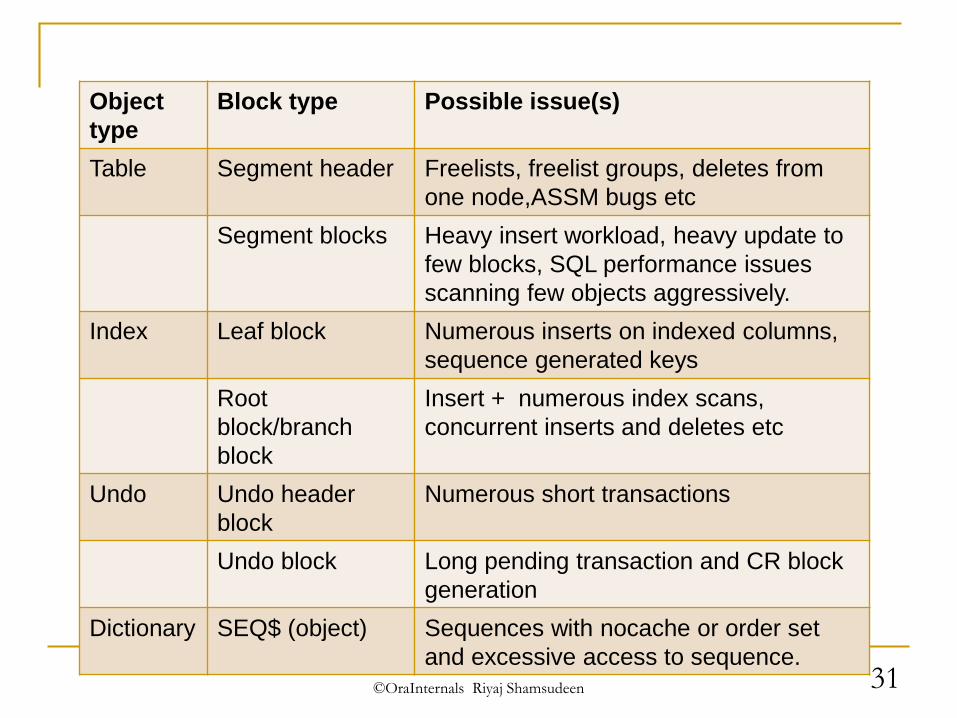
Object
type
Block type Possible issue(s)
Table Segment header Freelists, freelist groups, deletes from
one node,ASSM bugs etc
Segment blocks Heavy insert workload, heavy update to
few blocks, SQL performance issues
scanning few objects aggressively.
Index Leaf block Numerous inserts on indexed columns,
sequence generated keys
Root
block/branch
block
Insert + numerous index scans,
concurrent inserts and deletes etc
Undo Undo header
block
Numerous short transactions
Undo block Long pending transaction and CR block
generation
Dictionary SEQ$ (object) Sequences with nocache or order set
and excessive access to sequence.
©OraInternals Riyaj Shamsudeen 32
Measuring performance correctly
It is essential to review metrics from all nodes. Common
mistake I see is that DBAs review the metrics from just one
node.
Performance problem from one node usually affects other
nodes. Funnily, unhealthy node itself might not see the slowness.
Most Global cache wait events are symptoms, not necessarily
problems.
For example, Log file write slowness in one node can induce
massive ‘gc buffer busy’ waits in other nodes.
©OraInternals Riyaj Shamsudeen 33
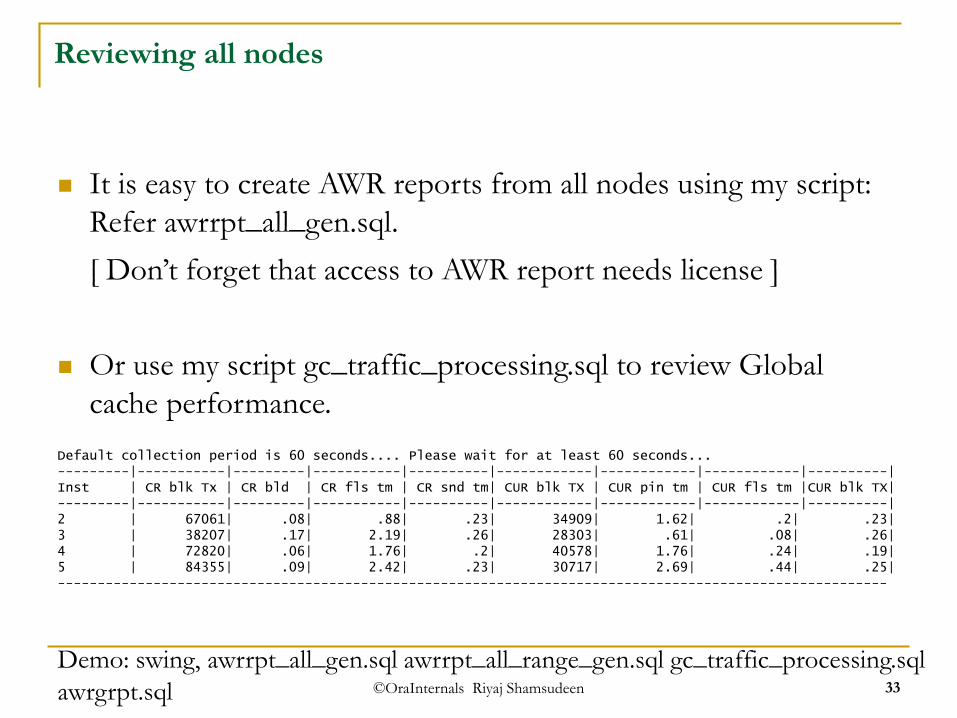
Reviewing all nodes
It is easy to create AWR reports from all nodes using my script:
Refer awrrpt_all_gen.sql.
[ Don’t forget that access to AWR report needs license ]
Or use my script gc_traffic_processing.sql to review Global
cache performance.
Default collection period is 60 seconds.... Please wait for at least 60 seconds...---------|-----------|---------|-----------|----------|------------|------------|------------|----------|Inst | CR blk Tx | CR bld | CR fls tm | CR snd tm| CUR blk TX | CUR pin tm | CUR fls tm |CUR blk TX|---------|-----------|---------|-----------|----------|------------|------------|------------|----------|2 | 67061| .08| .88| .23| 34909| 1.62| .2| .23|3 | 38207| .17| 2.19| .26| 28303| .61| .08| .26|4 | 72820| .06| 1.76| .2| 40578| 1.76| .24| .19|5 | 84355| .09| 2.42| .23| 30717| 2.69| .44| .25|--------------------------------------------------------------------------------------------------------
Demo: swing, awrrpt_all_gen.sql awrrpt_all_range_gen.sql gc_traffic_processing.sql
awrgrpt.sql

©OraInternals Riyaj Shamsudeen 34
Caution
Don’t use gv$views directly to find averages as that can be
misleading. Use AWR reports or custom scripts.
gv$views are aggregated data and persistent from the instance
restart.
For example this query output can be misleading
( As the output of this query is aggregated over the life of the
instances):
select b1.inst_id, b2.value "RECEIVED",b1.value "RECEIVE TIME",((b1.value / b2.value) * 10) "AVG RECEIVE TIME (ms)"from gv$sysstat b1, gv$sysstat b2where b1.name = ‘gc cr block receive time' andb2.name = 'gc cr blocks received' and b1.inst_id = b2.inst_id
©OraInternals Riyaj Shamsudeen 35
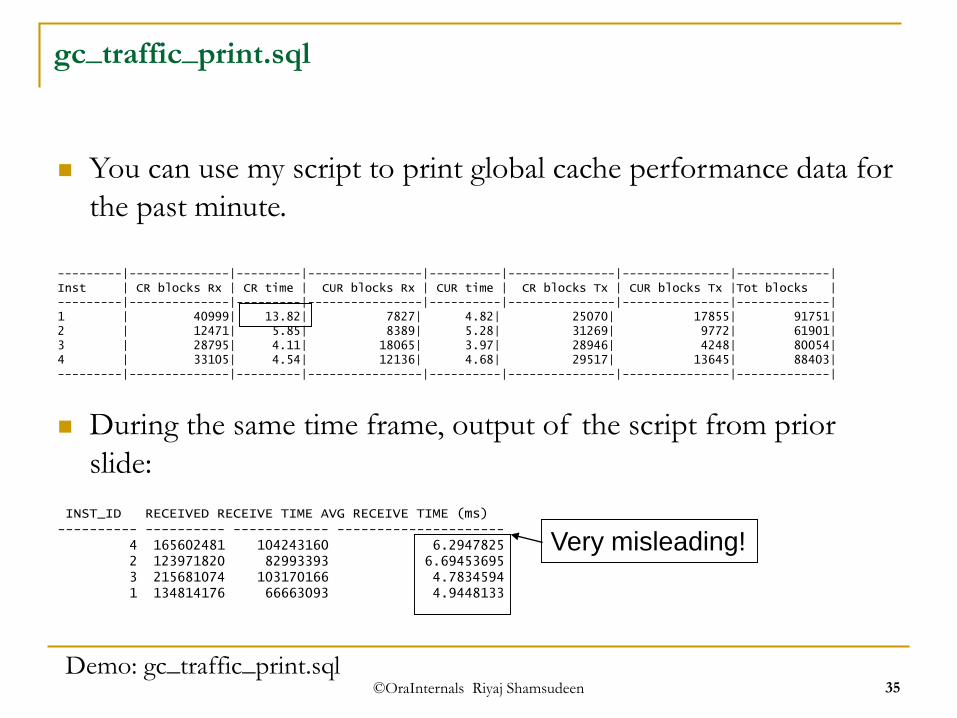
gc_traffic_print.sql
You can use my script to print global cache performance data for
the past minute.
---------|--------------|---------|----------------|----------|---------------|---------------|-------------|Inst | CR blocks Rx | CR time | CUR blocks Rx | CUR time | CR blocks Tx | CUR blocks Tx |Tot blocks |---------|--------------|---------|----------------|----------|---------------|---------------|-------------|1 | 40999| 13.82| 7827| 4.82| 25070| 17855| 91751|2 | 12471| 5.85| 8389| 5.28| 31269| 9772| 61901|3 | 28795| 4.11| 18065| 3.97| 28946| 4248| 80054|4 | 33105| 4.54| 12136| 4.68| 29517| 13645| 88403|---------|--------------|---------|----------------|----------|---------------|---------------|-------------|
During the same time frame, output of the script from prior
slide:
INST_ID RECEIVED RECEIVE TIME AVG RECEIVE TIME (ms)---------- ---------- ------------ ---------------------
4 165602481 104243160 6.29478252 123971820 82993393 6.694536953 215681074 103170166 4.78345941 134814176 66663093 4.9448133
Very misleading!
Demo: gc_traffic_print.sql

©OraInternals Riyaj Shamsudeen 36
GC Send time
Global cache send time is important metrics.
Global cache Send time in one node can affect Receive time
in all other nodes.
For that matter, GC receive performance of unhealthy node will
not be worse, but other nodes will suffer from GC receive
performance
For example, if node 2 is suffering from GC send latencies, other
nodes will suffer from GC receive latencies, but node 2 might not
suffer from GC receive latencies.

©OraInternals Riyaj Shamsudeen 37
AWR –Send metrics
Send metrics are broken down to various metrics. This section
shows efficiency of LMS processes:
Avg global cache cr block build time (ms): 0.1
Avg global cache cr block send time (ms): 0.3
Global cache log flushes for cr blocks served %: 18.7
Avg global cache cr block flush time (ms): 4.9
LMS processing delay ~=
Time to build block +
Time to wait for Log flush sync +
Time to send the block over the network.
These are Send metrics
©OraInternals Riyaj Shamsudeen 38
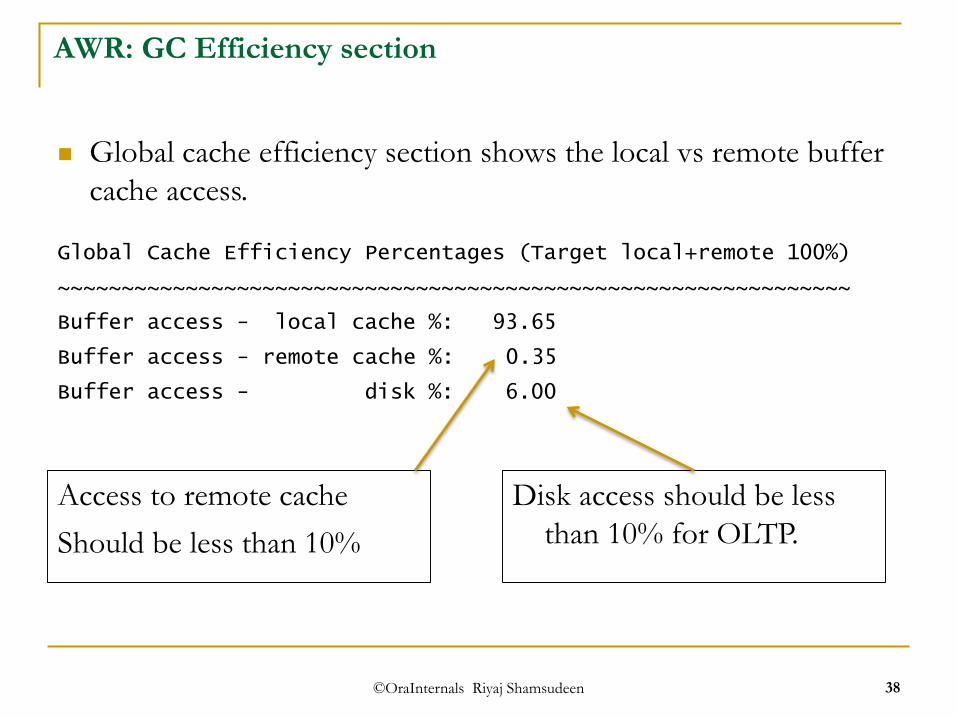
AWR: GC Efficiency section
Global cache efficiency section shows the local vs remote buffer
cache access.
Global Cache Efficiency Percentages (Target local+remote 100%)
~~~~~~~~~~~~~~~~~~~~~~~~~~~~~~~~~~~~~~~~~~~~~~~~~~~~~~~~~~~~~~
Buffer access - local cache %: 93.65
Buffer access - remote cache %: 0.35
Buffer access - disk %: 6.00
Access to remote cache
Should be less than 10%
Disk access should be less
than 10% for OLTP.
©OraInternals Riyaj Shamsudeen 39
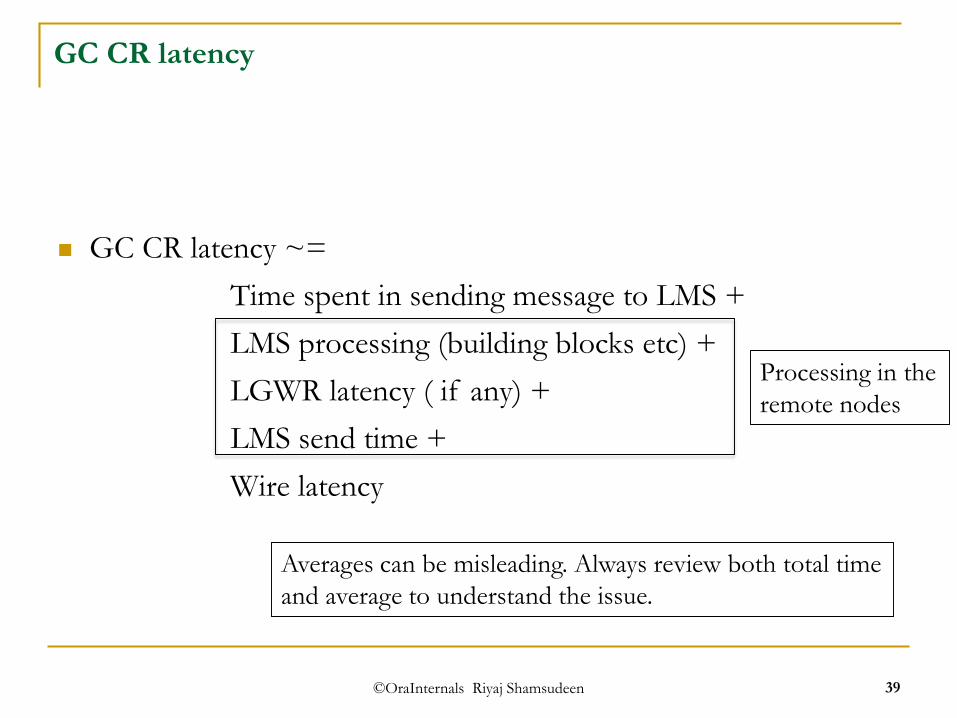
GC CR latency
GC CR latency ~=
Time spent in sending message to LMS +
LMS processing (building blocks etc) +
LGWR latency ( if any) +
LMS send time +
Wire latency
Averages can be misleading. Always review both total time
and average to understand the issue.
Processing in the
remote nodes
©OraInternals Riyaj Shamsudeen 40
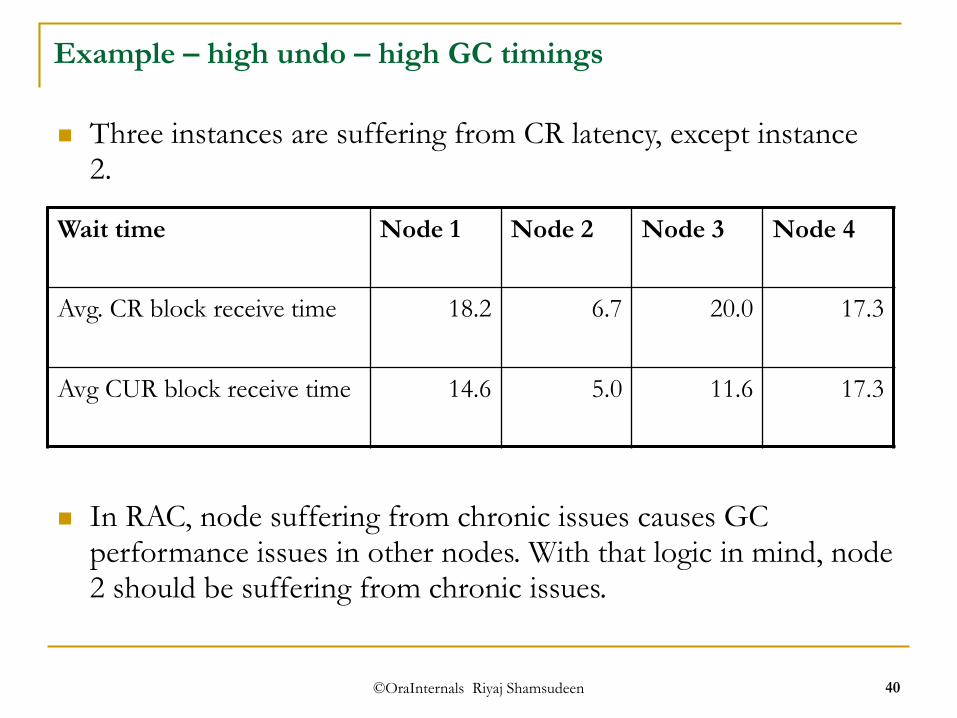
Example – high undo – high GC timings
Wait time Node 1 Node 2 Node 3 Node 4
Avg. CR block receive time 18.2 6.7 20.0 17.3
Avg CUR block receive time 14.6 5.0 11.6 17.3
Three instances are suffering from CR latency, except instance 2.
In RAC, node suffering from chronic issues causes GC performance issues in other nodes. With that logic in mind, node 2 should be suffering from chronic issues.
©OraInternals Riyaj Shamsudeen 41
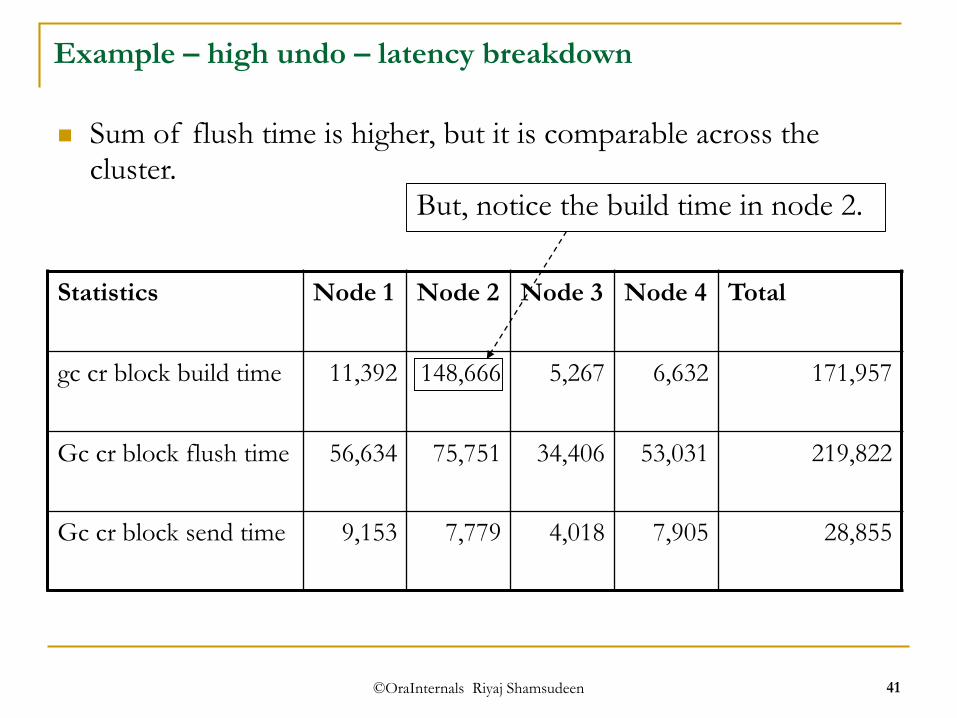
Example – high undo – latency breakdown
Statistics Node 1 Node 2 Node 3 Node 4 Total
gc cr block build time 11,392 148,666 5,267 6,632 171,957
Gc cr block flush time 56,634 75,751 34,406 53,031 219,822
Gc cr block send time 9,153 7,779 4,018 7,905 28,855
Sum of flush time is higher, but it is comparable across the cluster.
But, notice the build time in node 2.
©OraInternals Riyaj Shamsudeen 42
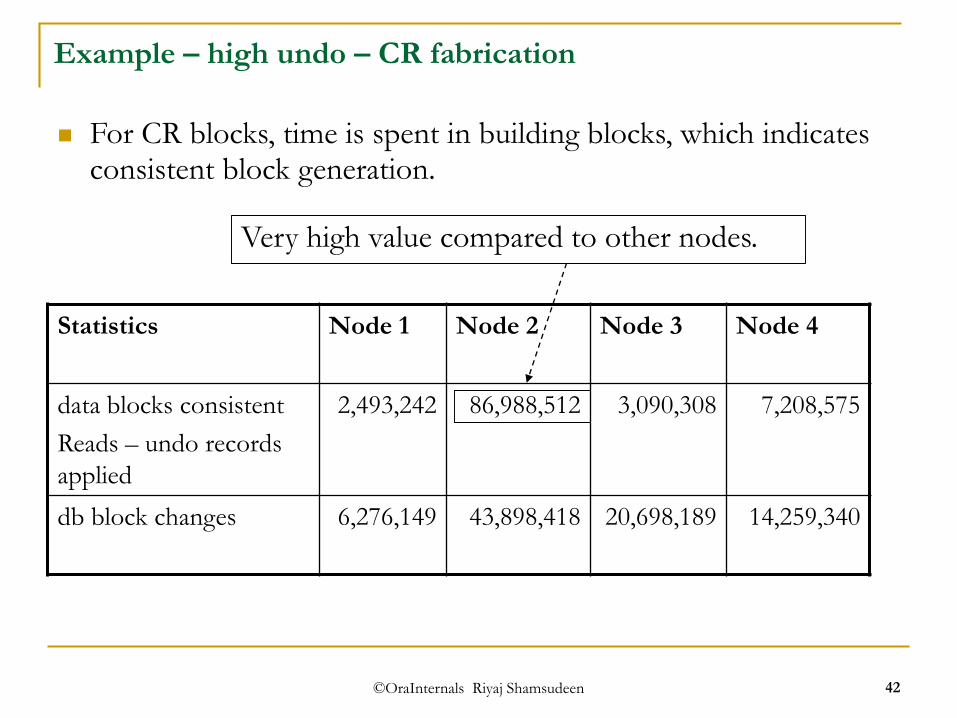
Example – high undo – CR fabrication
Statistics Node 1 Node 2 Node 3 Node 4
data blocks consistent
Reads – undo records
applied
2,493,242 86,988,512 3,090,308 7,208,575
db block changes 6,276,149 43,898,418 20,698,189 14,259,340
For CR blocks, time is spent in building blocks, which indicates consistent block generation.
Very high value compared to other nodes.

©OraInternals Riyaj Shamsudeen 43
GC CUR latency
GC CUR latency ~=
Time spent in sending message to LMS +
LMS processing (pin blocks etc, defer ) +
LGWR latency ( if any) +
LMS send time +
Wire latency
Statistics : gc current block flush time
gc current block pin time
gc current block send time
©OraInternals Riyaj Shamsudeen 44
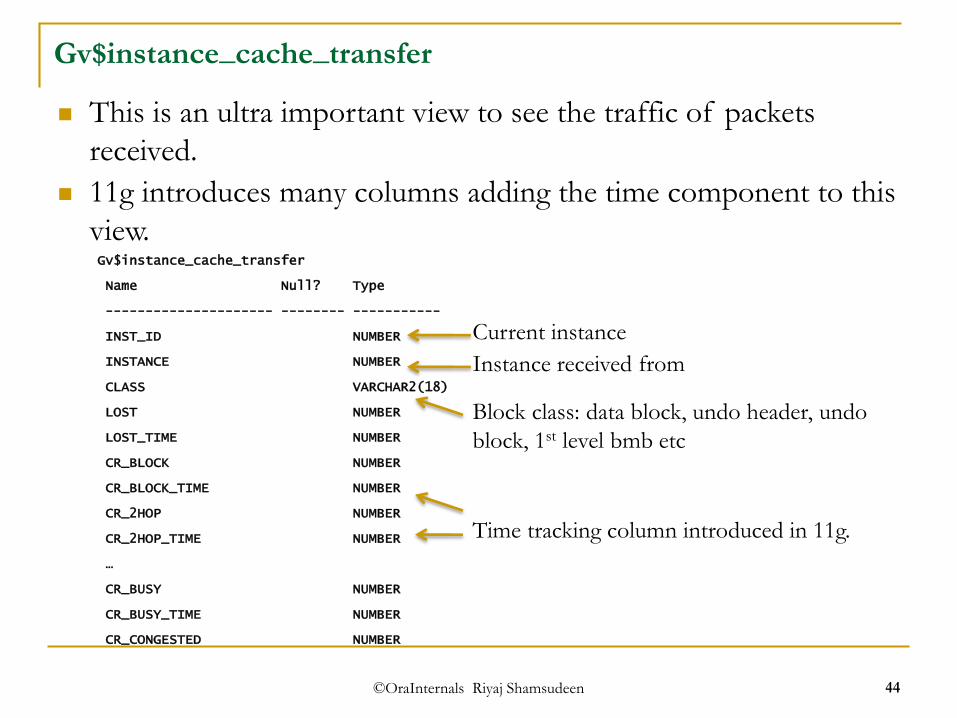
Gv$instance_cache_transfer
This is an ultra important view to see the traffic of packets
received.
11g introduces many columns adding the time component to this
view. Gv$instance_cache_transfer
Name Null? Type
--------------------- -------- -----------
INST_ID NUMBER
INSTANCE NUMBER
CLASS VARCHAR2(18)
LOST NUMBER
LOST_TIME NUMBER
CR_BLOCK NUMBER
CR_BLOCK_TIME NUMBER
CR_2HOP NUMBER
CR_2HOP_TIME NUMBER
…
CR_BUSY NUMBER
CR_BUSY_TIME NUMBER
CR_CONGESTED NUMBER
Current instance
Instance received from
Block class: data block, undo header, undo
block, 1st level bmb etc
Time tracking column introduced in 11g.

©OraInternals Riyaj Shamsudeen 45
THANK YOU
Email: [email protected]
Blog : orainternals.wordpress.com
Web: www.orainternals.com