Quantifying Aflatoxin B1 in peanut oil using fabricating ... · 27 China and India regions is the...
23
Quantifying Aflatoxin B1 in peanut oil using fabricating fluorescence probes based on upconversion nanoparticles. Sun, C., Li, H., Koidis, A., & Chen, Q. (2016). Quantifying Aflatoxin B1 in peanut oil using fabricating fluorescence probes based on upconversion nanoparticles. SPECTROCHIMICA ACTA PART A-MOLECULAR AND BIOMOLECULAR SPECTROSCOPY, 165, 120-126. DOI: 10.1016/j.saa.2016.04.040 Published in: SPECTROCHIMICA ACTA PART A-MOLECULAR AND BIOMOLECULAR SPECTROSCOPY Document Version: Peer reviewed version Queen's University Belfast - Research Portal: Link to publication record in Queen's University Belfast Research Portal Publisher rights Copyright 2016 Elsevier. This manuscript is made available under a Creative Commons Attribution-NonCommercial-NoDerivs License (https://creativecommons.org/licenses/by-nc-nd/4.0/), which permits distribution and reproduction for non-commercial purposes, provided the author and source are cited. General rights Copyright for the publications made accessible via the Queen's University Belfast Research Portal is retained by the author(s) and / or other copyright owners and it is a condition of accessing these publications that users recognise and abide by the legal requirements associated with these rights. Take down policy The Research Portal is Queen's institutional repository that provides access to Queen's research output. Every effort has been made to ensure that content in the Research Portal does not infringe any person's rights, or applicable UK laws. If you discover content in the Research Portal that you believe breaches copyright or violates any law, please contact [email protected]. Download date:22. Aug. 2018
Transcript of Quantifying Aflatoxin B1 in peanut oil using fabricating ... · 27 China and India regions is the...
Quantifying Aflatoxin B1 in peanut oil using fabricating fluorescenceprobes based on upconversion nanoparticles.
Sun, C., Li, H., Koidis, A., & Chen, Q. (2016). Quantifying Aflatoxin B1 in peanut oil using fabricatingfluorescence probes based on upconversion nanoparticles. SPECTROCHIMICA ACTA PART A-MOLECULARAND BIOMOLECULAR SPECTROSCOPY, 165, 120-126. DOI: 10.1016/j.saa.2016.04.040
Published in:SPECTROCHIMICA ACTA PART A-MOLECULAR AND BIOMOLECULAR SPECTROSCOPY
Document Version:Peer reviewed version
Queen's University Belfast - Research Portal:Link to publication record in Queen's University Belfast Research Portal
Publisher rightsCopyright 2016 Elsevier.This manuscript is made available under a Creative Commons Attribution-NonCommercial-NoDerivs License(https://creativecommons.org/licenses/by-nc-nd/4.0/), which permits distribution and reproduction for non-commercial purposes, provided theauthor and source are cited.
General rightsCopyright for the publications made accessible via the Queen's University Belfast Research Portal is retained by the author(s) and / or othercopyright owners and it is a condition of accessing these publications that users recognise and abide by the legal requirements associatedwith these rights.
Take down policyThe Research Portal is Queen's institutional repository that provides access to Queen's research output. Every effort has been made toensure that content in the Research Portal does not infringe any person's rights, or applicable UK laws. If you discover content in theResearch Portal that you believe breaches copyright or violates any law, please contact [email protected].
Download date:22. Aug. 2018
Quantifying Aflatoxin B1 in peanut oil using fabricating fluorescence probes 1
based on upconversion nanoparticles 2
3
Cuicui Sun, Huanhuan Li, Anastasios Koidis, Quansheng Chen* 4
School of Food and Biological engineering, Jiangsu University, Zhenjiang, 212013, P. R. China. 5
Institute for Global Food Security, Queen’s University Belfast, BT95GN, Northern Ireland, United 6
Kingdom. 7
8
* Corresponding author. Tel.: +86-511-88790318; fax: +86-511-88780201
E-mail: [email protected] (Qs Chen)
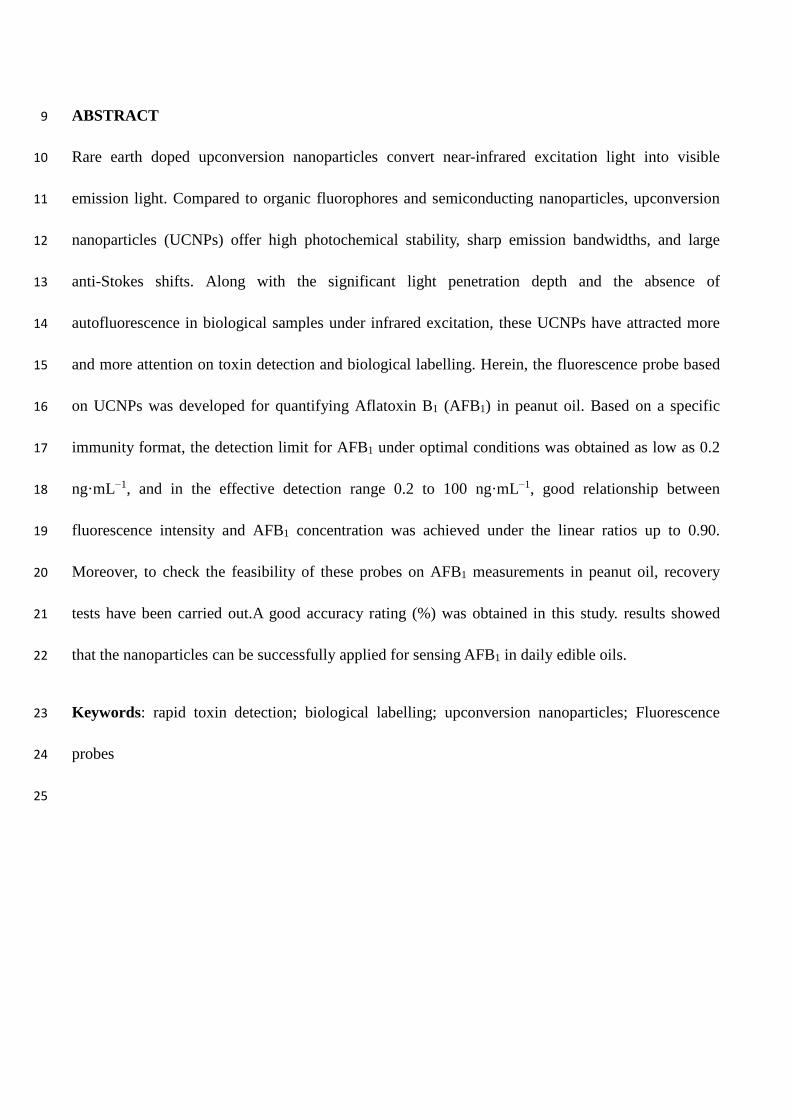
ABSTRACT 9
Rare earth doped upconversion nanoparticles convert near-infrared excitation light into visible 10
emission light. Compared to organic fluorophores and semiconducting nanoparticles, upconversion 11
nanoparticles (UCNPs) offer high photochemical stability, sharp emission bandwidths, and large 12
anti-Stokes shifts. Along with the significant light penetration depth and the absence of 13
autofluorescence in biological samples under infrared excitation, these UCNPs have attracted more 14
and more attention on toxin detection and biological labelling. Herein, the fluorescence probe based 15
on UCNPs was developed for quantifying Aflatoxin B1 (AFB1) in peanut oil. Based on a specific 16
immunity format, the detection limit for AFB1 under optimal conditions was obtained as low as 0.2 17
ng·mL−1, and in the effective detection range 0.2 to 100 ng·mL−1, good relationship between 18
fluorescence intensity and AFB1 concentration was achieved under the linear ratios up to 0.90. 19
Moreover, to check the feasibility of these probes on AFB1 measurements in peanut oil, recovery 20
tests have been carried out.A good accuracy rating (%) was obtained in this study. results showed 21
that the nanoparticles can be successfully applied for sensing AFB1 in daily edible oils. 22
Keywords: rapid toxin detection; biological labelling; upconversion nanoparticles; Fluorescence 23
probes 24
25
1. Introduction 26
China and India regions is the world’s biggest market for peanut and its derivatives (in particular 27
peanut oil) in terms of productions well as consumption (Sanders Iii et al., 2014). Several survey 28
studies have shown that mold will grow quickly, and the possible presence of aflatoxins would 29
transfer into peanut oil, when peanuts are stored for weeks in humid conditions (Klu & Chen, 2015). 30
Aflatoxins are a group of highly toxic secondary metabolites produced mainly by Aspergillus flavus 31
and Aspergillus parasiticus on a variety of food products (K. Chen et al., 2014). These toxins are 32
known to be potent carcinogens, teratogens, mutagens, and immunosuppression and pose harmful 33
threat to animal and human health (Xia et al., 2013). Naturally occurring aflatoxins are composed of 34
B1, B2, G1 and G2 types. Among them, aflatoxin B1 (AFB1) is the most abundant and carcinogenic 35
(Passone, Girardi, & Etcheverry, 2013). Since peanut oil is widely consumed as diet in the Asian 36
region, even low levels of contamination may cause severe health and safety incidents (Luongo et al., 37
2013; Quiles, Manyes, Luciano, Mañes, & Meca, 2015; Van de Perre, Jacxsens, Lachat, El Tahan, & 38
De Meulenaer, 2015). Therefore, determination of AFB1 in peanut and its derivatives becomes a 39
subject of great importance for industries and regulators alike. 40
A wide range of methods are currently available, including thin layer chromatography (TLC), 41
spectrometry (Busman, Liu, Zhong, Bobell, & Maragos, 2014), gas chromatography(Ceker, Agar, 42
Alpsoy, Nardemir, & Kizil, 2014), High-performance liquid chromatography (HPLC)(Herzallah, 43
2009), fluorescence polarization assays(Maragos, 2009), radio immunoassays(Waliyar, Reddy, & 44
Lava-Kumar, 2009), enzyme-linked immunosorbent assay(Sai et al., 2010) (ELISA) and fiberoptic 45
based immunoassays(Kozlov et al., 2004), which have been used for the detection of aflatoxins. 46
However, most of these techniques require well equipped laboratories, trained personnel, harmful 47
solvents, and are time-consuming. Therefore, the demand for developing a rapid and sensitive 48
method for sensing aflatoxins is urgent. 49
In optical detection methods, conventional downconversion fluorescent materials, such as 50
semiconductor nanoparticles, dye-coupled hybrid materials and mesoporous silica, are fluorophores 51
that are commonly used in biological studies and clinical application because of their unique features 52
(Mnoyan, Kirakosyan, Kim, Jang, &Jeon, 2015); Sharma, Rawat, Solanki, & Bohidar, 2015). One 53
important intrinsic limitation, however, is that these materials usually emit one lower-energy photon 54
after absorption of a higher-energy ultraviolet or visible photon. This lead to significant 55
disadvantages, such as low light-penetration depth, potentially severe photodamage to living 56
organisms (Sozer & Kokini, 2014), and the autofluorescence (noise) of some biological samples. To 57
solve these problems, the development of alternative biological luminescent labels through the use of 58
up-converting rare-earth nanophosphors (UCNPs) has attracted a tremendous amount of attention 59
due to the unique luminescence properties of rare-earth nanoparticles. Lanthanide-doped, 60
near-infrared (NIR)-to-visible upconversion nanophosphors are capable of emitting strong visible 61
fluorescence under the excitation of NIR light (typically 980 nm). They have been shown to have 62
significant advantages as fluorescent bio-label (Boyer, Manseau, Murray, & van Veggel, 2010; 63
Chatterjee, Rufaihah, & Zhang, 2008; Fang et al., 2014; Huang, Yu, & Chu, 2015; Ma, Liu, Han, 64
Yang, & Liu, 2015; Tian et al., 2015) over the traditional organic fluorophores due to their attractive 65
optical and chemical features, including low toxicity (Chatterjee, Gnanasammandhan, & Zhang, 66
2010; Zhang, Wu, Tang, Su, & Lv, 2014), large stokes shifts (Ahn et al., 2016), high resistance to 67
photobleaching(Feng Wang et al., 2011), blinking, photochemical stability (H. Q. Chen, Yuan, & 68
Wang, 2013) and the lack of both auto-fluorescence (Aramburu et al., 2015) and light scattering 69
background (Zhou, Liu, & Li, 2012). As a result, the signal-to-background ratio and sensitivity of the 70
detection can be greatly improved. Moreover, upconversion nanoparticles have also attracted 71
increasing interest due to their optical properties which can be achieved by adding a λexc. = 980 nm 72
optical source used in fluorescence measurement. From the mentioned advantages above, we can 73
conclude that the upconversion nanophosphors as color label has a high potential on the detection of 74
toxin. 75
In recent years, with the rapid development of nanostructured materials and nanotechnology in 76
the fields of biotechnology and contaminat detection, magnetic nanoparticles (MNPs) have been 77
receiving considerable attention. Due to their magnetic properties, low toxicity, and biocompatibility, 78
MNPs are useful for the separation of target antibiotics from a mixture of antibiotics and matrix 79
substances. Additionally, MNPs help to concentrate the separated antibiotics into a small volume, 80
which is suitable for impedance measurements(Z. Wang et al., 2013). Artificial antigen-modified 81
MNPs were employed as immune sensing probes, and antibody functionalized UCNPs were used as 82
signal probes; the antibodies-functionalized UCNPs were linked to the surface of the MNPs by 83
antibody–antigen affinity. 84
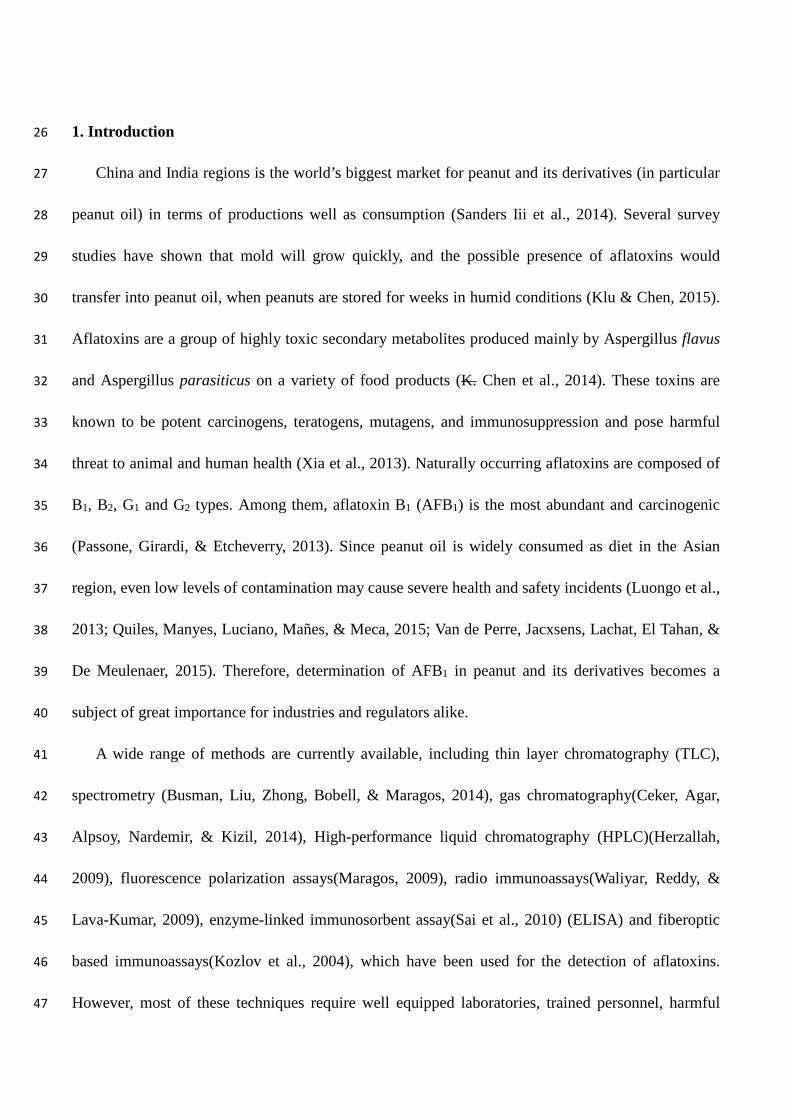
Herein, we explored a novel and sensitive fluorescence probe for sensing toxin by crosslinking 85
rare earth doped upconversion nanoparticles and immunoproteins. Fig. 1 presents the scheme of this 86
proposed fluorescence bioassay platform. Specific procedures are outlined as follows. (1) 87
Upconversion nanoparticles (UCNPs) were synthesized and functionalized. (2) The resultant 88
water-soluble UCNPs were conjugated with anti-AFB1 antibodies to produce biological fluorescent 89
probes. (3) A fluorescence standard curve was prepared with different concentrations of AFB1. (4) 90
Independent food samples were tested. As an efficient, specific, and technically simple biological 91
probe, these selective sensors can be used for rapidly detecting toxin in food. 92
93
94
95
Fig. 1. Scheme of this proposed fluorescence bioassay platform. 96
97
2. Materials and methods 98
2.1 Instruments 99
The size and morphology of nanoparticles were determined using a JEM-2100HR transmission 100
electron microscope (TEM, JEOL Ltd., Japan). X-ray diffraction (XRD) measurements were 101
performed using a D8-advance instrument (Bruker AXS Ltd., Germany). Upconversion fluorescence 102
spectra were measured using an F-7200 fluorescence spectrophotometer (Hitachi Co., U.S.A.) 103
modified with an external 980nm laser (Beijing Hi-Tech Optoelectronic Co., China) instead of the 104
internal excitation source. Fourier transform infrared spectrophotometer (FT-IR) spectra of the 105
nanoparticles were obtained with a Nicolet Nexus 470 (Thermo Electron Co., U.S.A.) using a KBr 106
detector. 107
2.2 Reagents 108
AFB1 standard solution, (8 mg·mL−1 solution in methanol and working dilution by deionized 109
water),AFB1–BSA antigen (extent of labeling 8-12 mol Aflatoxin B1 per mol BSA), monoclonal 110
anti-AFB1 antibody, (6 mg·mL−1 solution and working dilution by phosphate buffer solution) was 111
obtained from Beijing Mozhidong Bio-tech (city. Country). Hydrated rare earth nitrate (RECl3·xH2O, 112
RE Y, Yb, Er, ≥ 99.99%), oleic acid (≥ 90%) and octadecanoic acid (≥ 90%) were purchased from 113
Sigma-Aldrich (Shanghai, China). In addition, FeCl3·6H2O, sodium fluoride, sodium hydroxide, 114
methyl alcohol, toluene, ethyl alcohol, sodium citrate, 1,6-hexanediamine, anhydrous sodium acetate, 115
glycol, bovine serum albumin (BSA, 96-99%),25% glutaraldehyde, tetraethyl orthosilicate (TEOS ≥ 116
98%), and 3-aminopropyltrimethoxysilane (APTES) was all purchased from Sinopharm Chemical 117
Reagent Co., Ltd. (Shanghai, China). All the chemicals used were of analytical grade. The water used 118
was deionized. 119
2.3 Synthesis and surface modification of rare-earth-doped 120
Oleic acid-capped NaYF4: Yb, Er UCNPs were synthesized according to the method reported in 121
predecessors’ research (F. Wang et al., 2010) with a few modifications. In a typical experiment, 2 ml 122
of RECl3 (0.2 M, RE = Y (78%), Yb (20%), Er (2%)) in methanol were added to a 50 ml flask 123
containing 3 ml oleic acid and 7 ml 1-octadecene, and the solution was heated to 160 ℃ for 30 min 124
and then cooled down to room temperature. Thereafter, 5 ml methanol solution of NH4F (1.6 mmol) 125
and NaOH (1 mmol) was added and the solution was stirred for 30 min. After methanol evaporated, 126
the solution was heated to 300 ℃ under argon for 1.5 h and cooled down to room temperature. The 127
resulting nanoparticles were precipitated by the addition of ethanol, collected by centrifugation, 128
washed with methanol and ethanol several times, and finally dried in an oven at 60 ℃. 129
The obtained oleic acid-capped UCNPs can disperse well in nonpolar solvents. However, for 130
biological applications, hydrophobic UCNPs should be converted into hydrophilic UCNPs so as to 131
be compatible with biomolecules, such as antibodies. Thus, surface modification of the hydrophobic 132
UCNPs was performed via a ligand exchange process as described in predecessors’ research (Ong, 133
Ang, Alonso, & Zhang, 2014). Briefly, a mixture of 2 mmol sodium citrate in 15 ml of diethylene 134
glycol was first heated to 110 ℃ under argon for 30 min. Oleic acid-capped UCNPs (10 mg) 135
dispersed in cyclohexane and toluene were then added into the mixture and the reaction was heated 136
to 160 ℃ for evaporation of cyclohexane and toluene. After complete evaporation, the reaction was 137
further maintained at 160 ℃ for 3 h. Water-soluble UCNPs were then collected by centrifugation, 138
washed with ethanol and ultrapure water several times, and finally dispersed in ultrapure water. 139
140
2.4 Preparation of amine-functionalized Fe3O4 magnetic nanoparticles 141
Amine-functionalized Fe3O4 MNPs were prepared according to Gao’s work (Gao, Gu, & Xu, 142
2009). Briefly, a solution of 6.5 g 1,6-hexanediamine, 2.0 g anhydrous sodium acetate and 1.0 g 143
FeCl3 6H2O as a ferric source in 30 mL glycol was stirred vigorously at 50 ℃ to give a transparent 144
solution. This solution was then transferred into a Teflon-lined autoclave and reacted at 198 ℃ for 6 145
h. The MNPs were then rinsed with water and ethanol (2 or 3 times) to effectively remove the 146
solvent and unbound 1,6-hexanediamine, and then dried at 50 ℃ before characterization and 147
application. During each rinsing step, the nanoparticles were separated from the supernatant by using 148
magnetic force. 149
2.5 Preparation of immunosensing probes and signal probes 150
The artificial antigen conjugated MNPs and antibody conjugated immunosensing probes were 151
fabricated with the classical glutaraldehyde method. Typically, 10 mg of MNPs were dispersed in 5 152
mL of 10 mmol/L phosphate buffer solution (pH 7.4) by ultrasonication for 20 min. 1.25 mL of 25% 153
glutaraldehyde was then added to the mixture. The mixture was shaken slowly at room temperature 154
for 1 h, and the Fe3O4 MNPs were separated by an external magnetic field and washed with PBS 155
three times to remove the physically adsorbed glutaraldehyde. Subsequently, 11.67 μL of AFB1-BSA 156
antigen, at a concentration of 6 mg mL−1, was added into 5 mL of a suspension of Fe3O4 MNPs in 157
PBS. The mixture was shaken slowly for 6 h at room temperature. The surplus biomolecules were 158
removed by magnetic separation of the particles from the solution. The AFB1–BSA antigen 159
conjugated MNPs were treated with 5 mL BSA at 3% concentration in 10 mmol/L PBS at room 160
temperature for 6 h to block the unreacted and nonspecific sites. Finally, the as-prepared probes were 161
stored in 5 mL of 10 mmol/L PBS at 4 ℃ prior to use. The biofunctionalization of amino-modified, 162
water-soluble UCNPs conjugated with monoclonal antibody, namely the preparation of the signal 163
probes, was similar to that of the antigen conjugated MNPs described above. The prepared antigen 164
conjugated Fe3O4 MNPs and antibody functionalized UCNPs were characterized by FT-IR 165
spectroscopy. 166
2.6 Sample preparation and measurement 167
Twelve naturally contaminated peanut oil samples obtained from local supermarkets were 168
treated according to official methods of China (GB/T, 2003) with some modifications. Briefly, five 169
grams of each peanut oil sample and 5 g NaCl were introduced into a 100 mL flask, and the 170
extracting solution (methanol:water; 7:3 (v:v)) was filled to the mark, completely mixed with the 171
compound and then the mixture was transferred into the cup of a homogenizer. The mixture was then 172
stirred at high-speed and extracted for 2 min. Next, the resulting solution was filtered, and 10 mL of 173
filtrate was transferred into a 50 mL flask; water was filled to the mark, and the flask contents were 174
mixed to homogeneity. The resulting mixture was further filtered with glass fiber filter paper until 175
the filtrate was clear. For the standard addition and recovery experiments, the AFB1 standard 176
solutions were added to the peanut oil samples before adding the extracting solution. After the 177
complete chemical reaction and magnetism separation, fluorescence spectra of the obtained 178
supernatants (from 400 to 700 nm) were measured with a fluorescence spectrophotometer equipped 179
with a 980 nm laser excitation under the excitation power (1.3 W). Here, the 541nm peak intensity 180
emission wavelength was used. 181
3. Results and Discussion 182
3.1 Characterization of the prepared upconversion nanoparticles and magnetic nanoparticles 183
Results showed that toxin-specific antibodies with high selectivity and sensitivity were 184
successfully conjugated onto the surface of UCNPs to yield UCNP−antibody probes, as illustrated in 185
Fig.1. Prior to the conjugation, the precursor UCNPs were first characterized by transmission 186
electron microscopy (TEM), X-ray diffraction (XRD) and fluorescence spectral measurements, as 187
shown in Fig 2. Successful surface modification, selectivities, sizes, and luminance and spectral 188
properties of UCNPs before and after surface modification were validated by TEM and fluorescence 189
spectral measurements, as presented in Fig.2 (a, b, c). The TEM images confirmed the hexagonal 190
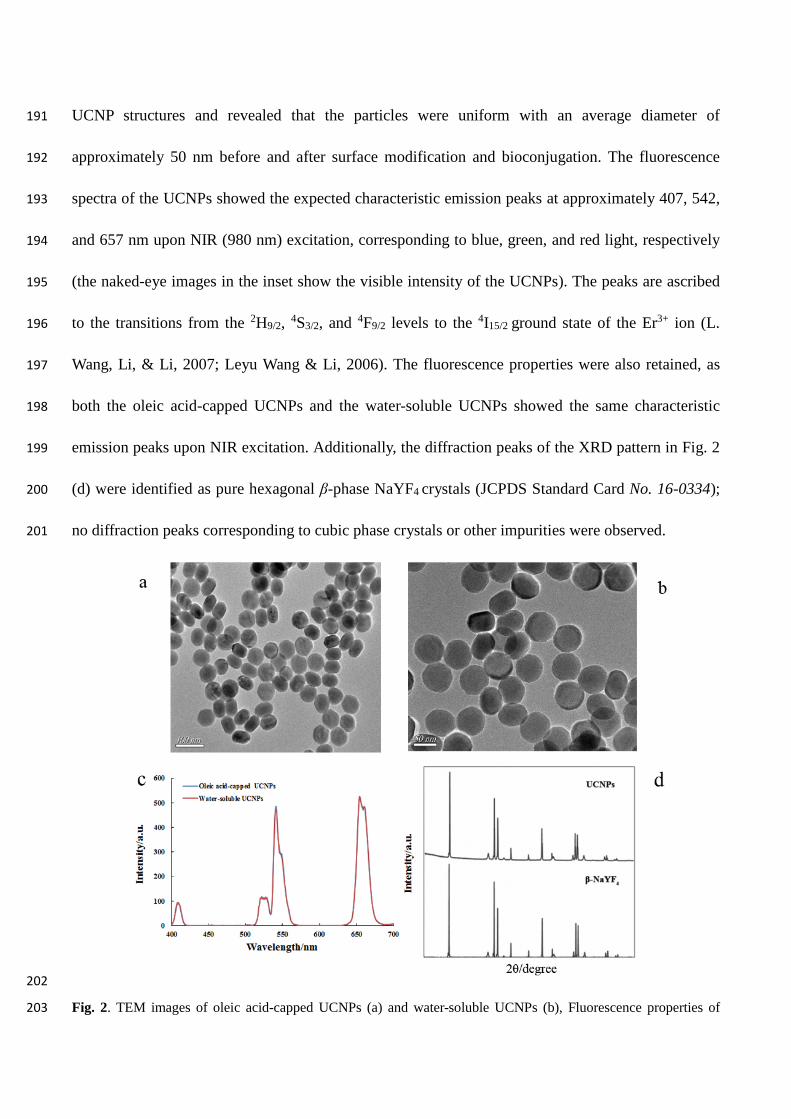
UCNP structures and revealed that the particles were uniform with an average diameter of 191
approximately 50 nm before and after surface modification and bioconjugation. The fluorescence 192
spectra of the UCNPs showed the expected characteristic emission peaks at approximately 407, 542, 193
and 657 nm upon NIR (980 nm) excitation, corresponding to blue, green, and red light, respectively 194
(the naked-eye images in the inset show the visible intensity of the UCNPs). The peaks are ascribed 195
to the transitions from the 2H9/2, 4S3/2, and 4F9/2 levels to the 4I15/2 ground state of the Er3+ ion (L. 196
Wang, Li, & Li, 2007; Leyu Wang & Li, 2006). The fluorescence properties were also retained, as 197
both the oleic acid-capped UCNPs and the water-soluble UCNPs showed the same characteristic 198
emission peaks upon NIR excitation. Additionally, the diffraction peaks of the XRD pattern in Fig. 2 199
(d) were identified as pure hexagonal β-phase NaYF4 crystals (JCPDS Standard Card No. 16-0334); 200
no diffraction peaks corresponding to cubic phase crystals or other impurities were observed. 201
202
Fig. 2. TEM images of oleic acid-capped UCNPs (a) and water-soluble UCNPs (b), Fluorescence properties of 203
oleic acid-capped UCNPs and water-soluble UCNPs (c), XRD pattern of oleic acid-capped UCNPs (d). 204
205
The UCNPs used in this work were Yb, Er ion-pair doped hexagonal phase NaYF4 206
nanoparticles. The hexagonal phase NaYF4 was reported to be one of the most efficient hosts for 207
performing infrared to visible photon conversion when activated by Yb, Er ion-pairs. During the 208
experiment, we found that the reaction time and temperature were the two main influential factors in 209
the phase transition of NaYF4 UCNPs. In order to obtain hexagonal phase NaYF4, the reaction was 210
maintained at 300 ℃ for 1.5 h. 211
The XRD pattern of NaYF4: Yb, Er phosphor gives several reflections shown in Fig.2 (d) indicates 212
that the microballoon sphere are well-crystallized. In Yb3+ and Er3+ co-doped systems, Yb3+ ions act 213
as sensitizers and Er3+ ions as activators. The Debye Scherrer formula was used to calculate the 214
crystallite size of the synthesized phosphor and is given by d = , where d is the crystallite size, 215
λ is the wavelength of the X-rays, β is full width at half maximum and θ is the diffraction angle. The 216
average value of the crystallite size was found to be around 50 nm that confirms the formation of 217
nanostructured crystallites. 218
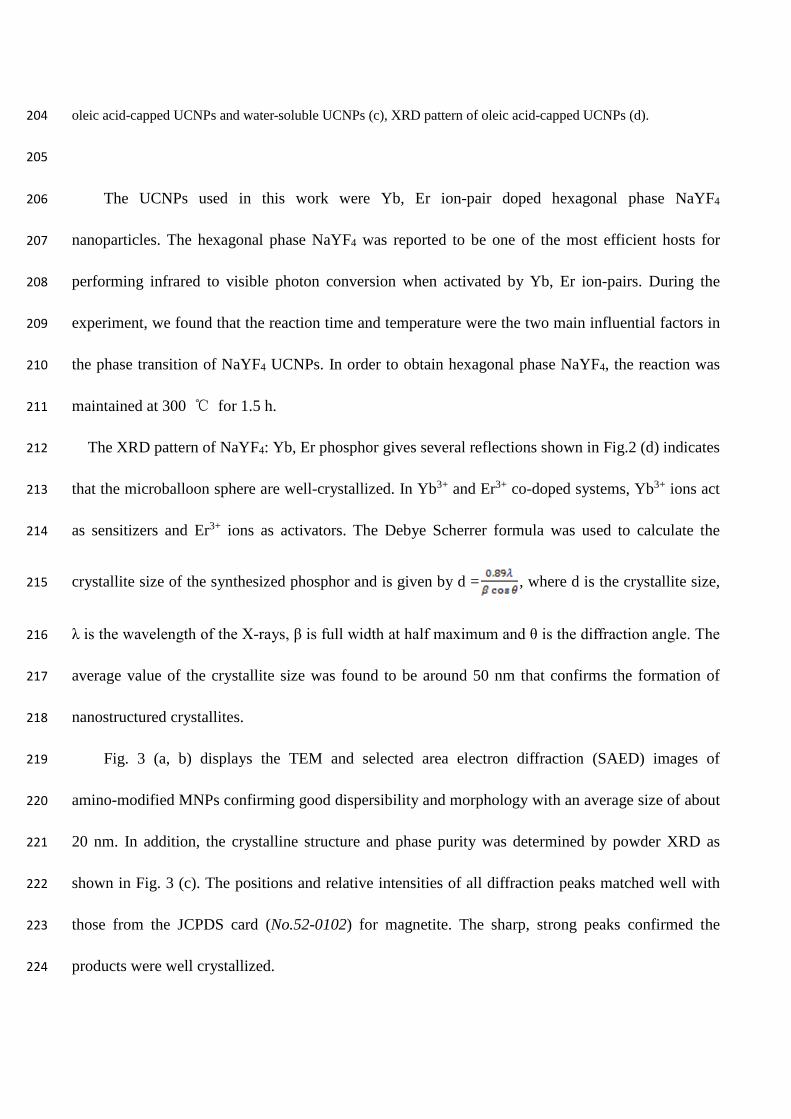
Fig. 3 (a, b) displays the TEM and selected area electron diffraction (SAED) images of 219
amino-modified MNPs confirming good dispersibility and morphology with an average size of about 220
20 nm. In addition, the crystalline structure and phase purity was determined by powder XRD as 221
shown in Fig. 3 (c). The positions and relative intensities of all diffraction peaks matched well with 222
those from the JCPDS card (No.52-0102) for magnetite. The sharp, strong peaks confirmed the 223
products were well crystallized. 224
225
Fig. 3. TEM image (a), SAED image (b), and XRD (c) of the amino-functionalized magnetic nanoparticles. 226
227
3.2 Characterization of the antigen modified MNPs and antibody functionalized UCNPs 228
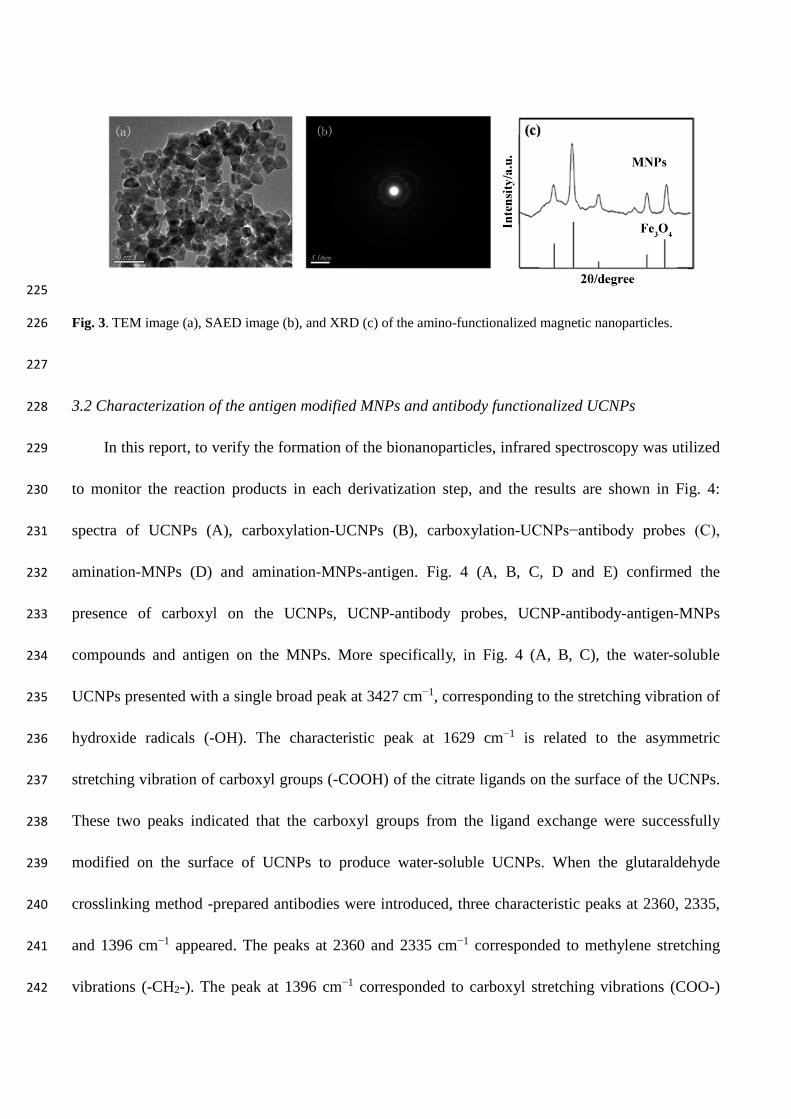
In this report, to verify the formation of the bionanoparticles, infrared spectroscopy was utilized 229
to monitor the reaction products in each derivatization step, and the results are shown in Fig. 4: 230
spectra of UCNPs (A), carboxylation-UCNPs (B), carboxylation-UCNPs−antibody probes (C), 231
amination-MNPs (D) and amination-MNPs-antigen. Fig. 4 (A, B, C, D and E) confirmed the 232
presence of carboxyl on the UCNPs, UCNP-antibody probes, UCNP-antibody-antigen-MNPs 233
compounds and antigen on the MNPs. More specifically, in Fig. 4 (A, B, C), the water-soluble 234
UCNPs presented with a single broad peak at 3427 cm−1, corresponding to the stretching vibration of 235
hydroxide radicals (-OH). The characteristic peak at 1629 cm−1 is related to the asymmetric 236
stretching vibration of carboxyl groups (-COOH) of the citrate ligands on the surface of the UCNPs. 237
These two peaks indicated that the carboxyl groups from the ligand exchange were successfully 238
modified on the surface of UCNPs to produce water-soluble UCNPs. When the glutaraldehyde 239
crosslinking method -prepared antibodies were introduced, three characteristic peaks at 2360, 2335, 240
and 1396 cm−1 appeared. The peaks at 2360 and 2335 cm−1 corresponded to methylene stretching 241
vibrations (-CH2-). The peak at 1396 cm−1 corresponded to carboxyl stretching vibrations (COO-) 242
due to the linking reaction between the water-soluble UCNPs and the antibodies. Furthermore, a new 243
peak was observed at 1540 cm−1 upon comparison of the spectra of the 244
UCNP-antibody-antigen-MNPs complex and the UCNP−antibody probe; this peak is attributed to 245
the distinct amide I and amide II vibration modes characteristic of antigen proteins. On the other 246
hand, in Fig. 4 (D, E), a new peak was observed at 1400 cm−1 upon comparison of the spectra of the 247
amino-MNPs complex and the MNPs-antigen probes; this peak is attributed to the distinct amide I 248
and amide II vibration modes characteristic of antigen proteins. In the FT-IR spectra of 249
antigen-functionalized-Fe3O4 MNPs and antibody-functionalized-UCNPs, all the characterized peaks 250
of Fe3O4 MNPs and UCNPs appeared in the corresponding wavenumbers, indicating the 251
modification of antigen and antibody onto the surface of MNPs and UCNPs. On the basis of these 252
characterizations, the proposed UCNP-based method is suitable for sensing toxin. 253
254
Fig.4. FT-IR spectrums of oleic acid-capped UCNPs (A), carboxylation-UCNPs (B), 255
carboxylation-UCNPs−antibody probes (C), amination-MNPs (D) and amination-MNPs-antigen (E). 256
3.3 Specific Capturing Evaluation 257
In order to evaluate the specificity of the immunoassay procedure using this developed 258
fluorescent probe for AFB1, other two commonly occurring toxins, Aflatoxin G1 (AFG1) and 259
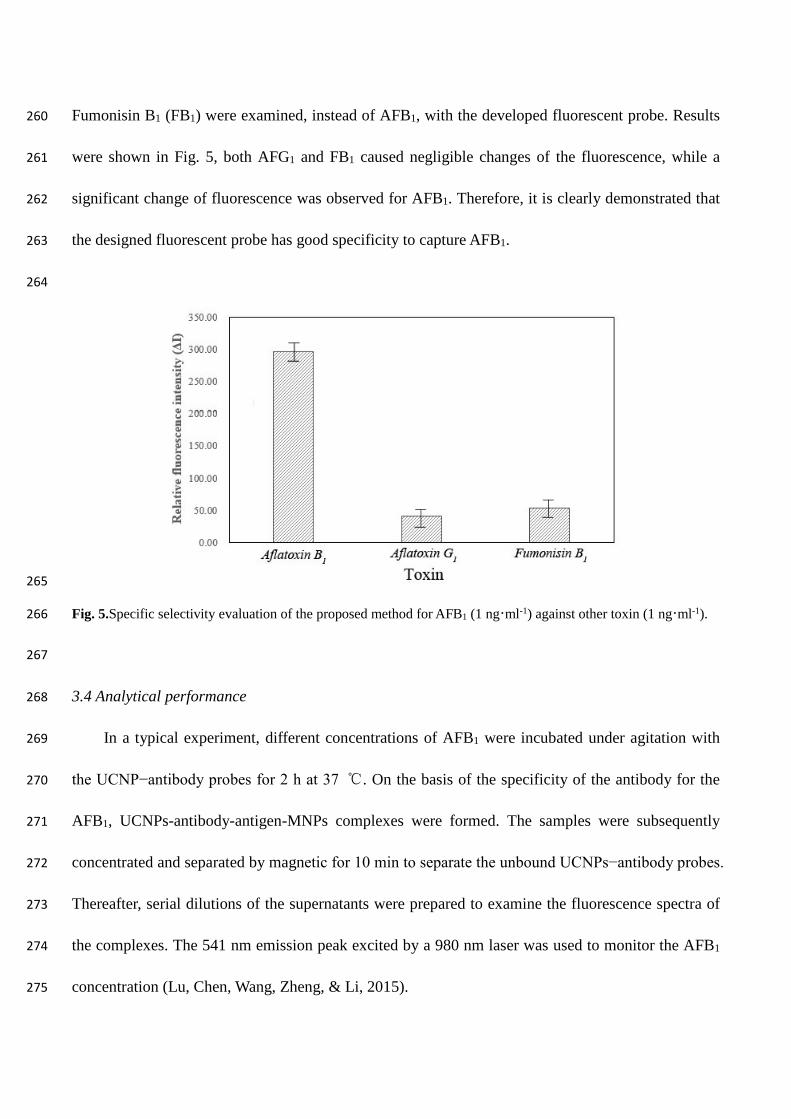
Fumonisin B1 (FB1) were examined, instead of AFB1, with the developed fluorescent probe. Results 260
were shown in Fig. 5, both AFG1 and FB1 caused negligible changes of the fluorescence, while a 261
significant change of fluorescence was observed for AFB1. Therefore, it is clearly demonstrated that 262
the designed fluorescent probe has good specificity to capture AFB1. 263
264
265
Fig. 5.Specific selectivity evaluation of the proposed method for AFB1 (1 ng·ml-1) against other toxin (1 ng·ml-1). 266
267
3.4 Analytical performance 268
In a typical experiment, different concentrations of AFB1 were incubated under agitation with 269
the UCNP−antibody probes for 2 h at 37 ℃. On the basis of the specificity of the antibody for the 270
AFB1, UCNPs-antibody-antigen-MNPs complexes were formed. The samples were subsequently 271
concentrated and separated by magnetic for 10 min to separate the unbound UCNPs−antibody probes. 272
Thereafter, serial dilutions of the supernatants were prepared to examine the fluorescence spectra of 273
the complexes. The 541 nm emission peak excited by a 980 nm laser was used to monitor the AFB1 274
concentration (Lu, Chen, Wang, Zheng, & Li, 2015). 275
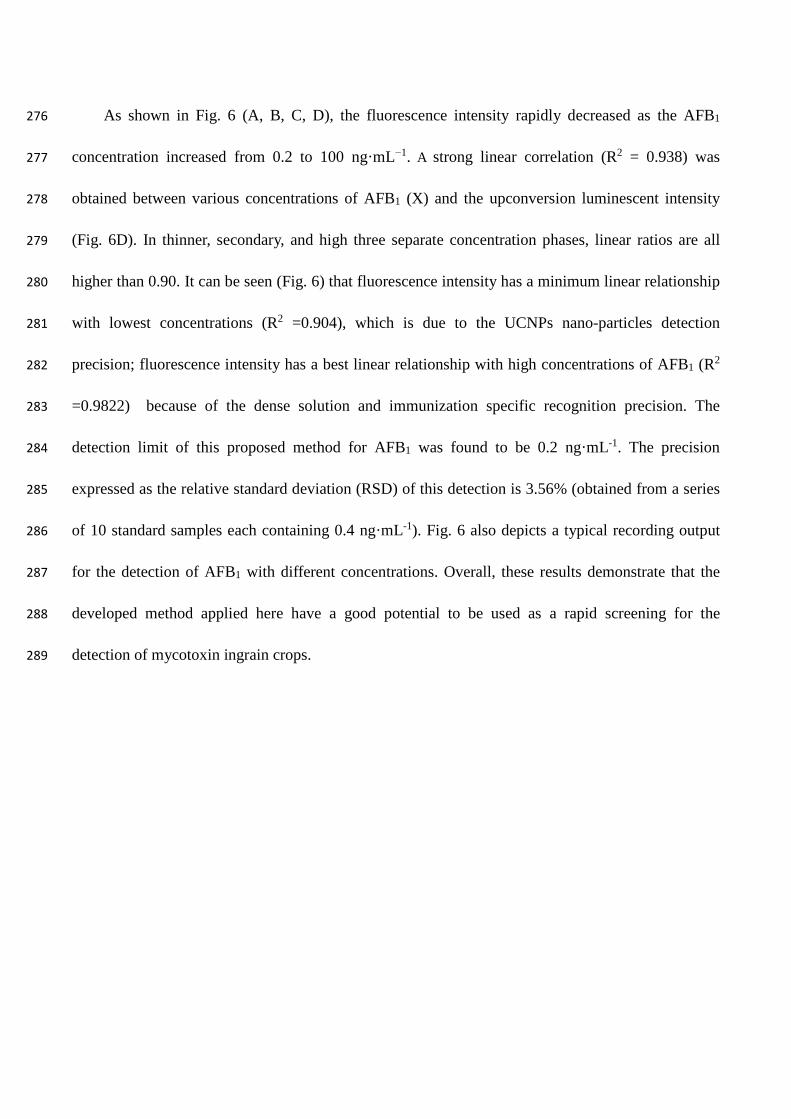
As shown in Fig. 6 (A, B, C, D), the fluorescence intensity rapidly decreased as the AFB1 276
concentration increased from 0.2 to 100 ng·mL−1. A strong linear correlation (R2 = 0.938) was 277
obtained between various concentrations of AFB1 (X) and the upconversion luminescent intensity 278
(Fig. 6D). In thinner, secondary, and high three separate concentration phases, linear ratios are all 279
higher than 0.90. It can be seen (Fig. 6) that fluorescence intensity has a minimum linear relationship 280
with lowest concentrations (R2 =0.904), which is due to the UCNPs nano-particles detection 281
precision; fluorescence intensity has a best linear relationship with high concentrations of AFB1 (R2 282
=0.9822) because of the dense solution and immunization specific recognition precision. The 283
detection limit of this proposed method for AFB1 was found to be 0.2 ng·mL-1. The precision 284
expressed as the relative standard deviation (RSD) of this detection is 3.56% (obtained from a series 285
of 10 standard samples each containing 0.4 ng·mL-1). Fig. 6 also depicts a typical recording output 286
for the detection of AFB1 with different concentrations. Overall, these results demonstrate that the 287
developed method applied here have a good potential to be used as a rapid screening for the 288
detection of mycotoxin ingrain crops. 289
290
Fig. 6. Linear relation between upconversion luminescent intensity and the various concentrations of AFB1. 291
292
Statistical analysis revealed that the detection limit of AFB1 are equal to 0.2 ng·mL−1, as 293
estimated by using 3σ. These values are desirable for detection AFB1 in various kinds of foods 294
relative to the maximum acceptable standards of these mycotoxins in China and other countries. The 295
RSD of AFB1 detection was equal to 3.56% indicating that the developed method exhibited good 296
reproducibility. In the absence of AFB1-BSA-MNPs, the fluorescence intensity of NaYF4: Yb, Er 297
was at a maximum, and in the presence of AFB1-BSA-MNPs, the antigen binds with 298
antibody-AFB1-UCNPs and causes the fluorescent signal of the unreleased UCNPs gradually 299
decreased. It can be understood as that the more MNPs-antigen- antibody-UCNPs was formed, the 300
fewer antibody-UCNPs were remained, and the fluorescence intensity is weaker. 301
To check feasibility of this method, the accuracy of the measurements of AFB1 in peanut oil was 302
also evaluated by determining the recovery of AFB1.by adding a known quantity of standard solution 303
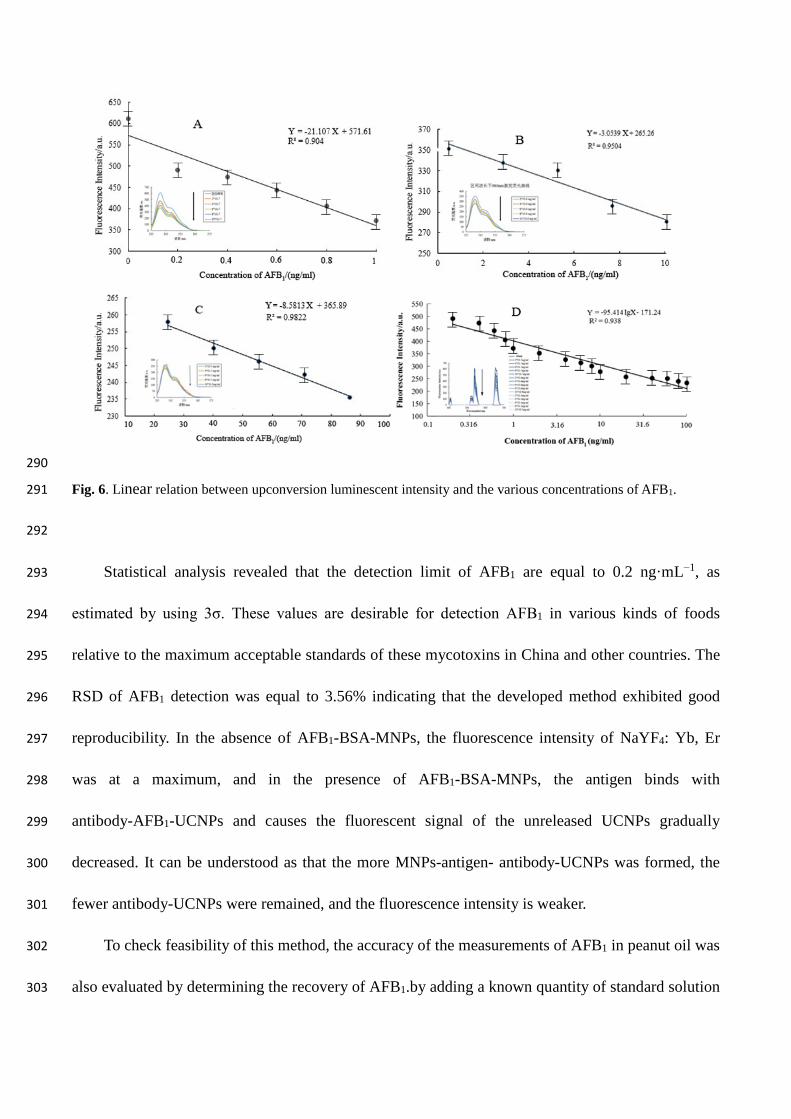
to the test solution. As shown in Table 1, the recoveries of AFB1 were between 90.1% and 113.4%, 304
indicating a high level of accuracy of the developed immunoassay. These analyses demonstrated that 305
the proposed method could be applied to the analysis of AFB1 in real agricultural commodities. 306
307
Table 1: Recovery results for AFB1 detection 308
Samples Background
concentration(ng·ml-1) Added concentration
(ng·ml-1) Detected concentration
(ng·ml-1)(mean±SD) Recovery radio%
AFB1 0.052 0.1 0.150±0.032 98
AFB1 0.052 1 0.98±0.120 92.8
AFB1 0.734 0.5 1.301±0.233 113.4
AFB1 0.734 1 1.720±0.121 98.6
AFB1 3.364 1 4.265±0.236 90.1
AFB1 3.364 5 8.465±0.103 102.02
309
4. Conclusions 310
In this study, rare earth doped upconversion nanoparticles have been successfully assembled for 311
sensing Aflatoxins B1 in actual food samples (peanut oil). Herein, antigen-modified magnetic 312
nanoparticles were used for immunosensing probes, and antibody functionalized NaYF4 313
upconversion nanoparticles as color signal probes. Due to strong fluorescence signal, low 314
autofluorescence of the UCNPs, rapid separation and purification of the magnetic nanoparticles and 315
the immunocomplex, this method can reduce significantly the overall assay time. Based on these 316
results, the ease of use and reliability, the developed method could be extended for the rapid 317
detection of other toxins in the edible oils and other agricultural products. suggest that it maybe be 318
extended to other agriculture products 319
320
321

Acknowledgments 322
This work has been financially supported by the National Natural Science Foundation of China 323
(31471646) and a Project Funded by the Priority Academic Program Development of Jiangsu Higher 324
Education Institutions (PAPD). 325
326
Conflict of interest 327
The authors declare no conflicts of interest. The authors alone are responsible for the content of 328
this manuscript. 329
330
References 331
Ahn, K.S., Lim, K. R., Jeong, D., Lee, B. Y., Kim, K. S., & Lee, W.Y. (2016). Fluorescence energy transfer inhibition 332 bioassay for cholera toxin based on galactose-stabilized gold nanoparticles and amine-terminated quantum dots. 333 Microchemical Journal, 124, 9-14. 334
Aramburu, I., Galban, J., Ostra, M., Ubide, C., Vidal, M., & Zuriarrain, J. (2015). Uncertainty in CCD detectors with and 335 without cooling devices when used for molecular fluorescence measurements. Analytical Methods, 7(6), 336 2379-2385. 337
Boyer, J.C., Manseau, M.P., Murray, J. I., & van Veggel, F. C. J. M. (2010). Surface Modification of Upconverting 338 NaYF4 Nanoparticles with PEG-Phosphate Ligands for NIR (800 nm) Biolabeling within the Biological 339 Window. Langmuir, 26(2), 1157-1164. 340
Busman, M., Liu, J., Zhong, H., Bobell, J. R., & Maragos, C. M. (2014). Determination of the aflatoxin AFB1 from corn 341 by direct analysis in real time-mass spectrometry (DART-MS). Food Additives & Contaminants: Part A, 31(5), 342 932-939. 343
Ceker, S., Agar, G., Alpsoy, L., Nardemir, G., & Kizil, H. E. (2014). Antagonistic effects of Satureja hortensis essential 344 oil against AFB, on human lymphocytes in vitro. Cytology and Genetics, 48(5), 327-332. 345
Chatterjee, D. K., Gnanasammandhan, M. K., & Zhang, Y. (2010). Small Upconverting Fluorescent Nanoparticles for 346 Biomedical Applications. Small, 6(24), 2781-2795. 347
Chatterjee, D. K., Rufaihah, A. J., & Zhang, Y. (2008). Upconversion fluorescence imaging of cells and small animals 348 using lanthanide doped nanocrystals. Biomaterials, 29(7), 937-943. 349
Chen, H.Q., Yuan, F., & Wang, L. (2013). Simple and sensitive turn-on luminescent detection of biothiols based on 350 energy transfer between green-emitting upconversion nanocrystals and gold nanoparticles. Analytical Methods, 351 5(11), 2873-2879. 352
Chen, K., Fang, J., Peng, X., Cui, H., Chen, J., Wang, F.,Zhou, Y. (2014). Effect of selenium supplementation on 353 aflatoxin B1-induced histopathological lesions and apoptosis in bursa of Fabricius in broilers. Food and 354 Chemical Toxicology, 74, 91-97. 355
Fang, S., Wang, C., Xiang, J., Cheng, L., Song, X., Xu, L.,Liu, Z. (2014). Aptamer-conjugated upconversion nanoprobes 356 assisted by magnetic separation for effective isolation and sensitive detection of circulating tumor cells. Nano 357 Research, 7(9), 1327-1336. 358
Gao, J., Gu, H., & Xu, B. (2009). Multifunctional Magnetic Nanoparticles: Design, Synthesis, and Biomedical 359 Applications. Accounts of Chemical Research, 42(8), 1097-1107. 360
Herzallah, S. M. (2009). Determination of aflatoxins in eggs, milk, meat and meat products using HPLC fluorescent and 361 UV detectors. Food Chemistry, 114(3), 1141-1146. 362
Huang, L.J., Yu, R.Q., & Chu, X. (2015). DNA-functionalized upconversion nanoparticles as biosensors for rapid, 363 sensitive, and selective detection of Hg2+ in complex matrices. Analyst, 140(15), 4987-4990. 364
Karimi, M., Habibi-Rezaei, M., Safari, M., Moosavi-Movahedi, A. A., Sayyah, M., Sadeghi, R., & Kokini, J. (2014). 365 Immobilization of endo-inulinase on poly-d-lysine coated CaCO3 micro-particles. Food Research International, 366 66, 485-492. 367
Klu, Y. A. K., & Chen, J. (2015). Effect of peanut butter matrices on the fate of probiotics during simulated 368 gastrointestinal passage. LWT - Food Science and Technology, 62(2), 983-988. 369
Kozlov, I. A., Melnyk, P. C., Stromsborg, K. E., Chee, M. S., Barker, D. L., & Zhao, C. (2004). Efficient strategies for the 370 conjugation of oligonucleotides to antibodies enabling highly sensitive protein detection. Biopolymers, 73(5), 371 621-630. 372
Lu, Z., Chen, X., Wang, Y., Zheng, X., & Li, C. (2015). Aptamer based fluorescence recovery assay for aflatoxin B1 373
using a quencher system composed of quantum dots and graphene oxide. Microchimica Acta, 182(3-4), 374 571-578. 375
Luongo, D., Russo, R., Balestrieri, A., Marzocco, S., Bergamo, P., & Severino, L. (2013). In vitro study of AFB1 and 376 AFM1 effects on human lymphoblastoid Jurkat T-cell model. Journal of immunotoxicology, 11(4), 353-358. 377
Ma, Y., Liu, H., Han, Z., Yang, L., & Liu, J. (2015). Highly-reproducible Raman scattering of NaYF4:Yb,Er@SiO2@Ag 378 for methylamphetamine detection under near-infrared laser excitation. Analyst, 140(15), 5268-5275. 379
Maragos, C. (2009). Fluorescence polarization immunoassay of mycotoxins: a review. Toxins, 1(2), 196-207. 380 Mnoyan, A. N., Kirakosyan, A. G., Kim, H., Jang, H. S., & Jeon, D. Y. (2015). Electrostatic Stabilized InP Colloidal 381
Quantum Dots with High Photoluminescence Efficiency. Langmuir, 31(25), 7117-7121. 382 Ong, L. C., Ang, L. Y., Alonso, S., & Zhang, Y. (2014). Bacterial imaging with photostable upconversion fluorescent 383
nanoparticles. Biomaterials, 35(9), 2987-2998. 384 Passone, M. A., Girardi, N. S., & Etcheverry, M. (2013). Antifungal and antiaflatoxigenic activity by vapor contact of 385
three essential oils, and effects of environmental factors on their efficacy. LWT - Food Science and Technology, 386 53(2), 434-444. 387
Quiles, J. M., Manyes, L., Luciano, F., Mañes, J., & Meca, G. (2015). Influence of the antimicrobial compound allyl 388 isothiocyanate against the Aspergillus parasiticus growth and its aflatoxins production in pizza crust. Food and 389 Chemical Toxicology, 83, 222-228. 390
Sai, N., Chen, Y., Liu, N., Yu, G., Su, P., Feng, Y., Gao, Z. (2010). A sensitive immunoassay based on direct hapten 391 coated format and biotin–streptavidin system for the detection of chloramphenicol. Talanta, 82(4), 1113-1121. 392
Sanders Iii, C. T., DeMasie, C. L., Kerr, W. L., Hargrove, J. L., Pegg, R. B., & Swanson, R. B. (2014). Peanut 393 skins-fortified peanut butters: Effects on consumer acceptability and quality characteristics. LWT - Food Science 394 and Technology, 59(1), 222-228. 395
Sharma, A., Rawat, K., Solanki, P. R., & Bohidar, H. B. (2015). Electrochemical response of agar ionogels towards 396 glucose detection. Analytical Methods, 7(14), 5876-5885. 397
Sozer, N., & Kokini, J. L. (2014). Use of quantum nanodot crystals as imaging probes for cereal proteins. Food Research 398 International, 57, 142-151. 399
Tian, J., Bai, J., Peng, Y., Qie, Z., Zhao, Y., Ning, B.,Gao, Z. (2015). A core-shell-structured molecularly imprinted 400 polymer on upconverting nanoparticles for selective and sensitive fluorescence sensing of sulfamethazine. 401 Analyst, 140(15), 5301-5307. 402
Van de Perre, E., Jacxsens, L., Lachat, C., El Tahan, F., & De Meulenaer, B. (2015). Impact of maximum levels in 403 European legislation on exposure of mycotoxins in dried products: Case of aflatoxin B1 and ochratoxin A in 404 nuts and dried fruits. Food and Chemical Toxicology, 75, 112-117. 405
Waliyar, F., Reddy, S., & Lava-Kumar, P. (2009). Review of immunological methods for the quantification of aflatoxins 406 in peanut and other foods. Journal Information, 36(1), 54-59. 407
Wang, F., Deng, R., Wang, J., Wang, Q., Han, Y., Zhu, H., Liu, X. (2011). Tuning upconversion through energy migration 408 in core–shell nanoparticles. Nat Mater, 10(12), 968-973. 409
Wang, F., Han, Y., Lim, C. S., Lu, Y. H., Wang, J., Xu, J., Liu, X. G. (2010). Simultaneous phase and size control of 410 upconversion nanocrystals through lanthanide doping. Nature, 463(7284), 1061-1065. 411
Wang, L., Li, P., & Li, Y. (2007). Down- and Up-Conversion Luminescent Nanorods. Advanced Materials, 19(20), 412 3304-3307. 413
Wang, L., & Li, Y. (2006). Na(Y1.5Na0.5)F6 Single-Crystal Nanorods as Multicolor Luminescent Materials. Nano Letters, 414 6(8), 1645-1649. 415
Wang, Z., Yue, T., Yuan, Y., Cai, R., Niu, C., & Guo, C. (2013). Preparation of immunomagnetic nanoparticles for the 416 separation and enrichment of Alicyclobacillus spp. in apple juice. Food Research International, 54(1), 302-310. 417
Xia, Q., Huang, X.Y., Xue, F., Zhang, J.J., Zhai, B., Kong, D.C., Long, X.D. (2013). Genetic polymorphisms of DNA 418 repair genes and DNA repair capacity related to aflatoxin b1 (AFB1)-induced DNA damages. New Research 419 Directions in DNA Repair, 1, 377-412. 420
Xu, X., Liu, X., Li, Y., & Ying, Y. (2013). A simple and rapid optical biosensor for detection of aflatoxin B1 based on 421 competitive dispersion of gold nanorods. Biosensors and Bioelectronics, 47(0), 361-367. 422
Yang, B.c., Wang, F., Deng, W., Zou, Y., Liu, F.y., Wan, X.d., Huang, O.p. (2015). Wooden-tip electrospray ionization 423 mass spectrometry for trace analysis of toxic and hazardous compounds in food samples. Analytical Methods, 424 7(14), 5886-5890. 425
Zhang, Y., Wu, L., Tang, Y., Su, Y., & Lv, Y. (2014). An upconversion fluorescence based turn-on probe for detecting 426 lead(ii) ions.. Analytical Methods, 6(22), 9073-9077. 427
Zhou, J., Liu, Z., & Li, F. (2012). Upconversion nanophosphors for small-animal imaging. Chemical Society Reviews, 428 41(3), 1323-1349. 429
430 431