Peanut contamination by Aspergillus flavus and aflatoxin...
9
Journal of Food, Agriculture & Environment, Vol.8 (2), April 2010 195 www.world-food.net Journal of Food, Agriculture & Environment Vol.8 (2): 195-203. 2010 WFL Publisher Science and Technology Meri-Rastilantie 3 B, FI-00980 Helsinki, Finland e-mail: [email protected] Received 26 January 2010, accepted 2 April 2010. Peanut contamination by Aspergillus flavus and aflatoxin B1 in granaries of villages and markets of Mali, West Africa Cecilia M. Tojo Soler 1 *, Gerrit Hoogenboom 1 , Rabiu Olatinwo 1 , Bamory Diarra 2 , Farid Waliyar 3 and Sibiry Traore 4 1 Department of Biological and Agricultural Engineering, The University of Georgia, 1109 Experiment Street, Griffin, Georgia. 30223, USA. 2 Institut d’Economie Rurale (IER), Bamako, Mali. 3 International Crops Research Institute for the Semi-Arid Tropics (ICRISAT), Niamey, Niger. 4 International Crops Research Institute for the Semi-Arid Tropics (ICRISAT), Bamako, Mali. *e-mail: [email protected] Abstract Peanut (Arachis hypogoea) is an important crop in Mali, West Africa. However, one of the main problems related to peanut production and commercialization is the detection of high levels of aflatoxin B1 in peanut-derived products for consumption. The objectives of this study were 1) to determine the rate of progress of Aspergillus flavus and aflatoxin B1 in granaries located in 26 villages and also in the granaries located in the corresponding 26 markets in Mali and 2) to correlate the progress of the A. flavus and aflatoxin B1 with environmental variables outside the peanut granaries. The results showed that peanuts stored and consumed in rural areas are highly contaminated by A. flavus and aflatoxin B1, with average rates of aflatoxin B1 significantly above the accepted international standards especially between the months of June and December. There was a moderate relationship (r 2 = 0.58) between the aflatoxin B1 levels for two granary types, located at the villages and the corresponding granaries in the markets. The analysis of the aflatoxin B1 levels in the villages and its relation with the weather conditions outside the granaries revealed that for one village (Tiele), high relative air humidity was a contributing factor in the development of A. flavus and levels of the aflatoxin B1 in the granary. The results indicated that maximum aflatoxin B1 production occurs in presence of warm temperatures and relative humidity above 80%. Key words: Groundnut, post-harvest, environmental variables, climate, weather, temperature, relative humidity, food security, health. Introduction Peanut is an important crop in West Africa, with an area planted in the region greater than 5 million ha during the period 2005 to 2007 1 . Peanut is used and processed in diverse forms as grain, butter, oil, flour, dried leaves or stems. Therefore, it is a very important food source for more than 95% of households as well as a source for animal feed. The peanut crop also constitutes an essential source of revenue for the rural population and for the entire country of Mali. Peanut yields are usually low in Mali, compared to other production regions, with a national average, based on data reported from 2000 to 2005, of approximately 780 kg ha -1 1 . Aflatoxin contamination of peanut is a serious quality problem in West Africa 2 . The main constraint in peanut production in Mali is the presence of an increased contamination of aflatoxin B1 in the peanut grain during traditional storage prior to marketing. Aflatoxins are toxic, carcinogenic, teratogenic and immunosuppressive substances produced when toxigenic strains of the fungi A. flavus Link. Ex Fries and Aspergillus parasiticus Speare grow on peanuts as well as many other agricultural commodities 3-6 . Infection of peanut by Aspergillus occurs under both pre- and post-harvest conditions. Thus, the contamination process is frequently broken down into two phases with the first phase occurring on the developing crop, i.e. pre-harvest, and the second phase affecting the crop after maturation during harvest and storage, i.e. post- harvest. Rain and temperature influence the phases differently with dry and hot conditions favoring the first phase, while warm and wet conditions favoring the second phase. Contamination varies with climate both temporally and spatially 7 . Mali has favorable climatic conditions for Aspergillus development; the country lies within the intertropical zone and has a hot, dry climate, with a conspicuous rainy season. Pre-harvest infection by Aspergillus and consequent aflatoxin B1 concentration are more important in the semi-arid tropics, especially when drought occurs during the last 20-40 days of the season 8 . Other authors found that pre-harvest contamination requires a drought period of 30-50 days and a mean soil temperature in the podding zone of 29-31°C 9, 10 . Similar results were also reported for peanut grown in Niger 11 . Climate and local weather have a strong impact on contamination 12 , in part, by direct effects on the causative fungi 7 . Climate and local weather affect the rate of development of aflatoxin-producing fungi and alters the fungal community’s structure. These factors also change the predisposition of hosts to contamination by altering crop development and insects’ infestations that create wounds on which aflatoxin-producers fungi proliferate. Aflatoxin contamination is prevalent both in warm humid climates and in irrigated hot deserts. In temperate regions, contamination may be severe during drought 7 .
Transcript of Peanut contamination by Aspergillus flavus and aflatoxin...

Journal of Food, Agriculture & Environment, Vol.8 (2), April 2010 195
www.world-food.net Journal of Food, Agriculture & Environment Vol.8 (2): 195-203. 2010
WFL PublisherScience and Technology
Meri-Rastilantie 3 B, FI-00980Helsinki, Finlande-mail: [email protected]
Received 26 January 2010, accepted 2 April 2010.
Peanut contamination by Aspergillus flavus and aflatoxin B1 in granaries of villagesand markets of Mali, West Africa
Cecilia M. Tojo Soler 1*, Gerrit Hoogenboom 1, Rabiu Olatinwo 1, Bamory Diarra 2, Farid Waliyar 3 andSibiry Traore 4
1 Department of Biological and Agricultural Engineering, The University of Georgia, 1109 Experiment Street, Griffin, Georgia.30223, USA. 2 Institut d’Economie Rurale (IER), Bamako, Mali. 3 International Crops Research Institute for the Semi-Arid Tropics
(ICRISAT), Niamey, Niger. 4 International Crops Research Institute for the Semi-Arid Tropics (ICRISAT), Bamako, Mali.*e-mail: [email protected]
AbstractPeanut (Arachis hypogoea) is an important crop in Mali, West Africa. However, one of the main problems related to peanut production andcommercialization is the detection of high levels of aflatoxin B1 in peanut-derived products for consumption. The objectives of this study were 1) todetermine the rate of progress of Aspergillus flavus and aflatoxin B1 in granaries located in 26 villages and also in the granaries located in thecorresponding 26 markets in Mali and 2) to correlate the progress of the A. flavus and aflatoxin B1 with environmental variables outside the peanutgranaries. The results showed that peanuts stored and consumed in rural areas are highly contaminated by A. flavus and aflatoxin B1, with averagerates of aflatoxin B1 significantly above the accepted international standards especially between the months of June and December. There was amoderate relationship (r2 = 0.58) between the aflatoxin B1 levels for two granary types, located at the villages and the corresponding granaries in themarkets. The analysis of the aflatoxin B1 levels in the villages and its relation with the weather conditions outside the granaries revealed that for onevillage (Tiele), high relative air humidity was a contributing factor in the development of A. flavus and levels of the aflatoxin B1 in the granary. Theresults indicated that maximum aflatoxin B1 production occurs in presence of warm temperatures and relative humidity above 80%.
Key words: Groundnut, post-harvest, environmental variables, climate, weather, temperature, relative humidity, food security, health.
IntroductionPeanut is an important crop in West Africa, with an area planted inthe region greater than 5 million ha during the period 2005 to2007 1. Peanut is used and processed in diverse forms as grain,butter, oil, flour, dried leaves or stems. Therefore, it is a veryimportant food source for more than 95% of households as wellas a source for animal feed. The peanut crop also constitutes anessential source of revenue for the rural population and for theentire country of Mali. Peanut yields are usually low in Mali,compared to other production regions, with a national average,based on data reported from 2000 to 2005, of approximately 780 kgha-1 1. Aflatoxin contamination of peanut is a serious quality problemin West Africa 2. The main constraint in peanut production in Maliis the presence of an increased contamination of aflatoxin B1 in thepeanut grain during traditional storage prior to marketing. Aflatoxinsare toxic, carcinogenic, teratogenic and immunosuppressivesubstances produced when toxigenic strains of the fungi A. flavusLink. Ex Fries and Aspergillus parasiticus Speare grow on peanutsas well as many other agricultural commodities 3-6. Infection ofpeanut by Aspergillus occurs under both pre- and post-harvestconditions. Thus, the contamination process is frequently brokendown into two phases with the first phase occurring on thedeveloping crop, i.e. pre-harvest, and the second phase affecting
the crop after maturation during harvest and storage, i.e. post-harvest. Rain and temperature influence the phases differentlywith dry and hot conditions favoring the first phase, while warmand wet conditions favoring the second phase. Contaminationvaries with climate both temporally and spatially 7. Mali hasfavorable climatic conditions for Aspergillus development; thecountry lies within the intertropical zone and has a hot, dry climate,with a conspicuous rainy season. Pre-harvest infection by Aspergillus and consequent aflatoxinB1 concentration are more important in the semi-arid tropics,especially when drought occurs during the last 20-40 days of theseason 8. Other authors found that pre-harvest contaminationrequires a drought period of 30-50 days and a mean soil temperaturein the podding zone of 29-31°C 9, 10. Similar results were also reportedfor peanut grown in Niger 11. Climate and local weather have astrong impact on contamination 12, in part, by direct effects on thecausative fungi 7. Climate and local weather affect the rate ofdevelopment of aflatoxin-producing fungi and alters the fungalcommunity’s structure. These factors also change the predispositionof hosts to contamination by altering crop development and insects’infestations that create wounds on which aflatoxin-producers fungiproliferate. Aflatoxin contamination is prevalent both in warm humidclimates and in irrigated hot deserts. In temperate regions,contamination may be severe during drought 7.

196 Journal of Food, Agriculture & Environment, Vol.8 (2), April 2010
For peanuts that are stored in enclosed facilities such as granaries,the local weather conditions as well as the environmentalconditions in the storage facilities, especially temperature andrelative humidity, are important for the growth of A. flavusand consequently present a potential risk for aflatoxinproduction 13. The thermal conditions for A. flavus growth rangefrom 10-12°C to 42-43°C, with an optimum in the 32 to 33°Crange 14. Fungal growth in storage facilities is favored by relativehumidity above 83-85% 15. Since these suitable conditions forgrowth and toxin production occur in many areas of Africa, theaflatoxin B1 contamination is usually a problem across thecontinent 16. However, aflatoxin contamination of peanuts, which occurs bothbefore and after harvest, can be effectively managed in order toproduce shelled peanuts that meet strict regulatory guidelines,ensuring a safe food supply. This management primarily involvestechniques that remove highly contaminated kernels from themajority that are not contaminated. However, these removal stepsare costly, in terms of both processing and unavoidable loss ofnon-contaminated kernels. It is, therefore, highly preferable totake steps to prevent contamination if at all possible. Such stepsinclude control of kernel moisture both before and after harvest.Prevention of pre-harvest aflatoxin contamination can also beachieved by harvesting peanuts before contamination occurs,where possible. However, this early harvesting can result inreduced yield and thus a reduced income for the farmer. Biologicalcontrol technology has recently been commercialized whichprevents much of the contamination that would otherwiseoccur 17, 18. Best practices to achieve the lowest possible levels ofcontamination are to combine all possible management andprevention strategies to ensure and maintain a safe supply ofpeanuts 17. Several technologies that can reduce risks of aflatoxincontamination have already been developed and tested in Mali 19.These technologies include genetic resistance and integrated cropmanagement practices, agronomic practices, biological control andbiotechnological interventions. A number of agronomic practicesthat minimize risk of pre-harvest infection by A. flavus were testedin two major groundnut growing regions (Kolokani and Kayes) inMali. The application of lime and farmyard manure significantlyreduced aflatoxin contamination, especially in a susceptiblecultivar. Lime application alone reduced aflatoxin by 79% and theapplication of farmyard manure reduced the aflatoxin content by74%. Several harvesting and drying techniques, such as avoidingdamage to pods, harvesting at right maturity, and proper dryingof pods were also studied in Mali. The aflatoxin reduction underthese practices varied from 69 to 88% at Kolokani, and 63 to 84%at Kayes 19. Since there is an association between consumption of highlyaflatoxin contaminated stocks of peanuts and impact on humanhealth, mainly related to the prevailing types of cancers and otherdiseases 6, 20, it is extremely important to investigate the effects ofenvironmental variables that affect the A. flavus growingconditions in the granaries. The objectives of this study werefirst, to determine the progression of A. flavus and aflatoxin B1levels in granaries located in villages and markets of Mali, andsecond, to determine the correlation between the progression ofA. flavus and aflatoxin B1 with environmental variables outsidethe peanut granaries.
Materials and MethodsDuring the period 1999/2000, 2000/2001 and 2001/2002 peanutsamples were taken every three months from 26 granaries at villagesand 26 granaries at the local markets of Mali, West Africa. Smallweather station data loggers Hobos (Onset Computer Corporation)were installed in two granaries to monitor the temperature and airmoisture. In February, April, June, August, October and December,peanut samples of one kg were collected from the previouslymixed stock and then submitted to a laboratory for determinationof A. flavus levels. For this purpose 20 peanut pods werevigorously shaken in a flask with sterilized water 21; the resultingsolution was placed on Petri dishes that contained a substratumconsisting of boiled meat that was maintained for six days at roomtemperature (36°C). Three replicates were made from each sample.At the end of the six-day incubation procedure, the germinatingA. flavus colonies were visually identified and counted. The aflatoxin B1 was determined by the ELISA (enzyme linkedimmunosorbent assay) technique developed by ICRISAT 21. Forthis, peanut samples of 100 g were taken from village and marketstocks. An indirect determination of aflatoxin B1 was conductedby competitive binding. A statistical analysis was conducted to test the differences inthe level of weather variables for the locations with the highestand the lowest levels of aflatoxin B1. The Student’s paired t-testand Freese test 22 were performed to evaluate the daily temperatureand relative air humidity differences between the same months ofdifferent years. Lack of sufficient weather data was a limitation formost of the sites analyzed, therefore, the analysis focused on thesites with available weather information. In some cases data fromnearby weather stations were used. The original data for A. flavus and aflatoxin B1 had a highstandard deviation for different years and months studied.Therefore, a data transformation was conducted to illustrate therelation between the A. flavus and aflatoxin B1 contamination ofthe granaries located in the villages and at the markets. The naturallogarithms (ln) of the A. flavus and aflatoxin B1 levels werecalculated to normalize the data for further regression analysis.
Results and DiscussionClimatic conditions in South Mali: The analysis of the weatherrecords for 19 years in Bamako, Mali (latitude 12.63, longitude-7.98, elevation 200 m) revealed that the highest temperatures occurduring April and the lowest temperatures during July and August.In addition, there is a conspicuous rainy season that starts inMay and ends in October (Fig. 1). The analysis of the maximumrelative humidity for the month of June indicated that the peanutarea also had high relative humidity. In 1999, only three sites hada maximum relative humidity above 83.3% while in 2000 and 2001there were five and six sites in this category, respectively (Fig.2). During the three years that were studied, July and Augustconsistently had a high maximum relative humidity in the peanutgrowing region.
Aspergillus flavus and aflatoxin B1 in the granaries of thevillages: The analysis of the infestation in the 26 village granariesduring the three years of the experiment showed a low level of A.flavus (spores g-1) in February, and a consistent increase fromFebruary to August (Fig. 3). There was a plateau in thedevelopment of the fungus from August to December. However,

Journal of Food, Agriculture & Environment, Vol.8 (2), April 2010 197
the standard deviation was high during these months, indicatinga significant variation between the granaries of the differentvillages. The correlation coefficient (r) between the averagenumber of A. flavus of spores in the village granaries and theaflatoxin B1 amount was 0.85, 0.83, and 0.85 in 1999, 2000 and2001, respectively. This indicated that the infection with A. flavuswas related to the presence of aflatoxin B1 in the granaries for thethree years of the experiment. The year 2001 had the highest levelof A. flavus and the highest standard deviation. Similarly to A. flavus, the aflatoxin B1 levels were low in Februaryfor all granaries of the individual villages. However, there was aconsistent increase from April to December, reaching levels abovethe international standard as early as June and rising thereafter. Itis important to mention that the maximum allowable level in theUnited States is 20 ppb and the European Union has an allowablelevel of 4 ppb total aflatoxins and under 2 ppb aflatoxin B1 23. There was a considerable variation in the levels of aflatoxin B1from June to December (Fig. 3). The granaries with the highestaverage aflatoxin B1 were located in the villages of Diaka, Tiele,N’tonsoni and Konko, while the lowest values were found in thegranaries located at Lofigué, Lofiné, Loulouni and Bogi (Fig.4). The average aflatoxins B1 levels (expressed as ln), for the threeyears and the 26 villages are represented in a map (Fig. 5). Thehighest levels of aflatoxin B1 were found in 2001.
A. flavus and aflatoxin B1 at market granaries: The A. flavuslevels in granaries located at markets revealed differences between
years, with the highest level recorded in 2001 (Fig. 6). Thiscould be due to the favorable environmental conditions, but alsoto poor sanitation of the granaries and poor quality of the peanutsprior to storage. The average level of aflatoxin B1 detected fromJune to December in the market granaries was significantly higherthan the accepted international standard, and there was a highvariation between the granaries. This illustrated the severe problemwith aflatoxin B1 in the market granaries. The granaries with thehighest average levels of aflatoxin were found at the markets inFouya, N’tonsoni, Banlandou and Tiele, while those with the lowestaverage level were found at the markets in Soukoumba, Lofiguéand Diomatene (Fig. 7).
Relation between Aspergillus flavus and aflatoxin B1 levels inthe village and market granaries: The original data for A. flavusinfection levels and aflatoxin B1 had a high standard deviation forthe different years and months that were studied. The regressionanalysis showed a low coefficient of determination between A.flavus at the village and market granaries and between the aflatoxinB1 levels in the granaries at the villages and the correspondingmarkets. Data were transformed to natural logarithms (ln) to moreclearly illustrate the relation between the A. flavus and aflatoxinB1 at the two types of granaries. There was a moderate relationbetween the number of A. flavus found at the village granariesand the market granaries (r2 = 0.39) (Fig. 8a). The coefficient of determination (r2) was 0.58 between the aflatoxinB1 levels in granaries at the villages and the correspondinggranaries in the markets (Fig. 8b), showing that there was amoderate relationship between the aflatoxin B1 levels for the twogranary types. It was hypothesized that the weather conditionsoccurring during storage in the villages would be similar to theweather conditions during storage on the markets because bothtypes of facilities are located in the same micro-region. However,it seems that other factors different from the weather conditionsoutside the granaries also played a role in the development of A.flavus and consequently on the levels of aflatoxin B1. Poorsanitation in the granaries before peanut storage and differencesin ventilation between the granaries could also have an impact onthe development of the fungus inside the facilities. However, ourresults showed that the weather conditions outside the granariesenhanced the development of A. flavus, especially during the rainyseason. Further analysis was conducted to identify whichparticular weather conditions would favor the development ofthis fungus.
Analysis of weather variables for locations with contrastinglevels of aflatoxin B1: Tiele had one of the highest average levelsof aflatoxin B1 in the village granary in 2000 (1654 ppb) and relativelylow values in 1999 (47 ppb) and 2001 (114 ppb). As the weatherdata for Tiele were not available, the data for Bamako Senou wereused, located approximately 50 km from Tiele. A statistical analysiswas conducted to determine whether there were significantdifferences in weather data for the three years. The analysis of therate of aflatoxin B1 increase revealed that the greatest increase in2000 occurred between June and August. Thus, the statisticalanalysis of daily weather data focused on the period betweenJune and August for the three years. The average monthly minimum temperature for June was 24.6°C,22.7°C and 23.6°C in 1999, 2000 and 2001, respectively (Fig. 9a).
a)
Months
Jan Feb Mar Apr May Jun Jul Aug Sep Oct Nov Dec
Maximum temperature
Minimum temperature
b)
10
15
20
25
30
35
40
45
Ave
rage
tem
pera
ture
(°C
)
Maximum temperatureMinimum temperature
a)
Jan Feb Mar Apr May Jun Jul Aug Sep Oct Nov Dec
Month
Jan Feb Mar Apr May Jun Jul Aug Sep Oct Nov Dec
Month
0
50
100
150
200
250
300
Ave
rage
pre
cipi
atio
n (m
m)
Figure 1. Average maximum and minimum air temperature (a) and averageprecipitation (b) for Bamako, Mali, for 19 years of weather records from1981 to 1999.
b)

198 Journal of Food, Agriculture & Environment, Vol.8 (2), April 2010
Statistical differences were found for minimum temperaturebetween June 1999 and June 2000 and also between June 2000and June 2001 using Freese 22 and the t-test. The average maximumtemperature for June 1999, June 2000 and June 2001 was 35.9, 33.5and 34.0°C, respectively. Statistical differences were found formaximum temperature between June 1999 and June 2000 (Freese 22
and t-test). The average maximum temperature for August 1999,August 2000 and August 2001 was 28.3, 30.4 and 31.0°C,respectively (Fig. 9b). Significant differences were found formaximum temperature between August 1999 and August 2000 andbetween August 1999 and August 2001. The average minimum relative humidity was 34.3% for June 1999and 47% for June 2000 and 2001 (Fig. 10a). Statistical differenceswere found for minimum relative humidity between June 1999,June 2000 and June 2001. The average maximum relative humidity
for June 1999, June 2000, August 2000 and August 2001 was 79%,91%, 99% and 98%, respectively (Fig. 10b). Statistical differenceswere found for maximum relative humidity between June 1999 andJune 2000 and also between August 1999 and August 2000(Freese 22 and t-test). At Tiele, the favorable temperatures (33.5°C maximumtemperature, 22.6°C minimum temperature) and the high relativehumidity during June 2000 (91.1% maximum humidity) stimulatedthe development of the A. flavus and consequently increased theaflatoxin B1 levels in the granaries in the village. Therefore, itseems evident that weather conditions should be considered forproper granaries’ management. Actions should be taken wheneverfavorable conditions for A. flavus infection are forecasted or met,in order to avoid the increase in aflatoxin B1. As a practicalmanagement approach for the granaries, the humidity inside the
Mali
Mauritania
Algeria
Niger
Guinea
Burkina Faso
Nigeria
BeninGhanaCote d'Ivory
Western Sahara
Senegal
TogoSierra Leone
-10° 0°
10°
Mali
Mauritania
Algeria
Niger
Guinea
Burkina Faso
Nigeria
BeninGhana
Cote d'Ivory
Western Sahara
Senegal
TogoSierra Leone
-10° 0°
10°
10°
20°
Mali
Mauritania
Algeria
Niger
Guinea
Burkina Faso
Nigeria
BeninGhana
Cote d'Ivory
Western Sahara
Senegal
TogoSierra Leone
-10° 0°
10°
10°
20°
20°
Mali
Mauritania
Algeria
Niger
Guinea
Burkina Faso
Nigeria
BeninGhana
Cote d'Ivory
Western Sahara
Senegal
TogoSierra Leone
-10°
-10°
0°
0°
10
°
10
°
20
°
20
°
Mali
Mauritania
Algeria
Niger
Guinea
Burkina Faso
Nigeria
BeninGhanaCote d'Ivory
Western Sahara
Senegal
TogoSierra Leone
-10°
-10°
0°
0°
10
°
10
°
20
°
20
°
Mali
Mauritania
Algeria
Niger
Guinea
Burkina Faso
Nigeria
BeninGhanaCote d'Ivory
Western Sahara
Senegal
TogoSierra Leone
-10°
-10°
0°
0°
10
°
10
°
20
°
20
°
Mali
Mauritania
Algeria
Niger
Guinea
Burkina Faso
Nigeria
BeninGhana
Cote d'Ivory
Western Sahara
Senegal
TogoSierra Leone
-10° 0°
10
°
10
°
20
°
20
°
Mali
Mauritania
Algeria
Niger
Guinea
Burkina Faso
Nigeria
BeninGhana
Cote d'Ivory
Western Sahara
Senegal
TogoSierra Leone
-10° 0°
10
°
10
°
20
°
20
°
Mali
Mauritania
Algeria
Niger
Guinea
Burkina Faso
Nigeria
BeninGhana
Cote d'Ivory
Western Sahara
Senegal
TogoSierra Leone
-10° 0°
10
°
10
°
20
°
20
°
0.00 - 16.67
16.68 - 33.33
33.34 - 50.00
50.01 - 66.66
66.67 - 83.33
83.34 - 100.00
June 1999 June 2000 June 2001
July 1999 July 2000 July 2001
August 2001August 2000August 1999
Relative humidity (%)
Figure 2. Average monthly maximum relative air humidity for June, July and August for 1999, 2000 and 2001.
-10° 0°20
°
20°
10°
10°
-10° 0°
-10° 0°
20°
20°
10°
10°
-10° 0°
-10° 0°
20°
20°
10°
10°
-10° 0°
-10° 0°
20°
20°
10°
10°
-10° 0°
-10° 0°
20°
20°
10°
10°
-10° 0°
-10° 0°
20°
20°
10°
10°
-10° 0°
-10° 0°
20°
20°
10°
10°
-10° 0°
-10° 0°
20°
20°
10°
10°
-10° 0°
-10° 0°
20°
20°
10°
10°
-10° 0°

Journal of Food, Agriculture & Environment, Vol.8 (2), April 2010 199
1999
Months
Feb Apr Jun Aug Oct Dec0
0
0
0
0
0
0
1999
Months
Feb Apr Jun Aug Oct Dec
Afla
toxin
B1 (
ppb
)
0
100
200
300
400
2000
Months
Feb Apr Jun Aug Oct Dec0
0
0
0
0
0
0
2000
Months
Feb Apr Jun Aug Oct Dec
Afla
toxin
B1 (
ppb
)
0
100
200
300
400
2001
0
0
0
0
0
0
0
2001
Afla
toxin
B1 (
ppb
)
0
100
200
300
400
Feb Apr Jun Aug Oct DecMonth
20
40
60
80
100
120
0
1999A
sper
gillu
s fl
avus
(103
spor
es g
-1)
Feb Apr Jun Aug Oct Dec
Month
20
40
60
80
100
120
0
2000
Asp
ergi
llus
flav
us (1
03sp
ores
g-1)
Feb Apr Jun Aug Oct Dec
Month
20
40
60
80
100
120
0
2001
Asp
ergi
llus
flav
us (1
03sp
ores
g-1)
Feb Apr Jun Aug Oct Dec
Month
100
200
300
400
0
1999
Afl
atox
in B
1 (p
pb)
Feb Apr Jun Aug Oct DecMonth
100
200
300
400
0
2000
Afl
atox
in B
1 (p
pb)
Feb Apr Jun Aug Oct Dec
Month
100
200
300
400
0
2001
Afl
atox
in B
1 (p
pb)
Figure 3. Average and standard deviation for levels of Aspergillus flavus and aflatoxin B1 for 26granaries located in different villages in Mali for 1999, 2000 and 2001.
1999
2000
2001
500
1000
1500
0
Afl
atox
in B
1 (p
pb)
2000
2500
3000
1999
2000
2001
Bafa
gaB
alan
dou
Bind
ougo
Bog
iBo
ugou
laD
iaka
Dio
mate
neD
iou
Fouy
aK
aran
gass
oK
ebila
Kon
iK
onko
Lofig
uéLo
finé
Loul
ouni
Mam
bri
Nam
alaN
’tons
oni
Siko
lom
aSo
noug
o 1
Sono
ugo
2So
tuba
Souk
oum
baTi
ele
Zanc
asso
Village
Figure 4. Average aflatoxin B1 levels for 26 granaries located in different villages in Mali for 1999, 2000 and 2001.
B1 contamination, with the south-west region of Mali being themost affected area, which is due in part to the high relativehumidity. Warm temperatures and relative humidity above 80%promoted the development of A. flavus in the granaries. Similarresults have been found in other regions where maximum toxinproduction occurred between 25 and 27°C and fungal growth instorage facilities was favored by relative humidity above 85% 16.
granaries could be reduced by promoting proper ventilation,because peanuts stored with aeration generally cool faster thanthose stored without aeration 24. Aflatoxin detected in the initialpeanut samples of the Southeastern USA was significantly reducedby aeration in the storages. The results from our study indicated that Mali has conditionsfor A. flavus growth in the granaries and consequently for aflatoxin

200 Journal of Food, Agriculture & Environment, Vol.8 (2), April 2010
1999 2000 2001
0.00
0.01 - 1.501.51 - 3.00
3.01 - 4.50
4.51 - 6.00
6.01 - 9.00
Figure 5. Average aflatoxin B1 levels (expressed as ln) for 26 granaries located in different villages in Mali for 1999, 2000 and 2001.
Mali
Mauritania
Algeria
Niger
Guinea
Burkina Faso
Nigeria
BeninGhana
Cote d'Ivory
Western Sahara
Senegal
TogoSierra Leone
-10° 0°
10°
10°
20°
20°
Mali
Mauritania
Algeria
Niger
Guinea
Burkina Faso
Nigeria
BeninGhana
Cote d'Ivory
Western Sahara
Senegal
TogoSierra Leone
-10° 0°
10°
10
-10° 0°
20°
20°
10°
10°
-10° 0°
-10° 0°
20°
20°
10°
10°
-10° 0°
-10° 0°
20°
20°
10°
10°
-10° 0°
Western Sahara
Algeria
Mauritania
Mali
Niger
Burkina Faso
NigeriaBenin
TogoGhanaCote d’ivory
Guinea
Sierra Leone
Senegal
1999
Months
Feb Apr Jun Aug Oct Dec
1999
Months
Feb Apr Jun Aug Oct Dec
Aflato
xin
B1
(ppb)
0
100
200
300
400
2000
Months
Feb Apr Jun Aug Oct Dec
2000
Months
Feb Apr Jun Aug Oct Dec
Aflato
xin
B1
(ppb)
0
500
1000
1500
2000
2001
0
0
0
0
0
0
0
2001
Aflato
xin
B1
(ppb)
0
500
1000
1500
2000
Feb Apr Jun Aug Oct Dec
Month
20
40
60
80
100
120
0
1999
Asp
ergi
llus
flav
us (1
03sp
ores
g-1)
Feb Apr Jun Aug Oct DecMonth
20
40
60
80
100
120
0
2000
Asp
ergi
llus
flav
us (1
03sp
ores
g-1)
Feb Apr Jun Aug Oct DecMonth
20
40
60
80
100
120
0
2001
Asp
ergi
llus
flav
us (1
03sp
ores
g-1)
Feb Apr Jun Aug Oct Dec
Month
100
200
300
400
0
1999
Afl
atox
in B
1 (p
pb)
Feb Apr Jun Aug Oct DecMonth
500
1000
1500
2000
0
2000
Afl
atox
in B
1 (p
pb)
Feb Apr Jun Aug Oct DecMonth
2001
500
1000
1500
2000
0
Afl
atox
in B
1 (p
pb)
Figure 6. Average and standard deviation levels of Aspergillus flavus and aflatoxin B1 for 26market granaries in Mali for 1999, 2000 and 2001.
In 2000, a high level of aflatoxin B1 was observed at Tiele in boththe village and market granaries. In the market granaries theaverage aflatoxin B1 level was 413 ppb, 977 ppb and 143 ppb in1999, 2000 and 2001, respectively. The same weather data wereused for analysis of the markets and villages granaries at thislocation (Tiele). The month of June was critical for developmentof A. flavus and aflatoxin B1 in Mali, since a significant increase inthe rate of the peanut contamination in many granaries wasobserved during this month. Other sites with high aflatoxin B1
Studies conducted in Brazil showed that A. flavus growth waspromoted by an increase in relative humidity accompanied bytemperatures in the range of 25-30°C in infected nuts 25. Similarly,studies conducted in Pakistan revealed that the higher thehumidity level, the faster the growth of A. flavus growth and thehigher the toxin production 26. A pattern whereby the percentageof contaminated peanut samples on farmers’ granaries declinedwith decreasing precipitation across Western Kenya has beenreported 27.

Journal of Food, Agriculture & Environment, Vol.8 (2), April 2010 201
a)
1999
2000
2001
b)
Avera
ge
maxim
um
tem
pe
ratu
re (
oC
)
26
28
30
32
34
36
38
1999
2000
2001
June July August
199920002001
MonthJune July August
199920002001
Month
23
24
25
20
21
22
Ave
rage
min
imum
tem
pera
ture
(°C
)
32
34
36
26
28
30
Ave
rage
max
imum
tem
pera
ture
(°C
) 38a) b)
Figure 9. Average monthly minimum temperature (a) and average monthly maximum temperature (b)for the months of June, July and August recorded at Bamako Senou (near Tiele).
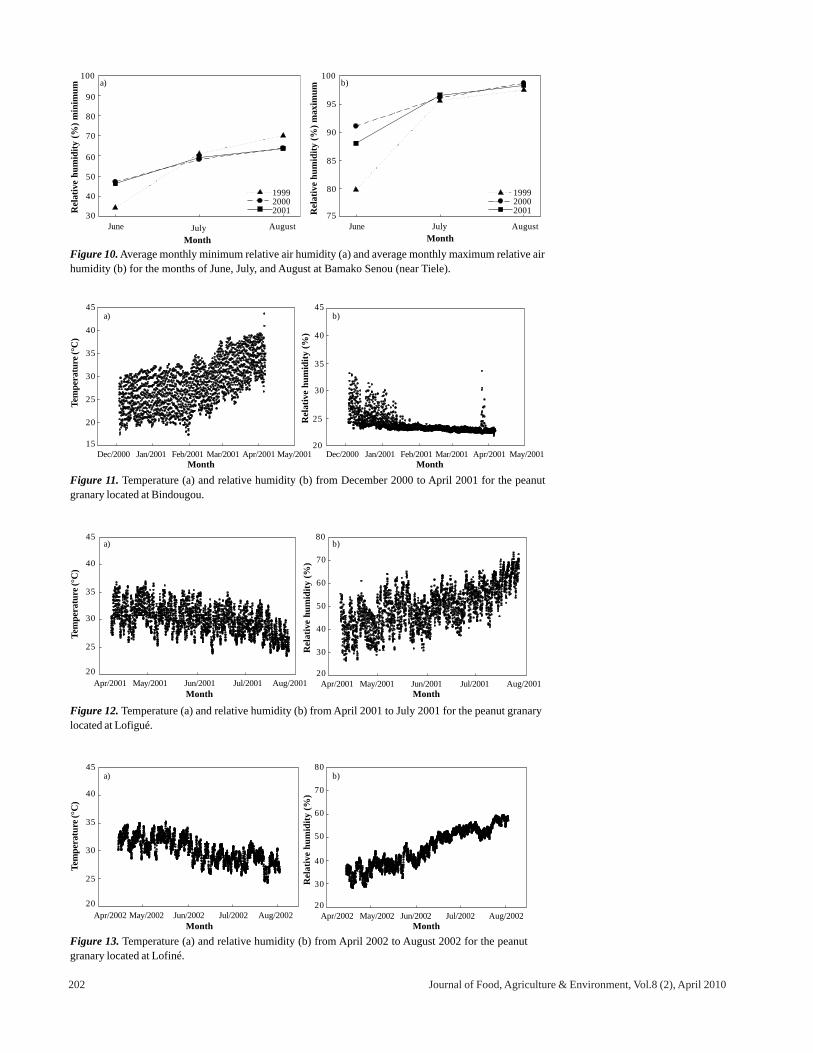
levels at the village granaries included Diaka and Ntonsoni.Unfortunately, these sites had only limited weather data, and,therefore, no statistical analysis was conducted. Lofigué, Lofiné and Loulouni had the lowest aflatoxin B1 in thevillages. These sites are located in the southern part of Mali, nearthe border with Burkina Faso. For some villages, like Bindougou,Lofigué and Lofiné, the only weather data available were
temperature and relative humidity obtained every 90 min with theHobos located inside the granaries (Figs 11-13). Unfortunately,technical problems with the Hobos prevented collection of acomplete data set for analysis. However, based on partial datacollected, it was evident that there was an increase in the relativehumidity from June to August inside the granaries at Lofigué(Fig. 12) and Lofiné (Fig. 13). The maximum relative humidity
1999
2000
2001
500
1000
1500
0
Afl
atox
in B
1 (p
pb) 2000
2500
3000
1999
2000
2001Ba
faga
Bal
ando
uBi
ndou
goB
ogi
Boug
oula
Dia
kaD
iom
atene
Dio
uFo
uya
Kar
anga
sso
Keb
ilaK
oni
Kon
koLo
figué
Lofin
éLo
ulou
niM
ambr
iN
amala
N’to
nson
iSi
kolo
ma
Sono
ugo
1So
noug
o 2
Sotu
baSo
ukou
mba
Tiel
eZa
ncas
so
Market
Figure 7. Average levels of aflatoxin B1 for 26 granaries located in different markets in Mali for 1999, 2000 and 2001.
r2 = 0.39 r
2 = 0.58
Afla
toxin
B1
a
t m
ark
ets
(L
N)
0
2
4
6
8
10
0
2
4
6
8
10
0
2
4
6
8
10
0 2 4 6 8 10 0 2 4 6 8 10
r2=0.39 r2=0.58
Aspergillus flavus at villages (LN) Aflatoxin B1 at villages (LN)
Asp
ergi
llus f
lavu
s at
mar
kets
(LN
)
Afl
atox
in B
1 at
mar
kets
(LN
)
Figure 8. Relation between Aspergillus flavus levels at the 26 villages and theAspergillus flavus levels in the corresponding 26 markets for 1999, 2000 and 2001(a); relation between aflatoxin B1 levels at the 26 villages and the aflatoxin B1 levelsin the corresponding 26 markets for 1999, 2000 and 2001 (b).
a b
202 Journal of Food, Agriculture & Environment, Vol.8 (2), April 2010
a) b)
Rela
tive
Hum
idity (
%)
20
25
30
35
40
45
Dec/2000 Jan/2001Month
35
40
45
20
25
30
b)R
elat
ive
hum
idit
y (%
)
Feb/2001 Mar/2001 Apr/2001 May/2001Dec/2000 Jan/2001Month
35
40
45
20
25
30
a)
Tem
pera
ture
(°C
)
Feb/2001 Mar/2001 Apr/2001 May/200115
Figure 11. Temperature (a) and relative humidity (b) from December 2000 to April 2001 for the peanutgranary located at Bindougou.
a) b)
Rela
tive H
um
idity (
%)
20
30
40
50
60
70
80
50
60
70
20
30
40
b)
Rel
ativ
e hu
mid
ity
(%)
Apr/2001 May/2001Month
35
40
45
20
25
30
a)
Tem
pera
ture
(°C
)
Jun/2001 Jul/2001 Aug/2001 Apr/2001 May/2001MonthJun/2001 Jul/2001 Aug/2001
80
Figure 12. Temperature (a) and relative humidity (b) from April 2001 to July 2001 for the peanut granarylocated at Lofigué.
a) b)
Rela
tive H
um
idity (
%)
20
30
40
50
60
70
80
50
60
70
20
30
40
b)
Rel
ativ
e hu
mid
ity
(%)
Apr/2002 May/2002Month
35
40
45
20
25
30
a)
Tem
pera
ture
(°C
)
Jun/2002 Jul/2002 Aug/2002 Apr/2002 May/2002Month
Jun/2002 Jul/2002 Aug/2002
80
Figure 13. Temperature (a) and relative humidity (b) from April 2002 to August 2002 for the peanutgranary located at Lofiné.
a)
1999
2000
2001
b)
Rela
tive h
um
idity (
%)
ma
xim
um
75
80
85
90
95
100
1999
2000
2001
June July August
199920002001
Month
June July August
199920002001
Month
60
70
80
30
40
50
Rel
ativ
e hu
mid
ity
(%)
min
imum
90
95
100
75
80
85
a) b)
90
100
Rel
ativ
e hu
mid
ity
(%)
max
imum
Figure 10. Average monthly minimum relative air humidity (a) and average monthly maximum relative airhumidity (b) for the months of June, July, and August at Bamako Senou (near Tiele).

Journal of Food, Agriculture & Environment, Vol.8 (2), April 2010 203
References1FAOSTAT 2007. Food and Agriculture Organization of the United
Nations. http://faostat.fao.org/ (Verified: March, 2010).2Subrahmanyam, P., Greenbergj, D. C., Savary, S. and Bosc, J. P. 1991.
Diseases of groundnut in West Africa and their management: Researchpriorities and strategies. International Journal of Pest Management37:259-269.
3Turner, P. C., Mendy, M., Whittle, H., Fortuin, M., Hall, A. J. andWild, C. P. 2000. Hepatitis B infection and aflatoxin biomarker levelsin Gambian children. Trop. Med. Int. Health 5:837-841.
4Wild, C. P. and Hall, A. J. 2000. Primary prevention of hepatocellularcarcinoma in developing countries. Mutation Research 462:381-393.
5Jolly, P., Jiang, Y., Ellis, W., Awuah, R., Nnedu, O., Phillips, T., Wang,S., Afriyie-Gyawu, E., Tang, L., Person, S., Williams, J. and Jolly, C.2006. Determinants of aflatoxin levels in Ghanaians: Sociodemographicfactors, knowledge of aflatoxin and food handling and consumptionpractices. International Journal of Hygiene and Environmental Health209:345-358.
6Jiang, Y., Jolly, P. E., Preko, P., Wang, J., Ellis, W. O., Phillips, T. D. andWilliams, J. H. 2008. Aflatoxin-related immune dysfunction in healthand in human immunodeficiency virus disease. Clinical andDevelopmental Immunology. Article ID 790309. doi:10.1155/2008/790309.
7Cotty, P. J. and Jaime-Garcia, R. 2007. Influences of climate on aflatoxinproducing fungi and aflatoxin contamination. International Journal ofFood Microbiology 119:109-115.
8Sanders, T. H., Cole, R. J., Blankenship, P. D. and Domer, J. W. 1993.
only reached 60 and 70% in August for Lofiné and Lofigué,respectively, indicating that an extreme problem with aflatoxin B1would not be expected for these two locations.
Summary and ConclusionsIn this study A. flavus development in peanut stocks and theheavy contamination of aflatoxin B1 in village and market granariesof Mali were analyzed. The results showed that weather conditionsplayed an important role in the development of A. flavus.Environmental conditions (temperature and relative humidity)favorable for A. flavus development and aflatoxin contaminationwere identified. The results indicate that the weather conditionsoutside the granaries enhanced the development of A. flavus,mainly during the months of June, July and August; warmtemperatures and relative humidity above 80% promoted the fungalgrowth in storage facilities. However, the limited weather datathat were collected at specific granaries, made it difficult to conducta thorough statistical analysis. Nevertheless, the results anddiscussion presented in this study could help enhancemanagement of peanut granaries. Agricultural extension programsin this region should focus on the development of proper storagefacilities with sufficient ventilation that reduces the high relativehumidity levels required for A. flavus development andcontamination of peanuts by aflatoxin. A good sanitation programcould be developed for local granaries and other facilities toeliminate or reduce the carry-over inoculum from prior years’peanut storage.
AcknowledgementsThis work was supported in part by a grant from the U.S. Agencyfor International Development through the Peanut CollaborativeResearch Support Program (Peanut CRSP) and by State andFederal Funds allocated to Georgia Agricultural ExperimentStations Hatch Project GEO01654.
Aflatoxin concentration of peanuts from plants drought stressed inpod or root zones. Peanut Science 20:5-8.
9Cole, R. J., Sanders, T. J., Hill, R. A. and Blankenship, P. D. 1985. Meangeocarposphere temperatures that induce preharvest aflatoxin concentrationof peanuts under drought stress. Mycopathologia 91:41-46.
10Cole, R. J., Sanders, T. H., Dorner, J. W. and Blankenship, P. D. 1989.Environmental conditions required to induce preharvest aflatoxincontamination of groundnuts: Summary of six years’ research. In Hall,S. D. (ed.). Aflatoxin Contamination of Groundnut: Proceedings of theInternational Workshop, 6-9 Oct 1987, ICRISAT Center, Patancheru,A.P., India, pp.279-287.
11Craufurd, P. Q., Prasad, P. V. V., Waliyar, F. and Taheri, A. 2006. Drought,pod yield, pre-harvest Aspergillus infection and aflatoxin contaminationon peanut in Niger. Field Crops Research 98:20-29.
12Boken, V. K., Hoogenboom, G., Williams, J. H., Diarra, B., Dione, S.and Easson, G. L. 2008. Monitoring peanut contamination in Mali(Africa) using AVHRR satellite data and a crop simulation model.International Journal of Remote Sensing 29:117-129.
13Nakai, V. K., Rocha, L. O., Goncalez, E., Fonseca, H., Ortega, E. M. M.and Correa, B. 2008. Distribution of fungi and aflatoxins in a storedpeanut variety. Food Chemistry 106:285-290.
14Pitt, J. I. and Hocking, A. D. 1997. Aspergillus and related teleomorphs.In Pitt, J. I. and Hocking, A. D. (eds). Fungi and Food Spoilage. AcademicPress, London, pp. 339-416.
15Christensen, C. M., Mirocha, C. J. and Meronuck, R. A. 1977. Molds,Mycotoxins and Mycotoxicoces. Minnesota, American Associationof Cereal Chemist 142.
16Shephard, S. S. 2003. Aflatoxin and food safety: Recent Africanperspectives. Journal of Toxicology-Toxin Reviews 22:267-286.
17Dorner, J. W. 2008. Management and prevention of mycotoxins inpeanuts. Food Additives and Contaminants 25:203-208.
18Yin, Y., Yan, L., Jiang, J. and Ma, Z. 2008. Biological control of aflatoxincontamination of crops. Journal of Zhejiang University Science B9:787-792.
19Waliyar, F., Ntare B. R., Diallo, A. T., Kodio, O. and Diarra B. 2007.On-farm Management of Aflatoxin Contamination of Groundnut inWest Africa. A Synthesis Report. International Crops Research Institutefor the Semi-Arid Tropics, 24 p.
20Eaton, D. L. and Gallagher, E. P. 1994. Mechanisms of aflatoxincarcinogenesis. Annual Review of Pharmacology and Toxicology34:135-172.
21Goto, T. and Manabe, M. 1987. Methods for the analysis of aflatoxinsin groundnut and other agricultural commodities. In AflatoxinContamination of Groundnuts. ICRISAT, Patancheru, India. pp.173-182.
22Freese, F. 1967. Elementary Statistical Methods for Foresters.Agricultural Handbook No.317. Department of Agriculture, ForestService, Washington, DC, U.S.
23Holbrook, C., Ozias-Akins, P., Timper, P., Wilson, D. M., Cantonwine,E., Guo, B. Z., Sullivan, D. G. and Dong, W. 2008. Research from theCoastal Plain Experiment Station, Tifton, Georgia, to minimize aflatoxincontamination in peanut. Toxin Reviews 27:391-410.
24Butts, C. L., Dorner, J. W., Brown, S. L. and Arthur, F. H. 2006.Aerating farmer stock peanut storage in the southeastern U.S.Transactions of the ASABE 49:457-465.
25Arrus, K., Blank, G., Abramson, D., Clear, R. and Holley, R. A. 2005.Aflatoxin production by Aspergillus flavus in Brazil nuts. Journal ofStored Products Research 41:513-527.
26Saleemullah, Iqbal, A., Khalil, I. A. and Shah, H. 2006. Aflatoxin contentsof stored and artificially inoculated cereals and nuts. Food Chemistry98:699-703.
27Mutegi, C. K., Ngugi, H. K., Hendriks, S. L. and Jones, R.B. 2009.Prevalence and factors associated with aflatoxin contamination ofpeanuts from Western Kenya. International Journal of FoodMicrobiology 130:27-34.