Q2-21 Results Presentation
32
Q2-21 Results Presentation JULY 15, 2021
Transcript of Q2-21 Results Presentation

Copyright © SUSE 2021
Q2-21 Results Presentation
JULY 15 , 2021

Copyright © SUSE 2021
This presentation as well as any information communicated in connection therewith (the "Presentation") contains information regarding SUSE S.A. (the "Company") and its subsidiaries (the Company, together with its subsidiaries, "SUSE" or "Group"). It is being provided for informational purposes only and should not be relied on for any purpose and may not be redistributed, reproduced, published, or passed on to any other person or used in whole or in part for any other purpose.
All stated figures are unaudited. This document contains alternative performance measures (APMs) which are further specified on page 25.
Certain statements in this presentation may constitute forward looking statements. These statements are based on assumptions that are believed to be reasonable at the time they are made, and are subject to significant risks and uncertainties, including, but not limited to, those risks and uncertainties described in SUSE’s disclosures. You should not rely on these forward-looking statements as predictions of future events and we undertake no obligation to update or revise these statements. Our actual results may differ materially and adversely from any forward-looking statements discussed in these statements due to several factors, including without limitation, risks from macroeconomic developments, external fraud, lack of innovation capabilities, inadequate data security and changes in competition levels.
The Company undertakes no obligation, and does not expect to publicly update, or publicly revise, any forward-looking statement,whether as a result of new information, future events or otherwise. All subsequent written and oral forward-looking statements attributable to it or to persons acting on its behalf are expressly qualified in their entirety by the cautionary statements referred to above and contained elsewhere in this Presentation.
2
Important Notice

Copyright © SUSE 2021
MelissaDi Donato
CEO
AndyMyers
CFO
JonathanAtack
Investor Relations Director
3
Today’s Presenters
1. Business Update
2. Financial Update
A G E N D A

Copyright © SUSE 2021 Copyright © SUSE 2021
Melissa Di Donato, CEO
Business Update
4

Copyright © SUSE 2021
5
Another Strong Quarter for SUSE
Note: Q2 and H1 financial figures are based on pro forma numbers including Rancher on a coterminous basis in the prior year and in 2021 as if acquired on November 1, 2020. For definition of APM metrics please refer to page 25.(1) Adjusted for a sizeable contract renewal which occurred in Q2-20.
FY21 Guidance and Medium-Term Outlook Confirmed
11%
Reported ACV Growth(22%+ Underlying(1))
$137mAdjusted Revenue
40%
Adjusted Cash EBITDA Margin
$54mAdjusted Cash EBITDA
98%
H1-21 Cash Conversion
$106mH1-21 Unlevered Free
Cash Flow
$519mTotal ARR
16%
Total ARR Growth
109%
SUSE NRR
125%
SUSE Rancher NRR
Copyright © SUSE 2021
6
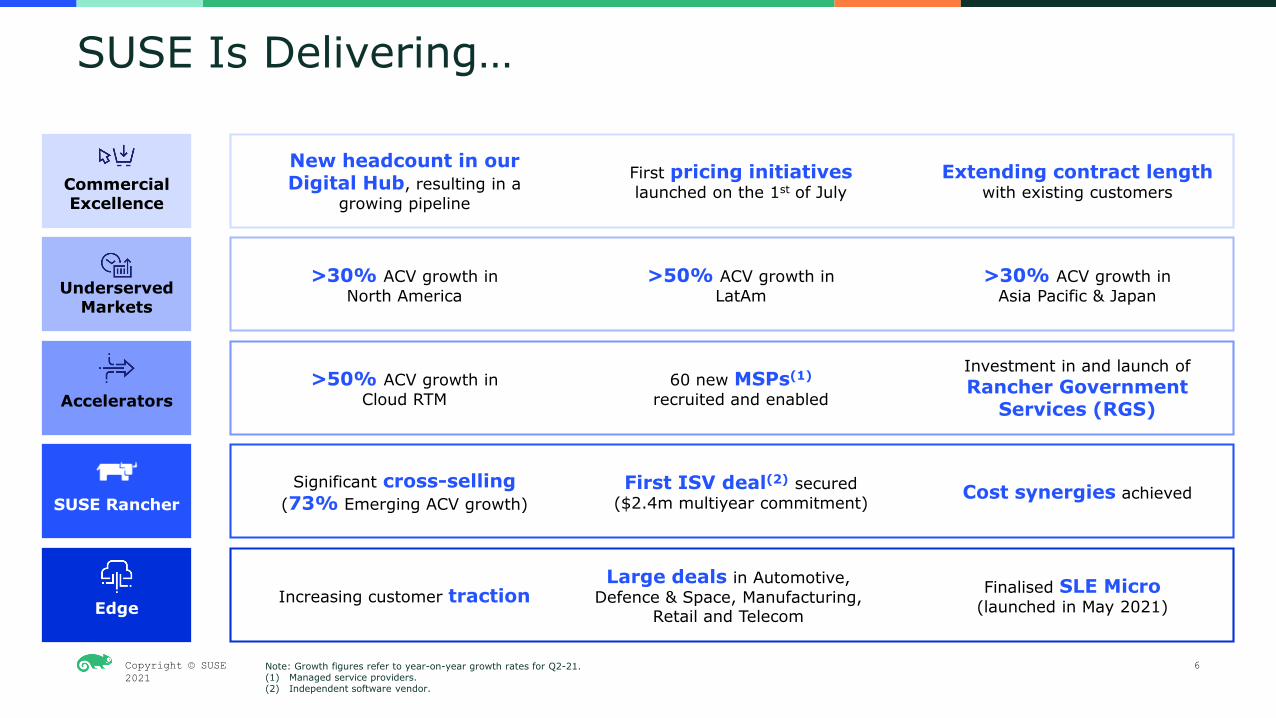
SUSE Is Delivering…
Note: Growth figures refer to year-on-year growth rates for Q2-21.(1) Managed service providers.(2) Independent software vendor.
Commercial Excellence
Underserved Markets
Accelerators
SUSE Rancher
Edge
New headcount in our Digital Hub, resulting in a
growing pipeline
First pricing initiativeslaunched on the 1st of July
Extending contract lengthwith existing customers
>30% ACV growth in North America
>50% ACV growth in LatAm
>30% ACV growth in Asia Pacific & Japan
>50% ACV growth in Cloud RTM
60 new MSPs(1)
recruited and enabled
Investment in and launch of Rancher Government
Services (RGS)
Significant cross-selling(73% Emerging ACV growth)
First ISV deal(2) secured ($2.4m multiyear commitment) Cost synergies achieved
Increasing customer tractionLarge deals in Automotive,
Defence & Space, Manufacturing, Retail and Telecom
Finalised SLE Micro (launched in May 2021)
Copyright © SUSE 2021
7
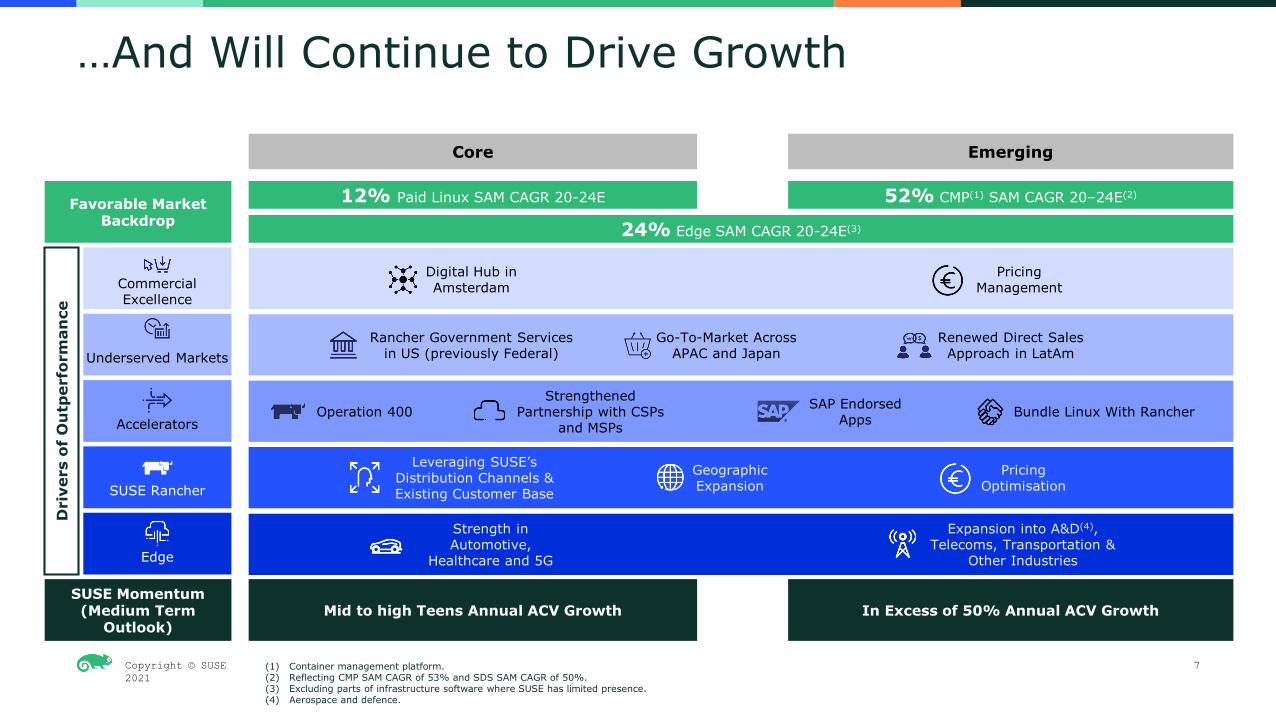
…And Will Continue to Drive Growth
(1) Container management platform.(2) Reflecting CMP SAM CAGR of 53% and SDS SAM CAGR of 50%.(3) Excluding parts of infrastructure software where SUSE has limited presence.(4) Aerospace and defence.
12% Paid Linux SAM CAGR 20-24E 52% CMP(1) SAM CAGR 20–24E(2)
Commercial Excellence
Underserved Markets
Accelerators
SUSE Rancher
Edge
Dri
vers
of
Ou
tper
form
ance
Favorable Market Backdrop
SUSE Momentum (Medium Term
Outlook)Mid to high Teens Annual ACV Growth In Excess of 50% Annual ACV Growth
Core Emerging
Digital Hub in Amsterdam
Go-To-Market Across APAC and Japan
Renewed Direct Sales Approach in LatAm
Bundle Linux With RancherOperation 400 SAP Endorsed Apps
Strengthened Partnership with CSPs
and MSPs
Leveraging SUSE’s Distribution Channels & Existing Customer Base
Geographic Expansion
Strength in Automotive,
Healthcare and 5G
PricingManagement
Pricing Optimisation
Expansion into A&D(4), Telecoms, Transportation &
Other Industries
Rancher Government Services in US (previously Federal)
24% Edge SAM CAGR 20-24E(3)

Copyright © SUSE 2021
8
A Fantastic Quarter for New Customer Contracts
Top 10 American Retail Company
Products
Why SUSE
SUSE Linux Enterprise Server for SAP Applications
Strategic relationship with SAP delivered a smooth SAP S/4HANA migration
SUSE chosen to partner with HPE because of its strong HPE GreenLake track record
Required to power the customer’s new connected car technology
Cost effective scaling
No vendor lock in
Ease of installation and operation
Major EMEA Aerospace and Defense Organisation
OverviewSUSE displaced the incumbent provider in a
highly significant SAP contract
SUSE won in a competitive tender, displacing the incumbent provider and
winning against other contenders
SUSE Rancher displaced the incumbent provider in a significant contract to power
innovative connected car technology
Successful management and orchestration of container environments
Ease of installation and operation
Most secure container solution
No vendor lock in
Leading Korean Automotive Manufacturer
SUSE Rancher
SUSE Linux Enterprise ServerSUSE Rancher
Total 120 net new logos in Q2 21 alone

Copyright © SUSE 2021
A Successful IPO Bringing Stakeholder Engagement…Our Colleagues Are Engaged…
…And Increasingly Invested in SUSE
Our Community Has Never Been so Active
86%response rate to latest employee
satisfaction survey
5,500comments, equivalent to nearly 3 contributions per
colleague
63%of our staff are invested in SUSE through LTIP
(vs. 25% pre-IPO)
Employee Stock Purchase Planbeing established
9
64%y-o-y increase in SUSECON event
attendance
92%y-o-y increase in
SUSECON audience engagement(1)
721%y-o-y increase in social media engagement on SUSECON event days
(1) Based on viewed content per attendee.
1.6mTotal views making
Choose Open SUSE’s most watched video!
Copyright © SUSE 2021
10
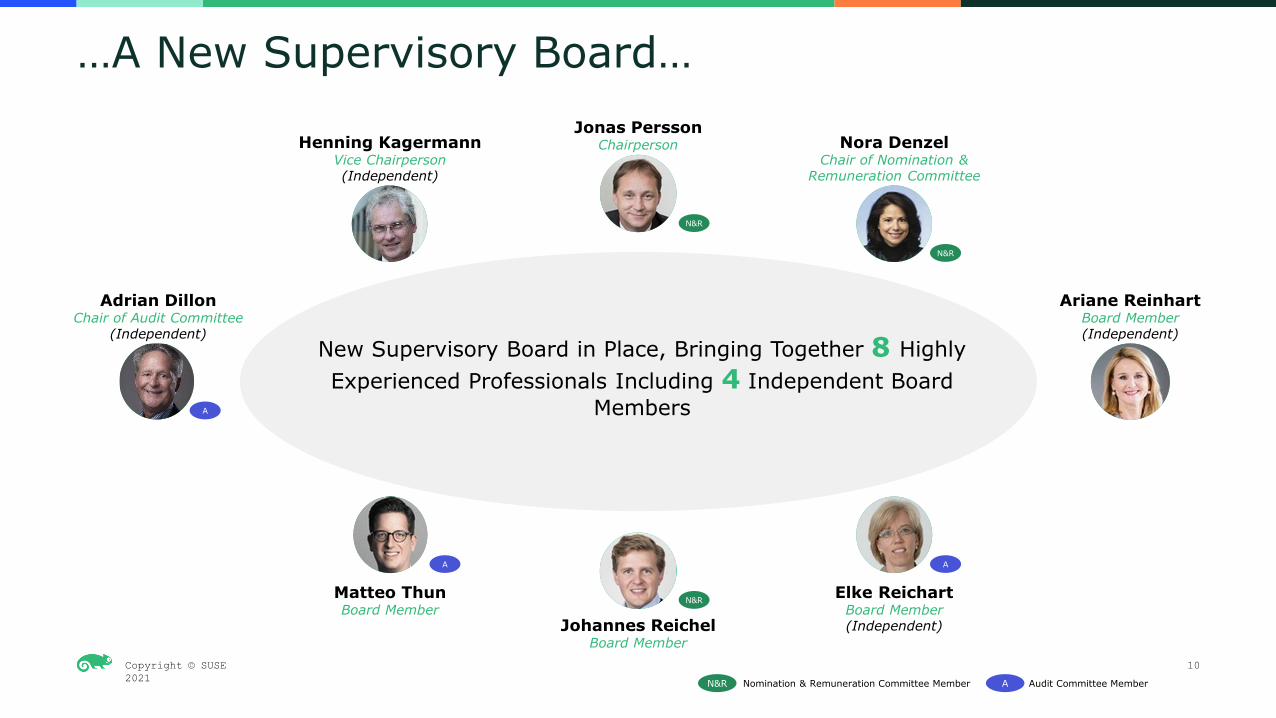
…A New Supervisory Board…
New Supervisory Board in Place, Bringing Together 8 Highly Experienced Professionals Including 4 Independent Board
Members
Jonas PerssonChairpersonHenning Kagermann
Vice Chairperson(Independent)
Adrian DillonChair of Audit Committee
(Independent)
Nora DenzelChair of Nomination &
Remuneration Committee
Ariane ReinhartBoard Member(Independent)
Elke ReichartBoard Member(Independent)Johannes Reichel
Board Member
Matteo ThunBoard Member
N&R Nomination & Remuneration Committee Member A Audit Committee Member
A
A A
N&R
N&R
N&R

Copyright © SUSE 2021
11
…And Further Progress on ESGESG Goals Targeted Initiatives Transverse Initiatives
Philanthropy
— Launched flagship employee program SUSEcares, with over 300 employees already engaged
Employee Engagement
— Well-resourced and functioning employee networks (e.g. Women in Tech, Pride)
— Paid volunteering days
Climate ActionCommitment Towards Becoming Net Zero
Climate Action— GHG emissions measured in 2019 and 2020— Developing a roadmap towards net-zero
Diversity & InclusionAt least 30% Female Directors by 2026
Diversity & Inclusion— Developing cross-functional work plan and
program with HR to nurture and grow internal talent as well as hire externally
— To be launched with first non-financial disclosure report
Open Source 4 GoodPromote access and equality in the open source community through professional development courses and structured internships / apprenticeships
Open Source 4 Good— Launched Udacity-SUSE cloud native nanodegree
course in May as well as free foundational course— Scholarship program, with 100 to be granted
specifically to women of colour
ESG GovernanceEstablish a governance framework to ensure ESG is fully embedded across the business
ESG Governance— Developed framework for policy life cycle
management at SUSE and rewriting of key policies
— Rolling out of cross-functional governance structure and terms of reference

Copyright © SUSE 2021 Copyright © SUSE 2021
Andy Myers, CFO
Financial Update
12

Copyright © SUSE 2021
13
Financial Results Summary
— Strong growth: ARR up 16% and ACV up 22% on an underlying basis (ACV up 11% on a reported basis)
— High margin: Adjusted Cash EBITDA margin of 40%
— High cash generation: 98% cash conversion in H1-21
— FY21 guidance and medium-term outlook confirmed
Q2-21 Highlights
Memo
— Results prepared on an adjusted, pro-forma basis at actual currency rates
— Pro forma figures prepared for Q2-21 and H1-21, as well as for the prior year periods, as if Rancher had been fully consolidated (Rancher only consolidated since December 2020 in the Statutory Accounts)
— Revenue shown excluding the impact of the deferred revenue haircut
— Other P&L and cash flow items excluding the impact of share based compensation, as well as non-recurring items
Note: For definition of APM metrics please refer to page 25.

Copyright © SUSE 2021
90 95
185 2068 14
22
41
99 109
207
247
Q2-20 Q2-21 H1-20 H1-21
14
ACV by Solutions
(1)
ACV growth of 11% in Q2-21 despite a demanding prior year’s base
− 22% ACV growth on an underlying basis, adjusted for the impact of a major contract renewal in Q2-20
Continued momentum in Emerging with 73% growth in Q2-21, reflecting growing enterprise uptake of Containers:
− First ISV deal secured for SUSE Rancher ($2.4m multi-year commitment)
− Positive momentum in selling SUSE Rancher solutions into SUSE’s installed base
Very high growth across underserved markets, with North America, LatAm and APJ all above 30%
Route to Market Dynamics
− Particularly dynamic in the Cloud Route-to-Market, which saw over 50% growth in ACV
− IHV slightly weaker, due to hardware supply issues increasing customer lead times
− End User continues to show strong underlying growth across the board
88%
11%73%
5%
ACV by Solutions ($m)
YoY Growth
YoY Growth
H1-20 – H1-21Q2-20 – Q2-21
Core Emerging
Note: All figures are expressed in $m unless otherwise specified. Q2 and H1 financial figures are based on pro forma numbers including Rancher on a coterminous basis in the prior year and in 2021 as if acquired on November 1, 2020. For definition of APM metrics please refer to page 25.
Copyright © SUSE 2021
15
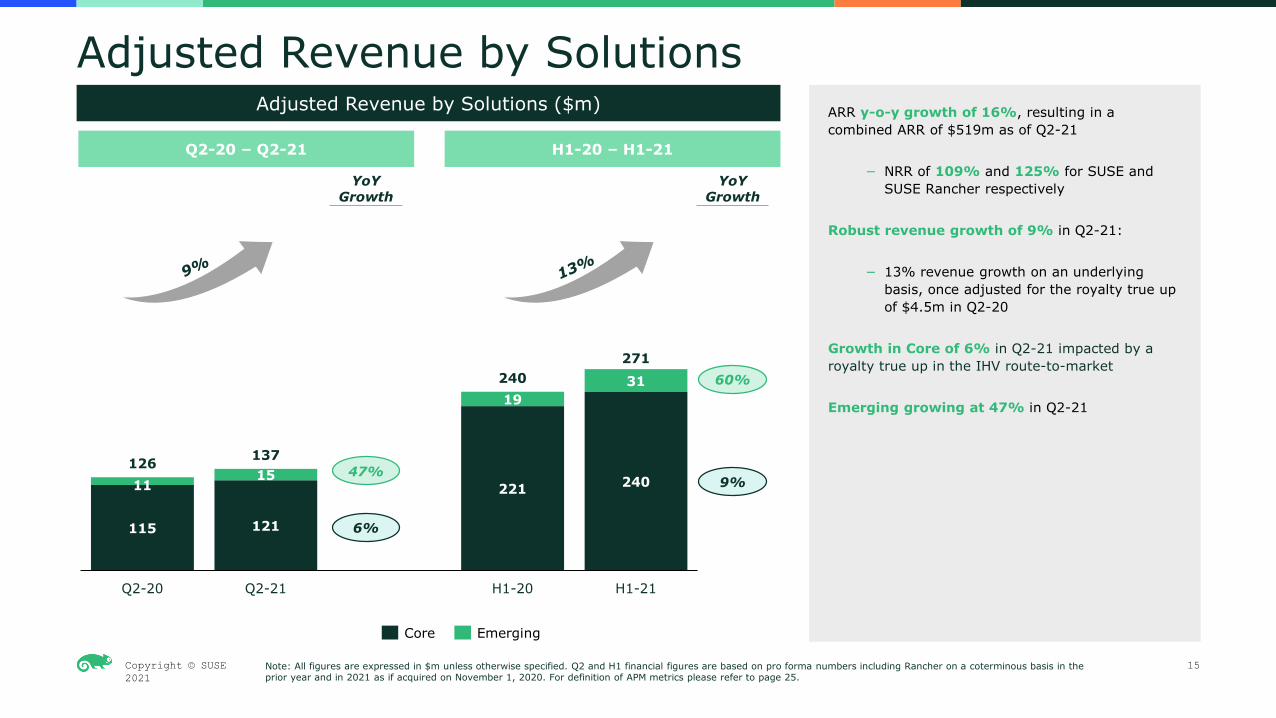
Adjusted Revenue by Solutions
Note: All figures are expressed in $m unless otherwise specified. Q2 and H1 financial figures are based on pro forma numbers including Rancher on a coterminous basis in the prior year and in 2021 as if acquired on November 1, 2020. For definition of APM metrics please refer to page 25.
(1)
60%
9%47%
6%
Core Emerging
ARR y-o-y growth of 16%, resulting in a combined ARR of $519m as of Q2-21
− NRR of 109% and 125% for SUSE and SUSE Rancher respectively
Robust revenue growth of 9% in Q2-21:
− 13% revenue growth on an underlying basis, once adjusted for the royalty true up of $4.5m in Q2-20
Growth in Core of 6% in Q2-21 impacted by a royalty true up in the IHV route-to-market
Emerging growing at 47% in Q2-21
Adjusted Revenue by Solutions ($m)
YoY Growth
YoY Growth
H1-20 – H1-21Q2-20 – Q2-21
115 121
221 2401115
1931
126 137
240271
Q2-20 Q2-21 H1-20 H1-21

Copyright © SUSE 2021
($m) Q2-20 Q2-21 H1-20 H1-21
Adjusted Revenue 125.5 136.8 240.4 270.9
Cost of Sales (7.5) (10.5) (14.6) (18.6)
As % of Revenue 6.0% 7.7% 6.1% 6.9%
Gross Profit 118.0 126.3 225.8 252.3
% Margin 94.0% 92.3% 93.9% 93.1%
Sales, Marketing & Operations (34.1) (35.9) (69.5) (67.4)
Research & Development (20.1) (22.4) (40.4) (44.4)
General & Administrative (14.0) (19.8) (28.5) (31.6)
Total Operating Costs (68.2) (78.1) (138.4) (143.4)
Adjusted EBITDA 49.8 48.2 87.4 108.9
% Margin 39.7% 35.2% 36.4% 40.2%
— Cost of Sales:
− Slight increase resulting from growth in Rancher Government Services business, which involved incremental third-party consulting costs
— Sales, Marketing & Operations:
− Slight increase due to 61 additional FTEs, as well higher marketing spend to drive demand generation
— Research & Development:
− Broadly flat as % of revenue with the impact of increased headcount largely offset by elimination of overlapping functions at SUSE Rancher
— General & Administrative:
− Increase due to the end of favourable TSA with Micro Focus and 40 additional FTEs to support growth
− Adjusted EBITDA margin reflecting investment for growth
16
Operating Costs Evolution
Note: All figures are expressed in $m unless otherwise specified. Q2 and H1 financial figures are based on pro forma numbers including Rancher on a coterminous basis in the prior year and in 2021 as if acquired on November 1, 2020. For definition of APM metrics please refer to page 25.
1
2
3
4
1
2
3
4
55

Copyright © SUSE 2021
108.9
52.6
161.5
73.5
AdjustedEBITDA
Change inDeferredRevenue
AdjustedCash
EBITDA
AdjustedPBT
48.2
6.2
54.4
22.3
AdjustedEBITDA
Change inDeferredRevenue
AdjustedCash
EBITDA
AdjustedPBT
H1-21 Profitability
17
Profitability Update
Note: All figures are expressed in $m unless otherwise specified. Q2 and H1 financial figures are based on pro forma numbers including Rancher on a coterminous basis in the prior year and in 2021 as if acquired on November 1, 2020. For definition of APM metrics please refer to page 25.
SUSE continues to show high levels of profitability thanks to its mission-critical open source solutions and highly efficient go to market
Adjusted EBITDA margins in Q2-21 and H1-21 reached 35%and 40% respectively
Adjusted Cash EBITDA margins in Q2-21 and H1-21 reached 40%and 60% respectively
− Modest deferred revenue inflow in Q2-21, with a challenging comparison basis given particularly large multi-year deal signed in Q2-20
− Typical H1-21 change in deferred revenue pattern reflecting a combination of business seasonality and large renewals in Q1-21
Q2-21 Profitability
% Margin
$m
40.2% 59.6% 27.1%
$m
35.2% 39.8% 16.3%

Copyright © SUSE 2021
108.9
161.5
106.4
52.6
(0.8)
(27.6)
(20.9) (4.0)(1.8)
Adjusted EBITDA Change inDeferred Revenue
Adjusted CashEBITDA
Capex Other WorkingCapital Items
Reversal of IFRS15 and 16
Cash Taxes Rancher Nov-20Contribution
Adjusted uFCF
98%Cash
Conversion in H1-21
18
Bridge from Adjusted EBITDA to Adjusted uFCF (H1-21)
Note: All figures are expressed in $m unless otherwise specified. For definition of APM metrics please refer to page 25.(1) Combined impact of one month of Rancher (Nov-20) capex, other working capital items, reversal of IFRS 15 and 16, cash taxes and other.
Including 6 months of Rancher Including 5 months of Rancher RancherNov-20
Including 6 months of Rancher
(1)

Copyright © SUSE 2021
897
1,205
703
H1-20 H1-21 H1-21 Post IPO Proceeds
Net Debt ($m)
19
Balance Sheet / Leverage
Note: All figures are expressed in $m unless otherwise specified. H1 financial figures are based on pro forma numbers including Rancher on a coterminous basis in the prior year and in 2021 as if acquired on November 1, 2020.(1) Defined as Net Debt divided by LTM Adjusted Cash EBITDA.(2) Net proceeds after the cash payment related to the VSOP program as well as other IPO costs and debt pre-payment fees.
Net proceeds from the IPO (post VSOP payment and other IPO costs) of $502m utilised to pay down debt, resulting in pro forma leverage of 3.1x
− IPO proceeds used to fully repay the Second Lien Term Loan Facility ($270m) and partial repayment of the Term Loan B ($232m), as well as payment of liabilities relating to the virtual stock option program
S&P and Moody’s have upgraded their ratings for SUSE post IPO, to BB- (Stable) and B1 (Stable) respectively
SUSE is committed to keeping leverage below 3.5x LTM Adj. Cash EBITDA over the medium term, whilst retaining flexibility for any potential M&A
5.3x 3.1xLeverage(1)
Including net IPO proceeds of $502m(2)
Copyright © SUSE 2021
20
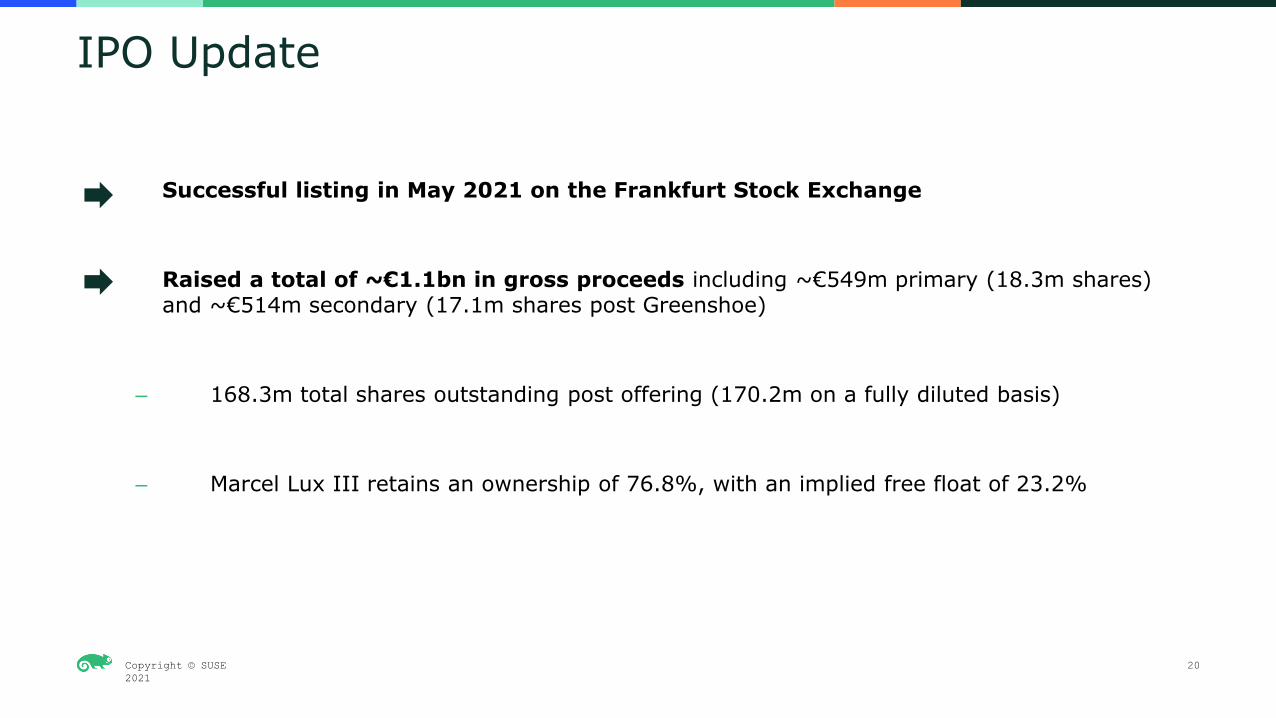
IPO Update
— Successful listing in May 2021 on the Frankfurt Stock Exchange
— Raised a total of ~€1.1bn in gross proceeds including ~€549m primary (18.3m shares) and ~€514m secondary (17.1m shares post Greenshoe)
– 168.3m total shares outstanding post offering (170.2m on a fully diluted basis)
– Marcel Lux III retains an ownership of 76.8%, with an implied free float of 23.2%
Copyright © SUSE 2021
21
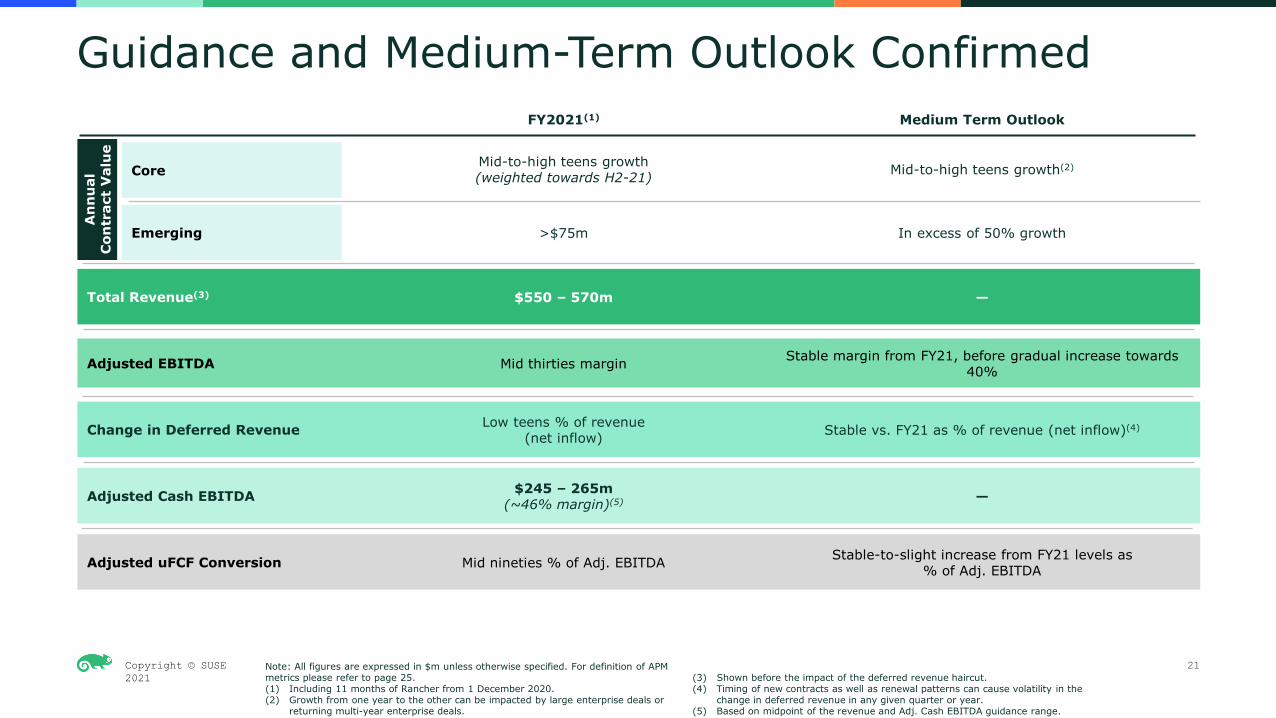
Guidance and Medium-Term Outlook ConfirmedA
nn
ual
C
ontr
act
Val
ue
Mid-to-high teens growth(weighted towards H2-21)Core
>$75mEmerging
Total Revenue(3) $550 – 570m
Adjusted EBITDA Mid thirties margin
Change in Deferred Revenue Low teens % of revenue(net inflow)
Adjusted Cash EBITDA $245 – 265m(~46% margin)(5)
Adjusted uFCF Conversion Mid nineties % of Adj. EBITDA
FY2021(1) Medium Term Outlook
Mid-to-high teens growth(2)
In excess of 50% growth
—
Stable margin from FY21, before gradual increase towards 40%
Stable vs. FY21 as % of revenue (net inflow)(4)
—
Stable-to-slight increase from FY21 levels as% of Adj. EBITDA
Note: All figures are expressed in $m unless otherwise specified. For definition of APM metrics please refer to page 25.(1) Including 11 months of Rancher from 1 December 2020.(2) Growth from one year to the other can be impacted by large enterprise deals or
returning multi-year enterprise deals.
(3) Shown before the impact of the deferred revenue haircut.(4) Timing of new contracts as well as renewal patterns can cause volatility in the
change in deferred revenue in any given quarter or year.(5) Based on midpoint of the revenue and Adj. Cash EBITDA guidance range.
Copyright © SUSE 2021
22
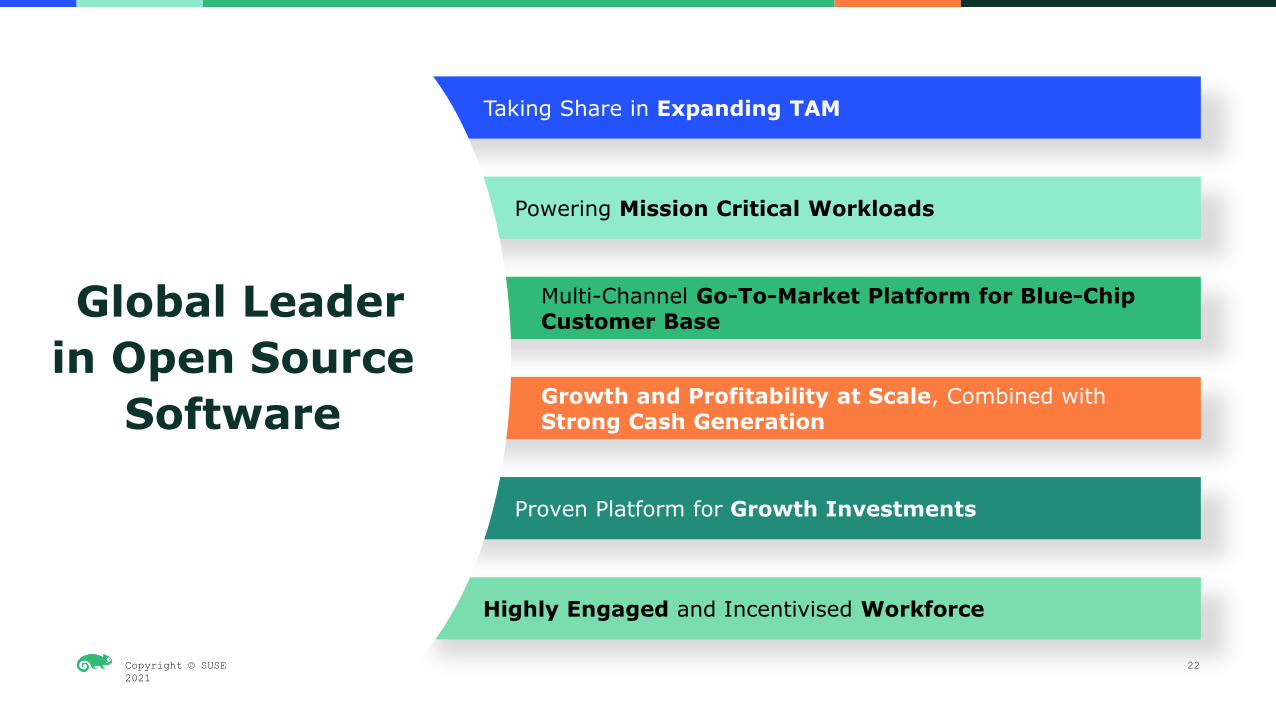
Global Leader in Open Source
Software
Multi-Channel Go-To-Market Platform for Blue-Chip Customer Base
Growth and Profitability at Scale, Combined with Strong Cash Generation
Powering Mission Critical Workloads
Taking Share in Expanding TAM
Proven Platform for Growth Investments
Highly Engaged and Incentivised Workforce

Copyright © SUSE 2021 Copyright © SUSE 2021
Q&A

Copyright © SUSE 2021 Copyright © SUSE 2021
Appendix
24

Copyright © SUSE 2021
25
Alternative Performance Measures (APMs) This document contains certain alternative performance measures (collectively, “APMs”) including ACV, ARR, NRR, Adjusted Revenue, Adjusted EBITDA, Adjusted Cash EBITDA, Adjusted Cash EBITDA margin, Adjusted uFCF, Cash Conversion and Net Debt that are not required by, or presented in accordance with, IFRS, Luxembourg GAAP or any other generally accepted accounting principles. Certain of these measures are derived from the IFRS accounts of the Company and others are derived from management reporting or the accounting or controlling systems of the Group.
SUSE presents APMs because they are used by management in monitoring, evaluating and managing its business and management believes these measures provide an enhanced understanding of SUSE’s underlying results and related trends. The definitions of the APMs may not be comparable to other similarly titled measures of other companies and have limitations as analytical tools and should, therefore, not be considered in isolation or as a substitute for analysis of SUSE’s operating results as reported under IFRS or Luxembourg GAAP. APMs such as ACV, ARR, NRR, ACV to Revenue Conversion, Adjusted Revenue, Adjusted EBITDA, Adjusted Cash EBITDA, Adjusted Cash EBITDA Margin, Adjusted uFCF, Cash Conversion and Net Debt are not measurements of SUSE’s or the Company’s performance or liquidity under IFRS, Luxembourg GAAP or German GAAP and should not be considered as alternatives to results for the period or any other performance measures derived in accordance with IFRS, Luxembourg GAAP, German GAAP or any other generally accepted accounting principles or as alternatives to cash flow from operating, investing or financing activities.
SUSE has defined each of the following APMs as follows:
“Annual Contract Value” or “ACV”: ACV represents the first 12 months monetary value of a contract. If total contract duration is less than 12 months, 100% of invoicing is included in ACV;
“Annual Recurring Revenue” or “ARR”: ARR represents the sum of the monthly contractual value for subscriptions and recurring elements of contracts in a given period, multiplied by 12. ARR for SUSE (excluding Rancher) is calculated three months in arrears, given backdated royalties relating to IHV and Cloud, and hence reflects the customer base as of three months prior. ARR for SUSE as of April 30, 2021 is calculated as the sum of SUSE (excluding Rancher)’s ARR as of April 30, 2021 and SUSE Rancher’s ARR as of April 30, 2021;
“Net Retention Rate” or “NRR”: expressed as a percentage, NRR indicates the proportion of ARR that has been retained over the prior 12 month period, which is inclusive of up-sell, cross-sell, down-sell, churn and pricing. It excludes ARR from net new logo End User customers. The NRR is calculated three months in arrears, aligned to the calculation of ARR;
“Adjusted Revenue”: Revenue as reported in the statutory accounts of the Company, adjusted for fair value adjustments;
“Adjusted EBITDA”: this APM represents earnings before net finance costs, share of loss of associate and tax, adjusted for depreciation and amortization, share based payments, fair value adjustment to deferred revenue, statutory separately reported items, specific non-recurring items and net unrealized foreign exchange (gains)/losses;
“Adjusted Cash EBITDA”: this APM represents Adjusted EBITDA plus changes in contract liabilities in the related period and is shown in the Prospectus and excludes the impact of contract liabilities –deferred revenue haircut;
“Adjusted Cash EBITDA Margin”: expressed as a percentage, this APM represents Adjusted Cash EBITDA divided by Adjusted Revenue;
“Adjusted Unlevered Free Cash Flow” or “Adjusted uFCF”: this APM represents Adjusted Cash EBITDA less capital expenditure related cash outflow, working capital movements (excluding deferred revenue, which is factored into Adjusted Cash EBITDA, and non-recurring items), cash taxes and the reversal of non-cash accounting adjustments relating to IFRS 15 and IFRS 16;
“Cash Conversion”: expressed as a percentage, this APM represents Adjusted uFCF divided by Adjusted EBITDA; and
“Net Debt”: this APM represents the sum of non-current financial liabilities, non-current lease liabilities, current financial liabilities and current lease liabilities less cash and cash equivalents as of the respective balance sheet date (excluding capitalized debt arrangement fees (net of amortization) and gains on loan modifications).
Copyright © SUSE 2021
26
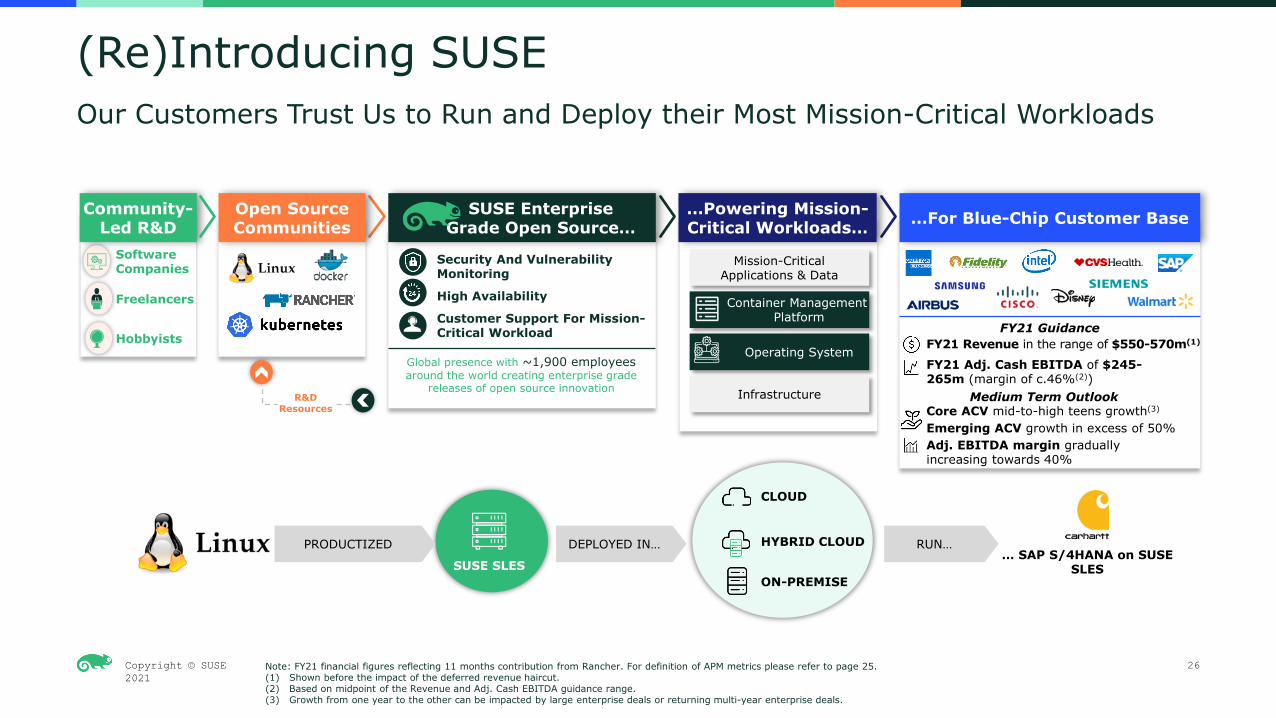
Our Customers Trust Us to Run and Deploy their Most Mission-Critical Workloads
(Re)Introducing SUSE
Note: FY21 financial figures reflecting 11 months contribution from Rancher. For definition of APM metrics please refer to page 25.(1) Shown before the impact of the deferred revenue haircut.(2) Based on midpoint of the Revenue and Adj. Cash EBITDA guidance range.(3) Growth from one year to the other can be impacted by large enterprise deals or returning multi-year enterprise deals.
SUSE SLES
CLOUD
HYBRID CLOUD
ON-PREMISE
PRODUCTIZED DEPLOYED IN… RUN…… SAP S/4HANA on SUSE
SLES
Open Source Communities
Security And Vulnerability Monitoring
High Availability
Customer Support For Mission Critical Workload
SUSE Enterprise Grade Open Source…
Global presence with ~1,900 employees around the world creating enterprise grade
releases of open source innovation
…Powering Mission-Critical Workloads…
CUSTOMER EXAMPLES
R&D Resources
Software Companies
Freelancers
Hobbyists
Security And Vulnerability Monitoring
High Availability
Customer Support For Mission-Critical Workload
Mission-CriticalApplications & Data
Container Management Platform
Operating System
Infrastructure
Community-Led R&D …For Blue-Chip Customer Base
Adj. EBITDA margin gradually increasing towards 40%
FY21 Adj. Cash EBITDA of $245-265m (margin of c.46%(2))
FY21 Revenue in the range of $550-570m(1)
Core ACV mid-to-high teens growth(3)
Emerging ACV growth in excess of 50%
Medium Term Outlook
FY21 Guidance

Copyright © SUSE 2021
48.254.4
67.6
6.2
(0.4)
24.1
(8.9) (1.6)
Adjusted EBITDA Change in DeferredRevenue
Adjusted CashEBITDA
Capex Other WorkingCapital Items
Reversal of IFRS 15and 16
Cash Taxes Adjusted uFCF
140%Cash
Conversion in Q2-21
27
Bridge from Adjusted EBITDA to Adjusted uFCF (Q2-21)
Note: All figures are expressed in $m unless otherwise specified. For definition of APM metrics please refer to page 25.

Copyright © SUSE 2021
28(1) Adding 3 months, 6 months and 1 month of Rancher for Q2-20, H1-20 and H1-21 respectively.
Adjusted Revenue Reconciliation
($m) Q2-20 Q2-21 H1-20 H1-21
Statutory Revenue 113.4 133.2 215.7 259.7
Plus: Contract Liability Haircut Amortised 4.6 3.6 11.1 7.5
Plus: Pro Forma Rancher Contribution(1) 7.5 - 13.6 3.7
Adjusted Revenue 125.5 136.8 240.4 270.9

Copyright © SUSE 2021
29
Adjusted EBITDA Reconciliation
($m) Q2-20 Q2-21 H1-20 H1-21
Operating Loss per Statutory Account 8.0 (130.0) (2.3) (150.8)
Minus: Amortisation and Depreciation 32.8 40.5 67.8 78.8
Minus: Separately Reported Items - 4.6 - 9.2
Minus: Contract Liability Haircut Amortised 4.6 3.6 11.1 7.5
Minus: Non-recurring Items 6.6 6.3 14.0 13.3
Minus: Share Based Payments(1) 2.2 127.6 4.3 153.6
Plus: Foreign Exchange (unrealised) (0.4) (4.4) 0.9 (0.9)
Adjusted EBITDA (Statutory Basis, Excluding Rancher Pro Forma Contribution)
53.8 48.2 95.8 110.7
Minus: Adjustment for Actual Rancher Contribution(2) (4.0) - (8.4) (1.8)
Adjusted EBITDA 49.8 48.2 87.4 108.9
Note: For definition of APM metrics please refer to page 25.(1) Q2-21 and H1-21 increase in share based compensation driven by pre-IPO option program.(2) Adding 3 months, 6 months and 1 month of Rancher for Q2-20, H1-20 and H1-21 respectively.
Copyright © SUSE 2021
30
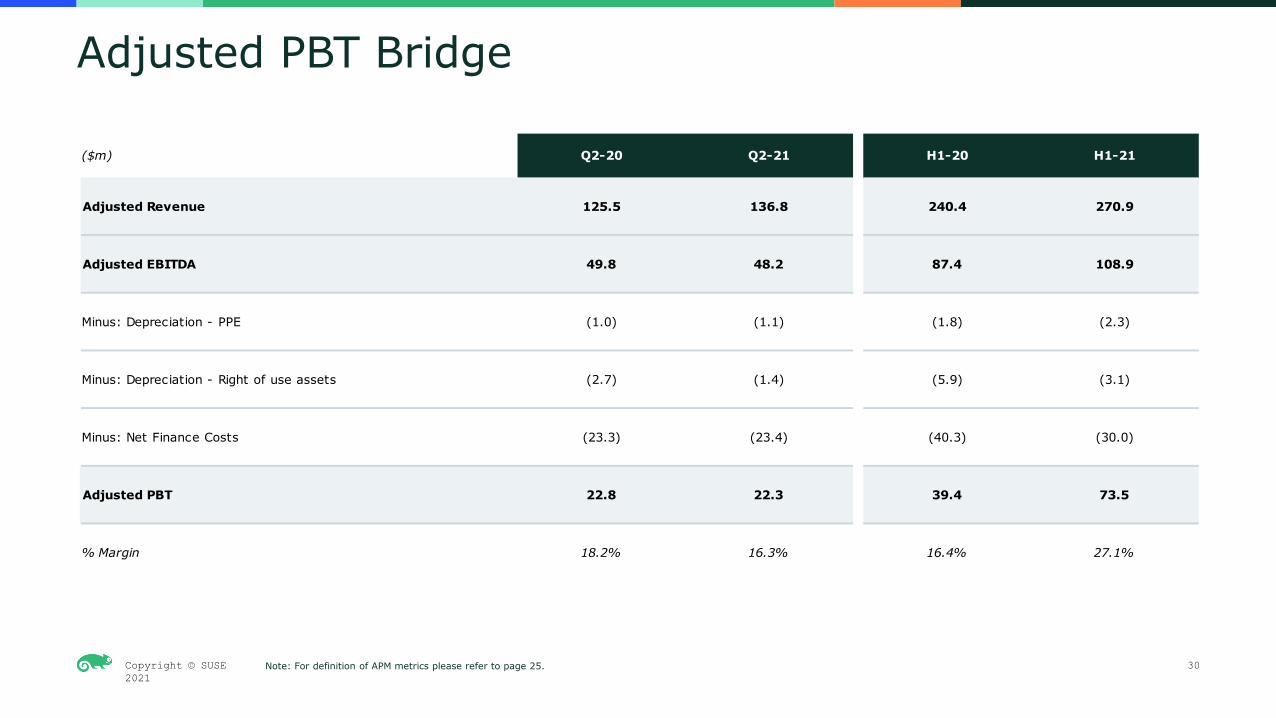
Adjusted PBT Bridge
Note: For definition of APM metrics please refer to page 25.
($m) Q2-20 Q2-21 H1-20 H1-21
Adjusted Revenue 125.5 136.8 240.4 270.9
Adjusted EBITDA 49.8 48.2 87.4 108.9
Minus: Depreciation - PPE (1.0) (1.1) (1.8) (2.3)
Minus: Depreciation - Right of use assets (2.7) (1.4) (5.9) (3.1)
Minus: Net Finance Costs (23.3) (23.4) (40.3) (30.0)
Adjusted PBT 22.8 22.3 39.4 73.5
% Margin 18.2% 16.3% 16.4% 27.1%

Copyright © SUSE 2021
31Note: For definition of APM metrics please refer to page 25.(1) Cash flow items below Adjusted Cash EBITDA are presented on a statutory basis, and hence H1-21 figures include only 5 months of Rancher, and H1-20 and Q2-21 include no impact from Rancher. Adjustment reflects the combined impact of the missing Rancher contribution relating to capex, other working capital items, reversal of IFRS 15 and 16, cash taxes and other.
Adjusted Unlevered FCF Bridge
($m) Q2-20 Q2-21 H1-20 H1-21
Adjusted Cash EBITDA 59.2 54.4 115.1 161.5
Minus: Capex (0.3) (0.4) (1.0) (0.8)
Plus: Other Working Capital (excl. Def Revenue) 19.3 24.1 4.7 (27.6)
Minus: IFRS 15 (4.3) (7.3) (9.3) (17.3)
Minus: IFRS 16 (3.0) (1.6) (6.3) (3.6)
Minus: Cash Tax (1.9) (1.6) (3.4) (4.0)
Plus: Rancher Impact(1) (2.3) - (4.2) (1.8)
Adjusted uFCF 66.7 67.6 95.6 106.4

Copyright © SUSE 2021
Thank you