Pumping back to profitability CMP: INR 167 - Edelweiss · 1 Edel Invest Research Pumping back to...
16
1 Edel Invest Research Pumping back to profitability CMP: INR 167 Edel Invest Research Not Rated Kirloskar Brothers Ltd: Visit Report We recently met the senior management of Kirloskar Brothers Ltd (KBL), the largest pump manufacturer in India with 14% market share in the domestic organized pump industry. At the consolidated level, the company’s turnover remained flat between FY12 and FY16, but the proportion of international business increased from 21% in FY12 to 31% in FY16. In the domestic business as well, the revenue composition changed significantly from Project business to Product business. KBL has a dominant market share in small and medium sized pumps - used in Agriculture and Domestic Housing. The management is looking to strengthen this dominance through tripling of its industry-leading retail selling points over the next 3-4 years. Strong focus on the Product business and declining exposure to the Project business are expected to improve the company’s profitability, de-leverage the balance sheet and improve cash flows in the domestic operation going forward. Internationally, the company is diversifying the business, both vertically and horizontally, to achieve higher growth and improved profitability. At the CMP of INR 167, the stock is trading at P/S of 0.5x and P/BV of 1.4x on FY16 basis. KBL transforming domestic business model from Project-driven to Product-driven During FY05-09, KBL had aggressively acquired projects in Irrigation and Water Supply to diversify its core operations. But, due to economic slowdown and political instability in some states, projects got delayed or cancelled, affecting the company’s revenue and margins, besides resulting in a bloated balance sheet. Post FY09, the company realigned its focus on scaling up the Products business, with its share in standalone revenue rising from 43% to 76% during FY09-16. The Projects business’ executable order backlog has declined from INR 2,500 cr in FY11 to INR 1,100 cr in FY16. KBL has put a lot of efforts to execute the stuck projects, which is reflected in consistent revenue and closure of various projects. In a period when the Government is aggressively focusing on replacing inefficient pumps in the Agriculture space and increase spending on Irrigation and Water Management, KBL’s revived focus on pump manufacturing and supply business is expected to lift revenue growth and improve the margin performance. International business – Diversifying exposure and focus on increasing profitability KBL grew the international business, both organically and inorganically, across different geographies. The company’s International business (predominantly Products) has grown at a CAGR of 16.3% over FY10-15. But, a sharp fall in crude oil prices hurt the international business in FY16 (30% revenue from Oil & Gas). Under the leadership of Mr. Alok Kirloskar, the company is diversifying the international business into different industries (Onshore Exploration, Desalination and Downstream Petrochemicals) and varied geographies (USA, South Africa, South-East Asia). KBL is also looking to expand its Spares & Services business in the international market to derive higher profitability and annuity income. Valuation At the CMP of INR 167, the stock is trading at P/S of 0.5x and P/BV of 1.4x on FY16 basis. During the capex cycle of 2003-08, as a focused products company, KBL had posted peak EBIDTA margin and RoCE of 16% and 48% respectively in FY06 while trading at an average 1-year forward PE multiple of 23x. We believe that as KBL transforms from a Projects company to a Products player, the margins and returns ratios are likely to trend towards the peak of FY06. Financial highlights (Consolidated) Year to March FY12 FY13 FY14 FY15 FY16 Revenues (INR Cr) 2,554 2,612 2,690 2,728 2,594 Rev growth (%) (4.3) 2.3 3.0 1.4 (4.9) EBITDA (INR Cr) 135 200 199 190 65 PAT (INR Cr) 63.9 59.5 60.0 44.4 -32.6 EPS (INR) 6.4 8.3 8.2 5.6 -4.1 EPS growth (%) (48.2) 30.0 (0.6) (32.2) NA P/E (x) 26.2 20.1 20.3 29.9 NA P/B (x) 1.5 1.4 1.3 1.3 1.4 RoACE (%) 7.0 11.6 11.1 7.2 -0.9 RoAE (%) 5.8 7.3 6.8 4.5 -3.2 Salil Utagi Research Analyst +91 (22) 4272 2319 [email protected] Debashish Mazumdar Research Analyst +91 (22) 4088 5819 [email protected] Bloomberg: KKB:IN 52-week range (INR): 198 / 113 Share in issue (Crs): 7.95 M cap (INR crs): 1,326 Avg. Daily Vol. BSE/NSE :(‘000): 143.6 SHARE HOLDING PATTERN (%) Date: 9th December, 2016 Promoter, 65.4 Public, 34.6 40 50 60 70 80 90 100 110 120 Jan-15 Mar-15 May-15 Jul-15 Sep-15 Nov-15 Jan-16 Mar-16 May-16 Jul-16 Sep-16 Nov-16 KBL Sensex
Transcript of Pumping back to profitability CMP: INR 167 - Edelweiss · 1 Edel Invest Research Pumping back to...
1 Edel Invest Research
Pumping back to profitability CMP: INR 167
Edel Invest Research Not Rated
Kirloskar Brothers Ltd: Visit Report
We recently met the senior management of Kirloskar Brothers Ltd (KBL), the largest pump manufacturer in India with 14% market share in the domestic organized pump industry. At the consolidated level, the company’s turnover remained flat between FY12 and FY16, but the proportion of international business increased from 21% in FY12 to 31% in FY16. In the domestic business as well, the revenue composition changed significantly from Project business to Product business. KBL has a dominant market share in small and medium sized pumps - used in Agriculture and Domestic Housing. The management is looking to strengthen this dominance through tripling of its industry-leading retail selling points over the next 3-4 years. Strong focus on the Product business and declining exposure to the Project business are expected to improve the company’s profitability, de-leverage the balance sheet and improve cash flows in the domestic operation going forward. Internationally, the company is diversifying the business, both vertically and horizontally, to achieve higher growth and improved profitability. At the CMP of INR 167, the stock is trading at P/S of 0.5x and P/BV of 1.4x on FY16 basis. KBL transforming domestic business model from Project-driven to Product-driven During FY05-09, KBL had aggressively acquired projects in Irrigation and Water Supply to diversify its core operations. But, due to economic slowdown and political instability in some states, projects got delayed or cancelled, affecting the company’s revenue and margins, besides resulting in a bloated balance sheet. Post FY09, the company realigned its focus on scaling up the Products business, with its share in standalone revenue rising from 43% to 76% during FY09-16. The Projects business’ executable order backlog has declined from INR 2,500 cr in FY11 to INR 1,100 cr in FY16. KBL has put a lot of efforts to execute the stuck projects, which is reflected in consistent revenue and closure of various projects. In a period when the Government is aggressively focusing on replacing inefficient pumps in the Agriculture space and increase spending on Irrigation and Water Management, KBL’s revived focus on pump manufacturing and supply business is expected to lift revenue growth and improve the margin performance. International business – Diversifying exposure and focus on increasing profitability KBL grew the international business, both organically and inorganically, across different geographies. The company’s International business (predominantly Products) has grown at a CAGR of 16.3% over FY10-15. But, a sharp fall in crude oil prices hurt the international business in FY16 (30% revenue from Oil & Gas). Under the leadership of Mr. Alok Kirloskar, the company is diversifying the international business into different industries (Onshore Exploration, Desalination and Downstream Petrochemicals) and varied geographies (USA, South Africa, South-East Asia). KBL is also looking to expand its Spares & Services business in the international market to derive higher profitability and annuity income. Valuation
At the CMP of INR 167, the stock is trading at P/S of 0.5x and P/BV of 1.4x on FY16 basis. During the capex cycle of 2003-08, as a focused products company, KBL had posted peak EBIDTA margin and RoCE of 16% and 48% respectively in FY06 while trading at an average 1-year forward PE multiple of 23x. We believe that as KBL transforms from a Projects company to a Products player, the margins and returns ratios are likely to trend towards the peak of FY06.
Financial highlights (Consolidated)
Year to March FY12 FY13 FY14 FY15 FY16
Revenues (INR Cr) 2,554 2,612 2,690 2,728 2,594
Rev growth (%) (4.3) 2.3 3.0 1.4 (4.9)
EBITDA (INR Cr) 135 200 199 190 65
PAT (INR Cr) 63.9 59.5 60.0 44.4 -32.6
EPS (INR) 6.4 8.3 8.2 5.6 -4.1
EPS growth (%) (48.2) 30.0 (0.6) (32.2) NA
P/E (x) 26.2 20.1 20.3 29.9 NA
P/B (x) 1.5 1.4 1.3 1.3 1.4
RoACE (%) 7.0 11.6 11.1 7.2 -0.9
RoAE (%) 5.8 7.3 6.8 4.5 -3.2
Salil Utagi Research Analyst +91 (22) 4272 2319 [email protected] Debashish Mazumdar Research Analyst +91 (22) 4088 5819 [email protected]
Bloomberg: KKB:IN
52-week range (INR): 198 / 113
Share in issue (Crs): 7.95
M cap (INR crs): 1,326
Avg. Daily Vol. BSE/NSE
:(‘000): 143.6
SHARE HOLDING PATTERN (%)
Date: 9th December, 2016
Promoter, 65.4
Public, 34.6
40
50
60
70
80
90
100
110
120
Jan
-15
Mar
-15
May
-15
Jul-
15
Sep
-15
No
v-1
5
Jan
-16
Mar
-16
May
-16
Jul-
16
Sep
-16
No
v-1
6
KBL Sensex
Kirloskar Brothers Ltd
2 Edel Invest Research
I. Kirloskar Brothers – A dominant pump manufacturer in India Global pumps market – growth muted due to Oil & Gas slump
The global pumps market has grown at a CAGR of 4% over 2006-15 from $33bn to $47bn, with a large part
of growth coming from China, India and the CIS countries. Growth has been lower due to the sharp fall in
crude oil prices, as the Oil & Gas sector contributes ~10% to the global pumps market.
According to the European Industrial Foundation (EIF), the pumps market is expected to grow by 3.5%
during 2015-20. Ggrowth would be driven by investments in Irrigation, Water & Water Resource Projects,
Sewage and Power Capacity additions in developing countries. The developed countries are expected to
spend on Municipal Water, Nuclear Power, Fire & HVAC Packages and Commercial Establishments.
Source: EIF, Edel Invest Research.
Indian pumps market – Growing at a faster pace; Organised players consolidating position
EIF as well as the Indian Pump Manufacturers Assocation (IPMA) estimate that the organised pump market
in India in 2016 was valued at around INR 11,178 cr and is expected to reach approximately INR 14,255 cr in
2020E, growing at a CAGR of 6.3%. The organised pumps market in India is represented by over 300 players,
with the top 10 accounting for 45% of the overall pie. Over and above the organized market, the value of
the unorganized market (more than 600 players) and imports is ~INR 9,000 cr. Over the period FY09-16,
share of organised market has grown from 35% to 55% respectively.
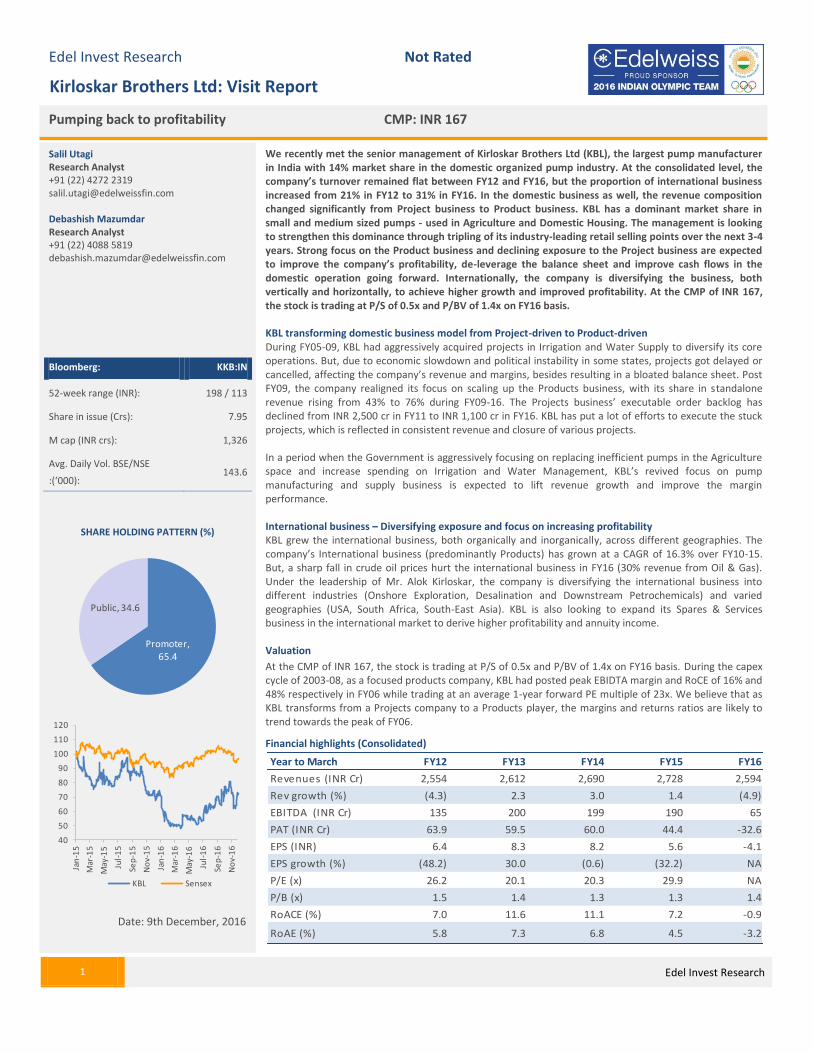
Sector composition - By user industry Organised sector - Market share
Source: Edel Invest Research.
** includes product content in projects
Western Europe
27%
Americas 21% Asia
27%
Others 25%
World Pump Market 2006 - $33bn
Western Europe
19%
Americas 23%
Asia 40%
Others 18%
World pump market 2015-$47bn
Agri-culture 27.0%
Building Services 19.0%
Water & Waste Water 17.0%
Power Gener-ation 12.0%
Oil & Gas 8.0%
Metal & Mining 4.0%
Others 13.0%
Kirloskar Bros
(Stnd) 13.6%**
CRI 10.9%
Crompton Consumer
6.5%
KSB Pumps 7.7%
Sulzer 5.3%
Texmo 4.5%
Grundfos 3.7%
Shakti 2.5%
WPIL (Stnd) 2.0%
Other organised
players (45%

Kirloskar Brothers Ltd
3 Edel Invest Research
KBL - Consolidating leadership position in domestic pumps market KBL, the largest pumps manufacturer in India, has expanded its Products market share from 9% in FY10 to
14% in FY16 in the domestic organized products market. The company is also transforming its model from
Projects-centric one (57% of revenue in FY09) to a Products-centric company (75% of revenue in FY16) in the
domestic market. In the international market, KBL has grown inorganically in different geographies as a
Products player, specializing in Engineered Pumps and Services.
KBL Organization Structure
*- Revenue numbers are on gross levels (before inter-segmental)
During FY10-16, KBL’s consolidated revenue remained flat, with a CAGR of only 0.7%, with growth impacted
by overall economic slowdown and delay in large projects. However, the composition of revenue has
changed during FY10-16, wherein the international business has grown from INR 459 cr in FY10 (16% of
revenue) to INR 873 cr in FY16 (31% of revenue). During FY10-16, the company’s net profit slumped from a
high of INR 146 cr in FY10 to a loss of INR 7 cr in FY16, as projects faced execution issues with huge cost
over-runs and lower oil prices post FY15 led to the curtailment of the global Oil & Gas related capex.
Revenue composition - International operations growing in size Profitability deteriorates due to project cost over-runs and slowdown in Oil & Gas capex
*-revenue nos are before intersegmental ,
*-profits are before intra group transactions and share of assoc/minority interest
Source: Compnay data, Edel Invest Research.
Kirloskar Brothers Ltd
(INR 2994cr)
Kirloskar Brothers
International BV
(100%) (INR 873cr)
SPP(UK)
KirloskarPompen
SPP MENA(Egypt)
KirloskarBrothers
Thailand Ltd
KirloskarBrothers
Africa (PT)
SPP(US)
Syncroflow
Rodelta
SPP(South Africa)
Breybar(Mining)
Karad Project
(100%) (Rs263cr)
Kolhapur Steel
(96% )(INR 39cr)
Kirloskar Systech
(100%)(INR 22cr)
Kirloskar
Corrocoat
(65%)(INR 46cr)
KirloskarEbara(45 %)
(INR 71cr)
KBL- Standalone
(INR 1680cr) Subsidiaries
Joint Ventures
2,066 1,955 1,828 1,879 1,765 1,637 1,680
459 411 591 658 882
975 873
339 502 430 356 303 445 441
0%
20%
40%
60%
80%
100%
FY10 FY11 FY12 FY13 FY14 FY15 FY16
kirloskar Bros - Standalone Kirloskar Brs International BV
Indian Subsidiaries+JV
2,86 2,868 2,849 2,893 2,950 3,057 2,994
118 61 31 43 48
8 12
10 16 31 31
37
36
(15)
18 23
(1) (6) (19)
13
(4) -80%
-60%
-40%
-20%
0%
20%
40%
60%
80%
100%
FY10 FY11 FY12 FY13 FY14 FY15 FY16
kirloskar Bros - Standalone Kirloskar Brs International BV
Indian Subsidiaries+JV
146 100 61 68 66 57 -7

Kirloskar Brothers Ltd
4 Edel Invest Research
II. KBL transforming from Projects driven to Products driven in domestic market KBL is rebuilding the Products business
During FY05-09, KBL had aggressively acquired projects in Irrigation and Water Supply, diversifying away
from its core business, reaching a peak order book of ~INR 3,000 cr in FY09. Economic slowdown post 2008
and political instability in Andhra Pradesh after the demise of erstwhile Chief Minister Mr xyz put the
company’s entire irrigation project portfolio at risk. Some of the projects from Andhra Pradesh never took
off while most of them faced inordinate delays due to lack of leadership, exacerbated by the formation of
the new state of Telangana.
Post FY09, KBL has realigned its focus on scaling up the Products business (which is inherently a high-margin
business), with its market share expanding from 7-8% in FY09 to 14% in FY16. The Products business’ share
in standalone revenue increased from 43% in FY09 to 76% in FY16 through sustained investments in
capacities, strong R&D capabilities, large distribution network and brand building.
Products business contributed 76% to domestic revenue in FY16 vs 43% in FY09
Source: Company data, Edel Invest Research.
Current order book and order inflow - conscious shift from Projects to Products visible
Domestic order booking has been going from strength to strength; from INR 1,485 cr in FY13, the company
booked orders worth INR 1,925 cr in FY16. The Products portfolio accounts for as much as 80% of orders
booked while the Projects orders also contain limited scope of civil work and a higher proportion of orders
for pumps.
Domestic order inflow – Standard pumps witnessing strong traction
Source:Company data, Edel Invest Research.
787 993 1129 871 1079 1002
1124 1229
1043 954 748 871 776 721 478 403
0%
20%
40%
60%
80%
100%
FY09 FY10 FY11 FY12 FY13 FY14 FY15 FY16
Products Segment Projects Segment
1830 1947 1878 1742 1855 1723 1602 1632
1485 1359 1646
1925
1127 966
1322 1309
745
162
2451 2681
2955 2670
1289
FY13 FY14 FY15 FY16 H1FY17
(IN
R C
r)
Standalone Subsidiaries Consolidated

Kirloskar Brothers Ltd
5 Edel Invest Research
Despite industrial slowdown, the Products segment’s order book has been in the range of INR 300 – 400 cr
per year over the last few years. Order book in the Projects business in FY16 was INR 1,140 cr, a significant
drop from INR 2,773 cr in FY11. Around 70% of the current projects order book is from pre-2009 era, when
KBL had completed a good part of civil work, and hence it is unlikely to hurt margins materially. Current
executable orders of INR 1100 cr are likely to have product content of over 40%. With slower additions to
the order backlog, the contribution of the Projects business should fall to 10-12% in the next 3-4 years.
Products business order book steadily improving Projects business order book scaling down
Source:Company data, Edel Invest Research.
Out of the total order backlog, KBL has kept few orders where work has not yet started (INR 324 cr) and
where clients have asked it to stop work (INR 234 cr). The company has spent negligible amount for the
latter two categories, which even if not started, doesn’t affect the company’s balance sheet in an adverse
manner.
Domestic pumps industry at the cusp of recovery and KBL will be a major benefeciary
a) Agriculture: EESL driven demand could be a game changer for the industry
Agriculture accounts for 18% of India’s total electricity consumption, as majority pumps installed on farms
are highly inefficient (working at 20% efficiency). With the Government giving priority to higher efficiencies
and cost savings, EESL has outlined plans to replace all the 2 crore pumps installed on the Indian farms with
a total investment of INR 70,952 cr.
EESL targeting to double energy efficiency of pumps Investments envisaged INR 71,000 cr
Particulars Unit Value
Total No. of pump sets installed in Agri. Sector
Million Nos. 20.27
Average saving potential per pump (%) 25
Average annual consumption per pump
kWh/pump/year 9000
Average annual saving potential per pump
kWh/pump/year 2250
Total Energy Saving (PAN) India BU/year 46
SouSourcSsssSe: SSrce: Edel Invest Research. Source: EESL document, Edel Invest Research
0
100
200
300
400
FY11 FY12 FY13 FY14 FY15 FY16 H1FY17
INR
cr
Oil&Gas Marine&Defense
Industry Building Construction
KOV Distribution Customer Support & Spare
Valves Export Excellence Cell
1421 1310 1149 1026 747 776 661
376 243
218 178 189 196 189
976
616 521
275 324 280 275
234 395 395 324
FY11 FY12 FY13 FY14 FY15 FY16 H1FY17
(IN
R C
r)
Irrigation Water Resource Mgmt
Power Work kept on hold
Work not started
Particulars Unit Value
Total No. of pump sets installed in Agri. Sector
Million Nos. 20.27
Average cost of pump sets (incl panels & warranty)
INR./pump 35,000
Total Investment envisaged INR (crore) 70,952
Total annual project benefit (DISCOM and Govt.) @ Rs. 4.50 / unit
INR (crore) 20,526

Kirloskar Brothers Ltd
6 Edel Invest Research
b) Building services & drinking water resources/treatment, urbanisation and pollution control to drive
pumps demand
The Government has envisaged a capital expenditure of INR 80,000 cr during FY16-20E to bring 16.7 million
hectares under irrigation, including canal and drip irrigation. This may alone create INR 10,000 cr
opportunity for the pumps industtry. Our estimates suggest that the untapped long-term irrigation potential
in top 8 states stands at 90.4 mn hectares, requiring an investment of INR 54 Lakh cr, leading to INR 54,000
cr opportunity for the industry.
The status of water treatment in India also remains critical, as 80% of the country’s surface water is polluted.
Domestic sewage, which is discharged untreated into local water bodies, is the cause for 75% of water
pollution.
Irrigation sector opportunity for small & large engineered pumps Waste water an opportunity for medium and large engineered pumps
Expected capex Opportunity during FY16-20E Expected capex Opportunity during FY16-20E
Bringing 16.7mn hectares under irrigation with a capex of INR 80,000 cr
INR 10,000cr Capex on waste water treatment – INR 50,000 cr
over FY16-20 INR 2,000 cr
Long-term potential for irrigation in top 8 states
INR 54,000cr
Source: industry, Edel Invest Research
The central government’s flagship projects of building 100 SMART Cities and the AMRUT scheme are likely to
open up opportunities for the pumps sector. Also, flagship projects to clean up the Ganga river and create
in-land waterways by inter-connecting rivers are likely to result in several opportunities for the pumps
sector.
Opportunity for small pumps under flagship housing schemes Opportunity for engineered pumps under Namani Gange & In-land
waterways
Expected capex Opportunity during FY16-20E Expected capex Opportunity during FY16-20E
INR48,000 cr to be spent on building 100 Smart Cities
INR 2400 cr
Namami Gange Project – INR 50,000 cr INR 1,000 cr
INR 50,000 cr to build 500 cities under AMRUT
INR 2500 cr Long-term investments planned in Inland Waterways
Project – INR 250,000 cr INR 2,500 cr
Source: industry, Edel Invest Research
c) Industrial Sector – Initial signs of recovery visilble in few secotrs
Currently, the Industrial sector, including Power and Oil & Gas, is not in an expansion mode. However, there
are few industries which are spending on Greenfield capacities, viz Sugar, Chemical, Paper and Pharma,
opening up incremental opportunities for the pumps sector.

Kirloskar Brothers Ltd
7 Edel Invest Research
Strong focus on product business is expected to drive margin performance in domestic business
During the previous capex cycle of FY02-08, KBL was predominantly a products company, having EBIDTA
margin of 8-13%, with peak margins of 13.3% in FY06. Aggressive addition in the Projects business impacted
the margin performance of the company. During FY11-16, the company wrote off debt of INR 205 cr,
appointed consulting companies for restructuring (~INR 18 cr) and invested ~INR 40 cr in integrating all the
facilities with planning, procurement and sales functions through robust IT systems.
As the company made sustained efforts to increase the contribution of its Products business, raw material
cost has gradually reduced from 70.9% in FY10 (Products business at 51% of sales) to 59.4% in FY16
(Products business accounting for 76% of revenues). Taking into consideration the higher contribution of the
Products business, lower provisioning and zero one-time restructuring expenses, EBIDTA margins are
expected to be trending closer to 10% in the near future.
Gross margin improves; EBITDA margin impacted by Projects business write-offs and one-time charges
Source: Company data, Edel Invest Research.
8.0%
13.3%
12.0%
9.8%
6.8%
9.8%
8.4%
4.0%
7.8% 7.9%
5.2%
3.5%
63.1% 70.9%
59.4%
8.8% 4.4% 11.0%
19.9% 14.9%
26.1%
0%
2%
4%
6%
8%
10%
12%
14%
0%
10%
20%
30%
40%
50%
60%
70%
80%
FY05 FY06 FY07 FY08 FY09 FY10 FY11 FY12 FY13 FY14 FY15 FY16
EBITDA margin (%)(RHS) RM cost as % of sales
Empl cost as % of sales Other expenses as % of sales

Kirloskar Brothers Ltd
8 Edel Invest Research
III. International business – Diversifying exposure and focus on increasing profitability Kirloskar Brothers International BV, which is a holding company for KBL’s international businesses, grew at a
CAGR of 16.3% during FY10-15 to INR 975 cr on the back of entry into newer markets, growth in core
business and inorganic growth through acquisitions in different geographies. But, due to a sharp fall in crude
prices, the company’s international business got affected, as 30% of the company’s revenue was coming
from the Oil & Gas sector. The international business is a reasonably profitable business, with ~10%
operating margins. But, as KBL has been making acquisitions of sick companies, the losses from these
acquired companies have been pulling down the overall margins.
Under the leadership of Mr. Alok Kirloskar, KBL is diversifying the international business into different
industries (Onshore Exploration, Desalination and Downstream Petrochemicals) and varied geographies
(USA, South Africa, South-East Asia). KBL is also looking to expand its Spares & Services business in the
international market to derive higher profitability and annuity income.
Source: Company data, Edel Invest Research.
Source: Company Data, Edel Invest Research.
459 411
591 658
882 975
873
10 16 31 31 37 36
(15) FY10 FY11 FY12 FY13 FY14 FY15 FY16
(IN
R C
r)
International business - Decent growth in revenues but profitability subdued
Total Income PAT
UK, 76.4%
USA, 15.0%
South Africa, 5.3%
Thailand, 3.3%
International Business - Region Wise (FY16)
966
1322 1309
745
162
536 570
401
729
892
FY13 FY14 FY15 FY16 H1FY17
(IN
R C
r)
Orders impacted by lower O&G capex
Orders received Order backlog
Company Year of
Acquisition
SPP Pumps, UK 2002
Aban Constructions, India
2006
Kolhapur Steel, India
2007
Braybar Pumps, Africa
2010
Syncroflo,USA 2014
Rodelta,Netherlands 2015
Kirloskar Brothers Ltd
9 Edel Invest Research
IV. Stress on BS expected to ease as projects move to closure stage Despite the Projects business dragging down profitability and stretching the execution cycle, KBL has
managed to limit stress on the net working capital and has reduced debt-to-equity (D/E) below 0.3x. The
existing debt of INR 255 cr on a standalone basis is entirely related to the Projects business and is expected
to gradually reduce to zero, as the Projects business’ contribution falls in the overall revenue.
In the past 4-5 years, project execution has also picked up pace, with a few even achieving 100%
completion. Increase in retention money (current level of INR 400 cr) as a proportion of total debtors and
other current assets from the lows of 27% in FY12 to the current levels of ~57% (H1FY17) is an indicator of
traction in execution, with the possibility of recovering the entire retention money of INR 400 cr in the next
3-4 years.
With strong growth in Products business, the working capital cycle will improve significantly, while
execution of stuck projects will free up further capital, thereby reducing the stress on the company’s
balance sheet materially.
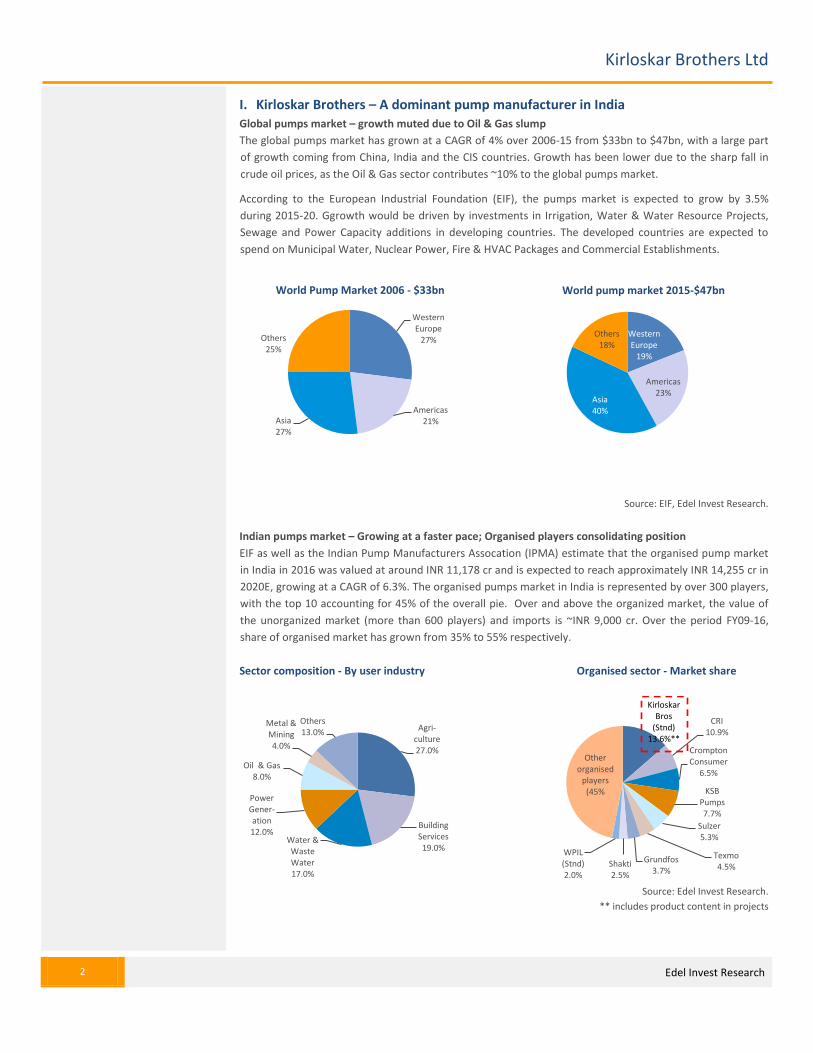
Standalone D/E and NWC remain in control High retention with Govt – Hoping to recover in 3-4 years
Source: Edel Invest Research.
Despite the Projects business being a drag on KBL’s working capital, it has managed to maintain the NWC
cycle (Debtors + Inventory + Retention – Payables) at a respectable level of 94 days. Leaner operations and
decision to work on orders with favourable payment terms have resulted in a tight control over investments
in working capital. Being the largest player in the pumps market, KBL has been able to get favourable terms
when it comes to payment to suppliers.
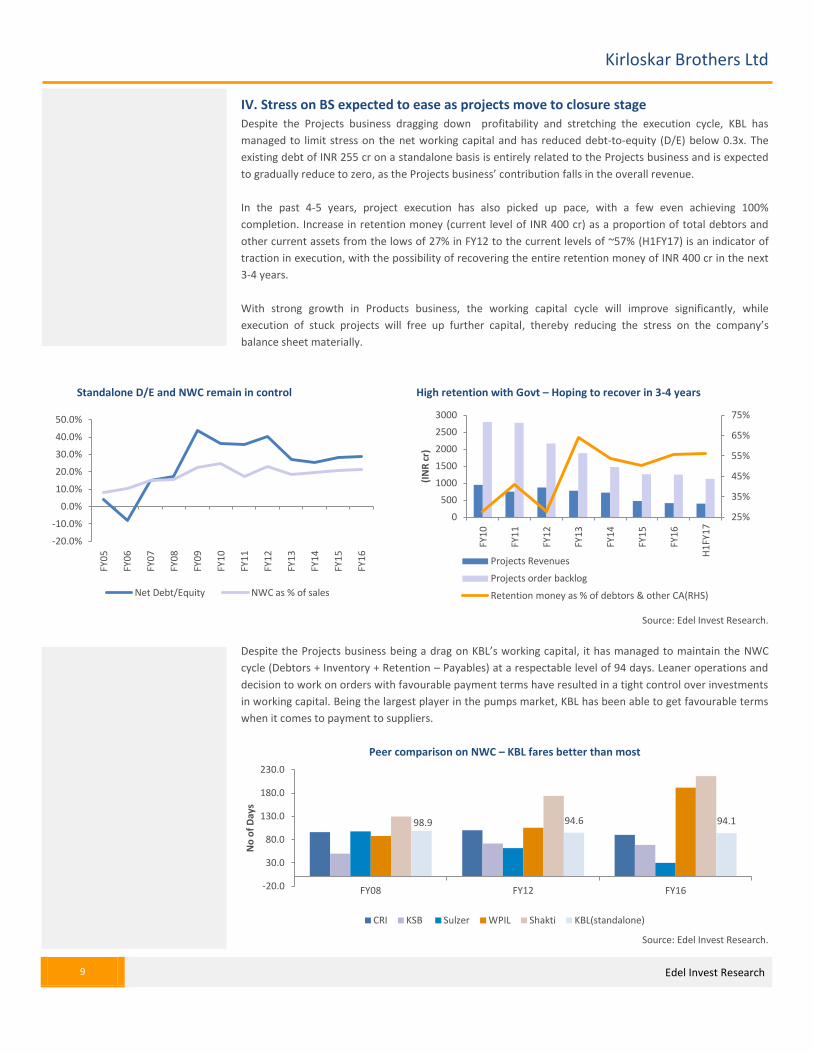
Peer comparison on NWC – KBL fares better than most
Source: Edel Invest Research.
-20.0%
-10.0%
0.0%
10.0%
20.0%
30.0%
40.0%
50.0%
FY0
5
FY0
6
FY0
7
FY0
8
FY0
9
FY1
0
FY1
1
FY1
2
FY1
3
FY1
4
FY1
5
FY1
6
Net Debt/Equity NWC as % of sales
25%
35%
45%
55%
65%
75%
0
500
1000
1500
2000
2500
3000
FY1
0
FY1
1
FY1
2
FY1
3
FY1
4
FY1
5
FY1
6
H1
FY1
7
(IN
R c
r)
Projects Revenues
Projects order backlog
Retention money as % of debtors & other CA(RHS)
98.9 94.6 94.1
-20.0
30.0
80.0
130.0
180.0
230.0
FY08 FY12 FY16
No
of
Day
s
CRI KSB Sulzer WPIL Shakti KBL(standalone)

Kirloskar Brothers Ltd
10 Edel Invest Research
Company Description KBL is a world-class pumps manufacturing company with expertise in engineering and manufacture of
systems for fluid management. Established in 1888 and incorporated in 1920, KBL is the flagship company of
the US$ 2.1 billion Kirloskar Group. KBL, a market leader, provides complete fluid management solutions for
large infrastructure projects in the areas of Water Supply, Power Plants, Irrigation, Oil & Gas and Marine and
Defence. KBL engineers and manufactures Pumps (Industrial, Agriculture and Domestic), Valves and Hydro
Turbines. KBL also undertakes turnkey projects in large irrigation and infra projects involving design/system
engineering, product supply and site erection, besides various other services involved in a large project.
In 2003, KBL acquired SPP Pumps in the UK and eventually established subsidiary operations in USA,
Netherlands and Thailand. In 2008, KBL incorporated Kirloskar Brothers Europe B.V. (Kirloskar Pompen B.V.
since June 2014), a joint venture (JV) between Kirloskar International B.V. and Industrial Pump Group, The
Netherlands. In 2010, KBL further consolidated its global position by acquiring Braybar Pumps, South Africa.
SPP MENA was established in Egypt in 2012. In 2014, KBL acquired SyncroFlo Inc., the largest independent
fabricator of commercial and municipal domestic water booster pumps in USA.
Locations of Facilities
Landmark Orders Received and Executed
Domestic Market International Market
Client Description
Mumbai International Airport - T2 Terminal 27 pumps for the maintenance systems at the airport
Gujarat International Finance Tec-City (GIFT) 12 pumps for its district cooling systems
Sardar Sarovar Narmada Nigam Ltd (SSNNL)
KBL’s concrete volute pumps and vertical turbine pumps support the world’s largest pumping system
Nuclear Power Corporation of India Ltd Sodium liquid pump
Coastal Gujarat Power Ltd. (CGPL) KBL’s 10 concrete volute pumps supports world’s largest circulating water system
Bharat Petroleum Corporation Ltd, Mahul-Mumbai ST pump of KEPL supplied in 1989, which is still running satisfactorily
Reliance Industries Ltd Hazira-Gujarat KBL pumps used for French water application
Client Description
Saudi Aramco Base Oil Company (Luberef)- Saudi Arabia
High speed & high pressure API BB5 pumps
Calik Enerji, Turkey 230 Megawatt Gardabani Combined Cycle Power Plant project
Toshiba, Philippines
CW Pump-sets in special material of construction for sea water application to Toshiba for Thermal Power Project
Hyundai Engg, UAE Boiler feed pumps and Condensate Extraction pumps
Kirloskar Brothers Ltd
11 Edel Invest Research
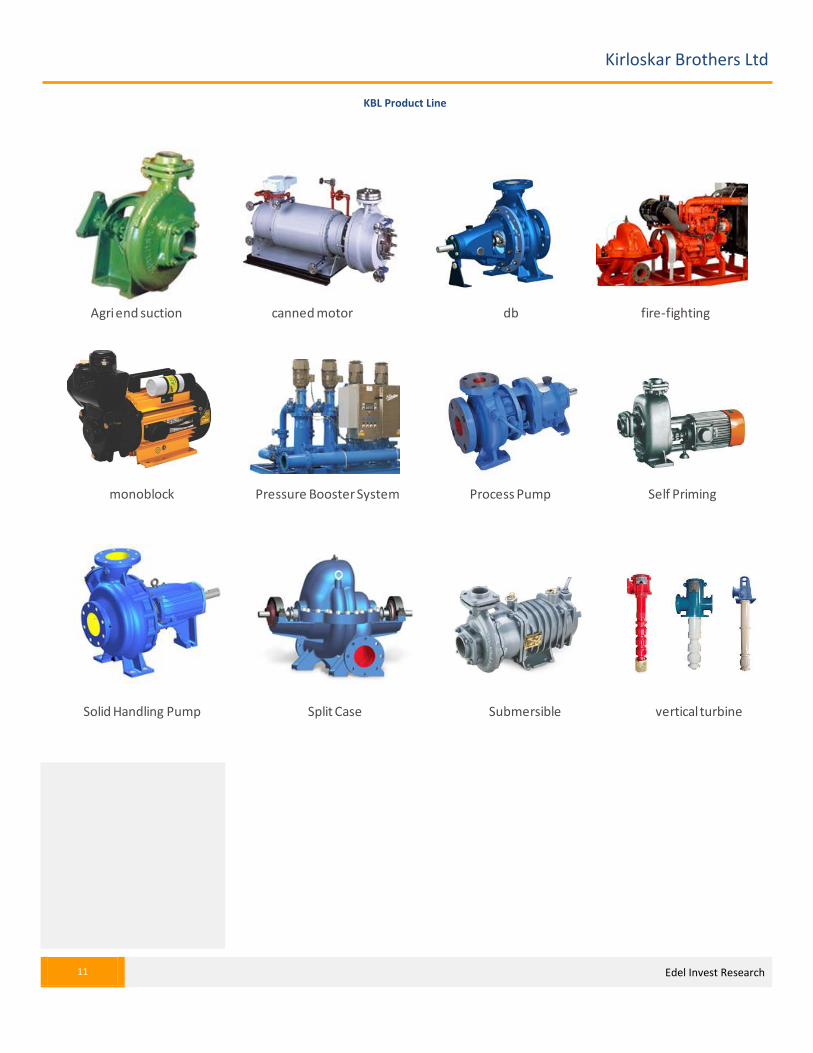
KBL Product Line
Agriend suction canned motor db fire-fighting
monoblock Pressure Booster System Process Pump Self Priming
Solid Handling Pump Split Case Submersible vertical turbine
Kirloskar Brothers Ltd
12 Edel Invest Research
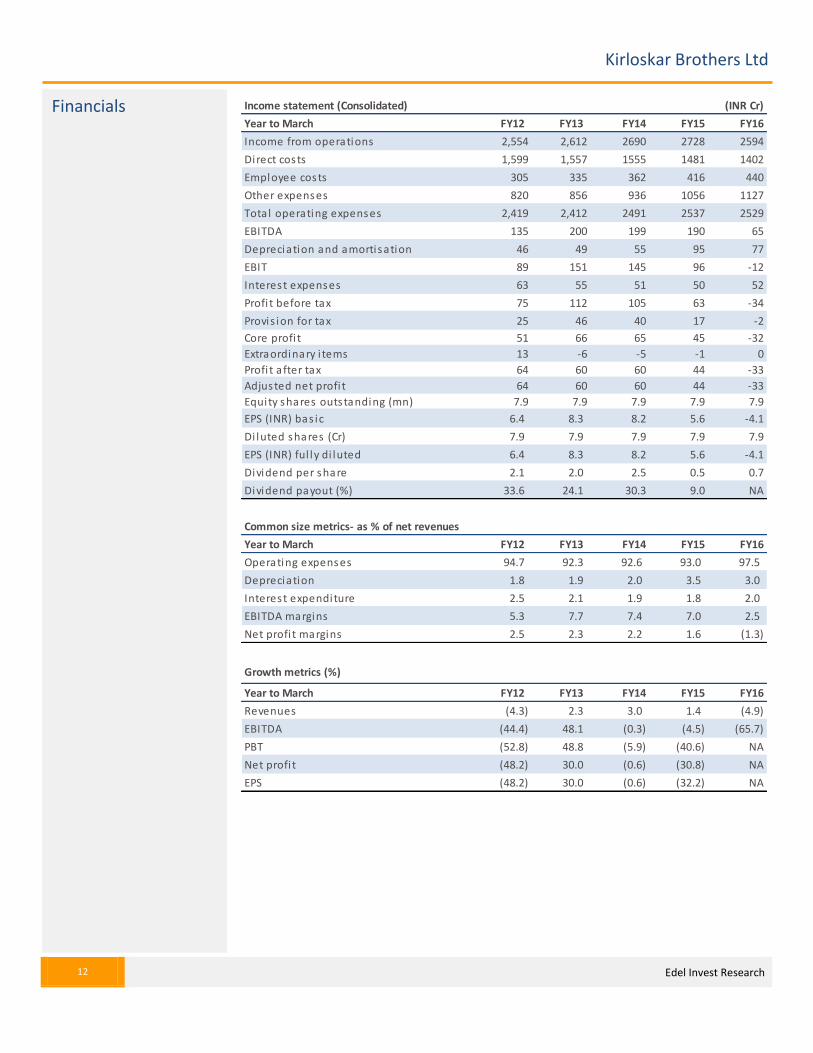
Income statement (Consolidated) (INR Cr)
Year to March FY12 FY13 FY14 FY15 FY16
Income from operations 2,554 2,612 2690 2728 2594
Direct costs 1,599 1,557 1555 1481 1402
Employee costs 305 335 362 416 440
Other expenses 820 856 936 1056 1127
Total operating expenses 2,419 2,412 2491 2537 2529
EBITDA 135 200 199 190 65
Depreciation and amortisation 46 49 55 95 77
EBIT 89 151 145 96 -12
Interest expenses 63 55 51 50 52
Profi t before tax 75 112 105 63 -34
Provis ion for tax 25 46 40 17 -2
Core profi t 51 66 65 45 -32
Extraordinary i tems 13 -6 -5 -1 0
Profi t after tax 64 60 60 44 -33
Adjusted net profi t 64 60 60 44 -33
Equity shares outstanding (mn) 7.9 7.9 7.9 7.9 7.9
EPS (INR) bas ic 6.4 8.3 8.2 5.6 -4.1
Di luted shares (Cr) 7.9 7.9 7.9 7.9 7.9
EPS (INR) ful ly di luted 6.4 8.3 8.2 5.6 -4.1
Dividend per share 2.1 2.0 2.5 0.5 0.7
Dividend payout (%) 33.6 24.1 30.3 9.0 NA
Common size metrics- as % of net revenues
Year to March FY12 FY13 FY14 FY15 FY16
Operating expenses 94.7 92.3 92.6 93.0 97.5
Depreciation 1.8 1.9 2.0 3.5 3.0
Interest expenditure 2.5 2.1 1.9 1.8 2.0
EBITDA margins 5.3 7.7 7.4 7.0 2.5
Net profi t margins 2.5 2.3 2.2 1.6 (1.3)
Growth metrics (%)
Year to March FY12 FY13 FY14 FY15 FY16
Revenues (4.3) 2.3 3.0 1.4 (4.9)
EBITDA (44.4) 48.1 (0.3) (4.5) (65.7)
PBT (52.8) 48.8 (5.9) (40.6) NA
Net profi t (48.2) 30.0 (0.6) (30.8) NA
EPS (48.2) 30.0 (0.6) (32.2) NA
Financials

Kirloskar Brothers Ltd
13 Edel Invest Research
Balance sheet (INR Cr)
As on 31st March FY12 FY13 FY14 FY15 FY16
Equity share capita l 16 16 16 16 16
Preference Share Capita l 0 0 0 0 0
Reserves & surplus 866 915 980 996 952
Shareholders funds 881 931 996 1,012 968
Secured loans 229 164 129 268 298
Unsecured loans 174 211 169 95 81
Borrowings 403 375 298 363 379
Minori ty interest 7 7 4 4 3
Sources of funds 1,292 1,313 1,298 1,378 1,350
Gross block 795 862 921 1,041 1,098
Depreciation 305 329 379 470 534
Net block 490 533 543 571 565
Capita l work in progress 43 17 10 12 7
Total fixed assets 533 550 553 583 572
Unreal ised profi t 0 0 0 0 0
Investments 2 4 12 0 0
Inventories 360 360 274 339 370
Sundry debtors 514 564 679 788 654
Cash and equiva lents 36 69 72 64 61
Loans and advances 704 634 712 568 570
Other current assets 0 0 0 0 0
Total current assets 1,614 1,628 1,737 1,758 1,656
Sundry creditors and others 911 927 1,093 1,059 962
Provis ions 68 60 67 58 70
Total CL & provis ions 979 987 1,161 1,117 1,033
Net current assets 635 641 577 641 624
Net Deferred tax -3 2 2 16 25
Misc expenditure 125 116 154 138 129
Uses of funds 1,292 1,313 1,298 1,378 1,350
Book va lue per share (INR) 111 117 125 127 122
Cash flow statement
Year to March FY12 FY13 FY14 FY15 FY16
Net profi t 51 66 71 46 -32
Add: Depreciation 46 49 55 95 77
Add: Misc expenses wri tten off 86 9 -39 17 8
Add: Deferred tax -5 -5 -0 -14 -9
Gross cash flow 178 119 87 143 45
Less : Changes in W. C. 150 -36 -67 72 -15
Operating cash flow 28 155 154 71 60
Less : Capex 63 66 58 125 66
Free cash flow -34 89 96 -54 -6

Kirloskar Brothers Ltd
14 Edel Invest Research
Ratios
Year to March FY12 FY13 FY14 FY15 FY16
ROAE (%) 5.8 7.3 6.8 4.5 -3.2
ROACE (%) 7.0 11.6 11.1 7.2 -0.9
Debtors (days) 73 79 92 105 92
Current ratio 1.6 1.6 1.5 1.6 1.6
Debt/Equity 0.5 0.4 0.3 0.4 0.4
Inventory (days) 51 50 37 45 52
Payable (days) 130 129 148 142 135
Cash convers ion cycle (days) -5 -0 -19 9 9
Debt/EBITDA 3.0 1.9 1.5 1.9 5.8
Adjusted debt/Equity 0.4 0.3 0.2 0.3 0.3
Valuation parameters
Year to March FY12 FY13 FY14 FY15 FY16
Di luted EPS (INR) 6.4 8.3 8.2 5.6 (4.1)
Y-o-Y growth (%) (48.2) 30.0 (0.6) (32.2) NA
CEPS (INR) 12.2 14.5 15 18 6
Di luted P/E (x) 26.2 20.1 20.3 29.9 NA
Price/BV(x) 1.5 1.4 1.3 1.3 1.4
EV/Sales (x) 0.7 0.6 0.6 0.6 0.6
EV/EBITDA (x) 12.5 8.2 7.8 8.5 25.2
Di luted shares O/S 7.9 7.9 7.9 7.9 7.9
Bas ic EPS 6.4 8.3 8.2 5.6 (4.1)
Bas ic PE (x) 26.2 20.1 20.3 29.9 NA
Dividend yield (%) 1.4 1.2 1.5 0.3 0.4

15 Edel Invest Research
Edelweiss Broking Limited, 1st Floor, Tower 3, Wing B, Kohinoor City Mall, Kohinoor City, Kirol Road, Kurla(W)
Board: (91-22) 4272 2200
Vinay Khattar
Head Research
Rating Expected to
Buy appreciate more than 15% over a 12-month period
Hold appreciate between 5-15% over a 12-month period
Reduce Return below 5% over a 12-month period
0
50
100
150
200
250
300
350
Jan
-12
Ap
r-1
2
Jul-
12
Oct
-12
Jan
-13
Ap
r-1
3
Jul-
13
Oct
-13
Jan
-14
Ap
r-1
4
Jul-
14
Oct
-14
Jan
-15
Ap
r-1
5
Jul-
15
Oct
-15
Jan
-16
Ap
r-1
6
Jul-
16
Oct
-16
Kirloskar Brothers 5 years price chart

Disclaimer
16 Edel Invest Research
Edelweiss Broking Limited (“EBL” or “Research Entity”) is regulated by the Securities and Exchange Board of India (“SEBI”) and is licensed to carry on the business of broking, depository services and related activities. The business of EBL and its
Associates (list available on www.edelweissfin.com) are organized around five broad business groups – Credit including Housing and SME Finance, Commodities, Financial Markets, Asset Management and Life Insurance.
Broking services offered by Edelweiss Broking Limited under SEBI Registration No.: INZ000005231; Name of the Compliance Officer: Mr. Dhirendra Rautela, Email ID: [email protected] Corporate Office: Edelweiss House,
Off CST Road, Kalina, Mumbai - 400098; Tel. (022) 4009 4400/ 4088 5757/4088 6278
This Report has been prepared by Edelweiss Broking Limited in the capacity of a Research Analyst having SEBI Registration No.INH000000172 and distributed as per SEBI (Research Analysts) Regulations 2014. This report does not constitute an
offer or solicitation for the purchase or sale of any financial instrument or as an official confirmation of any transaction. The information contained herein is from publicly available data or other sources believed to be reliable. This report is
provided for assistance only and is not intended to be and must not alone be taken as the basis for an investment decision. The user assumes the entire risk of any use made of this information. Each recipient of this report should make such
investigation as it deems necessary to arrive at an independent evaluation of an investment in the securities of companies referred to in this document (including the merits and risks involved), and should consult his own advisors to determine
the merits and risks of such investment. The investment discussed or views expressed may not be suitable for all investors.
This information is strictly confidential and is being furnished to you solely for your information. This information should not be reproduced or redistributed or passed on directly or indirectly in any form to any other person or published, copied,
in whole or in part, for any purpose. This report is not directed or intended for distribution to, or use by, any person or entity who is a citizen or resident of or located in any locality, state, country or other jurisdiction, where such distribution,
publication, availability or use would be contrary to law, regulation or which would subject EBL and associates / group companies to any registration or licensing requirements within such jurisdiction. The distribution of this report in certain
jurisdictions may be restricted by law, and persons in whose possession this report comes, should observe, any such restrictions. The information given in this report is as of the date of this report and there can be no assurance that future
results or events will be consistent with this information. This information is subject to change without any prior notice. EBL reserves the right to make modifications and alterations to this statement as may be required from time to time. EBL or
any of its associates / group companies shall not be in any way responsible for any loss or damage that may arise to any person from any inadvertent error in the information contained in this report. EBL is committed to providing independent
and transparent recommendation to its clients. Neither EBL nor any of its associates, group companies, directors, employees, agents or representatives shall be liable for any damages whether direct, indirect, special or consequential including
loss of revenue or lost profits that may arise from or in connection with the use of the information. Our proprietary trading and investment businesses may make investment decisions that are inconsistent with the recommendations expressed
herein. Past performance is not necessarily a guide to future performance .The disclosures of interest statements incorporated in this report are provided solely to enhance the transparency and should not be treated as endorsement of the
views expressed in the report. The information provided in these reports remains, unless otherwise stated, the copyright of EBL. All layout, design, original artwork, concepts and other Intellectual Properties, remains the property and copyright
of EBL and may not be used in any form or for any purpose whatsoever by any party without the express written permission of the copyright holders.
EBL shall not be liable for any delay or any other interruption which may occur in presenting the data due to any reason including network (Internet) reasons or snags in the system, break down of the system or any other equipment, server
breakdown, maintenance shutdown, breakdown of communication services or inability of the EBL to present the data. In no event shall EBL be liable for any damages, including without limitation direct or indirect, special, incidental, or
consequential damages, losses or expenses arising in connection with the data presented by the EBL through this report.
We offer our research services to clients as well as our prospects. Though this report is disseminated to all the customers simultaneously, not all customers may receive this report at the same time. We will not treat recipients as customers by
virtue of their receiving this report.
EBL and its associates, officer, directors, and employees, research analyst (including relatives) worldwide may: (a) from time to time, have long or short positions in, and buy or sell the securities thereof, of company(ies), mentioned herein or (b)
be engaged in any other transaction involving such securities and earn brokerage or other compensation or act as a market maker in the financial instruments of the subject company/company(ies) discussed herein or act as advisor or
lender/borrower to such company(ies) or have other potential/material conflict of interest with respect to any recommendation and related information and opinions at the time of publication of research report or at the time of public
appearance. EBL may have proprietary long/short position in the above mentioned scrip(s) and therefore should be considered as interested. The views provided herein are general in nature and do not consider risk appetite or investment
objective of any particular investor; readers are requested to take independent professional advice before investing. This should not be construed as invitation or solicitation to do business with EBL.
EBL or its associates may have received compensation from the subject company in the past 12 months. EBL or its associates may have managed or co-managed public offering of securities for the subject company in the past 12 months. EBL or
its associates may have received compensation for investment banking or merchant banking or brokerage services from the subject company in the past 12 months. EBL or its associates may have received any compensation for products or
services other than investment banking or merchant banking or brokerage services from the subject company in the past 12 months. EBL or its associates have not received any compensation or other benefits from the Subject Company or third
party in connection with the research report. Research analyst or his/her relative or EBL’s associates may have financial interest in the subject company. EBL, its associates, research analyst and his/her relative may have other potential/material
conflict of interest with respect to any recommendation and related information and opinions at the time of publication of research report or at the time of public appearance.
Participants in foreign exchange transactions may incur risks arising from several factors, including the following: ( i) exchange rates can be volatile and are subject to large fluctuations; ( ii) the value of currencies may be affected by numerous
market factors, including world and national economic, political and regulatory events, events in equity and debt markets and changes in interest rates; and (iii) currencies may be subject to devaluation or government imposed exchange
controls which could affect the value of the currency. Investors in securities such as ADRs and Currency Derivatives, whose values are affected by the currency of an underlying security, effectively assume currency risk.
Research analyst has served as an officer, director or employee of subject Company: No
EBL has financial interest in the subject companies: No
EBL’s Associates may have actual / beneficial ownership of 1% or more securities of the subject company at the end of the month immediately preceding the date of publication of research report.
Research analyst or his/her relative has actual/beneficial ownership of 1% or more securities of the subject company at the end of the month immediately preceding the date of publication of research report: No
EBL has actual/beneficial ownership of 1% or more securities of the subject company at the end of the month immediately preceding the date of publication of research report: No
Subject company may have been client during twelve months preceding the date of distribution of the research report.
There were no instances of non-compliance by EBL on any matter related to the capital markets, resulting in significant and material disciplinary action during the last three years.
A graph of daily closing prices of the securities is also available at www.nseindia.com
Analyst Certification:
The analyst for this report certifies that all of the views expressed in this report accurately reflect his or her personal views about the subject company or companies and its or their securities, and no part of his or her compensation was, is or will
be, directly or indirectly related to specific recommendations or views expressed in this report.
Additional Disclaimer for U.S. Persons
Edelweiss is not a registered broker – dealer under the U.S. Securities Exchange Act of 1934, as amended (the“1934 act”) and under applicable state laws in the United States. In addition Edelweiss is not a registered investment adviser under
the U.S. Investment Advisers Act of 1940, as amended (the "Advisers Act" and together with the 1934 Act, the "Acts), and under applicable state laws in the United States. Accordingly, in the absence of specific exemption under the Acts, any
brokerage and investment services provided by Edelweiss, including the products and services described herein are not available to or intended for U.S. persons.
This report does not constitute an offer or invitation to purchase or subscribe for any securities or solicitation of any investments or investment services and/or shall not be considered as an advertisement tool. "U.S. Persons" are generally
defined as a natural person, residing in the United States or any entity organized or incorporated under the laws of the United States. US Citizens living abroad may also be deemed "US Persons" under certain rules.
Transactions in securities discussed in this research report should be effected through Edelweiss Financial Services Inc.
Additional Disclaimer for U.K. Persons
The contents of this research report have not been approved by an authorised person within the meaning of the Financial Services and Markets Act 2000 ("FSMA").
In the United Kingdom, this research report is being distributed only to and is directed only at (a) persons who have professional experience in matters relating to investments falling within Article 19(5) of the FSMA (Financial Promotion) Order
2005 (the “Order”); (b) persons falling within Article 49(2)(a) to (d) of the Order (including high net worth companies and unincorporated associations); and (c) any other persons to whom it may otherwise lawfully be communicated (all such
persons together being referred to as “relevant persons”).
This research report must not be acted on or relied on by persons who are not relevant persons. Any investment or investment activity to which this research report relates is available only to relevant persons and will be engaged in only with
relevant persons. Any person who is not a relevant person should not act or rely on this research report or any of its contents. This research report must not be distributed, published, reproduced or disclosed (in whole or in part) by recipients to
any other person.
Additional Disclaimer for Canadian Persons
Edelweiss is not a registered adviser or dealer under applicable Canadian securities laws nor has it obtained an exemption from the adviser and/or dealer registration requirements under such law. Accordingly, any brokerage and investment
services provided by Edelweiss, including the products and services described herein, are not available to or intended for Canadian persons.
This research report and its respective contents do not constitute an offer or invitation to purchase or subscribe for any securities or solicitation of any investments or investment services.
Disclosures under the provisions of SEBI (Research Analysts) Regulations 2014 (Regulations)
Edelweiss Broking Limited ("EBL" or "Research Entity") is regulated by the Securities and Exchange Board of India ("SEBI") and is licensed to carry on the business of broking, depository services and related activities. The business of EBL and its
associates are organized around five broad business groups – Credit including Housing and SME Finance, Commodities, Financial Markets, Asset Management and Life Insurance. There were no instances of non-compliance by EBL on any matter
related to the capital markets, resulting in significant and material disciplinary action during the last three years. This research report has been prepared and distributed by Edelweiss Broking Limited ("Edelweiss") in the capacity of a Research
Analyst as per Regulation 22(1) of SEBI (Research Analysts) Regulations 2014 having SEBI Registration No.INH000000172.


![CMP INR 40 Tactical Buy: Orient Paper & Industries Ltd ... · t }uu v Z d ] o hz[with target price of INR 51/share, valuing the stock at 6x on FY20 EBITDA estimates FY17 FY18 FY19E](https://static.fdocuments.us/doc/165x107/5cdee04b88c993301d8d9bb2/cmp-inr-40-tactical-buy-orient-paper-industries-ltd-t-uu-v-z-d-o-hzwith.jpg)


