Projects: A Scottish Suppliers’ -...
442
Success Factors for Organisational Information Systems Development Projects: A Scottish Suppliers’ Perspective A thesis submitted in partial fulfilment of the requirements of Edinburgh Napier University for the award of Doctor of Philosophy Approved [electronic] version Robert John Irvine June 2013
Transcript of Projects: A Scottish Suppliers’ -...

Success Factors for Organisational
Information Systems Development
Projects: A Scottish Suppliers’
Perspective
A thesis submitted in partial fulfilment of the requirements
of Edinburgh Napier University
for the award of Doctor of Philosophy
Approved [electronic] version
Robert John Irvine
June 2013
i
Abstract
Organisational information systems development (OISD) projects have long
been associated with failure. Not surprisingly, the cost of these failures is
enormous. Yet, despite numerous studies, understanding of real-world projects
is limited. In particular, little is known about the way in which various factors
affect the success of OISD projects. Prior research has focussed on OISD
projects from an in-house or client perspective, and the views of the supplier
have largely been ignored. By investigating OISD project success factors from
the supplier perspective, this doctoral study helps address this gap.
Based on an empirical investigation drawn from data collected from Scottish
IS/IT solution suppliers, this research identifies and analyses 20 success factors
for supplier-based OISD projects, and a range of more detailed, inter-related
sub-factors related to each of the twenty. The work confirms the importance of
many factors identified in the extant literature. A number of additional factors not
previously identified are also exposed. Important differences between supplier
and client perspectives are revealed. The findings also develop a variety of
factors that have merited scant treatment in the OISD project success factor
literature.
The means by which OISD project success factors propagate their influences to
affect project success was also investigated. This is revealed to be a complex
phenomenon comprising billions of causal chains interacting with a few million
causal loops. The propagation process is performed by a sizeable network of
factors, the topology of which seems to reflect the complexities of real-world
OISD projects. Hence, the network is used to propose a new theory for success
factors that contributes new insight into the behaviour of these projects.
The research also reveals that supplier-based OISD projects are oriented more
towards project success than project management success and that OISD
project success criteria are far more than simply measures of success. Indeed,
the overall conclusion of this thesis is that the concept of OISD project success
factors is far more complicated than has been previously articulated.

ii
Acknowledgements
For my mother and father.
This thesis is dedicated to my family: To my two sons, Robbie and Jamie but,
more so, to my parents without whose love and support this thesis would never
have been completed: Mum and Dad, I could not have done this without you.
Also, to my then girlfriend Diane, for putting up with and supporting me during
the difficult stages of the research process.
I am also deeply indebted to all of my supervisors for guiding me through the
course of my research. To Dr. Xiaodong Liu for encouraging me to apply for the
university’s research degree programme. To Mr. Pritam Chita for acting as my
director of studies during the initial stages of my research and to Dr. Alison
Crerar for acting as my second supervisor during the first few months of my
research.
But more so, I am indebted to Professor Jessie Kennedy who, as my panel
chair, proved not only to be fair and supportive, but also incredibly astute in
terms of her questioning during my panel meetings. Also, to Dr. Alistair
Armitage who, in addition to acting as my second supervisor throughout the
majority of my research degree, acted as sole supervisor for many months
during the interim stages of my research: Alistair, your support and guidance
during this time proved to be invaluable. But most of all, to Professor Hazel Hall
who, as my director of studies in the latter stages of my research, proved to be
incredibly supportive in every way: Hazel, I couldn’t have done this without you
either.
Finally, I would like to thank my brother, Andrew, and all of the individuals (and
their companies) for participating in the pilot and main fieldwork interviews.
Similarly, I would also like to thank my fellow PhD research students and
various members of the university’s staff for their encouragement over the
course of my studies.

iii
Table of contents
Abstract ........................................................................................................ i
Acknowledgements ...................................................................................... ii
Table of contents .......................................................................................... iii
List of figures ................................................................................................ x
List of tables ................................................................................................. xii
Chapter 1. Introduction to the thesis ....................................................... 1
1.1 Introduction ...................................................................................... 1
1.2 The allure of project success factors ............................................... 1
1.3 Motivations for this research ........................................................... 2
1.4 Research aims and objectives ......................................................... 4
1.5 Key terms and definitions ................................................................. 4
1.5.1 Organisational information systems ............................................. 4
1.5.2 OISD projects ............................................................................... 5
1.5.3 OISD project success factors ...................................................... 6
1.6 Thesis structure ............................................................................... 9
1.7 Conclusion ....................................................................................... 11
Chapter 2. Literature review ...................................................................... 12
2.1 Introduction ...................................................................................... 12
2.2 Background to the research ............................................................. 13
2.2.1 Contemporary organisational information systems ...................... 13
2.2.2 Organisational information systems development ....................... 14
2.2.3 Challenges faced by OISD projects ............................................. 16
2.2.3.1 Technological challenges ........................................................ 16
2.2.3.2 Process challenges ................................................................. 17
2.2.3.3 People challenges ................................................................... 17
2.2.3.4 Organisational challenges ....................................................... 18
2.2.4 Cobb’s paradox ........................................................................... 19
2.2.5 Known best practice for OISD project management ................... 21
2.2.6 Closing the gap in project management knowledge .................... 25

iv
2.3 Project success factors .................................................................... 26
2.3.1 Project success factors in the context of project success ............ 27
2.3.1.1 Project success criteria ............................................................ 28
2.3.2 Project success factor definitions ................................................ 30
2.3.3 Project success factor nomenclature .......................................... 31
2.3.4 The origins of success factor research ........................................ 31
2.3.5 Project success factor research ................................................... 33
2.3.6 Criticisms of project success factor research .............................. 35
2.4 Research into OISD project success factors ................................... 39
2.4.1 OISD project success factor lists ................................................. 40
2.4.1.1 OISD project success factor research studies ......................... 41
2.4.1.2 OISD project success factor analysis ...................................... 42
2.4.1.3 OISD project success factors .................................................. 46
2.4.1.4 OISD project success factor studies containing the
suppliers’ perspective ......................................................... 52
2.4.1.5 Conclusions for OISD project success factor lists ................... 53
2.4.2 Research into project success factor frameworks ....................... 54
2.4.3 Research into individual OISD project success factors ............... 56
2.4.3.1 Project manager competences ............................................... 56
2.4.3.2 Executive management support .............................................. 58
2.4.3.3 End user involvement .............................................................. 58
2.4.3.4 Other success factor studies ................................................... 59
2.4.4 Research into the influence of success factors on OISD
project success ....................................................................... 60
2.4.5 Research into causal interactions between OISD
project success factors ........................................................... 63
2.4.5.1 Identifying relationships between success factors .................. 65
2.4.5.2 Investigating the dynamics of success factor relationships ..... 67
2.5 Dimensions of OISD project success factor research ...................... 68
2.6 Temporality of OISD project success factors ................................... 70
2.7 Theoretical basis of OISD project success factors .......................... 71
2.8 Conclusion ....................................................................................... 73
Chapter 3. Methodology ............................................................................ 76
3.1 Introduction ...................................................................................... 76
3.2 Overview of the research approach ................................................. 76
3.3 Philosophical foundations of the research approach ....................... 81
3.4 Literature review .............................................................................. 85
3.4.1 Literature search .......................................................................... 86
3.4.2 OISD project success factor analysis ......................................... 88
3.5 Pilot interviews ................................................................................. 90

v
3.6 Fieldwork process ............................................................................ 92
3.6.1 Stage 1: Company selection ......................................................... 93
3.6.2 Stage 2: Interview arrangement .................................................. 95
3.6.3 Stage 3: Data collection ............................................................... 98
3.6.4 Stage 4: Qualitative analysis ....................................................... 110
3.6.5 Stage 5: Relationship analysis .................................................... 112
3.7 Difficulties and limitations encountered during the fieldwork
process ........................................................................................ 117
3.8 Quality of the research findings ....................................................... 118
3.8.1 Validity .......................................................................................... 119
3.8.2 Reliability ...................................................................................... 123
3.9 Conclusion ....................................................................................... 126
Chapter 4. 20 success factors for OISD projects .................................... 127
4.1 Introduction ...................................................................................... 127
4.2 Participant sample ........................................................................... 127
4.3 Project success ................................................................................ 129
4.3.1 Project management success ...................................................... 129
4.3.2 Organisational success ................................................................ 130
4.3.2.1 Client organisation .................................................................. 130
4.3.2.2 Supplier organisation .............................................................. 132
4.4 Success factors ............................................................................... 132
4.4.1 Determining the relative importance of OISD project
success factors ........................................................................ 133
4.4.2 Process related success factors .................................................. 136
4.4.2.1 An effective sales process ....................................................... 138
4.4.2.2 An effective project start-up ..................................................... 141
4.4.2.3 Effective communication ......................................................... 143
4.4.2.4 Effective project planning ........................................................ 146
4.4.2.5 Effective risk management ...................................................... 149
4.4.2.6 Effective stakeholder management ......................................... 151
4.4.2.7 Effective expectation management ......................................... 152
4.4.2.8 Effective change management ............................................... 153
4.4.2.9 Effective requirements management ...................................... 155
4.4.2.10 An effective software development approach ......................... 161
4.4.2.11 Effective software testing ........................................................ 164
4.4.2.12 Effective training ...................................................................... 166
4.4.2.13 Effective post implementation support .................................... 167
4.4.2.14 Effective lessons learning ....................................................... 168
4.4.3 Artefact related success factors ................................................... 169
4.4.3.1 A fit for purpose project governance model ............................ 170

vi
4.4.3.2 Fit for purpose technology ....................................................... 172
4.4.4 Actor related success factors ....................................................... 174
4.4.4.1 Effectiveness of the project team ............................................ 174
4.4.4.2 Effectiveness of the project manager ....................................... 179
4.4.4.3 Effectiveness of the client organisation ................................... 182
4.4.4.4 Effective client involvement ..................................................... 185
4.5 Discussion ........................................................................................ 188
4.6 Conclusion ....................................................................................... 189
Chapter 5. Relationship analysis of OISD project success factors ...... 191
5.1 Introduction ...................................................................................... 191
5.2 Relationship concepts ...................................................................... 192
5.3 Causal diagram nomenclature ......................................................... 194
5.4 Overview of the analysis process .................................................... 197
5.5 Relationship data set ....................................................................... 198
5.6 Active relationship network .............................................................. 201
5.7 Findings ........................................................................................... 203
5.7.1 Linear causal chains .................................................................... 203
5.7.2 Causal loops ................................................................................ 207
5.7.3 Activity levels ............................................................................... 210
5.7.3.1 Factor activity levels ............................................................... 210
5.7.3.2 Criteria activity levels .............................................................. 211
5.7.3.3 Relationship activity levels ...................................................... 213
5.7.3.4 Aggregated activity levels ....................................................... 213
5.7.4 Factor receptivity and range ........................................................ 217
5.8 Special cases ................................................................................... 218
5.8.1 Project team’s staffing level ........................................................ 218
5.8.2 Project success as a success factor ............................................ 220
5.8.3 Success criteria as success factors ........................................... 221
5.9 Discussion ....................................................................................... 223
5.10 Conclusion ....................................................................................... 227
Chapter 6. Discussion ............................................................................... 230
6.1 Introduction ...................................................................................... 230
6.2 Preamble ......................................................................................... 231
6.2.1 Setting realistic expectation levels for the contribution
made by this research project ................................................. 231
6.2.1.1 OISD project success factor studies containing the
suppliers’ perspective ......................................................... 231

vii
6.2.1.2 Studies investigating causal interactions between
OISD project success factors .............................................. 233
6.2.2 A framework for contributions made by this research
project ..................................................................................... 234
6.3 Contributions made by the findings relating to the identification
and description of OISD project success factors ......................... 235
6.3.1 Factors identified by this research and also cited in the
literature .................................................................................. 238
6.3.2 Factors identified by this research but not cited in the
literature .................................................................................. 239
6.3.3 Factors cited in the literature but not identified by this
research .................................................................................. 242
6.3.4 The development of factors cited in the literature ........................ 243
6.3.5 Discussion of the differences between supplier and
client perspectives .................................................................. 247
6.4 Contributions made by the findings of the relationship
analysis of OISD project success factors .................................... 249
6.4.1 Utility and limitations of the relationship analysis ......................... 250
6.4.2 Contributions to knowledge ......................................................... 251
6.4.3 Towards a network topology theory for OISD project
success factors ....................................................................... 253
6.5 Contributions made by the findings related to OISD project
success criteria ........................................................................... 255
6.5.1 Organisational success from the suppliers’ perspective ............. 256
6.5.2 OISD project success criteria as influencers ............................... 257
6.5.3 The relative importance of OISD project success criteria ........... 260
6.6 Additional contributions ................................................................... 262
6.6.1 The literature review as a contribution to knowledge .................. 262
6.6.2 Implications for project management theory ................................ 262
6.6.3 The fieldwork process as a contribution to knowledge ................ 265
6.7 Conclusion ....................................................................................... 266
Chapter 7. Conclusions ............................................................................. 268
7.1 Introduction ...................................................................................... 268
7.2 Meeting the original research aims and objectives .......................... 268
7.2.1 Research objective 1: To provide a better understanding of
OISD project success factors from a suppliers’ perspective ........ 268
7.2.2 Research objective 2: To provide a better understanding of
the way in which OISD project success factors interact to
influence project success ............................................................ 269

viii
7.2.3 An implicit research objective: To provide a better
understanding of OISD project success criteria ........................... 270
7.2.4 Additional contributions to knowledge provided by this
research project ........................................................................... 271
7.2.5 A summary of the contributions provided by this research
project .......................................................................................... 271
7.3 Fitness for purpose of the research methodology ........................... 272
7.4 Recommendations for further research ........................................... 273
7.4.1 Research into success factors for supplier-based OISD
projects from the suppliers’ perspective .................................. 273
7.4.2 Relationship analyses of OISD project success factors .............. 273
7.4.3 Research to enable OISD success factor modelling ................... 274
7.5 Conclusions from the research ........................................................ 275
Reference list .............................................................................................. 277
Appendices ................................................................................................. 305
Appendix 1.1. A profile of the researcher’s experience and beliefs .............. 306
Appendix 2.1. Turner’s theory of project management: corollaries
and roles ................................................................................................... 310
Appendix 2.2. OISD project success factor studies ..................................... 312
Appendix 2.3. Success (and failure) factors contained in OISD
project success factor studies .................................................................. 320
Appendix 2.4. The 60 most cited success (and failure) factors contained in
OISD project success factor studies ........................................................ 329
Appendix 2.5. The 52 most cited success (and failure) factors contained in OISD project success factor studies that do not include a suppliers’
perspective ............................................................................................... 332
Appendix 3.1. Entity-based coding book ..................................................... 334 Appendix 3.2. Letter of invitation for prospective interview participants ...... 336
Appendix 3.3. Response form for prospective interview participants .......... 337
Appendix 3.4. Interview participant guidelines ............................................. 338
Appendix 3.5. Requirements specification for the propagation software ...... 351
Appendix 3.6. Class design for the propagation software ............................ 361
Appendix 3.7. List of propagation runs performed during relationship
analysis ..................................................................................................... 371
Appendix 3.8. Difficulties and limitations encountered during the fieldwork process ..................................................................................... 376

ix
Appendix 4.1. Interview participant details ................................................... 384
Appendix 5.1. Relationship examples from the relationship data set ........... 386
Appendix 5.2. OISD project success factors identified by the relationship
analysis as base factors but not cited in the literature............................... 389
Appendix 5.3. Active causal chain examples ............................................... 402
Appendix 5.4. Active chain statistics for 40 randomly selected active
base factors .............................................................................................. 414
Appendix 5.5. Active causal loop examples ................................................. 417
Appendix 5.6. Causal loop statistics for 20 randomly selected active
factors ....................................................................................................... 423
Appendix 7.1. Additional recommendations for further research .................. 425

x
List of figures
Figure 2.1. The golden (or iron) triangle ....................................................... 20
Figure 2.2. Research model for the influence of factors on project
success .................................................................................................... 62
Figure 3.1. Fieldwork process stages ........................................................... 93
Figure 3.2. Stage 1: Company selection ...................................................... 94
Figure 3.3. Stage 2: Interview arrangement ................................................. 96
Figure 3.4. Stage 3: Data collection .............................................................. 99
Figure 3.5. Interview outline slide ................................................................. 101
Figure 3.6. Research aim slide ..................................................................... 102
Figure 3.7. Interview objective slide ............................................................. 103
Figure 3.8. Additional information/guidelines slide ....................................... 104
Figure 3.9. Entity map example slide ............................................................ 106
Figure 3.10. Participant perspective slide ..................................................... 107
Figure 3.11. Transcript fragment example .................................................... 109
Figure 3.12. Stage 4: Qualitative analysis .................................................... 110
Figure 3.13. Stage 5: Relationship analysis ................................................. 113
Figure 3.14. Detailed coding transcript fragment example ........................... 114
Figure 4.1. 15 key OISD project processes identified by the interview
participants ............................................................................................... 137
Figure 5.1. Factor receptivity and range ....................................................... 192
Figure 5.2. Schematic of an active causal chain .......................................... 194
Figure 5.3. Example of a causal chain diagram ........................................... 196
Figure 5.4. Examples of relationships between data types ........................... 200
Figure 5.5. Causal chain example: Software development slippages .......... 203
Figure 5.6. Causal chain example: Project start-up effectiveness (I) ........... 204
Figure 5.7. Causal chain example: Project start-up effectiveness (II) ........... 204
Figure 5.8. Causal chain example: Project start-up effectiveness (III) .......... 206
Figure 5.9. Schematic of four interacting causal loops ................................. 207
Figure 5.10. Causal loop example: Number of (project) issues .................... 208
Figure 5.11. The 30 most active entity relationships in the active
relationship network ................................................................................ 216
Figure 5.12. The project team’s staffing level positively influencing
project success ......................................................................................... 218
Figure 5.13. The project team’s staffing level negatively influencing project success ......................................................................................... 219
Figure 5.14. The influence of project success on future projects .................. 221

xi
Figure 5.15. A typical active chain with multiple success factors
and a single success criterion .................................................................. 222
Figure 5.16. An active chain with success criteria influencing other
success criteria ....................................................................................... 222
Figure 5.17. An active chain with a success criterion influencing a
success factor .......................................................................................... 223
Figure 5.18. An example of a small network of success factors with
a single convergence/divergence point .................................................... 224
Figure 5.19. An example of a small network of success factors with
two convergence/divergence points ...................................................... 225
Figure 6.1. An active chain with success criteria influencing other
success criteria ........................................................................................ 258
Figure 6.2. An active chain with a success criterion influencing a
success factor .......................................................................................... 258
Figure 6.3. The influence of project success on future projects ................... 259

xii
List of tables
Table 1.1. The 11 most cited OISD project success factors ......................... 7
Table 1.2. Project entity types........................................................................ 8
Table 2.1. An example of a success factor listing ......................................... 32
Table 2.2. Project entity types ....................................................................... 42
Table 2.3. Project types ................................................................................. 45
Table 2.4. Examples of success factors expressed as characteristics of
entities ...................................................................................................... 46
Table 2.5. The 24 most cited OISD project success factors ......................... 48
Table 2.6. OISD success factor proportions by entity type ........................... 49
Table 2.7. Entities ranked by number of unique characteristics ................... 50
Table 2.8. Project manager success factors (characteristics) ...................... 51
Table 2.9. OISD project success factors by project type ............................. 51
Table 2.10. Studies examining OISD project success, failure or risk
factors containing the suppliers’ perspective ........................................... 52
Table 2.11. Research articles investigating the influence of factors on
project success ........................................................................................ 61
Table 2.12. Standish Group success factor listings (1995, 2001, 2009) ...... 70
Table 3.1. Literature search term combinations ............................................ 87
Table 3.2. Detailed coding relationship examples ........................................ 115
Table 3.3. Research difficulties/limitations ................................................... 118
Table 4.1. Number of participants by project size ......................................... 128
Table 4.2. 20 OISD project success factors .................................................. 133
Table 4.3. Key success factors identified by the interview participants ........ 135
Table 5.1. Project entity types ...................................................................... 195
Table 5.2. Abbreviations used in causal diagrams ....................................... 195
Table 5.3. Entity-characteristic coding examples by data type ..................... 199
Table 5.4. Examples of relationships between factors/criteria ..................... 201
Table 5.5. Factor/criteria counts for the relationship data set and
active relationship network ....................................................................... 202
Table 5.6. Causal loop interaction levels between the five most
active factors ............................................................................................ 209
Table 5.7. The 10 most active factors in the active relationship network ..... 211
Table 5.8. The 12 most active success criteria in the active relationship network ..................................................................................................... 212

xiii
Table 5.9. Core success factors, success criteria and relationship
statistics .................................................................................................... 213
Table 5.10. OISD project success factors activity levels by project type ...... 214
Table 5.11. OISD project success factor activity levels by entity type .......... 214
Table 5.12. The 10 most active entities in the active relationship
network ..................................................................................................... 215
Table 5.13. Average (mean) receptivity and range values by factor set ....... 217
Table 6.1. Studies examining OISD project success, failure or risk
factors containing the suppliers’ perspective ........................................... 232
Table 6.2. 20 OISD project success factors ................................................. 236
Table 6.3. Number of success factors/criteria by factor set ......................... 236
Table 6.4. OISD project success factors identified by prior research .......... 239
Table 6.5. New OISD project success factors identified by this study........... 240
Table 6.6. The 12 most active success criteria in the active relationship
network .................................................................................................... 260
Table 6.7. Project types ................................................................................. 264
Table 6.8. OISD project success factors activity levels by project type ........ 264
Chapter 1. Introduction to the thesis
1
1. Introduction to the thesis
1.1 Introduction
This thesis presents a doctoral research project that investigated success
factors for organisational information systems development (OISD) projects.
The investigation addressed OISD projects from the perspective of Scottish
suppliers engaged in the development of information systems1 (IS) solutions for
client organisations. The research project employed both qualitative and
quantitative methods to produce findings that constitute an original contribution
to knowledge in the field of IS project management. The findings also contribute
to the development of theory in the field.
This chapter provides an introduction to the thesis. In the next section, the allure
of project success factors is discussed. Then, the motivations for the research
are presented, as are the research aims and objectives. These are followed by
the definition of the project’s key terms: (1) organisational information systems,
(2) OISD projects, and (3) OISD project success factors. Prior to the chapter’s
conclusion, the structure of the thesis is described.
1.2 The allure of project success factors
A little over 50 years ago, an article entitled “Management information crisis”
appeared in the Harvard Business Review. In the article, success factors were
defined as the “key jobs [that] must be done exceedingly well for a company to
be successful” (Daniel, 1961, p. 116). The article also stated that companies
would generally have between three and six industry specific success factors
(Daniel, 1961, p. 116). Around 20 years later, Daniel’s work was popularised by
Rockart (for example, Rockart, 1979; Bullen & Rockart, 1981), who used the
term critical success factors to refer to “the few key areas of activity in which
1 The terms information systems (IS), information technology (IT), and information and
communications technology (ICT) are considered to be synonymous and, hence, are used
interchangeably throughout this thesis.

Chapter 1. Introduction to the thesis
2
favourable results [were] absolutely necessary for a particular manager to reach
his goals” (Bullen & Rockart, 1981, p. 3).
Since then, the concept of success factors (i.e. that the success of a given
endeavour could be determined by a few key areas of activity), has appealed to
a large number of researchers, not least those conducting studies in the field of
project management. Indeed, since Rockart, the allure of success factors has
led many researchers to investigate the factors that affect project success
(Milosevic & Patanakul, 2005, p. 181). Thus, success factor research became a
major research stream in project management (Söderlund, 2004b, p. 659;
Söderlund, 2011, p. 158) and information systems (Larsen & Myers, 1999, p.
397; Lu, Huang, & Heng, 2006, p. 295). That said, there is a lack of theoretical
grounding in the work that has been produced. Also, despite numerous studies,
a coherent set of factors for the IS/IT development process has yet to be found
(Altuwaijri & Khorsheed, 2012, p. 38; Butler & Fitzgerald, 1999, p. 355). Hence,
the question remains: can IS/IT project success be determined by a few, key
factors? Or, despite this alluringly simple concept, is IS/IT project success a far
more complex phenomenon?
1.3 Motivations for this research
The motivations for the research discussed in this thesis were three-fold:
(1) The researcher’s experience as a professional IS consultant
The study was initially motivated by the researcher’s experience as a
professional IT consultant specialising in enterprise resource planning
(ERP) and “advanced” planning and scheduling applications. From 1992
to 2001, the researcher was involved in the delivery of 21 successful
IS/IT projects for a diverse range of customers in a variety of countries
(for example, in the UK, USA, Ireland, Germany and China) and industry
sectors (for example, communications infrastructure, personal
communication devices, whisky production, medical supplies and public
transport services). To provide a better understanding of the researcher’s

Chapter 1. Introduction to the thesis
3
experiences and beliefs (in relation to project management), a profile of
the researcher is presented in Appendix 1.1.
(2) The widespread adoption of IT
During the 1990s, the widespread adoption of IT by organisations was
profound (Lycett & Paul, 1999, p. 127). Indeed, by the beginning of the
21st Century, the very idea that a modern day organisation might operate
effectively without computerised information systems seemed almost
absurd. As a consequence, organisations accrued significant operational
and strategic benefits from their IT investments (Chiang & Mookerjee,
2004, p. 89).
(3) The poor performance of IS projects
Yet, these benefits came at a price. In particular, the projects that
delivered IS solutions had acquired a reputation for high failure rates
(Wright & Capps, 2011, p. 88). In addition, although there had been
successful projects in a large number of organisations (Wateridge, 1995,
p. 169), many OISD projects were delivered late and/or over budget,
while others failed to deliver the required functionality (Standish Group,
2009a, p. 1).
Hence, this research was conceived from the consensus of research articles
that identified the poor performance of OISD projects to be a serious and
recurrent problem (see, for example, Lee, 2003; Tarbet, 2012; Wallace & Keil,
2004; Wright & Capps, 2010). In other words, too many OISD projects failed to
meet the required success criteria determined at their outset. Subsequently, an
investigation into the reasons why contemporary OISD projects succeed or fail
was deemed appropriate for a doctoral research project. This was regarded as
especially important due to the regularity with which the theme has been
researched and the severity of the problem area.

Chapter 1. Introduction to the thesis
4
1.4 Research aims and objectives
Thus, the aim of this research project was to provide a better understanding of
the reasons why OISD projects succeed or fail. To develop this aim further, a
comprehensive review of literature in the field was performed. The literature
review (presented in the next chapter) revealed a number of gaps in the
literature and, in particular, indentified the need for research into:
(1) OISD project success factors from the suppliers’ perspective;
(2) The numerous success factor relationships/interactions that might (or
might not) exist in real-world OISD projects.
Consequently, the research objectives for this study were defined as follows:
(1) To provide a better understanding of OISD project success factors from a
suppliers’ perspective;
(2) To provide a better understanding of the way in which these factors
interact to influence project success.
These objectives were considered appropriate for providing an original
contribution to knowledge and also for developing theory in the field.
1.5 Key terms and definitions
There are three key terms in this thesis: (1) organisational information systems,
(2) OISD projects, and (3) OISD project success factors. These terms are
defined as follows.
1.5.1 Organisational information systems
An organisational information system is “any of a wide combination of computer
hardware, communication technology and software designed to handle
information related to one or more [organisational] processes” (Flowers, 1996
cited by Yeo, 2002, pp. 241-242). Organisational information systems can vary
significantly in terms of their scale, complexity and functionality, as can their
host organisations and end user populations. End user populations can be
internal and external to their host organisations. Internal end user populations

Chapter 1. Introduction to the thesis
5
include various levels of management, specific individuals and specific
functional groups. Functional groups (and individuals) are typically responsible
for performing organisational functions such as sales and marketing, human
resource management, engineering and product development, quality
management, financial accounting, along with service and manufacturing
functions (and specialised sub-functions thereof; for example, purchasing,
production planning, etc.). External populations include customers, suppliers
and other stakeholder groups such as investors. Examples of organisational
information systems (or applications) include enterprise resource planning
(ERP) systems (and sub systems thereof), web-based e-commerce systems
and customer relationship management (CRM) systems.
1.5.2 OISD projects
In its generic sense, a project is “a temporary endeavour undertaken to create a
unique product or service” (Project Management Institute, 2008, p. 5). A
specialised form of a “project” is the IS/IT project: a temporary endeavour
performed to provide2 an information system for a host organisation. IS/IT
projects can be further classified as (1) implementation only or (2) development
projects. Implementation only IS projects do not comprise any significant
software development3. Instead, these projects are used to implement
commercial packaged software products for a host organisation (for example,
an ERP implementation project). On the other hand, development projects
involve a significant amount of software development to create the information
system prior to implementation. In this thesis, development projects are referred
to as organisational information systems development (OISD) projects to
accentuate the organisational aspect of the project’s deliverable (the information
system) and the software development process used to create it.
2 Or perform a significant update or upgrade.
3 Although they may still involve lesser degrees of software development for system
installation, data transfer, minor customisations, etc.
Chapter 1. Introduction to the thesis
6
OISD projects can be further classified as (1) in-house development or (2)
supplier-based development projects. In an in-house development project, the
supplier organisation and the host organisation are one in the same. In a
supplier-based development project, the host organisation subcontracts the
development project to an external supplier. Hence, the organisations involved
in the project are the supplier organisation and the client (host) organisation.
The OISD projects investigated in this thesis are supplier-based and, hence, the
discussion differentiates between the supplier and client organisations.
1.5.3 OISD project success factors
Prior to defining the meaning of project success factors, it is necessary to
discuss what is meant by project success; a term that can be defined in two
different ways. The first of these refers to the way in which project success is
typically used in the literature; that is, to refer to the intended outcome of a
project (see, for example, Nicholas & Hidding, 2010, p. 152; Subramanyam,
Weisstein, & Krishnan, 2010, p. 137). Yet, project success can also be
expressed as having two aspects: project success factors and project success
criteria (Cooke-Davies, 2004, p. 99; Müller & Turner, 2007a, p. 299) In this
context, project success factors contribute to the success (intended outcome) of
the project (Ika, 2009, p. 8), whereas project success criteria are “the set of
principles or standards by which project success is or can be judged” (Lim &
Mohamed, 1999, p. 243). Examples of project success criteria include budget
adherence, benefit to the client organisation, etc.
The project management literature provides a variety of definitions for project
success factors; for example, conditions, circumstances and events (Ika, 2009,
p. 8), characteristics, conditions and variables (Milosevic & Patanakul, 2005, p.
183) or circumstances, facts and influences (Lim & Mohamed, 1999, p. 245)
that, when present (Cooke-Davies, 2004, p. 101), contribute to the success (Ika,
2009, p. 8) or intended outcome, of a project. Although these definitions are
quite acceptable (discussed further in the next chapter), project success factors
are better defined in simpler terms. As project success factors contribute to the
success of a project, a project success factor is anything that contributes to the

Chapter 1. Introduction to the thesis
7
success, or intended outcome, of a project. Equally, (1) a project failure factor is
anything that detracts from the success of a project (or, put another way,
contributes to the failure of a project), and (2) a project risk factor is a potential
project failure factor that has still to be realised as such. Hence:
(1) An OISD project success factor is anything that contributes to the
success (intended outcome) of an OISD project;
(2) An OISD project failure factor is anything that detracts from the success
(intended outcome) of an OISD project;
(3) An OISD project risk factor is a potential OISD project failure factor that
has still to be realised as such.
The definition of an OISD project success factor can be further clarified by way
of examples. As Chapter 2 will demonstrate (see p. 42), OISD projects
encompass a wide range of success factors, the 11 most cited of which are
listed in Table 1.1.
Rank Success factor
1 End user involvement
2 Project board supportiveness
Project team competence
Effectiveness of the project planning process
5 Stability of the project’s requirements
Effectiveness of the project management process
7 Fitness for purpose of the project’s requirements
8 Fitness for purpose of the project’s estimates
Maturity of the project deliverable’s technology
Clarity of the project’s requirements
Effectiveness of the communication process
Table 1.1. The 11 most cited OISD project success factors
The success factors in Table 1.1 are related to three project entity types: the (1)
actors (for example, end users, the project board, etc.), (2) artefacts (for
example, the project’s requirements, the project’s estimates, etc.) and (3)

Chapter 1. Introduction to the thesis
8
processes (for example, project planning, communication, etc.) associated with
an OISD project. These entity types4 are described further in Table 1.2.
Entity type Definition Entity examples
Actor People: individuals and groups found in organisations associated with the project.
Project manager, end users, project team, executive management, project sponsor.
Artefact Things that are typically produced, consumed, utilised or referred to by a project’s processes.
Project budget, hardware, training facilities, design specifications, project metrics.
External Entities found outwith the client/host organisation (excluding those in external organisations e.g. suppliers and partner organisations).
Financial climate, labour market, government legislation.
Process Activities associated with the project.
Project management, software development, training.
Table 1.2. Project entity types
Unfortunately, Table 1.1 is open to a degree of misinterpretation. In particular, it
might be construed that the 11 factors listed in Table 1.1 might represent those
critical or key factors5 factors (i.e. those that should be considered to be more
significant than other factors in terms of their influence on project success) for
OISD projects as a whole (see Section 1.2 above). However, as the literature
review will show, such an interpretation is erroneous. On the contrary, there is
little agreement between researchers as to the success factors that are
applicable to OISD projects in general. Indeed, the evidence suggests that
OISD project success is a function of a wide range of project success factors.
Thus, in summary, an OISD project success factor (as distinct from a success
criterion) is anything that contributes to the success (intended outcome) of an
OISD project. Typically, there will be a wide range of these factors, the majority
4 And a fourth, less applicable entity type: externalities.
5 Or any similar term (for example, crucial success factors) that infers significance in relation
to other factors.

Chapter 1. Introduction to the thesis
9
of which are related to the various actors, artefacts and processes associated
with the OISD project.
1.6 Thesis structure
This thesis comprises an opening section (abstract, acknowledgements, etc.),
seven chapters, a reference list and a series of appendices. The contents of the
six remaining chapters are summarised below.
Chapter 2 presents a critical review of the OISD project success factor
literature. With numerous studies covering a number of research directions,
OISD project success factors6 is shown to be a vibrant research area with
significant research opportunities. In particular, as prior research has explored
OISD project success factors predominantly from an in-house/client viewpoint,
there is a need for qualitative studies that examine the supplier’s perspective
(first research objective) and, in so doing, describe the actuality of real-world
OISD projects. Research that explains the way in which success factors
propagate their influences to affect project success is also merited (second
research objective).
Chapter 3 discusses the methodology employed by this research project. The
first two sections provide an overview of the research approach followed by a
discussion of its philosophical foundations. Next, the literature review and pilot
interviews are described. The main part of the chapter presents the main
fieldwork process: (1) company selection, (2) interview arrangement, (3) data
collection (semi-structured interviews), followed by (4) qualitative and (5)
quantitative (relationship) analyses of supplier-based OISD project success
factors. The problems and limitations encountered by the research are then
presented as are the measures taken to ensure the validity and reliability of the
research findings.
6 Including risk and failure factors.

Chapter 1. Introduction to the thesis
10
Chapter 4 addresses the first research objective by presenting the findings of a
qualitative analysis that identifies and describes 20 high-level success factors
for supplier-based OISD projects. These factors include effective requirements
management, an effective project team and fit for purpose technology. The
thick, rich descriptions provided for each factor serve to enhance understanding
of the actuality of real-world OISD projects. The descriptions also reveal that the
high-level success factors comprise a range of more detailed factors and
relationships between them. The findings also identify of range of success
criteria for project management success and organisational success.
Chapter 5 addresses the second research objective. The findings of a
quantitative relationship analysis reveal that the propagation process by which
success factors affect OISD project success is a complex phenomenon. The
process is shown to rely upon a sizeable network of factors and criteria
comprising 114 billion casual chains and three million causal loops. The most
active factors in the network are shown to be significant in that they can be used
to determine project performance over the lifecycle of the project. The network
can also be used to identify the most significant success criteria for supplier-
based OISD projects.
Chapter 6 identifies and discusses the contributions to knowledge and theory
made by the research project. The primary contributions are shown to be (1) the
identification and description of 20 high-level success factors (see “Chapter 4”
above), and (2) the complex, active network of factors and criteria by which
success factors propagate their influences to affect project success7 (see
“Chapter 5” above). Additional contributions relating to success criteria include
(1) the differentiation between client and supplier organisational success, and
(2) examples of success criteria influencing other factors and criteria. A number
of lesser contributions are also described.
7 The active network is also used to propose a new theory for the behaviour of success factors
in OISD projects.

Chapter 1. Introduction to the thesis
11
Chapter 7 provides the conclusions for the thesis. The research project is
shown to have met its research aims and objectives, and that it has made
original contributions to knowledge and theory. The project’s research
methodology is shown to be fit for purpose when assessed in terms of its
strengths and weaknesses. A number of recommendations for further research
are also presented. Finally, it is argued that the findings of the project show that
the concept of OISD project success factors is far more complex than portrayed
in the research literature.
1.7 Conclusion
This chapter has provided an introduction to the thesis. The allure of project
success factors was discussed; in particular, the notion that the success of an
IS/IT project can be determined, neatly and succinctly, by the influence of a few
key factors. The motivations for the research; namely, the researcher’s career in
IT consultancy, the proliferation of IS/IT solutions and the poor performance of
IS/IT projects, were also presented, as were the research aims and objectives.
In summary, the research aimed to provide a better understanding of (1) OISD
project success factors from a suppliers’ perspective, and (2) the way in which
these factors interact to influence project success. Definitions for the project’s
key terms were also provided: (1) organisational information systems, (2) OISD
projects, and (3) OISD project success factors. Finally, the structure of the
thesis was described.
Having provided an introduction to the thesis, the next chapter will present the
findings of first substantial activity carried out in the research project: a critical
review of the literature pertaining to OISD project success factors and closely
related topics.
Chapter 2. Literature review
12
2. Literature review
2.1 Introduction
This chapter provides a critical review of the literature that analyses and
evaluates previous research into success factors for organisational information
systems development (OISD) projects. The review is essential to an
understanding of how earlier research has explained OISD project success and
failure. In this context, the main objectives of the chapter are twofold: (1) to
provide a critical review of research previously carried out in the field, and (2) to
identify the state-of-the-art for OISD project success factor research. The
literature discussed here draws on a range of sources, the derivation of which is
given in Chapter 3.
This chapter is structured as follows. The next section describes the
background to the research. This is followed by a discussion of project success
factor research:
(1) The subject matter is introduced and discussed in the context of project
success;
(2) Project success factor definitions and terms are provided;
(3) The origins of success factor research are identified and developed in
terms of project success factors;
(4) General criticisms of the research area are presented.
Next, the literature review turns its attention to OISD project success factors
and considers the five prominent research directions in the field:
(1) Success factor lists (including an analysis of their findings);
(2) Specific success factors;
(3) Success factor frameworks;
(4) The direct influence of success factors on project success;
(5) Causal interactions between success factors.

Chapter 2. Literature review
13
Having discussed the five prominent research directions in the field, three
dimensions of OISD project success factor research are then explored: culture,
perspective, and approach. Next, the temporality and theoretical basis of OISD
project success factors are discussed. The chapter concludes by identifying the
state-of-the-art for the research area and outlining the content of the
subsequent chapters.
2.2 Background to the research
Project success has attracted the attention of many researchers. Although a
great deal has been written about the subject, understanding of project success
is far from complete (Ika, 2009, p. 7). Indeed, a certain amount of contemporary
research into IS/IT project success is still being described by its authors as
“exploratory” (for example, Agarwal & Rathod, 2006, p. 358; Andersen, Birchall,
Jessen, & Money 2006, p. 128; Chow & Cao, 2008, p. 964; Fowler & Horan,
2007, p. 1; Procaccino & Verner, 2006, p. 1541; Thomas & Fernández, 2008,
p.733; Wright & Capps, 2010, p. 2; Wright & Capps, 2011, p. 89). Others note it
is “conceptual” (for example, Yu, Flett, & Bowers, 2005, p. 428) or even at a
“starting point” (for example, Agourram & Robson, 2006, p. 308). These
descriptions, in conjunction with the increasing trend of investment in IT (Lin,
2009, p. 865) and the poor performance of IS projects (see, for example,
Standish Group, 2009a, p. 1; Wright & Capps, 2010, pp. 1-2), indicates that IS
project success is an active, relevant and ongoing research area.
2.2.1 Contemporary organisational information systems
Since the mid-1950s, the widespread adoption of IT by organisations has been
profound (Lycett & Paul, 1999, p. 127); a trend that has persisted and will
continue to do so (Lin, 2009, p. 865). As a consequence, organisations have
accrued significant operational and strategic benefits (Chiang & Mookerjee,
2004, p. 89). Yet the contribution of IT to business performance remains
ambiguous (Szanto, 2005 cited by Lin, 2007, p. 93) and many companies have
been considerably disappointed by their IT investments (Tiernan & Peppard,
2004, p. 609). Even so, executive management seems to have become reliant
on IT to run their organisations more efficiently (Rigby & Bilodeau, 2005, p. 5).

Chapter 2. Literature review
14
Most organisations are now dependent on IT and would quickly cease to
function should the technology underpinning their activities ever come to a halt
(Peppard & Ward, 2004, p. 168).
Advances in IT have given rise to a broad range of organisational information
systems. Examples of these systems include applications for financial
accounting, commercial transactions, customer relationship management
(CRM), supply chain management, human resources management (HRM) and
production scheduling (to name but a few). Although some of these applications
can be provided through the deployment of packaged software products, others
require the development of bespoke software. In many cases, the bespoke
software may constitute a complete application in its own right. In others, the
bespoke software may be required to provide functionality not provided by the
packaged solution. Where bespoke software is required, the effort required to
develop these applications can be substantial (Warkentin, Moore, Bekkering, &
Johnston, 2009, p. 9), sometimes involving the engagement of large teams in
development cycles that take years to complete (Bechtold, 2003, p. 25).
2.2.2 Organisational information systems development
Organisational information systems development (OISD) involves the “analysis,
design and implementation of applications and systems to support business
operations in an organisational context” (Xia & Lee, 2004, p. 70). It is a unique,
complex and unpredictable process (Han & Huang, 2007, p. 42; Na, Li,
Simpson, & Kim, 2004, p. 155), often involving significant organisational change
(British Computer Society, 2004, p. 17; Cicmil, Hodgson, Lindgren, &
Packendorff, 2009, p. 82; Lorenzi & Riley, 2000, p. 117). Consequently, OISD
requires effective management to be successful (Wateridge, 1997, p. 283). As
conventional management has long been considered ineffective in such
conditions (see, for example, Avots, 1969, p. 77; Gaddis, 1959, p. 89), OISD
relies on project management to provide the requisite theory and practice. Thus,
the project has become the basic unit used by contemporary organisations to
manage their OISD activities (Lee, 2003, p. 1; Xia & Lee, 2004, p. 70).

Chapter 2. Literature review
15
However, the projects that deliver these systems have acquired a reputation for
high failure rates (Lee, 2003, p. 1; Tarbet, 2012, p. 26; Wallace & Keil, 2004, p.
68; Wright & Capps, 2010, pp. 1-2; Wright & Capps, 2011, p. 88). Although
there have been successful projects in a large number of organisations
(Wateridge, 1995, p. 169), many OISD projects are delivered late and/or over
budget, while others fail to deliver the required functionality (Standish Group,
2009a, p. 1). Indeed, some deliver nothing at all (Reel, 1999, p. 18). Not
surprisingly, in cases where projects do not accomplish their anticipated
business outcomes (Shenhar & Dvir, 2005, p. 2), the cost of these failures can
be enormous (Bharadwaj, Keil, & Mähring, 2009, p. 74; Tiwana & Mclean, 2003,
p. 345). There is also considerable evidence, outwith the findings of academic
research, regarding the poor performance of OISD projects. Catastrophic
failures often make headline news (for example, Mostrous & Elliot, 2009, p. 1).
Non-academic research (for example, Sauer & Cuthbertson, 2003) and various
books (for example, Glass, 1998; Yourdon, 1997) also make important
contributions. Of particular note is the commercial research conducted by the
Standish Group (for example, Standish Group, 1995; 1999; 2004; 2009a). This
body’s research findings are the “most widely quoted statistics in the IT
industry” (Jørgensen & Moløkken-Østvold, 2006, p. 297) and are often cited by
researchers as a driver for their studies (Glass, 2006, p. 15) (for example,
British Computer Society, 2004, p. 8; Kendra & Taplin, 2004, p. 30; Rodriguez-
Repisoa, Setchib, & Salmeron, 2007, p. 582; Tesch, Kloppenborg, & Frolick,
2007, p. 61). This is despite criticisms of the Standish Group’s research results
and methods (see, for example, Eveleens & Verhoef, 2010, p. 36; Glass, 2004,
p. 103; Jørgensen & Moløkken-Østvold, 2006, p. 300).
Previous research, such as that published by Brooks (1975), shows that OISD
project performance is not a new problem. Despite evidence of some
improvement (Sauer & Cuthbertson, 2003, p. 1), the failure rate is not only high
(Xia & Lee, 2004, p. 70), but unnecessarily so (Tiwana & Keil, 2004, p. 73).
These findings, coupled with high investment figures, have led to serious
concerns regarding the successful implementation of OISD projects (Saleh &
Alshawi, 2005, p. 47). That said, there is evidence to suggest that of all the

Chapter 2. Literature review
16
project management application areas (for example, construction, utilities and
pharmaceuticals), IS/IT projects perform better than the rest (Müller & Turner,
2007a, p. 306). However, the overwhelming view of many academic studies is
that OISD project performance is a major problem (Glass, 2006, p. 15).
2.2.3 Challenges faced by OISD projects
OISD projects face a host of difficulties, a number of which can be considered
to characterise this type of project. It is argued, for example, that the IS/IT
project environment tends to exhibit a higher level of uncertainty than other
project management application areas (Wirth, 1996, pp. 8-9). OISD projects
also face difficulties in terms of high levels of risk and design changeability
(Milosevic, 2004, pp. 1289-1291). End user involvement is also considered
critical (Morris, 2004, p. 10). When discussing these, and other issues, it is
useful to frame OISD project challenges as (1) technological, (2) process, (3)
people and (4) organisational (Chow & Cao, 2008, p. 962). Each of these is
elaborated below.
2.2.3.1 Technological challenges
There is evidence to suggest that relatively few OISD projects fail due to
technical problems (DeMarco & Lister, 1999, p. 4; Kappelman, McKeeman, &
Zhang, 2006, p. 32). That is not to say that OISD projects do not face
technological challenges: these certainly exist and always will (Lorenzi & Riley,
2000, p. 116). Technological challenges can refer to characteristics of the end
product i.e. the information system. These include software complexity (British
Computer Society, 2004, p. 15; Chiang & Mookerjee, 2004, p. 89), ease of use
and system performance (Procaccino & Verner, 2006, pp. 115-116). Another
characteristic is software intangibility (Sommerville, 2007, p. 93). This has been
cited as a barrier to accurate progress measurement (Chiang & Mookerjee,
2004, p. 89; Morris, 2004, p. 12). Technological challenges can also refer to the
development tools favoured by the project team (for example, compilers,
debuggers, source code libraries, etc.). These tools might prove to be unreliable
or difficult to integrate with existing technologies (Yourdon, 1997, p. 185).
However, technical challenges are far easier to deal with than those related to

Chapter 2. Literature review
17
people and the organisation as a whole (Lorenzi & Riley, 2000, p. 117). Indeed,
it has even been claimed that many technically-sound information systems have
failed due to sabotage by the end users (Lorenzi & Riley, 2000, p. 123).
2.2.3.2 Process challenges
OISD projects consist of a number of interrelated processes, some of which can
pose significant challenges. Development processes have generally been
considered to be one of the primary contributing factors to the success (or
failure) of OISD projects (Saleh & Alshawi, 2005, p. 48). These processes have
been described as undisciplined and incomplete (Lyytinen, 1987, p. 9).
Practitioners have also been criticised for rarely following software engineering
best practices (British Computer Society, 2004, p. 17). It has also been argued
that there are no standard development processes and that is often impossible
to reliably predict when software processes will cause development problems
(Sommerville, 2007, p. 93).
OISD projects are genuinely difficult to manage (Morris, 1994, p. 187). They
require effective project management to be successful. Failure to do so can
result in an information system that is never completed or finished poorly
(Weinberg, 2003, p. 4). Unfortunately, planning and control has been found to
be lacking (Wateridge, 1997, p. 283), as has scope management (Rehman,
Ullah, Rauf, & Shahid, 2010, p. 10:1), risk management (Thomsett, 2002, p.
157), value management (Morris, 2004, p. 13) and milestone tracking (Jones,
2004, p. 7). Difficulties in estimating (Jones, 2006, p. 8) and specifying system
requirements are also relevant (Morris, 2004, p. 11). Indeed, management in
general is a major challenge. Management issues can be the main impediments
to software development and many technology based projects fail due to poor
managerial approaches to organisational and human factors (Jaafari, 2003, pp.
52-53).
2.2.3.3 People challenges
It has been noted that it is "people who deliver projects, not processes and
systems" (Cooke-Davies, 2002, p. 189). Thus, people “are the single most

Chapter 2. Literature review
18
important part of successful projects” (Hartman, 2000, p. 28 cited by Jugdev &
Müller, 2005, p. 26). In this respect, obtaining involvement and support from
executive management (Thomsett, 1993, p. 6) and end users is vital (Morris,
1994, p. 188). Since it is “people who do the work” (Zielinski, 2005, p. 19), the
majority of project problems can be traced back to people i.e. those who design,
manage and work in organisations, by engaging in processes (again designed
and managed by people) which consume, utilise, produce or maintain
technological and other artefacts. Slevin and Pinto (2004) frame the significance
of people from the project managers’ perspective, focussing on one key
challenge: “All people problems are problems of communication. And all (at
least most) project [manager] problems are people problems – the team, the
line manager, upper management, the customer, suppliers, etc. … or involve
people that have to be convinced, persuaded, stroked or put on the right path”
(Slevin & Pinto, 2004, p. 75).
The literature also notes several examples of how human characteristics can
influence the success (or otherwise) of a project. For example, project
managers need be suitably experienced (British Computer Society, 2004, p.
22), particularly as they exert a substantial influence on the success or
otherwise of a OISD project (Wateridge, 1997, p. 285). Indeed, it has even been
shown that a project manager’s personality has an influence on the success of
a project (Wang & Li, 2009, p. 872). Similarly, the project team should possess
adequate technical and communication skills (British Computer Society, 2004,
p. 22). They also require knowledge of the business domain in which they are
working (Institute of Electrical and Electronics Engineers, 2004, p. 8:7). De-
motivated project team members can be detrimental to the success of an OISD
project (Cerpa & Verner, 2009, p. 132) as can end users with unrealistic
expectations (Cerpa & Verner, 2009, p. 131).
2.2.3.4 Organisational challenges
People should also be considered in terms of the organisations in which they
work. For example, in an OISD project, people working on the project are part of

Chapter 2. Literature review
19
the project organisation. In a wider context, people are also part of their host
organisation. Thus, the “organisation” is key to OISD projects.
Organisational issues can have a significant impact on OISD projects (Gorla &
Lin, 2010, p. 62; Lorenzi & Riley, 2000, p. 117). For example, project team
performance is influenced by organisational culture (Thamhain, 2004, p. 533).
Political pressures, organisational hostility (Yeo, 2002, p. 243) and high staff
turnover (Verner, Overmyer, & McCain, 1999, p. 1025) are also failure factors.
The size of the organisation is known to be an issue, with communication
challenges increasing with organisational size (Hyvari, 2006, p. 36). Even an
organisation’s commitment to measurement processes is essential to the
success of a project (Institute of Electrical and Electronics Engineers, 2004, p.
8:7).
2.2.4 Cobb’s paradox
All of these issues are plausible reasons for OISD failure and, it is reasonable to
suggest that the literature proposes a range of valid reasons why OISD projects
fail. With published “best practice” available to address the majority of these
problems since 2004 (British Computer Society, 2004, p. 4), an improvement in
OISD performance should already be evident since this date. However, there is
evidence to suggest that this is not the case (for example, Standish Group,
2009a, p. 1). This scenario has been referred to as Cobb’s Paradox: “We know
why projects fail, we know how to prevent their failure – so why do they still
fail?” (Cobb, 2004, p. 1).
One possible explanation for the perception of poor OISD project performance
is that it is being measured using inappropriate success criteria. For example, in
conducting comparatively recent studies, the British Computer Society (2004)
and the Standish Group (2004; 2009a) have elected to measure the success of
OISD projects based on the application of the traditional golden (or iron) triangle
(depicted in Figure 2.1). That is, against (1) schedule, (2) cost and (3) scope
metrics. These success criteria can be traced back to one of the first project
management articles ever published (see Gaddis, 1959, p. 89). The golden
triangle focuses project management activity on delivering a project’s

Chapter 2. Literature review
20
predetermined requirements (specification, scope, quality), on time (schedule)
and to cost (budget) (Westerveld, 2003, p. 412). It also represents the
relationships between these success criteria and hence the trade-offs that can
be made between them. For example, reducing the cost of a project might only
be achievable at the expense of reduced scope (or quality) of the project’s
deliverable.
Figure 2.1. The golden (or iron) triangle
There has been some debate as to whether the golden triangle is appropriate
for measuring the success of a project and, if so, in which circumstances
(Munns & Bjeirmi, 1996, p. 81; Wateridge, 1998, p. 59; Westerveld, 2003, p.
142). Indeed, since project success has been described as complex,
ambiguous (Jugdev & Müller, 2005, p. 29) and multidimensional (Shenhar,
Levy, & Dvir, 1997, p. 5), a simple triangle, based on three main criteria, as
explained here, might be inadequate as a tool to measure OISD project
performance (Wateridge, 1998, p. 59). For example, it has been argued that the
dimensions of project success should be extended to encompass stakeholder
perceptions (Fowler & Walsh, 1999, p. 8; Wateridge, 1995, p. 171) and to
differentiate between short term objectives (such as project efficiency) and
longer term goals; in particular the impact on the customer and business
success (Shenhar, Levy, & Dvir, 1997, p. 12).
Cost
Schedule
Scope

Chapter 2. Literature review
21
Another possible explanation for poor project performance is that it is actually
improving (Sauer & Cuthbertson, 2003, p. 1), perhaps even dramatically.
However, the modern day business environment is becoming increasingly
turbulent (Andersen, Birchall, Jessen, & Money, 2006, p. 127). This, coupled
with tighter deadlines, lower budgets and larger scopes, might mean that
improvements in project performance are being eclipsed or nullified by factors
such as competitive pressures and national imperatives that “keep driving a
stunning growth in projects’ size, speed and complexity” (Pyster & Thayer,
2005, p. 24).
However, these explanations do not necessarily fully justify the high failure rate
of OISD projects. Therefore, another possible explanation is that projects are
simply not being managed properly. In other words, OISD project personnel are
not implementing known best practice (if, indeed, there is such a thing).
2.2.5 Known best practice for OISD project management
In 2004, the British Computer Society, in conjunction with The Royal Academy
of Engineering, reported that a disproportionate number of problems in IS
projects stem from a failure to implement known best practices (British
Computer Society, 2004, p. 17). The report also stated that many IT managers
and practitioners lack project skills and recommended the use of established
project management procedures (British Computer Society, 2004, p. 4). IT
personnel may lack such skills because they tend to rise through the ranks of
the organisations more quickly than in other industries (Wirth, 1996, p. 9) and
are often assigned project management responsibilities beyond their level of
expertise (Sauer & Cuthbertson, 2003, p. 17). Thus, best practices and
established project management procedures will not be implemented if OISD
project personnel lack the requisite project management skills. A key to
resolving this issue could be to provide education for project managers that is
better than that currently undertaken. Although improved education should
almost certainly yield benefits, the underlying assumption is that current
understanding of project management best practice is relevant to present day
OISD projects. However, there is evidence to suggest that this is not the case.

Chapter 2. Literature review
22
The project management literature is dominated by normative studies (Cicmil &
Hodgson, 2006 cited by Alojairi & Safayeni, 2012, p. 16). The goal of these
studies is to discover an ideal model or standard for project management
(Alojairi & Safayeni, 2012, p. 16). Consequently, a huge amount of published
material is “devoted to prescribing how projects should be managed” (Nicholas
& Hidding, 2010, p. 148), as opposed to how they are actually managed.
Unfortunately, little of this “theoretical” material has been empirically tested
(Nicholas & Hidding, 2010, p. 148) and it has even been suggested that, at
present, there is “not yet a theory of project management” (Turner, 2006a, p. 1).
Although there is some merit in this argument, the real issue seems to be four-
fold. First, project management theory, as found in textbooks written for
practitioners (such as, Turner, 1999), is not overt; “it is there” but not presented
explicitly as being theoretical (Turner, 2006a, p. 1). It is also embryonic and in
need of further development (Turner, 2006a, p. 1). Second, a single theory of
project management is unlikely to suffice. Instead, multiple approaches are
necessary; at the very least, normative theory and descriptive theory (Sauer &
Reich, 2007, p. 2). Third, all too much project management research is “theory
free” or, at best, “not sufficiently embedded in theory” (Morris, 2010, p. 143).
Fourth, project management research is a relatively young discipline having
existed for only 50 years or so.
Suffice to say that developing a project management theory remains a “hugely
important challenge for the research community” (Sauer & Reich, 2007, p. 1).
To this end, Rodney Turner8 “decided to write a series of [four] editorials ...
outlining what [he thought] the theory of project management [was] and its
current stage of development” (Turner, 2006a, p. 1). Turner’s theory of project
management (see, Turner, 2006a; 2006b; 2006c; 2006d) reflects the normative
material prevalent in the literature and includes 17 corollaries (typically
processes); for example, risk management, requirements management, etc.,
8 J. Rodney Turner is an established editor and author of 16 project management text books.
In addition to being Professor of Project Management at the SKEMA Business School, in
Lille France, he is also editor of the International Journal of Project Management (Elsevier,
2012). He is also an active researcher in the field of project management.

Chapter 2. Literature review
23
and seven roles; for example, the project sponsor and project manager (refer to
Appendix 2.1 for a full listing of corollaries and roles). Unfortunately, since
Turner’s editorials, there is little evidence of further development of a theory of
project management in the literature.
Thus, the topic of project management has attracted considerable criticism
(Winter & Smith, 2006, p. 13) and has been described as simply missing the
mark (Thomsett, 2002, p. xxiii). There is mounting concern regarding the value
and relevance of “traditional project management theory” (such as it is) and the
way in which it relates to project management in practice (Winter & Smith, 2006,
p. 13). In particular, the research literature has failed to explain why projects
deviate from plans, incur cost overruns and suffer internal conflicts
(Packendorff, 1995 cited by Alojairi & Safayeni, 2012, p. 16).
Project management lacks a strong theoretical base and a set of guiding
concepts (Shenhar & Dvir, 2005, p. 2). Indeed, “there is no sound theory of
project management” (Turner, 2005, p. 573) and gaps have been found
between theory and practice (Hallgren & Maaninen-Olsson, 2005, p. 17; Yeo,
2002, p. 246). In addition, there has been an “extraordinary silence on the
theoretical advancement” of project management in over 40 years of research
(Koskela & Howell, 2002, p. 293). In fact, much a project management research
has been accused of being “theory free” (Morris, 2010, p. 143) with the same
author compelled to describe project management theory as being stuck in a
1960s time-warp (Morris, 1994, p. 217). Yet, real-world projects have moved on
from the 1960s: they have changed, rarely unfolding according to plan and
hence have become inherently messy, ambiguous and confusing (Bredillet,
2005, p. 3). OISD projects, in particular, have seen significant changes since
the 1990s. These changes have led to new organisational challenges related to
people, processes and the working environment (Saleh & Alshawi, 2005, p. 47).
Many OISD projects also involve significant organisational change (British
Computer Society, 2004, p. 17; Cicmil, Hodgson, Lindgren, & Packendorff,
2009, p. 82; Lorenzi & Riley, 2000, p. 117). Jaafari (2003, p. 53), finding no
evidence to suggest that project management supports such change, concludes

Chapter 2. Literature review
24
that it is “a manifestation of the failure of the contemporary project management
model to respond to the challenges faced by … [IS/IT] … projects.”
Of particular interest are the project management bodies of knowledge,
maintained and published by professional organisations such as the Project
Management Institute (PMI) and the Association for Project Management
(APM). These bodies of knowledge reflect the current knowledge base for
modern project management (Crawford, Morris, Thomas, & Winter, 2006, p.
726; Turner, 2005, p. 573) and are highly relevant to OISD projects (Institute of
Electrical and Electronics Engineers, 2004, p. 8:2). Not only are the bodies of
knowledge enormously influential, but they are used by practitioners as best
practice guides (Morris, 1999, p. 1). Although these bodies of knowledge are
widely accepted, many practitioners and academics believe they have serious
shortcomings (Morris, 2004, p. 6). For example, practitioners have questioned
whether the bodies of knowledge reflect the actuality of managing projects
(Crawford, Morris, Thomas, & Winter, 2006, p. 724). Researchers have voiced
similar concerns (for example, de Bakker, 2009, p. 3; Fortune & White, 2009, p.
37). The bodies of knowledge have also been described as inadequate (Morris,
2004, p. 10) and narrow (Crawford, Morris, Thomas, & Winter, 2006, p. 724).
Indeed, it has even been argued that the bodies of knowledge may even be
counter-productive for present day projects (Koskela & Howell, 2002, p. 303).
There are a number of reasons for these criticisms. First, the bodies of
knowledge “are based on unrealistic views of how companies and individuals
behave” (Winter & Smith, 2006, p. 15). Their methods and techniques are
unable to deal with project complexity, uncertainty and environmental influences
(Fortune & White, 2009, p. 37) and hence their use might be “inappropriate and
potentially disadvantageous” (Cicmil, Williams, Thomas, & Hodgson, 2006, p.
687). As a result, there are cases where these methods and techniques are
simply not used (Fortune & White, 2009, p. 37). Furthermore, the bodies of
knowledge do not describe how project management can be applied to all
projects (Turner, 2005, p. 573), tending instead to “treat all projects as if they
were the same” (Winter, Smith, Morris, & Cicmil, 2006, p. 640). The bodies of
knowledge also fail to account sufficiently for human issues, which are often

Chapter 2. Literature review
25
identified as the most significant (Winter, Smith, Morris, & Cicmil, 2006, p. 640).
Finally, the bodies of knowledge fall short of reality, particularly in terms of
larger, more complex projects (Crawford, Morris, Thomas, & Winter, 2006, p.
724). Specifically, they fail to explain how complex projects behave in terms of
inter-related causal effects and the existence of feedback loops (Winter &
Smith, 2006, p. 13). For these reasons, the bodies of knowledge fail to
satisfactorily describe the richness of what really happens in project
environments (Cicmil, Williams, Thomas, & Hodgson, 2006, p. 684).
These arguments suggest that many projects, and OISD projects in particular,
no longer have an effective project management paradigm (Morris, 2004, p. 10).
However, the existing project management bodies of knowledge are still
considered to be rich and helpful (Shenhar & Dvir, 2005, p. 3) and certainly
should not be abandoned (Cicmil, Williams, Thomas, & Hodgson, 2006, pp.
683-684; Winter & Smith, 2006, p. 13). This implies that the bodies of
knowledge might be described as necessary but not sufficient. In other words,
there is a gap between “what we need to know and what we actually know
about project management” (Shenhar & Dvir, 2005, p. 2). Clearly, this gap
needs to be closed.
2.2.6 Closing the gap in project management knowledge
Closing this gap represents a considerable challenge. Not only is there a gap in
knowledge, but it has been suggested that research is still grappling with basic
questions such as “what works and what doesn’t?” (Cooke-Davies, 2003, p. 77).
For example, risk management is often prescribed as an essential project
management process. Yet the evidence regarding its actual influence on project
success is still inconclusive (de Bakker, 2009, p. 4). Similarly, the relevance of
quantitative tools and techniques for project planning and control is
questionable given the complexity and uncertainty of contemporary projects
(Alojairi & Safayeni, 2012, p. 16). In addition, despite many years of research,
understanding of the actuality of projects i.e. “how practitioners actually manage
projects” (Winter & Smith, 2006, p. 6) is limited (Cicmil, Williams, Thomas, &
Hodgson, 2006, p. 675). Again, taking risk management as an example,

Chapter 2. Literature review
26
understanding of the risk management process is still based on how it is
assumed to work, not how it is really used in practice (de Bakker, 2009, p. 4); a
criticism that can be extended to the normative research as a whole that
dominates the literature. But most importantly, there is still a “general lack of
agreement amongst authors regarding the factors that influence project success
or failure” (Fortune & White, 2006, p. 54). Within this context, the remainder of
this chapter will discuss prior research into project success factors and that
concentrating on OISD projects.
2.3 Project success factors
Although just one of many proposed definitions, project success factors can be
defined as conditions, circumstances and events that contribute to the success
of a project (Ika, 2009, p. 8). Since the 1960s, many authors have published
lists of these factors (Fortune & White, 2006, p. 53), popularly referred to as
critical success factors (CSFs). Indeed, the project management research
literature is replete with these lists (Alojairi & Safayeni, 2012, p. 17). In the field
of information systems, the success factor approach became a major research
stream (Larsen & Myers, 1999, p. 397) and continues to occupy a prominent
position in the field (Lu, Huang, & Heng, 2006, p. 295). The approach attempts
to identify the factors that contribute to project success (Larsen & Myers, 1999,
p. 397) by collecting quantitative data regarding project implementations and
then determining the relative importance of the various factors that influence
project success (Kwon & Zmud, 1987 cited by Larsen & Myers, 1999, p. 397).
The primary output from these studies is typically lists of project success factors
(Sauser, Reilly, & Shenhar, 2009, p. 666), sometimes referred to as top ten lists
(Klakegg, 2009, p. 500), check lists (Alojairi & Safayeni, 2012, p. 17) or laundry
lists; the latter term being attributed to Richmond (1993, p. 117) by Akkermans
and van Helden (2002, p. 35). These lists are referred to as “descriptive” lists,
not because they are supported with any form of descriptive narrative, but
because they are derived from descriptive empirical studies that seek to identify
actual success factors (Alojairi & Safayeni, 2012, p. 17). This approach differs
significantly from the success factor method developed by Rockart (1979)
(discussed below) and is better described as the success factor approach or,

Chapter 2. Literature review
27
quite simply, factor research (Bussen & Myers, 1997, p. 145; El Sawah,
Tharwat, & Rasmy, 2008, p. 290).
2.3.1 Project success factors in the context of project success
Project success factors should not be discussed out of context; that is, without
reference to project success. Project success has been described as a rather
“slippery subject” (Cooke-Davies, 2004, p. 99) that is both vague and
ambiguous (Ika, 2009, p. 8) and complex to define (Standing, Guilfoyle, Lin, &
Love, 2006, p. 1149). It is a somewhat difficult and elusive concept (Thomas &
Fernández, 2008, p. 733) with no consistent interpretation (Baccarini, 1999, p.
25) or commonly agreed definition (Thomas & Fernández, 2008, p. 733). IS/IT
project success is also difficult to define in terms of its conceptualisation and
operation (Basten, Joosten, & Mellis, 2011, p. 12). But, unfortunately, it is not
unusual for authors to “simply presume that everyone knows what is meant by
project success” (Ika, 2009, p. 7).
Project success is intrinsic to all projects. From the point of their inception,
projects are intended to be successful. In this context, project success is a term
that, more often than not, is used to refer to the intended, successful outcome of
a project (see, for example, Hall, Beecham, Verner, & Wilson, 2008, pp. 31-32;
Nicholas & Hidding, 2010, p. 152; Project Management Institute, 2008, p. 5;
Subramanyam, Weisstein, & Krishnan, 2010, p. 137).
Project success can also be expressed as having two aspects: project success
criteria and project success factors (Cooke-Davies, 2004, p. 99; Müller &
Turner, 2007a, p. 299). Both of these aspects are important and should not be
confused (Cooke-Davies, 2004, p. 99). Yet, in the research literature, they
occasionally are (for example, Bernroider & Ivanov, 2011, p. 326; Lim &
Mohamed, 1999, p. 244; Turner, Ledwith, & Kelly, 2009, p. 292). Project
success criteria can be considered to be “the set of principles or standards by
which project success is or can be judged” (Lim & Mohamed, 1999, p. 243). As
previously defined, project success factors are conditions, circumstances and
events that contribute to the success of a project (Ika, 2009, p. 8). Indeed,
anything that contributes to the success of a project is a project success factor.

Chapter 2. Literature review
28
Although project success factors contribute to the success or failure of a project,
they do not provide the basis for judging the success of a project (Lim &
Mohamed, 1999, p. 243). That is the purpose of project success criteria.
2.3.1.1 Project success criteria
Project success criteria have attracted the attention of many researchers.
Although an in-depth discussion of project success criteria research is beyond
the scope of this chapter, a review of the central issues in this area is useful. As
Turner points out: “How can you say what the correct success factors are until
you have identified the criteria?” (Turner, 1996 cited by Ika, 2009, p. 9).
As discussed briefly above (see p. 19), the primary argument regarding success
criteria centres around the use of the golden triangle to measure a project’s
performance in terms of delivering predetermined requirements (specification,
scope, quality), on time (schedule) and to cost (budget) (Andersen, Birchall,
Jessen, & Money, 2006, p. 128; Jugdev & Müller, 2005, p. 20; Procaccino &
Verner, 2006, p. 1541; Westerveld, 2003, p. 412) and its relevance to
contemporary project management (see, Munns & Bjeirmi, 1996, p. 81;
Wateridge, 1998, p. 59; Westerveld, 2003, p. 142). Criticisms of the golden
triangle have led to a consensus amongst authors that (1) success criteria need
to be extended beyond that of the golden triangle, and (2) success should be
measured from two different viewpoints. As Cleland (1986) states, “Project
success is meaningful only if considered from two vantage points: (1) the
degree to which the project’s technical performance objective was attained on
time and within budget, [and] (2) the contribution that the project made to the
strategic mission of the enterprise” (Cleland, 1986, p. 6). The first vantage point
reflects the criteria of the golden triangle and is thus concerned with the
efficiency of the project process and its management. The second vantage point
extends beyond the completion of the project process and addresses the
effectiveness of the project’s deliverable, or product, to provide value to the host
organisation. Although different authors use different terminology to delineate
process and product success, there is general agreement that this distinction is
both necessary and valid for IS/IT projects (for example, Agarwal & Rathod,

Chapter 2. Literature review
29
2006, p. 359; Saleh & Alshawi, 2005, p. 48; Thomas & Fernández, 2008, p.
737) and for projects in general (for example, Andersen, Birchall, Jessen, &
Money, 2006, p. 142; Cooke-Davies, 2002, p. 185; Ika, 2009, p. 13). For the
purposes of this thesis, the first vantage point (process success) is referred to
as project management success and the second (product success) as
organisational (or business) success (as defined by Thomas & Fernández,
2008, p. 737).
Admittedly, a number of authors have suggested that there is a certain amount
of disagreement on the “new success criteria” that should be used to do
determine project success (for example, Basten, Joosten, & Mellis, 2011, p. 12;
Rai, Lang, & Welker, 2002 cited by Thomas & Fernández, 2008, p. 734;
Wateridge, 1995, p. 171). However, on the whole, the literature shows that, for
IS/IT projects, this is not the case. First, the golden triangle would seem to be
appropriate for determining project management success (see above).
Secondly, organisational success requires two additional criteria: (1)
organisational (commercial and/or strategic) benefits (Andersen, Birchall,
Jessen, & Money, 2006, p. 143; Saleh & Alshawi, 2005, p. 48; Thomas &
Fernández, 2008, p. 734; Wateridge, 1995, p. 170; Wateridge, 1998, p. 63) and
(2) stakeholder (client and/or end user) satisfaction (Agarwal & Rathod, 2006, p.
369; Basten, Joosten, & Mellis, 2011, p. 12; Saleh & Alshawi, 2005, p. 48;
Thomas & Fernández, 2008, p. 734; Wateridge, 1995, p. 170; Wateridge, 1998,
p. 63).
Yet it would be erroneous to suggest that the debate over OISD project success
is complete. On the contrary, a number of important issues remain. For
example, research has indicated that perceptions of OISD project success vary
by stakeholder group (Wateridge, 1995, p. 170; Wateridge, 1998, p. 63) and
geographical location (cultural background) (Pereira, Cerpa, Verner, Rivas, &
Procaccino, 2008, p. 906). There are also difficulties in defining success
measures at the beginning of an OISD project. Requirements will almost
certainly change over the course of the project (de Bakker, Boonstra, &
Wortmann, 2010, p. 500), thus making the definition of realistic success
measures, at project start-up, near impossible (Savolainen, Ahonen, &

Chapter 2. Literature review
30
Richardson, 2012, p. 1). Stakeholders also have tendency to be overly
optimistic in terms of their expectations and to underestimate potential
challenges (Glass, 1999, p. 19; Thomas & Fernández, 2008, p. 733), thus
detracting further from the validity of success measures. Finally, and perhaps
most importantly, there has been an apparent reluctance by the OISD project
research community to adopt the “new success criteria” described above;
instead adhering to the traditional measures defined by the golden triangle
(Savolainen, Ahonen, & Richardson, 2012, p. 2).
2.3.2 Project success factor definitions
There is no single, agreed definition of a project success factor. Instead, as the
research area has developed, different authors have offered differing
definitions. In general, differences in wording do not seem to be significant.
However, there is one aspect of these definitions: the sphere of influence
exerted by project management, that requires discussion. For example, success
factors can be defined as “those elements within the project that can be
influenced directly by project management so as to increase the chance of
achieving success” (Andersen, Birchall, Jessen, & Money, 2006, p. 128).
Similar definitions are provided by a number of authors (for example, Ika, 2009,
p. 8; Milosevic & Patanakul, 2005, p. 18; Westerveld, 2003, p. 412). These
definitions are too narrow as they exclude factors outwith the project life cycle;
that is, factors that exist before the project starts (Ahonen & Savolainen, 2010,
p. 2185; Klakegg, 2009, p. 500) and therefore cannot be influenced directly by
project management (Belassi & Tukel, 1996, p. 141). The same can be said for
external factors outwith the project boundary; for example, changes in the
business environment (Mahaney & Lederer, 2003, p. 8), over which project
management has little or no control (Belassi & Tukel, 1996 cited by Westerveld,
2003, p. 412; Bussen & Myers, 1997, p. 146; Verner, Overmyer, & McCain,
1999, p. 1026). Hence, wider definitions that address this failing are more
appropriate. For example, Cooke-Davies (2004, p. 101) defines success factors
as those elements that, when present, tend to “improve perceived success,
while their absence contributes to failure” (Cooke-Davies, 2004, p. 101). Again,
similar definitions are available (for example, Andersen, Birchall, Jessen, &

Chapter 2. Literature review
31
Money, 2006, p. 129; Lim & Mohamed, 1999, p. 243). These definitons
recognise that external factors, outwith the project can contribute to the success
(or failure) of a project.
2.3.3 Project success factor nomenclature
The literature lacks consistent terminology for project success factors. Instead,
research studies into OISD project success factors use a variety of synonyms.
In addition to success factors (for example, Berntsson-Svensson & Aurum,
2006; Standish Group, 2009b), these include critical success factors (for
example, Chow & Cao, 2008; Thi & Swierczek, 2010), key success factors (for
example, British Computer Society, 2004; Merla, 2005), success drivers (for
example, Procaccino, Verner, & Lorenzet, 2006; Wohlin & Andrews, 2003) and
key project factors (for example, Thi & Swierczek, 2010). Early success factor
research focussed on the reasons for project failure (Belassi & Tukel, 1996, p.
141; Thi & Swierczek, 2010, p. 570). Thus, antonymic references to failure (as
opposed to success) are also relevant. These include studies on failure factors
(for example, Cerpa & Verner, 2009; Charette, 2005), critical failure factors (for
example, Yeo, 2002) and failure causes (for example, May, 1998). Potential
failure factors are also expressed in terms of project risk. These include articles
on risks (for example, Jiang & Klein, 1999; Jiang, Klein, & Ellis, 2002), risk
factors (for example, Leishman & Cook, 2004; Taylor, 2007), key risk factors
(for example, Nakatsu & Iacovou, 2009), major risk factors (for example,
Bannerman, 2008) and risk characteristics (for example, Evans, Abela, & Beltz,
2002). Indeed, it can be argued that any research study that identifies a list of
reasons why projects succeed or fail is a valid source of success or failure
factors (for example, Gaitros, 2004; Kanter & Walsh, 2004; Moynihan, 1996).
After all, as explained in Chapter 1 (see p. 6), a project success factor is
anything that contributes to the success of a project.
2.3.4 The origins of success factor research
The concept of success factors is not new and can be traced back decades, if
not centuries (Forster & Rockart, 1989, p. 1). Traditionally, project managers
attended to these in an “intuitive manner” (Jugdev & Müller, 2005, p. 24).

Chapter 2. Literature review
32
Although contemporary discussions of success factors can be found in earlier
management publications (for example, Drucker, 1955, pp. 347-351), their
origin is typically attributed to Daniel (1961) for his discussion of the issues
associated with the development of executive information systems. Daniel
defined success factors as the “key jobs [that] must be done exceedingly well
for a company to be successful” (Daniel, 1961, p. 116). Companies would
generally have between three and six industry specific success factors (Daniel,
1961, p. 116). Over a decade later, Anthony, Dearden and Vancil (1972, pp.
155-158) seem to have been the first to introduce the critical prefix, thus forming
the term used by many contemporary studies: critical success factors (CSFs).
Rockart (1979) represents the seminal work on success factors (Fortune &
White, 2006, p. 53). Rockart was primarily concerned with developing the CSF
method; a structured interview technique designed to assist chief executive
officers in defining the information needs for their organisations. Bullen and
Rockart (1981) developed Rockart’s work by presenting various success factor
classification constructs and extensive details of the interview process. Having
been popularised by Rockart, success factors began to appear as the subject of
studies into project management and various other research areas. The primary
output from these studies are lists of success factors, similar to that depicted in
Table 2.1.
Rank Success factor
1 User involvement
2 Executive management support
3 Clear business objectives
4 Emotional maturity
5 Optimising scope
6 Agile process
7 Project management expertise
8 Skilled resources
9 Execution
10 Tools and infrastructure
Table 2.1. An example of a success factor listing (Source: Standish Group, 2009b)
Chapter 2. Literature review
33
As previously discussed, these lists have appeared regularly since, with many
researcher investigating the factors that affect project success (Milosevic &
Patanakul, 2005, p. 181). Thus, success factor research became a major
research stream in project management (Söderlund, 2004b, p. 659; Söderlund,
2011, p. 158) and information systems (Larsen & Myers, 1999, p. 397; Lu,
Huang, & Heng, 2006, p. 295).
2.3.5 Project success factor research
Early research, that is studies conducted up until the mid-1980s, tended to be
based on limited data sets, in particular, single case studies and anecdotal
evidence (Cooke-Davies, 2004, p. 101, Jugdev & Müller, 2005, p. 24;
Söderlund, 2011, p. 160). Over time, these studies were replaced by more
rigorous survey research with large sample sizes (Söderlund, 2011, p. 160). In
addition, a few in-depth case studies have been carried out (Söderlund, 2011,
p. 160). There have also been a number of theoretical studies9 (Fortune &
White, 2006, p. 56). Research techniques are predominantly quantitative; for
example, surveys coupled with quantitative data analysis techniques (Ika, 2009,
p. 12; Larsen, 2001, p. 2; Söderlund, 2011, p. 167). Hence, much of success
factor research differs from Daniel’s and Rockart’s original works. First, it often
seeks to identify generic project success factors (Söderlund, 2004b, p. 659);
that is, those applicable to all types of projects (Fortune & White, 2006, p. 53)
rather than specific application areas. Second, many of the studies utilise
quantitative approaches (Ika, 2009, p. 12; Larsen & Myers, 1999, p. 397)
without recourse to the interview techniques used by Rockart’s CSF method.
Third, on average, factor lists typically contain more than ten success factors,
thus exceeding “between three and six” success factors as identified in Daniel’s
studies (Daniel, 1961, p. 116). These studies have collectively been referred to
9 The definition of a theoretical study varies between authors. For example, Fortune and White
define a theoretical study as one in which the “data [is] often based on [the] work of others”
(Fortune & White, 2006, p. 56). On the other hand, Belassi and Tukel consider a theoretical
study to be any study that is not empirically proven (Belassi & Tukel, 1996, p. 142).
Unfortunately, neither of these definitions explicitly state that a theoretical study should make
a contribution to project success factor theory.

Chapter 2. Literature review
34
as belonging to the factor school: “empirical research relying on descriptive
statistics on the criteria and factors of project success and failure” (Söderlund,
2011, p. 158).
The need for research that identifies project success factors is based on a
number of driving forces. The first of these is the widespread use of projects in
organisations (Dvir, Lipovetsky, Shenhar, & Tishler, 1998, p. 915; Söderlund,
2004a, p. 186), an aspect that is pertinent to OISD projects (Lee, 2003, p. 1; Xia
& Lee, 2004, p. 70). The second is poor project performance (Pinto & Prescott,
1990 cited by Söderlund, 2004a, p. 189; Söderlund, 2011, p. 159); again,
relevant to OISD projects (see, for example Standish Group, 2009a, p. 1; Wright
& Capps, 2010, pp. 1-2). The third is the belief (or assumption) that the
identification and use of success factors will lead to better project performance
(Papke-Shields, Beise, & Quan, 2010, p. 660; Pinto & Prescott, 1999 cited by
Söderlund, 2004a, p. 189) by focusing project management attention on such
factors (Andersen, Birchall, Jessen, & Money, 2006, p. 129). As a result, project
success factors have received significant attention from researchers over the
past years, as noted by a number of authors (for example, Bryde, 2008, p. 800;
Cooke-Davies, 2002, p. 185; Christensen & Walker, 2004, p. 39; Söderlund,
2004a, p. 186; Söderlund, 2011, p. 159; Thi & Swierczek, 2010, p. 570) with a
number of articles appearing in prominent project management journals such as
the Project Management Journal and the International Journal of Project
Management (Ika, 2009, p 11; Söderlund, 2004a, p. 189).
Research into success factors is considered important (Papke-Shields, Beise, &
Quan, 2010, p. 651; Thi & Swierczek, 2010, p. 567). In particular, success
factor listings “represent a useful compilation and transfer of experience from a
large number of projects” (Klakegg, 2009, p. 500). A number of useful factors
have been identified (Jugdev & Müller, 2005, p. 24), some of which have been
found to be generic to all projects, regardless of project type (Pinto & Covin,
1989, p. 49 cited by Jugdev & Müller, 2005, p. 26). A potential candidate for this
is executive management (or project board) support, “the most cited [success
factor] in the project management literature” (Fortune and White, 2006, p. 54

Chapter 2. Literature review
35
cited by Zwikael, 2008, p. 387). Yet, the most commonly cited factors are not
necessarily the most important (Klakegg, 2009, p. 500).
Research has also found that there are significant differences between project
types (Pinto & Covin, 1989, p. 49). It has also been claimed by Papke-Shields,
Beise, and Quan (2010) that success factor research findings have been
codified in standards such as the project management bodies of knowledge
(Papke-Shields, Beise, & Quan, 2010, p. 660); although these authors do not
provide specific examples. Some factors have been shown to be more
important than others (Dvir, Lipovetsky, Shenhar, & Tishler, 1998, p. 932). The
research has also shown that the significance of success factors varies across
the project life cycle (Pinto & Covin, 1989, p. 49 cited by Jugdev & Müller, 2005,
p. 26; Pinto & Prescott, 1988, p. 5; Pinto & Slevin, 1988 cited by Söderlund,
2004a, p.189). In other words, success factors can be considered as being
temporal across the project lifecycle.
Research into project success factors has allowed project management to
evolve over recent decades (Papke-Shields, Beise, & Quan, 2010, p. 660).
Despite being a major research stream for many years, reference to, and the
use of, success factors has yet to diminish (Fortune & White, 2006, p. 54) and
further work is still required. Some authors (for example, Bryde, 2008, p. 800)
cite the need for research into generic project success factors. Others (for
example, Söderlund, 2011, p. 159) suggest that research into context-specific
success factors would seem to be more appropriate (Ika, 2009, p. 15). For
example, success factors for specific project types and/or geographical/cultural
areas (Söderlund, 2011, p. 159). Although various factors influencing IS/IT
project success have been identified (de Bakker, 2009, p. 5), further success
factor research into IS/IT projects is still required (Rodriguez-Repiso, Setchib, &
Salmeron, 2007, p. 582).
2.3.6 Criticisms of project success factor research
Despite their widespread use, project success factor studies have been
criticised in the research literature, including those concerned with IS
implementations (Larsen & Myers, 1999, p. 307). These criticisms are generally

Chapter 2. Literature review
36
directed at studies that produce descriptive lists of project success factors
(discussed below), not the other research directions in the field (also discussed
below). Although these lists have identified a number of useful success factors
(Jugdev & Müller, 2005, p. 24), little agreement has been reached on the factors
for project success (Altuwaijri & Khorsheed, 2012, p. 38; Fortune & White, 2006,
p. 54; Söderlund, 2004, p. 186). Indeed, what the success factor lists do seem
to demonstrate is that it is not possible to develop a comprehensive list of
factors appropriate to all projects (Ika, 2009, p. 9). Similarly, a coherent set of
factors for the IS/IT development process has yet to be found (Altuwaijri &
Khorsheed, 2012, p. 38; Butler & Fitzgerald, 1999, p. 355). Indeed, “very few
factors have been shown to be important across multiple studies” (Kwon &
Zmud, 1987 cited by Larsen & Myers, 1999, p. 398).
According to Alojairi and Safayeni (2012), this might be due to a flaw in one of
the research area’s basic assumptions: that “a single theory of project
management exists” (Alojairi & Safayeni, 2012, p. 17). This assumption has
been questioned (as discussed above) because it contadicts the unique nature
of projects. Thus, as all projects are inherently unique, how can success factors
be transferred from one project and applied to others of different types (Alojairi
& Safayeni, 2012, p. 17)? However, the reason that success factors can be
transferred between projects is that projects do have similarities. They have (1)
common actors (for example, a project manager, a project team, etc.), (2)
common processes (for example, project planning, risk management, etc.) and
(3) common artefacts (for example, a project plan, a project deliverable, etc.), all
of which can be described using common characteristics (for example, their
effectiveness or fitness for purpose). Therefore, although a unified theory of
project management may or may not exist, sufficient commonality exists to
support the transfer of certain success factors between projects of various
types. Of course, the question still remains: which factors can be transferred
and which cannot?
Another reason why a compehensive list of factors has yet to be found might be
due to the limited number of factors contained in the lists. As most lists

Chapter 2. Literature review
37
resemble top ten lists (Klakegg, 2009, p. 500), they negate the possibility that
project success is influence by a far wider range of factors.
Belout and Gauvreau (2004) point to the lack of empirical data on success
factors (Belout & Gauvreau, 2004, p. 2). However, this criticism is questionnable
given the large number of empirical studies. As above, it has also been
observed that early success factor literature is based on single case studies
(Jugdev & Müller, 2005, p. 24), anecdotal evidence or surveys with very small
sample sizes (Cooke-Davies, 2004, p. 101). Although anecdotal evidence might
be considered thought-provoking, it is dangerous to suggest that it purports to
be generically applicable to a large target population of real-world projects.
Similar criticisms regarding the generalisation of limited findings can also be
applied to research based on small sample sizes or single case studies (Arber,
2001, p. 59; Pickard, 2007, p. 59).
Although there are exceptions (for example, Bannerman, 2008), project success
factor research is compromised due to the way in which it presents its results.
Success factor lists are considered to be descriptive because they “describe”
real-world projects by way of empirical studies (Alojairi & Safayeni, 2012, p. 17).
However, by presenting their results as a list of brief, highly abstract labels, the
reader is left unclear as to their meaning (Fortune & White, 2006, p. 54). For
example, the term “executive support” (refer to Table 2.1) does not provide
sufficient information on how to better support a project (Zwikael, 2008a, p.
387). This constitutes a serious criticism of project success factor research as it
has done little do define its basic terms; that is, what do these factors actually
mean? More so, without adequate supportive information, the reader is left with
little choice but to refer back to the project management literature to find these
meanings. But the project management literature is predominantly normative
(Cicmil & Hodgson, 2006 cited by Alojairi & Safayeni, 2012, p. 16); that is, it
describes how projects should be managed (Nicholas & Hidding, 2010, p. 148),
not how they actually are managed. Thus, “descriptive” project success factor
research is severely compromised as it requires the reader to refer to back to
normative, not descriptive, material. To address this issue, descriptive lists of

Chapter 2. Literature review
38
project success factors should be supported by additional narrative to describe
the real-world factors that they present.
The success factor list approach assumes that OISD projects are more likely to
be successful as long as practitioners are aware of the various factors and
understand how to address them during the course of the project (Larsen &
Myers, 1999, p. 397). However, few studies have attempted to analyse, assess
or clarify the various factors (Belassi & Tukel, 1996, p. 141). The literature also
provides little in the way of advice and guidance regarding the practical
application of success factors (Clarke, 1999 cited by Jugdev & Müller, 2005, p.
24). Similarly, practitioners are provided with little in the way of assistance to
understand the consequences of their actions (King & Burgess, 2006, p. 59;
King & Burgess, 2008, p. 421). Although the literature provides evidence to
support the existence of project success factors, there is little advice on how
these factors can be used to help alleviate the problems faced by project
managers in practice (Clarke, 1999, p. 139; Nakatsu & Iacovou, 2009, p. 64). In
this respect, stronger theoretical models would be beneficial to project
managers in better understanding the primary causes of success and failure
(King & Burgess, 2008, p. 421). However, with very few exceptions (for
example, Rodriguez-Repiso, Setchib, & Salmeron, 2007), the literature is
almost completely silent on the subject of project success factor management.
Success factor studies have also been criticised for treating the project life cycle
as a static process rather than a dynamic phenomenon (Altuwaijri & Khorsheed,
2012, p. 38; Ginzberg, 1981 cited by Larsen & Myers, 1999, p. 398; Paré &
Elam, 1997 cited by El Sawah, Tharwat, & Rasmy, 2008, p. 260; Söderlund,
2004a, p. 189; Söderlund, 2011, pp. 159-160). Thus, the studies ignore the
social and organisational dynamics associated with IS/IT projects (Gauld, 2007
cited by Altuwaijri & Khorsheed, 2012, p. 38). The majority of studies also
ignore the potential for factors to have varying degrees of significance over the
different stages of the project life cycle (Larsen & Myers, 1999, p. 398). This is a
view supported by the earlier work of Pinto and Covin (1989, p. 59). Thus, it can
be difficult for practitioners to determine the actual importance of a particular
factor at various points over the project life cycle. Not only do the majority of
Chapter 2. Literature review
39
studies fail to recognise variations in the significance of success factors across
the project life cycle but they fail to take into account the dynamic nature of their
interactions over time (discussed below). Thus, success factor research fails to
provide a meaningful depiction of real-world projects (Söderlund, 2004a, p.
189).
In some cases, project success factors are abstracted to such a level that they
become composites (or groups) of two or more individual factors. Although it
has been argued that there can be merit in grouping success factors together
(Clarke, 1999, p. 140), this can also present significant problems. Consider, for
example, the “monitoring and control” process. This process has been identified
as a potential failure factor (see, for example, Taylor, 2000, p. 25; Walsh &
Kanter, 1988, p. 19). Yet, monitoring and control are not the same thing and
should not be stated as such (Gardiner & Stewart, 2000, p. 252). Separating the
two helps identify the effects of each individual factor, and the possible
interaction between them. Indeed, “the inter-relationships between factors are at
least as important as the individual factors” (Fortune & White, 2006, p. 54).
Therefore, success factors should not be considered on an independent basis
(Clarke, 1999, p. 141). However, the success factor list approach treats each
factor as an independent variable, thus overlooking the interactions between
them (Nandhakumar, 1996 cited by Myers, 1999, p. 398). Thus, the literature
fails to explain the relationship between various factors (El Sawah, Tharwat, &
Rasmy, 2008, p. 260; Ginzberg, 1981 cited by Larsen & Myers, 1999, p. 398).
However, “a better understanding of the relationship between key success
factors and the [IS/IT development process] is required if success factors are to
be of any guidance to the practitioners to develop effective information systems”
(Nandhakumar, 1996 cited by Fortune & White, 2006, p. 54).
2.4 Research into OISD project success factors
Having considered project success factors and general criticisms of the
research area, the discussion will now turn to project success factors as
applicable to OISD projects in particular. Research into OISD project success
factors comprises five research directions. Articles reviewing the chronological

Chapter 2. Literature review
40
development of project success factor research (for example, Ika, 2009; Jugdev
& Muller, 2005) recognise the first two: (1) success factor lists and (2) success
factor frameworks, but pay little or no attention to the others: (3) individual
success factors, (4) the influence of success factors on project success, and (5)
the causal interactions between success factors. This section discusses all five
research directions.
2.4.1 OISD project success factor lists
Over the past 50 years, a great many researchers have published articles
containing lists of project success and/or failure factors (Fortune & White, 2006,
p. 53). These descriptive lists, ranked or otherwise, represent the primary output
of project success factor research. Some of the lists are generic while others
attempt to identify success factors for specific project types (Fortune & White,
2006, p. 53). One such type is information systems (IS/IT) projects, with many
studies providing success factors lists for projects with, or without, software
development. Despite claims that research in this area has slowed (Fortune &
White, 2006, p. 54), lists of OISD project success/failure factors still appear
regularly in the literature (for example, Cerpa & Verner, 2009; Sharma,
Sengupta, & Gupta, 2011).
The following discussion provides an analysis of the main text of research
articles containing descriptive lists of OISD project success, failure or risk
factors. Studies that perform an analysis of success factor list research (for
example, Fortune & White, 2006; Nasir & Sahibuddin, 2011) typically seek to
identify the most commonly cited success factors. Although this analysis
identifies these factors, it also seeks to provide a better understanding of the
nature of success factors presented in prior literature with a view to determining
appropriate conclusions. Unlike Fortune and White (2006) (IS/IT and generic
project success factors) and Nasir and Sahibuddin (2011) (IS/IT project success
factors), this analysis deals exclusively with articles that contain OISD project
success, failure or risk factors.

Chapter 2. Literature review
41
2.4.1.1 OISD project success factor research studies
The literature search on which this analysis is based identified 56 suitable
research articles, all published between 1979 and 2011 (refer to Appendix 2.2
for further details). A number of the authors do not explicitly state that their work
is concerned with OISD projects, as opposed to IS/IT projects in general (for
example, Charette, 2005; Merla, 2005). However, in the analysis, if their content
was found to make specific reference to software development competences,
activities or artefacts, they were deemed suitable. The studies were conducted
by academics, practitioners, commercial organisations and one professional
society. They provide descriptive lists of success, failure and risk factors, using
a variety of synonyms. On average (mean), each list contains 12 factors. The
articles cover both in-house and supplier based software development although,
in the majority of cases (33 articles), this distinction is not clear. Whilst the
studies reflect the views of practitioners in varying roles, the most common
perspective provided is that of the host (in-house/client) organisation (although,
again, this is not made clear for 30 of the articles). Indeed, only one article
focuses exclusively on the suppliers’ perspective with another three
investigating that of both the supplier and client. A wide range of countries are
represented with the USA being the most popular. There are only three UK-
based studies. The organisations targeted by the studies include commercial
companies of various sizes in a range of industry sectors. The public sector is
also represented. Research methods are varied but questionnaire based
surveys with quantitative analytical techniques are the most popular. Qualitative
research is also evident, in particular structured interviews. Five case studies
were also found.
Although part of a major research stream (Larsen & Myers, 1999, p. 397), the
studies are quite disparate in character. Other than reviewing prior research (to
identify candidate success factors for use in their surveys), a number of studies
seem to have been carried out in near isolation. Until recently, there has been
little opportunity for “learning” from prior studies, with many articles failing to
provide limitations, lessons learned or recommendations for further research.
Similarly, discussions of validity and reliability were also found to be rare and, in

Chapter 2. Literature review
42
some cases, the research methodology was not made clear; a criticism that has
been levelled at project management research as a whole (Smyth & Morris,
2007 cited by Morris, 2010, p. 143). Research focus (for example, geographical
location) also seems to be almost at random, with researchers utilising
localised, convenience samples. The studies are also published in a wide range
of journals, hence contributing to the disparity of the research. Interestingly, this
“scattering” of results is also evident in closely related areas such as enterprise
resource planning (ERP) projects (Ngai, Law, & Wat, 2008, p. 549). Such
disparity impedes knowledge development (Savolainen, Ahonen, & Richardson,
2012, p. 10) and perhaps explains why there are still many differing opinions on
the factors for project success (Andersen, Birchall, Jessen, & Money, 2006, p.
130).
2.4.1.2 OISD project success factor analysis
The analysis process is described further in Chapter 3 (p. 88). It is concerned
with OISD project success factor studies only10. Articles providing generic
success factors are not included as there is little agreement on factors that are
relevant to all project types (Fortune & White, 2006, p. 54; Söderlund, 2004a, p.
186; Wateridge, 1995, p. 171). Similarly, articles concerned with IS projects that
involve only a small degree of software development effort (that is, those that
are primarily concerned with the implementation of packaged software) are also
excluded. A good example of this type of project is ERP implementations.
Although ERP projects often involve software development for integration
purposes (Nah, Lau, & Kuang, 2001, p. 294; Ngai, Law, & Wat, 2008, p. 556),
this is typically on a relatively small scale. As these do not qualify as “bespoke
software-intensive application development projects” (Moynihan, 1996, p. 359),
ERP implementations (and other IS implementation projects) are excluded,
despite their similarity to OISD projects (Rothenberger, Srite, & Jones-Graham,
2010, p. 81). All of the studies focus on the OISD project at the project level.
Articles dealing with specific areas of the project (for example IS project
10 Although a number of studies deal with OISD projects and “implementation only” projects.

Chapter 2. Literature review
43
manager competences) are also excluded (for example, Bloom, 1996;
Skulmoski & Hartman, 2010). Studies of this type are discussed later in the
literature review.
The analysis found that success factors can be expressed as characteristics of
entities associated with OISD projects (examples of which are provided below).
The use of characteristics in success factor studies in not unusual, although
they usually describe the project as a whole rather than entities associated with
the project (for example, McLain, 2009; Rodriguez-Repisoa, Setchib, &
Salmeron, 2007; Sharma, Sengupta, & Gupta, 2011; Thi & Swierczek, 2010, p.
572). However, Milosevic and Patanakul (2005, p. 183) do refer to
characteristics in their definition of success factors. The analysis also found that
project entities can be classified using four entity types: actors, processes,
artefacts and externalities11 (external). These are described in Table 2.2. Again,
similar classifications can be found in “frameworks” provided by prior factor
research (for example, Chow & Cao, 2008; Moynihan, 1996; Nakatsu &
Iacovou, 2009).
11 The definition of external entities (refer to Table 2.2) has been extended from entities beyond
the project boundary to those beyond the host/client organisation’s boundary. This is due to
the importance of the host/client organisation in OISD projects.

Chapter 2. Literature review
44
Entity type Definition Entity examples
Actor People: individuals and groups found in organisations associated with the project.
Project manager, end users, project team, executive management, project sponsor.
Artefact Things that are typically consumed, produced, utilised or referred to by a project’s processes.
Project budget, hardware, training facilities, design specifications, project metrics.
External12
Entities found outwith the client/host organisation (excluding those in external organisations e.g. suppliers and partner organisations).
Financial climate, labour market, government legislation.
Process Activities associated with the project.
Project management, software development, training.
Table 2.2. Project entity types (replicated from Table 1.2)
The entities contained within these entity types tend to be hierarchical (as do
some of the characteristics used to describe them). For example, domain
experts might be considered to be part of the project team which, in turn, is part
of the host organisation (assuming in-house development).
The analysis process for this chapter has six basic steps:
(1) Success/failure factors were retrieved (verbatim) from the research
articles;
(2) Composite factors (those containing two or more factors) were
deconstructed into unique factors
(3) Each factor was then expressed as a characteristic of an appropriate
entity;
(4) Where appropriate, failure factors were restated as success factors;
(5) Synonymous terms were resolved;
(6) Each factor was assigned a code to denote its project type (refer to Table
2.3).
12 Also (occasionally) referred to as externalities.

Chapter 2. Literature review
45
Project type Definition
OISD Projects that involve bespoke software development to deliver an information system for end users in a host organisation.
Information system (IS/IT)
Projects that deliver an information system for end users in a host organisation e.g. an enterprise resource planning (ERP) implementation project.
Organisational technology
Projects that deliver a technology product for end users in a host organisation e.g. a project to introduce a new manufacturing technology to production operatives.
Organisational Projects not involving the delivery of a technology product in a host organisation (most likely some kind of organisational change) e.g. a business process re-engineering (BPR) project.
Generic Projects that require the use of generic project management principles e.g. a new product development (NPD) project.
Table 2.3. Project types
This resulted in a list of unique success factors. However, step four requires
further clarification. Restating a failure factor as a success factor (and vice
versa) requires that success and failure factors are related. Although research
in this area is inconclusive, the work of Jones (2004), Bannerman (2008) and,
most importantly, Fowler and Horan (2007) suggests that this is the case i.e.
there might be a considerable relationship between specific success and failure
factors. In other words, the same factor can be “extremely influential” to both
successful and unsuccessful OISD projects (Fowler & Horan, 2007, p. 17).
Indeed, Verner, Overmyer and McCain (1999) state that certain factors can be
expressed as “bipolar descriptor pairs” and suggest that successful OISD
projects place emphasis on these factors whereas unsuccessful projects do not
(Nicholas & Hidding, 2010, p. 154; Verner, Overmyer, & McCain, 1999, p.
1025).

Chapter 2. Literature review
46
Entity type Entity Characteristic
Actor Project manager Competence\social skills
End users Involvement
Host organisation Staff turnover (low)
Artefact Project requirements Detail
Success criteria Agreement of
Project schedule Realism
External Business environment Benevolence
Process Project Complexity (low)
Risk analysis Effectiveness
Software development Evolutionary
Table 2.4. Examples of success factors expressed as characteristics of entities
2.4.1.3 OISD project success factors
Although it is conceded that a few factors (for example, the supportiveness of
the project board) would be better represented using two (or more) entities,
OISD project success factors can be expressed as characteristics of entities
associated with the project. Examples of these are provided in Table 2.4. Thus,
an OISD project success factor can be defined as: a characteristic and
associated actor, artefact, process or externality (external factor) that
contributes to the success (or otherwise) of an OISD project. Put another way,
entities can be said to play “host” to a number of success factors via their
characteristics.
The literature surveyed identifies 488 unique factors (listed in Appendix 2.3).
Although further consolidation might be possible (for example, by further
resolving synonymous terms), this number does not reflect the critical nature of
success factors originally defined by Daniel (1961, p. 116); that is, between
three and six factors. On the contrary, this suggests that the success of an
OISD project might be the function of a far wider range of factors. Research by
Moynihan (1996) and Bannerman (2008) supports this view. Moynihan derived
113 risk constructs from his study while Bannerman identified over 300 artefacts
that “appeared to be relevant or important in enabling or inhibiting the

Chapter 2. Literature review
47
performance and/or outcome” of OISD projects (Bannerman, 2008, p. 2123).
Unfortunately, Bannerman does not elaborate any further. Perhaps then, a
major reason why success factor research does not provide a deeper
understanding of real-world projects (Söderlund, 2004a, p. 189) is that the
majority of success factor studies do not acknowledge, let alone address, the
large number of factors relevant to OISD projects.
In keeping with the presentation style employed by the majority of success
factor studies (refer to Table 2.1), Table 2.5 shows the 24 most cited OISD
project success factors from the 56 articles analysed (with a more
comprehensive listing presented in Appendix 2.4). Interestingly, none of these
factors are exclusively restricted to software development, with most (all but end
users’ involvement and the maturity of the project deliverable’s technology)
being applicable to generic projects and their management (discussed further
below). The low level of agreement between articles is also significant. For
example, the “top two” factors (end users’ involvement and project board
supportiveness) appear together in only eight articles whereas the “top three”
factors (end users’ involvement, project board supportiveness and project team
competence) appear together in only three articles. Similarly, the top four
factors only appear together in one article and the top five factors do not appear
together in any single article. Table 2.5 also contrasts the level of detail that can
be found in success factor lists. On the one hand, project requirements has four
detailed entries in the list, each with different characteristics i.e. stability, clarity,
completeness and, at a more general level, fitness for purpose. Conversely, end
users’ involvement can be considered to be vague as it does not identify (1) the
project activities in which the end users are to be involved, or (2) the form that
this involvement is to take (for example, full or part time).

Chapter 2. Literature review
48
Rank Entity type Entity Characteristic Citations
1 Actor End users Involvement 18
2 Actor Project board Supportiveness 14
Actor Project team Competence 14
Process Project planning Effectiveness 14
5 Artefact Requirements Stability 11
Process Project management Effectiveness 11
7 Artefact Requirements Fitness for purpose 10
8 Artefact Estimates Fitness for purpose 7
Artefact Project deliverable\technology Maturity 7
Artefact Requirements Clarity 7
Process Communication Effectiveness 7
12 Actor Client/host organisation Staff turnover 6
Actor Project team Competence\fit with project
6
Process Change control Effectiveness 6
Process Project control Effectiveness 6
Process Project monitoring Effectiveness 6
Process Project Size 6
Process Risk management Effectiveness 6
19 Actor Project manager Experience 5
Actor Project team Competence\ technical
5
Actor Project team Experience 5
Artefact Requirements Completeness 5
Process Estimating Effectiveness 5
Process Project Complexity 5
Table 2.5. The 24 most cited OISD project success factors (success factors with five or more citations)
There are a number of other points of interest regarding OISD project success
factors. Factors are more commonly expressed in terms of failure (61%) than
success (39%); although this ratio is heavily influenced by the number of risk
factor studies (35%)13. As such, the “early” interest in project failure (Thi &
13 Success factors (38%), failure factors (28%) and risk factors (34%).

Chapter 2. Literature review
49
Swierczek, 2010, p. 570) has persisted in factor research. In relation to the
criticisms discussed above, a mere 1.7 percent of factors describe any kind of
relationship with other factors. Also, 19 percent of factors are composite; that is
they contain two or more unique factors.
As discussed above (see p. 41), there are a number of studies in which it not
possible to determine whether the research is addressing in-house or supplier
based software development. However, the results of the analysis contain far
fewer references to clients and suppliers than to the host organisation. There
are also no references to any form of sales process or contract. This suggests
that (1) the bulk of the projects represented by these studies are actually
concerned with in-house development projects, and (2) success factors are
being perceived from the host organisation’s perspective; not that of the
supplier. Second, other than project size, there is little evidence to suggest that
studies are concerned with large scale OISD projects. For example, there is no
mention of the project organisation’s management structure including the need
for multiple development teams led by their own team leaders. Thus, it is not
unreasonable to suggest that OISD success factor research deals with smaller
rather than larger projects.
Entity type Percentage
Actor 44%
Artefact 30%
External 1%
Process 25%
Table 2.6. OISD success factor proportions by entity type
Based on the literature reviewed, the proportion of OISD project success factors
by entity type is shown in Table 2.6.
The low number of external factors seems to support the view of Bussen and
Myers that success factor research fails to identify issues outwith the project
(Bussen & Myers, 1997, p. 149). However, this might be due to external factors
being defined as those that lie beyond the organisational boundary, not the

Chapter 2. Literature review
50
project boundary. The other three entity types, in particular actors (44%), are
better represented. However, given the significance of people in projects
(Cooke-Davies, 2002, p. 189; Hartman, 2000, p. 28 cited by Jugdev & Müller,
2005, p. 26; Slevin & Pinto, 2004, p. 75; Zielinski, 2005, p. 19), perhaps the
proportion of success factors associated with actors should be even higher. The
same argument can be applied to processes. Project artefacts are typically
produced or maintained by project processes (in particular, the project
deliverable). Therefore, by concentrating on process success factors, the fitness
for purpose of project artefacts should, as a consequence, improve.
Actors Artefacts Processes
Entity No. Entity No. Entity No.
Project team 60 Project deliverable 24 Project 14
Client/host organisation 43 Requirements 22 Communication 8
End users 40 Project objectives 13 Software development 8
Project board 17 Project plan 9 Project\processes 6
Project manager 14 Project deliverable\technology
6 Target business processes
5
Project sponsor 13 Estimates 4 Change management 4
Project stakeholders 8 Project deliverable\hardware
4 Requirements definition 4
Supplier organisation 8 Project resources 4 Change control 3
Domain experts 2 Change requests 3 Project management 3
Partner organisations 2 Methodologies\ development
3 Project monitoring 3
Table 2.7. Entities ranked by number of unique characteristics
Table 2.7 shows examples of actor, artefact and process entities ranked by their
number of characteristics. For example, the project manger has 14 unique
success factors as shown in Table 2.8. This implies that the overall
effectiveness of an OISD project entity, in this case the project manager, is a
function of a variety of success factors. However, there is considerable variation
in the number of characteristics between entities (refer to Table 2.7), with many
having very few other than the need to be effective or fit for purpose. Table 2.7
also shows that actors are better represented by characteristics than artefacts

Chapter 2. Literature review
51
which, in turn have more characteristics than processes; proportions that are
consistent with those shown in Table 2.6.
Success factor (characteristic) Source(s)
Characteristics (overall) Kim & Peterson, 2001
Competence (overall) Milis & Mercken, 2002
Competence\leadership skills Kanter & Walsh, 1988; Walsh & Kanter, 2004
Competence\managerial skills Klein, Jiang & Tesch, 2002
Competence\people skills Wallace & Keil, 2004
Competence\project management Merla, 2005; Standish Group, 2009
Competence\social skills Milis & Mercken, 2002
Conflict with other project managers (low level of) Jiang, Klein & Ellis, 2002
Effectiveness BCS, 2004; Wallace & Keil, 2004
Experience Merla, 2005; Milis & Mercken, 2002; Standish Group, 2001; Verner, Overmyer & McCain, 1999; Wallace & Keil, 2004
Power Milis & Mercken, 2002
Supportiveness\adding extra personnel to meet an aggressive schedule late in the project (low level of)
Berntsson-Svensson & Aurum, 2006; Cerpa & Verner, 2009
Supportiveness\long working hours (low level of) Berntsson-Svensson & Aurum, 2006
Understanding\end users’ needs Reel, 1999
Table 2.8. Project manager success factors (characteristics)
Project type Percentage
OISD 5%
IS/IT 4%
Organisational technology 9%
Organisational 21%
Generic 61%
Table 2.9. OISD project success factors by project type
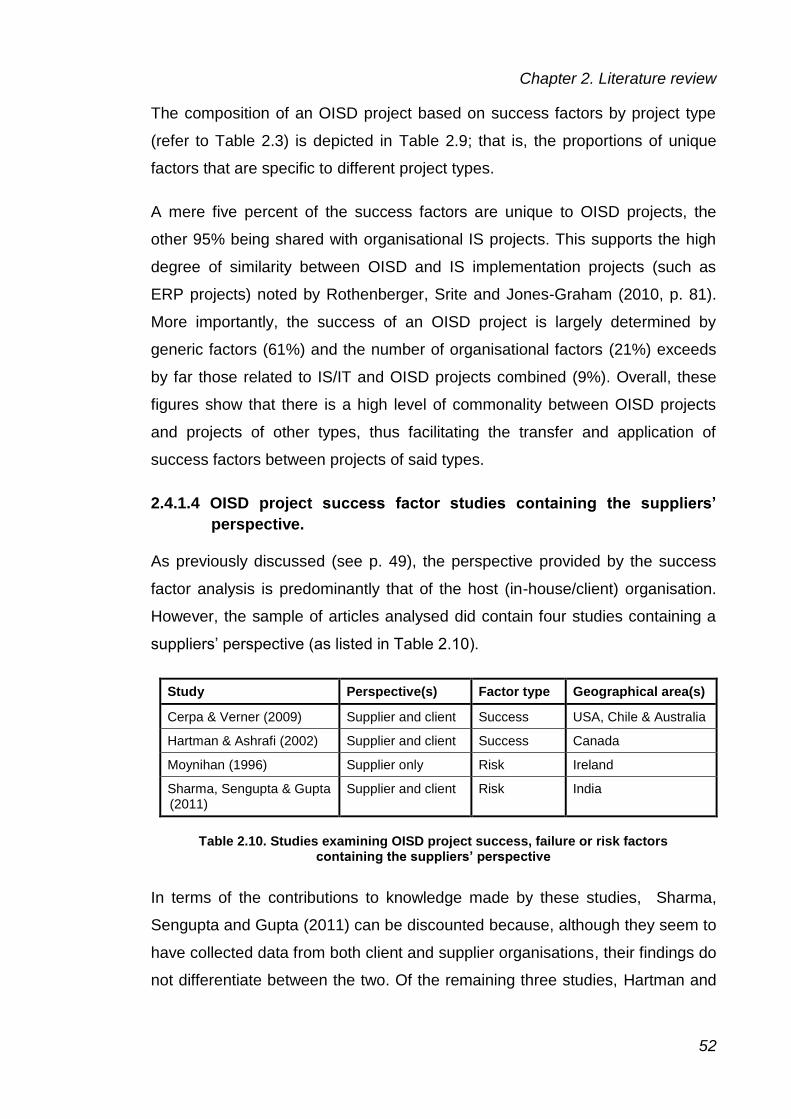
Chapter 2. Literature review
52
The composition of an OISD project based on success factors by project type
(refer to Table 2.3) is depicted in Table 2.9; that is, the proportions of unique
factors that are specific to different project types.
A mere five percent of the success factors are unique to OISD projects, the
other 95% being shared with organisational IS projects. This supports the high
degree of similarity between OISD and IS implementation projects (such as
ERP projects) noted by Rothenberger, Srite and Jones-Graham (2010, p. 81).
More importantly, the success of an OISD project is largely determined by
generic factors (61%) and the number of organisational factors (21%) exceeds
by far those related to IS/IT and OISD projects combined (9%). Overall, these
figures show that there is a high level of commonality between OISD projects
and projects of other types, thus facilitating the transfer and application of
success factors between projects of said types.
2.4.1.4 OISD project success factor studies containing the suppliers’
perspective.
As previously discussed (see p. 49), the perspective provided by the success
factor analysis is predominantly that of the host (in-house/client) organisation.
However, the sample of articles analysed did contain four studies containing a
suppliers’ perspective (as listed in Table 2.10).
Study Perspective(s) Factor type Geographical area(s)
Cerpa & Verner (2009) Supplier and client Success USA, Chile & Australia
Hartman & Ashrafi (2002) Supplier and client Success Canada
Moynihan (1996) Supplier only Risk Ireland
Sharma, Sengupta & Gupta (2011)
Supplier and client Risk India
Table 2.10. Studies examining OISD project success, failure or risk factors containing the suppliers’ perspective
In terms of the contributions to knowledge made by these studies, Sharma,
Sengupta and Gupta (2011) can be discounted because, although they seem to
have collected data from both client and supplier organisations, their findings do
not differentiate between the two. Of the remaining three studies, Hartman and
Chapter 2. Literature review
53
Ashrafi (2002) and Cerpa and Verner (2009) reported only slight differences in
perspective between the supplier and client. This leaves Moynihan (1996)
which, as the only study to focus exclusively on the suppliers’ perspective, is
more representative of this research project. Moynihan reported that most of the
risk factors identified in his study had already been mentioned in the OISD
project risk literature14. That said, Moynihan’s study did reveal some “subtle
elaborations of these factors” (Moynihan, 1996, p. 364).
Hence, a realistic expectation for future studies of OISD project success factors
from a suppliers’ perspective is that many of the newly identified factors will
already have been reported in the OISD project success, failure and risk factor
literature (as listed in Appendix 2.3). However, a number of new factors should
also be expected, particularly at a detailed level and through the development of
factors previously reported in the literature. It might also be possible to provide
a comparison between success factors as perceived by supplier vis-à-vis client
organisations. This is because the perspective presented by the OISD project
success factor studies identified by the literature review is predominantly that of
host (in-house/client) organisation (see p. 49). In fact, performing the success
factor analysis described above (see p. 42), with the exclusion of the four
articles listed in Table 2.10, produces remarkably similar results in terms of the
most cited factors; refer to Appendix 2.5 in comparison to Appendix 2.4.
2.4.1.5 Conclusions for OISD project success factor lists
The observations provided above can be summarised in terms of the
competences required for successful OISD project management. In addition to
the 14 success factors listed in Table 2.8, the analysis suggests that client and
supplier-based OISD project managers, need to be people focussed, with a firm
grasp of generic and organisational project management practices and their
application to real-world projects. Due to the large number of potential success
14 Based solely on the literature reviewed in previous study conducted by Barki, Rivard and
Talbot (1993).

Chapter 2. Literature review
54
factors, they should have an eye for detail and be able to deal with complicated,
if not complex, situations; particularly those relating to the host organisation.
They should also be aware that the entities that they manage (particularly
actors and artefacts) are in themselves host to multiple success factors (in the
form of their various characteristics). Experience of IS/IT projects, with, or
without, software development is certainly important but not, it would seem,
quite as relevant as the other competences previously mentioned. In other
words, the analysis suggests that research into generic, organisational,
organisational technology, and IS/IT projects is relevant to OISD projects, as
are studies concerned with project actors and, to a slightly lesser extent,
artefacts and processes.
Although success factor lists have identified a number of useful factors (Jugdev
& Müller, 2005, p. 24), the limitations of these lists have given rise to a number
of other research directions. First, factors are typically not grouped or classified
in any coherent manner (Jugdev & Müller, 2005, p. 24). Hence, a number of
frameworks have emerged. These frameworks seek to organise factors in such
a way that they might be more useful to readers (Jugdev & Müller, 2005, p. 25);
for example, to aid understanding or possibly to stimulate discussion
(Söderlund, 2011, p. 157). Second, the success factors identified in the factor
listings are not usually supported by any form of descriptive text or narrative.
Hence, research into individual success factors or entities has been required.
Third, lists of success factors do not address the effect of factors on project
success or the causal interactions between factors. Thus, researchers have
carried out studies in both of these areas. The literature review will now discuss
each of these areas in relation to OISD projects. Where appropriate, attention is
given to studies concerned with generic, organisational, organisational
technology, and IS/IT projects.
2.4.2 Research into project success factor frameworks
The use of frameworks in research is commonplace. For example, a literature
search for the term will, more than likely, return thousands of articles
incorporating some kind of framework. Hence, it is hardly surprising to find that

Chapter 2. Literature review
55
frameworks (outlines, models, schemes, etc.) have appeared regularly in
project success factor literature for a number of years (Ika, 2009, p. 11; Jugdev
& Muller, 2005, p. 25). These frameworks have become increasingly holistic
and some are being empirically tested (Jugdev & Müller, 2005, p. 29). However,
the need for more inclusive project success factor frameworks still remains (Ika,
2009, p. 11).
Although there are exceptions (for example, Chow & Cao, 2008, p. 964), the
factors contained in success factor lists are typically not grouped or classified in
any coherent manner (as noted by Belassi & Tukel, 1996, p. 142; Jugdev &
Müller, 2005, p. 24). To address this issue, a number of authors have proposed
a variety of generic project success factor frameworks (in a range of shapes
and forms). Early examples include Kerzner’s model for project excellence
(Kerzner, 1987, p. 33) and Slevin and Pinto’s project implementation framework
(Slevin & Pinto, 1987, p. 35).
In the mid-1990s, Belassi and Tukel (1996, p. 144) developed a holistic
framework allowing readers to consider success factors in terms of their
classification, relationships and implications if factors were not addressed
(Jugdev & Müller, 2005, p. 25). Belassi and Tukel provided evidence to support
the usefulness of their framework based on participant responses in their study,
some of which were from IS practitioners (Belassi & Tukel, 1996, p. 149).
Westerveld (2003, p. 415) also developed a generic framework linking project
success factors to success criteria. Like Belassi and Tukel, Westerveld provides
evidence to support the usefulness of the model; in this case to assess the a
performance of a project organisation implementing an ERP solution
(Westerveld, 2003, p. 417). Fortune and White (2006) (discussed later) have
also shown how a generic framing device can be applied to IS projects
(including one OISD project). Thus, the evidence provided by these studies
suggests that generic project success factor frameworks can be applied to IS
projects and perhaps even OISD projects.
More recently, a number of IS project success factor frameworks have
appeared in the literature. For example, Vithanage and Wijayanayake (2007, p.
Chapter 2. Literature review
56
37) developed a framework for large scale information systems
implementations. Similarly, Hawari and Heeks (2010, p. 151) propose a design-
reality gap model for ERP projects. Although both studies are concerned with
implementation based projects, the factors they encompass suggest that their
frameworks might be relevant to the implementation aspects of OISD projects.
As Hawari and Heeks state, there is no reason why their framework could not
be applied to other information systems applications (Hawari & Heeks, 2010, p.
155).
Unfortunately, the literature search found only one framework that addressed
factors for OISD projects. Keil, Cule, Lyytinen and Schmidt (1998, p. 80)
propose a risk categorisation framework based on two dimensions: perceived
relative importance of risk and perceived level of control. An interesting finding
of this study was that individuals perceive risks to be higher for items over which
they have little or no control (Keil, Cule, Lyytinen, & Schmidt, 1998, p. 82).
However, although these findings are useful, the study is more notable in that it
is indicative of the need for additional OISD project success factor frameworks.
2.4.3 Research into individual OISD project success factors
Over the past decade there have been a number of studies into individual
success factors for IS and OISD projects. Unlike the remainder of OISD project
success factor research, studies in this area often employ qualitative methods.
The majority of studies have a people focus; that is, concentrating on actor
related aspects such as project manager competences, executive management
support and end user involvement. These aspects are discussed below.
2.4.3.1 Project manager competences
In their review of project success factor literature, Turner and Müller (2005, p.
49) found that, in the main, it ignored project managers, their leadership styles
and competences. However, this is not to say that the studies conducted prior
to 2005 had not provided insights into the IS project manager. For example, the
importance of selecting a project manager with the correct qualities and skills
prior to the start of an IS project had been identified (Bloom, 1996, p. 9). Thite

Chapter 2. Literature review
57
(2000) had also identified five essential leadership characteristics for IS project
managers: (1) organisational catalyst, (2) intellectual stimulation, (3) charisma,
(4) contingent reward, and (5) active monitoring of exceptions (Thite, 2000, pp.
239-240).
More recently, a few studies have advanced understanding of the IS project
manager. Successful IS project managers require excellent communication
skills. They also require a range of “emotional” competences including self
awareness, sensitivity, influence and motivational qualities. Conversely,
strategic and visionary competences in IS project managers are detrimental to
their performance. Interestingly, this competence “profile” is also well suited to
organisational change projects (Müller & Turner, 2007b, pp. 29-30). Project
manager competence profiles have also been shown to vary across the IS
project life cycle. That is, various characteristics, competences and social skills
have differing levels of importance in the initiation, planning, implementation
and closeout stages of an IS project (Skulmoski & Hartman, 2010, p. 73).
However, a project manager’s competences are of little consequence unless he
or she is sufficiently motivated. This is best served through the provision of “an
interesting task, a cohesive, goal oriented team, receiving the necessary
resources, and the possibility to influence important decisions” (Seiler, Lent,
Pinkowska, & Pinazza, 2012, p. 71).
Despite these studies, a range of research opportunities exist. First, none of
these studies focus specifically on OISD project managers. Thus, it cannot be
assumed that their findings are equally relevant to OISD projects. Issues with
generalisation also remain. For example, the findings of Skulmoski and
Hartman (2010) are based on 21 Canadian interviewees. Thus, the extent to
which the results can be generalised and applied to different cultures require
additional research (Skulmoski & Hartman, 2010, pp. 74-75). Finally, there are
competence areas that have not been addressed in an IS or OISD project
context. For example, the skills and behaviours required for effective people
management (Fisher, 2011, p. 1000). All that said, another viewpoint suggests
that the role of the project manager is over-emphasised and that understanding
of project reality would be better served by researching other areas; in

Chapter 2. Literature review
58
particular, social networks of interactions involving individuals and groups
involved in the project management process (Alojairi & Safayeni, 2012, p. 17).
2.4.3.2 Executive management support
The importance of executive management (project board) support in IS projects
has been recognised, at the very least, since the early 1980s (for example,
Wight, 1983, pp. 39-42). The failure of executive management to accept
responsibility for their IS projects has been cited as one of the main reasons
why various factors become problems during implementation (for example,
Beckley & Gaines, 1991a, p. 25; 1991b, p. 61). More recent research has even
suggested that executive management support is the most important of all
success factors in IS projects (Young & Jordan, 2008, p. 720). Zwikael (2008a,
p. 387; 2008b, p. 498) supports the view that executive management support
contributes highly to project success and identifies a number of high impact
executive management support processes for OISD projects (Zwikael, 2008b,
p. 505). However, in addition to being industry specific, these processes vary
significantly by country (Zwikael, 2008b, p. 509). Thus, additional research into
executive management support for OISD projects across various countries is
merited (Zwikael, 2008b, p. 509). Further research is also required to explore
support processes in more detail and to determine the appropriate level of
executive management support (Young & Jordan, 2008, p. 721).
2.4.3.3 End user involvement
End users, in particular their involvement in project processes, have long
appeared in OISD project success factor listings (for example, Fairley, 1994;
Rademacher, 1989; Standish Group, 1995). The negative effects of inadequate
end user involvement have also been demonstrated by numerous studies
(Jiang, Chen, & Klein, 2002). Conversely, prior literature has consistently
discussed the importance of end user involvement in the software development
life cycle (Petter, 2008, p. 707). However, as recent studies suggest, there is
substantially more to end users than simply involving them in OISD projects.
For example, end user involvement is significantly affected by pre-project
partnering activities designed to enhance collaboration and align expectations
Chapter 2. Literature review
59
among stakeholders (Jiang, Chen, & Klein, 2002, pp. 22-23). End user
involvement can also be framed (along with leadership and trust) as a strategy
for managing end user expectations (Petter, 2008, p. 704). However, as a
measure of project success, end user satisfaction has been shown to
deteriorate with increasing levels of involvement in OISD projects
(Subramanyam, Weisstein, & Krishnan, 2010, p. 138). In fact, end users are
often most satisfied when they have minimal involvement in an OISD project
(Subramanyam, Weisstein, & Krishnan, 2010, p. 140). Thus, a balance needs to
be struck when determining the optimal level of end user involvement. But the
nature of the end users’ involvement is also significant. Effective end user
involvement in the development process has been shown to be based on
shared knowledge between end users and developers or, failing that, the quality
of the relationship between the parties (Hsu, Lin, Zheng, & Hung, 2012, p. 8).
As these studies show, end user involvement is not as simple as it is often
portrayed. More so, there are ample research opportunities to examine this area
in further detail and to address issues such as the generalisability of findings
(see, for example, Petter, 2008, p. 708; Hsu, Lin, Zheng, & Hung, 2012, p. 9).
2.4.3.4 Other success factor studies
Unfortunately, only a few other actor-based success factor studies exist. Thus,
research into other OISD project actors, such as the project team, would seem
to be merited. Similarly, only a few process related articles can be found. For
example, Jones (1996) and Smuts, van der Merwe, Kotzé, and Loock (2010)
both investigated success factors for the software development life cycle; the
latter identifying nearly 50 individual success factors relating to outsourcing
software development. However, as these findings were derived from a single,
South African case study, additional research is required to address
generalisation issues. Indeed, understanding of OISD processes seems to be
poor. For example, in their study of requirements engineering, Hofmann and
Lehner (2001) state, “We know surprisingly little about the actual process”
(Hofmann & Lehner, 2001, p. 58). Research has also shown that prescribed
project management processes are often not followed in practice (de Bakker,
2009, p. 3; Fortune & White, 2009, p. 37). The findings of other studies, such as

Chapter 2. Literature review
60
Kutsch and Hall (2005), also suggest that there is merit in investigating how the
behaviours and activities of individuals impact rational OISD project processes
(see Kutsch & Hall, 2005, p. 595). Clearly then, additional research into OISD
processes in general is required. Finally, there would seem to be two
unexplored research topics: (1) artefacts as success factors for OISD projects,
and, possibly (2) external OISD project success factors.
2.4.4 Research into the influence of success factors on OISD project
success
According to some, there has been limited research into the influence of
success factors on project success (Andersen, Birchall, Jessen, & Money,
2006, p. 128; Thi & Swierczek, 2010, p. 572). However, a variety of success
factor articles in this area have been published since 2000 (refer to Table 2.11).
This suggests that, for OISD and IS projects, at least, the situation is changing.
Given the wide range of success factors identified in Section 2.4.1, the
opportunity for a great deal more research would seem to exist.
With the exception of a few qualitative studies (for example, Christensen &
Walker, 2008; de Bakker, Boonstra, & Wortmann, 2012), research in this area is
predominantly quantitative (as is the case for success factor lists discussed
above on p. 41): surveys coupled with descriptive statistical analysis. Studies in
this area tend to focus on one, sometimes two, factors. The factor under
investigation is considered as an independent variable that directly influences
project success, the dependent variable (refer to Figure 2.2). Notably, project
success is not normally considered in terms of specific success criteria. Some
of the studies give consideration to moderating variables; that is, those factors
that might have a bearing on the influence of the factor being investigated.

Chapter 2. Literature review
61
Project type Factor Influence Article(s)
OISD
Common knowledge (end users and project team)
Positive Tesch, Sobol, Klein, & Jiang (2009); Hsu, Lin, Zheng, & Hung (2012)
Requirements engineering
Positive Hofmann & Lehner (2001); Hsu, Lin, Zheng, & Hung (2012)
End user involvement Positive Jiang, Chen, & Klein (2002)
Project team motivation Positive Verner, Beecham, & Cerpa (2010)
Quality of planning Positive Dvir & Lechler (2004)
Goal changes Negative
Staff turnover Negative Hall, Beecham, Verner, & Wilson (2008)
Developer input to project estimates
None Verner, Evanco, & Cerpa (2007)
Project manager’s leadership style
Positive Sumner, Bock, & Giamartino (2006)
IS
Risk management Positive de Bakker, Boonstra, & Wortmann (2012)
Incremental organisational change
Negative Winklhofer (2001)
Project planning practices Positive Kearns (2007)
Project team dynamics Positive Gelbard & Carmeli (2009)
Organisational support Positive
Project size Negative Sauer, Gemino, & Reich (2007)
Project volatility Negative
Human resource management
Marginal Belout & Gauvreau (2004)
Project manager’s use of vision
Positive Christensen & Walker (2004)
Project vision Positive Christensen & Walker (2008)
Executive management support
Positive Young & Jordan (2008)
Project manager’s leadership style
Positive Müller & Turner (2007b)
Generic
Project sponsorship Positive Bryde (2008)
Supportive organisational environment
Positive Gray (2001)
Project commitment Positive Andersen, Birchall, Jessen, & Money (2006) Project communications Positive
Table 2.11. Research articles investigating the influence of factors on project success

Chapter 2. Literature review
62
Figure 2.2. Research model for the influence of factors on project success
Interestingly, 92% of the studies in Table 2.11 found that the factor under
investigation has an influence on project success. This seems to suggest that
further studies in this area will identify additional factors that influence project
success, thus supporting the view that project success is indeed a function of a
wide range of success factors, not a limited few as purported by the “top 10”
checklists analysed in Section 4.2.1.
Although a detailed discussion of each of the articles listed in Table 2.11 is
outwith the confines of this literature review, Sauer, Gemino and Reich (2007)
merits further discussion. This study conforms to the research model presented
in Figure 2.2. Yet, it raises an issue that the majority of success factor research
ignores, let alone addresses. Treating a success or failure factor as an
independent variable implies that the factor can be measured or assessed in
some way. Thus, some form of unit of measure might be required. For project
size, the study recommends that project budget (stated, for example, in US
dollars) is an inappropriate measure. Instead, project size is better measured by
effort: the product of project team size and project duration (expressed,
perhaps, as person-months) (Sauer, Gemino, & Reich, 2007, p. 82). The study
also identifies another issue: the degree or magnitude of a factor that influences
project success. Again, the majority of studies give no guidance on this point.
Without further information, the logical assumption is that the magnitude of a
specific factor is directly proportional to its influence on project success. In other
words, for success factors, the more the better (and vice versa). However, as
Factor (independent variable)
Project success (dependent variable)
Moderating factors (moderating variables)

Chapter 2. Literature review
63
this study shows, this is not always the case: the influence of project size on
project success is not linear. Instead, it rises slowly from 25 person-months until
1000 person-months at which point it starts to rise far more steeply (Sauer,
Gemino, & Reich, 2007, p. 81).
Sauer, Gemino and Reich (2007) also allude to another issue: the relationship
between a specific factor and project success “is [typically] not as simple or
direct as many think” (Sauer, Gemino, & Reich, 2007, p. 80). In general,
researchers investigating this area agree (for example, Andersen, Birchall,
Jessen, & Money, 2006; de Bakker, Boonstra, & Wortmann, 2012; Hsu, Lin,
Zheng, & Hung, 2012; Tesch, Sobol, Klein, & Jiang, 2009). In many cases,
specific factors are found comprise a number of other “sub” factors (see, for
example, de Bakker, Boonstra, & Wortmann, 2012; Gelbard & Carmeli, 2009;
Verner, Evanco, & Cerpa, 2007). It is also relatively common for studies to
acknowledge that the interaction between factors is relevant and therefore
requires further investigation (for example, Bryde, 2008; Hall, Beecham, Verner,
& Wilson, 2008; Tesch, Sobol, Klein, & Jiang, 2009). A number of studies (for
example, Gelbard & Carmeli, 2009; Hsu, Lin, Zheng, & Hung, 2012; Tesch,
Sobol, Klein, & Jiang, 2009) also identify the moderating effects of intermediate
factors. Finally, it is not uncommon for studies to reveal small, localised causal
chains related to the factor being investigated (for example, Hofmann & Lehner,
2001; Hsu, Lin, Zheng, & Hung, 2012; Jiang, Chen, & Klein, 2002; Wallace,
Keil, & Rai, 2004). In summary, these studies suggest that the concept of a
factor directly influencing project success is somewhat of a misnomer. Instead,
“the impact of individual factors is complex” (Hall, Beecham, Verner, & Wilson,
2008, p. 33) requiring further research to provide a better understanding of why
and how success factors contribute to project success or failure.
2.4.5 Research into causal interactions between OISD project success
factors
The research described in the previous section has provided support for the
influence of various factors on project success or failure. Yet, it has done little to
enhance understanding of how these factors interact and promulgate their
influence in practice. This is a need identified by, amongst others, Belassi and

Chapter 2. Literature review
64
Tukel (1996, p. 150). In general, the studies in the previous section have two
primary limitations. First, it is typically the combination of a large number of
factors, throughout the project life cycle, that results in project success or failure
(Belassi & Tukel, 1996, p. 142). However, by treating success factors as
independent variables, the studies do not address combinations of factors or
their interactions. Second, factors do not typically affect a project’s outcome in a
direct manner (Belassi & Tukel, 1996, p. 142). Again, by attempting to assess
the direct influence of a success factor on project success, the studies do not
identify the intermediate paths that the initial effects of given factor may actually
take over a project’s life cycle to influence a project’s outcome. Thus, in the mid-
1990s, Belassi and Tukel (1996) expressed their expectation for future research
into the causal relationships between success factors (Belassi & Tukel, 1996, p.
150). Unfortunately, research in this area is still limited, particularly so for OISD
projects. Thus, there still exists little to explain how success factors are related,
and how and why they lead to IS success or failure (Kim & Pan, 2006, p. 73).
OISD projects, have been referred to as being complex (British Computer
Society, 2004, p. 15; Williams, Klakegg, Walker, Andersen, & Magnussen,
2012, p. 44; Xia & Lee, 2004, p. 69) and complexity cited as a failure factor in a
number of studies (for example, Charette, 2005; Tiwana & Keil, 2004; Wohlin &
Andrews, 2002). This view can be traced back, at the very least, to the early
1980s, in that the management of OISD projects “is a very complex undertaking
in which a complex network of interrelationships and interactions exists” (Abdel-
Hamid & Madnick, 1983, p. 346). Making sense of such a network requires an
integrative model containing a large number of components or factors in a
complex network of interrelationships. Over and above this, an effective means
is required to accurately determine the dynamic behaviour of the interactions
between factors in the model (Abdel-Hamid & Madnick, 1983, p. 346). Hence,
enhancing understanding of OISD project success factors has two stages. First,
the relationships between success factors need to be identified. Second, the
dynamics of these relationships over the life cycle of the project requires
investigation.

Chapter 2. Literature review
65
2.4.5.1 Identifying relationships between success factors
The majority of research articles in this area address the first stage i.e.
identifying the causal interactions between success factors. Unfortunately, most
of these studies only deal with IS projects, not OISD projects. However, as the
factors encompassed by these studies also appear in success factor lists for
OISD projects (for example, executive management support and end user
involvement), their findings would seem to have some relevance for OISD
projects.
Akkermans and van Helden’s (2002) exploratory ERP case study has been
cited as a study that has moved the success factor debate on from “simply
listing factors to trying to understand the interrelationships between factors”
(King & Burgess, 2006, p. 61). This is because the study presents a causal
model incorporating the relationships between 10 success factors previously
identified by Somers and Nelsen (2001). More importantly, their relationship
model identifies a reinforcing loop of causal interactions that can act as both a
vicious or virtuous feedback loop (Akkermans & van Helden, 2002, p. 42).
Simply put, vicious loops detract from project success while virtuous loops do
the opposite. Thus, the study shows how a change in a success factor can lead
to a “self-perpetuating cycle of good or poor performance” (Akkermans & van
Helden, 2002, p. 45) that eventually leads to the success or failure of a project
(King & Burgess, 2006, p. 61).
Subsequent studies, have built upon Akkermans and van Helden’s work for IS
project success factors. Kim (2004) and Kim and Pan (2006) use customer
relationship management (CRM) case studies to develop a relationship model
for IS projects comprising 12 and 10 “essential” factors respectively. The
models help explain how and why success factors affect one another and how
their interaction leads to project success (Kim, 2004, p. 28; Kim & Pan, 2006, p.
72). King and Burgess (2006; 2008) also propose conceptual models containing
a limited number success factors linked in causal chains (King & Burgess, 2006,
p. 66; King & Burgess, 2008, p. 426).

Chapter 2. Literature review
66
Similar studies have also been undertaken by a number of researchers. For
example, Fortune and White’s (2006) theoretical study framed 27 success
factors in a formal system model that considers the relationships between
success factors. The model was then used to “distinguish” between two IS
projects, one of which was successful, the other not15 (Fortune & White, 2006,
p. 63). Butler and Fitzgerald’s (1999) case study of an IS development process
was presented as a network analysis of 20 factors; thus illustrating that IS
development success factors (for example, a committed project sponsor and
adequate documentation) are closely related. Not only do these success factors
influence each other, but the strength of these influences can vary (Butler &
Fitzgerald, 1999, p. 368). Similarly, Sabherwal, Jeyaraj and Chowa (2006)
provided a theoretical IS model containing a mere six factors (and four criteria),
described as either context related (top management support and facilitating
conditions) or user related (user experience, training, attitude and participation).
The study identifies a number of relationships between factors, not all of which
were “expected” by the authors: for example, the influence of user attitudes on
IS quality (Sabherwal, Jeyaraj, & Chowa, 2006, p. 1858). Yetton, Martin,
Sharma, and Johnston (2000) also provided a causal model of OISD project
performance containing 12 factors. The model helps highlight the significance of
executive management support, risk management and project team dynamics
for strategic projects and end user involvement to ensure successful OISD
project performance (Yetton, Martin, Sharma, & Johnston, 2000, p. 263).
Finally, Procaccino, Verner, Darter and Amadio (2005) proposed an model for
OISD project success containing 10 factors. The model, based on data
collected from software practitioners, identifies a number of relationships
between factors. More so, the model identifies a chronological critical path of
success factors in which having a project champion influences the amount of
time that end users make for requirements gathering. This, in turn, leads to a
high level of end user involvement in the development process which results in
15 An OISD project and an IS implementation project.

Chapter 2. Literature review
67
better agreement on requirements between end users and the project team
(Procaccino, Verner, Darter, & Amadio, 2005, p. 196).
Although these studies have enhanced understanding of the interaction of IS
and OISD project success factors, they have a number of limitations. First, all of
the studies address only a small number of key success factors. Similarly, only
three of the studies include (simple) causal loops and the treatment of success
criteria across the studies as a whole is best described as limited. Thus, they
represent relatively simple scenarios, requiring the addition of more success
factors, relationships and criteria to provide a better representation of complex
OISD projects (Kim, 2004, p. 28; King & Burgess, 2008, p. 430). Thus, there is
a significant opportunity for researchers to provide more comprehensive causal
models that provide a better explanation of the behaviour of real-world OISD
projects. Second, further research is required to validate, complement and
extend the conceptual models presented by the studies. Finally, and most
importantly, because all the models are still static in nature, they do not address
the dynamic nature of real-world IS and OISD projects.
2.4.5.2 Investigating the dynamics of success factor relationships
Altuwaijri and Khorsheed (2012) note the static nature of success factors
identified in prior research (Altuwaijri & Khorsheed, 2012, p. 38). King and
Burgess (2006) cite similar concerns (King & Burgess, 2006, p. 67) and hence
the need to develop dynamic success factor models for OISD projects. A
number of authors have identified computerised simulation modelling
techniques as a means to accomplish this (for example, Abdel-Hamid &
Madnick, 1983, p. 346; King & Burgess, 2006, p. 62; King & Burgess, 2008, p.
430; Lee & Miller, 2004, p. 80). As Lee and Miller (2004) state, “Simulation is a
useful tool for tactical management in software engineering. It provides a means
to study complex phenomena in project development that cannot be carried out
easily with actual cases” (Lee & Miller, 2004, p. 80). Indeed, the use of
modelling techniques for other project types (other than OISD projects) has
shown to be extremely useful in developing understanding of how complex
projects behave (Cicmil, Williams, Thomas, & Hodgson, 2006, pp. 682-683) and

Chapter 2. Literature review
68
has made a significant contribution to understanding the actuality of projects
(Cicmil, Williams, Thomas, & Hodgson, 2006, p. 684). Yet, despite such
promise, simulation remains an under-explored technique for understanding
success factors in IS projects (King & Burgess, 2008, p. 430) and OISD
projects. Thus, although tentative steps have been carried out in this area (for
example, King & Burgess, 2008), the use of simulation models, to enhance
understanding of the dynamic relationships between success factors in OISD
projects, represents a significant opportunity for further research.
2.5 Dimensions of OISD project success factor research
Having discussed the five OISD project success factor research directions, the
discussion will now turn to the state-of-the-art of empirical research in the area.
This can be described using three dimensions: culture, perspective and
approach.
Empirical research into OISD project success factors relies almost entirely on
the views of practitioners associated with this type of project. The same is true
for factor research investigating other project types. In this respect, project
success factor research is very much practice-led (based on empirical data) as
opposed to being theoretically-derived (normative). Prior research (for example
Peterson, Kim, Kim, & Tamura, 2002, p. 434) has shown that perceptions of
OISD project success factors varies by geographical location. More accurately,
success factors are viewed differently depending on a practitioner’s cultural
environment. Because of this, a number of authors have identified an
opportunity for their findings to be explored in other cultural settings (for
example, Moynihan, 1996, p. 365; Procaccino, Verner, & Lorenzet, 2006, p. 83;
Skulmoski & Hartman, 2010, pp. 74-7; Taylor, 2007, p. 22; Zwikael, 2008b, p.
509). Hence, there is ample opportunity for research into OISD project success
factors in different countries and/or cultures.
Many organisations outsource their OISD process to external suppliers (Elitzur,
Gavious, & Wensley, 2012, p. 379; Heiskanen, Newman, & Eklin, 2008, p. 268).
Although a number of studies include supplier based OISD projects (for
example, Mahaney & Lederer, 2003; Procaccino, Verner, & Lorenzet, 2006), the

Chapter 2. Literature review
69
perspective investigated is almost entirely that of the client, not the supplier
(Savolainen, Ahonen, & Richardson, 2012, p. 2; Taylor, 2007, p. 22). Indeed, a
recent review of IT outsourcing literature (refer to Lacity, Khan, & Willcocks,
2009) identifies 191 outsourcing articles, all of which present the clients’
perspective. Unfortunately, limiting research to the client perspective does not
reflect the reality of OISD projects (Savolainen, Ahonen, & Richardson, 2012,
pp. 9-10). This is because, for subcontracted projects, the supplier and client
may have differing viewpoints on the factors that contribute to project success
or failure (Cerpa & Verner, 2009, p. 132; Savolainen, Ahonen, & Richardson,
2012, p. 2; Taylor, 2007, p. 22) and that the suppliers’ perspective can be
different from that espoused in mainstream literature (Moynihan, 1996, p. 364).
As a consequence, understanding of OISD projects, from a suppliers’
perspective, is poor (Savolainen, Ahonen, & Richardson, 2012, p. 2). Hence,
there is a need for empirical studies that examine OISD projects from the
suppliers’ perspective (Savolainen, Ahonen, & Richardson, 2012, p. 10).
Empirical research into OISD project success factors is predominantly
quantitative (Ika, 2009, p. 12). As a result, a number of success factors have
been identified. A number of studies have also supported the existence of
various success factors by attempting to qualify their direct influence on project
success. However, understanding of OISD projects is still far from complete. In
particular, understanding of real-world projects is poor (Cicmil, Williams,
Thomas, & Hodgson, 2006, p. 675) as is the matter of how and why OISD
success factors influence project success in practice. Although the reasons for
this are not clear, there seems to be sufficient argument that qualitative
research methods are more appropriate to addressing these issues. For
example, the only OISD project success factor list studies to acknowledge the
large number of potential factors (that is, Bannerman, 2008; Moynihan, 1996),
utilise qualitative methods. From a more general standpoint, qualitative methods
are considered to be particularly effective when understanding of a particular
phenomenon is modest (Eriksson & Kovalainen, 2008, p. 5). Hence, it would
seem that developing a better understanding of OISD project success factors
would benefit from qualitative as opposed to quantitative methods.
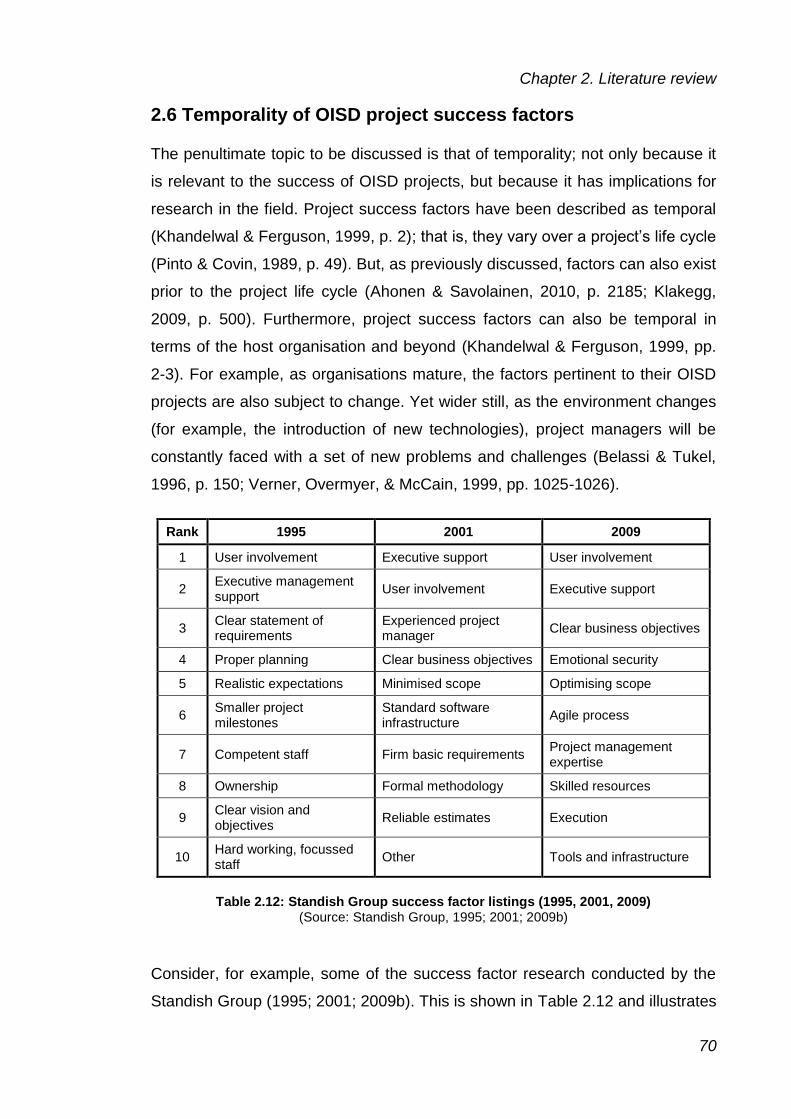
Chapter 2. Literature review
70
2.6 Temporality of OISD project success factors
The penultimate topic to be discussed is that of temporality; not only because it
is relevant to the success of OISD projects, but because it has implications for
research in the field. Project success factors have been described as temporal
(Khandelwal & Ferguson, 1999, p. 2); that is, they vary over a project’s life cycle
(Pinto & Covin, 1989, p. 49). But, as previously discussed, factors can also exist
prior to the project life cycle (Ahonen & Savolainen, 2010, p. 2185; Klakegg,
2009, p. 500). Furthermore, project success factors can also be temporal in
terms of the host organisation and beyond (Khandelwal & Ferguson, 1999, pp.
2-3). For example, as organisations mature, the factors pertinent to their OISD
projects are also subject to change. Yet wider still, as the environment changes
(for example, the introduction of new technologies), project managers will be
constantly faced with a set of new problems and challenges (Belassi & Tukel,
1996, p. 150; Verner, Overmyer, & McCain, 1999, pp. 1025-1026).
Rank 1995 2001 2009
1 User involvement Executive support User involvement
2 Executive management support
User involvement Executive support
3 Clear statement of requirements
Experienced project manager
Clear business objectives
4 Proper planning Clear business objectives Emotional security
5 Realistic expectations Minimised scope Optimising scope
6 Smaller project milestones
Standard software infrastructure
Agile process
7 Competent staff Firm basic requirements Project management expertise
8 Ownership Formal methodology Skilled resources
9 Clear vision and objectives
Reliable estimates Execution
10 Hard working, focussed staff
Other Tools and infrastructure
Table 2.12: Standish Group success factor listings (1995, 2001, 2009) (Source: Standish Group, 1995; 2001; 2009b)
Consider, for example, some of the success factor research conducted by the
Standish Group (1995; 2001; 2009b). This is shown in Table 2.12 and illustrates

Chapter 2. Literature review
71
the temporal nature of 17 OISD project success factors between 1995 and
2009. Although end user involvement and executive management occupy the
two most highly ranked positions over the three studies, the other factors
demonstrate greater degrees of temporality. For example, the relative
importance of project “objectives” rises with each subsequent study. Yet, none
of the other factors (14) appear in all three lists and nearly half (eight) only
once. Indeed, even those that appear in two of lists (six) show important
changes. For example, project “scope” evolves from being minimised to
optimised between 2001 and 2009, despite retaining its rank. Similarly, a formal
methodology for software development is replaced by an agile approach over
the same period.
In summary, OISD project success factors represent a “moving target”, based
upon which, two conclusions can be drawn. First, the temporal nature of factors,
is another possible reason for the general lack of agreement on success factors
for OISD projects. Second, temporality also serves as a driving force for
continuous research into OISD project success factors, thus keeping research
in line with the reality of contemporary OISD projects.
2.7 Theoretical basis of OISD project success factors
Having provided a critical analysis of the OISD project success factor and
related literature, the final area of discussion is the theoretical basis for said
factors, which it borrows, for the main part, from generic project success factor
theory. Unfortunately, much like project management theory as a whole (see p.
22), success factor theory is seldom expressed explicitly in the literature.
Indeed, even where theory is stated clearly as such (for example, in project
success factor frameworks and, to a lesser extent, research into causal
interactions between project success factors), the theory espoused in these
studies receives little or no support beyond the limited evidence provided by the
original articles’ authors. However, the main problem is that the majority of
project success factor research comprises empirical studies that fail to use their
findings to build theory. Consequently, project success factor research has

Chapter 2. Literature review
72
provided very little in terms of theory development (Söderlund, 2004a, p. 187;
Söderlund, 2004b, p. 659).
All that said, this does not mean that a theory of OISD project success factors
does not exist. On the contrary, it is quite possible to determine what may be
construed as OISD project success factor theory by examining the research
literature discussed in this chapter and identifying the “theoretical” elements that
seem to have gained general (or, at least, partial) acceptance by the research
community. The remainder of this section “builds” such a theory.
The starting point for OISD project success factor theory is that project success
contains two mutually exclusive aspects: (1) success criteria and (2) success
factors (see p. 27). In relation to success criteria (the measurements of project
success), project success is, again, considered to have two aspects: (1) project
management success and (2) organisational success, each with their respective
success criteria (see p. 28).
Turning now to success factors, Rockart’s definition of CSFs for project
management still has merit: “the few key areas of activity in which favourable
results [are] absolutely necessary for a particular manager to reach his goals”
(Bullen & Rockart, 1981, p. 3). More recent definitions (for example, Ika, 2009,
p. 8; Milosevic & Patanakul, 2005, p.183) are also valid but, when considered
as a whole, suggest that a project success factor is anything that contributes to
the success of a project (see p. 6).
Despite the identification of nearly 500 unique OISD project success factors,
success factor theory retains the “critical” nature of success factors. That is,
project success is dependent on a few, rather than a large number of factors.
For the main part, this is due to the large number of empirical studies that
produce “top 10” factor lists (see p. 40). The same is true for research into
causal interactions between project success factors (see p. 63) that produces
simplistic networks comprising limited numbers of success factors, linear causal
chains and causal loops in an attempt to explain the manner in which success
factors affect project success.
Chapter 2. Literature review
73
In summary, OISD project success factor theory constitutes a simplistic model
of success factors, their relationships and the way in which success factors
affect project success. As this simplicity does not reflect the complex nature of
contemporary projects (Bredillet, 2005, p. 3; Crawford, Morris, Thomas, &
Winter, 2006, p. 724; Fortune & White, 2009, p. 37; Winter & Smith, 2006, p.
13), project success factor theory can only be described as weak in its ability to
provide credible explanations of the behaviour of real-world OISD projects.
2.8 Conclusion
The literature review shows that OISD project success factors, incorporating
failure and risk factors, is a vibrant research area. Driven by the poor
performance of OISD projects, the research area has number of active research
directions, all of which can be further justified by the temporal nature of project
success factors, poor understanding of the “actuality” of real-world projects
(Cicmil, Williams, Thomas, & Hodgson, 2006, p. 675) and the weak theoretical
basis for the research area.
Studies providing descriptive lists of OISD project success factors remain
popular and are beginning to enhance understanding of specific perspectives,
such as that of the supplier, and various cultural settings (see, for example,
Sharma, Sengupta, & Gupta, 2011). Yet, specialised studies of this type are
rare and significant research opportunities still exist. In particular, there is a
need for more empirical studies that examine OISD projects from the suppliers’
perspective (Savolainen, Ahonen, & Richardson, 2012, pp. 10) and in different
cultural contexts (see, for example, Moynihan, 1996, p. 365; Procaccino,
Verner, &Lorenzet, 2006, p. 83; Skulmoski & Hartman, 2010, pp. 74-7; Taylor,
2007, p. 22; Zwikael, 2008b, p. 509). The success factor analysis described in
Section 2.4.1 (see p. 40) also suggests that OISD projects comprise a large
number of relevant success factors (see also Bannerman, 2008; Moynihan,
1996). Thus, approaches such as overly-simplistic “top 10” or laundry lists of
success factors, produced by predominantly quantitative techniques, are not
sufficient to describe the richness of what really happens in a project
environment (Cicmil, Williams, Thomas, & Hodgson, 2006, p. 684). Instead,

Chapter 2. Literature review
74
qualitative approaches would seem far better suited to enhancing
understanding of real-world OISD projects and the reasons why these projects
succeed or fail.
The literature review identified a lack of frameworks for OISD project success
factors. There is also scope for additional studies into the influence of individual
factors on OISD project success. However, the contributions made by both of
these research directions are at an abstract rather than detailed level. They are
also relatively simplistic and receive little or no support other than the limited
evidence provided by the original authors. Frameworks, for example, tend to be
high level outlines as opposed to in-depth explanations. Similarly, research into
the influence of individual factors on OISD project success does not explain
how these factors actually interact and promulgate their influence in practice.
Indeed, the concept of a factor directly influencing project success is somewhat
of a misnomer. Hence, in terms of enhancing understanding of complex, real-
world OISD projects, the potential contributions made by these research
directions would seem to be somewhat limited.
Understanding of the dynamic relationships between OISD project success
factors is poor; so much so, that this research direction is probably best
described as being in its infancy. There is certainly a need to develop dynamic
success factor models for OISD projects. However, a precursor to achieving this
is the identification of the numerous success factor relationships/interactions
that might exist in real-world OISD projects. Therefore, research that seeks to
identify and describe such relationships is certainly needed. In particular,
research that explains the way in which success factors interact and hence
propagate their influences to affect project success would seem to be of
particular value.
The remainder of this thesis describes an empirical study that contributes to two
of the areas discussed above. Specifically, the research investigates OISD
project success factors as viewed by information system supplier organisations
in Scotland; the first time that such a perspective has been studied. The study
extends beyond the identification of individual success factors and provides

Chapter 2. Literature review
75
detailed explanations of factors as perceived by OISD project professionals.
The study also examines the way in which success factors interact and hence
propagate their influences to affect OISD project success.

Chapter 3. Methodology
76
3. Methodology
3.1 Introduction
This chapter presents the methodology employed to conduct this research
project. In so doing, the research approach and methods are clearly described.
This is particularly important in the field of project management as the majority
of researchers in this area (over 90%) do not make their research methodology
explicit (Morris, 2010, p. 143).
This chapter is structured as follows. Over the next two sections an overview of
the research approach is provided followed by a discussion of its philosophical
foundations. The subsequent sections of the chapter describe various aspects
of the research in more detail. First, the literature review is discussed in terms of
the literature search and a quantitative analysis of OISD project success
studies. Next, the use of pilot interviews is described. The main part of the
chapter then presents the main fieldwork process. This process comprised five
stages:
(1) Company selection;
(2) Interview arrangement;
(3) Data collection;
(4) Qualitative analysis;
(5) Relationship analysis.
Following the main fieldwork process, the problems experienced during the
research are described. Prior to the chapter’s conclusion, the quality of the
research process is discussed in terms of its validity and reliability.
3.2 Overview of the research approach
This research was conceived from the consensus of research articles that
identified the poor performance of organisational information systems
development (OISD) projects to be a serious and recurrent problem. In other
words, too many OISD projects failed to meet the required success criteria

Chapter 3. Methodology
77
determined at their outset. Subsequently, an investigation into the reasons why
contemporary OISD projects succeed or fail was deemed worthy of a doctoral
research project. Thus, the aim of the project was to provide a better
understanding of the reasons why OISD projects succeed or fail.
To develop this aim further, a comprehensive review of literature in the field was
required (discussed in Section 3.4). The review revealed a number of gaps in
the literature and, in particular, indentified the need for research into:
(1) OISD project success factors from the suppliers’ perspective;
(2) The numerous success factor relationships/interactions that might (or
might not) exist in real-world OISD projects.
Thus, the research objectives for this study were defined as follows:
(1) To provide a better understanding of OISD project success factors from
the suppliers’ perspective;
(2) To provide a better understanding of the way in which these factors
interact to influence project success.
Satisfying these objectives would require various “instruments” to collect and
analyse data (see, for example, Denscombe, 1998, p. 240; Merriam, 1995, p.
51; Pyett, 2003, p. 1170). Appropriate data sources also needed to be
identified. All in all, these instruments and data sources would need to be
combined in a coherent research approach. Broadly speaking, the choices
available were that of a quantitative or qualitative approach, or perhaps a hybrid
of the two.
The literature review suggested that future research should adopt a qualitative
approach. A review of the literature discussing qualitative research theory also
supported this view (see, for example, Denscombe, 1998; Fielding & Thomas,
2001; Labuschagne, 2003; Patton, 2002); in particular, that providing a better
understanding of OISD project success factors would benefit from a qualitative
study. The primary reason for this was that “understanding” would be best
served by providing in-depth descriptions of success factors in real-world OISD

Chapter 3. Methodology
78
projects. In so doing, this would allow the research to contribute to
understanding the actuality of projects. This is a gap in the literature identified
by various researchers (for example, Cicmil, Williams, Thomas, & Hodgson,
2006, p. 675; de Bakker, 2009, p. 3; Fortune & White, 2009, p. 37).
For qualitative research, the instruments utilised for data collection are typically
interviews, observation or the review of pertinent documents. Having concluded
that observation and document review were not practical options, qualitative
interviews were identified as the instrument for data collection.
Qualitative interviews can take numerous forms in terms of the structure they
employ. An interview can be highly structured (similar to a quantitative survey),
comprising a number of specific, closed questions. Conversely, an interview
may exhibit no structure other than a single, open-ended question. Clearly, an
interview can also be structured anywhere between these two extremes; that is,
containing varying degrees of specific and open-ended questions. Given that
research into OISD project success factors from the suppliers’ perspective was,
at best, in its infancy, a relatively unstructured interview was deemed
appropriate for this project. This would allow the interviewees to identify and
discuss success factors as they saw fit and with minimal bias from the
researcher and his knowledge of prior research. However, it was also
recognised that the interviews needed to collect a small amount of quantitative
data regarding the interviewees’ roles and experiences. Thus, the interview
structure was defined as follows:
(1) Eight short, closed questions to solicit/confirm interviewee details;
(2) A single open-ended research question in the form of a statement: “In my
experience as a [project role], [a particular factor] is significant to the
success or failure of an OISD project because ... [discussion]” affording
the interviewees the opportunity to identify and discuss factors as they
saw fit.

Chapter 3. Methodology
79
Having defined the data collection approach, interview structure and specific
questions, attention turned to the data analysis approach. It was decided that
the interviews should be transcribed verbatim. Although this would be a very
time consuming exercise, it would provide an important opportunity for the
researcher to familiarise himself with the interview data. Verbatim transcripts
would also serve as a basis for both broad and detailed coding.
To satisfy the first research objective (providing a better understanding of OISD
project success factors from the suppliers’ perspective) a qualitative approach
would be employed. This would involve a broad, entity-based coding approach
to identify themes from the transcripts. These themes, in themselves high-level
success factors, would be based on a coding structure derived from the
success factor analysis performed as part of the literature review (discussed
below). However, it was also anticipated that a degree of open-coding would be
required. If necessary, these themes would then amalgamated and the text for
each reviewed to produce informative narratives for each factor.
Satisfying the second research objective (providing a better understanding of
the way in which OISD project success factors interact to influence project
success) would require a more quantitative coding approach. In this instance,
the transcripts would be analysed in more depth to identify detailed success
factors (represented as entities and characteristics) and relationships
(influences) between them.
Having determined the basic approaches for data collection and analysis, a
series of six pilot interviews were carried out (described in Section 3.5). The
primary objective of these interviews was to test the research processes and
hence determine their “quality” prior to the main fieldwork process (described in
Section 3.6). The pilot interviews suggested that the processes were, indeed, fit
for purpose. However, it was deemed necessary to add another open-ended
interview question: “How do you define project success?” This question would
act as a precursor to the main interview question (discussed further in Section
3.6).

Chapter 3. Methodology
80
Next, the main fieldwork process commenced with the identification of
appropriate data sources. Scotland has a strong IT sector comprising numerous
IT departments and, more so, a variety of supplier organisations. These supplier
organisations range from small, highly specialised companies to large, global
players. The sector employs in excess of 40,000 personnel which, compared
with the whisky industry (11,200), textiles (27,000) and the electronics sector
(41,000), makes it a significant asset to the Scottish economy (ScotlandIS,
2012). Hence, a priori sampling was used to identify candidate supplier
organisations for the research project. As opposed to random sampling, this
form of purposeful sampling helped ensure that the interview participants were
knowledgeable in terms of the research project’s subject matter. During the
subsequent interviews, additional participants were secured using snowballing
(another form of purposeful sampling). In all, 33 participants were interviewed
and, as all but one of the interviews were recorded, the recordings transcribed
as described above.
Broad, entity-based coding and subsequent analysis (as described above) were
then used to satisfy the first research objective (providing a better
understanding of OISD project success factors from the suppliers’ perspective).
This resulted in various definitions of OISD project success and the
identification of 20 OISD project success factors. These findings, presented in
Chapter 4, also confirmed that the success factors comprised of more detailed
factors and that relationships existed between the factors. Consequently, the
interview transcripts were coded in detail as described above.
At this stage, the second research objective (providing a better understanding of
the way in which OISD project success factors interact to influence project
success) was expanded. That is, to provide a better understanding of:
(1) The number of detailed success factors (and success criteria) that are
involved;
(2) The relationships that exist between the factors;
Chapter 3. Methodology
81
(3) The causal chains by which success factors propagate their influence to
affect project success;
(4) The key factors and relationships involved in the propagation process.
The detailed coding process had identified a large number of detailed factors
and relationships between them. Hence, a small software application was
developed to identify causal chains (and loops) and the key factors and
relationships involved in the propagation process. This software was then used
to help analyse the detailed factors and their relationships, the findings of which
are presented in Chapter 5.
3.3 Philosophical foundations of the research approach
This section discusses the philosophical foundations of the research approach.
The way in which these foundations, or assumptions, have informed the
research approach is explained, as is their influence on the use of quantitative
and qualitative methods. The limitations of the approach and the ensuing
knowledge claims are also discussed.
The philosophical foundations of social research are “messy” (Crotty, 1998, p.
216). The “language-in-use” is often daunting (Johnson & Duberley, 2000, p. 2)
and no discussion can be considered complete (Creswell, 2012, p. 23). There
are no set standards (Creswell & Clark, 2007, p. 22) or firm guidelines
(Creswell, 2012, p. 65). The terminology is inconsistent and even contradictory
(Crotty, 1998, p. 1); for example, one author’s epistemology16 can be another’s
interpretive framework (compare, for example, Crotty, 1998, p. 5 and Creswell,
2012, pp. 36-37). Further still, a given epistemology might exist in an array of
bewildering varieties (see, for example, Crotty, 1998, p. 20; Halfpenny, 2003, p.
372). Viewpoints are still evolving (Creswell & Clark, 2007, p. 22) and authors
often disagree over the tenets associated with a certain research approach
(see, for example, Creswell, 2012, pp. 226-228). Perhaps because of this
16 The author’s viewpoint regarding the nature of knowledge (Stainton-Rogers, 2006, p. 79).

Chapter 3. Methodology
82
“mess”, the philosophical foundations of social research are often ignored
(Easterby-Smith, Thorpe, & Jackson, 2008, p. 56), hidden (Myers, 2009, p. 35),
overlooked (Creswell, 2012, p. 18) or, at best, seldom clearly presented
(Johnson & Duberley, 2000, p. 8).
Although it can be argued that researchers should refrain from debating
philosophical issues (Pickard, 2007, p. 5; p. 22) and that this is best left to
“those who care about it” (Miles & Huberman, 1988, p. 223 cited by Pickard,
2007, p. 22), to do so disadvantages the researcher. In particular, the
philosophical foundations of a research approach17 exert considerable influence
on what can and cannot be achieved. They also place limits on any ensuing
knowledge claims (Myers, 2009, pp. 35-36). Hence, researchers would do well
to understand these foundations (Creswell, 2012, p. 83; Pickard, 2007, p. 5; Lee
& Lings, 2008, pp. 50-51; Myers, 2009, pp. 35-36) and the way in which they
inform and guide their research (Creswell & Clark, 2007, p.20; Guba & Lincoln,
1998, p. 218 cited by Pickard, 2007, p. 5).
The primary philosophical stance adopted within this thesis is based upon an
interpretive18 epistemology19. Hence, the research approach is rejecting the
positivist20 worldview of the nature of knowledge i.e. that it may be attained by
way of detached, value-free observation that seeks to identify universal features
of its subject matter to offer explanation, control and predictability (Crotty, 1998,
p. 67). Although positivism has been shown to have merit for research into the
natural sciences, this is not necessarily the case for social and cultural issues;
17 This section uses the term research approach instead of research paradigm due to the
numerous meanings afforded to the word paradigm in the research literature (Creswell &
Clark, 2007, p. 21).
18 Also referred to in the literature as interpretivist (see, for example, Crotty, 1998, p. 67) and
interpretivism (see, for example, Creswell, 2012, p. 24).
19 Although epistemology (i.e. understanding what it means to know) is discussed in this
section, ontology (i.e. understanding what is) is not. This is because ontology need not be
expressly addressed when discussing a research approach (Crotty, 1998, pp. 10-12).
20 Also referred to in the literature as positivism (see, for example, Pickard, 2007, p. 6).
Chapter 3. Methodology
83
such as those related to OISD projects. Instead, an interpretive epistemology,
through its acceptance of multiple realities (Lee & Lings, 2008, p. 60) and
culturally devised interpretations of the world, seems better suited to describe
and understand social and cultural reality (Crotty, 1998, pp. 66-67).
An interpretive epistemology provides access to various interpretive frameworks
(Creswell, 2012, pp. 35-38). Of relevance to this research project is the social-
constructivism21 framework in which reality is neither objective nor exterior, but
is “socially constructed and given meaning by people” (Easterby-Smith, Thorpe,
& Jackson, 2008, p. 58). It is important to note that all of the data collected by
this research project can be considered to be socially constructed. Thus, in
terms of its data collection, this research project can be considered
epistemologically pure. However, a pragmatic framework i.e. one by which
reality is made known through the use of methods that are considered both
practical and workable (Creswell, 2012, p. 37), is also relevant. Given that
researchers are responsible for devising a research process that serves their
purposes best (Creswell, 2012, p. 28; Crotty, 1998, p. 216), a pragmatic
framework is not only justified, but essential.
An interpretive epistemology can be realised through a number of research
methodologies, of which the phenomenological study is best suited to this
research project. Phenomenology is the study of lived, human experiences (Lee
& Lings, 2008, p. 59) and phenomenological studies report how their
participants “view their experiences” (Moustakas, 1994 cited by Creswell, 2012,
p. 20). This type of research lends itself well to qualitative methods (Denzin &
Lincoln, 2011, p. 3 cited by Creswell, 2012, p. 44; Lee & Lings, 2008, p. 65).
These include open-ended interviews; “the more open-ended the questioning,
the better” (Creswell, 2012, p. 25). Also relevant are coding, analysis and
presentation techniques, all designed to explore their subject matter in extreme
21 Also referred to in the research literature as constructivist (see, for example, Pickard, 2007,
p. 6) and constructionism (see, for example, Easterby-Smith, Thorpe, & Jackson, 2008, p.
58); although it is acknowledged that certain authors distinguish between words such as
constructivism and constructionism (see, for example, Crotty, 1998, p. 79).
Chapter 3. Methodology
84
depth and detail (Creswell, 2012, p. 79; Pickard, 2007, p. 240). However, as
quantitative data is useful to interpretive research (Lee & Lings, 2008, p. 65), a
mixed method approach can also be of merit (Creswell & Clark, 2007, p. 34;
Crotty,1998, p. 15). Thus, a quantitative relationship analysis was performed
(refer to Section 3.6.5) to complement the initial qualitative analysis (refer to
Section 3.6.4).
The adoption of a phenomenological methodology founded on an interpretive
epistemology with pragmatic and social constructionist frameworks brings with it
a number of potential limitations. First, constructionist truth is neither absolute or
appropriate for generalisation (Crotty, 1998, p. 16). Simply put, in interpretive,
socially constructed research, the generalisation of findings is impossible
(Dervin, 1997, p. 14 cited by Pickard, 2007, p.13; Lee & Lings; 2008, p. 67).
Thus, all such claims should be avoided. That said, interpretive, socially
constructed research is still suited to theory generation (Easterby-Smith,
Thorpe, & Jackson, 2008, p. 72) and the development of practice and policy
(Creswell, 2012, p. 81); albeit subject to appropriate consideration of its
suitability for transferability (Erlandson, Harris, Skipper, & Allen, 1993, p. 33
cited by Pickard, 2007, p.13).
Second, knowledge that is both constructed and interpreted is intrinsically
altered, modified and contaminated by these processes, their context and their
actors. For example, due to their unavoidable personal involvement,
researchers might be unable to separate individual experience from its holistic,
socio-historical context (Lee & Lings, 2008, p. 60). In other words, bracketing22
personal experiences might prove impossible for researchers and, hence, their
assumptions will always be incorporated in their findings in some way (Creswell,
2012, p. 83). Thus, meaning is always modified by the interpretive process
(Blumer, 1969, p. 2 cited by Crotty, p. 72). Although this is a central tenet of
interpretive research, it should also be recognised as a potential limitation;
22 The process by which a researcher excludes his or her experiences from the research
(Creswell, 2012, p. 78).

Chapter 3. Methodology
85
especially if the intended audience of the research do not share comparable
ontological and epistemological beliefs (Easterby-Smith, Thorpe, & Jackson,
2008, p. 73). Put another way, the subjective nature of the findings (Easterby-
Smith, Thorpe, & Jackson, 2008, p. 73), being culturally and historically affected
(Crotty, 1998, p. 64), can be problematic for audiences of a differing culture
and/or of a positivist viewpoint (Halfpenny, 2003, p. 379).
Finally, socially constructed, interpretive approaches seek to provide complex,
detailed understanding (Creswell, 2012, p. 65). However, there are limitations
regarding the completeness of such an understanding. For example,
phenomenology treats culture as both enabling but, paradoxically, crippling;
“while it offers us entrée to a comprehensive set of meanings, it shuts us off
from an abundant font of untapped significance” (Crotty, 1998, p. 71). Similarly,
socially constructed reality is always “unstable, constantly changing, and
unavoidably subjective” (Lee & Lings, 2008, p. 60). Thus, interpretation and
knowledge are never final (Lee & Lings, 2008, p. 60) and interpretive findings
can sometimes be construed as being tentative and inconclusive (Creswell,
2012, p. 187), as opposed to being complete.
In conclusion and, all of the above said, it is best remembered that limitations
are inevitable for the majority of research projects (Pickard, 2007, p. 55) and the
ensuing knowledge claims. Thus, it is important that these limitations are clearly
identified and explained (Pickard, 2007, p. 55). The difficulties and limitations
encountered by this research project are discussed below in Section 3.7.
3.4 Literature review
Having provided an overview of the research approach and discussed its
philosophical foundations, the remaining sections of this chapter will provide
details of five aspects of the research methodology. These are (1) the literature
review (this section), followed by (2) the pilot interviews, (3) the main fieldwork
process, (4) the difficulties encountered during the project and (5) the quality of
the research process.

Chapter 3. Methodology
86
The literature search and review processes initiated at the start of this research
continued throughout the study. The final update to the content of the literature
review was performed in June 2012. Interestingly, the frequency by which
project success factors are discussed in the literature grew over the course of
the study, indicating increased interest in the topic. These articles have served
to reinforce the need for the research described in this thesis.
3.4.1 Literature search
The literature review, as provided in Chapter 2, makes use of a diverse
collection of research material. For the main part, the discussion makes
reference to significant articles from leading, peer-reviewed journals in the fields
of project management and information systems, as well as other related fields
such as business management and software development respectively. These
publications include the International Journal of Project Management, the
Project Management Journal, the European Journal of Information Systems and
the Journal of Strategic Information Systems. Reference is also made to a
limited number of conference papers.
Software development has been described as a practitioner led discipline
(Glass, 2003, p. 21). Important advances in project management research have
also been made in publications outwith the realm of academic journal articles
(Jugdev & Müller, 2005, p. 25). Consequently, various other sources such as
books and commercial articles, written by academics and practitioners alike, are
cited as deemed appropriate.
It is important to define the scope of material covered in the literature review.
Project success is intrinsic to all OISD projects. That is, all projects are intended
to be successful in terms of meeting their initial objectives. Thus, it can be
argued that each and every research article that describes an aspect of an
OISD project is, in some way or another, related to project success. This is
particularly true for success factors. There are also studies outside the field that
should be examined and integrated into project management (Alojairi &
Safayeni, 2012, p. 16). However, it would be impossible for this research project
to review all of the literature that addresses all aspects of OISD projects and

Chapter 3. Methodology
87
their management. Therefore the discussion is limited, for the main part, to
those publications that deal directly with OISD project success in terms of
success criteria and success, failure and risk factors.
On the whole, publications were sourced from online databases to which
Edinburgh Napier University provides access. These resources were used to
gain access to scholarly journals (and other materials) relating to project
management, information systems and software development. The databases
included ABI/INFORM Complete (ProQuest), ACM Digital Library (ACM),
Emerald Journals (Emerald), Expanded Academic ASAP (Gale) and
IngentaConnect (Ingenta). Google Scholar was also used to identify a number
of articles.
The initial literature search was conducted using combinations of the terms
shown in Table 3.1 (16 combinations in all). The combinations were used to
identify articles containing the terms in their titles, abstracts and key words (or
similar depending on the search options provided by each database). Literature
searches were carried out periodically throughout the research project
(approximately once every six months).
Term 1
AND
Term 2
Information systems Success factors
Information technology Failure factors
Software projects Risk factors
Software development Success criteria
Table 3.1. Literature search term combinations
The literature search also involved a significant amount of “snowballing” to
identify further material from citations found in articles. This proved to be
particularly important as a number of articles that are key to this research (for
example, Moynihan, 1996) could not be identified using the terms shown in
Table 3.1. The end product of the literature search was a selection of 325
articles, books, book chapters, etc., that, although not complete in terms of

Chapter 3. Methodology
88
every article written on OISD project success, was deemed sufficient to conduct
a satisfactory review of said literature. Again, this is particularly important in the
field of project management as, all too often, researchers “seem to have only a
partial knowledge of the literature” (Morris, 2010, p. 140).
As part of the research, a literature search was also conducted on qualitative
research methods. In this case, material was drawn from various text books,
supplemented by research articles that discuss generic aspects of qualitative
research. These articles, culled from the same databases as listed above, were
not restricted to the project management and information systems research
areas. This is because qualitative research is a cross disciplinary subject and
many of its key tenets are transferrable between research areas. For example,
the concepts of validity and reliability are as relevant to educational research as
they are to OISD project success factor research.
3.4.2 OISD project success factor analysis
A quantitative analysis of OISD project success factor lists (as contained in the
56 studies listed in Appendix 2.2) was conducted as part of the literature review.
The purpose of the analysis was fourfold:
(1) To identify all of the unique factors in said lists;
(2) To identify the most cited factors in the lists;
(3) To construct a coding book (structure) that may be used as a basis for
qualitative analysis purposes during subsequent stages of this research;
(4) To produce various descriptive statistics from the lists and hence provide
a better understanding of OISD project success factors.
The literature search on which the analysis was based identified 56 suitable
research articles, all published between 1979 and 2011 (refer to Appendix 2.2).
A number of the authors did not explicitly state that their work is concerned with
OISD projects, as opposed to IS/IT projects in general (for example, Charette,
2005; Merla, 2005). However, in the analysis, if their content was found to make
specific reference to software development competences, processes or
artefacts, they were deemed suitable. Note also that the perspective provided

Chapter 3. Methodology
89
by the analysis is predominantly that of the host (in-house/client) organisation.
The analysis process had six basic steps:
(1) Success/failure factors were retrieved (verbatim) from the research
articles;
(2) Each factor was then checked to ensure that it described a unique factor
(as opposed to two or more factors). For example, Milis and Mercken
(2002) listed “powerful project manager with sufficient social skills” as a
success factor. However, this is, in fact, two separate factors. In such
cases, the original factor was deconstructed into the relevant number of
unique factors; in this instance “powerful project manager” and “project
manager with sufficient social skills”;
(3) Each factor was assigned an entity type (actor, artefact, process or
externality, as previously described in Table 2.2), an entity name, and a
characteristic that described the entity in some way. In the above
example, “powerful project manager” would have been designated as an
actor named “project manager” characterised as being “powerful.”
Similarly, “monitoring is ineffective,” (a failure factor cited by Mahaney
and Lederer (2003)), would have been designated as a process named
“monitoring” with a characteristic of “ineffective.” For factors in which no
characteristic was provided (for example, “project manager”), a default
values were assigned (in general, “effectiveness” for actors, externalities
and processes, and “fitness for purpose” for artefacts);
(4) In most cases, failure factors were restated as success factors. For
example, “ineffective monitoring” would be restated as being “effective.”
However, certain factors were left as failure factors where this was not
really possible (for example, project duration) or where the factor was
better expressed as a failure factor (for example, client arrogance);
(5) Synonymous terms were resolved at both entity and characteristic level;
(6) Each factor was assigned a code to denote its project type (as previously
described in Table 2.3).
The result of this process was a list of unique OISD project success factors as
reported by prior research in the field (refer to Appendix 2.3). The list was then

Chapter 3. Methodology
90
used to identify the most cited factors (refer to Appendix 2.4), an entity based
coding book (refer to Appendix 3.1) and a range of descriptive statistics (as
presented in Chapter 2; see p. 46).
Finally, as discussed in the literature review, the success factor analysis
described above was performed for a second time with the exclusion of four
studies containing a supplier’s perspective. The results of this secondary
analysis (presented in Appendix 2.5) were remarkably similar to the original
analysis suggesting that there is little difference between client/in-house and
supplier perspectives regarding OISD project success factors.
3.5 Pilot interviews
Prior to the main fieldwork process (described in the next section), six pilot
interviews were conducted. The main objective of the pilot interviews was to
demonstrate the effectiveness (or not) of using a open-ended interview
technique to gather information for the research. Another reason for conducting
pilot interviews prior to the main body of interviews was to build the researcher’s
experience in conducting such interviews. This is significant because it has
been shown that more experienced interviewers obtain better responses in
terms of their volume and detail (Fielding & Thomas, 2001, p. 134). The pilot
interviews also provided an opportunity to iron out any unforeseen problems
with the researcher’s interviewing style, audio recording equipment and
presentation materials.
For the pilot interviews, the interviewees included two professional IT project
managers, a retired company director (with IS/IT project board experience), a
research student (with professional software development experience) and two
professional software engineers. The interviews with the two professional
software engineers were also used in conjunction with the 31 interviews
conducted during the main fieldwork process.
The format for each pilot interview was similar to that used for the main
fieldwork process. The format consisted of an outline of the research, recording
of participant characteristics, an introduction to the interview process, a

Chapter 3. Methodology
91
discussion section and a conclusion. However, the pilot interviews showed that
two modifications to the format were required.
First, the discussion section for the pilot interviews comprised a single question
(or discussion point): “In my experience as a [project role], [a particular factor] is
significant to the success or failure of an organisational IS development project
because ... [discussion].” The difficulty with this as a single question is twofold:
(1) Interviews often require an initial icebreaker question that will almost
guarantee a response so as to allow the participant to talk freely
thereafter (Sharp, Peters, & Howard, 2002, p. 158) i.e. prior to the main
research question;
(2) More importantly, the main research question lacks context i.e. the
participants were being asked to discuss project success factors without
the opportunity to define what they actually meant by project success.
Consequently, an initial question: “How do you define project success?”, was
added as a precursor to the main research question.
Second, a number of slides were presented to the participants in an attempt to
facilitate their discussion. These slides offered alternate views (or models) of
project success factors. However, the pilot interview participants made little or
no use of these slides during the interview. Moreover, appropriate intervention
by the interviewer (in terms of prompts, probes and checks) was found to be a
more effective means of facilitating discussion. Therefore, these slides were
removed from the presentation used for the main body of the interviews.
Informal feedback from the participants indicated that they were comfortable
with the interview process. They also stated that they considered it worthwhile
and even enjoyable, welcoming the opportunity to discuss their project
experiences.
Each interviewee consented to their interview being recorded. Therefore, after
each interview, these recordings were transcribed, verbatim. Although a
relatively lengthy process, the resultant transcripts proved suitable for analysis

Chapter 3. Methodology
92
proposes. In particular, it was found that the entity-based coding book derived
from the first success factor analysis (as discussed above) could be applied, in
part, to the transcripts to identify high level success factors and supporting
information. However, the need for open coding was also recognised. It was
also found that the transcripts could be analysed at a more detailed level to
identify detailed success factors (in the form of entities and characteristics) and
the relationships between them.
Two of the interviewees kindly agreed to participate in follow-up sessions.
During these sessions, the interviewees were presented with a series of
statements containing the detailed factors and relationships identified from the
transcripts by the researcher. The interviewees were then asked if they agreed
with these statements. Both interviewees indicated that they agreed with all of
the statements and thus the factors and relationships derived from their
transcripts. The follow-up sessions were also used to ensure that the
researcher had correctly identified the high level factors covered in the
interviews. Again, it was found that these had been identified correctly.
In summary, the pilot interviews and subsequent analysis demonstrated that a
an interview process utilising open-ended questions would be an effective
means for gathering and, thereafter, analysing data for the research.
3.6 Fieldwork process
Once the pilot interviews had been successfully completed, the main fieldwork
process commenced. The fieldwork process comprised five stages (as depicted
in Figure 3.1), each containing a number of steps. The initial objective of the
fieldwork process was to obtain, collect and analyse appropriate data from
approximately 40 interviews (minimum and maximum of 30 and 50
respectively), each with a participant who was working as a project manager,
consultant or software developer for a company engaged in the development of
information systems solutions for client organisations. The target interview
figures were based on the number of interviewees involved in similar studies. In
particular, Moynihan (1996): 14 participants, and Taylor (2007): 22 participants.
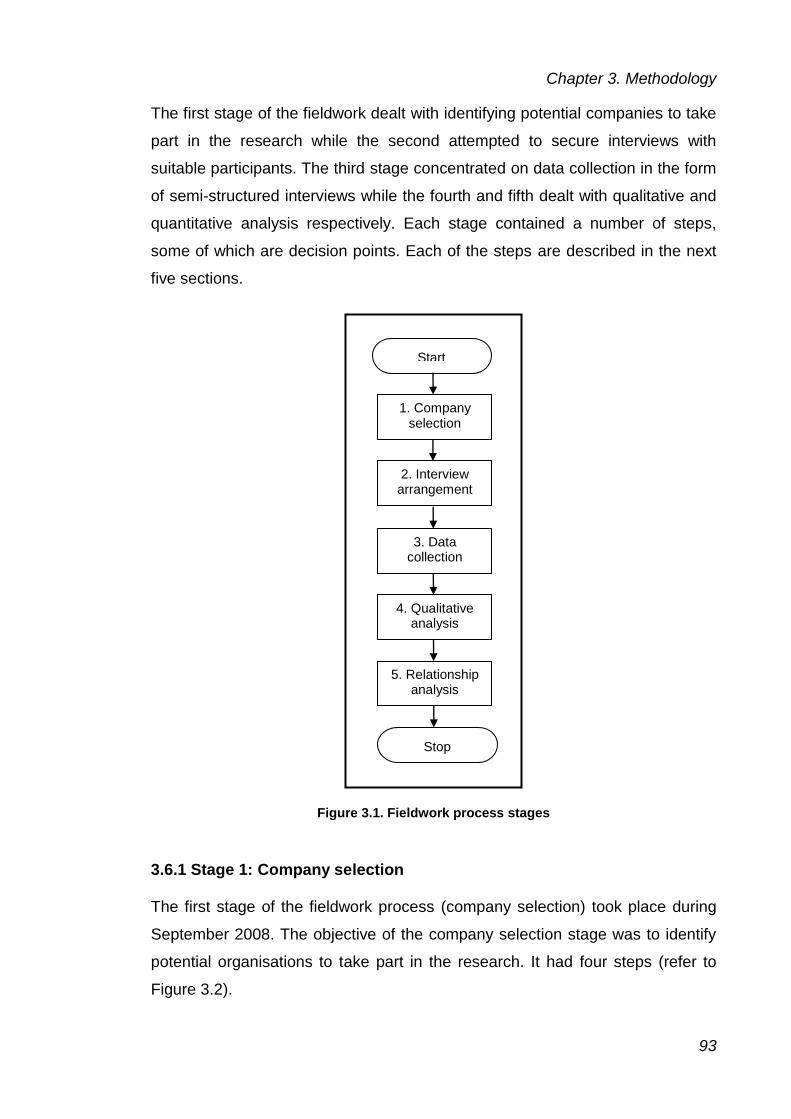
Chapter 3. Methodology
93
The first stage of the fieldwork dealt with identifying potential companies to take
part in the research while the second attempted to secure interviews with
suitable participants. The third stage concentrated on data collection in the form
of semi-structured interviews while the fourth and fifth dealt with qualitative and
quantitative analysis respectively. Each stage contained a number of steps,
some of which are decision points. Each of the steps are described in the next
five sections.
Figure 3.1. Fieldwork process stages
3.6.1 Stage 1: Company selection
The first stage of the fieldwork process (company selection) took place during
September 2008. The objective of the company selection stage was to identify
potential organisations to take part in the research. It had four steps (refer to
Figure 3.2).
Start
1. Company selection
2. Interview arrangement
3. Data collection
4. Qualitative analysis
5. Relationship analysis
Stop

Chapter 3. Methodology
94
Figure 3.2. Stage 1: Company selection
Step 1.1 – Identify suitable company directories
The first step in the process was to identify suitable lists of companies that were
in the business of supplying information systems to client organisations. Initially,
a number of lists were obtained from directories to which Edinburgh Napier
University23 subscribed. However, as none of these provided contact names
within the companies, the lists were rejected as not having a named contact
might seriously detract from the success rate of the next stage (interview
arrangement). To remedy this problem, attempts were made to identify internet-
based directory listings that provided contact names. Two web-based business
23 In this thesis, all references to the researcher’s university are cited as Edinburgh Napier
University, despite the fact that the university was known as Napier University prior to 25th
February 2009.
Start
1.1 Identify suitable company directories
1.2 Identify potential companies
1.3 Verify company details/existence
2. Interview arrangement
Stop
1.4 Is company suitable? No
Yes

Chapter 3. Methodology
95
directories, complete with contact names and business descriptions, were
identified i.e. ScotlandIS (2008) and the Edinburgh Business Directory (2008).
These directories contained over 200 potential companies.
Step 1.2 - Identify potential companies
All of the companies contained in these directories were screened to identify
those that were engaged in the development of information systems for client
organisations. This was achieved by reviewing the brief description of each
company’s business activity provided in the directories (the Edinburgh Business
Directory being particularly limiting). This step identified in excess of 250
potential companies.
Step 1.3 – Verify company details/existence
As the business description provided by the on-line directories was
unacceptably brief, further screening was performed using each company’s web
presence; mainly their web pages but also on-line articles relating to the
company, if they were found to exist.
Step 1.4 – Is company suitable? (decision point)
From the information obtained from Steps 1.2 and 1.3, a decision was made as
to the suitability of the company to participate in the research i.e. was the
company engaged in the development of information systems for client
organisations? If the answer was “no” the overall process was terminated for
that company. If the answer was “yes” the company was admitted to the next
stage. This step provided a set of 137 suitable companies.
3.6.2 Stage 2: Interview arrangement
The second stage of the fieldwork process was interview arrangement (depicted
in Figure 3.3). This took place between September 2008 and January 2009.
The objective of the process was to arrange interviews (participant, date, time
and location) and had seven steps. This particular stage, as noted by Noy
(2009, p. 462), proved to be a particularly time consuming aspect of the

Chapter 3. Methodology
96
fieldwork process. It was also a vital stage as “until you convince someone to
spend the time to talk to you, you will not obtain any data to analyse at all” (Noy,
2009, p. 455).
Figure 3.3. Stage 2. Interview arrangement
Step 2.1 – Send letter
A letter, on Edinburgh Napier University headed paper, was sent to the named
contact in each company. These letters (an example of which is provided in
2.1 Send letter
1. Company selection
2.5 Arrange interview
3. Data collection
2.6 Follow up
Stop
2.2 Delivered?
2.3 Response?
2.7 Participate?
2.4 Participate?
Yes
Yes
Yes
Yes
No
No
No
No

Chapter 3. Methodology
97
Appendix 3.2) were sent out in two batches (during October and November
2009). Enclosed with each letter were a response form (refer to Appendix 3.3)
and a prepaid envelope. The response form was printed on green paper to
attract the attention of the recipient. Copies of each letter were also held on file
with an accompanying log sheet to track the subsequent dialogue with each
company.
Step 2.2 – Delivered? (decision point)
Of the 58 letters sent, five were returned as being incorrectly addressed,
despite the addresses being checked against the original business directory
and the company’s web site. In such cases, the overall process was terminated
for that company.
Step 2.3 – Response? (decision point)
29 reply forms were not returned. In such cases follow up action was carried out
as described in Step 2.6.
Step 2.4 – Participate? (decision point)
Of the 24 reply forms returned, 14 companies agreed to participate in the
research whilst 10 declined. A few of the respondents provided reasons for not
wishing to take part in the research (for example, as one stated: “Due to the
current economic climate we can only allocate resource to work that will raise
money”). For those that declined to participate the overall process was
terminated for that company.
Step 2.5 – Arrange interview
The 14 companies that agreed to participate in the research were then
contacted via telephone. During the telephone call, the potential participants
were provided with a summary of the research objectives and the interview
process. In particular, the participants were provided with foresight of the two
questions that would be asked during the interview i.e.

Chapter 3. Methodology
98
(1) “How do you define project success?”;
(2) “In [your] experience as a [project role], [a particular factor] is significant
to the success or failure of an organisational IS development project
because ... [discussion].”
In some cases, participants requested additional information about the research
prior to consenting to be interviewed. This information was then forwarded to
them by email.
Step 2.6 – Follow up
For the 29 companies that did not reply, a great deal of effort was expended in
attempts to make contact via telephone. 22 potential participants were
eventually contacted whereas, despite repeated telephone calls, no contact was
made with the remaining seven.
Step 2.7 – Participate? (decision point)
Of the 22 named contacts that were successfully contacted, 12 agreed to
participate in the research whilst ten declined. These respondents provided
reasons various for not wishing to take part in the research (for example, that
they had already participated in a number of student research projects). For
those that declined to participate the overall process was terminated for that
company.
In summary, the process described thus far provided 26 potential interviews (14
via reply forms and 12 from follow up activities). During data collection stage,
another 12 interviews were obtained via “snowballing.” However, of these 38
interviews, only 31 actually took place with the other seven being lost, possibly
due to the downturn in the economic climate which was prevalent at the time.
3.6.3 Stage 3: Data collection
The third stage of the fieldwork process was data collection (depicted in Figure
3.4). Its objective was to conduct 31 interviews in a manner appropriate to the

Chapter 3. Methodology
99
research and to transcribe the results into a form suitable for analysis (stage
four). The stage has four steps.
Figure 3.4. Stage 3: Data collection
All 31 interviews were conducted at a date, time and location of each
participant’s choice. Interviews were conducted at various locations across
central Scotland between October 2008 and January 2009. Most of the
interviews were conducted on the participants’ business premises (18) although
others were conducted in coffee houses (5), participants’ homes (5), Edinburgh
Napier University (1), a private club (1) and a motorway service station (1).
Each interview was conducted using a process consisting of five steps (refer to
Figure 3.4), each of which is described below.
3.1 Prepare for interview
2. Interview arrangement
3.2 Conduct interview
3.3 Send courtesy email
3.4 Transcribe interview
4. Qualitative analysis
Chapter 3. Methodology
100
Step 3.1 – Prepare for interview
Before each interview a number of preparatory activities were carried out.
These included double checking the date, time and location of the interview and
that all required kit (interview presentation, digital recorder, spare batteries, etc.)
were present and correct (for example, that the digital recorder had sufficient
storage space and battery charge). In most cases, a route map to the interview
location was produced and used to ensure that the researcher arrived in ample
time for the interview. The company’s web presence was also reviewed to gain
basic information that might aid the interview process. Finally, an appropriate
dress code was chosen for the interview (for example, suit and tie for interviews
on company sites and more casual attire for home-based interviews).
Step 3.2 – Conduct interview
Following the appropriate introductions and pleasantries, the participant was
provided with an outline for the interview. The researcher explained that he
would first ask for some basic details about the participant:
(1) Name;
(2) Current role;
(3) Company name;
(4) Experience in current role (years);
(5) Total OISD project experience (years);
(6) Application domains (experience of);
(7) Client domains (experience of);
(8) Typical project size (person-months).
This data provides a description of the participant sample. If practicable, it
would also enable the subsequent analysis to identify similarities and
differences between various characteristics. For example, between different
roles, experience levels and application domains.

Chapter 3. Methodology
101
Next, the participant was given a brief presentation24 (see Appendix 3.4) to
describe the research objectives and the interview process. The first slide
(depicted in Figure 3.5) was used to describe the overall structure of the
interview which would last approximately one hour. The first part consisted of
the presentation mentioned above after which the main part of the interview
began. At this point participants were reminded that there were only two
interview questions and that they could terminate the interview at any point
without explanation. Finally, it was explained that the interview would conclude
by describing the next steps in the research and by providing the participants
with the opportunity to ask any questions they might have.
Figure 3.5. Interview outline slide
Next, the research aim and a brief overview of the interview process were
presented to the participant. The slide depicted in Figure 3.6 was used to
explain that the overall aim of the research was simply “to provide a better
24 Certain slides i.e. the main title slide and the title slides for each of the three sections
(introduction, subject matter and conclusion) have been omitted from this chapter because
they add no value to the discussion. However, the full version of the presentation can be
found in Appendix 3.3.

Chapter 3. Methodology
102
understanding of why organisation information systems development (OISD)
projects succeed or fail.” It was also explained that the need for such research
arose from (1) a perceived lack of understanding about success factors for real-
world projects on the part of academic research, and (2) that this had not been
investigated from the perspective of Scottish suppliers.
Figure 3.6. Research aim slide
The next slide (depicted in Figure 3.7) was used to present the interview
objective to the participant. First, it was explained that real-world practitioners,
such as the interview participant, could help address this lack of understanding.
Hence, the interview objective was “to determine the reasons for the success of
OISD projects by interviewing individuals who have significant experience in
these projects as principal stakeholders.”

Chapter 3. Methodology
103
Figure 3.7. Interview objective slide
Second, the researcher explained that he was currently interviewing three main
types of practitioner i.e. consultants, project managers and project team
members (primarily software developers). In addition, a number of senior
managers (including directors) had also offered to be interviewed, thus
representing a fourth category of interviewee. The common link between these
practitioners was that they were all employed by supplier organisations that
developed information systems solutions for client organisations. It was also
explained that an additional reason for targeting practitioners working for
supplier organisations was that they were considered by the researcher to have
breadth and depth of experience superior to that to professionals working for in-
house IT departments. This is due to the range of applications and, more so,
the range of clients with which they interact.

Chapter 3. Methodology
104
Figure 3.8. Additional information/guidelines slide
The fourth slide (depicted in Figure 3.8) was used to provide the participant with
some additional information and guidelines regarding the interview i.e.
(1) The researcher described his experience in terms of educational
qualifications, professional background, and in particular 12 years as a
consultant delivering information systems projects;
(2) Assurances of confidentiality and anonymity were then provided. It was
explained that if the participant mentioned a company, a name or even a
scenario that might identify an individual or an organisation, this
information would be anonymised in the research output. Furthermore, if
this was not possible, the information would not be utilised in any way by
the research;
(3) The rationale behind “minimising interview bias” was then clarified. In
summary, it was explained that a large amount of success factor
research is based on a questionnaire approach. Such research leads
participants to address subject matter identified by the researchers, as
opposed to that which the participants might consider to be important.
Therefore, to help address this issue, the interview would consist of two
open-ended questions, within which the participants would be
encouraged to concentrate on the issues that they felt were relevant;

Chapter 3. Methodology
105
(4) It was then explained that, in terms of the information provided by the
participant, no justification was required other than their own experience;
(5) The researcher then explained that he would prefer to record the
interviews using a digital voice recorder. It was also explained that the
recordings would not be made available to anyone else other than the
researcher and that they would simply be transcribed for future analysis.
However, it was also explained that, if the participant was not
comfortable about being recorded, the researcher would endeavour to
make notes of the interview;
(6) Finally, the issue of participant comfort was highlighted to the participant.
In particular, participants were encouraged to inform the researcher if
they felt uncomfortable at any point in the interview due to the nature of
the questions and/or the subject matter being discussed. They were also
reminded that they could terminate the interview at any point, for
whatever reason, without explanation.
The next slide (depicted in Figure 3.9) was used to provide some additional
information regarding the research. The entity map, depicting an athlete’s
involvement in training sessions and competitive races, was used to describe
how this type of map can be built for an OISD project. It was further explained
that various success factors could be modelled as characteristics of the various
entities (classified as actors, artefacts, processes and externalities) and that
relationships could be defined between the characteristics to help explain the
behaviour of project. It was also explained that OISD research had a limited
knowledge of how these characteristics and relationships work, hence the
reason for the interviews with real-world practitioners.

Chapter 3. Methodology
106
Figure 3.9. Entity map example slide
After the additional information and guidelines had been explained, the main
part of the interview commenced i.e. discussion of the subject matter. This was
also the point in the interview process where the researcher started to record
the interview (for all but one participant who preferred that the researcher take
notes). Note also that during this part of the interview the participant always had
sight of the main research question (provided using the slide depicted in Figure
3.10) i.e. “in my experience as a [project role], [a particular factor] is significant
to the success or failure of an organisational IS development project because ...
[discussion].”

Chapter 3. Methodology
107
Figure 3.10. Participant perspective slide
Once recording had begun, the interviewer asked the first research question:
“How do you define project success?” The participant then provided an
appropriate answer, in all cases with minimal prompting from the interviewer.
When the first question was concluded, the researcher introduced the second
research question and allowed the participant to answer in whatever manner
they deemed appropriate. However, unlike the first question, this part of the
interview tended to involve a degree of interaction on the part of the researcher.
Although most of the participants were able to discuss the question with
relatively little assistance, interviewer interjections, in the form of prompts,
probes and checks, were sometimes necessary for the following reasons:
(1) There were occasions when the participant would “dry up.” To help
overcome this situation, the researcher would endeavour to reframe the
question with a prompt. For example, “What do you find has helped (or
hindered) you to deliver your projects?”;
(2) Another strategy was to ask the participant, by way of a probe, to explain
more about issues they had raised earlier in the interview. For example,
“You said that project start-up is key. Could you explain what that
entails?”;

Chapter 3. Methodology
108
(3) There were also occasions when clarification of a particular point, by way
of a check, was required (usually due to misunderstanding on the part of
the researcher). For example, “Am I correct in thinking then, that the
requirements evolve from one increment to another?”
Finally, at the conclusion of the second question, recording of the interview was
terminated.
To conclude the interview, the researcher explained the time scales required to
complete the interviews and also those required to conduct the analysis. The
participants were also told that they would be provided with a preliminary report
of the research findings at the end of May 2009. The participants were then
provided with the opportunity to ask any questions that they might have before
finally being thanked again for participating in the research. In certain cases, the
participants would also be asked if they could recommend another potential
participants. This “snowballing” approach provided a further nine interviews.
Step 3.3 – Send courtesy email
Directly following each interview, the participant was sent a courtesy email
thanking them for participating in the research. The email also restated that they
would receive a preliminary report of the research findings at the end of May
2009.
Step 3.4 – Transcribe interview
Transcription took place between November 2008 and March 2009.
Of the 33 interviews (including the two pilot interviews used as part of the main
body of the research), 32 were recorded using a digital voice recorder and the
one other in notes form. The 32 digital recordings were transferred to a PC as
waveform audio format (WAV) files. The quality of these recordings was
generally very good, even those made in reasonably noisy locations, with very
few sections rendered inaudible. The files were transcribed verbatim, with
ellipsis to denote pauses in speech and exclamation marks to identify
exclamatory remarks. However, other changes in the participants tone of voice
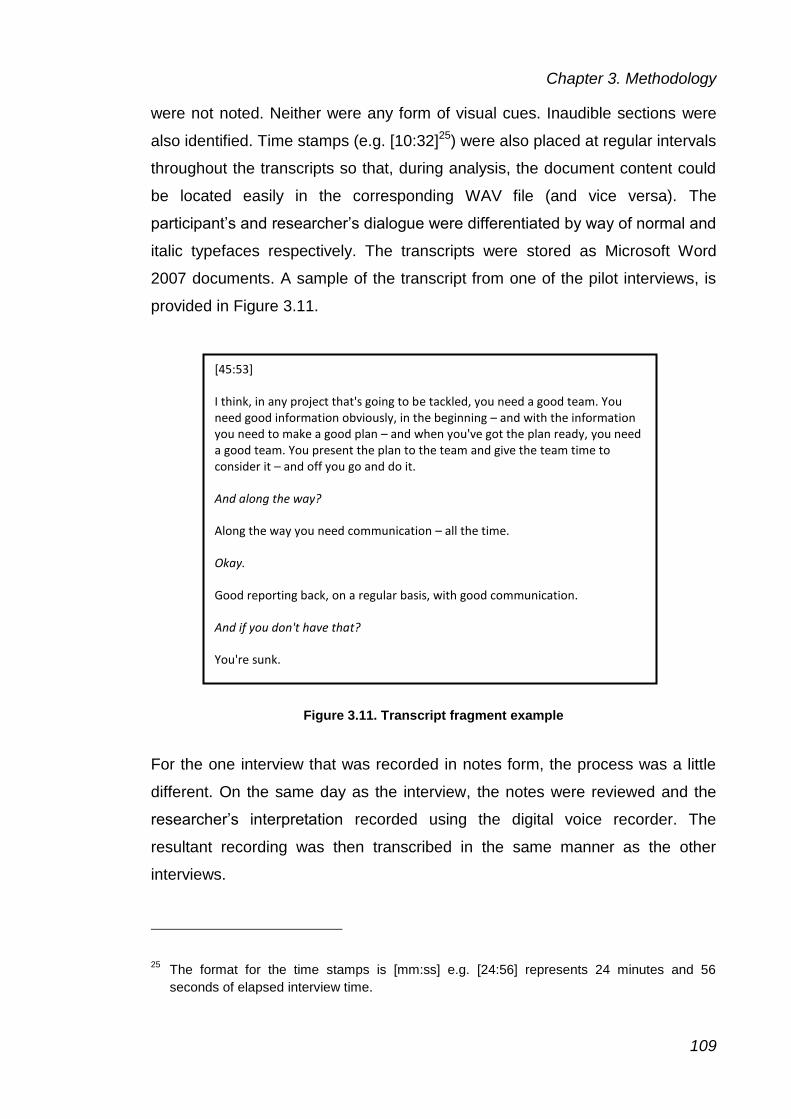
Chapter 3. Methodology
109
were not noted. Neither were any form of visual cues. Inaudible sections were
also identified. Time stamps (e.g. [10:32]25) were also placed at regular intervals
throughout the transcripts so that, during analysis, the document content could
be located easily in the corresponding WAV file (and vice versa). The
participant’s and researcher’s dialogue were differentiated by way of normal and
italic typefaces respectively. The transcripts were stored as Microsoft Word
2007 documents. A sample of the transcript from one of the pilot interviews, is
provided in Figure 3.11.
Figure 3.11. Transcript fragment example
For the one interview that was recorded in notes form, the process was a little
different. On the same day as the interview, the notes were reviewed and the
researcher’s interpretation recorded using the digital voice recorder. The
resultant recording was then transcribed in the same manner as the other
interviews.
25 The format for the time stamps is [mm:ss] e.g. [24:56] represents 24 minutes and 56
seconds of elapsed interview time.
[45:53]
I think, in any project that's going to be tackled, you need a good team. You need good information obviously, in the beginning – and with the information you need to make a good plan – and when you've got the plan ready, you need a good team. You present the plan to the team and give the team time to consider it – and off you go and do it.
And along the way?
Along the way you need communication – all the time.
Okay.
Good reporting back, on a regular basis, with good communication.
And if you don't have that?
You're sunk.

Chapter 3. Methodology
110
3.6.4 Stage 4: Qualitative analysis
The fourth stage of the fieldwork process was a qualitative analysis of the
interview transcripts. This stage was designed to assist in satisfying the first
research objective (providing a better understanding of OISD project success
factors from a Scottish suppliers’ perspective). This involved identifying and
describing a range of OISD project success factors and providing a definition of
OISD project success. The main part of the work took place between March
2009 and May 2009 with refinements being made throughout the remainder of
the project. The stage had four steps as depicted in Figure 3.12.
Figure 3.12. Stage 4: Qualitative analysis
4.1 Coding
3. Data collection
4.3 Participants’ report
4.4 Additional analysis
5. Relationship analysis
4.2 Analysis

Chapter 3. Methodology
111
Step 4.1 – Coding
The interview transcripts were coded, using QSR’s NVivo software26, at a
broad, entity-based level to identify relevant themes (or patterns). The themes,
constituting high level OISD project success factors, denoted actors (for
example, project manager, project team, etc.), artefacts (for example,
technology, planning tools, etc.) and processes (for example, requirements
management, project planning, etc.). Additional themes were used to identify
project success and also segments of the transcripts that were not relevant to
the research. The coding process comprised deductive and inductive elements.
Deductive coding was loosely based on the entity-based coding book
(presented in Appendix 3.1) derived from the success factor analysis described
in Section 3.4.2. Inductive (open) coding ensured that new themes could be
identified as required. The themes were then consolidated (again using QSR’s
NVivo software) into 20 OISD project success factors and one other theme
containing definitions of project success.
Step 4.2 – Analysis
This step constituted a qualitative analysis involving a manual review of the
themes to identify similarities (and differences) between interviews. This led to
the identification of various sub-themes, more detailed success factors and
relationships. These findings were then written up as thick, rich descriptions for
each of the 20 OISD project success factors and also a definition for OISD
project success.
Step 4.3 – Participants’ report
The rationale behind the participants’ report was to provide companies with an
incentive to take part in the research. The 25 page report, issued in May 2009,
presented the preliminary findings from the research. Having described how the
participants defined project success, the bulk of the report identified and
26 QSR NVivo 8.0.

Chapter 3. Methodology
112
described the 20 OISD project success factors. Feedback on the report was
favourable (indeed no negative feedback was received). Several participants
stated that they considered it informative whilst others indicated that they would
be circulating the report to others within their organisation. One participant
requested permission to cite the report during business presentations.
Step 4.4 – Further analysis
A limited amount of additional analysis was conducted during the remainder of
the project. This allowed the researcher to reflect on the preliminary findings
and make appropriate modifications; in particular to the way in which the 20
success factors were to be presented in Chapter 4. The findings were also
compared to the results of the detailed coding process (described below in
Section 3.6.5). Again, this led to a number of minor amendments. However,
despite the various refinements, the preliminary and final versions of the
findings were found to be similar. The final version of the findings are presented
in Chapter 4.
3.6.5 Stage 5: Relationship analysis
The fifth stage of the fieldwork process was a quantitative analysis of the
interview transcripts. This stage was designed to satisfy the second research
objective (providing a better understanding of the way in which OISD project
success factors interact to influence project success). As the qualitative analysis
had confirmed that the 20 high level success factors comprised more detailed
factors and relationships between them, this objective was expanded to
providing a better understanding of:
(1) The number of detailed success factors (and success criteria) that are
involved;
(2) The relationships that exist between the success factors;
(3) The causal chains by which success factors propagate their influence to
affect project success;
(4) The key factors and relationships involved in the propagation process.

Chapter 3. Methodology
113
Hence, this stage involved a detailed coding process and a computer aided
quantitative analysis. The work took place between January and June 2012,
and had three steps (as depicted in Figure 3.13).
Figure 3.13. Stage 5: Relationship analysis
Step 5.1 – Coding
Analysis of the interview transcripts revealed numerous success (and failure)
factors. Several definitions of project success, in the form of various success
criteria, were also found. Consequently, all instances of success factors,
success criteria and the term “project success” were coded in the form of
entities and characteristics.
Analysis of the interview transcripts revealed numerous relationships, the
majority of which were between success factors i.e. from a source factor to a
target factor. However, a number of other relationship types were also
identified; for example, from success factors to success criteria and from
success criteria to project success. These, and other, relationship types are
discussed further in Chapter 5.
5.1 Coding
4. Qualitative analysis
5.2 Software development
5.3 Analysis
Stop

Chapter 3. Methodology
114
Relationships were also found to have two influence types: (1) those having a
positive effect on the target (or receiving) factor (or criterion), and (2) those
having a negative effect. In quantitative terms, positive influences contribute
(cause an increase) to the target factor whilst negative influences detract from
(result in a decrease). The relationships identified by the coding process
(collectively referred to as the relationship data set) were stored in a Microsoft
Excel spreadsheet.
In summary, the coding process identifies entities and characteristics. A default
value is assigned if no characteristic is available (“effectiveness” for actors and
processes and “fitness for purpose” for artefacts). The coding process is
relatively simple, on occasions subjective and time consuming. The process can
be explained by way of an example (refer to Figure 3.14 and Table 3.2).
Figure 3.14. Detailed coding transcript fragment example
In this example, the coding fragment (as depicted in Figure 3.14) yields four
different relations (as shown in Table 3.2, in which the factors are expressed in
entity.characteristic notation).
Risk management is really important.
Why is that?
Because if you don’t have good risk management, you tend to end up with lots of unforeseen issues.
I see.
And if that happens, your development times start to increase.
Is that all that’s affected?
No, come to think of it, if there are lots of issues – team morale tends to suffer and that impacts development too.
In what way?
Well, basically, [software development] takes even longer.
4
3
2
1

Chapter 3. Methodology
115
Id Source factor Influence Target factor
1 Risk management.effectiveness Negative Issues.number of
2 Issues.number of Positive Software development.duration
3 Issues.number of Negative Project team.morale
4 Project team.morale Negative Software development.duration
Table 3.2. Detailed coding relationship examples
Step 5.2 – Software development
The relationship data set contained a large number of relationships. These were
to be constructed into a relationship network. Unfortunately, the number of
relationships suggested that the network would, in all likelihood, be too large to
analyse manually. Hence, a small software application was developed to assist
with the analysis. The detailed requirements for the software are presented in
Appendix 3.5. In summary, the software was required to:
(1) Read the relationship data set and construct it into a relationship
network;
(2) Identify the active causal chains by which success factors propagate
their influence through the relationship network to affect project
success27;
(3) Identify the key success factors and relationships involved in the
propagation process.
The software was written in C# using object-oriented principles. Software
development (specification of requirements, software design, coding and
testing) took approximately 10 days (80 hours) and was performed in three
stages:
27 The software was to identify two types of linear causal chain: (1) those that influenced
project success and (2) those that did not. Causal chains that influence project success are
referred to as being active. Causal chains that do not influence project success as referred to
as being inactive or impotent. These terms are discussed further in Chapter 5.

Chapter 3. Methodology
116
(1) Functionality to read the relationship data set, construct the relationship
network, identify active chains (those that affect project success),
calculate activity levels for the factors and relationships involved, and
produce various output files;
(2) Modifications required to deal with the large size of the relationship
network;
(3) Enhancements to provide further analysis of causal loops.
In summary, the software consisted of an application class and five data
classes. The application class was responsible for:
(1) Reading the relationship data set and constructing the relationship
network;
(2) Propagating factors through the network to identify causal chains (and
loops) in accordance with number of user defined parameters (refer to
Appendix 3.5);
(3) Recording the activity of the factors and relationships involved in the
propagation process (refer to Appendix 3.5);
(4) Writing a variety of tab delimited output files (suitable for importing to
Microsoft Excel for analysis purposes).
The data classes were used to model entities, success factors (expressed as
entities and characteristics), relationships, causal chains and causal loops. A
class design for the software is presented in Appendix 3.6.
Step 5.3 – Analysis
This software was then used to perform an analysis of the relationships
described above (refer to Step 5.1). In essence, the software was used to read
the relationship data set, construct the relationship network and hence:

Chapter 3. Methodology
117
(1) Analyse success factors (and success criteria) in terms of:
(1) The factors they influence;
(2) The factors they are influenced by;
(2) Identify and describe active causal chains;
(3) Identify and describe causal loops;
(4) Analyse the interaction between causal loops;
(5) Analyse the activity of success factors, success criteria and relationships
in the active causal chains;
(6) Analyse the activity described in (5) by:
(1) Entity;
(2) Entity type;
(3) Project type.
To achieve the above, the propagation software was used to perform a number
of propagation runs. Initially, these propagation runs attempted to propagate all
of the factors contained in the relationship data set. However, this proved to be
problematic due to the size of the relationship network (refer to Section 3.7.4 for
a full discussion of this issue). Hence, the propagation software was used to
perform a series of additional propagation runs; in particular, propagation runs
to:
(1) Propagate specific factors;
(2) Analyse potentially active factors;
(3) Analyse causal loops for specific factors;
(4) Analyse the interaction of causal loops;
(5) Analyse the propagation of factors affecting specific success criteria;
(6) Analyse various special cases.
A full listing of the propagation runs performed during the analysis is presented
in Appendix 3.7. The findings of the analysis are presented in Chapter 5.
3.7 Difficulties and limitations encountered during the research
Despite appropriate planning, design and testing, a number of difficulties and
limitations were encountered during the research. Although these did not

Chapter 3. Methodology
118
detract significantly from the quality of the research, they should still be
disclosed.
Research stage Difficulty/limitation
2 – Interview arrangement Actual number of interviews was fewer than planned
Job functions of actual interview participants did not match target
Time (and effort) required to secure interviews was greater than expected
3 – Data collection A few of the interviews proved quite difficult to control
Little or no control over the participants’ motivation, preparation or truthfulness regarding the interviews
Background noise during the interviews
One interviewee’s refusal to be recorded
Interview bias (on the part of the researcher)
Data collected was based on the perceptions of the interview participants
4 – Qualitative analysis Subjective nature of the data coding process
5 – Relationship analysis Extensive run times associated with the propagation software
Table 3.3. Research difficulties/limitations
The primary difficulties and limitations encountered by this research project are
summarised in Table 3.3 and discussed in full in Appendix 3.8. Although some
of these only affected the efficiency of the research project, a number had the
potential to affect the quality of the research findings. Hence, a variety of
measures were implemented to ensure the validity of the findings and the
reliability of the research process. These measures are discussed in the next
section.
3.8 Quality of the research findings
As presented above, this research project encountered a number of difficulties
and limitations. Some of these (for example, the effort required to secure
interview participants), resulted in inefficiencies and delays to the project.
Fortunately, these inefficiencies and delays did not prove detrimental to the
findings of the research. However, other difficulties (for example, those
encountered during the field interviews, data coding and whilst using the
propagation software) all had the potential to impact the effectiveness of the

Chapter 3. Methodology
119
research process and, hence, the quality of the research findings. Hence, an
important part of the research project was to ensure that the research design
(as presented in Chapter 3) was appropriately robust for delivering results of the
highest quality; specifically, in terms of their validity and reliability28.
The validity and reliability of a qualitative research project depend greatly on the
“skill, sensitivity and training” of the researcher (Labuschagne, 2003, p. 101). In
other words, “research is only as good as the investigator” (Morse, Barrett,
Mayan, Olson, & Spiers, 2002, p. 17). Although this is a great strength in
qualitative research, it can also be construed as a fundamental weakness
(Patton, 1990 cited by Pyett, 2003, p. 1172) as the researcher’s attributes can
have a significant influence on the validity of the research (Pyett, 2003, p.
1172). Fortunately, however, there are a number of measures that can be used
to help ensure the validity and reliability of qualitative research findings. Some
of these measures (for example, researcher triangulation and understanding the
research process) enhance both validity and reliability. The measures employed
by this research are described in the next two sections.
3.8.1 Validity
Validity is concerned with the accuracy of a research instrument when
measuring an item (Gilbert, 2001, p. 23). Put another way, for research findings
to be valid, they should accurately reflect truth, reality and cover the key issues
(Denscombe, 1998, p. 241).
Key to determining the validity (and reliability) of a research process (and its
findings) is understanding the process itself (Gilbert, 2001, p. 24). As Chapter 3
shows, the researcher has a firm understanding of the overall research process
and the instruments employed. Another key factor is that the research process
should employ instruments that are well established in qualitative investigation
(Shenton, 2004, p. 64). Subsequently, this research project ensured that its
28 The terminology typically used by qualitative researchers in the UK and Europe (Morse,
Barrett, Mayan, Olson, & Spiers, 2002, p. 14).

Chapter 3. Methodology
120
instruments (for example, semi-structured interviews) met this criteria.
Moreover, a variety of procedures were employed to reinforce the validity of the
research findings. These included researcher triangulation (peer reviews),
researcher reflexivity, member checking (participant feedback), thick, rich
description, purposive sampling, and auditing (see, for example, Creswell &
Miller, 2000; Johnson, 1997; Mays & Pope, 1995).
The research did not employ traditional data triangulation i.e. the use of
alternate physical data sources (Creswell & Miller, 2000, pp. 126-127). Attempts
were made in this area (for example, to take account of alternative data
provided on the participant’s company web sites) although these proved
unfruitful. Similarly, it was considered inappropriate to ask each participant for
access to their company’s project documentation. However, the research did
utilise another form of data triangulation: the use of a range of informants to
triangulate between data sources (Shenton, 2004, p. 66) i.e. by including
multiple job functions in the sample (for example, project managers, software
developers, etc.). The research also employed researcher triangulation to
enhance validity (see, for example, Denzin, 1978 cited by Creswell & Miller,
2000, p. 127; Johnson, 1997, p. 283; Mays & Pope, 1995, p. 110). Equally
applicable to reliability (discussed below), this involved two individuals outwith
the project performing thematic coding of an interview transcript. In both cases,
the level of agreement with the researcher’s coding was found to be reasonably
high (80% and 85% respectively) hence supporting the validity of the research.
Research validity can also be enhanced through researcher reflexivity i.e.
where a researcher discloses his or her “personal beliefs, values, and biases
that may shape their inquiry” (Creswell & Miller, 2000, p. 127). Hence, a profile
of the researcher disclosing his experience and beliefs (Johnson, 1997, p. 284),
is provided in Appendix 1.1. The profile allows the reader to better understand
the researcher’s position in relation to the research findings (Creswell & Miller,
2000, p. 127). Although this does not constitute a comprehensive
implementation of researcher reflexivity (see, for example, Creswell & Miller,
2000, p. 127; Johnson, 1997, p. 284), it does assist in enhancing the validity of
the research findings.
Chapter 3. Methodology
121
Member checking (participant feedback) is “the most crucial technique for
establishing credibility” and hence validity (Lincoln & Guba, 1985, p. 314). In
simple terms, this involves discussing the researcher’s interpretation of the
interviews with the interview participants (Johnson, 1997, p. 283; Mays & Pope,
1995, p. 111; Shenton, 2004, p. 68). However, it is important to restrict these
interpretations to a relatively descriptive level; for example, data coding (as
opposed to the final results), as asking participants to judge the correctness of
the findings is, more often than not, a threat to validity (Guba & Lincoln, 1981
cited by Morse, Barrett, Mayan, Olson, & Spiers, 2002, p. 16). Therefore, this
research confined member checking to the data coding processes (as part of
the pilot interviews), the outcome of which was very satisfactory i.e. both
participants involved reported that the their transcripts had been coded correctly
at thematic and detailed levels. However, as this was found to place a
considerable burden of the participants, it was decided not to employ member
checking in the main fieldwork process. Another form of participant feedback
also resulted from the interim report issued to the interview participants.
Although this report was not accompanied with a request for any form of
feedback (which, with hindsight was a missed opportunity), a certain amount of
participant feedback was received. And, although limited, all feedback was
found to be very positive, thus enhancing the validity of the research findings
(albeit to a limited extent, especially in light of the need to restrict interpretations
to a relatively descriptive level).
The research also made use of “external auditors” (three professors; one
internal to the student’s university, and two external to the university) to audit
elements of the project. The purpose of these audits was to “examine both the
process and product of the inquiry, and determine the trustworthiness of the
findings” (Creswell & Miller, 2000, p. 128). Feedback from the audits was
provided verbally and, although confirming the validity of the research process,
did identify certain deficiencies; for example, that the potential for interviewer
bias was somewhat higher that claimed by the researcher. However, the
research could have made more extensive use of auditors. For example, the
audit trails developed to support reliability (discussed in the next section) could

Chapter 3. Methodology
122
have, and should have been, subjected to external audit. That said, a number of
other methods were employed to enhance the reliability of the research
(discussed in the next section).
The validity of a qualitative study can be established by describing its findings in
thick, rich detail (Creswell & Miller, 2000, p. 128; Shenton, 2004, p. 69). For this
study, this is demonstrated in Chapter 4. The thick, rich descriptions provided in
Chapter 4 assist the reader in understanding that the findings are, indeed, valid.
Thick descriptions also help the reader to determine the applicability of the
findings to similar contexts (Creswell & Miller, 2000, p. 129). Finally, an integral
part of thick descriptions is the use of low-level inference descriptors; for
example, verbatim quotations and descriptions that closely reflect the
participant’s accounts (Johnson, 1997, p. 283). Hence, particular attention was
made to these descriptors during the development of Chapter 4, thus ensuring
that the findings of the analysis were closely related to the narratives provided
by the interviewees.
To ensure validity, the sample of interview participants should be appropriate to
the research. That is, the sample should consist of ”participants who best
represent or have knowledge of the research topic” (Morse, Barrett, Mayan,
Olson, & Spiers, 2002, p. 18). In this research project, this was accomplished
using purposive sampling to identify professionals who had relevant experience
of supplier-based OISD projects. This also helps ensure sampling adequacy:
that sufficient data has been obtained to account for and replicate all aspects of
the phenomenon under investigation (Morse, Barrett, Mayan, Olson, & Spiers,
2002, p. 18). Unfortunately, despite accounting for a wide range of OISD project
success factors (and associated detail), the findings cannot be used to
demonstrate that the data collected via the interviews had definitely reached
saturation point. On the contrary, it is quite possible that the sample size was
too small to achieve saturation. However, in defence of this point, it should be
noted that the sample size of 33 is significantly higher than those for
comparable studies; for example, Moynihan (1996): 14 participants, and Taylor
(2007): 22 participants. Hence, it is argued that the validity of this study is more
than likely to be greater than the aforementioned studies.

Chapter 3. Methodology
123
Finally, a few words regarding the truthfulness of the interview participants are
warranted. Truth is a factor for the validity of research findings (Denscombe,
1998, p. 241). Hence, the truthfulness of the interviewees is of prime
importance and tactics should be employed to help ensure their honesty
(Shenton, 2004, p. 66). Although there was no apparent reason for the interview
participants to provide dishonest accounts (as might have been the case in a
study in which recrimination was a concern), all interviewees were still
guaranteed anonymity (for themselves and their companies) relating to their
views (as presented in the findings) and confidentiality regarding their interview
transcripts i.e. that they would not be made available to anyone other than the
researcher. Such guarantees are typical in research studies to encourage the
truthfulness of the interview participants and hence the validity of the findings
(see, for example, Hall, 2004, p. 202). Closely related to participant truthfulness
is trust between the researcher and the participants. To an extent, this can be
achieved by the researcher familiarising him or herself with a participant’s
organisation prior to the interview (Shenton, 2004, p. 65). Hence, prior to each
interview, sufficient time was spent by the researcher to review organisational
information provided by the participant’s company’s web site. For this research,
these measures seem to have had the desired effect. In particular, participants
were quite open in providing examples of OISD project failures at a personal
and company level.
3.8.2 Reliability
Reliability is concerned with the consistency of a research instrument when
measuring an item (Denscombe, 1998, p. 240; Gilbert, 2001, p. 23). In other
words, a reliable research process (and, hence, its instruments) will produce the
same data each time it is used and that any variation in the findings will be due
to variations in the item being measured, not the process itself (Denscombe,
1998, p. 240).
As with validity, understanding the research process is key to determining its
reliability (Gilbert, 2001, p. 24). Again, Chapter 3 demonstrates the researcher’s
understanding of the overall research process and the instruments employed.

Chapter 3. Methodology
124
As above, a range of techniques were also available to reinforce the reliability of
research findings. The techniques employed by the research project included
the utilisation of computer software, process documentation, the use of coding
books and independent assessment (see, for example, Mays & Pope, 1995;
Merriam, 1995).
The use of computer software is commonplace in qualitative research (Patton,
2002, p. 442) and can be used to enhance reliability, particularly in analysis
(Mays & Pope, 1995, p. 110). Indeed, its use had a significant impact on the
reliability of this research project. In particular, the software developed as part of
the relationship analysis of OISD project success factors (refer to Chapter 5)
guaranteed that the propagation process would generate reliable results
between propagation runs (refer to Chapter 3). In other words, variations in
findings (of which there were very few) were purely due to variations in the
relationship data set; for example, the rectification of errors found in the data set
whilst the output from the propagation process was being checked29.
Computer software was also used to enhance reliability in a number of other
areas. For example, the qualitative coding process was carried out using QSR’s
NVivo software30. Additionally, a specifically designed spreadsheet and a
bespoke software application were used to conduct the success factor analyses
performed as part of the literature review (as discussed above). This software
enhanced reliability between the results produced during the initial literature
review and those produced later in the project; for example, as additional
success factor articles were identified and analysed. Clearly then, future use of
the same software (i.e. in subsequent studies) would aid reliability between this
and later studies.
29 As part the relationship analysis, checks were performed on the output of the propagation
process. These checks revealed a few errors in the relationship data set (for example, the
influence type was found to be incorrectly coded in a few relationships). In all such cases,
the errors were corrected and the propagation process(es) re-run. Performing checks in this
manner serves to enhance reliability (Morse, Barrett, Mayan, Olson, & Spiers, 2002, p. 17).
30 QSR NVivo 8.0.

Chapter 3. Methodology
125
One of the main strategies employed by qualitative researchers to ensure
reliability of their analyses is to document the analysis process in detail (Mays &
Pope, 1995, p. 110). This ensures that analysis decisions are clearly visible and
that individual findings can be linked back to the data from which they were
derived. In this research, a detailed documentation system was implemented for
data coding during the relationship analysis (refer to Chapter 5). The system
provided an audit trail whereby any success factor or relationship could be
linked back to the transcript(s) and paragraph(s) from which they were derived
and, more importantly, to show how the original narratives had been translated
into the entity-characteristic combinations used in the analysis.
The development of coding books and coding rules (prior to deductive coding
and as a result of inductive coding) serves to enhance reliability through making
them available to other researchers during the research project (Mays & Pope,
1995, p. 110). Similarly, these coding books can be made available to
subsequent studies. For this research, an entity-based coding book, derived
from the success factors identified in the literature review (refer to Appendix 3.1)
was produced for the qualitative analysis (presented in Chapter 4). These
success factors, expressed as entity-characteristics (refer to Appendix 2.3) also
formed the basis of the coding process for the relationship analysis (presented
in Chapter 5).
The reliability of a qualitative analysis can be enhanced by subjecting the
interview transcripts to an independent assessment by additional, similarly-
skilled researchers and comparing the level of agreement between those rating
the transcripts (Mays & Pope, 1995, p. 110); referred to above (in relation to
validity) as researcher triangulation. Unfortunately, this was to prove difficult for
this research project, simply because the researcher was found to be the only
individual in the university undertaking similar research. However, two of the
researcher’s family members (both of whom were educated to degree level and
could be considered to be computer literate) did agree to code segments of an
interview transcript at a broad entity-based level (as performed during the
qualitative analysis). In both cases, the reviewers were provided with the entity-
based coding book discussed above to aid their analyses. Although both

Chapter 3. Methodology
126
reviewers reported difficulties during the coding process, high levels of
agreement were obtained (80% and 85% respectively), thus reinforcing the
reliability of the research.
3.9 Conclusion
This chapter has described the methodology employed to conduct this research
project. An overview of the research approach was presented, followed by
detailed accounts of the primary elements of the methodology: (1) the literature
review, (2) the pilot interviews, and (3) the main fieldwork process. The
problems experienced during the research were also discussed as were the
measures implemented to ensure the validity and reliability of the findings.
Despite the problems experienced during the research, the research
methodology exhibits several strengths. The decision to utilise a predominantly
qualitative approach was justified by the literature review. The use of open
ended questions in the interviews was also a significant strength as it provided
sufficient rich, thick descriptions to support both qualitative and quantitative
analyses. However, the key strengths of the research methodology can be
attributed to the measures implemented to ensure the validity and reliability of
the research findings (as described above). In summary, the strengths of the
research methodology more than compensated for its weaknesses and, hence,
the research methodology can be considered fit for purpose in relation to
achieving the project’s aims and objectives.
The next two chapters present the findings of this research project. Although
both chapters are based on a common data collection process, they differ
significantly in terms of their analysis methods. First, Chapter 4 presents the
findings of the qualitative analysis. These findings reveal 20 high level OISD
project success factors and various definitions of OISD project success. Next,
Chapter 5 presents the findings of the quantitative relationship analysis. These
findings provide a detailed account of the way in which OISD project success
factors interact via long causal chains to influence project success.
Chapter 4. 20 success factors for OISD projects
127
4. 20 OISD project success factors
4.1 Introduction
This chapter presents 20 success factors for organisational information systems
development (OISD) projects. The factors are based on the experiences of 33
IT professionals working for Scottish supplier organisations engaged in the
delivery of OISD projects to client organisations. The chapter also describes
how the interview participants defined project success.
The chapter is structured as follows. The next section describes the participant
sample. This is followed by the participants’ definitions of project success. Next,
the main part of the chapter presents 20 success factors for OISD projects, as
derived from a qualitative analysis of the interview transcripts. A detailed
description is provided for each factor. These descriptions are intended to leave
the reader in no doubt regarding the meaning of each factor as provided by the
interview participants. The chapter’s findings are then discussed in terms of
their contribution to knowledge and the issues that they raise. The chapter
concludes by presenting further research objectives to be considered in Chapter
5.
4.2 Participant sample
The interviews were provided by a sample of 33 participants (denoted as P1 ...
P33 in this and subsequent chapters)31. All of the participants were based in
central Scotland and engaged, in a professional capacity (i.e. as sole traders or
working for supplier organisations), delivering OISD projects to client
organisations. This criteria qualified each participant as a suitable candidate for
the interview process. Characteristics of the participant sample are presented in
Appendix 4.1.
31 31 participants from the main fieldwork process and two from the pilot interviews (P1 and
P2).

Chapter 4. 20 success factors for OISD projects
128
The participants comprised nine software developers, nine consultants, six
project managers and three software development managers. The remaining
six worked at more senior levels of management in their organisations: five
company directors and one managing director. In total, the 33 participants
represented 24 individual supplier organisations.
The participants had an average (mean) of 10 years experience in their current
role. More importantly, the participants had a collective experience of over 500
years, on average 16 years (mean) per participant, in the delivery of OISD
projects to client organisations. Thus, the sample were considered as having a
high level of experience in the field32 and, consequently, a knowledgeable data
source for this study.
The majority of participants were engaged in the delivery of various application
types to various types of client organisation. A number of participants delivered
specialised application types; for example, customer relationship management
(CRM), law, commercial and financial applications.
The average (mean) size of project delivered by the participants equates to 60
person-months: six project team members over 10 months. However, as shown
in Table 4.1, there is a substantial variation in project size amongst participants.
Project size
(person-months)
Number of
participants
Fewer than 10 7
Between 11 and 50 11
Between 51 and 100 7
Over 100 8
Table 4.1. Number of participants by project size
32 Based on similar criteria used by Sauer, Gemino and Reich (2007, p. 80) to define the term
“high levels of experience.”

Chapter 4. 20 success factors for OISD projects
129
4.3 Project success
This section presents the responses to the first research question33: “How would
you define project success?” Overall, the participants provided a range of
responses, the majority of which incorporated success criteria relating to the
intended, successful outcome of an OISD project. These responses conform to
the way in which the term project success is often used in the literature (see p.
27).
As discussed in Chapter 2 (see p. 28), success criteria are measures of (1)
project management success or (2) organisational success. This section
presents the participants’ responses using these categories.
4.3.1 Project management success
As the literature review showed, project management success is concerned
with the efficiency of the project process and its management (see p. 28).
Project management success is measured using the criteria encompassed by
the golden triangle: adherence to (1) schedule, (2) budget and (3) requirements.
10 participants cited the importance of schedule adherence (P3, P6, P7, P8,
P12, P19, P20, P24, P26, P32), eight the importance of meeting budgets (P3,
P6, P7, P8, P19, P20, P24, P26) and 10 the importance of satisfying
requirements (P14, P20), scope (P32), quality (P3, P15), wants (P5, P9, P26),
or specifications (P13), as stated at the beginning of the project (P3, P8, P29)
but often subject to change (P26). The iron triangle was also considered to be
less important than client side criteria such as customer satisfaction (P6) and
business benefit (P10), both of which are discussed below. As one participant
stated, “So what if the project was a little over budget or was delivered a month
late,” when it delivered the anticipated benefit to the business (P10). It was also
recognised that schedule, budget and requirements are not necessarily equally
33 Covering participants P3 ... P33 only. The question was not part of the pilot interviews in
which P1 and P2 participated (as discussed in Chapter 3).

Chapter 4. 20 success factors for OISD projects
130
important (P32). For example, satisfying requirements might be subordinate to
meeting the project’s due date.
4.3.2 Organisational success
As the literature review showed, organisational success extends beyond the
completion of the project process and addresses the effectiveness of the
project’s deliverable to provide benefit to the organisation (see p. 28). Although
the literature suggests that this should be measured in terms of organisational
benefit and stakeholder satisfaction, it makes no reference to the existence of
multiple organisations in its discussion of project success. As the OISD projects
described in this study involve at least two organisations34, participant
responses are presented below in terms of (1) the client organisation and (2)
the supplier organisation.
4.3.2.1 Client organisation
A number of participants described the need for projects to meet their clients’
business needs or objectives (P10, P14, P15, P25). One participant stated that
project success was “achieving what was actually asked for, not what was
asked for” (P30)35. In other words, the project’s deliverable needs to be actually
useful to the client organisation (P23) and to provide business benefit (P4, P10,
P20); for example, increased sales (P25) or operational savings (P7, P25). As
such, it is the delivery of business benefit that leads to project success (P10).
This requires effective benefits realisation (P31) and measurement of success
in terms of that benefit (P31).
A successful project is one in which the client can be described as satisfied (P6,
P11, P23, P33) or happy (P6, P10, P13, P19, P22, P23, P24, P33). In other
34 In addition to the supplier and client organisations, some of the participants made mention of
client side partner organisations and multiple supplier organisations.
35 The example presented by this participant was that of a project to build a factory to produce
square wheels. Although the factory was “the best square wheel factory in the world”, it was
of no actual use to the client organisation.

Chapter 4. 20 success factors for OISD projects
131
words, client expectations (P11, P15, P21), parameters (P22), or perceptions
(P14) have been met (satisfied). Satisfied clients are important, not least
because they constitute the source of repeat business (P19, P22, P24) or follow
on work (P6, P13) and provide the basis for long term supplier-client
relationships (P13). As one participant stated, “If we don’t have customer
satisfaction, then we don’t have any more work” (P23).
Client organisations have their own perceptions, or views, of a project’s success
(P14, P19). These can be subjective (P11), implied (P29) or unique to each
project (P14) or client (P19). They are also prone to change (P15, P16, P31);
perhaps as the business changes (P31), the goals of the project change (P26),
or the project evolves (P16). In this respect, a successful project can be defined
in terms of the way that these perceptions, or expectations (P21), have been
identified (P25, P29), managed (P19, P20, P22) and satisfied (P25) and the
degree of client buy-in that has been attained, particularly from the project’s
sponsor (P17). However, this “dynamic” view was not found to be universal; for
example, project success was also be defined as delivering what was agreed at
the outset of the project (P3, P8, P17, P20, P29). In other words, “delivering ...
what you’ve defined in the first instance” (P17).
Although client organisations usually comprise a number of stakeholder groups,
end users are particularly important in defining project success. The project’s
deliverable has to be fit for purpose for those that will make use of it (P15). In
other words, end users can engage with the information system in such a way
that it makes a difference to them. Thus, the end users are actively using the
system (P21) and are happy working with it (P12). Or, as one participant stated,
“there’s no good in having a system that’s fully functional if it’s not useable by
the people who are going to use it” (P29). Thus, a successful project is one that
satisfies the client’s real needs (P16), principally the end users (P17), with the
project deliverable becoming the organisation’s “book of record” (P4) for many
years after implementation (P29).

Chapter 4. 20 success factors for OISD projects
132
4.3.2.2 Supplier organisation
As commercial organisations, suppliers need to meet certain financial (or
commercial) objectives (P22, P24). In short, they need to make money to be
able, or willing, to sustain their business activities (see, for example, Goldratt &
Cox, 1984). And, because all of the participants’ companies use OISD projects
as the primary vehicle to deliver their products and services, there is normally
an anticipated profit margin, or commercial objective, associated with each
project (P10, P13, P14, P19, P22, P33). Therefore, getting paid is a measure of
project success. As one participant pointed out, “If the customer pays for it, it’s a
success” (P21) and, for suppliers, getting paid is important (P5, P22). Put
slightly more colourfully, “It’s extremely bloody irritating if you don’t get paid”
(P28).
Another aspect that can help define a successful project is “what did we get out
of the project that’s going to help us make the next one more successful?”
(P21). Successful projects can also be described as an “intellectual success”
(P23) and can deliver better internal processes and technologies for use on
future projects (P33). Successful projects can be enjoyable (P23, P28, P33) or
provide satisfaction to those involved (P24). As one participant said, “That was
a great project and I really enjoyed working on it” (P33). Such enjoyment and/or
satisfaction might apply to everybody involved in the project, including the client
(P24).
4.4 Success factors
This section discusses the responses to the main interview question, presented
to the interview participants as a statement: “In my experience as a [project
role], [a particular factor] is significant to the success or failure of an OISD
project because ... [discussion].” In all, the participants identified and described
20 OISD project success factors. These factors are listed in Table 4.2.

Chapter 4. 20 success factors for OISD projects
133
Rank Type Factor Coverage (%)
1 Process Effective requirements management 15.5
2 Actor Effectiveness of the project team 11.4
3 Process Effective communication 9.7
4 Actor Effectiveness of the project manager 6.9
5 Process An effective development approach 6.8
6 Actor Effectiveness of the client organisation 6.6
7 Actor Effective client involvement 6.4
8 Process An effective sales process 5.5
9 Artefact A fit for purpose project governance model 5.3
10 Process An effective project start-up 4.9
11 Process Effective project planning 4.7
12 Artefact Fit for purpose technology 3.7
13 Process Effective software testing 2.4
14 Process Effective risk management 2.2
15 Process Effective change management 1.7
16 Process Effective stakeholder management 1.7
17 Process Effective post implementation support 1.5
18 Process Effective training 1.5
19 Process Effective expectation management 1.2
20 Process Effective lessons learning 0.5
Table 4.2. 20 OISD project success factors
Prior to describing each of these factors, the order in which they should be
presented deserves discussion.
4.4.1 Determining the relative importance of OISD project success factors
More often than not, OISD project success factor studies (as discussed in the
literature review) rank their factors in terms of their relative importance
(significance, criticality, etc.). Thus, the most important factor is ranked one, the
second most important is ranked two, and so on (see, for example, Procaccino,
Verner, & Lorenzet, 2006; Sauer & Cuthbertson, 2003; Yeo, 2002). In
quantitative studies (for example, Cerpa & Verner, 2009; Chow & Cao, 2008;
Han & Huang, 2007), these rankings are determined using descriptive statistics.
As qualitative studies do not make use of such techniques, simpler methods are

Chapter 4. 20 success factors for OISD projects
134
often utilised to determine the significance of the factors they identify. For
example, studies by Moynihan (1996) and Taylor (2007), both of which are
comparable to this study, cite the number of interviewees that make reference
to each of the factors that they identify. However, the suitability of such an
approach is somewhat questionable. In particular, it takes no account of the
amount of time and effort expended by the interviewees to describe a particular
factor. Consider, for example, one success factor that is described at length by
an interviewee and another that simply receives a brief mention. Surely, the
former carries more weight in terms of its significance. For this reason, the
factors listed in Table 4.2 have been ranked (initially) using the coverage each
received from the interview participants36.
Unfortunately, the use of coverage figures to rank factors is not without its
concerns. One issue is that the coverage figures might be construed as
absolute values (refer to Table 4.2); for example, that effective requirements
management (ranked 1st with 15.5% coverage) is 31 times as important than
effective lessons learning (ranked 20th with 0.5% coverage). At best, this is
misleading but, more probably, dangerous in terms of its implications. Indeed, it
can be argued, that without an effective lessons learning process, the
performance of future projects is unlikely to improve. Hence, effective lessons
learning should be considered as highly significant for OISD project success.
The use of coverage figures also ignores any emphasis or significance afforded
to the success factors by the interviewees. However, as only eight of the
interview participants identified a factor (or factors) as being key or significant
(refer to Table 4.3), this does not seem to be a serious issue. On the contrary,
over 75% of the interviewees did not attach any explicit significance to any
36 The coverage figures presented in Table 4.2 were calculated as follows. First, the word
counts for each of the factors were determined. For example, if three interviewees had
described a particular factor using 300, 400 and 500 words respectively, the word count for
that factor would be 1,200 words. Next, the total coverage was calculated by summing the
individual word counts of all 20 factors. Finally, the coverage figures (one per factor) were
calculated by dividing each factor’s word count by the total coverage figure and multiplying
by 100 to obtain a percentage.

Chapter 4. 20 success factors for OISD projects
135
factor, thus implying that no one factor is any more important than any other. Of
course, if this is the case, then it can easily be argued that the success factors
should not be ranked at all. Indeed, this was the conclusion reached by
Bannerman (2008, p. 2125) because he deemed all of the factors in his study to
be important. Therefore, as the use of coverage figures (or reference counts as
discussed above) to rank success factors is somewhat flawed and also that
there is evidence to suggest that all factors are important, a more suitable
approach is required to present the 20 OISD project success factors listed in
Table 4.2.
Participant Key factor(s)
P2 1) Fit for purpose requirements, 2) effective communication
P3 1) A controlled project start-up
P9 1) Overselling in the sales process, 2) effective communication
P10 1) Effective requirements management, 2) management commitment (for larger projects), 3) effectiveness of the project manager
P14 1) Effective project planning, 2) effective communication, 3) fit for purpose requirements
P17 1) Usability and 2) reliability of the project deliverable
P29 1) Effective project planning
P30 1) Effective communication, 2) honesty of the project stakeholders
Table 4.3. Key success factors identified by the interview participants
As discussed in Chapter 1 (see p. 5), an OISD project is a specialised form of a
generic project: a temporary endeavour (Project Management Institute, 2008, p.
5) to create an organisational information system. Thus, an OISD project is a
process. As with its generic counterpart, an OISD project comprises various sub
process (see, for example, Project Management Institute, 2008, p. 43). As, 14
of the 20 success factors identified by the interview participants are processes
or, in the case of an effective development approach (Factor 5 in Table 4.2),
process related, it makes sense to present these first. It also makes sense to
present these factors chronologically within the context of the project life cycle
and the software development life cycle (SDLC).
Chapter 4. 20 success factors for OISD projects
136
Another reason for presenting process related factors in chronological order is
that the interviewees provided evidence to suggest that processes and events
occurring earlier in the project can have a significant impact on subsequent
processes. For example, an unsuccessful sales process (Factor 8 in Table 4.2)
renders the remaining factors irrelevant. Similarly, a poorly executed sales
process can prove extremely detrimental to the remainder of the project; as can
a poorly executed project start-up (Factor 10 in Table 4.2). Indeed, in the
context of software testing (Factor 13 in Table 4.2) it is always better to detect
software defects earlier rather than later when they can become far more costly
to rectify.
Hence, the remainder of this section will present the 20 success factors
identified by the interview participants as follows. The 15 process related factors
are discussed first. These are followed by the two artefact success factors
identified by the study (a fit for purpose project governance model and fit for
purpose technology) and last, but by no means least, the four actor related
success factors: the effectiveness of (1) the project team, (2) the project
manager and (3) the client organisation, and (4) effective client involvement.
4.4.2 Process related success factors
This section presents the 14 process related OISD project success factors
identified by the interview participants. To aid the discussion, Figure 4.1
provides a schematic representation of an OISD project in which the 14 success
factors are depicted as key processes in relation to simplified project and
software development life cycles.

Chapter 4. 20 success factors for OISD projects
137
Figure 4.1. 15 key OISD project processes identified by the interview participants
As Figure 4.1 shows, the sales process precedes (denoted pre) project
execution. Project execution comprises 11 processes with two others (post
implementation support and lessons learning) occurring post execution. This
shows that supplier organisations are well aware that project success is not
simply a function of the project execution processes. Instead, the project life
cycle needs to be “extended” to encompass processes that are pre and post
execution. This also applies to six of the project execution processes (Factors 3
to 9, inclusive, in Figure 4.1), elements of which can be carried out earlier (and
for that matter, later) in the project as integral parts of the sales process and
project start-up.
Having presented the key project processes in relation to the project and
software development life cycle, the remainder of this section presents the 14
Pre Project execution Post
Project life cycle Init Develop Implement
SDLC Req Des Bld Test
Process
1: Sales process
2: Project start-up
3: Communication
4: Project planning
5: Risk management
6: Stakeholder management
7: Expectation management
8: Change management
9: Requirements management
10: Software development
11: Software testing
12: Training Project team End users
13: Post implementation support
14: Lessons learning
Key: Init: project initiation, Req: requirements definition, Des: software design, Bld: software build

Chapter 4. 20 success factors for OISD projects
138
process related OISD project success factors identified by the interview
participants. The factors are presented in the order depicted in Figure 4.1.
4.4.2.1 An effective sales process
IS/IT supplier organisations earn their reputations by delivering successful
projects. However, as a precursor to successful delivery, authorisation must be
obtained from the prospective client organisation to embark upon the project. In
some cases, projects are obtained directly as a follow-up to prior projects.
However, in the majority cases, projects are obtained as the result of an
successful sales process. Unfortunately, as a number of the participants pointed
out, the sales process it not always executed in a satisfactory manner (P2, P3,
P4, P7, P9, P13, P14, P19, P21, P24, P26, P31). A badly executed sales
process (or cycle) has the potential to cause a project to fail straight away (P21,
P31), before the development activities have even started. Indeed, a number of
participants, typically working in larger organisations, provided examples of
projects in which the sales process had caused significant difficulties. As one
disgruntled project manager stated, “Salesmen have screwed up projects
royally before” (P3), a criticism that one sales-oriented participant considered to
be somewhat well deserved (P7). In addition, the view that sales personnel are
notorious for selling things that are hard to deliver was expressed by several
participants (P2, P3, P7, P9, P14, P21, P24, P26). It was even stated that, for
some sales personnel, “ethics doesn’t matter – [they are] out to make money”
(P3) and that some companies might even be dishonest with clients when trying
to secure future projects (P2).
The problems caused by poor sales processes manifest themselves in a variety
of ways. In some cases, project managers (and consultants) find themselves
faced with unrealistic timescales (P3, P9, P24) or with allotted budgets that turn
out to be insufficient (P13, P14, P21, P24). In other cases, specific
requirements have been missed (P14) or the promised functionality simply not
possible or available (P3, P9, P14, P21). As such, the interviews revealed
various examples of project staff having to deal with the consequences of
unrealistic client expectations (P2) due to sales staff overselling (P9); to quote,

Chapter 4. 20 success factors for OISD projects
139
“life, the universe and everything” (P21). Thus, project staff are often left to deal
with significant issues (P14). In some cases, this involves having to work out
how the system will function in the manner that sales personnel had promised it
would (P9), sometimes by cutting corners from day one of the project (P3). This
was seen by one project manager as an external factor over which they have
little or no control (P3). Unfortunately, it would seem that such occurrences are
all too frequent (P24).
To be fair, the sales process is not without its difficulties (P2, P3). There are
often commercial pressures, particularly in the current economic climate37 (P9,
P26). As a consequence, projects can be underbid to secure work (P26).
Similarly, bids (or tenders) might be submitted for the wrong jobs: “Bidding for a
job that doesn’t fit our technology or experience as a company particularly well
... gives us a whole potential stack of problems later on” (P19). Conversely,
securing projects with an appropriate fit increases the probability of success
(P28). Getting this right can also be influenced by the client organisation in that
they should evaluate the supplier organisation to determine “how good a fit they
are” (P4). During the sales process, information can also be vague (P14, P24):
“You don’t know the whole picture when you’re tendering” (P24), making it
difficult to quote accurately for prospective projects (P13). Indeed, in some
cases, the information provided by the client during a tendering process can
turn out to be completely different from the real requirements (P11).
The client organisation can also have a significant influence by dictating the way
in which their procurement process (or procurement model) is executed (P4,
P28). For example, the supplier organisation might only be allowed to provide a
few demonstrations to one or two managers (P4) who, perhaps, “haven’t a clue
about what they’re trying to do” (P31) as opposed to involving client staff who
will actually use the system (P9). Alternately, supplier organisations can be
required to submit competitive tenders (closed bids) that require interpretation
37 The global economic downturn of 2008 to the present day.

Chapter 4. 20 success factors for OISD projects
140
of supposed requirements (P13). The ability of the client organisation to judge
and evaluate tenders can also be influential (P4, P31).
There are also a number of other problems, generally more applicable to larger
rather than smaller organisations. The first of these is that the staff involved in
(or are responsible for) the sales process often differ from those who will deliver
the project (P13, P14): “Somebody will sell something ... and then just
disappear” (P7). This lack of continuity can manifest itself as a lack of
accountability for delivering the end solution (P3). Clearly, this situation can be
alleviated by ensuring that delivery personnel are involved in the sales process
(P13, P21). Secondly, it is sometimes the case that sales staff lack sufficient
knowledge regarding the proposed solution. As one participant stated, “They
know enough about things to be dangerous ... they know they key words ... the
buzz words” (P2). Similarly, there are instances where a salesperson simply
“doesn’t know enough about the product, does a demonstration, promises [the
customer] the earth and then hands [the project] over” (P9) to the project
manager, more often than not, with insufficient information (P9).
In general, the sales process is a more significant success factor for larger
organisations. This is because, in smaller organisations, there is typically more
likelihood that those who deliver the project will also have had involvement in
the sales process. That said, this does not mean that smaller organisations are
immune from the effects of poor sales processes. They also need to ensure that
their sales process adheres to basic project governance principles; for example,
that it produces a statement of work, signed by representatives of both the
supplier and client, to specify exactly what is to be delivered to the customer
(P27).
In summary, a well-executed sales process would seem to be an important
factor for OISD project success. It should involve a great deal of up-front work
to ensure that implementation planning issues are not left until project start-up
(discussed in the next section). In other words, it is prudent to ensure that a
measure of implementation thinking is carried out at the start of the sales cycle
(P4). As one project manager stated, “It’s better for us to engage as early as

Chapter 4. 20 success factors for OISD projects
141
possible” and “the quicker you can get from sales mode to implementation
mode the better” (P11). Indeed, engaging with clients earlier rather than later
can lead to increased sales and revenues for the supplier organisation (P11).
Achieving this requires lots of face-to-face communication between appropriate
staff thus building the customer relationship and setting realistic expectations.
Effective handovers between those involved in the sales process and
implementation staff are also beneficial (P13). More so, it seems important that
sales staff have an involvement in the overall business as opposed to a “go out
and sell something” mandate (P13).
4.4.2.2 An effective project start-up
A project’s start-up (initiation, setup or kick-off) represents the first stage of the
project’s execution process (refer to Figure 4.1). However, as described above,
it will almost always have been preceded by some form of sales process (also
referred to as the procurement process from the client’s perspective).
Therefore, in some cases, “you’ve already done a lot of the implementation
thinking” prior to the project’s formal start-up or setup (P4). As such, there can
be a degree of overlap between the sales process and project start-up. Thus,
suppliers have licence to address certain start-up activities during the sales
process. Indeed there is evidence to suggest that engaging in start-up activities
as early as possible is beneficial to project success and the supplier
organisation as a whole (P12). As discussed above, suppliers can achieve
higher sales revenues by engaging project staff early in the sales process
(P11).
The general view provided by the interview participants was that getting a
project’s start-up right was key to project success (P3, P26, P32). In fact, one
participant considered it to be the most important aspect of a project, stating
that, “If you invest enough time at the beginning then you’ll save time and
money ... later on in the project” (P3). Put another way, “If you set [off] on the
wrong foot ... the project’s a failure from the start” (P3) or, to use a cliché, “by
failing to prepare, you prepare to fail” (P3). Therefore, investing time and effort

Chapter 4. 20 success factors for OISD projects
142
to define the project up front and to ensure that is has a controlled start will help
make the project a lot easier during the remainder of its life cycle (P3).
Project start-up comprises a range of activities (or sub processes). Some of
these activities are concerned with the transition (or handover) from the sales to
start-up processes (P3, P8). For example, checking that the business case is
sound and that the allocated budget is adequate. Similarly, that project
objectives and timescale expectations are realistic and that commercial aspects
reflect the reality of the project’s requirements (P8). Other activities tend to
concentrate more on shaping how the project is actually going to be run. For
example, defining communication processes (P3, P15) and mobilising various
stakeholder groups (for example, the project team).
In terms of specific activities, the most widely cited was ensuring that roles and
responsibilities were properly defined and understood (P3, P8, P9, P15, P20,
P22, P25, P26, P33). Participants also cited budget preparation (P3, P4, P8,
P16, P26, P30) and the definition of objectives/goals/targets and success
criteria (P2, P11, P20, P30). Defining a business case (P7, P8, P25) and an
appropriate governance model were also considered important (for example,
reporting structures, frequency of meetings, change control process, etc.) (P3,
P8, P11). Other activities include requirements analysis, risk identification,
resource planning, stakeholder mapping, etc. (P8, P11, P12, P26). In this
respect, it is often prudent to embark upon these and other processes (refer to
Processes 3 to 9 in Figure 4.1 and corresponding Sections 4.4.2.3 to 4.4.2.9
below) at the earliest opportunity.
The start-up process also needs to produce a variety of output documents.
These include the project charter (terms of reference document or project
initiation document) (P8, P11, P12) and other key artefacts such as the initial
project plan (P3, P8, P12), with key documents requiring sign-off from the client
(P3). As such, project start-up represents the starting point for key project
processes such as project planning, risk management and requirements
management (see below).

Chapter 4. 20 success factors for OISD projects
143
Another important element of project start-up is ensuring that the appropriate
client and supplier side stakeholder groups understand, agree upon and,
preferably, sign-off on the various aspects of the project; for example, project
goals and objectives (P7, P8, P11, P26, P30). In this, communication is an
important factor, quite often facilitated by way of various kick-off, start-up or
project initiation meetings (P3, P8, P11, P12). Needless to say, these meetings
need to be planned, prepared for and conducted in an effective manner (refer to
Project Governance as discussed below).
Obviously, the amount of effort required for project start-up activities will vary
significantly depending on the size and complexity of the project. For larger
projects, start-up can be highly detailed (P26) whereas for smaller projects it is
likely to be less so. It is therefore important that start-up processes and their
deliverables are fit for purpose; for example, recognising that a project initiation
document might be three or 300 pages long, depending on the nature of the
project (P8).
In summary, the interviewees considered that time spent on start-up activities is
an important factor for project success. And, although an effective start-up
cannot guarantee success, the more time spent at the beginning tends to pay
dividends later in the project (P3): “The more that they’re defined and controlled
at the beginning ... makes them far more likely to succeed” (P32).
4.4.2.3 Effective communication
Many participants made reference to communication as a success (or failure)
factor (P1, P2, P4, P5, P6, P7, P8, P9, P10, P13, P14, P16, P29, P30, P31).
Therefore, it would seem that effective communication is also an important
factor for OISD project success. Indeed, four interviewees considered
communication to be key to OISD project success (P2, P9, P14, P30). As one
project manager stated, “If you don’t have good communications, you just don’t
have good projects” (P16).
One of the main reasons why communication is so important is that it underpins
most, if not all, of the project management processes (for example,

Chapter 4. 20 success factors for OISD projects
144
requirements management, project planning, etc.) discussed in this section.
Simply put, these processes would not be able to function without effective
communication. For example, how could a business analyst elicit adequate
requirements, or a project manager administer a project plan, without effective
communication? Thus, communication is intrinsic to the project as a whole,
acting as the glue that holds everybody (and everything) together, ensuring that
“everybody understands what’s going on in the project at all times” (P13).
The significance of communication can be illustrated by discussing what
happens when this glue disintegrates and projects become unstuck (or
fragmented). In this respect, a number of participants (i.e. P4, P16 and P30)
had experience of troubleshooting projects (by way of project interventions)
when things are going seriously wrong and/or are failing. In such cases, there
tends to be a great deal of friction and finger pointing between various
stakeholder groups; perhaps to the extent that “everybody’s staff is blaming
everybody else” (P28). Often, where there appears to be a wide range of
problems and issues, in reality, these turn out to be quite trivial (P16) and are
often the result of insignificant misunderstandings between stakeholders as
opposed to the incompetence of personnel (P30). In short, it is invariably the
case that failing projects are due to breakdowns in communication (P16, P30).
Therefore, the intervention required to get these projects back on track is
normally a case of bringing everybody together and getting them to understand
what the problem is. This is followed by arbitration to enable communication
between all those involved (P16) and ensuring that they are all moving in the
same direction (P16, P30).
Clearly, modern day OISD projects have a range of communication media at
their disposal. These include (in no particular order), paper based and softcopy
artefacts (for example, sign-off documents, reports, diagrams, plans, registers,
etc.), email, telephone and conference calls, meeting, workshops, etc. However,
there seems little doubt that verbal communication is more effective than written
means (P1, P6) and that face-to-face communication is the most effective
approach (P10, P20, P23, P30): “The easiest way to do it is to sit down face-to-
face and start work” (P30). That said, face-to-face communication is not just

Chapter 4. 20 success factors for OISD projects
145
about well-run project meetings. In many cases, it takes the form of an informal
conversation to discuss a problem openly (P10), perhaps by having a chat over
coffee (P4, P13) or even a beer (P19). That said, project meetings are still
important (P12), as long as they are not being held for the sake of holding
meetings (P16).
Not only does communication support all project processes, but it serves to
bond together all of the project’s stakeholder groups, ensuring that everyone is
“on the same page” (P16). Especially for larger projects, this means that there
may be a large number of communication channels between and within the
various stakeholder groups. Although the interviews made reference to a
number of these (for example, between the client’s senior management and the
end users), the communication channels between the supplier and the client
organisations seem to be particularly important (P5, P6, P9, P10, P13, P14,
P20, P24, P27, P29, P30). As one participant stated, “If you can’t crack the
communication with your customer, you’re going to struggle” (P5). In general,
participants considered building and keeping a good working relationship with
the client to be of prime importance. Regular contact with the client is therefore
essential (P12), thus “making sure that ... the client’s always aware [of] what’s
going on” (P6).
There are, however, a number of issues regarding communication. The first is
that some people are just not proficient at communicating. In particular,
software developers “traditionally ... aren’t the best people at talking to each
other” (P19). Similarly, some people have difficulty knowing when to
communicate, particularly if they are inexperienced (P18). For example, when
they have problems (P6, P18), “people are sometimes reluctant to ask for help
because it shows that they are not able to do something” (P6). In other cases,
people can be afraid to communicate, particularly if their message contains bad
news. For example, certain suppliers might not communicate effectively when
they are running late (P30). However, effective communication needs to convey
both good and bad news (P7). It can also be difficult to “make sure that
everybody’s ... talking a language that everybody else understands” (P16). This
might be down to the “ambiguity [of] meaning” in the communication content
Chapter 4. 20 success factors for OISD projects
146
(P1). It might also be due to varying degrees of interpretation, perhaps
influenced by an individual’s cultural background (P1, P16). It can also be due
to basic language barriers (P23) or, from a supplier’s perspective, a poor
understanding of the client’s terminology (P5, P12) (and vice versa from the
client side). As a result, the supplier is unable to converse with the client using
language that the client understands; a competence that is required of
contemporary supplier organisations (P5). There can also be difficulties
identifying appropriate communication channels in some client organisations,
particularly those with large, hierarchical management structures (P20). As one
participant complained, “It’s sometimes very difficult to find out [who to talk to] to
resolve problems” (P20).
The interviews also identified a number of hallmarks of effective communication.
It needs to be honest and truthful (P3, P4, P7, P13, P14, P29, P30). In the
words of one participant, “Honesty is important – pulling the wool over the
customer’s eyes just doesn’t work” (P14). Indeed, customers respond more
favourably to honest communication (P14). Communication should also be
open (P10, P13), thus ensuring that matters are presented up front (P3). It also
needs to regular (P6, P7, P9, P12, P14, P24, P29), especially when
communicating progress (and issues) from the supplier to client organisation.
In conclusion, regular, open and honest communication means that issues don’t
get hidden, are not allowed to worsen and can be dealt with more quickly (P10).
It also means that project team members are all working to the same objectives
and moving in the same direction (P2, P16); as opposed to making differing
assumptions that do not agree with one another (P19). Thus, effective
communication is key to project success. One participant, feeling particularly
passionate about this, advised, “Communicate to people, communicate to
people, communicate to people” (P8).
4.4.2.4 Effective project planning
Although it seems somewhat obvious, all projects, regardless of their size, need
some sort of project plan (P4, P18), as opposed to having no definitive start and
finish (P8), go-live date (P20), etc. Indeed, two of the participants (P14, P29)

Chapter 4. 20 success factors for OISD projects
147
specifically identified planning as a key success factor: “Planning is the major,
most important thing” (P29). However, the format of the plan and the techniques
used to produce and manage it can vary enormously depending on the size and
complexity of the project. For large, complicated projects a significant amount of
detailed planning work may be required (P7) whereas, for smaller, simpler
projects, a more simplistic approach is probably more appropriate. But again,
the key point here is that, whatever the project, “you have to have a plan” (P8,
P20); and that plan needs to be realistic (P9, P12, P16). Conversely, poor
planning, coupled with poor estimating, is likely to contribute to a project
missing its end date (P14).
A realistic project plan needs to be in place very early on in the project (P9). It
needs to reflect an agreed timescale for an agreed implementation of an agreed
deliverable (P4, P8). In particular, the project plan should identify a realistic and
definitive completion date (P8, P20). Thus the project plan precludes the “it’ll be
complete when its complete” mentality found in some organisations (P8).
Moreover, the plan needs to be communicated to and understood by the
project’s stakeholders.
Project planning requires the use of appropriate technical tools (P3), of which
Microsoft Project was the only such tool cited in the interviews. These tools
facilitate the production of realistic, coordinated plans that identify the necessary
activities along with their priorities, time scales, resource requirements and
dependencies. In particular, dependencies were identified by a number of
participants as being key in terms of their identification and management (P20,
P25).
A concept that seems worthy of consideration when developing the project plan
is the “valley of despair” (P8). Although projects often start with unbiased
optimism and enthusiasm from those involved (P8), there tends to come a point
towards the middle of the project when people recognise the enormity of what
they have taken on (P4/P8). It is at this time that those involved perceive the
project to be more difficult and more complex than originally expected (P8).
Either way, “there's going to be pain and discomfort” (P4). Moreover, it is in this
Chapter 4. 20 success factors for OISD projects
148
“valley of despair” (P8) (or perhaps towards the end of the project) that
unforeseen issues will arise, typically resulting in project slippage (P8). It
therefore seems reasonable that, if such a scenario is considered likely, the
“valley of despair” should be incorporated in the project plan (P8).
A major tenet of project planning is estimating the time required for the activities
that comprise the project (and also the demonstrated capacity of the project
team): “If we could hit our estimates, it would make everything else a lot simpler
to manage” (P32). Therefore, projects require personnel who are competent in
estimating (P33). Unfortunately, there are a number of problems regarding
estimates. As one participant revealed, “I don’t think I’ve been in involved in any
project where the initial estimates [have] been at all anything like what we
actually did in terms of hours” (P26). It was also pointed out that it can be
difficult to obtain commitments from project team members regarding activity
end dates (P14). One of the reasons for this is that it is quite difficult to provide
estimates for tasks that have not been performed before. Another is that people
tend to be overly optimistic when estimating, perhaps tending to favour the
perfect person-hour as opposed to realistic time estimates (P30). In summary,
people can be “really bad at ... working out how long it’s going to take them” to
do something (P30).
It would also seem that experience is a factor in estimating (P14, P33). For
example, estimates for the durations of activities given by inexperienced
personnel tend to be incorrect (P32). In general, more experienced personnel
tend to be better at estimating: “From experience they start to realise how long
things actually should take” (P30). Similarly, experienced project managers are
aware that they need to be able to identify optimistic estimates and factor these
estimates accordingly (P30, P32). Personnel also need to be provided with a
culture that (1) gives them the confidence to produce (and communicate)
realistic estimates, and (2) encourages them to improve their estimating skills
(P30).
Finally, there is a danger that, much like risk management (discussed in the
next section), project planning becomes an academic exercise (P8). “You can

Chapter 4. 20 success factors for OISD projects
149
have the best plan in the world” (P8) but the reality is that assumptions can be
wrong and that circumstances will change, particularly for longer term projects
(P8). In other words, projects rarely unfold as planned (P4) and project
managers need to recognise that they operate in a “world where things will go
wrong” (P8). For example, slippages need to be reported (P14) and key
dependencies monitored (P16). Thus, the project plan needs to be managed i.e.
not only tightly controlled and monitored, but also adapted to cope with a
changing environment (P4). Indeed, in extreme cases, the project plan may
have to be disregarded and a completely new plan put in place (P8).
4.4.2.5 Effective risk management
The interviews provided various examples of the issues that can arise over the
course of an OISD project: A third party supplier might fail to deliver a software
component to schedule (P19); an important task may not be carried out due to
absenteeism (P14); or, unexpected problems may surface during software
testing (P7). At a more general level, there might be the risk of missing the
project’s end date or failing to satisfy key requirements. Therefore, because
there is an element of risk on every project (P30), the most appropriate
approach to risk management should be given consideration during every
project’s start-up, regardless of the size of the project. That said, a strong,
rigorous approach to risk management (P8) (as opposed to less formal
approaches) is probably more appropriate to larger, rather than smaller,
projects (or programmes).
Unfortunately, it would seem that projects do not always have an effective risk
management process (P8, P30, P31). Some project managers do not (or are
not allowed to) manage risk properly (P30) and thus are unable to prevent risks
becoming real issues. As a result, unexpected issues arise (akin to those
described above) which threaten the objectives of the project. There are a
number of reasons for this. To a lesser extent, it can be because those involved
in the project simply do not understand risk (P8). The level to which the various
stakeholder groups are risk averse can also have an influence (P7). It can also
be because the project’s risks have simply not been adequately identified (P15)

Chapter 4. 20 success factors for OISD projects
150
or because the wrong people are involved in the risk management process
(P15).
The main reasons for ineffective risk management appear to be two-fold. The
first is that risk management is often a one-off exercise (P8). Despite being
adequately identified and documented at the start of a project, risk items are
simply left to “gather dust” (P8). Consequently, the remainder of the risk
management process becomes a passive (if not nonexistent) exercise, with
risks not being reviewed and mitigating actions not being monitored, progressed
and closed out (P30). Worse still, new risks that become apparent over the
course of the project are simply ignored (P31). In summary, the biggest part of
risk management is the monitoring of risk (P30) i.e. monitoring and reviewing
risks (and actions) on a regular basis (P15).
The second reason for ineffective risk management is that it is sometimes
viewed as the sole responsibility of the project manager. Clearly, in some
cases, this is unfeasible due to limits in the volume of information an individual
can cope with (P30). Therefore, a better approach is to transfer the ownership
of individual risks to members of the project team (or other stakeholder groups)
(P8, P30). However, adopting such an approach, does rely on a number of
factors. These include trust and communication (P30) and an organisational
culture in which people are encouraged and empowered to look after the
aspects of the project for which they are responsible (P30).
Finally, the participants also offered several pieces of advice regarding the risk
management process. These included using a consistent approach from project
to project (P14), ensuring that the review process is conducted regularly and in
a disciplined manner (P15), and employing an appropriate risk management
methodology (P14), complete with appropriate artefacts (risk registers, etc.)
(P20, P25, P31); for example, a “good, sensible level of PRINCE2 governance”
(P25) (discussed in Section 4.4.3.1 below).

Chapter 4. 20 success factors for OISD projects
151
4.4.2.6 Effective stakeholder management
A distinguishing characteristic between small and large projects can be the
number of stakeholder groups involved. For example, the development of an
enterprise solution for a large client organisation might well involve multiple
(third party) suppliers (P11), not forgetting the client’s internal IT departments
(P19). Supplier organisations might also find it necessary to hire their own third
party specialists (P16) or even recommend particular service providers (P29).
Similarly, the client will normally present itself at different organisational levels
(for example, senior management, end users, etc.), and as a diverse range of
departments or sub organisations i.e. different areas of the same business
(P13). There might even be multiple client organisations (P32).
From a client perspective, multiple stakeholder groups can have different
cultures and may never have worked with or shared information with each other
before (P31). They might well have diverse expectations (P32) and may all
have slightly different requirements from one another (P13). This can lead to
political infighting within the client organisation (P13). Similar problems can exist
on the supplier side (P26). Again, these can be the source of continuous
difficulties (P19). In a sense, it might seem obvious that supplier organisations
should act in unison on a project (P25), especially as the performance of each
supplier tends to reflect on each and one another (P29). Yet, this is not always
the case; for example, two suppliers competing for the implementation of their
own solution (P26) or, in terms of problems, “pointing the finger at each other”
(P20). In fact, it can be hard to get suppliers to talk to one another and deliver
effectively (P20). On the contrary, suppliers can resort to silo building, erecting
walls between each other to diminish inter-supplier communication (P25). The
same might be said of the stakeholder groups within the client organisation.
In general, multiple stakeholder groups make for more complicated projects
(P24, P31). And, with multiple stakeholder groups becoming the norm in many
projects (P31), an appropriate amount of stakeholder management is required
(P8): “You need to manage your stakeholders” (P8). Or, put slightly differently,
“you can’t take your eye off the ball in terms of stakeholders” (P8). However,
Chapter 4. 20 success factors for OISD projects
152
managing that totality is considered hard (P24) and, as one participant pointed
out, “If you can manage to cope with ... these different types of stakeholders ...
then you’re doing well” (P31). However, the reality is that projects can quite
easily end up on the brink of failure, sometimes to the point of litigation, if
stakeholders are not managed properly (P25).
4.4.2.7 Effective expectation management
To a certain extent, the process of expectation management shares a key
characteristic with communication (as described above) in that it forms an
integral part of a number of other processes (or factors) described in this
section (for example, requirements management, the sales process, etc.). That
said, communication is certainly a key element of expectation management.
Expectation management can constitute a significant element of an OISD
project, perhaps because “people’s expectations of what they get for their
money – or should get for their money – are really high” (P2). Part of the reason
for this might be down to the excitement that has surrounded IT over the past
years; for instance, the view that “software can do anything you want” (P21).
Another influence could be the proliferation of high quality, mass market
software that can be found on the desktops in end users’ homes (P2). It might
also be because modern day organisations, particularly in the current business
climate, simply demand value for money (P2). From a supplier’s perspective,
expectation management is also key to retaining a bank of goodwill with the
client organisation (P19).
Regardless of the reason, supplier organisations need to manage the
expectations if their clients. In particular, managing the expectation of what’s
possible and what’s not (P22). Realistic expectations need to be set early in the
project life cycle (P11). This is particularly important in the sales process to
ensure that the supplier organisation is not overselling what they are capable of
delivering (P19). Expectations also need to be managed as the project
progresses; for example, through the regular alignment of expectations as initial
assumptions change (P19).

Chapter 4. 20 success factors for OISD projects
153
Suppliers are likely to encounter major challenges if they have not defined and
managed the expectations of the client organisation in terms of the project
deliverable (P8). In particular, supply organisations can expect “a bit of a battle”
as clients attempt to secure additional functionality for their financial outlay (P2).
Indeed, client organisations can expect features to be delivered regardless of
whether or not they have been documented (P11). However, expectation
management is not just about the project’s end deliverable. Managing the
customer’s expectations regarding the implementation process is equally
important (P8). Customers need to understand the reality of not only (1) their
involvement in the implementation process (discussed in Section 4.4.4.4), but
also (2) the timing of the deliverables that will provide a project’s benefits (P8).
This can be particularly true of executive management (the project board) as
they can “be a bit divorced from reality in [OISD] projects ... as to what
something actually is and what something isn’t” (P8).
The final point about this factor is that it is not only about managing client
expectations. For example, the supplier organisation’s project team will have
their own expectations and, as such, need to be given appropriate consideration
and management (P8). A similar argument can be applied to other stakeholder
groups in the project (for example, other supplier organisations). Therefore,
expectation management can be considered a greater challenge for larger,
rather than smaller, projects.
4.4.2.8 Effective change management
Although it could be argued that the responsibility for change management lies
with the client organisation, a number of participants still recognised this as a
success factor.
According to the interviewees, people can be averse to change (P31), can act
negatively towards it (P19) and will tend to fight against it (P31), especially if
they feel it has been foisted upon them (P19). Given that people can also be
very resourceful and innovative (P21), this can be a significant issue: “If [the
end users] can get around a system, or make something easier for
them[selves], they will” (P21). Many organisations are not used to change and

Chapter 4. 20 success factors for OISD projects
154
find it difficult to deal with (P31). Some simply lack the flexibility and dynamics
required to change their ways of working (P31). More so, the majority of
organisations do not understand business change (P31). In short, for many
organisations, change is something that is incredibly difficult to achieve and is
often done slowly (P31).
Yet, OISD projects can involve a significant amount of change on the part of the
client organisation (P31). In some cases this might involve radically different
ways in which the organisation does business i.e. as the new system enables
the business to introduce new processes (P31). In others, operational efficiency
changes might involve redistributing staff (P31) or perhaps even reducing
headcount (P19). In such circumstances, people tend to become nervous about
measures that might result in them losing their jobs (P19). Hence, organisations
will typically tend to fight against these changes. However, the effects of
ineffective change management can be devastating. For example, if a client
organisation fails to change, “You [can] end up with a system that’s
implemented, does everything that you need it to do, but nobody uses it” (P21).
Hence the need for effective change management.
Effective change management is not easy, has many facets and is time
consuming. It involves effective communication and active involvement with all
levels of the organisation (P31). Change management requires effort to
convince people of the need for change and hence obtain buy-in and
acceptance of the proposed solution (P21). It involves not only an assessment
of the impact on the organisation (P31) but the emotional impact on individuals
(P7). For example, the project might have a profound impact on people’s
attitudes to their jobs. Thus, appropriate messages need to be carefully
communicated to the end user community to secure their buy-in (P19/P31). In
particular, people need to understand the reasons for their own emotional
investment (P19). Failing to do this can result in people feeling uncomfortable
and hence fighting against the changes required for the project to be successful
(P31).

Chapter 4. 20 success factors for OISD projects
155
Another aspect of change management involves minimising the impact of the
change. “People are much more accepting ... if the change isn’t such a big one”
(P17). In particular, one participant (predominantly working on smaller projects)
emphasised the need to maintain familiarity where possible: “If something is
familiar, you’re more likely to use it” (P17). As such, it is often wise to look at the
systems that the client organisation is currently operating and not just providing
a deliverable that is new but unfamiliar to them (P17).
4.4.2.9 Effective requirements management
In addition to appearing in the majority of the interviews (27 in all), the subject of
requirements and their management received the greatest amount of coverage
from the participants. In essence, requirements management would seem to be
a key factor for project success (P2, P10, P14). Simply put: “Incorrect
requirements means that you’re off building the wrong thing” (P25). However, it
is also problematic, partly because the process spans the entire project life
cycle, linking the project’s inception to its ultimate delivery, and thus
encountering a wide range of issues in between.
Determining (or defining) requirements, although easier on smaller projects, can
be difficult (P1, P24). Yet successful projects require a solid understanding of
what will be delivered (P2, P5, P24, P27, P28, P33). As one participant stated,
“If you’ve not got the requirements right at the beginning ... you’re on a hiding to
nothing” (P24). In other words, effectively identifying a project’s requirements, or
scope, is a key success factor (P2, P10, P14). Conversely, “not understanding
what the customer wants in the first place” may be regarded as a failure factor
(P13). Hence, one of the biggest issues for many projects is gaining a
comprehensive understanding of the problem in relation to business needs and
requirements, and then to convert this understanding into a requirements
specification that defines exactly what needs to be developed. As one
participant stated, “Once we’ve both agreed what the problem is, then we can
start thinking about the solution” (P17).
Without adequately stated requirements, the final deliverable becomes an
intangible entity (P11). Thus, it can be difficult to determine when the project is

Chapter 4. 20 success factors for OISD projects
156
actually finished (P15) and the final outcome may well be an information system
that is not what the client organisation needs (P16). In the interim, inadequate
requirements are often the cause of problems during a project’s testing phase
(P19). Yet, determining adequate requirements for OISD projects is not easy
(P1, P24). Not only do requirements need to be within the bounds of earlier
project documents (P10); for example, the project charter, but they need to
reflect the client’s expectations and goals (P20). Unfortunately, it can be difficult
to understand what is required at the beginning of an OISD project (P24), as
many customers “don’t understand what they want in the first place” (P13).
A number of interview participants made reference to the requirements
definition process (P17, P22, P23, P24, P25, P27, P29), comprising both
requirements elicitation (or gathering) (P2, P3, P5, P10, P14, P27) and analysis
(P3, P10, P16, P22). In terms of dependencies, the requirements definition
process requires consideration early in the project; for example, to avoid
resourcing issues, the required skill sets should be identified earlier in the
project (P19). Similarly, “understanding the objectives of the key stakeholders
on the client side is crucial” (P20). Otherwise the definition process becomes
“vague and woolly” (P20), resulting in all sorts of requirements, many of which
might be irrelevant.
Although it might seem obvious that “the person that wants the project needs to
know what they want” (P17), it can be the case that the client’s understanding of
what they “think they want” differs from “what they really want” (P24). Another
problem can be that the client organisation simply does not know what it wants
from the project (P1, P5, P13) or does not seem to be fully aware of what its
requirements are (P2, P11). Another reason is that the client’s senior
management, normally the initiators and sponsors of the project, do not
understand their organisation’s “coalface” i.e. the real business rules and
workflow processes within their organisation (P5, P11, P28). In extreme cases,
management “don’t know anything about what their staff do” (P28) and have “all
sorts of weird ideas about what they want” (P28). For example, in one client
organisation, it became clear to the supplier that the client’s senior managers
had “never been near a loading bay in ... the last 25 years” (P16) and thus could

Chapter 4. 20 success factors for OISD projects
157
not articulate realistic requirements. Hence, gaining access to appropriate
individuals is key to successful requirements elicitation (P5, P24, P27). Indeed,
a common failure of requirements elicitation is that “nobody went and actually
asked the right people” (P16). More often than not, this interaction goes beyond
senior management and includes other key stakeholder groups; in particular,
the business/end users i.e. the people that actually use the system (P5, P11,
P14, P16, P27, P28). As one participant stated, “You need to speak to the
people that are going to be using [the system]” (P27). However, due to funding
and resource issues, gaining access to end users is not always easy (P16).
Similarly, access to end users is sometimes denied to prevent them from
requesting additional functionality (P21).
As one or two people “doesn’t provide the business perspective” (P14), a larger
number of client side staff should be involved in the elicitation process (P27,
P28). Thus, a significant amount of information would be collected to make it
easier for the supplier over the remainder of the project (P6). However, user
involvement should be balanced as “too much ... is bad because it generates
requirements that aren’t actually realistic. Not enough means you’re not going to
get your user acceptance” (P21). Although there are a number of methods used
to elicit requirements (for example, individual interviews, reviewing existing
systems, etc.), the use of requirements workshops has merit: “Getting the right
number of people involved in requirements workshops at the start makes a big
difference” (P14).
An important role in the elicitation process is that of the requirements (or
business) analyst (P3, P10, P16, P22) i.e. analysts who can determine exactly
what “the remit is of what needs to be developed” (P3), including requirements
that are inferred rather than explicitly stated (P29). Analysts need experience in
their field or domain (P16) i.e. a deep understanding of the industry sector and
application area (P16). They need to understand how the client organisations
operate (P9, P24, P29), not just at present, but in the future (P9). This is
particularly important from the client’s perspective as customers can assume
and expect that a supplier understands each and every issue, even if these
transpire to be company specific (P16). Analysts also require a range of other

Chapter 4. 20 success factors for OISD projects
158
skills. They need to be able to ask the right questions (P1, P9) in an effective
and appropriate manner (P10) using the customer’s language/terminology (P5).
To dig a little bit deeper (P16, P22), they need to be inquisitive (P5, P29) and
“nosey” (P5). They also need to be “up front when [they] don’t understand
something” (P5) and have excellent listening skills (P10). In general, analysts
need a range of soft skills in order to carry users forward, to agree upon
requirements and create user buy-in (P10). That said, analysts also have to be
able to stand their ground, particularly on requirements that are out of scope
(P10). Finally, analysts need to be able to articulate their findings in writing in
the form of a requirements specification (or statement of work) (P27). As such,
analysts need to be able to structure their thoughts, structure the document,
spell correctly and use appropriate grammar (P10). Unfortunately, according to
one participant, these skills seem to be less common now than they were 20
years ago (P10).
The requirements specification is a key artefact in the requirements
management process. Requirements documents constitute an output of the
definition process and serve as a cornerstone of understanding for all
stakeholders regarding the requirements for the solution that the project will
deliver. In other words, a key part of requirements management is to “write
them up, send them out, get them signed off – and then you’ve got a page to
work on” (P14).
Adequate requirements documents should be accurate (P3), unambiguous
(P10) and understandable (P10, P22, P27). They should be easy to read (P10)
and consistent in terms of their language and level of detail (P10). Furthermore,
they should employ language and artefacts (for example, use case diagrams)
that are appropriate to the target audience (P22). They should also be
presented at a functional, not process, level (P4) and should define exactly what
is to be developed (P3) and/or what is expected (P17). That said, larger projects
tend to need more prescriptive requirements documents (P1).
Without adequate requirements documents, stakeholders will be unable to
understand what they have signed up for (P10). In the first instance, this lack of

Chapter 4. 20 success factors for OISD projects
159
understanding serves to undermine stakeholder buy-in (P10). Secondly, it
prohibits project team members from having a shared understanding of
requirements causing them to head off in different directions (P2) during the
delivery of the project. Indeed, a common cause of projects going off track is
that the technical team does not understand the requirements (P16). In
summary, without adequate requirements documents, you are unlikely to
produce what is expected (P18); a serious and costly mistake (P25).
However, it can be incredibly difficult to produce high-quality requirements
documents (P1). Over and above the literacy skills of their authors, this might
be down to insufficient time being made available for the task; for example, a
sponsor who does not care about the effort put into documents (P2). It can also
be difficult to utilise requirements documents. In particular, identifying omissions
from specifications can be a difficult problem (P32). They will be also be
interpreted and understood differently between individuals (P32), perhaps due
to different cultural backgrounds (P1). Furthermore, documentation inevitably
raises questions (P20). Not only do the readers have to know what questions to
ask but they need access to the documents’ authors (P20). Otherwise,
stakeholders can really struggle to interpret the requirements (P20).
Another use of requirements documents is to obtain customer sign-off on
project requirements (P3, P6, P10). However, this can also be difficult. This is
partly because individuals are afraid of accountability (P10), but also because it
can be difficult for them to leverage change after sign-off (P10). Yet, customer
business environments and cultures tend to change (P9, P10). There are many
reasons for this including competitive pressures and changing legal
requirements. Businesses also tend to move forward in terms of new products
(and services) and changes in management (P13). Or perhaps the business is
simply experiencing growth (P29). All of these factors can cause requirements
to change over the course of a project, particularly in longer projects (P13). As
such, a project’s initial scope is seldom correct and is itself subject to change
(P10). As one participant stated, “I don’t think I’ve ever been involved in any
project ... that the requirements we start with are the requirements that we end
up with at the end of the day” (P24).

Chapter 4. 20 success factors for OISD projects
160
Unmanaged incremental changes to a project’s requirements can be referred to
as “scope creep.” In this respect, poor scope control, can be described as a
significant factor affecting the success of a project (P10, P17, P24), particularly
for fixed price projects (P19, P24) (as opposed to projects priced on a time and
materials basis). Although scope creep can be caused by the factors outlined
above, it can simply be due to inadequacies in the original requirements
specification (P6, P14); again, perhaps because the clients do not know what
they want in the first place (P26). Its source can also be political; for example,
when middle management try to maximise functionality for their own
departments (P10).
Scope creep can be difficult to deal with, particularly for inexperienced project
personnel (P2). In some cases it can be a huge problem that causes
considerable rework and thus adversely affects both timescales and budgets
(P6, P14, P24). Moreover, it may lead to failure as the project can no longer
deliver the required functionality within its given resources (P10). Scope creep
can be alleviated by measures such as senior management involvement (P10),
effective expectation management (P4), iterative development (P29),
requirements sign-off (P6, P13, P17), and commercial flexibility (wriggle room)
to absorb changes (P19, P29). However, controlling changes usually requires
an effective change control process. Otherwise, supplier organisations can find
themselves undertaking a large amount of extra work at their own cost (P14)
and to the detriment of system maintainability and the project’s delivery date
(P17).
One of the reasons for having an effective change control process is that
customers do not always understand the impact of seemingly small changes
(P6). However, the basic reason for having a change control process is that
many projects fail because changes to requirements are simply not managed
properly (P17). Not only does an effective change control system need to be
rigorous but it should be explained upfront (P6). This informs the customer that
there will be an impact due to changes (P6). Effective change control also
needs to be properly managed as opposed to simply being a collection of
“fantastic looking artefacts” and procedures (P20).

Chapter 4. 20 success factors for OISD projects
161
In summary, requirements management is a key factor for OISD project
success. Clearly, careful attention should be paid to the issues surrounding the
definition of requirements and preparation of the initial requirements document.
However, it is equally important that changes to these requirements are
appropriately managed throughout the life cycle of the project.
4.4.2.10 An effective software development approach
OISD projects can be delivered using a number of different software
development (and deployment) approaches. Broadly speaking, these include:
(1) The traditional one-off waterfall approach (predetermined requirements
are delivered by an one-off development process/cycle);
(2) Incremental development (predetermined requirements are developed
over two or more increments/cycles);
(3) Iterative/evolutionary development (requirements are allowed to evolve
from one development iteration/cycle to the next).
Introductory explanations of these approaches can be found in elementary texts
such as Hughes and Cotterell (2006, pp. 68-92).
In general, participants did not favour the use of a pure waterfall approach.
Instead, deliverables were usually split into phases, increments or iterations,
especially for projects with longer life cycles. That said, the development
approaches described by the participants tended to be more incremental than
iterative (or evolutionary) by nature. In other words, although requirements can
be modified slightly between planned increments (for example, as the
“technology changes, the business changes [or] people change” (P31) or,
perhaps, as the client’s understanding of the solution increases as increments
are delivered (P29)), they are far less likely to evolve freely throughout the
project. However, there was certainly a degree of confusion on the part of some
participants as to whether or not their approaches were incremental or
iterative/evolutionary.

Chapter 4. 20 success factors for OISD projects
162
The participants identified a number of drivers that influence the choice of
development approach. The first of these is the mantra of delivering early and
often (P15) to allow the business to realise benefit early (P10, P25) and with
lower risk (P31). This helps explain the predominant use of incremental,
phased, time boxed and iterative approaches to deliver solutions within very
short periods of time (P23), as opposed to waiting nine or ten months before the
system is ready (P27). There were also clients who do not know what they want
from the project (P14), thus requiring a more iterative approach. Indeed, a
staged approach could be required simply because “three months down the
line, the customer [might want] something different” (P13).
Other advantages of delivering in stages include the ability to leverage
opportunities throughout the project (P10). In addition, “if you say you’re going
to deliver in a month’s time, you get much better buy-in and ... participation”
from the client organisation (P13). Breaking the project down into smaller
chunks can also make them more “understandable and doable” and result in
lower risk developments (P31). It also negates the need for people to sign-off
huge requirements documents for delivery at some distant date (P10).
Furthermore, incremental delivery can build project momentum and form
delivery centric behaviours in the project team as they get used to delivering in
interim steps (P8).
However, there are other factors that often need to be taken into account when
deciding upon the most appropriate development approach. Not least of these
is the client’s preference for “the way they want you to approach it” (P22). For
example, an incremental approach is probably more appropriate for risk averse
organisations (P10) or where potential changes in management might lead to
new project objectives and requirements (P13). Similarly, for projects in which
multiple suppliers are delivering different aspects of the overall solution, each
might have different ways of working (P15, P24) such that their delivery
methodologies are incongruent to each other (P25). Hence, the need to ensure
that development approaches are in alignment with each other. At a more
fundamental level, the minimum implementation footprint i.e. the minimum

Chapter 4. 20 success factors for OISD projects
163
usable set of features (P15), might be so large that a pure waterfall approach is
the only feasible option (P10).
Other than the use of the three development approaches described above, the
interviews did not reveal the use of any specific development methodologies
(such as SSADM38). However, a number of participants did make reference to
various elements of the development approach which they considered to be
success factors. One such factor is prototyping: “We try and do as much
prototyping as possible” (P22). Prototypes provide instant feedback (P19),
assist in the identification of operational flaws (P16), and facilitate ideas and
recommendations that add value to the project (P16/P17). They also aid
communication through face-to-face contact (while reviewing the prototypes)
and help set client expectations by demonstrating the software throughout the
project (P19). In summary, “The earlier you can get [a prototype] back to [the
client] the better” (P16).
The need for an appropriate or minimum level of documentation can also be a
factor (P1, P17, P22), as opposed to documentation that “would give War and
Peace a good run for its money” (P21). Or, in terms of process, “don’t do quality
... for quality’s sake” (P13). As one participant explained, “I think you need a
minimum of technical design to get a solution well articulated and understood,
but it can become very self serving in that you end up spending more time
writing documents than you actually do building software. So I think there’s a
practicality to what design artefacts people must do – and there actually tend to
be not that many” (P25).
Finally, although there were various examples of iterative (or evolutionary)
development, the interviews provided little evidence to support the use of purely
agile development methods (although there were a few brief references to agile
testing). As one participant stated, “I try and keep away from things like agile to
be honest” (P5). Indeed, the general consensus was that agile methods are not
38 Structured Systems Analysis and Design Method.

Chapter 4. 20 success factors for OISD projects
164
appropriate for OISD projects (although they may be more suitable for in-house
development). One reason for this is that client organisations tend to be
uncomfortable with the “it’s done when it’s done” approach (P25), preferring
instead to specify requirements up front, if they can (P10). From a suppliers’
perspective, one participant stated that his organisation was more comfortable
with a document based approach as opposed to agile development with no
detailed designs, etc. (P15). Other criticisms suggested that agile development
can produce sloppy projects with solutions that are not particularly strong (P16).
Although it was also recognised that agile development might lead to “the
absolute Savile Row perfect fit” in terms of a solution, it was felt that it would,
more than likely, be a very expensive fit (P25).
4.4.2.11 Effective software testing
Eight of the interview participants discussed software testing as a success
factor for OISD projects. Effective software testing helps minimise the risk to
development (P24) and hence the project as a whole. Indeed, one of the
interview participants made it clear that their company had recognised the value
of software testing over the past few years and that they had made efforts to
improve their testing processes (P24). As she said, “We’re a lot better at testing
than we used to be” (P24). In summary, effective testing leads to fewer
troublesome deployments i.e. if done properly, there should be very few issues
during a project’s go-live stage.
However, testing is not without its problems, particularly for larger projects. As
one participant explained: “It’s amazing how hard it is to get test systems and
data that cover all the scenarios that you need to test for” (P20). Some of the
problems can be considered to be generic (applicable to testing in general),
whereas others are more specific to either:
(1) Development testing: tests performed by the development team (unit
testing, system testing, integration testing, etc.);
(2) User acceptance testing (UAT): tests involving staff from the client
organisation, typically performed after the development team have
performed their own testing.

Chapter 4. 20 success factors for OISD projects
165
At a generic level, testing is not always perceived as important by the client
organisation (P12). Thus, in situations where a project is behind schedule,
testing is often one of the first activities to be squeezed in terms of the time
made available for it (P24). There can also be significant difficulties, particularly
for larger projects, in developing a comprehensive range of test scripts. In other
words, there may well be scenarios that are difficult (if not impossible) to
anticipate; for example, how an application will actually be used by a particular
user (P14), or the effects of interference from a third party application (P14). A
similar scenario applies to projects involving multiple suppliers in which
constructing end-to-end testing environments is not only difficult but can be
costly and time consuming in terms of data setup (P20).
As far as development testing is concerned, the general consensus seems to
be that testing should start earlier rather than later: “If you find serious defects
down the chain, they’re very expensive to fix” (P25). In this respect, embedding
testers with the developers makes sense as test scenarios (even if incomplete)
can be started earlier and “big expensive defects get caught quicker and
therefore exercised out of the system quicker” (P25). Embedding testers also
improves communication thus decreasing the time required for testing (P25).
Finally, there are a number of issues regarding user acceptance testing (UAT).
Clearly, UAT should not commence until development testing is complete.
Otherwise, UAT turns into a “promoted beta test” (P22). However, involving
users prior to UAT can be beneficial (P24), particularly in setting their
expectations. In fact, a cause of testing phases that perform poorly is that the
client’s expectations have not been managed properly (P19). An ineffective
requirements management process can also be to blame (P19). Yet, sometimes
it is simply because end users reveal errors that the development team had not
considered or had assumed would never happen (P27). Also, UAT should not
be perceived purely as a validation of the project’s technical deliverable; it can
also be used to validate the training of the end users (P12).
But there can be problems with the end users themselves. The first is that the
right people required to perform the testing are sometimes not available (P12),

Chapter 4. 20 success factors for OISD projects
166
possibly delaying the project. The second, relates more to the issue of
ownership. To an extent, the completion of UAT i.e. sign-off that confirms the
system “does what it says on the tin” (P24), represents a shift in ownership from
the supplier to client organisation (P22). However, for some client staff, “the
responsibility of what they’re doing starts to weigh on them and the doubt starts
to creep in” (P22). This doubt can create disputes between the supplier and
client organisations and therefore elongate the time required to complete UAT
(P22). Fortunately, this can be alleviated by identifying someone on the client
side who can take control of end user activities in the UAT process (P24).
4.4.2.12 Effective training
The need for effective training in an OISD project seems abundantly obvious
(P3, P9, P17, P29). For example, when asked why end users needed to be
trained, one participant pointed out that without training they wouldn’t know
“how to use the system ... simple as that” (P9). As others said, you really need
to give “the users an understanding of what the system’s for” (P17) or even
“how to do a degree of trouble shooting” (P29). Yet, beyond the seemingly
obvious, there are other aspects of training that were described during the
interviews.
Training methods (P4) and the trainees’ characteristics (for example, differing
levels of IT literacy, age, etc. (P7)) need to be considered. Although some
aspects seem quite clear cut (for example, training with real data “makes it
easier [because] they’re training with information that they’re aware of” (P9)),
others seem less so. Take, for example, the train the trainer route (P4).
Although cost effective, this approach can lead to information being filtered, as it
is passed through the trainers (P4). This can result in a system that is hardly
used as the end users have not been provided with all of the necessary
information as to how the system operates as a whole (P4).
Training also needs to be considered, not only from the client’s perspective, but
in terms of the supplier’s staff too (P3, P8). For example, project teams may be
required to learn about new technologies (P3) or the client’s business
terminology (P9). These shortfalls in knowledge or skills should be well defined

Chapter 4. 20 success factors for OISD projects
167
at the beginning of the project and the project team’s training requirements
scheduled in the project plan (P3). Training can also be provided outwith the
project in terms of an individual’s personal development plan (P3). The skills
required to deliver a training session also need to be considered; for example,
investing time “before you run the training session to ... do some form of dress
rehearsal ... in a safe environment” (P8). This is particularly true for less
experienced team members in order to demonstrate that they do possess the
required competences (P8).
Finally, it is important to acknowledge that the benefits that can be derived from
effective training have their limits (P30). It seems reasonable to expect that
personnel will learn new terminology (P30), return with new ideas (P3) and new
skills that prove particularly advantageous to the project (P3). Training also
enhances morale and informs staff that their organisation is making an
investment in them (P3). However, it is unrealistic to expect people to change
simply as a result of completing training courses (P30). In this respect, there are
other factors that are required to bring about changes in people’s behaviours,
such as effective communication and spending one-on-one time with people
(P30).
4.4.2.13 Effective post implementation support
Most of the participants that took part in the research stated that their
organisations provided post implementation support for the systems they
develop. In most cases this support was provided from “day one after go-live”
(P13). It is therefore not too surprising that, even though support is “after the
fact” (P29) in terms of a project’s end date, it can be considered as a success
factor. Indeed, a measure of project success can be the level of support
required after deployment. As one participant observed, “Support is the easiest,
dullest job in the world if the project has been a success” (P19).
Although there were exceptions, most suppliers did not have support
departments per se. And, although this cannot practicably be a matter of choice
for very small companies, even the larger suppliers chose to utilise the
developers who had worked on the original project to handle support matters.

Chapter 4. 20 success factors for OISD projects
168
Indeed, as one participant pointed out, providing continuity from development to
support in this manner is “a bit of a selling point to our customers” (P13). But the
main reason that the original development teams also provide support is that
they are the people who “know what [they] are talking about” (P29) and hence
can provide the best possible service. The problem, of course, is that when
development staff are redeployed to new projects, the burden of supporting
previous projects can become problematic. As one participant stated, “If you’ve
got a massive support issue in the middle of your project, it can blow a big hole
in it” (P14).
As such, the issue of support requires some forward thinking at the start of a
project (P13). For organisations that have support departments (or service
management teams), this means having them involved from the very start of the
project (P7). For those that don’t, the question of, “How do we support those
systems?” still remains (P13). In other words, how will the development staff
actually provide support while delivering new projects? Clearly, this whole issue
can be alleviated (to a certain extent) by minimising the burden of support. In
this respect maintainable (P17) and intuitive (P27) software can assist, as does
properly trained end users (discussed above) and the provision of fit for purpose
end user documentation (P27).
4.4.2.14 Effective lessons learning
It is perhaps appropriate that the final process related success factor covered
by this section is that of lessons learning. Clearly, no one likes getting burnt
when things go wrong (P17), but unfortunately, even on the best projects,
mistakes occasionally (if not regularly) get made. Or, as one participant
emphasised, “Things will go wrong” (P8). It might therefore seem a matter of
common sense that organisations would learn from prior mistakes and
endeavour to ensure that they are not repeated on future projects. In other
words, both supplier and client organisations need to ask, “What do we need to
do differently?” (P8). Unfortunately, this is not as simple as it might seem (P30,
P31).

Chapter 4. 20 success factors for OISD projects
169
For those working on smaller projects, learning lessons does not seem to
present too much of a problem (P17). As one participant explained, “I’ve made
mistakes in the past and I’m learning by my mistakes” (P9). However, for larger
organisations working on larger projects, the learning process can be more
difficult. In some cases this is simply because organisations do not revisit the
reasons why previous projects fail (P31). This is made worse by a lack of
understanding of prospective projects and leads to the repetition of mistakes
and errors (P31). In other cases, the reason is due to a lack of continuity of
personnel between projects (P31). For example, as organisations change or, as
projects teams are dispersed and allocated to new assignments: “The project’s
long gone and the people have changed, so a lot of the lessons learned ... are
learned by the wrong people” (P31). Finally, the reason why some organisations
fail to learn from previous experience is because their culture prevents them
from being open and honest and therefore unable to discuss what went wrong
and publicise the findings (P31).
Although the interviews did not identify many solutions to remedy this situation,
it would seem that effective governance (P31) or quality frameworks (P17) are
beneficial. More so, an appropriate organisational culture is very important
(P31) and, at a personal level, project based performance appraisals may well
assist (P8).
4.4.3 Artefact related success factors
Given that OISD projects consume, utilise, make reference to and produce a
wide range of artefacts, it was somewhat surprising to find that the interviewees
identified only two artefact related success factors. That said, an examination of
the factors presented in the previous section does show that process based
success factors are intertwined with numerous artefacts; for example, the
project plan, risk registers, requirements documents, etc., all of which might be
considered as sub factors for OISD project success. However, this section is
restricted to the discussion of only two success factors: (1) a fit for purpose
project governance model and (2) fit for purpose technology.

Chapter 4. 20 success factors for OISD projects
170
4.4.3.1 A fit for purpose project governance model
The interview participants were of the opinion that OISD projects require some
type of framework or governance model (P4, P7, P11, P12, P14, P15, P17,
P19, P20, P24, P26, P31, P33). For small projects this might simply be the
preparation of a comprehensive proposal (that forms the basis for all
subsequent activities) and informal adherence to some basic ground rules
(P20); for example, holding regular progress meetings with the client (P5).
Indeed, participants from smaller organisations saw little need for any type of
formal governance, citing it as an unnecessary and unaffordable overhead: “I
cannot afford to implement them” (P5). However, for larger projects, a more
formal structure or governance model is usually required (P4, P7, P19). In fact,
participants from larger organisations reported benefits from the introduction of
governance models as their businesses grew and they undertook larger
projects. As one said, “Governance wise ... we’re generally much, much more
successful than we were” (P7). In general, for larger projects, formal project
governance can be completely invaluable and essential for success (P7).
As a rule, proper project governance (P24) needs to be set up, or laid out, at the
beginning of the project (P19, P22, P24, P31). It also needs to be acceptable to
and understood by those involved in the project (P22). Broadly speaking, its
purpose is to provide a structure or framework for the project to follow in terms
of its overall management and execution i.e. “how we’re going to run the
project” (P22), depending on the size of the company and the way in which the
company operates (P22). Clearly then, for large, complex projects, a
governance model might itself be extremely large in terms of the breadth and
depth of processes (and supporting roles and responsibilities) that it defines.
A key tenet of effective governance is that it should be appropriate to the needs
of the supplier and client organisations and the projects being delivered. In this
respect, the interviews did not provide any examples of companies that had fully
adopted “heavy weight” (P11) governance models such as PRINCE2. As one
participant said, “You don’t need all the ... controls and frequency of meetings
and the documentation regime that goes along with PRINCE2” (P11). In fact,

Chapter 4. 20 success factors for OISD projects
171
the full adoption of heavy weight governance structures was even considered
by some to be a failure factor; to the extent that sometimes “PRINCE2 kills
projects” (P4).
On the other hand, “things such as PRINCE2 [can] help” (P25). Thus, there are
instances where suppliers have gained PRINCE2 accreditation in order to
attract or gain new business (P5, P26). Indeed, there are “certain factors of
PRINCE2 that are essential to delivery of a successful project” (P11). However,
the companies that have introduced formal governance models have tended to
develop more light weight approaches (P7, P14). In many cases, these variant
approaches can be described as “PRINCE alike” i.e. based loosely on
PRINCE2 (P4), but employing only a subset of the elements of PRINCE2 (P11,
P14). As one participant stated, “We stick kind of loosely to PRINCE2 ... but we
don’t stick rigidly to the methodology – we just employ some of the practices”
(P14). Some aspects of project governance can even be carried out on a less
formal basis; for example, informal project reviews (P7). In this way supplier
organisations are able to provide sensible levels of PRINCE2 governance (P25)
while making sure that they do not “spend too much time following process and
not enough time doing work” (P17).
As described above, a governance model can define a large number of
processes in varying degrees of detail. Typically (according to the participants)
these will include the way in which a project will be documented (P4, P11, P22),
the change management process (P20, P22), the frequency and nature of
meetings (P5, P10, P14, P19, P20, P22), sign-off procedures (P11), risk and
issue management (P14, P15, P20, P25, P26), escalation procedures (P7, P15,
P20), progress reporting (P4, P13, P14, P15, P19, P20, P26), dependency
management (P15, P20), the use of check points (P10, P19, P25), and roles
and responsibilities (for example, the project board, technical authorities, etc.)
(P4, P7, P11, P19, P20, P24). In this respect it would seem that a fit for purpose
project governance model has the potential to make an important contribution to
the effectiveness of many of the process described in the previous section.
Chapter 4. 20 success factors for OISD projects
172
Unfortunately, the application of effective project governance is not as
widespread as it might be (P31). In some cases this is because client
organisations simply do not understand or appreciate the need for effective
governance (P20). In others it is due to the wrong people being involved in the
governance process (P20). For example, “They choose people that have got
spare time – not the right people – the good people are busy” (P31). It may also
be that those involved do not dedicate sufficient time. For example, “The project
sponsor doesn’t spend enough time on the project” (P31). Another concern is
that governance models can constitute a collection of “fantastic looking
artefacts” that do not actually add any value to the project (P20). Simply put, for
effective governance, “It’s not what you use – it’s how you use it” (P20).
Similarly, project governance “is only good ... if it’s actually used” (P26).
4.4.3.2 Fit for purpose technology
The technology i.e. hardware and software, used to deliver OISD projects was
cited as a success/failure factor by a number of the interview participants: “The
IT side itself can cause a problem” (P28). That said, it was also acknowledged
by a few of participants that technology in itself is almost irrelevant (P5, P19).
For example, the choice of development language can be immaterial (as long
as it is fit for purpose). As one developer stated, “I don't think I'm any worse a
programmer for using one language over the other” (P5). In fact, in many cases
there is little difference between development languages (P5). Perhaps, more
importantly, client organisations tend to have little interest in technical
considerations, as long as they work (P28).
In terms of software, the development process requires the use of “the right
tools for the job” (P24) i.e. integrated development environments, automated
testing tools, etc. In addition, tools for other project management processes (i.e.
project planning, support call tracking, etc.), are also required. In general, it
would seem that these kind of tools have improved (P5) over the past years and
are now considered more mature (P8). However, on occasions, there are still
problems; for example, compiler bugs and inadequate documentation (P1).
And, as tools usually require financial outlay, organisations are sometimes

Chapter 4. 20 success factors for OISD projects
173
tempted to lower costs by reducing their investment in such software, by
purchasing cheaper (but often inferior) alternatives (P31) or with fewer licences
(P24). Of course, the downside of this is that project teams are then required to
work harder whilst performing the same activities (P24).
Participants also cited problems regarding the use of third party software
products as part of the overall solution. In this respect software defects can be
an issue; for instance, an application in which VAT was incorrectly calculated
(P4). Or, as another participant explained, in relation to new releases of
packaged software, “Sometimes you get one step forward and two steps back”
due to software defects (P9). It was also suggested that some off-the-shelf
products are not as flexible or simple to configure as they might be (P31) hence
leading to problems during deployment. Similarly, at an operating system level,
configuration issues can be a problem. As one participant had found, “There's
no two PCs on the planet that are configured in the same way” (P28). A similar
argument applies to different flavours of operating system and the interaction
(or integration) with other software products. Difficulties therefore arise in
ensuring that the software deliverable will perform adequately in an environment
over which the project team have little or no control (P32).
Hardware was also a concern, particularly where a project's end deliverable is
intended to run on an existing IT infrastructure (P28) or, perhaps, that procured
at the client’s discretion. For monetary reasons some client organisations
decide to make do with existing but inadequate hardware (P9). In other cases,
hardware is procured to the absolute minimum specification hence providing no
opportunity for dealing with increased levels of system usage (P29). For these
reasons, hardware performance can become an issue (P28). Hence, specifying
fit for purpose hardware at the start of the project can be considered an
important aspect of OISD project success (P29).
Finally, the project’s deliverable (the information system) was identified as a
success factor by 25 of the interview participants. Clearly, any information
system needs to be fit for purpose but, as the participants showed, this is a
function of a wide range of characteristics. The software should be based on

Chapter 4. 20 success factors for OISD projects
174
stable (P31) and mature (P8, P31) technology. It should be free from defects
(P2, P18) and software hacks (P32). The software should also be maintainable
(P2, P8, P14, P17, P32), reliable (P17, P21) and extensible (P8, P17, P21, P27,
P32). And, from the end users’ perspective, usability (ease of use) was the most
cited characteristic (P5, P15, P17, P18, P28, P29). Yet, usability can be
achieved using relatively straight forward measures. Ensuring that the software
is familiar to end users helps (P17, P27) as does spending time on the
software’s graphical user interface (GUI) (P6, P18, P19, P27, P28). Indeed,
paying attention to the software’s GUI can even have a positive effect on client
buy-in to the project (P19, P28).
4.4.4 Actor related success factors
As it is people who deliver projects (P8), it came as no surprise that the
interview participants identified a number of specific actors (and groups of
actors) as success factors for OISD projects; for example, the requirements
analyst, the project board, the end user community, etc. However, three actors
received substantially more coverage than all the others. These were (1) the
project team, (2) the project manager and (3) the client organisation. This
section presents each of these actors as OISD project success factors in terms
of their effectiveness. A fourth actor related success factor is also discussed:
effective client involvement. This factor could have been amalgamated into the
discussion of the client organisation. However, the attention afforded to this
factor by the interview participants was such that it was deemed a success
factor in its own right.
4.4.4.1 Effectiveness of the project team
P3 declared that “a project is a huge team effort.” In this respect, the effort
expended by a supplier organisation to develop an IS solution is, for the main
part, provided by the project team i.e. it is the project team that does the work.
On very small projects, this team could be a single individual (probably with
responsibility for other roles such as project management). However, for larger
projects, dedicated teams of people are required to develop and deploy the
solution. As such, it is important that not only the individual team members, but

Chapter 4. 20 success factors for OISD projects
175
the project team as a whole, have the appropriate attributes and competences.
As on participant stated, “If you don’t have a competent team ... then you’re not
going to be successful” (P8).
Clearly, individual project team members need to have the appropriate technical
skills required for development and deployment (P3, P19, P26). Therefore,
project teams require a variety of individuals (P3, P19); for example,
requirements analysts, developers, testers, trainers, etc., each with skills that
match the requirements of the project. In other words, “the right people
delivering the right types of work” (P13). There are also advantages of having
multi-skilled team members (P3, P19), so that (ideally) any individual should be
able to carry out any task (P19). For example, “We would typically expect a
[requirements] analyst ... to deal with specifying test plans and managing a test
phase” (P19). Indeed, having team members with a broad range of skills tends
to make the project team more agile (flexible) in that the team can respond
quickly to situations as they arise (P19). Moreover, project team members in
contemporary OISD projects require a good mix of industry/business/domain
and application knowledge as opposed to just having technical competences
(P9, P12, P13, P16, P17, P24). For example, a project team member should
already have a background in a particular industry sector (P13). This helps
them to understand the client’s domain (P16), “put themselves in the position of
the person who’s doing the job” (P28) and think from the users’ perspective
(P18). Not only does this aid communication between the supplier and the client
(P13) but it also provides the potential to add business value to the client
organisation (P6). This is an expectation that seems to have increased over the
past decade or so (P6).
The interviews identified numerous personal characteristics that make for good
project team members. These include being experienced (P8, P13, P18, P19,
P21, P26, P32, P33), knowledgeable (P12, P16) and competent (P16, P25,
P26, P33). They need to be enthusiastic (P11, P17), self motivated (P17) and
genuinely interested in what they do (P17). Being confident (P18, P33),
conscientious (P3) and honest (P8) are also favourable attributes. On the other
hand, it is wholly inappropriate for an individual to have become a developer

Chapter 4. 20 success factors for OISD projects
176
simply because “there was money in it” (P18). Project team members also need
to have degrees of energy (P8), commitment (P8, P12, P20) and “willingness to
invest the time and work on obstacles as they start to appear” (P8). As such,
they need to be prepared to work additional hours as and when required (P3,
P18, P19). The desire to work closely with other people (P14) rather than “trying
to outdo one another“ (P18) is also important i.e. being a good team player (P3,
P6, P10, P18, P21, P28, P32). Similarly, individuals with personal agendas can
be detrimental to project team effectiveness (P3). Project team members also
need to be prepared to take responsibility for various tasks (P3); for example, if
a temporary team leader is required, one of the project team members will be
prepared do this (P3). From an organisational perspective, individuals also need
to be empowered to make decisions to make the system work (P4) i.e. the
project team “can make decisions – and the business will back them” (P6). And
perhaps, above all, project team members must have a willingness to succeed
(P3, P8). All that said, the identification of personal characteristics (akin to those
described above) is not necessarily sufficient. As one participant explained,
“Some people just seem to be capable of delivering successful projects” despite
having “similar attributes, capabilities [and] experience” to others who are less
capable (P33). That said, the interview participants described five overall team
characteristics that have a significant influence on the success of the project as
a whole. These are (1) gelling of the team, (2) co-location of the team, (3)
balanced experience, (4) problem solving capability and (5) dedicated
resources. All of these are discussed below.
Characteristic 1: gelling of the team
The first characteristic is based on the concept of “how well you gel as a team”
(P8). As noted above, project team members need to be willing to work together
(P3). They also need to be comfortable with one another (P18), be able to
communicate with each other (P18) and be supportive of each other (P8), rather
than working as a group of individuals (P3). In other words, teamwork is
extremely important (P3). To achieve this, project team members need to think
beyond their own activities (P6). This involves understanding the bigger picture
and also what other team members are doing (P13, P14). It also requires

Chapter 4. 20 success factors for OISD projects
177
effective leadership, communication and honesty (P8), as well as clear roles
and responsibilities (P8). The gelling process can also be facilitated by investing
time together as a team (P8), thus providing an opportunity to understand the
different dynamics of the individuals in project team (P8). This allows team
members to understand what their peers consider important in the project, how
they want to be treated and how they want others to behave (P8). Attaining this
type of understanding can be easier if the project team members have
previously worked together (P8). Cultural consistency, as opposed to language
barriers and totally different working methods (P24), is also necessary for a
project team to gel effectively. This, to a certain extent, explains why some of
the participants disapproved of employing an offshore model for software
development in an OISD project.
Characteristic 2: co-location of the team
The second characteristic of an effective project team is that the team members
will be located close to one another i.e. they will have physical proximity (co-
location) (P10, P13, P19, P21). Amongst other things, this alleviates barriers in
communication between project team members. This allows them to
communicate with one another in a manner that is both quick and easy (P19). It
also enhances the visibility of problems and promotes discussion and
cooperation (P10). In turn, this can lead to better decision making (P1). Being
physically close to the customer is also important (P19, P20, P22, P25, P30) as
it makes it easier for the project team to engage with the client (P20) and
enhances information flow (P25). Thus, the supplier-client partnership is
enhanced (P30). This helps explain why some suppliers find it invaluable to
have teams co-located with their client side project teams and ends users (and
vice versa). For example, being on site to develop “a piece of software
surrounded by the people who will use it” (P19).
Characteristic 3: balanced experience
Effective project teams need to be balanced in terms of their team members’
experience levels (P13). Ideally, a project team will comprise sufficiently
experienced individuals (P8, P11, P13, P21, P24, P25, P26, P27, P29, P32).

Chapter 4. 20 success factors for OISD projects
178
However, this rarely happens (P24) as many supplier organisations employ staff
with varying degrees of experience (and ability). Hence, employees can range
from seasoned professionals to relatively young people who have recently
graduated from university (P1, P32). As a consequence, project teams can
comprise of individuals with varying levels of experience (P1, P24). Clearly, the
danger here is that the “experienced people ... might be outnumbered by the
inexperienced people” (P26) thus diminishing the team’s productive capability
and contributing to project failure.
Characteristic 4: problem solving capability
Effective project teams also tend to be good at dealing with problems (P4, P6,
P18, P21, P25). Given that OISD projects encounter a multitude of issues,
individual project team members need to be “able to identify ... problems” (P6)
early, communicate these problems to those concerned (P14, P18) and be
willing to ask for help in solving problems when they get stuck (P6, P13, P18).
Similarly, team members also need to be willing and able to provide assistance
to their peers as and when problems arise (P6).
Characteristic 5: dedicated resources
Finally, the project team, as a resource, “should be dedicated to the project”
(P3) as opposed to sharing team members with other projects (P3) or “switching
and changing people on a project from one minute to the next” (P13). Similarly,
if client-side project team members are “doing their normal day to day job as
well as having to do project tasks than that ... makes it more difficult” (P12).
In conclusion, OISD projects need effective project teams to be successful.
Therefore having a project team with the appropriate characteristics and
competences is paramount. As one participant stated, “If you’ve got the right
people with the right mindset and attitude and everything like that, then a project
will succeed, whatever you throw at it” (P3).

Chapter 4. 20 success factors for OISD projects
179
4.4.4.2 Effectiveness of the project manager
All OISD projects require some degree of project management. For projects of
any significant size, the incumbent organisations (supplier and client side) each
require an effective project manager with the appropriate characteristics and
competences. Indeed, a number of participants considered the project
manager’s role to be a factor for project success (P3, P4, P10, P16, P19). As
one suggested, “No project manager, no successful project” (P4).
One of the reasons for this is that projects cannot usually be managed by
committee (P16). In such cases collective responsibility tends to blur project
priorities resulting in a lack of real progress. Therefore, the majority of projects
need a designated individual (per organisation) who has “the ultimate
responsibility for seeing that [the] project actually works” (P16); preferably on a
full time basis (P2, P4), as opposed to being “a bolt on to another role” (P2).
Clearly, being such a key role, the characteristics of the individual assigned to
this task can have a significant influence on the success (or otherwise) of the
project.
However, before discussing these characteristics, it is worth remembering that
project managers (and other project staff) do not operate in a vacuum. In this
respect, their effectiveness is largely limited by the culture of their own
organisations (supplier and client). For example, the project manager needs to
be sufficiently empowered to manage the project (P4) and be provided with
support from senior management when appropriate. It is also important that
supplier and client organisations define what “a good project manager is” (P22),
so that the project manager understands the ways in which they are expected to
operate. The supplier organisation should also ensure that their project
manager is a good cultural fit with the client organisation (P10) so that they can
“[get] on very, very well with [the client’s] people.” As one participant stated,
“You can’t underplay the value that good cultural fit and personality fit can have”
(P7). Finally, the supplier organisation should be prepared to spend money to
recruit and invest in individuals with the appropriate project management skills
(P2, P31). However, this was found to be a rather contentious issue in one

Chapter 4. 20 success factors for OISD projects
180
supplier organisation in which certain senior managers considered their project
management staff to be of lesser value that the technically oriented staff.
The interviews identified various personality traits that make for an effective
project manager. These include being well organised (P2, P6, P17, P18),
approachable (P2, P15, P17), flexible (P10, P16), understanding (P2, P10),
sociable (P15), and credible (P19). Additionally, they should be able to accept
responsibility (P15, P19) but in no way should be egotistical (P15). They also
need to be “cool under fire” and be able to “take the heat” when things get
difficult (P4). Similarly, they need to be comfortable in any environment where
change is a common factor (P4). They should expect things to change and
problems to arise (P4). Being proactive by nature with regard to potential
problems is also important (P8, P10, P15), as is the ability to “divorce your
emotions from the reality of something that’s happened” (P8). In addition,
project managers need to have good interpersonal skills. As one participant
pointed out, “A good project manager with bad interpersonal skills is not a good
project manager” (P4). Project managers may also be required to have the
courage and confidence to stand their ground (P3, P10, P30) when dealing with
more senior stakeholders; for example, to reject unrealistic demands, to secure
additional resources, or even to deliver bad news. Finally, a project manager
should not be overly technical. Although they need to have a technical
understanding (P3), the ability to perform technical tasks tends to “take them
away from their [project management] job” (P3). As one participant remarked, “If
they do that, who’s looking at the project plan?” (P3).
Clearly, there are a number of text book project management competences that
a project manager needs to possess (P19). These include being able to prepare
and manage a project plan (P16, P25), manage budgets (P3, P25), etc.
However, project managers also need a range of softer skills (P15). For
example, they need to know how to treat people and how to manage them
(P31); potentially difficult tasks given that various stakeholder groups may have
different cultures and backgrounds. They also need to be able to communicate
effectively (P2, P6, P15, P19, P24, P31) at all levels of the organisation (P31)
i.e. from the project board to the end user community. To do so they have to be
Chapter 4. 20 success factors for OISD projects
181
able to make use of appropriate language and be able to translate technical
matters into a business perspective (and vice versa). They also need to have a
thorough understanding of the project’s environment (P2, P4, P10, P19) which,
for larger, more dynamic projects, can be very difficult to do (given the scale
and complexity of some organisations) (P4). In general, it is perhaps these type
of skills that really make for an effective project manager.
The interviewees also suggested that a key part of the project manager’s role is
the ability to build and maintain relationships (P3, P16); hence the need for
good interpersonal skills. In larger projects there can be a number of such
relationships, depending on the number of stakeholder groups (for example,
with the project board, end users, other suppliers, etc.). However, a number of
participants noted that the relationship between the project manager and the
project team is of prime importance (P3, P16, P19). In essence, it is the project
team that performs the work and therefore “has to have somebody to basically
manage it” (P16). Hence, it is imperative that the project manager devotes time
and effort to developing and maintaining this relationship. In addition, the
interviewees suggested that the relationship with the client (in particular the
project board) was also significant (P3, P4). For example, the relationship
should be such that the project manager can stand up to the client to acquire
extra resources (P3, P4, P30) or to arbitrate with the client if they are being
difficult or unreasonable (P8).
Achieving this requires a range of activities, some of which seem to be relatively
straight forward; for example, working with the project team (P14, P18) to
ensure that they have a solid understanding of the project plan (P10). In a
broader context project managers need “to be in there with [the team]” (P3), not
just “sat in [their] little corner office” (P3). This involves understanding their team
(P18) and being genuinely interested (P15) in what they do. It also involves
providing appropriate support (P18) and ensuring that obstacles to progress are
dealt with in a quick and timely manner (P15). Similarly, project managers need
to inspire, motivate and mentor their teams (P4, P15, P19), making sure that
“they’re not stuck on something – they’re not struggling” (P18) and enabling
them to move forward and work together (P3). The consequences of these

Chapter 4. 20 success factors for OISD projects
182
actions seem to be two-fold. In the first instance, the actions inform the project
team that they can rely on their project manager. Secondly, the actions tend to
enhance the credibility of the project manager and earn the respect of the
project team.
In summary, the role of project manager demands a special type of individual
armed with a wide range of characteristics and skills. Given the influence that a
project manager can exert on the success (or otherwise) of a project, there may
actually be some truth in the suggestion that good project managers really are
“worth their weight in gold” (P10).
4.4.4.3 Effectiveness of the client organisation
The third key stakeholder group identified by the interviews is that of the client
(or customer) as an organisation. Not surprisingly, the effectiveness of the client
organisation can influence the success or failure of an OISD project. In this
respect, it would seem imperative that suppliers have a sound understanding of
client characteristics and their possible effects.
One attribute of an effective client is that they have a very good idea of what
they are trying to achieve (P6). They should also be able to articulate their
objectives, as opposed to being unclear about what it is they want (P2). That
said, it is also important that clients are not too adamant (or arrogant) regarding
their expectations (P23, P25) i.e. they “aren’t too fixed in their attitudes” (P6), as
dictating requirements might not necessarily reflect the best possible solution
(P6, P9). Thus, clients should be open to advice from supplier organisations (as
opposed to dictating to suppliers) to ensure that the project is as successful as
possible (P9). As on participant stated, when describing a failed project, “The
customer was one of these people who ... would not listen to advice from
anyone” (P23).
It is also important that client organisations have an understanding, or better
still, experience of OISD projects and the way in which they have to be
managed. At a basic level, it helps if the client understands some of the
difficulties of software development (P32) and the complexities of what the

Chapter 4. 20 success factors for OISD projects
183
supplier organisation is doing (P25). More so, it is important that the client
organisation understands the importance of sound project management
practices and the need for appropriate project governance. (P20).
There are many aspects of OISD projects that need to be carried out by the
client organisation. Therefore, the ability of the client to get engaged, involved
and get things done represents a key characteristic (P6, P11, P12). However,
the effectiveness of a client to carry out tasks in a project environment can vary
considerably depending on the culture of the organisation. At one end of the
scale, some client organisations have a very proactive culture or “we can do
this” attitude (P12). As one participant explained, “Ask them to do something
and they’ll do it right away” (P12). However, at the other end of the scale, other
organisations can be far less responsive. For example, with some clients,
requests for information are simply denied (P12). Clearly, this kind of “we won’t
do what we’re asked to ... we’ll do less” (P12) attitude can have a significantly
detrimental effect of project success.
Client organisations also need to have the desire to be successful and hence
demonstrate sufficient commitment, ownership and buy-in for their projects (P4,
P10, P11, P13, P15, P21). Somewhat surprisingly, this is not always the case.
In extreme cases, some client organisations seem to find it acceptable to “chuck
millions of pounds down the drain” (P20) when it comes to OISD projects. In
fact, in these organisations, there is almost an acceptance of failure. As one
participant commented, “They just don’t seem to have this mindset of failure
being unacceptable” and are quite prepared to move from one failed project to
another (P20).
The political nature of the client organisation can influence project success (P2,
P3, P13). The view of a number of participants was that personal politics,
perhaps fuelled by a lack of commitment and buy-in, contributes to the
probability of a project failing. Again, it is easy to see how individuals with their
own personal agendas can cause significant infighting (P3, P12) and thus
detract from working towards a common project goal (P3).
Chapter 4. 20 success factors for OISD projects
184
Client organisations exhibiting high levels of instability or change can also be
problematic (P20). In general, destabilising influences distract client
organisations from concentrating their efforts on the project. Although there are
a large number of such influences; for example, threats of takeover, cost cutting
initiatives, redundancies, business expansion, etc., a number of participants
cited staff turnover as a common problem (P20, P27, P29). As one said, “I’ve
got one customer whose staff are constantly turning over” (P27). Again, the loss
of staff can have a significant effect in terms of delays, increased costs, etc.
(P29). Conversely, the best projects are those staffed by client personnel who
have been with the organisation for long periods of time (P12).
The size, complexity and structure of the client organisation can also be
important (P10, P20). Some larger organisations have very hierarchical
management structures (P19) comprising “layers and layers and layers of
people” (P20) that make it difficult to determine how the client actually operates.
In extreme cases, it can even make things difficult for client-side staff; for
instance, “managers on their side who don’t know how to do things in their
organisation” (P20). Hence, even the simplest tasks become slow and difficult.
These structures can also make it hard to determine who to talk to and make it
almost impossible to gain access to the essential client side staff, thus having a
significant impact on communication (P20).
Certain client characteristics can even be considered to be dynamic over the
course of the project. For example, system ownership should increase during
the project depending on the degree of client buy-in (P15). A similar argument
applies to user confidence. However, user confidence i.e. the confidence of end
users to utilise the system (P11), comes about due to effective user training and
user acceptance testing (P11).
Client characteristics can therefore have a major influence on the success of a
project. It is important that supplier organisations have a comprehensive
understanding of these characteristics to identify potential risks before they
become real issues.
Chapter 4. 20 success factors for OISD projects
185
4.4.4.3 Effective client involvement
In addition to the characteristics described in the previous section, the client
organisation needs to be actively involved in the project. As such, a number of
participants considered the client’s involvement (or participation) in a project to
be a success factor (P4, P9, P11, P14, P16, P28). As one participant remarked,
“To be successful ... we need to have the right number or the right range of
people from their side of the project” (P14). Yet, although it almost seems like
common sense that client organisations will put the necessary time and effort
into their projects (P15), this is not always the case (P9, P11, P14, P16). As one
participant stated, “A significant factor [is] that the key [client] resources that the
project needs aren’t allocated to it” (P15).
The root of this problem seems to be that some client organisations have “no
idea of how much involvement and how much work they’re going to have to do”
in a project (P12). In fact, some customers are more than willing to “sit back and
watch the supplier deliver” (P11) without realising that there are various
deliverables that can only be provided by themselves (P6). Consequently, it is
crucial that the client be provided with a full understanding of the tasks that
have been allocated to them (P11) at the earliest opportunity (P12). Moreover,
customers need to be fully aware that the time and effort required can be
substantial. For example, a rule of thumb used by one participant suggests that
client involvement is normally between seven and ten times that of the supplier
(P4).
One of the reasons why clients need to be heavily involved in OISD projects is
that there is a range of tasks that cannot be carried out without customer
resources. To name but a few, these include the initial system selection (P4),
decision making (P20, P24), specification of requirements (P11, P12, P20),
document sign-off (P6, P14), end user training (P4, P9, P12), data setup (P4,
P6, P16) and user acceptance testing (P12, P13). There are also tasks that
should not be left to the supplier organisation, particularly if this can detract from
the client’s ownership of the project (P4). In particular, the client needs to own
and actively manage the project from its own perspective (P4, P15), as opposed

Chapter 4. 20 success factors for OISD projects
186
to leaving the overall project management to the supplier. In other words, “This
nonsense that some [clients] have ... of letting the supplier drive [the project]”
(P4). A similar argument applies to organisational processes such as business
transformation and change management (P8, P20, P23) which, from an
ownership perspective, cannot realistically be undertaken by suppliers.
However, clients can find it difficult to provide appropriate resources in a timely
manner. In general this is because businesses have “competing priorities ... in
that everyone’s got other tasks to do that are out with the project” (P4). In other
words, client staff have other priorities and day jobs to support their
organisation’s “business as usual” activities (P4, P8, P11, P12, P14, P19, P31).
As a result, it can be very difficult to secure people’s time in organisations (P31)
and many OISD projects experience resource conflicts as the client staff find it
hard to do “their normal day to day job as well as having to do project tasks”
(P12).
The impacts of these conflicts tend to manifest themselves in a number of ways.
The first is that the calibre of the individuals assigned to the project is often
inadequate (P2). Not surprisingly, this tends to delay project progress (P6, P19,
P28). Similarly, client staff are sometimes not authorised or empowered to carry
out their tasks. In other cases, the amount of resource can be inadequate
and/or provided at the wrong time (P9).
The interviews also revealed a number of stakeholder groups whose
involvement can be considered both critical and problematic. The first of these
is executive management, usually in the form of the project board (or steering
committee) (P31). The project board is essential to the project by providing
leadership and strong messages of support (P8). However, as project board
members tend to be very senior and very busy (P20), they can find it difficult to
devote the time that is necessary to actively engage in the running of projects
(P31). In extreme cases, senior management have even been known to “float
off never to be seen again for 18 months” (P20) after the initial project meetings
have been concluded (P28).

Chapter 4. 20 success factors for OISD projects
187
Suppliers also need access to client side domain experts (P12, P20, P28) i.e.
“the resource within the [client] company who’s going to provide [the supplier]
with the domain knowledge” (P15). However, in some cases “the person who is
allocated is the guy who’s got time as opposed to the real technical expert”
(P15). This tends to result in misinformed decisions (P24) as the client side staff
do not understand (1) what they are trying to do and also (2) the consequences
of their decision making (P24). Similarly, suppliers’ questions are sometimes
incorrectly answered by client personnel who are not qualified to answer them
(P1).
Several participants also considered the client’s IT department to be particularly
problematic (especially, it would seem, on smaller projects). In general, the
main concern was the lack of support from the IT department (P23). As a simple
example, one participant stated, “It’s really hard, in a big company, to get
anything special done to a PC” (P28), adding that some client IT departments
are “really, really inflexible and quite often desperately slow” (P28). On a more
worrying note, another participant considered the actions of some IT
departments to be quite malicious (P23), underpinned by a mixture of
incompetence, laziness and snobbery (P23). In short, there are occasions when
attempting to get the client’s IT department to carry out a particular task seems
almost impossible (P28).
Finally, there seems to be merit in having a client side facilitator in OISD
projects. That is “someone who can knock down barriers and cut through the
bureaucracy” (P20) and maybe even break a few rules in order to get things
done (P20). As one participant explained, “We were given one guy who ...
sorted everything out – anything you asked for – sorted” (P20). Clearly, this type
of client support can be extremely beneficial to the success of an OISD project.
Indeed, the interviews provided some evidence that support from lower levels of
the client organisation has supplanted the more traditional executive
management support cited as a key success factor in earlier studies by other
researchers.

Chapter 4. 20 success factors for OISD projects
188
4.5 Discussion
The primary contribution provided by this chapter is the 20 OISD project
success factors presented in the previous section. By focussing on Scottish
suppliers, the listing represents the first study to examine OISD project success
factors from a UK supplier’s perspective. The qualitative descriptions provided
for each factor also differentiate the listing from much of the prior research in
the field. Indeed, there are only two comparable studies that concentrate
exclusively on the supplier’s perspective. In the first, Moynihan (1996) provides
a series of OISD project risk constructs for supplier organisations in Ireland. In
the second, Taylor (2007) examines key risks identified by IT supplier
organisations in Hong Kong. Although both studies identify a series of sub-
factors, neither provides much descriptive information for the key risk factors
they identify.
The descriptions provided in this chapter clearly show that each success factor
contains a number of more detailed success factors. For example, effective
requirements management requires effective requirements definition, effective
change control and effective communication. Its reliance on the latter shows
that requirements management and communication are not mutually exclusive.
Requirements management is also affected by the client organisation’s
expectations, end user involvement and the business analysts’ experience.
Indeed, the descriptions contain many other causal relationships. For example,
inadequate requirements are often the cause of problems during a project’s
testing phase. Poorly stated requirements can also lead to a project deliverable
that does not reflect what the client organisation needs. Moreover, the
descriptions show that these relationships can form causal chains. For example,
organisational politics can lead to scope creep which, in turn, can lead to
rework. Consequently, rework adversely affects both project timescales and
budgets thus affecting project success. In other words, organisational politics
does not influence project success directly. Instead, its influence is propagated
through a causal chain comprised of other factors.

Chapter 4. 20 success factors for OISD projects
189
Extrapolating these examples from requirements management to the other
success factors listed above suggests that there may be large number of
detailed success factors, each with the potential to influence each other and
combine to form causal chains that influence project success. Indeed, there is
even evidence from the participants’ definitions of project success that causal
relationships apply to success criteria. For example, client satisfaction
influences repeat business from the client and affects the long term supplier-
client relationships.
Clearly then, there is merit in investigating OISD project success at a detailed
level, not least because this has not been addressed by prior research. This
would provide practitioners and researchers with a better understanding of (1)
the number of detailed success factors (and success criteria) that might be
involved, (2) the relationships that exist between them, (3) the causal chains by
which individual success factors might propagate their influence to affect project
success, and (4) the key factors and relationships involved in the propagation
process.
4.6 Conclusion
This chapter has utilised the experiences of 33 IT professionals to discuss OISD
projects from a Scottish suppliers’ perspective. In particular, 20 success factors
for OISD projects were identified and described. Various definitions of OISD
project success were also presented.
The IT professionals defined project success using a variety of success criteria.
Their responses correspond to a definition commonly used in the literature. The
success criteria were presented in relation to (1) project management success
and (2) organisational success. The success criteria for project management
success are consistent with those provided in the literature i.e. schedule, budget
and requirements adherence. The same can be said for the organisational
success criteria i.e. client satisfaction and organisational benefit (client-side).
However, the participants’ responses clearly differentiated between the client
and supplier organisation, thus adding an additional dimension to organisational
success. From the supplier’s perspective, additional success criteria

Chapter 4. 20 success factors for OISD projects
190
encompassed commercial aspects of the project (profitability and revenues
received) and other benefits such as personal enjoyment and organisational
improvements.
The main part of the chapter presented 20 success factors for OISD projects
from a Scottish suppliers’ perspective; the first time that this research area has
been examined. The qualitative descriptions provided for each factor serve to
enhance understanding in this area. However, the descriptions also show that,
underneath the 20 factors, there exists a large number of more detailed success
factors, each with the possibility of influencing other factors and combining to
form causal chains to indirectly influence project success. There would certainly
seem to be merit in investigating these detailed factors and the relationships
that might exist between them.
This investigation is presented in the next chapter. It takes the form of a
relationship analysis which seeks to provide a better understanding of success
factors, at a detailed level, and the relationships between them.

Chapter 5. Relationship analysis of OISD project success factors
191
5. Relationship analysis of OISD
project success factors
5.1 Introduction
This chapter presents the findings of a relationship analysis of OISD project
success factors. The objective of the analysis was to provide a better
understanding of success factors at a detailed level and the relationships
between them. In particular:
(1) The causal chains by which success factors might propagate their
influence to affect project success;
(2) The number of success factors, success criteria and relationships that
might be involved;
(3) The relationships that exist between them;
(4) The key factors and relationships involved in the propagation process.
This chapter is structured as follows. First of all, a number of relationship
concepts are introduced. The nomenclature employed by this chapter is also
presented. An overview of the analysis process follows. Next, the relationship
data set and the active relationship network are discussed. The main part of the
chapter presents the findings of the analysis:
(1) Active causal chains identified by the analysis;
(2) Causal loops identified by the analysis;
(3) Factor receptivity and range;
(4) Activity levels for success factors and criteria.
A number of special cases are then described. Prior to the chapter’s conclusion,
a discussion of the chapter’s findings is provided.
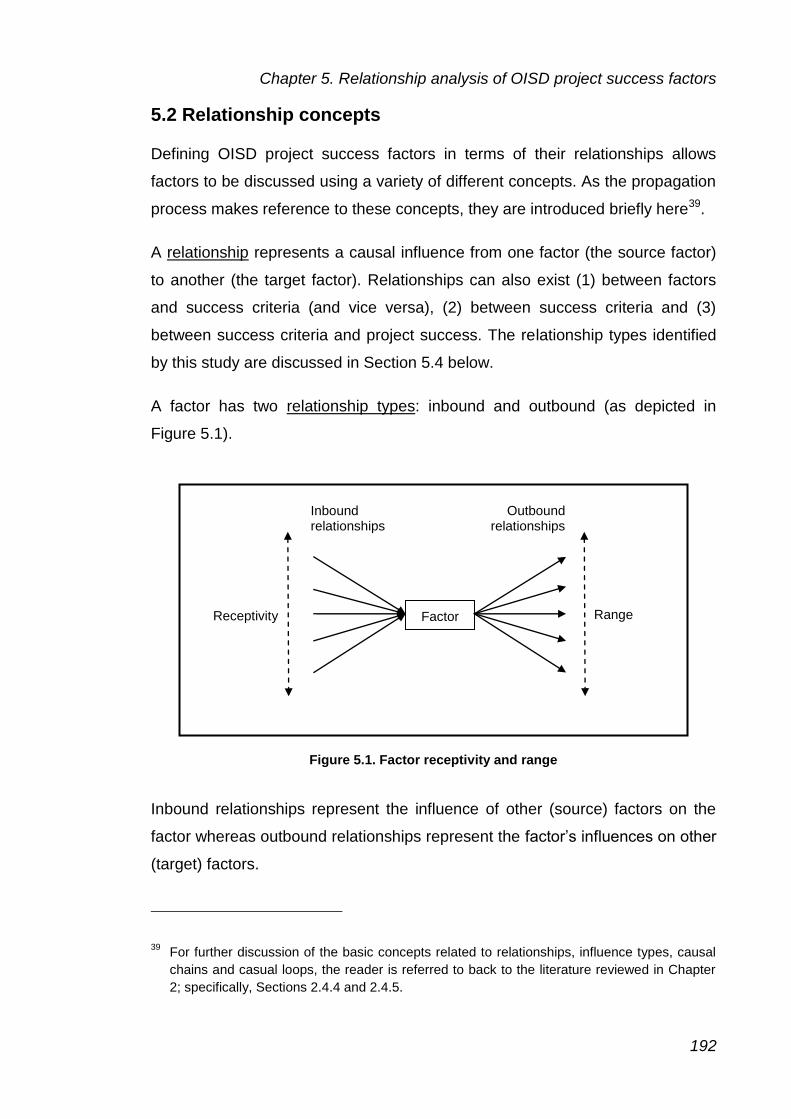
Chapter 5. Relationship analysis of OISD project success factors
192
5.2 Relationship concepts
Defining OISD project success factors in terms of their relationships allows
factors to be discussed using a variety of different concepts. As the propagation
process makes reference to these concepts, they are introduced briefly here39.
A relationship represents a causal influence from one factor (the source factor)
to another (the target factor). Relationships can also exist (1) between factors
and success criteria (and vice versa), (2) between success criteria and (3)
between success criteria and project success. The relationship types identified
by this study are discussed in Section 5.4 below.
A factor has two relationship types: inbound and outbound (as depicted in
Figure 5.1).
Figure 5.1. Factor receptivity and range
Inbound relationships represent the influence of other (source) factors on the
factor whereas outbound relationships represent the factor’s influences on other
(target) factors.
39 For further discussion of the basic concepts related to relationships, influence types, causal
chains and casual loops, the reader is referred to back to the literature reviewed in Chapter
2; specifically, Sections 2.4.4 and 2.4.5.
Inbound relationships
Factor Receptivity Range
Outbound relationships

Chapter 5. Relationship analysis of OISD project success factors
193
Factors that are influenced by other (source) factors are described as being
receptive i.e. they are receptive to the influence of other factors. A factor’s
receptivity40 (or receptiveness) is determined by the number of inbound
relationships that it has. A factor with no inbound relationships i.e. zero
receptivity, is referred to as a root factor.
Factors that influence other (target) factors are described as having a range41. A
factor’s range is determined by the number of outbound relationships that it has.
A factor with zero range is referred to as being impotent.
Relationships have two influence types: (1) those having a positive effect on the
target (or receiving) factor (or criterion), and (2) those having a negative effect.
In quantitative terms, positive influences contribute to (cause an increase in) the
target factor whilst negative influences detract from (result in a decrease). For
example, the fitness for purpose of the project’s business case can be
considered to have a positive influence on the client organisation’s buy-in for
the project. In other words, the better the business case (in terms of it fitness for
purpose), the more buy-in from the client organisation can be expected.
However, the client organisation’s buy-in can be considered to have a negative
effect on the client organisation’s resistance to change (associated with the
project). Put another way, the higher the client organisation’s buy-in, the less
likely it is that the client organisation will resist the changes associated with the
project (and vice versa).
A causal chain (or path) represents a sequence of relationships by which a
base factor (root or receptive) propagates its influence through a series of
receptive factors. A factor may have multiple causal chains.
40 Also referred to as in-degree centrality in network theory (Wang, Mo, Fahui, & Fengjun,
2011, p. 714).
41 Also referred to as out-degree centrality in network theory (Wang, Mo, Fahui, & Fengjun,
2011, p. 714).

Chapter 5. Relationship analysis of OISD project success factors
194
Some causal chains affect project success whilst others do not. Chains that
affect project success are referred to as being active (those that do not are
considered to be inactive or impotent). A base factor may have multiple active
chains (and multiple inactive chains). The factors (base and receptive) and
relationships in an active causal chain are also considered to be active because
they are actively involved in propagating the base factor’s influence to affect
project success. An example of an active causal chain, containing a base factor
and four receptive factors, is depicted schematically in Figure 5.2.
Figure 5.2. Schematic of an active causal chain
5.3 Causal diagram nomenclature
This chapter presents a number of casual chain examples in diagrammatic form
(refer to Figure 5.3 for an example). In these diagrams, success (and failure)
factors and success criteria are represented thus:
type-id:entity:characteristic
in which the type-id represents one of the project entity types listed in Table
5.1.
Base factor
Project success Receptive factors

Chapter 5. Relationship analysis of OISD project success factors
195
Type Id Description
act Actor
art Artefact
cri Criterion
ext Externality
pro Process
suc Success
Table 5.1. Project entity types
The project entity types listed in Table 5.1 are the same as those identified in
Chapter 2 to classify success factors (refer to Table 2.2) with the exception of
criterion and success. The criterion entity type has been added to classify the
success criteria data types identified in the relationship data set (described in
Section 5.4). The success entity type has been added to represent project
success.
Relationships between factors are represented as
-p->
for positive influences and
-n->
for negative influences.
The following abbreviations are also used (refer to Table 5.2):
Abbreviation Term
c-o Client organisation
s-o Supplier organisation
p- Project
Table 5.2. Abbreviations used in causal diagrams
This nomenclature allows factors (and criteria) and their causal chains to be
depicted diagrammatically as shown by the example presented in Figure 5.3.

Chapter 5. Relationship analysis of OISD project success factors
196
ext:labour-market:available-skills
-p->
act:s-o\p-manager:calibre
-p->
art:p-plan:fitness-for-purpose
-n->
pro:software-development:duration
-n->
cri:project:adherence\schedule
-p->
suc:project:success
Figure 5.3. Example of a causal chain diagram
In Figure 5.3, the available skills in the labour market have a positive influence
on the calibre of the project manager (supplier-side). In other words, an
increase in the available skills in the labour market should lead to the
recruitment of higher calibre project managers (and vice-versa). The calibre of
the project manager is also depicted as having a positive influence on the
fitness for purpose of the project plan. This means that higher calibre project
managers can be expected to produce higher quality project plans than lower
calibre project managers (and vice versa). Next, the fitness for purpose of the
project plan has a negative influence on the duration of the software
development process (i.e. causes it to decrease). Again, this means that higher
quality project plans (measured by their fitness for purpose) should result in
shorter software developments (and vice versa). In turn, the duration of the
software development has a negative influence on the project’s schedule
adherence42; in other words, the longer the software development, the worse
the project’s schedule adherence (and vice versa). Finally, the project’s
schedule adherence is a positive indicator of project success; or, put another
way, the better a project adheres to its schedule, the more successful it will be
(and vice versa). Hence, by virtue of its causal chain, the available skills in the
42 Note that, in this example, the two negative influences serve to cancel each other out, thus
determining that the casual chain has a positive influence on project success. As a rule, an
even number of negative influences denotes a positive chain, whereas a negative number
denotes a negative chain.

Chapter 5. Relationship analysis of OISD project success factors
197
labour market has a positive influence on project success; that is, the better the
available skills in the labour market, the more likely it is that the project will be
successful.
The nomenclature described above is also used to present factors (and criteria)
in the chapter’s tables.
5.4 Overview of the analysis process
The relationship analysis process is described in detail in Chapter 3 (see p.
112) and is summarised again here to support the discussion presented in the
remainder of this chapter. The objective of the analysis process was to provide
a better understanding of success factors, at a detailed level, and the
relationships between them. In particular:
(1) The causal chains by which success factors might propagate their
influence to affect project success;
(2) The number of success factors, success criteria and relationships that
might be involved;
(3) The relationships that exist between them;
(4) The key factors and relationships involved in the propagation process.
The analysis process had three steps:
(1) Construction of the relationship data set (coding)
Following the qualitative data analysis discussed in the previous chapter,
the interview transcripts were reviewed again to identify success factors,
success criteria and the relationships between them (for example, from
one factor to another, from one factor to a criterion, etc.). In so doing,
success factors and success criteria were coded as characteristics of
entities. Collectively, these relationships (and their factors, criteria and
project success) are referred to as the relationship data set.
Chapter 5. Relationship analysis of OISD project success factors
198
(2) Factor propagation
The relationship data set was then constructed into a relationship
network and analysed to identify the causal chains by which success
factors propagated their influence to affect project success. Due to the
size of the relationship data set, a small software application was
developed to perform the propagation process. In essence, the
propagation software was used to identify causal chains and estimate the
activity of the factors and relationships involved in the propagation
process.
(3) Analysis of the propagation software’s output files
The propagation software produced a selection of output files (described
in Appendix 3.5). The files provided descriptions of the causal chains and
various statistics relating to the propagation process (for example, factor
activity levels, causal chain lengths, etc.). The contents of the files were
analysed to produce the findings presented in this chapter.
5.5 Relationship data set
As discussed above, the interview transcripts were analysed to identify success
factors, success criteria and the relationships between them. In all, the analysis
revealed 1,988 success (and failure) factors. Several definitions of project
success, in the form of various success criteria, were also found. Consequently,
all instances of success factors, success criteria and the term “project success”
were coded in the form of entities and characteristics. Coding examples for
these data types are presented in Table 5.3.

Chapter 5. Relationship analysis of OISD project success factors
199
Data type Entity type Entity Characteristic
Success factor Actor Project manager Competence
Artefact Requirements Stability
Externality Legislation Introduction of
Process Project planning Effectiveness
Success criterion Criterion Budget Adherence
Criterion End users Satisfaction
Project success Success Project Success
Table 5.3. Entity-characteristic coding examples by data type
Analysis of the interview transcripts revealed numerous relationships which,
collectively, formed the relationship data set. The majority of these relationships
were between success factors i.e. from a source factor to a target factor.
Relationships between success factors and success criteria were also found.
For the main part, these relationships were from source factors to target criteria.
However, the transcripts were also found to contain a number of (1) criteria to
factor relationships i.e. from a source criteria to a target factor, and (2) criteria to
criteria relationships i.e. from a source criteria to a target criteria. As several
definitions of project success, in the form of various success criteria, were also
provided during the interviews, relationships between these criteria and project
success were also defined. These relationships were considered valid based on
the premise that success criteria are indicators of project success. However, as
the concept of a success factor directly influencing project success has been
shown to be somewhat of a misnomer (see p. 63), all such relationships were
considered erroneous and hence disregarded. Finally, a limited number of
relationships in which project success influenced various success factors were
also found. These were also excluded from the initial relationship data set as
these relationships lie outwith the normal OISD project lifecycle i.e. project
success constitutes the project’s intended outcome. However, the relationships
between project success and various success factors were analysed as a
special case as part of the overall analysis process (discussed further in Section
5.8.3).

Chapter 5. Relationship analysis of OISD project success factors
200
All of the valid relationship types discussed above are depicted in Figure 5.4. As
the diagram shows, these relationships allow success factors to interact with
one another and hence form causal chains that influence project success via
one or more success criteria. As discussed above, causal chains that influence
project success are referred to as active chains. Conversely, causal chains that
do not influence project success are referred to as being inactive (for example,
the causal chain that originates at Factor A and terminates at Factor B in Figure
5.4).
Figure 5.4. Examples of relationships between data types
Relationships were also found to have two influence types: (1) those having a
positive effect of the target (or receptive) factor (or criteria), and (2) those
having a negative effect (as defined above).
All relationships derived from the interview transcripts were combined into the
relationship data set with the exception of two special cases: (1) relationships
emanating from project success (as discussed earlier) and (2) relationships
relating to project interventions (as project interventions do not form part of a
Success factors Success criteria Project success
Factor B
Factor A
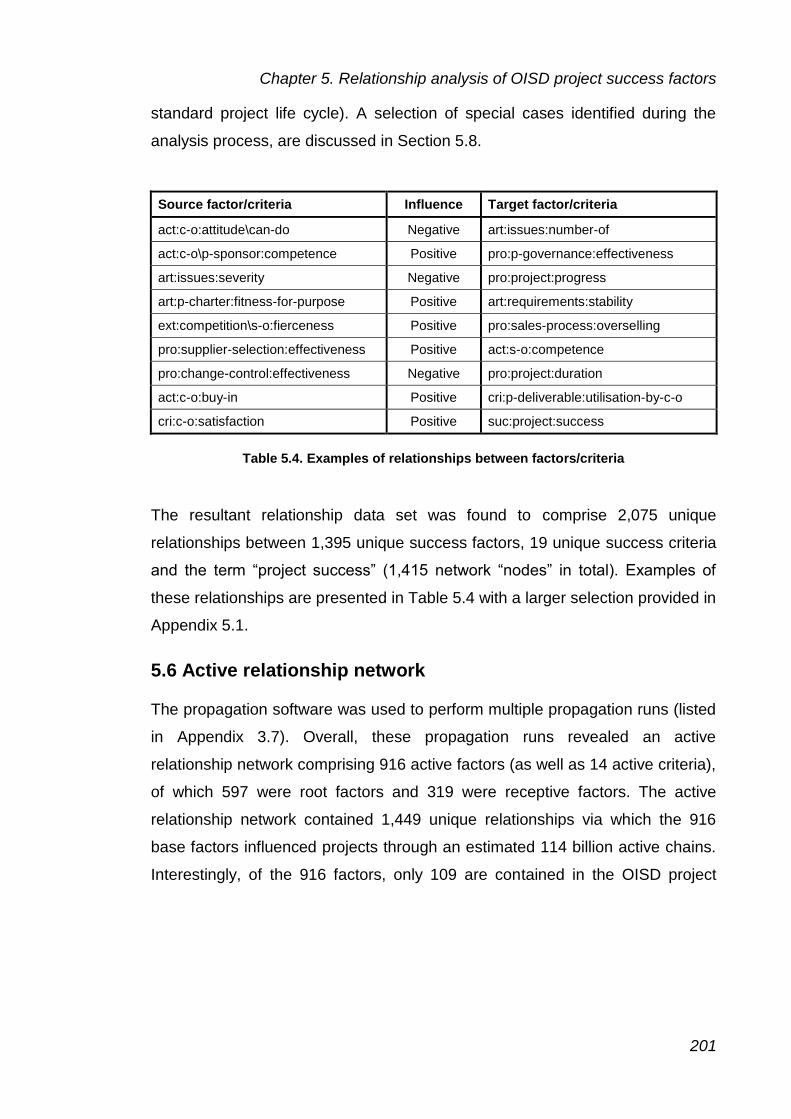
Chapter 5. Relationship analysis of OISD project success factors
201
standard project life cycle). A selection of special cases identified during the
analysis process, are discussed in Section 5.8.
Source factor/criteria Influence Target factor/criteria
act:c-o:attitude\can-do Negative art:issues:number-of
act:c-o\p-sponsor:competence Positive pro:p-governance:effectiveness
art:issues:severity Negative pro:project:progress
art:p-charter:fitness-for-purpose Positive art:requirements:stability
ext:competition\s-o:fierceness Positive pro:sales-process:overselling
pro:supplier-selection:effectiveness Positive act:s-o:competence
pro:change-control:effectiveness Negative pro:project:duration
act:c-o:buy-in Positive cri:p-deliverable:utilisation-by-c-o
cri:c-o:satisfaction Positive suc:project:success
Table 5.4. Examples of relationships between factors/criteria
The resultant relationship data set was found to comprise 2,075 unique
relationships between 1,395 unique success factors, 19 unique success criteria
and the term “project success” (1,415 network “nodes” in total). Examples of
these relationships are presented in Table 5.4 with a larger selection provided in
Appendix 5.1.
5.6 Active relationship network
The propagation software was used to perform multiple propagation runs (listed
in Appendix 3.7). Overall, these propagation runs revealed an active
relationship network comprising 916 active factors (as well as 14 active criteria),
of which 597 were root factors and 319 were receptive factors. The active
relationship network contained 1,449 unique relationships via which the 916
base factors influenced projects through an estimated 114 billion active chains.
Interestingly, of the 916 factors, only 109 are contained in the OISD project

Chapter 5. Relationship analysis of OISD project success factors
202
success factor literature43, thus revealing 807 “new” success factors44. These
“new” factors are listed in Appendix 5.2 and discussed further in Chapter 6.
Data set/network Factors/criteria Relationships
Relationship data set 1,414 2,075
Active relationship network 930 1,449
Table 5.5. Factor/criteria counts for the relationship data set and active relationship network
As Table 5.5 shows, the active relationship network contains fewer
factors/criteria and relationships than the relationship data set. This is because
the active relationship network contains only active relationships and
factors/criteria. Conversely, the relationship data set contains factors/criteria
and relationships that play no part in influencing project success i.e. they are
only contained in inactive casual chains that terminate at inactive/impotent
factors/criteria. Indeed, the relationship data set was found to contain 626
inactive relationships and 484 inactive/impotent factors/criteria. In other words,
approximately 30% of the relationship data set was found to be
inactive/redundant.
43 Based on the results of the success factor analysis performed as part of the literature review.
44 This figure might be slightly overstated due to difficulties encountered while comparing the
two sets of success factors identified by (1) the success factor analysis (prior research) and
(2) those identified by the network analysis (this research). The two factor sets cannot be
considered “like for like” due to the different perspectives they contain i.e. the perspective
contained in prior literature is predominantly that of the client (or “in-house”) organisation
whereas this research project addresses the perspective of the supplier organisation and
clearly differentiates between success factors for client and supplier organisations; which the
majority of prior research does not. To address this problem, the success factors identified
by prior research were extended to reflect both organisations. However, by modifying the
results of the success factor analysis a degree of distortion may have been introduced to the
comparison process.

Chapter 5. Relationship analysis of OISD project success factors
203
5.7 Findings
Having described the active relationship network, this section presents the
findings of the analysis. The findings are presented in four sections: (1) linear
causal chains, (2) causal loops, (3) factor receptivity and range, and (4) activity
levels for success factors and criteria.
5.7.1 Linear causal chains
The vast majority of the causal chains in the active relationship network were
linear (as opposed to causal loops, discussed below). The linear causal chains,
of which there were an estimated 114 billion, propagated the influence of a base
factor through one or more receptive factors/criteria to affect project success. In
some cases, these chains were very short; the shortest being only two
relationships in length and containing a base factor and a single success
criterion only. For example, slippages in the software development process
propagated their influence through a single success criterion (schedule
adherence) to influence project success (as depicted in Figure 5.5).
pro:software-development:slippages
-n->
cri:project:adherence\schedule
-p->
suc:project:success
Figure 5.5. Causal chain example: software development slippages
However, instances of factors influencing project success via causal chains
containing only two relationships (such as that depicted in Figure 5.5) were very
much in the minority. Indeed, only 90 factors (8%) influence project success in
this manner. The remaining 840 factors (92%) influence project success via
active causal chains which, on average, are significantly longer than those
described above i.e. 35 relationships/factors/criteria in length (weighted
average). A selection of active causal chain examples are depicted in Appendix
5.3.

Chapter 5. Relationship analysis of OISD project success factors
204
pro:p-start-up:effectiveness
-p->
act:c-o:understanding\project
-n->
art:issues:number-of
-p->
pro:project:cost
-n->
cri:project:adherence\budget
-p->
suc:project:success
Figure 5.6. Causal chain example: Project start-up effectiveness (I)
Consider, for example, how an effective project start-up might affect project
success. In Figure 5.6, an effective project start-up increases the client
organisation’s understanding of the project. This reduces the number of issues
in the project which, in turn, lowers the project’s cost. The lower the project’s
cost, the better the budget adherence. Finally, good budget adherence is an
positive indicator of project success. Thus, by propagating its influence through
the causal chain, an effective project start-up has a positive influence on project
success.
However, the propagation process also showed that an effective project start-up
influences project success as shown in Figure 5.7.
pro:p-start-up:effectiveness
-p->
pro:p-governance:effectiveness
-p->
pro:change-control:effectiveness
-n->
art:requirements:scope-creep
-p->
pro:software-development:slippages
-n->
cri:project:adherence\schedule
-p->
suc:project:success
Figure 5.7. Causal chain example: Project start-up effectiveness (II)

Chapter 5. Relationship analysis of OISD project success factors
205
In Figure 5.7, an effective project start-up also has a positive influence on
project success. However, it does so by way of a completely different causal
chain. Indeed, the propagation process showed that an effective project start-up
has a set of 467 million active causal chains. Each chain is unique, linear and,
since an effective project start-up is considered to be a success factor, usually
has a positive influence on project success. However, as a few receptive factors
can act as both success and failure factors, this is not always the case. This
apparent anomaly is discussed in Section 5.8.1.
An effective project start-up’s chains also differ in terms of the entities, factors
and relationships that they contain. In total, the chains comprise 49 unique
entities, 157 unique factors and 383 unique relationships. The chains also vary
significantly in length. Some, like those shown above (see Figures 5.6 and 5.7),
are relatively short, whereas others are considerably longer (see Figure 5.8 for
an example). On average (mean), effective project start-up chains are 35
relationships/factors in length with the longest containing 57 relationships.
The attributes described above for an effective project start-up also apply to all
other success factors. Each factor influences project success using a set of
linear causal chains. On average (mean) each factor has 122 million active
causal chains. Again, each chain is unique, linear and should influence project
success in manner that is commensurate with the factor being a success or
failure factor respectively. In other words, success factors have a positive
influence on project success whereas failure factors have a negative effect.
However, as discussed above, there are exceptions to this rule (as discussed in
Section 5.8.1 below)
Causal chains also differ in terms of the entities, factors and relationships that
they contain. On average (weighted), causal chains comprise 44 unique
entities, 147 unique factors and 359 unique relationships. The chains also vary
in length. On average (weighted), casual chains are 35 relationships in length,
with the longest containing 59 relationships. Causal chain statistics (akin to
those described here) for 40 randomly selected base factors are provided in
Appendix 5.4.

Chapter 5. Relationship analysis of OISD project success factors
206
[pro:p-start-up:effectiveness]
-p->
[act:c-o:understanding\project]
-n->
[art:issues:number-of]
-n->
[act:s-o\p-manager:control-of-project]
-p->
[pro:requirements-management:effectiveness]
-p->
[art:requirements:fitness-for-purpose]
-p->
[art:business-case:fitness-for-purpose]
-p->
[act:c-o:willingness-to-provide-funding]
-p->
[art:p-budget:fitness-for-purpose]
-p->
[act:s-o\p-team:staffing-level]
-n->
[act:s-o\p-team:management-of\ease-of]
-n->
[act:s-o\p-manager:workload]
-n->
[act:s-o\p-manager:ability\to-manage-project]
-n->
[act:c-o:politics]
-n->
[act:s-o\p-team:work-environment]
-p->
[act:s-o\p-team:teamwork]
-p->
[act:s-o\p-team:productivity]
-n->
[pro:software-development:duration]
-p->
[pro:project:duration]
-n->
[act:c-o:buy-in]
-n->
[act:c-o:resistance-to-change]
-n->
[cri:p-deliverable:utilisation-by-c-o]
-p->
[cri:project:benefit\to-c-o]
-p->
[cri:c-o:satisfaction]
-p->
[act:c-o:willingness-to-pay-for-project]
-p->
[cri:project:profitability\to-s-o]
-p->
[suc:project:success]
Figure 5.8. Causal chain example: Project start-up effectiveness (III)

Chapter 5. Relationship analysis of OISD project success factors
207
5.7.2 Causal loops
Thus far, the discussion has been limited to linear causal chains. However, the
active relationship network was also found to contain a large number of causal
loops (refer to Appendix 5.5 for a selection of examples). As their name
suggests, these causal loops comprise loops of relationships through which the
propagation process has the potential to persist ad infinitum (refer to Figure
5.9).
Figure 5.9. Schematic of four interacting causal loops
(causal loop influences travel in an anti-clockwise direction)
Consider, for example, how the number of (project) issues can form a causal
loop. The causal chain shown in Figure 5.10 forms a causal loop simply
because it “begins” and “ends” with the same factor i.e. the chain “loops” around
the number of issues. This means that whenever there is a change in any of the
factors contained in the loop, the effect of the change can be continually
Linear chains Causal loops (A, B, C & D)
Success factors Success criteria Project success
A
D
C
B

Chapter 5. Relationship analysis of OISD project success factors
208
propagated through the loop, affecting all of the factors in the loop (including
itself) as it does so.
art:issues:number-of
-n->
act:s-o\p-manager:control-of-project
-p->
pro:requirements-management:effectiveness
-p->
art:requirements:fitness-for-purpose
-p->
art:specifications\software-design:fitness-for-purpose
-p->
art:estimates:fitness-for-purpose
-p->
art:p-plan:fitness-for-purpose
-p->
act:s-o:resource-availability
-n->
pro:project:duration
-p->
act:s-o:staff-turnover
-n->
act:s-o\p-team:staffing-level
-p->
art:p-due-date:realism
-n->
art:issues:number-of
Figure 5.10. Causal loop example: Number of (project) issues
Individual factors can be contained in a large number of causal loops. For
example, the project’s duration, in its own right, was found in over two million
causal loops. Similarly, the effectiveness of end users’ training was found in 1.6
million loops. Indeed, the average (mean) number of casual loops for 20
randomly selected base factors (listed in Appendix 5.6) was found to be 1.14
million per factor. However, the estimated total number of unique causal loops
in the active relationship network is only 2.94 million; a smaller number than
might have been expected, due to the commonality of loops between factors.
In all, 105 (11%) of all factors in the network were found to appear in causal
loops. Also, 45 (90%) of the 50 most active factors were contained in one or
more causal loops. The analysis also found that these loops are not short i.e.
each had an average (weighted) length of 31 relationships/factors, with the

Chapter 5. Relationship analysis of OISD project success factors
209
longest causal chain detected having a length of 50 relationships/factors. This
suggests that causal loops might play a major part in the way that success
factors influence project success.
Factor
Number of causal loops
Other factors in loop
a
rt:r
equ
irem
ents
:fitness-f
or-
purp
ose
p
ro:p
roje
ct:dura
tio
n
a
rt:issues:n
um
ber-
of
a
ct:c-o
:unders
tand
ing
\what-
they-w
ant
p
ro:c
hang
e-c
ontr
ol:eff
ectiveness
art:requirements:fitness-for-purpose 1,785,370 - 96% 89% 14% 11%
pro:project:duration 2,002,974 - 88% 14% 13%
art:issues:number-of 1,956,959 - 13% 14%
act:c-o:understanding\what-they-want 605,486 - 8%
pro:change-control:effectiveness 717,146 -
Table 5.6. Causal loop interaction levels between the five most active factors
The way in which this occurs is further complicated because many of the causal
loops were found to interact with each other. Consider, for example, the five
most active factors listed in Table 5.6. The table shows that causal loops might
contain one or more of these factors. For example, the requirements’ fitness for
purpose appears in 1,785,370 causal loops, 96% and 89% of which also
contain the project’s duration and the number of (project) issues respectively. In
addition, the client’s understanding of what they want and the effectiveness of
the change control process also appear in 14% and 11% of the causal loops in
which the requirements’ fitness for purpose can be found. Further analysis of
the active relationship network showed that each of the five factors appear in
multiple, interacting loops, many of which also contained one or more of the
other four factors. In other words, there is a high level of interaction between

Chapter 5. Relationship analysis of OISD project success factors
210
these factors in causal loops, all of which is likely to affect the propagation
processes through the linear chains in which the factors can be found.
Expanding this scenario to encompass the other 100 factors that appear in
causal loops suggests that, not only do these loops play a major part in the way
that the success factors influence project success, but the way in which this is
achieved might be described as a highly complex phenomenon.
5.7.3 Activity levels
The propagation software estimates activity levels for factors, criteria and
relationships based on their involvement in each active causal chain45. This
allows the software to establish the most active factors, criteria and
relationships in the relationship network. Useful information can also be
obtained by aggregating activity levels in terms of entity types, project types and
individual entities. This section discusses activity levels for of each of the topics
mentioned above.
5.7.3.1 Factor activity levels
The analysis showed that certain factors were more active than others in the
active relationship network (linear chains only). For example the requirements’
fitness for purpose was found to be more than twice as active as the project
deliverable’s fitness for purpose (refer to Table 5.7).
45 Linear chains only, not causal loops.

Chapter 5. Relationship analysis of OISD project success factors
211
Rank Factor
Relative
activity
level
1 art:requirements:fitness-for-purpose 100
2 pro:project:duration 80
3 art:issues:number-of 73
4 act:c-o:understanding\what-they-want 60
5 pro:change-control:effectiveness 59
6 pro:training\c-o\end-users:effectiveness 54
7 art:requirements:scope-creep 54
8 pro:communication-with-c-o:effectiveness 53
9 art:p-deliverable:fitness-for-purpose 49
10 act:s-o:relationship-with-c-o 48
Table 5.7. The 10 most active factors in the active relationship network
(in which the relative activity levels are relative to the most active factor)
The analysis also showed that the bulk of the activity in the active relationship
network was restricted to a core of 133 receptive factors. On average (mean),
each of these factors were involved in the propagation of the influences of 674
unique base factors.
5.7.3.1 Criteria activity levels
The propagation process treats success criteria in exactly the same way as it
does success factors46. This allows the propagation software to estimate the
activity levels for individual success criteria. Table 5.8 shows the 12 most active
success criteria in the propagation process.
46 Except that success criteria are not (normally) allowed to act as base factors in causal
chains.

Chapter 5. Relationship analysis of OISD project success factors
212
Rank Success criteria
Relative
activity
level
1 cri:c-o:satisfaction 100
2 cri:project:benefit\to-c-o 63
3 cri:project:adherence\requirements 63
4 cri:project:adherence\p-budget 53
5 cri:c-o:payment-from 49
6 cri:project:profitability\to-s-o 34
7 cri:c-o:repeat-business-from 33
8 cri:p-deliverable:utilisation-by-c-o\end-users 32
9 cri:c-o\p-board:satisfaction 31
10 cri:c-o\end-users:satisfaction 26
11 cri:project:adherence\schedule 26
12 cri:p-deliverable:utilisation-by-c-o 26
Table 5.8. The 12 most active success criteria in the active relationship network
(in which the relative activity levels are relative to the most active criterion)
Similar to the case for success factors, the criteria listed in Table 5.8 formed a
core of 12 success criteria to which the bulk of the activity in the active
relationship network was restricted. On average (mean), each of these criteria
were used as a success metric for 782 unique base factors. It was also found
that 671 base factors impacted all 12 criteria whilst the remaining 245 affected a
lesser number.
One reasonable interpretation of Table 5.8 is that the factors in the active
relationship network, when taken as a whole, have a greater effect on success
criteria with higher activity levels than those with lower levels. Thus, it can be
said that the factors representing supplier-based OISD projects are more
oriented towards client satisfaction than any other success criteria (see Table
5.8). Notably, providing client benefit also ranks highly (2nd) in the listing. And, it
is interesting to note that, although requirements and budget adherence appear
as ranked 3rd and 4th in Table 5.8, schedule adherence seems to be of lesser
significance (ranked 11th). Thus, it can be proposed that supplier-based OISD
projects are focussed more on (or are more biased towards) project success

Chapter 5. Relationship analysis of OISD project success factors
213
than they are on project management success. That said, as the highest
positioned, supplier-side criterion (payment from the client organisation) only
ranks 5th in Table 5.8, it would seem that client-side project success assumes a
greater significance than supplier-side project success.
5.7.3.3 Relationship activity levels
In comparison to the success factors and success criteria described in the
previous sections, the difference in relative activity levels for the most active
relationships was found to be relatively low. Thus, there is little value in
presenting the 10 or so most active relationships in the active relationship
network. However, the analysis did find that the bulk of relationship activity was
restricted to a core of 361 relationships, each of which were involved in the
propagation of influences for, on average (mean), 674 unique base factors.
Receptive element Number of Average (mean) base
factors involved
Success factors 133 675
Success criteria 12 782
Relationships 361 674
Table 5.9. Core success factors, success criteria and relationship statistics
In summary, the activity analysis has, up until this juncture, shown that
relationship network activity is dominated by a core set of receptive success
factors, success criteria and relationships (as shown in Table 5.9).
5.7.3.4 Aggregated activity levels
In addition to determining the activity levels for factors, criteria and
relationships, the analysis also produced a number of sets of aggregated
activity statistics.

Chapter 5. Relationship analysis of OISD project success factors
214
Project type
Base factor activity
Receptive factor
activity
OISD 5% 3%
IS/IT 5% 4%
Organisational technology 1% 0%
Organisational 13% 15%
Generic 77% 78%
Table 5.10. OISD project success factors activity levels by project type
The first of these sets provides the factor activity levels by project type (as
shown in Table 5.10). As Table 5.10 shows, base factor activity levels and
those for the receptive factors that propagate their influences to affect project
success are dominated by generic and, to a lesser extent, organisational
factors. Indeed, OISD and IS/IT factors play relatively small parts as base or
receptive factors.
Entity type
Base factor activity
Receptive factor
activity
Actor 61% 39%
Artefact 15% 31%
External 2% 0%
Process 22% 31%
Table 5.11. OISD project success factor activity levels by entity type
The analysis also determined the factor activity levels by entity type (as shown
in Table 5.11). As Table 5.11 shows, base factor activity is dominated by actor
type success factors. However, receptive factor activity is more balanced, with
slightly more emphasis placed on actors than artefacts and processes.
The activity levels for individual entities were also found to reflect entity type
levels discussed above. From Table 5.12, it can be seen that actors, artefacts
and processes all feature as the most active entities in the relationship network.

Chapter 5. Relationship analysis of OISD project success factors
215
That said, the six highest ranking positions are dominated by actors, with the
supplier-based project team assuming first position.
Rank Entity
Relative
activity
level
1 act:s-o\p-team 100
2 art:requirements 94
3 act:c-o 85
4 act:c-o\end-users 70
5 act:s-o\p-manager 48
6 act:s-o 30
7 pro:software-development 27
8 art:issues 27
9 art:p-deliverable 26
10 pro:training\c-o\end-users 23
Table 5.12. The 10 most active entities in the active relationship network (excludes the pro:project entity)
However, entity-based activity levels should be interpreted with a degree of
caution. Although they do identify the most active actors, artefacts and
processes, it should be remembered that entities are not success factors;
unless, that is, they are qualified with a valid characteristic. Instead, entities
should be considered as hosts for success factors (see p. 46). In other words,
although entity activity levels are, to a certain extent, informative (as discussed
above), it is the success factor activity levels that are important.
The final aggregated statistic set provided by the analysis was the most active
relationships between entities. Again, the analysis found that inter-entity activity
was dominated by a core set of 143 relationships between 43 entities. The 30
most active of these relationships are shown diagrammatically in Figure 5.11.

Chapter 5. Relationship analysis of OISD project success factors
216
Figure 5.11. The 30 most active entity relationships in the active relationship network
However, the information that can be gleaned from Figure 5.11 is somewhat
limited for two reasons. First, as Figure 5.11 is clearly incomplete, it contains
only a few “key” linear causal chains. Second, as previously discussed, entities
are not success factors and it is the relationships between success factors that
is important.
Actors Artefacts Criteria External Processes Key:
s-o\p-team p-charter
p-deliverable
software-development
c-o\end-users
training\c-o\end-users
s-o\p-manager
communication-with-c-o
estimates
c-o
issues
project
project success
requirements
project
p-deliverable
c-o
c-o\end-users
s-o
change-management
p-budget
change-control
software-testing

Chapter 5. Relationship analysis of OISD project success factors
217
5.7.4 Factor receptivity and range
In a casual chain (linear or loop), each receptive factor is (1) influenced by a
single factor (receptive or root) and (2) influences a single factor (receptive).
Thus, no account is made for factor receptivity and range (as defined above).
However, as the analysis showed, factors (and criteria) can (1) be influenced
by, and (2) can influence, large numbers of factors/criteria. In other words,
factors can potentially have high levels of receptivity and range.
On average (mean), active receptive factors were each receptive to 3.1 factors.
Similarly, active factors each had an average (mean) range of 2.2 factors.
Indeed, the analysis showed that there were reasonable correlations between a
factor’s activity level and its (1) active receptivity47 and (2) active range48. In
other words, factors with higher activity levels tended to have higher receptivity
and range levels than less active factors (as shown in Table 5.13).
Factor set Receptivity Range
Top 10 most active factors 32.2 9.5
Core active factors (133) 7.0 2.6
All receptive factors (319) 3.1 2.2
Convergence/divergence points/factors (98) 8.8 3.9
Table 5.13. Average (mean) receptivity and range values by factor set
The analysis revealed that factors varied significantly in terms of the receptivity
and range levels. For example, the number of project issues was found to be
receptive to a total of 78 active factors (compared with a factor average of 3.1;
refer to Table 5.13). Similarly, the requirements’ fitness for purpose was found
to influence (had a range of) 15 factors (compared with a factor average of 2.2;
refer to Table 5.13).
47 Pearson’s correlation coefficient = 0.67.
48 Pearson’s correlation coefficient = 0.67.
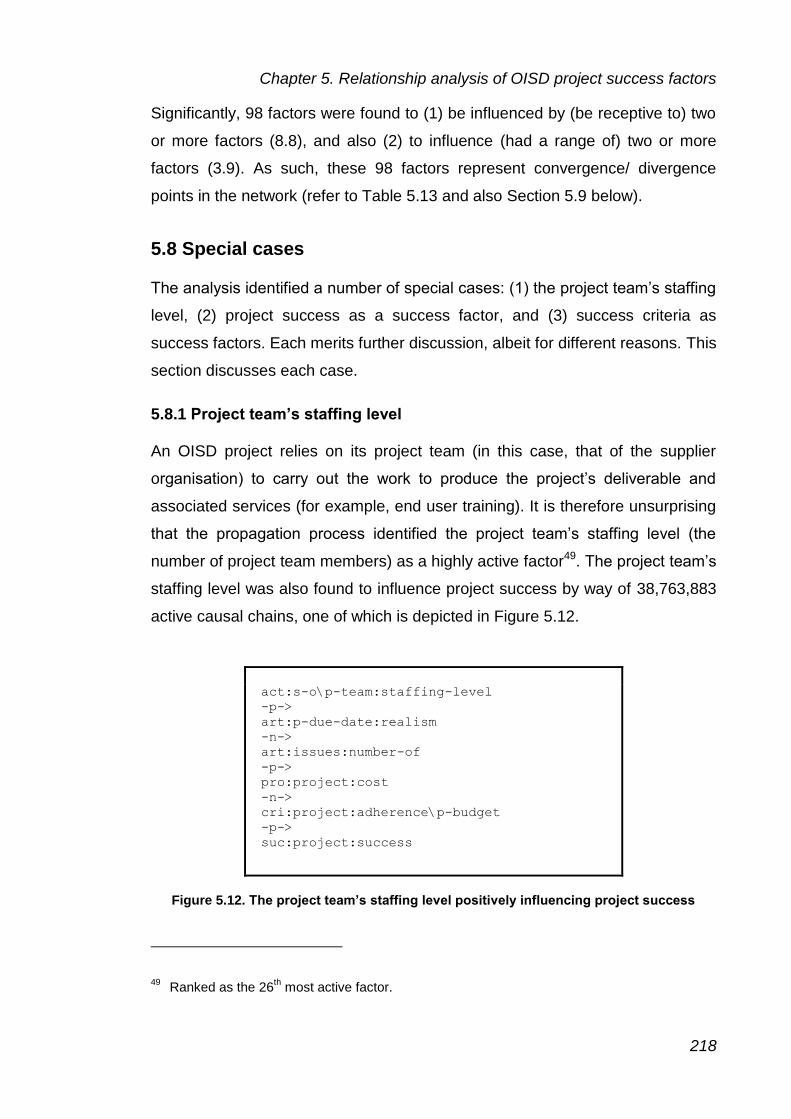
Chapter 5. Relationship analysis of OISD project success factors
218
Significantly, 98 factors were found to (1) be influenced by (be receptive to) two
or more factors (8.8), and also (2) to influence (had a range of) two or more
factors (3.9). As such, these 98 factors represent convergence/ divergence
points in the network (refer to Table 5.13 and also Section 5.9 below).
5.8 Special cases
The analysis identified a number of special cases: (1) the project team’s staffing
level, (2) project success as a success factor, and (3) success criteria as
success factors. Each merits further discussion, albeit for different reasons. This
section discusses each case.
5.8.1 Project team’s staffing level
An OISD project relies on its project team (in this case, that of the supplier
organisation) to carry out the work to produce the project’s deliverable and
associated services (for example, end user training). It is therefore unsurprising
that the propagation process identified the project team’s staffing level (the
number of project team members) as a highly active factor49. The project team’s
staffing level was also found to influence project success by way of 38,763,883
active causal chains, one of which is depicted in Figure 5.12.
act:s-o\p-team:staffing-level
-p->
art:p-due-date:realism
-n->
art:issues:number-of
-p->
pro:project:cost
-n->
cri:project:adherence\p-budget
-p->
suc:project:success
Figure 5.12. The project team’s staffing level positively influencing project success
49 Ranked as the 26
th most active factor.

Chapter 5. Relationship analysis of OISD project success factors
219
In Figure 5.12, the project team’s staffing level is shown to have a positive
influence on project success i.e. the project team needs to be adequately
staffed for the project to be successful. In other words, as the staffing level
increases, the more likely it is that the project will be successful. However,
these increases can also bring about some undesirable effects (refer to Figure
5.13).
In Figure 5.13, increasing the staffing level brings about problems with
communication i.e. larger project teams tend to be more problematic in terms of
internal (and, to a lesser extent, external) communication. Other issues include
less effective teamwork and the project team being more difficult to manage;
both of which are detrimental to project success. Thus, the project team’s
staffing level can also be seen to have a negative influence on project success.
act:s-o\p-team:staffing-level
-n->
pro:communication:effectiveness
-p->
pro:software-development:effectiveness
-p->
art:p-deliverable:fitness-for-purpose
-p->
cri:project:adherence\requirements
-p->
suc:project:success
Figure 5.13. The project team’s staffing level negatively influencing project success
This scenario is a form of Brook’s Law (see Brooks, 1975) which, in a very
simplified form, states that “adding manpower to a late software project makes it
later” (Hart, 2008, p. 6). This, in part, is due to the reasons described above
and, in particular communication issues50. The scenario is also indicative of
another issue not addressed by the OISD project success factor literature. As
discussed in Chapter 2 (see p. 44), success factors can be restated as failure
factors and vice versa. Therefore, a given factor (depending on how it is stated)
50 But also the learning curve required to bring new project team members up to speed.

Chapter 5. Relationship analysis of OISD project success factors
220
is either a success factor or a failure factor; but never both. However, this
example contradicts this in that the project team’s staffing level can be a
success factor and a failure factor at the same time. Other factors in the
relationship data set that can concurrently have both positive and negative
effects include the proximity of the supplier-side project team to the client
organisation51 and schedule pressure52. Thus, there is evidence to suggest that
the strict delineation between success and failure factors espoused in the
project success factor literature should be relaxed to acknowledge cases in
which factors can concurrently have elements of both success and failure.
This scenario can have a serious impact on the way in which other factors
influence project success. This occurs if the factor in question is receptive to the
influence of other factors (as discussed above). In this case, the project team’s
staffing level is receptive to the direct influence of only two factors. However,
the project team’s staffing level is indirectly receptive to the influence of 677
base factors and, in so doing, has the potential to reverse their influence on
project success as discussed above. In other words, a base success factor can
exert a negative influence on project success through a causal chain that
includes a relationship between the project team’s staffing level and the
effectiveness of the communication process.
5.8.2 Project success as a success factor
Under normal circumstances (as specified by the propagation software’s input
parameters; refer to Appendix 3.5), the propagation process considers
encountering project success to be the condition by which active causal chains
51 Having the supplier-side project team close to the client organisation can enhance
communication between the two groups but, over time, can refocus the team’s affiliation from
the supplier to the client. Sometimes referred to as “going native”, this can lead to project
teams acting in a way that is detrimental to the project and the client organisation; for
example, carrying out work for the client that is outwith the scope of the project.
52 Although it can lead to short term productivity improvements, prolonged schedule pressure
might increase project team stress and the likelihood of undesirable software development
practices; for example, coding hacks (code that is implemented hurriedly without recourse to
robust design, coding and testing).

Chapter 5. Relationship analysis of OISD project success factors
221
are terminated. Consequently, there is no need to consider relationships
“beyond” project success i.e. relationships in which project success influences
other factors. However, the data set does contain a number of these
relationships. These can be used to show how project success might influence
the success of future projects. Consider the example depicted in Figure 5.14.
suc:project:success
-p->
act:s-o:partnership-with-c-o
-p->
act:s-o:relationship-with-c-o
-n->
act:c-o:politics
-p->
art:requirements:scope-creep
-p->
pro:project:cost
-n->
cri:project:adherence\p-budget
-p->
suc:project:success
Figure 5.14. The influence of project success on future projects
In Figure 5.14, project success enhances the long term partnership between the
supplier and client organisations. This partnership supports the shorter term
supplier-client relationship identified by a number of participants as an OISD
project success factor. This relationship can serve to alleviate the detrimental
political aspects of the client organisation and, in turn, reduce scope creep.
Reduced scope creep lessens the cost of the project and, hence, increases
budget adherence which, in itself is a positive indicator of project success.
5.8.3 Success criteria as success factors
The project success factor literature clearly differentiates between success
factors and success criteria (see p. 27). To summarise: success factors
influence project success whereas success criteria are used to measure project
success. The majority of active causal chains produced by the propagation
process conform to this view (as shown, for example, in Figure 5.15).

Chapter 5. Relationship analysis of OISD project success factors
222
act:c-o:changes-of-mind
-p->
art:requirements:scope-creep
-p->
pro:software-development:effort
-p->
pro:project:cost
-n->
cri:project:adherence\p-budget
-p->
suc:project:success
Figure 5.15. A typical active chain with multiple success factors
and a single success criterion
However, the analysis provided examples of success criteria influencing other
success criteria (refer to Figure 5.16).
act:c-o:buy-in
-p->
cri:p-deliverable:utilisation-by-c-o
-p->
cri:project:benefit\to-c-o
-p->
cri:c-o:satisfaction
-p->
cri:c-o:repeat-business-from
-p->
suc:project:success
Figure 5.16. An active chain with success criteria influencing other success criteria
The propagation process also provides examples of success criteria influencing
success factors (refer to Figure 5.17) i.e. success criteria acting as success
factors.
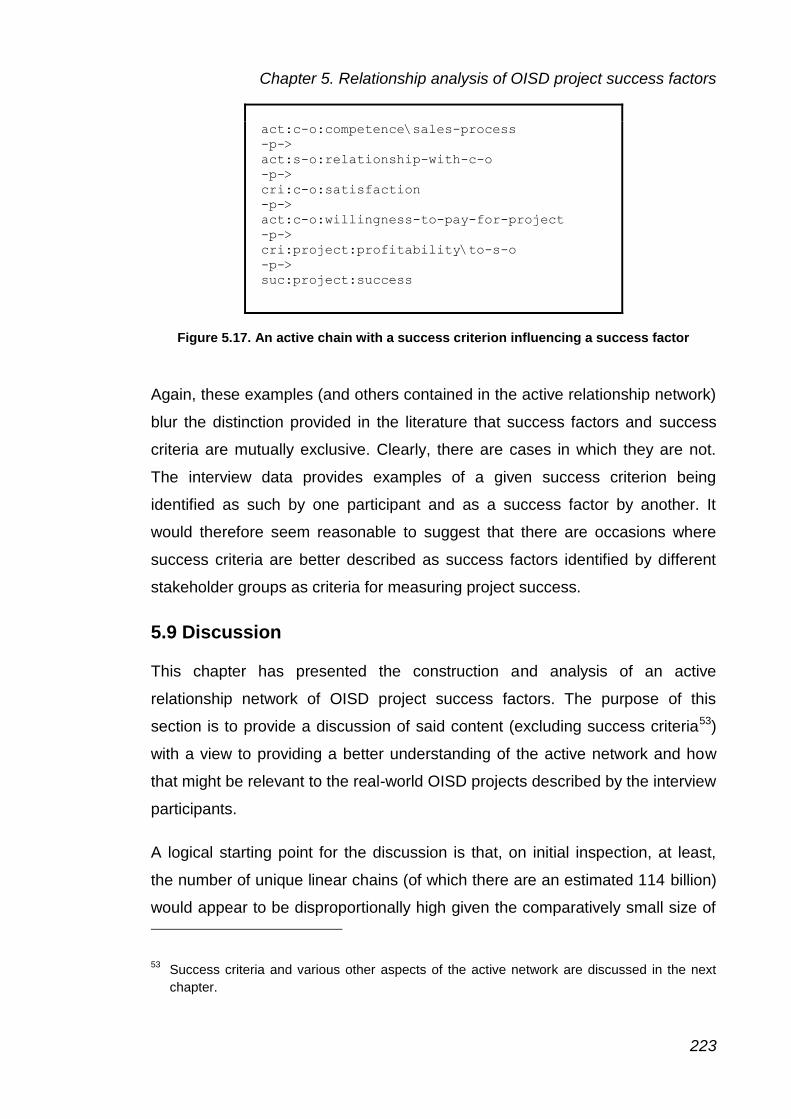
Chapter 5. Relationship analysis of OISD project success factors
223
act:c-o:competence\sales-process
-p->
act:s-o:relationship-with-c-o
-p->
cri:c-o:satisfaction
-p->
act:c-o:willingness-to-pay-for-project
-p->
cri:project:profitability\to-s-o
-p->
suc:project:success
Figure 5.17. An active chain with a success criterion influencing a success factor
Again, these examples (and others contained in the active relationship network)
blur the distinction provided in the literature that success factors and success
criteria are mutually exclusive. Clearly, there are cases in which they are not.
The interview data provides examples of a given success criterion being
identified as such by one participant and as a success factor by another. It
would therefore seem reasonable to suggest that there are occasions where
success criteria are better described as success factors identified by different
stakeholder groups as criteria for measuring project success.
5.9 Discussion
This chapter has presented the construction and analysis of an active
relationship network of OISD project success factors. The purpose of this
section is to provide a discussion of said content (excluding success criteria53)
with a view to providing a better understanding of the active network and how
that might be relevant to the real-world OISD projects described by the interview
participants.
A logical starting point for the discussion is that, on initial inspection, at least,
the number of unique linear chains (of which there are an estimated 114 billion)
would appear to be disproportionally high given the comparatively small size of
53 Success criteria and various other aspects of the active network are discussed in the next
chapter.

Chapter 5. Relationship analysis of OISD project success factors
224
the active network (which contains only 1,449 active relationships). Put another
way, is it possible for such a relatively small network to support such a high
number of unique active linear chains? The short answer to this question is yes,
but only if the network exhibits certain characteristics.
When discussing networks in relation to their characteristics, it is common
practice to refer to those networks as having topologies (see, for example,
Nedjah, da Silva, & de Macedo Mourelle, 2012; Zarifzadeh, Yazdani, & Nayyeri,
2012). Therefore, what is the topology of the active network such that is
supports such a high level of active linear chains?
For a network of this size (1,449 active relationships) to support a high number
of linear active chains (114 billion), its topology must satisfy two conditions i.e.
the topology must exhibit:
(1) Numerous long linear active chains;
(2) Multiple convergence/divergence points in the network with sufficiently
high receptivity and range values.
Consider, for example, the small network depicted in Figure 5.18.
Figure 5.18. Example of a small network of success factors with a single convergence/divergence point
In Figure 5.18, there are five unique linear chains between factors A and B and
also between factors B and C. However, the multiplicative effects of
convergence/divergence point B (with receptivity and range values of five)
means that there are 25 (not five) unique linear chains between factors A and
A B C

Chapter 5. Relationship analysis of OISD project success factors
225
C. Hence, the network between A and C, with a total of 20 relationships,
supports 25 unique linear chains each with a length of four relationships.
Figure 5.19. Example of a small network of success factors with two convergence/divergence points
Adding another convergence/divergence point, as depicted in Figure 5.19,
serves to increase the number of unique linear chains (125) in relation the
number of relationships in the network (30). Hence, the network between A and
D, with a total of 30 relationships, now supports 125 unique linear chains, each
with a chain length of six relationships54.
Continuing to extend the network in this manner to a create long network of say,
32 relationships in length, results in a network topology containing only 160
relationships with 15 convergence/divergence points but supporting 152 billion
unique linear chains. This example helps explain how a larger network like the
active network described in this chapter (with 98 convergence/divergence
points, a similar active chain length i.e. 35, and considerably more relationships
i.e. 1449) can support such a large number of unique linear chains.
Clearly then, the convergence points in the active network are significant. More
so, as explained above in Section 5.7.4, there is also a correlation between a
factor’s receptivity and range values in relation to its activity level. For example,
the 10 most active factors in the active network (refer to Table 5.7) have, on
54 Note that this does not include internal linear chains i.e. chains within chains; for example,
those between points B and D which are, in their own right, also unique.
A B C D

Chapter 5. Relationship analysis of OISD project success factors
226
average (mean), the highest receptivity and range values of all the factors in the
network. Indeed, the most active factor; the requirement’s fitness for purpose
has receptivity and range values of 67 and 15 respectively; values which
exceed, by far, the average (mean) values of 3.1 and 2.2 respectively for all
active factors in the network. This is the reason that the requirement’s fitness for
purpose is the most active factor in the network. Hence, the general rule is that
the higher a factor’s receptivity and range values, the higher the factor’s activity
level. Although this is not a hard and fast rule i.e. there are a few exceptions, it
does apply to the vast majority of factors.
The significance of the most active factors can be further demonstrated by
considering some of the network’s other characteristics. As previously
discussed, the network’s propagation process is governed by 133 core factors
and 361 core relationships. As the differentials between the activity levels of
these relationships are relatively low, the network cannot be considered to
contain any key relationships and thus any key linear chains. Indeed, even
when examined at entity level, key linear chains are not evident (see p. 216 and
Figure 5.11). Thus, from a project management perspective, the network
presents a significant problem: given the complicated nature of the network
(due to the large number of linear chains), and its additional level of complexity
(provided by the existence of multiple causal loops), how might the network be
managed, or at least monitored, in practice? Or, given that the network is not
only too complicated, but is too complex to be “managed”, how might a real-
world project manager, over the course a project, assess the effectiveness of
the network in propagating the influence of numerous base factors to affect
project success?
Again, the solution to this problem is provided by the most active factors; those
positioned at the “busiest” convergent/divergent points in the network as
determined by their high receptivity and range values. As these factors are
highly active, it is reasonable to assume they will be in a continual state of flux
throughout the project life cycle (or portions thereof); in other words, they will be
continually changing. Hence, the factors can be used as indicators of the
network’s performance and, as such, act as early, mid and late warning signs of

Chapter 5. Relationship analysis of OISD project success factors
227
project performance over the project life cycle. Thus, the most active factors; in
this case (1) the requirement’s fitness for purpose, (2) the project’s duration and
the (3) number of project issues (refer to Table 5.7) should be closely monitored
throughout the project by the project manager as indicators of project
performance.
Finally, to complete the active network’s topology, five additional characteristics
need to be considered i.e. success criteria, core sets of active factors and
relationships, multiple base factors, numerous causal loops and the possible
existence of success factors that, under certain conditions, can contribute to
project failure; for example, the project team’s staffing level as discussed in
Section 5.8.1. Hence, the active network’s topology is described as follows:
(1) Multiple (916) base success factors;
(2) Numerous long linear active chains per base factor (on average, 122
million per factor, with an average length of 35 factors/relationships,
resulting in a total of 114 billion linear chains);
(3) Multiple (98) convergence/divergence points with high receptivity (8.8)
and range (3.9) values;
(4) Numerous (2.94 million) interacting causal loops;
(5) A small number of success factors that, under certain conditions, can
contribute to project failure (for example, the project team’s staffing
level);
(6) Core sets of (133) active factors and (361) relationships that govern the
network’s propagation process;
(7) A set of (12) success criteria.
The implications of this topology to research and practice are discussed further
in the next chapter.
5.10 Conclusion
This chapter has presented a relationship analysis of OISD project success
factors. Various findings were presented relating to active linear chains, causal
loops and activity levels for success factors, success criteria, relationships and

Chapter 5. Relationship analysis of OISD project success factors
228
various aggregated data types. In addition to factor receptivity and range, a
number of special cases were discussed.
The analysis revealed a complex active network that can be considered as a
delivery system for the influences of multiple base factors to affect project
success. The network’s topology was found to comprise:
(1) Multiple base success factors;
(2) Numerous long linear active chains per base factor;
(3) Multiple convergence/divergence points with high receptivity and range
values;
(4) Numerous interacting causal loops;
(5) A small number of success factors that, under certain conditions, can
contribute to project failure (for example, the project team’s staffing
level);
(6) Core sets of active factors and relationships that govern the network’s
propagation process;
(7) A set of success criteria.
The significance of the most active factors in the network; those located at
convergence/divergence points with high receptivity and range values was also
explained, as was the usefulness of incorporating success criteria to determine
an OISD project’s success bias.
To summarise thus far, this thesis has:
(1) Introduced the research topic (Chapter 1);
(2) Performed a critical review of the appropriate literature (Chapter 2);
(3) Described the research methodology (Chapter 3);
(4) Presented 20 success factors (and various definitions of project success)
for supplier-based OISD projects (Chapter 4);
(5) Presented a relationship analysis of OISD project success factors
(Chapter 5).

Chapter 5. Relationship analysis of OISD project success factors
229
Hence, the next chapter will turn to a discussion of the above and, by examining
the findings of this research project in relation to the existing body of knowledge
for OISD project success factors (as portrayed by the literature review),
determine the contributions to knowledge and theory made by the research
presented in this thesis.
Chapter 6. Discussion
230
6. Discussion
6.1 Introduction
Having presented the findings of this research project, the purpose of this
chapter is to provide a discussion of these findings and, with appropriate
reference to the literature review, identify the contributions to knowledge and
theory made by the project.
To this end, the remainder of this chapter is structured as follows. First, the
preamble sets expectation levels for the contributions made by this research. A
framework for assessing these contributions is also provided. Next, the
contributions made by the findings relating to the identification and description
of organisational information systems development (OISD) project success
factors are presented. In addition to enhancing understanding of the actuality of
real-world OISD projects, these include:
(1) Factors identified by this research and also cited in the literature;
(2) Factors identified by this research but not cited in the literature;
(3) Factors cited in the literature but not identified by this research;
(4) The development of factors cited in the literature;
(5) Differences between supplier and client perspectives.
The contributions to knowledge and theory provided by the findings of the
relationship analysis of OISD project success factors are then presented. These
are discussed in conjunction with the utility and limitations of the relationship
analysis. Next, the contributions related to OISD project success criteria are
presented. These are:
(1) Organisational success from the suppliers’ perspective;
(2) OISD project success criteria as influencers;
(3) The relative importance of OISD project success criteria.
Prior to the chapter’s conclusion, a number of additional contributions are
presented.

Chapter 6. Discussion
231
6.2 Preamble
Prior to presenting the contributions to knowledge and theory made by this
research project, it is worthwhile setting realistic expectation levels for these
contributions. In addition, it is useful to define a framework against which the
contributions can be assessed. This section deals with both of these matters.
6.2.1 Setting realistic expectation levels for the contributions made by this
research project
The empirical fieldwork undertaken by this research investigated success
factors for supplier-based OISD projects as perceived by IT professionals
working for IS/IT solution providers in central Scotland. In other words, it offers
a suppliers’ perspective for a specific geographical and cultural region that, until
this study, had not previously been investigated. The fieldwork comprised
qualitative data collection processes followed by two complementary analyses.
The first of these was a qualitative analysis that identified and described 20
success factors. The analysis also presented various definitions for project
success. The second analysis was of a quantitative nature. Its findings
described the way in which success factors influence project success. Before
discussing the findings of these analyses, it is worthwhile determining the extent
to which the findings might be expected to make contributions to knowledge and
theory based on similar studies in the field.
6.2.1.1 OISD project success factor studies containing the suppliers’
perspective
As demonstrated by the literature review, there have only been four studies that
examined OISD project success factors from the suppliers’ perspective (as
listed in Table 6.1). Furthermore, these studies suggest that there is little
difference between supplier and client perspectives regarding OISD project
success factors. For example, Sharma, Sengupta & Gupta (2011) fail to
differentiate between the two, while Hartman and Ashrafi (2002) and Cerpa and
Verner (2009) reported only slight differences in perspective. Similarly,

Chapter 6. Discussion
232
Moynihan (1996) reported that most of the risk factors identified in his study had
already been mentioned in the OISD project risk literature55. That said,
Moynihan’s study did reveal some “subtle elaborations of these factors”
(Moynihan, 1996, p. 364).
Study Perspective(s) Factor type Geographical area(s)
Cerpa & Verner (2009) Supplier and client Success USA, Chile & Australia
Hartman & Ashrafi (2002)
Supplier and client Success Canada
Moynihan (1996) Supplier only Risk Ireland
Sharma, Sengupta & Gupta (2011)
Supplier and client Risk India
Table 6.1. Studies examining OISD project success, failure or risk factors containing the suppliers’ perspective
(replicated from Table 2.10)
Although not an OISD project study, Taylor (2007) can also be considered to be
comparable to this research project. As a qualitative study (as was Moynihan’s),
Taylor investigated risk factors for implementation-only IS/IT projects,
exclusively from the supplier’s perspective for packaged software suppliers
based in Hong Kong. Again, although the majority of the risk factors identified in
Taylor’s study had previously been reported in prior studies (Taylor, 2007, pp.
7-12), a small number of additional factors were also identified (Taylor, 2007, p.
22). That said, the literature used by Taylor to represent “the IT project risk
factor literature” (Taylor, 2007, p. 22) comprises only three studies.
It is also worth noting that both Taylor and Moynihan were concerned with
identifying “new” factors; those not previously in the OISD project risk factor
literature. Neither author attempted to provide a comparison between risk
factors as perceived by supplier vis-à-vis client organisations. Also, although the
findings of the four studies listed in Table 6.1 represent contributions to
knowledge, none of the studies provided contributions to theory; a criticism that
55 Based solely on the literature reviewed in previous study conducted by Barki, Rivard and
Talbot (1993).

Chapter 6. Discussion
233
can be made of empirical OISD project success factor studies in general
(Söderlund, 2004a, p. 187; Söderlund, 2004b, p. 659).
Hence, a realistic expectation for this study is that many of the factors it
identifies will already have been reported in the OISD project success, failure
and risk factor literature (as listed in Appendix 2.3). However, a number of new
factors should also be expected, particularly at a detailed level and through the
development of factors previously reported in the literature. It might also be
possible to provide a comparison between success factors as perceived by
supplier vis-à-vis client organisations. This is because the perspective
presented by the OISD project success factor studies identified by the literature
review is predominantly that of host (in-house/client) organisation (see p. 49). In
fact, performing the success factor analysis described in the literature review
(see p. 42), with the exclusion of the four articles listed in Table 6.1, produces
remarkably similar results (as listed in Appendix 2.5) in terms of the most cited
factors. Finally, because the qualitative analysis was concerned with identifying
and describing the actuality of real-world OISD project success factors (a
significant contribution in its own right), a contribution to theory in the research
area was not anticipated.
6.2.1.2 Studies investigating causal interactions between OISD project
success factors
Studies investigating causal interactions between success factors are discussed
in Section 2.4.5 (see p. 63). Unfortunately, the majority of these studies are
concerned with IT/IS projects, not OISD projects. In addition, as discussed in
the literature review, these studies have a number of other limitations (see p.
63). First, all of the studies address only a small number of key success factors;
on average (mean) 13 factors. Thus, they represent relatively simple scenarios,
requiring the addition of more success factors to provide a better representation
of complex OISD projects (Kim, 2004, p. 28; King & Burgess, 2008, p. 430).
Thus, there is a significant opportunity for researchers to provide more
comprehensive causal models that provide a better explanation of the
behaviour of real-world OISD projects. Second, further research is required to
validate, complement and extend the conceptual models presented by the

Chapter 6. Discussion
234
studies. Finally, and most importantly, because all the models are static in
nature, they do not address the dynamic nature of real-world IS and OISD
projects. Hence, there is ample opportunity for this research to provide original
contributions to both knowledge and theory.
In particular, because the relationship analysis described in Chapter 5
addressed success factors and relationships at a detailed level, a more
comprehensive causal model that better describes complex, real-world projects
should be expected. Second, because studies of this type tend to have
conceptual aspects, there is the possibility of enhancing OISD project success
factor theory by explaining practice and building theory (Morris, 2010, p. 144).
However, because the relationship analysis, as a rudimentary network analysis,
did not address the dynamic nature of real-world OISD projects, a contribution
should not be expected relating to the project dynamics.
6.2.2 A framework for contributions made by this research project
The contributions to knowledge and theory made by the research presented in
this thesis should be determined in an objective manner. Thus, the research
findings should be considered in relation (with reference) to the existing body of
knowledge for OISD project success factors. In this thesis, the literature review
(presented in Chapter 2) is the “lens” by which this research project has
established its “viewpoint” (Creswell & Miller, 2000, p. 125) of the body of
knowledge for OISD project success factors. In addition to discussing the
background, context, criticisms and recommendations for further research in the
field, this “viewpoint” identified five research directions for OISD success factors
upon which the contributions made by this study can be objectively assessed.
These are:
(1) OISD project success factor lists;
(2) OISD project success factor frameworks;
(3) Individual OISD project success factors;
(4) The influence of success factors on OISD project success;
(5) Causal interactions between OISD project success factors.

Chapter 6. Discussion
235
In addition, success criteria for OISD projects (see p. 28), constitutes a sixth
research direction against which contributions made by this study can also be
assessed.
6.3 Contributions made by the findings relating to the
identification and description of OISD project success
factors
The first objective for this research project was to provide a better
understanding of OISD project success factors from a suppliers’ perspective.
Initially, this was achieved by a qualitative analysis that identified and described
20 OISD project success factors (refer to Chapter 4). This also gave rise to a
relationship analysis that identified a large number of detailed success factors
(refer to Chapter 5). The findings of the two analyses are discussed below. The
findings represent contributions to knowledge for two research directions56: (1)
OISD project success factor lists, and (2) given the thick, rich descriptions
provided for each factor, individual OISD project success factors (in terms of
describing the actuality of real world projects).
The OISD success factors identified by this research project can be divided into
two categories, distinguished by their level of detail. The first category contains
20 high-level, entity-based success factors (listed in Table 6.2). As Table 6.2
indicates, 13 of these factors had already been identified in the OISD project
success factor research literature (indicated as “No” in the “New?” column)
while seven have been newly identified by this study (indicated as “Yes” in the
“New?” column).
56 Refer to the six research directions presented in Section 6.2.2 above.

Chapter 6. Discussion
236
Rank Type Factor New?
1 Process Effective requirements management No
2 Actor Effectiveness of the project team No
3 Process Effective communication No
4 Actor Effectiveness of the project manager No
5 Process An effective development approach No
6 Actor Effectiveness of the client organisation No
7 Actor Effective client involvement No
8 Process An effective sales process Yes
9 Artefact A fit for purpose project governance model Yes
10 Process An effective project start-up Yes
11 Process Effective project planning No
12 Artefact Fit for purpose technology No
13 Process Effective software testing Yes
14 Process Effective risk management No
15 Process Effective change management No
16 Process Effective stakeholder management Yes
17 Process Effective post implementation support Yes
18 Process Effective training No
19 Process Effective expectation management No
20 Process Effective lessons learning Yes
Table 6.2. 20 OISD project success factors (adapted from Table 4.2)
Further analysis of the success factors listed in Table 6.2 revealed that each of
the factors comprised a number of more detailed factors/criteria and
relationships between them. The subsequent relationship analysis went on to
identify nearly 2,000 of these “detailed” factors (refer to Table 6.3).
Factor set Number of factors/criteria identified
Interview participants 1,988
Relationship data set 1,414
Active relationship network 930
Table 6.3. Number of success factors/criteria by factor set

Chapter 6. Discussion
237
The detailed success factors (and criteria) identified by the relationship analysis
can be divided into three distinct factor sets (refer to Table 6.3). The first of
these contains the 1,988 success (and failure) factors (and criteria) identified by
the interview participants. Although these are valid success factors/criteria, not
all were contained in one or more relationships and, hence, could not be shown
to influence project success. Thus, the 1,395 success factors/criteria contained
in the relationship data set are more relevant. However, the relationship
analysis revealed that only 916 of these factors (and 14 success criteria)
actually influenced project success. Hence, these 916 success factors (and 14
success criteria) are the most relevant of all the factors identified in this study;
not only were they cited as success factors by the interview participants, but the
relationship information provided during the interviews allowed the relationship
analysis to show that they did, indeed, influence project success.
As a simple list, the “top 20” success factor listing depicted in Table 6.2 seems
somewhat unremarkable. That is, although it sits well with the success factors
lists produced by prior research (see, for example, Table 2.1), and contains a
number of factors not previously addressed by the literature, it does nothing to
describe what these factors actually are. Consequently, the value that it adds to
understanding of OISD project success factors is somewhat limited. However,
this criticism is addressed, not only by the thick, rich narratives provided for
each of the factors, but also by the 916 detailed success factors identified by
the relationship analysis. Of the 916 factors, only 109 are contained in the
literature, thus revealing 807 “new” success factors (listed in Appendix 5.2).
However, although this would seem to be a large number of newly identified
factors, it is worth remembering that the relationship analysis was conducted at
a level of detail that has not been addressed by prior OISD project success
factor studies.
By means of the thick, rich descriptions provided for the 20 success factors
presented in Chapter 4 and the detailed factors identified by the relationship
analysis (refer to Chapter 5), the findings of this research project provide a
number of valuable insights into OISD project success factors. First, the findings
enhance understanding of the actuality of real-world OISD projects; an aspect

Chapter 6. Discussion
238
of the findings that should not be underestimated, as the reader no longer has
to refer back to the normative project management literature to determine what
these factors might actually mean. The findings also confirm the significance of
previously reported success factors (in the OISD project success factor
literature). A number of additional factors are also identified and described.
Notable omissions in the findings are identified, and differences between
supplier and client perspectives discussed. The findings also develop a variety
of factors, poorly described in the literature. The key findings relating to OISD
project success factors are presented below.
6.3.1 Factors identified by this research and also cited in the literature
The 60 most commonly cited success factors in the OISD project success factor
research literature are listed in Appendix 2.4. As discussed above, this listing
predominantly reflects the in-house/client perspective. And, as had been
anticipated, the majority of the entity-based success factors identified by this
study (refer to Table 6.2) have corresponding (or similar) entries in Appendix
2.4 i.e. 13 of the factors had already been identified by prior research. These
factors are listed in Table 6.4.

Chapter 6. Discussion
239
Type Factor
Process Effective requirements management
Actor Effectiveness of the project team
Process Effective communication
Actor Effectiveness of the project manager
Process An effective development approach
Actor Effectiveness of the client organisation
Actor Effective client involvement
Process Effective project planning
Artefact Fit for purpose technology
Process Effective risk management
Process Effective change management
Process Effective training
Process Effective expectation management
Table 6.4. OISD project success factors identified by prior research
Not only had this been anticipated, but it would have been disturbing if this had
not been the case. It is relatively commonplace for IT professionals to advance
their careers and, in so doing, move from in-house IT departments to external
IS/IT solution suppliers (and vice versa). If OISD development projects were
perceived to be radically dissimilar by supplier and client organisations, these
moves would not be practicable. Thus, the findings of this research suggest
that, the majority (13) of high level (entity-based) success factors are equally
applicable to in-house and supplier-based OISD projects. That said, further
claims can also be made. In particular, 12 of the 13 factors57 are applicable to
any organisational project; for example, effective project planning, effective risk
management, etc.
6.3.2 Factors identified by this research but not cited in the literature
The findings of this research project contain numerous detailed success factors
not found in the OISD project success factor literature. This is particularly true
57 An effective development approach (Factor 5 in Table 6.2) is the only factor to be excluded
as it is specific to OISD projects.

Chapter 6. Discussion
240
for factors identified at a detailed level (as listed in Appendix 5.2 and also
discussed above in Section 6.3, p. 235). However, in relation to the high-level
success factors listed in Table 6.2, seven can be considered to be newly
identified by this study (as listed in Table 6.5).
Type Factor
Process An effective sales process
Artefact A fit for purpose project governance model
Process An effective project start-up
Process Effective software testing
Process Effective stakeholder management
Process Effective post implementation support
Process Effective lessons learning
Table 6.5. New OISD project success factors identified by this study
Although the reasons for the exclusion of these factors from the OISD project
success factor literature are not clear, further discussion of the factors might
provide an explanation. Consider, for example, an effective sales process
(Factor 8 in Table 6.2) which, as a success or failure factor, does not feature in
prior OISD project success factor studies; not even in the form of supplier
selection or the client’s procurement process (which was also acknowledged by
some of the interviewees as a success factor). The need for an effective sales
process was clearly articulated by a number of the interview participants.
Although there are other means by which an IS solution provider might acquire
a project (for example, by way of reputation or repeat business), the sales
process still seems to represent the primary vehicle by which future business is
secured. Yet the sales process was depicted by the interview participants to be
a somewhat challenging and troublesome affair. The root cause of some of
these difficulties lay with the client organisation; for example, senior managers
who did not possess sufficient understanding of what they wanted58.
58 Interestingly, this issue has only previously been reported by Moynihan (1996) in his study of
IS solution providers in Ireland. Therefore, based on empirical evidence provided to date

Chapter 6. Discussion
241
Conversely, other difficulties could be described as being self-inflicted; for
example, over-selling on the part of the organisation’s own sales staff.
Whichever is the case, the sales process should be considered crucial to
project success (no project, no success) and potentially challenging in its
execution. Why then does it not appear in the OISD project success factor
literature?
This might simply be because the projects addressed in prior studies are
predominantly in-house development projects (see p. 49). It might also be
because researchers have previously taken a relatively narrow view of the
project life cycle; say, from project start-up to delivery (thus, excluding the sales
process from the project life cycle). Similarly, the participants of prior studies
may have taken the same view. This might also explain the exclusion of
effective post implementation support and effective lessons learning. However,
if the sales process has long been troublesome (as portrayed by this study),
should not the participants in prior studies have been well aware of its
consequences? Unfortunately, this might not necessarily be the case. For
example, it is reasonable to suggest that client-side stakeholders are not
exposed to the consequences of a badly executed sales process in the same
way that the supplier’s stakeholders are. And, given that the majority of client-
side stakeholders (as participants in prior studies) play no part in the sales
process (and, for that matter, post implementation support and lessons
learning), it is quite possible that this lack of exposure (to the process and the
consequences) is the reason that the sales process is not present in prior
literature.
As for the remaining factors, the reasons are similarly unclear. However, one
possible explanation is that the projects addressed by prior studies seem to be
smaller rather than larger (see p. 49). Hence, the need for a fit for purpose
project governance model is not as acute as for larger projects (see p. 170).
(including that from this project), this factor might be construed as only affecting OISD
projects in the British Isles.

Chapter 6. Discussion
242
The interviews also suggested that this might also be the case for the three
remaining factors. For example, effective software testing certainly becomes
more difficult for larger projects (see p. 164), as does effective stakeholder
management (see p. 150) and conducting an effective project start-up (see p.
141). However, the omission of software testing could also be because it is not
viewed by client organisations as being important and hence, in situations
where a project is behind schedule, becomes one of the first activities to be
squeezed in terms of the time made available for it (see p. 164). The same is
perhaps true for a project’s start-up, with client organisations keen to get started
on the development activities required to deliver the project deliverable.
6.3.3 Factors cited in the literature but not identified by this research
The literature contains a number of factors that were not identified by this
research or, alternately, only received minimal attention in the interviews. For
example, project monitoring and control appear in the literature (as two
separate factors) but were hardly mentioned by the interview participants.
Perhaps the relatively mundane nature of these processes caused the interview
participants to relegate them to being “givens” and not requiring any discussion.
Whatever the reason, they are not afforded any real significance in the
interviews. Similarly, the project’s target business processes, i.e. those that will
be affected by the implementation of the information system, are absent (as
success factors) in the interview transcripts. Although the reason for this is not
clear, it is possibly because the interviews focussed very much on development,
not implementation.
There is, however, one factor that is (almost) conspicuous by its absence in the
findings of this study: the supportiveness of the project board (also referred to
as executive management support and/or commitment). Admittedly, it was
identified by one participant as an important factor, but, then again, only for
large projects. Given that the OISD projects in this study are relatively small and
that all of the other interview participants made no mention of the factor, it is
reasonable to conclude that the project board supportiveness is not a significant
success factor in this study. This is somewhat surprising because the

Chapter 6. Discussion
243
supportiveness of the project board can be found regularly in the uppermost
ranks of “top 10” OISD project success factor lists. Indeed, it is the 2nd most
highly ranked factor in Appendix 2.4. Why, then, is this not reflected in the
findings of this study?
Again, there are a number of possible explanations for this. It may be due to
bias introduced to quantitative surveys carried out by prior research. A relatively
common practice employed by researchers was to identify important success
factors in the literature and then incorporate these into their survey instruments.
This helped ensure that project board supportiveness was a regular feature in
questionnaires sent out to practitioners. In this way, the probability of project
board supportiveness being identified by the respondents as a significant
success factor was higher than it would be, say, in an open ended interview, in
which the participants can identify factors as they see fit. Hence, the bias in the
quantitative surveys might have maintained project board supportiveness as
being more significant than is actually the case. However, it might also be
because IS/IT projects have changed over recent decades in terms of their
novelty, the fear associated with them and the need for support from upper
levels of management. Coupled with the relatively small project sizes addressed
by this research, it may well be the case that support from the project board (as
a senior management group) is not as relevant as it was in the past. Instead of
requiring senior management input, the necessary support for OISD projects
can be delegated to lower levels of the organisation. Indeed, the interviewees
provided a number of examples of this i.e. staff members acting as sponsors
and facilitators of OISD projects and, thus, providing the necessary commitment
and support to enable the project to be successful.
6.3.4 The development of factors cited in the literature
When considered as a research objective, the development (or, indeed,
exploration) of factors cited in the literature represents “easy pickings” for any
qualitative study investigating real-world OISD project success factors. This is
simply because the vast majority of prior research does not explore or describe

Chapter 6. Discussion
244
the real-world factors that it identifies59. This leaves the reader with little option
but to refer back to the predominantly normative literature which, in the main,
does not reflect the actuality of real-world projects (Crawford, Morris, Thomas, &
Winter, 2006, p. 724). Hence, it can be argued that the thick, rich descriptions
provided by this research project clearly enhance understanding of the actuality
of real-world OISD projects and, in particular, their success factors, albeit for
supplier-based projects from the perspective of IS/IT solution providers in
central Scotland.
The development of factors cited in prior literature can also reveal important
differences between the findings of prior, predominantly in-house/client based
studies and the supplier perspective provided by this research. Consider, for
example, the importance of employing an effective development approach
(Factor 5 in Table 6.2), considered important by a number of interview
participants. Although a few success factors relating to development
methodologies can also be found in the literature, the approach favoured by the
interview participants is at odds with the findings of previous studies. In
particular, prior research provides a limited amount of support for evolutionary
and agile approaches, whereas the findings of this research advocates an
incremental approach. In fact, the interview participants considered agile
software development to be wholly inappropriate for OISD development projects
(and provided plausible evidence to support their view) (see p. 187). Hence,
incremental software development represents a success factor that is not
addressed in the literature.
However, it is the justification provided by the interview participants for
employing an incremental approach that merits discussion. On the whole, the
interview participants considered an incremental approach to be a success
factor, not because it provided any direct benefit to the supplier organisation,
but because it delivered benefits to the client organisation both quickly and
59 Indeed, even when articles do provide descriptions (or additional data) for the factors they
identify, these descriptions tend to be somewhat limited.

Chapter 6. Discussion
245
often. This suggests that IS solution providers can be described as being client
oriented and even as having their clients’ best interests at heart. Indeed, the
findings of relationship analysis (discussed below) support this view. Not only
did the analysis show supplier-based OISD projects to be oriented towards
project success (as opposed to project management success), but the success
criteria influenced most by OISD project success factors were also found to be
client satisfaction followed by client benefit.
Of course, there are limitations to the benefit that might be derived from the
development of factors. For example, the findings are based on the perceptions
of a limited number of interviewees. Then again, the number of interviewees
compares favourably with similar studies i.e. the sample size of 33 is larger than
studies such as Moynihan (1996): 14 participants, and Taylor (2007): 22
participants. The sample also comprises highly experienced individuals who,
therefore, can be considered to be experts in the field with appropriately
informed views.
There are also consequences regarding the completeness of the findings.
Although the thick, rich descriptions present substantial narratives for a wide
range of success factors, it would be foolish to claim that the coverage is
complete in terms of the factors covered and the detail provided. OISD project
success factors is an enormous concept that, realistically, cannot be addressed
in detail by a quarter of a million words collected through 33 interviews.
Therefore, although the reader should be able to draw their own conclusions
regarding the information provided by the interviewees, what should be
deduced about what was not said?
Consider for example, effective risk management (see p. 149). The views of the
interview participants clearly reflect the need for continuous risk management in
which potential risks are continually monitored and reviewed to ensure that they
are kept up to date. However, although this addresses the currency of risks
throughout a project, it does not address how they should be dealt with; for
example, through standard risk response strategies i.e. avoidance,
transference, mitigation and acceptance (see, for example, Project
Chapter 6. Discussion
246
Management Institute, 2008, p. 303). Therefore, by way of their omission, does
this mean that interview participants do not consider the use of these strategies
to be success factors, or is it perhaps that they view these strategies as
“givens”; factors that are simply assumed to be important and, hence, do not
need to be mentioned? Likewise, although their omission most likely excludes
the strategies from being considered as failure factors by the interview
participants, perhaps they were simply omitted in the interviews simply because
the participants forgot to mention them. In summary, although the thick, rich
descriptions serve to enhance understanding of success factors for real-world
OISD projects, they do bring with them certain limitations, the effects of which
should be clearly understood.
As might be expected, certain types of factors were developed more than
others. This is particularly well demonstrated by the “new” detailed factors
identified by the relationship analysis (refer to Appendix 5.2). As Appendix 5.2
shows, the majority of “new” detailed factors are associated with actors found in
a supplier-based OISD project and that the numbers of factors for the other
entity types (artefacts, externalities and processes) are substantially less. Thus,
actors have been developed further than the other entity types. As a result, the
findings of this study suggest that project actors embrace substantially more
success factors than previously indicated in the literature. However, is it actually
the case that the literature does not adequately identify actor related success
factors, or can it be explained by some other reason? Perhaps it was because
the researcher inadvertently steered the interviewees to discuss actor related
success factors. However, given the care taken to negate interviewer bias, this
is unlikely. Therefore, a more adequate explanation might be that the
interviewees were genuinely “people” focussed. After all, it is "people who
deliver projects, not processes and systems" (Cooke-Davies, 2002, p. 189). On
the other hand, perhaps people are simply easier to describe than, say,
artefacts and processes. Similarly, perhaps the interview participants were of
the opinion that they understood project actors better than the other entity
types. All of these reasons are plausible explanations for the development of

Chapter 6. Discussion
247
actor related success factors provided by this research project. Unfortunately,
the reader is still left to decide which, if any, of these explanations apply.
All of the above said, the development of thick, rich descriptions does serve to
enhance understanding of OISD project success factors and the actuality of
real-world OISD projects. A pertinent example of this is end user involvement, a
success factor widely cited in the literature. One criticism of this factor per se, is
that there is no explanation of what the end users are involved in. The findings
of this research corroborate this; for example, that end users (discussed within
the context of client involvement; see Factor 7 in Table 6.2) should be involved
in project start-up, requirements elicitation and even the sales process (see p.
184). Another criticism of end user involvement per se, is that it often occupies
the premier position in “top 10” success factors lists that do not contain any
other involvement related factors. As a result, there is a danger that the
involvement of end users assumes a disproportionally high significance at the
expense of the involvement of other actors; for example, the project board.
Again, this research addresses this by showing that a successful OISD project
requires the involvement of other actors other than the end users; for example,
the project board, domain experts and the client’s IT department (see p. 184).
6.3.5 Discussion of the differences between supplier and client
perspectives
The discussion thus far has identified differences in perspective between the
supplier and in-house/client organisations, regarding the significance of various
success factors (for example, project board supportiveness). This has been
based upon the new and existing factors identified by this study in relation to the
OISD project success factor literature, as depicted by the results of the success
factor analysis (see p. 42). As previously discussed, these results are
considered to reflect an in-house/client perspective for smaller rather than larger
projects (see p. 49).
Although the evidence presented in the literature review supports this view i.e.
that the literature predominantly reflects an in-house/client perspective for
relatively small projects (see p. 49), there are a number of caveats that should

Chapter 6. Discussion
248
be taken into account. The first is that researchers in the field are quite often
remiss in clearly describing the scope of their research (see p. 41). For
example, Wallace & Keil (2004) (Article 50 in Appendix 2.2) fail to clarify
whether they are investigating software development from and in-house or
supplier-based perspective; nor do they make it clear whether they are
presenting a supplier or in-house/client perspective. Hence, although the
literature appears to reflect an in-house/client perspective for relatively small
projects, this cannot be guaranteed. The second problem is that prior research
does not sufficiently describe the real-world success factors that it identifies.
Consequently, this limits the extent to which this research can compare its
findings with those presented in the literature. In summary, although the
evidence presented in the literature review supports the view that the literature
predominantly reflects an in-house/client perspective for relatively small
projects, the caveats discussed above should be taken into account in relation
to the discussion presented above in this section.
All of the above said, there are a number of additional differences that can be
identified by this research. For example, one apparent difference is that
suppliers clearly differentiate between success factors for the supplier and client
organisations and associated stakeholder groups (for example, the supplier-
side and client-side project teams). Based on the literature, this distinction is far
less clear, perhaps because client organisations view their own responsibilities
for the project to be far less than the supplier organisation. For example, as
noted by a number of the participants, client organisations quite often
underestimate their involvement in a project (see p. 184). This is contrary to the
participants who, by identifying success factors for supplier and client-based
actors, clearly perceive the success of an OISD project to be dependent on both
organisations.
Supplier organisations also seem to be quite critical of their own competences.
Indeed, the interview participants were quite open in discussing areas in which
their organisations had failed (or were failing) or where improvements in
performance were required (or had been made). A similar degree of
constructive self-criticism by the client organisation is not as evident in the

Chapter 6. Discussion
249
literature. Perhaps this is because in-house/client organisations simply do not
recognise their own failings. In fact, the interviewees provided a number of
examples of this; for example, arrogant customers and those having
unsatisfactory understanding of their requirements (see p. 184), without
apparently being aware of these issues. But, again, it is not possible to provide
a concrete explanation for these apparent differences in perception. Indeed,
perhaps the reason why the interviewees were comfortable exploring factors in
a self-critical manner was simply because the rapport built by the researcher
provided a “safe” environment for them to do so.
6.4 Contributions made by the findings of the relationship
analysis of OISD project success factors
The second objective of this research project was to provide a better
understanding of the way in which OISD project success factors interact to
influence project success. The qualitative analysis described above, by way of
the thick rich descriptions provided for each factor, clearly showed that each of
the 20 entity-based success factors comprised a range of detailed factors and
relationships between them. Hence, a relationship analysis of OISD project
success factors was performed. As the analysis was carried out at a very
detailed level and identified 916 active factors, it does not seem to have a
comparable study in the OISD project success factor literature. Indeed, the
studies that have previously investigated causal interactions for IS and OISD
project success factors have contained, on average (mean), only 12 factors in
each60 (see p. 41). In this respect, the relationship analysis can be described as
an exploratory investigation, not normally associated with the qualitative
research discussed above. The findings of the analysis constitute contributions
to knowledge and theory for two research directions: (1) the influence of
success factors on OISD project success and (2) causal interactions between
OISD project success factors (refer to the six research directions presented in
Section 6.2 above).
60 Note, also, that the majority of these studies investigated IS/IT, not OISD, projects.
Chapter 6. Discussion
250
6.4.1 Utility and limitations of the relationship analysis
Prior to presenting these contributions (refer to Sections 6.4.2 and 6.4.3), a
discussion of the utility and limitations of the relationship analysis is merited;
that is, by considering the outputs of the analysis in relation to its inputs. As
presented in Section 5.4, the input to the relationship analysis is the data
generated by the data collection process (as described in Chapter 3) i.e. the
interview transcripts. These transcripts were coded using a detailed data coding
process. This allowed the relationship analysis to be performed, aided by a
bespoke software application developed as part of the research project.
The output from the analysis helped to identify, describe and quantify a
complicated active network constituting the delivery system for the influences of
multiple base factors to affect OISD project success. In particular, the analysis
showed that the network contained multiple (916) base success factors, each of
which influenced project success through numerous long linear chains; on
average, 122 million per factor, each with an average length of 35
factors/relationships, resulting in a total of 114 billion linear chains. The analysis
also revealed the existence of numerous (2.94 million) interacting causal loops
which, collectively, add a level of complexity to the behaviour of the network. In
terms of factor activity, the analysis identified core sets of (133) active factors
and (361) relationships that governed the network’s propagation process. By
investigating criteria activity, the analysis also revealed that that the primary
focus of supplier-based OISD projects was client-side organisational success
(client satisfaction followed by client benefit), at the expense of supplier-oriented
organisational success (payment from the client, etc.). The most active factors
in the network; those located at convergence/ divergence points with high
receptivity and range values were also shown to be significant in that they can
be used to determine project performance over the lifecycle (or sections
thereof) of the project.
However, the utility described above needs to be bounded by the limitations of
the analysis (also discussed in Section 7.4.3). For example, the analysis
addressed only the factor activity levels and, hence, ignored factor magnitude.

Chapter 6. Discussion
251
Similarly, the time taken by a source factor to influence a target factor was not
taken into account. Factors were also considered to be mutually exclusive in
terms of their causal chain sets. In addition, the consequences of a target factor
being influenced simultaneously by the influences of multiple source factors
were ignored. Finally, relationship types were modelled relatively simplistically
i.e. as either positive or negative.
Hence, although the utility of the relationship analysis allows a number of
contributions to knowledge and theory to be made (as described in the next two
sections), these need to be bounded by the limitations described above. In
particular, the analysis does not provide a complete picture of the complicated
nature and inherent complexities of the active network. Similarly, the relatively
small number of interviewees and the qualitative nature of the data collection
and detailed coding processes negate the extent to which claims of
generalisation of findings can be made. Indeed, as this research project was
essentially a small scale study, in which the interview participants were
identified using purposive, not random, sampling, attempts to generalise its
findings would be inappropriate (Pickard, 2007, p. 59). Hence, this thesis makes
no claims for the generalisation of its findings. Yet, this does not diminish the
value of the research findings. Despite its limitations, the relationship analysis
reveals levels of detail and complexity regarding the interaction of OISD project
success factors that have not been addressed by prior research.
6.4.2 Contributions to knowledge
In addition to those described in Section 6.3, the primary contribution to
knowledge provided by the relationship analysis is that it revealed a complex
active network that may be considered as a delivery system for the influences of
multiple base factors to affect OISD project success. The active network’s
topology was found to comprise:
Chapter 6. Discussion
252
(1) Multiple (916) base success factors;
(2) Numerous long linear chains per base factor (on average, 122 million per
factor, with an average length of 35 factors/relationships, resulting in a
total of 114 billion linear chains);
(3) Multiple (98) convergence/divergence points with high receptivity (8.8)
and range (3.9) values;
(4) Numerous (2.94 million) interacting causal loops;
(5) A small number of success factors that, under certain conditions, can
contribute to project failure (for example, the project team’s staffing
level);
(6) Core sets of (133) active factors and (361) relationships that govern the
network’s propagation process;
(7) A set of (12) success criteria.
The most active factors in the network; those located at convergence/
divergence points with high receptivity and range values were also shown to be
significant in that they can be used to determine project performance over the
lifecycle (or sections thereof) of the project. The three most active factors were
found to be (1) the requirement’s fitness for purpose, (2) the project’s duration
and the (3) number of project issues (refer to Table 5.7). The inclusion of
success criteria also allowed the network to be used to provide an indication of
success bias for supplier-based OISD projects i.e. that the primary focus of
supplier-based OISD projects is client-side organisational success (client
satisfaction followed by client benefit), at the expense of supplier-oriented
organisational success (payment from the client, etc.). This topic is discussed
further below in Section 6.5.3.
The relationship analysis builds upon previous studies carried out in this
research direction (see p. 63). Prior studies enhance understanding of the
causal interactions between success factors by identifying networks of casual
chains and causal loops. Unfortunately, these networks are overly simplistic and
do not provide satisfactory explanations of the behaviour of complex OISD
projects. By addressing success factors and their relationships, the relationship
analysis helps address this issue by producing a more comprehensive active

Chapter 6. Discussion
253
network that better reflects the complexities of contemporary OISD projects.
The analysis also helps address the problem of managing, or at least
monitoring, such a complex network. This is achieved by monitoring the most
active factors in the network, which by being in a constant state of flux, can be
used as early, mid and late warning signs or, in other words, indicators of
ongoing project performance. As the relationship analysis showed, the most
active factors are those found at the convergence/divergence points in the
network with the highest receptivity and range values. The active network also
contains a set of success criteria that can be used to determine the success
bias for the OISD projects studies; for example, that supplier-based OISD
projects are orientated more towards client-side than supplier-side project
success. All in all, the resultant active network produced by the network
analysis is a significant improvement on those found in the research literature.
6.4.3 Towards a network topology theory for OISD project success factors
The findings of the network analysis provide an excellent opportunity to
enhance project success factor theory by explaining practice (as presented in
the previous section) and building relevant theory (Morris, 2010, p. 144).
The evidence presented in the literature review suggests that real-world OISD
projects (and projects in general) are inherently messy, ambiguous and
confusing (Bredillet, 2005, p. 3). Contemporary OISD projects are also regarded
as being complex (Alojairi & Safayeni, 2012, p. 16; Bredillet, 2005, p. 3; British
Computer Society, 2004, p. 15; Crawford, Morris, Thomas, & Winter, 2006, p.
724; Fortune & White, 2009, p. 37; Williams, Klakegg, Walker, Andersen, &
Magnussen, 2012, p. 44; Winter & Smith, 2006, p. 13; Xia & Lee, 2004, p. 69),
with complexity cited as a failure factor in a number of studies (for example,
Charette, 2005; Tiwana & Keil, 2004; Wohlin & Andrews, 2002). This view can
be traced back to the early 1980s in that the management of OISD projects “is a
very complex undertaking in which a complex network of interrelationships and
interactions exists” (Abdel-Hamid & Madnick, 1983, p. 346).
Although the conceptual causal relationship models offered by prior research in
the field (see p. 63) are useful for developing understanding of the interaction of

Chapter 6. Discussion
254
IS and OISD project success factors, they have a number of limitations. In
particular, all of the studies address only a small number of key success factors
and causal chains. Their treatment of causal loops and success criteria is also
limited. Thus, they represent relatively simple scenarios, requiring the addition
of more success factors, relationships and criteria to provide a better
representation of complex OISD projects (Kim, 2004, p. 28; King & Burgess,
2008, p. 430). As this simplicity does not reflect the complex nature of
contemporary projects (Bredillet, 2005, p. 3; Crawford, Morris, Thomas, &
Winter, 2006, p. 724; Fortune & White, 2009, p. 37; Winter & Smith, 2006, p.
13), project success factor theory can only be described as weak in its ability to
provide credible explanations of the behaviour of complex, real-world OISD
projects.
Hence, the active network identified by the relationship analysis can be used to
produce a more credible theory for the behaviour of complex, real-world OISD
projects (and possibly broader project types such as IS/IT projects,
organisational technology projects, organisational projects and even projects in
general). Thus the following theory is proposed.
In real-world, supplier-based OISD projects, its incumbent success factors form
a complex active relationship network that serves to deliver the influences of its
success factors to affect project success. The topology of this network
comprises the following constructs:
(1) Multiple base success factors;
(2) Numerous long linear chains per base factor;
(3) Multiple convergence/divergence points with high receptivity and range
values;
(4) Numerous interacting causal loops;
(5) The possible inclusion of small number of success factors that, under
certain conditions, can contribute to project failure;
(6) Core sets of active factors and relationships that govern the network’s
propagation process;
(7) A set of success criteria.

Chapter 6. Discussion
255
The factors representing convergence/divergence points with high receptivity
and range values serve to act as indicators of project performance over the
lifecycle of the project. The inclusion of success criteria can also be used to
determine the success bias/orientation of the project.
In summary, the network topology theory presented above contains elements
that reflect the complex nature of real-world OISD projects. Hence, this theory is
better placed than the simplistic conceptual/theoretical models found in the
research literature to explain the behaviour of real-world OISD projects.
6.5 Contributions made by the findings related to OISD project
success criteria
Although the primary focus of this research project was OISD project success
factors, its findings also provide a number of useful insights into (1) success
criteria for OISD projects and (2) the influence of success factors on OISD
project success (refer to the six research directions presented in Section 6.2.2
above). These findings were derived from both the qualitative success factor
analysis (Chapter 4) and the relationship analysis (Chapter 5).
During the interview process, the participants defined project success using a
variety of success criteria (for example, schedule adherence, client satisfaction,
etc.). These criteria are in accordance with a definition of project success that is
commonly found in the literature i.e. the intended, successful outcome of a
project. The success criteria can also be classified under (1) project
management success and (2) organisational success (see p. 28). The success
criteria for project management success are consistent with those provided in
the literature i.e. schedule, budget and requirements adherence. The same can
be said for the organisational success criteria i.e. client satisfaction and
organisational benefit (client-side). Thus, so far, the findings can be said to
correspond to the existing body of knowledge (as described in the literature
review).
Chapter 6. Discussion
256
6.5.1 Organisational success from the suppliers’ perspective
However, in relation to organisational success, the findings go on to make a
clear distinction between the client and supplier organisations. As this
distinction is not evident in the OISD project success literature, it constitutes a
new dimension for organisational success for OISD projects. Thus, in addition
to client satisfaction and client-side organisational benefit, the findings
demonstrate the importance of benefit and satisfaction for the supplier
organisation.
The research literature has, quite rightly, argued that project success criteria
need to be extended beyond the realm of project management success (as
denoted by the golden triangle) to encompass additional criteria such as
organisational benefit (see p. 28). To recount the view of one interview
participant: “So what if the project was a little over budget or was delivered a
month late,” when it delivered the anticipated benefit to the business (P10).
However, although this provides the opportunity for organisational success to
be measured against important client-side criteria (for example, client-side
benefit and satisfaction), it does not explicitly take the needs of the supplier
organisation into account. And, for supplier-based OISD projects, client-side
benefit and satisfaction are of prime importance.
IS/IT solution providers are commercial organisations that share a common
goal: to make money (see, for example, Goldratt & Cox, 1984). If they were
unable to do so, these organisations would quickly cease to trade. Hence, over
the longer term, the primary criteria, from a supplier’s perspective, are not
related to project management success or client-side organisational success.
On the contrary, their primary success criteria need to reflect their ability to
make money, as determined by the requisite return on investment and net profit
level specified in their business plan/model. Therefore, on a project by project
basis, key criteria will include the net profit derived from each project and, from
a cash flow perspective, the timing of payments from the client.
In addition, supplier-side satisfaction (and enjoyment) is also an important
success criterion. As the interview participants stated, getting paid is important
Chapter 6. Discussion
257
(P5, P22), but projects can also be enjoyable (P23, P28, P33). Extending this,
in particular to the supplier-side project team, satisfaction (or even enjoyment) is
an important part of project life. OISD projects are hard, not just for the project
manager, but for the other stakeholders too. Therefore, it is important that the
project team (and other stakeholders) derive satisfaction from their project
experiences; otherwise productivity is likely to fall and, in the longer term, staff
turnover might increase. And, for a supplier organisation, both of these potential
outcomes can have serious consequences for their OISD projects and their
business in general.
Hence, a contribution to knowledge made by the findings thus far, is the
identification and description of supplier-side organisational success criteria for
OISD projects. These criteria are particularly important for IS/IT solution
providers and, therefore, an additional dimension of project success,
demanding consideration during OISD projects. That said, the other success
criteria identified by the interview participants are also extremely relevant.
Budget adherence underpins financial performance for the client and supplier,
and schedule adherence can also be key to both organisations. Clearly,
requirements adherence is particularly important to the client, but also has
ramifications for the supplier as well. In terms of organisational success, client
satisfaction and benefits are hallmarks of a successful project and reflect the
reasons why the project was undertaken in the first place. However, without
criteria to measure the supplier’s ability to make money and, to a lesser extent,
the satisfaction of their staff, supplier organisations would soon cease to exist;
hence, demonstrating the significance of these criteria for supplier-based OISD
projects.
6.5.2 OISD project success criteria as influencers
The research literature makes a clear distinction between success factors and
success criteria. Indeed, they may be considered as mutually exclusive. As
previously discussed (see p. 27), theory states that success factors influence
project success whereas success criteria are measures of project success.
Thus, although success criteria are measurements, they are, in no way,

Chapter 6. Discussion
258
influencers. However, the relationship analysis carried out as part of this
research project, suggests that these definitions are overly simplistic. Indeed,
this research provides evidence that OISD success criteria are, in fact,
influencers; not only as indicators of project success, but also as influencers of
other success criteria and success factors. In addition, project success can also
be shown to influence the success of subsequent projects. Consider, for the
sake of argument, two examples presented in the previous chapter; as depicted
in Figures 6.1 and 6.2 respectively.
act:c-o:buy-in
-p->
cri:p-deliverable:utilisation-by-c-o
-p->
cri:project:benefit\to-c-o
-p->
cri:c-o:satisfaction
-p->
cri:c-o:repeat-business-from
-p->
suc:project:success
Figure 6.1. An active chain with success criteria influencing other success criteria (replicated from Figure 5.16)
act:c-o:competence\sales-process
-p->
act:s-o:relationship-with-c-o
-p->
cri:c-o:satisfaction
-p->
act:c-o:willingness-to-pay-for-project
-p->
cri:project:profitability\to-s-o
-p->
suc:project:success
Figure 6.2. An active chain with a success criterion influencing a success factor
(replicated from Figure 5.17)
In the relationship data set, success criteria were modelled as indicators of
project success. Consequently, the active relationship network provided
numerous examples of success factors influencing project success via a limited

Chapter 6. Discussion
259
number of success criteria. However, the findings also revealed examples of
success criteria influencing other success criteria (refer to Figure 6.1) and, also,
success criteria influencing success factors (refer to Figure 6.2). These findings
suggest that it is overly simplistic to define success criteria solely as
measurements of project success. Not only are success criteria indicators of
project success (and, hence, can be said to influence project success), but they
are influencers, not only of other success criteria, but also of success factors.
A similar argument can be made for project success. Again, consider an
example presented in the previous chapter (see p. 220). As Figure 6.3 shows,
project success can also act as a success factor, albeit, not by influencing itself,
but by influencing the success of subsequent projects performed for the same
client.
suc:project:success
-p->
act:s-o:partnership-with-c-o
-p->
act:s-o:relationship-with-c-o
-n->
act:c-o:politics
-p->
art:requirements:scope-creep
-p->
pro:project:cost
-n->
cri:project:adherence\p-budget
-p->
suc:project:success
Figure 6.3. The influence of project success on future projects (replicated from Figure 5.14)
These findings also represent a contribution to knowledge (and theory, as
discussed in the next section). The examples described above (and others
contained in the active relationship network) blur the distinction provided in the
literature that success factors and success criteria (and, for that matter, project
success) are mutually exclusive. Clearly, for supplier-based OISD projects,
there are cases in which they are not. Indeed, the interview data provided
examples of success criteria being identified as such by one participant and as

Chapter 6. Discussion
260
a success factor by another. Therefore, it seems reasonable to modify current
theory by suggesting that success criteria are actually success factors (and,
hence, influencers) identified by certain stakeholder groups as criteria for
measuring project success.
6.5.3 The relative importance of OISD project success criteria
The literature contains a number of studies that have investigated the influence
of a given success factor on project success. These studies have been carried
out for OISD, IS/IT and generic projects (see p. 60) and their results determine
if the factor under investigation has a positive, negative or no influence on
project success. Success criteria are not normally taken into account as part of
these investigations.
Rank Success criteria
Relative
activity
level
1 cri:c-o:satisfaction 100
2 cri:project:benefit\to-c-o 63
3 cri:project:adherence\requirements 63
4 cri:project:adherence\p-budget 53
5 cri:c-o:payment-from 49
6 cri:project:profitability\to-s-o 34
7 cri:c-o:repeat-business-from 33
8 cri:p-deliverable:utilisation-by-c-o\end-users 32
9 cri:c-o\p-board:satisfaction 31
10 cri:c-o\end-users:satisfaction 26
11 cri:project:adherence\schedule 26
12 cri:p-deliverable:utilisation-by-c-o 26
Table 6.6. The 12 most active success criteria in the active relationship network (replicated from Table 5.8)
As discussed in the previous section, the relationship analysis conducted as
part of this research, did take success criteria into account. This enabled the
analysis to calculate the activity levels of individual success criteria. The
analysis revealed that the factors contained in the active relationship network
Chapter 6. Discussion
261
had a greater effect on certain criteria than they did on others (as shown in
Table 6.6).
As Table 6.6 shows, the factors in the active relationship network, when taken
as a whole, have a greater effect on client satisfaction than any other success
criterion. Put another way, this shows that, based on the overall effect of their
success factors, supplier-based OISD projects are oriented towards client
satisfaction. Indeed, as client benefit ranks 2nd in Table 6.6, supplier-based
OISD projects can be viewed as being oriented towards organisational success
(as defined in the literature; 28). However, as the highest positioned supplier-
oriented organisational success criterion ranks only 5th in Table 6.6, it would
seem that client-side organisational success assumes a greater significance
than supplier-side organisational success. A similar differential can also be seen
for project management success i.e. supplier-based OISD projects are more
oriented towards requirements and budget adherence (ranked 3rd and 4th
respectively) than they are to schedule adherence (ranked 11th).
In summary, the research literature recognises that, within the golden triangle,
budget, schedule and requirements adherence might not be equally important
(see p. 19). For example, schedule adherence might be preferred over budget
adherence. A contribution to knowledge made by this analysis is the suggestion
that, for project management success, supplier-based OISD projects are more
oriented towards requirements adherence and, to a lesser extent budget
adherence; but significantly less so to meeting the project’s due date.
However, the primary focus of supplier-based OISD projects seems to be client-
side organisational success (client satisfaction followed by client benefit),
although this is at the expense of supplier-oriented organisational success
(payment from the client, etc.). Although this might seem to contradict the
argument presented in Section 6.5.1 that supplier-oriented organisational
success is of prime importance, a better interpretation seems to be that
supplier-oriented organisational success is best served by focussing on client-
side organisational success.

Chapter 6. Discussion
262
6.6 Additional contributions
In addition to the primary contributions to knowledge and theory presented
above, this research project also provided a number of additional contributions.
These contributions are described in this section.
6.6.1 The literature review as a contribution to knowledge
The literature review should also be considered as a contribution to knowledge
in its own right. With a few exceptions (most notably, Ika, 2009), there is a lack
of articles with the sole purpose of performing a comprehensive review of
literature covering research into project success factors (and related topics such
as project success and project success criteria). A comprehensive literature
review for OISD project success factors has yet to be published. Unfortunately,
for project management, all too many researchers are not familiar with the
“depth of literature” in the field and are failing to acknowledge the contributions
made by prior research (Morris, 2010, p. 143). Consequently, the publication of
articles containing comprehensive literature reviews would serve to enhance
understanding of the literature and assist knowledge development in the field of
OISD project success factors. In this respect, the literature review presented in
this thesis assists in satisfying this need. By performing a critical review of the
literature in the field and, thereafter, deriving appropriate recommendations for
further research, the literature review represents a contribution to knowledge in
the field of OISD project success factors, by either its inclusion in a PhD thesis
or its potential for future publication.
6.6.2 Implications for project management theory
Whilst discussing the background to this research project, project management
was subjected to ample criticism regarding its theoretical basis (see p. 22) and
bodies of knowledge (see p. 24). In particular, project management theory was
criticised for being predominantly normative and, as such, not reflecting the
actuality of real-world projects. In addition to being similarly berated, project
management’s bodies of knowledge were also accused of treating all projects
as a homogeneous concern and thus failing to explain how project management
can be applied to different types of project. However, although these

Chapter 6. Discussion
263
shortcomings appear to be valid, the findings of this research project suggest
that the criticisms noted above might be somewhat overstated.
In the literature review, Turner’s theory on project management was cited as
typifying normative project management theory. This was because its
corollaries (predominantly processes) and roles (listed in Appendix 2.1) are
representative of the normative project management material that dominates
the project management literature (see p. 22). Interestingly, many of the entity-
based success factors identified by the interview participants (listed in Table
6.2) reflect Turner’s corollaries and roles. For example, in terms of roles, both
lists (Appendix 2.1 and Table 6.2) contain the project manager and project
team, while other roles in Turner’s theory can be found in the narratives
provided for each success factor; for example, end users and the project
sponsor. Similarly, a number of processes cited by the interviewees as success
factors also appear in Turner’s theory as corollaries; for example, risk
management, requirements management and project planning (an aspect of
time management). In addition, Turner’s project contract and procurement
management can be considered as the client’s perspective of the sales process
cited by the interview participants. Finally, from these thick, rich narratives,
references to other processes cited in Turner’s theory can be found; for
example, resource management, benefits management and project
management (management of the project).
Another feature of the interviews was that they contain no criticisms of the
normative success factors (also found in Turner’s theory) identified by the
interview participants. Instead, the interviewees were prone to provide criticisms
regarding the misuse (or abuse) of certain normative processes; for example,
risk management, the sales process and project planning. Therefore, given
these criticisms, and the evidence provided in the previous paragraph, it would
seem that the interviews provide a degree of support for normative project
management. And, by providing various examples of normative processes and
roles in real-world OISD projects, the overall view of interview participants
would seem to indicate that the criticisms presented in the literature review are,
at least in part, unwarranted.

Chapter 6. Discussion
264
Project type Definition
OISD Projects that involve bespoke software development to deliver an information system for end users in a host organisation.
Information system (IS/IT)
Projects that deliver an information system for end users in a host organisation e.g. an enterprise resource planning (ERP) implementation project.
Organisational technology
Projects that deliver a technology product for end users in a host organisation e.g. a project to introduce a new manufacturing technology to production operatives.
Organisational Projects not involving the delivery of a technology product in a host organisation (most likely some kind of organisational change) e.g. a business process re-engineering (BPR) project.
Generic Projects that require the use of generic project management principles e.g. a new product development (NPD) project.
Table 6.7. Project types (replicated from Table 2.3)
This research also produced findings that relate to the extent to which project
management can be applied to different types of project. As part of the success
factor analysis (conducted as part of the literature review) and also the
relationship analysis (presented in Chapter 5), all of the success factors
identified were assigned to one of five project types (as listed in Table 6.7).
Project type
Literature review
success factor
analysis
Relationship analysis
Base factor activity
Receptive factor
activity
OISD 5% 5% 3%
IS/IT 4% 5% 4%
Organisational technology 9% 1% 0%
Organisational 21% 13% 15%
Generic 61% 77% 78%
Table 6.8. OISD project success factors activity levels by project type (derived from Tables 2.9 and 5.10)
The results of these analyses (presented in Table 6.8) show that, in terms of
OISD and related project types, generic project management, as espoused in
the literature, is not sufficient to apply to all of the success factors that are
pertinent to OISD and IS/IT projects. However, what the results do show is that

Chapter 6. Discussion
265
the success factors for OISD projects (and IS/IT projects) are related
predominantly to generic and, to a lesser extent, organisational project types.
Indeed, the proportions provided for generic and organisational project types in
Table 6.8 are most probably understated as the proportions provided for OISD
and IS/IT project types relate more to delivery process (those concerned with
producing the project’s deliverable) than project management processes.
Hence, it can be concluded that a high proportion of project management theory
and/or best practices, as purported in the normative project management
literature (for example, the project management bodies of knowledge) is
relevant, and therefore transferrable, to OISD and IS/IT projects.
6.6.3 The fieldwork process as a contribution to knowledge
Although the research instruments described in Chapter 3 are by no means
original or exclusive to this research project, their collective use does constitute
a fieldwork approach that has not been employed by previous OISD project
success factor studies. And, given that this research project has produced
original contributions to both knowledge and theory (as discussed above), the
fieldwork approach can also be considered as a contribution in its own right. For
example, it has the potential to be used, and perhaps adapted and/or improved,
for future research studies in both academic and professional contexts.
In this respect, a number of aspects of the fieldwork approach merit discussion.
First, the fieldwork identified and adopted a specific syntax (comprising entities
and characteristics) to represent success factors throughout the course of the
research. In addition to providing consistency throughout the project, the syntax
is also ideally suited for success factor modelling by means of simulation
software or contemporary object-oriented languages (for example, Java or C#).
The use of semi structured interviews, more reminiscent of open ended
interviews61, also proved particularly effective is gathering data for the
qualitative and quantitative (network) analyses. Not only did this approach allow
61 Given that the main part of the interview concentrated on the main research question.

Chapter 6. Discussion
266
the qualitative analysis to identify 20 entity-based success factors, but it
provided the basis for rich, thick descriptions for each of the factors. The
significance of these descriptions should not be undervalued. First, they
enhance understanding of the actuality of real-world OISD projects. Second,
they reveal that entity-based success factors are not mutually exclusive and,
more so, comprise collections of more detailed success (and failure) factors and
relationships between them. Finally, the relationship analysis was used to
quantitatively analyse the detailed factors contained in the interview transcripts
and also the relationships between these factors (as well as various success
criteria and project success). The results of this analysis revealed an active
relationship network which, being more extensive than those presented by prior
studies, and exhibiting certain characteristics in terms of its topology, is better
suited to explaining the behaviour and complexities of contemporary, real-world
OISD projects.
6.7 Conclusion
This chapter has presented the contributions to knowledge and theory provided
by this research project. The scope of these contributions is both wide and
varied. The identification and description of 20 entity-based success factors
enhances understanding of the actuality of real-world, supplier-based OISD
projects. Similarly, the active network produced by the relationship analysis has
shown that the way in which success factors influence project success is a
complex process, again more representative of the actuality of real-world
projects. Hence, the active network was used as a basis for a network topology
theory that might better explain the behaviour of complex OISD projects. A
number of lesser contributions to knowledge and theory were also made in
relation to OISD project success criteria. Finally, a number of additional
contributions were described. In summary, the contributions presented in this
chapter enhance understanding of the actuality of real-world supplier-based
OISD projects and improve upon the theoretical basis for OISD project success
factors.

Chapter 6. Discussion
267
Hence, all that remains to complete this thesis is a reflective discussion of its
content thus far with emphasis on aspects such as how well the original
research objectives have been met, the fitness for purpose of the research
methodology and recommendations for further research. This discussion is
provided in the next and final chapter.

Chapter 7. Conclusions
268
7. Conclusions
7.1 Introduction
The purpose of this chapter is to reflect upon the work described thus far and
offer pertinent conclusions for the thesis. In the next section, the extent to which
the project has met its research aims and objectives is discussed. This is
followed by a discussion of the fitness for purpose of the research methodology.
Next, a number of recommendations for further research are presented. The
chapter ends with conclusions for the thesis as a whole.
7.2 Meeting the original research objectives
The aim of this research project was to provide a better understanding of the
reasons why OISD projects succeed or fail. Achieving this aim required a critical
review of the research literature for OISD project success factors and closely
related subject areas. The literature review gave rise to two specific research
objectives, both of which are discussed below.
7.2.1 Research objective 1: To provide a better understanding of OISD
project success factors from a suppliers’ perspective
To satisfy the first research objective, this research project investigated success
factors for OISD projects from the perspective of IS/IT solution suppliers in
central Scotland.
20 success factors for supplier-based OISD projects were identified and
described. The thick, rich descriptions provided for each factor enhance
understanding of the actuality of real-world OISD projects. These descriptions
also revealed that each of the 20 factors comprised a range of more detailed
factors and relationships. The importance of several factors found in the
predominantly in-house/client OISD project success factor literature was
confirmed; for example, effective requirements management and effective
communication. A number of additional factors were also identified; for
example, an effective sales process and an effective project start-up, as were

Chapter 7. Conclusions
269
some notable omissions; for example, project board supportiveness. Hence,
important differences between supplier and client perspectives were revealed.
Understanding of a variety of factors, poorly described in the OISD project
success factor literature, was also enhanced.
7.2.2 Research objective 2: To provide a better understanding of the way
in which OISD project success factors interact to influence project
success
To satisfy the second research objective, this research project conducted a
relationship analysis of OISD project success factors at a detailed level. In
summary, the analysis investigated the way in which success factors
propagated their influences to affect project success. The findings of this
analysis greatly surpassed the expectations of the researcher.
The way in which OISD project success factors propagate their influences to
affect project success was revealed to be a complex phenomenon comprising a
sizeable network of active factors. The topology of the network can be
described by the following constructs:
(1) Multiple (916) base success factors;
(2) Numerous long linear chains per base factor (on average, 122 million per
factor, with an average length of 35 factors/relationships, resulting in a
total of 114 billion linear chains);
(3) Multiple (98) convergence/divergence points with high receptivity (8.8)
and range (3.9) values;
(4) Numerous (2.94 million) interacting causal loops;
(5) A small number of success factors that, under certain conditions, can
contribute to project failure (for example, the project team’s staffing
level);
(6) Core sets of (133) active factors and (361) relationships that govern the
network’s propagation process;
(7) A set of (12) success criteria.
The most active factors in the network; those located at convergence/
divergence points with high receptivity and range values were also shown to be

Chapter 7. Conclusions
270
significant, in that they can be used to determine project performance over the
lifecycle (or sections thereof) of the project. The three most active factors were
found to be (1) the requirement’s fitness for purpose, (2) the project’s duration
and (3) the number of project issues. The inclusion of success criteria also
allowed the network to provide an indication of success bias for supplier-based
OISD projects.
The active network described above was found to be more representative of
contemporary, complex OISD projects than the simplistic causal models
provided by prior research. Hence, the network topology described above was
used to provide a more satisfactory theory that better explains the way in which
success factors propagate their influences to affect OISD project success.
7.2.3 An implicit research objective: To provide a better understanding of
OISD project success criteria
This research project did not set out to provide a better understanding of OISD
project success criteria. Indeed, the question: “How do you define project
success?” was only added to the interview process to provide context for the
main research question62. With hindsight, the significance of this contextual
question was underestimated. Indeed, the question, “How can you say what the
correct success factors are until you have identified the criteria?” (Turner, 1996
cited by Ika, 2009, p. 9) implies that the question: “How do you define project
success?” in its own right gives rise to a third research objective, albeit
implicitly: to provide a better understanding of OISD project success criteria.
Various success criteria (for example, budget adherence and client satisfaction)
were identified as indicators of project management success and organisational
success. Some of these criteria (for example, supplier satisfaction and supplier-
side project profitability) are not described in the literature and, hence identify a
new supplier-side dimension for OISD project success. Supplier-based OISD
projects were also found to be (1) oriented more towards organisational
62 And also to help prevent interviewee lockjaw.

Chapter 7. Conclusions
271
success than project management success and (2) more oriented to towards
client-side than supplier-side organisational success. OISD project success
criteria were also found to extend beyond being measures of success. Not only
are success criteria indicators of project success, but they can be seen to
influence success factors and other success criteria.
7.2.4 Additional contributions to knowledge provided by this research
project
Over and above the findings described above, this research project provided
three additional contributions. As discussed in Chapter 6 (see p. 262) these are
(1) the literature review and (2) the fieldwork process as contributions to
knowledge, and (3) the implications for project management theory based on
the findings of this research. Although these contributions are of a lesser stature
than those described above, they do assist in further demonstrating the
achievements made by this research.
7.2.5 A summary of the contributions provided by this research project
The findings for this research represent important and original contributions to
knowledge and theory. The findings are both wide and varied. Not only do they
identify and describe 20 factors that contribute to supplier-based OISD project
success, but the way in which these factors, at a detailed level, propagate their
influences to affect project success is shown to be phenomenally complex.
These findings make important contributions to knowledge by describing the
actuality of real-world OISD projects. The active network revealed by the
relationship analysis also makes an important contribution to OISD project
success factor theory. The implicit and additional findings discussed above also
make contributions, albeit to a lesser extent, to knowledge and theory. All in all,
the findings show that the concepts of OISD project success factors and
success criteria are far more complicated than portrayed in the literature. Thus,
the project’s research objectives can be considered to have been met; and the
overall research aim: to provide a better understanding of the reasons why
OISD projects succeed or fail, to be satisfied.

Chapter 7. Conclusions
272
7.3 Fitness for purpose of the research methodology
The research methodology proved particularly effective in fulfilling the research
objectives described above. Yet, the chosen research methodology is important
and should be evaluated independently of the research outcomes (Hall, 2004,
p. 194). Here, the research methodology described in Chapter 3 is reviewed in
relation to the strengths and weaknesses (and also difficulties and limitations) of
the approach.
Commencing with the weaknesses, a number of these were to be expected,
especially as this was a student research project conducted by a solitary
researcher. For example, endeavouring to secure additional, similarly-skilled
researchers to assist in the project (for researcher triangulation) proved
particularly difficult. Other difficulties (see p. 117) were of a more generic
nature; that is, they represent potential risks for socially-oriented qualitative
research projects in general. Although comparing favourably to the numbers
involved in similar studies, fewer participants than anticipated were secured for
the data collection process. Also, despite the use of coding books and a
predefined syntax for the representation of success factors, the coding
processes employed in the qualitative and quantitative (relationship) analyses
still retained degrees of subjectivity. Indeed, the relationship analysis, as a
rudimentary network analysis, might have been performed using more elaborate
instruments; perhaps utilising those associated with the field of network theory.
Difficulties resulting from the size of the relationship network in relation to the
propagation software also represents a potential weakness, although the
arguments presented in Chapter 3 (see p. 381) serve to nullify this issue.
Despite these weaknesses, the research methodology exhibits several
strengths. The decision to utilise a predominantly qualitative approach was
justified by the literature review. The use of open ended questions in the
interviews was also a significant strength as it provided sufficient rich, thick
descriptions to support both qualitative and quantitative analyses. However, the
key strengths of the research methodology can be attributed to the measures
implemented to ensure the validity and reliability of the research findings (see p.

Chapter 7. Conclusions
273
119 and p. 123 respectively). In summary, the strengths of the research
methodology more than compensated for its weaknesses and, hence, the
research methodology can be considered fit for purpose in relation to achieving
the project’s aims and objectives.
7.4 Recommendations for further research
A number of key recommendations for further research were identified by this
research project. These recommendations are discussed below (and a number
of more general recommendations presented in Appendix 7.1).
7.4.1 Research into success factors for supplier-based OISD projects from
the suppliers’ perspective
The literature review made a clear case for further research into OISD project
success factors from the supplier’s perspective. The literature review also
suggested that this would be achieved best through empirical studies of a
qualitative nature. In particular, the provision of thick, rich description would
greatly enhance understanding of the actuality of success factors for real-world
OISD projects.
This research has gone some way to address this need. However, there is still a
requirement for additional studies to confirm or refute the findings of this and
other studies into OISD project success factors from a supplier’s perspective.
Hence, there is still considerable scope for additional work, not least to perform
research in different cultural and geographical locations. For example, to date
there have only been two studies performed in Europe: this research project
and Moynihan (1996). Therefore, studies performed in other European
countries would allow comparison of the perspectives of IS solution suppliers
across Europe.
7.4.2 Relationship analyses of OISD project success factors
This research project suggests that the way in which success factors influence
project success is a complex phenomenon. For example, the relationship
analysis revealed an active network containing nearly one thousand base
success factors that, collectively, influenced project success through 114 billion

Chapter 7. Conclusions
274
causal chains. The identification of nearly three million causal loops showed
that this process is so complicated, that it may be described as a complex
phenomenon. As the active network was found to be more representative of
contemporary, complex OISD projects than the simplistic causal models
provided by prior research, the findings of the relationship analysis were
extended to provide a more satisfactory theory that helps explain the way in
which success factors propagate their influences to affect real-world OISD
project success.
Thus, further research is required to confirm, refute or improve upon the
findings of the relationship analysis and the resultant theory in relation to their
application to supplier-based OISD projects in general. Indeed, it is possible
that the theory provided by the relationship analysis is applicable to a wider
range of project types. Hence, there is the opportunity to perform research
beyond the scope of OISD projects; for example, relationship and network
analyses for IS/IT projects, organisational projects and even projects in specific
industry sectors; for example, pharmaceuticals and utilities.
7.4.3 Research to enable OISD success factor modelling
Comprehensive understanding of OISD success factors and the way in which
they affect project success is unlikely to be achieved until success factors can
be modelled using computer simulation techniques. But, as discussed in the
literature review, a great deal of preparatory research is required before
simulation techniques can be applied to OISD project success factors.
This research project has taken a small step in preparing the data required for
the simulation of OISD project success factors. It has identified a range of
detailed factors that had not been identified by prior studies. These factors have
been presented as entity-characteristics, a format ideally suited for object-
oriented software development and contemporary computer simulation
techniques. More importantly, this research has revealed a complex active
network containing 916 success factors, 14 success criteria and 1,449 unique
relationships between the factors, criteria and project success. This network
constitutes the basis for a computer simulation of OISD project success factors.
Chapter 7. Conclusions
275
Indeed, the propagation software developed as part of this research project
could be described as an extremely simple simulation tool.
However, a great deal more research is required before a comprehensive
computer simulation can be performed. For example, the relationship analysis
in this research project only addressed factor activity levels. It did not address
factor magnitude (instead, assuming that each factor had equal magnitude).
Similarly, the time taken by a source factor to influence a target factor was not
taken into account (instead, this was assumed to happen instantaneously).
Factors were also considered to be mutually exclusive in terms of their causal
chain sets. In addition, the consequences of a target factor being influenced
simultaneously by the influences of multiple source factors were ignored.
Finally, influence types were modelled simplistically i.e. as either positive or
negative.
Further research is required to address all of the above and other aspects
required for the development of realistic computer simulations of OISD project
success factors. In addition, there is also a need for more relationship and
network analyses to confirm, refute or build upon the findings of this research.
7.5 Conclusions from the research
This chapter has presented the conclusions for this research project. The
discussion has shown that the project’s research aims and objectives have
been met and that it has made original contributions to knowledge and theory.
The fitness for purpose of the research methodology was also shown to be
satisfactory when assessed in terms of its strengths and weaknesses. A
number of avenues for further research were also recommended.
In the introduction to this thesis it was argued that the notion of project success
factors was an alluring concept (see p. 1). By attracting numerous researchers,
a large number of OISD project success factors have been identified.
Researchers have also shown that a number of factors have a positive
influence on IS/IT and OISD project success. Unfortunately, research has done
little to describe what these factors actually are. In addition, research into the

Chapter 7. Conclusions
276
interaction of success factors has been restricted to relatively few factors. As a
result, the literature still presents OISD project success factors as a relatively
simple concept.
This thesis has offered a fresh perspective. The findings of this research
suggest that the concept of OISD project success factors, at least from the
perspective of Scottish IS solution suppliers, is far from simple. Although the
research identified 20 entity-based success factors, these were found to
comprise a range of more detailed factors and relationships between them.
More so, the way in which OISD project success factors propagate their
influences to affect project success was shown to be highly complex. Even
success criteria were shown to be more complicated than presented in the
project success literature. Hopefully, this new perspective; that OISD project
success factors are actually a highly complex phenomenon, will attract the
attention of researchers and that future studies will build upon the findings of
this research project.

Reference list
277
Reference list
Abdel-Hamid, T. K., & Madnick, S. E. (1989). Lessons learned from modelling
the dynamics of software development. Communications of the ACM, 32(12),
1426-1455.
Abdel-Hamid, T. K., & Madnick, S. E. (1983). The dynamics of software project
scheduling. Communications of the ACM, 26(5), 340-346.
Agarwal, N., & Rathod, U. (2006). Defining 'success' for software projects: An
exploratory revelation. International Journal of Project Management, 24(1),
358-370.
Agourram, H., & Robson, B. (2006). Defining information systems success in
Canada. Information Management & Computer Security, 14(4), 300-311.
Ahonen, J. J., & Savolainen, P. (2010). Software engineering projects may fail
before they are started: Post-mortem analysis of five cancelled projects. The
Journal of Systems and Software, 83(11), 2175-2187.
Akkermans, H., & van Helden, K. (2002). Vicious and virtuous cycles in ERP
implementation. European Journal of Information Systems, 11(1), 35-46.
Alojairi, A., & Safayeni, F. (2012). The dynamics of inter-node coordination in
social networks: A theoretical perspective and empirical evidence.
International Journal of Project Management, 30(1), 15-26.
Altuwaijri, M. M., & Khorsheed, M. S. (2012). InnoDiff: A project-based model
for successful IT innovation diffusion. International Journal of Project
Management, 30(1), 37-47.
Andersen, E. S., Birchall, D., Jessen, S. A., & Money, A. H. (2006). Exploring
project success. Baltic Journal of Management, 1(2), 127-147.
Anthony, R. N., Dearden, J., & Vancil, R. F. (1972). Management control
systems. Homewood: Irwin.
Arber, S. (2001). Designing samples. In N. Gilbert (Ed.), Researching social life
(2nd ed., pp. 58-82). London: Sage Publications.
Atkinson, R. (1999). Project management: Cost, time and quality, two best
guesses and a phenomenom, it's time to accept other success criteria.
International Journal of Project Management, 17(6), 337-342.

Reference list
278
Averweg, U. R., & Erwin, G. J. (1999). Critical success factors for
implementation of decision support systems in South Africa. Proceedings of
the 32nd Hawaii International Conference on System Sciences, (pp. 1-10).
Hawaii, USA.
Avots, I. (1969). Why does project management fail? California Management
Review, 12(1), 77-82.
Baccarini, D. (1999). The logical framework method for defining project
success. Project Management Journal, 30(4), 25-32.
Baker, B. N., Murphy, D. C., & Fisher, D. (1988). Factors affecting project
success. In D. I. Cleland, & W. R. King, Project Management Handbook. New
York: Van Nostrand Reinhold.
Bannerman, P. L. (2008). Risk and risk management in software projects: A
reassessment. The Journal of Systems and Software, 81(12), 2118-2133.
Barki, H., Rivard, S., & Talbot, J. (1993). Toward an assessment of software
development risk. Journal of Management Information Systems, 10(2), 203-
25.
Basten, D., Joosten, D., & Mellis, W. (2011). Managers' perceptions of
information system project success. The Journal of Computer Information
Systems, 52(2), 12-21.
Bechtold, J. (2003). Planning and managing the development of complex
software systems. CrossTalk: The Journal of Defense Software Engineering,
16(5), 23-26.
Beckley, G. B., & Gaines, M. (1991b). Implementation of business systems is as
important as the hardware. The CPA Journal, 61(2), 61-63.
Beckley, G. B., & Gaines, M. (1991a). Implementing business systems: What
the CEO can do to ensure success. Industrial Management, 33(2), 25-26.
Belassi, W., & Tukel, O. I. (1996). A new framework for determining critical
success/failure factors in projects. International Journal of Project
Management, 14(3), 141-151.
Belout, A., & Gauvreau, C. (2004). Factors influencing project success: The
impact of human resource management. International Journal of Project
Management, 22(1), 1-11.

Reference list
279
Bernroider, E. W., & Ivanov, M. (2011). IT project management control and the
Control Objectives for IT and related Technology (CobiT) framework.
International Journal of Project Management, 29(3), 325-336.
Berntsson-Svensson, R., & Aurum, A. (2006). Successful software project and products: An empirical investigation. Proceedings of the 2006 ACM/IEEE International Symposium on Empirical Software Engineering, (pp. 144-153). Rio de Janeiro, Brazil.
Bharadwaj, A., Keil, M., & Mähring, M. (2009). Effects of information technology
failures on the market value of firms. Journal of Strategic Information
Systems, 18(2), 66-79.
Bloom, N. L. (1996). Selecting the right IS project manager for success.
Personnel Management, 75(1), 6-9.
Blumer, H. (1969). Symbolic interactionism: Perspective and method.
Englewood Cliffs: Prentice Hall.
Bredillet, C. N. (2005). Reconciling uncertainty and responsibility in the
management of projects. Project Management Journal, 36(3), 3.
British Computer Society. (2004). The challenges of complex IT projects [Digital
version]. Retrieved October 2nd, 2011, from http://www.ceid.upatras.gr/tech_
news/challengesIT.pdf
Brocke, H., Uebernickel, F., & Brenner, W. (2009). Success factors in IT-
projects to provide customer value propositions. Proceedings of the 20th
Australasian Conference on Information Systems, (pp. 1-10). Melbourne,
Australia.
Brooks, F. P. (1975). The mythical man-month. Reading: Addison Wesley.
Bryde, D. (2008). Perceptions of the impact of project sponsorship practices on
project success. International Journal of Project Management, 26(8), 800-
809.
Bullen, C. V., & Rockart, J. F. (1981). A primer on critical success factors
[Electronic version]. Retrieved October 10th, 2011, from
http://mit.dspace.org/bitstream/handle/1721.1/1988/SWP-1220-08368993-
CISR-069.pdf?sequence=1
Bussen, W., & Myers, M. D. (1997). Executive information system failure: A
New Zealand case study. Journal of Information Technology, 12(2), 145-153.

Reference list
280
Butler, T., & Fitzgerald, B. (1999). Unpacking the systems development
process: An empirical application of the CSF concept in a research context.
Journal of Strategic Information Systems, 8(4), 351-371.
Cash, C. H., & Fox, R. (1999). Elements of successful project management.
Journal of Systems Management, 43(9), 10-12.
Cerpa, N., & Verner, J. M. (2009). Why did your project fail? Communications of
the ACM, 52(12), 130-134.
Chambers. (2003). The Chambers Dictionary (9th ed.). Edinburgh: Chambers
Harrap Publishers.
Charette, R. N. (2005). Why software fails. IEEE Spectrum, 42(9), 42-49.
Chiang, I. R., & Mookerjee, V. S. (2004). Improving software team productivity.
Communications of the ACM, 47(5), 89-93.
Chow, T., & Cao, D. (2008). A survey study of critical success factors in agile
software projects. Journal of Systems and Software, 81(6), 961-971.
Christensen, D., & Walker, D. H. (2004). Understanding the role of vision in
project success. Project Management Journal, 35(3), 39-52.
Christensen, D., & Walker, D. H. (2008). Using vision as a critical success
element in project management. International Journal of Managing Projects
in Business, 1(4), 611-622.
Cicmil, S., & Hodgson, D. (2006). New possibilities for project management
theory: A critical engagement. Project Management Journal, 37(3), 111-122.
Cicmil, S., Hodgson, D., Lindgren, M., & Packendorff, J. (2009). Editorial:
Project management behind the façade. Ephemera: Theory & politics in
organization, 9(2), 78-92.
Cicmil, S., Williams, T., Thomas, J., & Hodgson, D. (2006). Rethinking project
management: Researching the actuality of projects. International Journal of
Project Management, 24(8), 675-686.
Clarke, A. (1999). A practical use of key success factors to improve the
effectiveness of project management. International Journal of Project
Management, 17(3), 139-145.
Cleland, D. I. (1986). Measuring success: The owner's viewpoint. Proceedings
of the 18th Annual Seminar/Symposium (pp. 6-12). Montreal, Canada: Project
Management Institute.

Reference list
281
Cobb, M. (2004). Unfinished voyages: A follow up to the CHAOS report [Digital
version]. Retrieved October 2nd, 2011, from
http://www.umflint.edu/~weli/courses/bus381/assignment/vo.pdf
Cooke-Davies, T. (2004). Project success. In P. W. Morris, J. K. Pinto, P. W.
Morris, & J. K. Pinto (Eds.), The Wiley guide to managing projects (pp. 99-
122). Hobeken: John Wiley.
Cooke-Davies, T. (2002). The real success factors on projects. International
Journal of Project Management, 20(3), 185-190.
Cooke-Davies, T. (2003). Why APM should foster, encourage and support
international research. In D. Boyce, J. McLaughlin, M. McKinlay, R. Stoddart-
Stones, & T. Williams, APM Yearbook 2003/2004 (pp. 77-78). Leighton
Buzzard: Impact.
Crawford, L., Morris, P., Thomas, J., & Winter, M. (2006). Practitioner
development: From trained technicians to refective practitioners. International
Journal of Project Management, 24(8), 722-723.
Creswell, J. W. (2012). Qualitative inquiry and research design: Choosing
among five approaches (3rd ed.). London: Sage Publications.
Creswell, J. W., & Clark, V. L. (2007). Designing and conducting mixed methods
research. London: Sage Publications.
Creswell, J. W., & Miller, D. L. (2000). Determining validity in qualitative inquiry.
Theory Into Practice, 39(3), 124-130.
Crotty, M. J. (1998). The foundations of social research: Meaning and
perspective in the research process. London: Sage Publications.
Daniel, D. R. (1961). Management information crisis. Harvard Business Review,
1961(Sep-Oct), 111-121.
Davis, A. M., Hickey, A. M., & Zweig, A. S. (2004). Requirements management
in a project management context. In P. W. Morris, & J. K. Pinto (Eds.), The
Wiley Guide to Managing Projects (pp. 391-421). Hoboken: Wiley.
de Bakker, K. (2009). Risk management does (not) contribute to project
success. The Risk Register, 11(4), 1-5.
de Bakker, K., Boonstra, A., & Wortmann, H. (2010). Does risk management
contribute to IT project success? A meta-analysis of empirical evidence.
International Journal of Project Management, 28(5), 493-503.

Reference list
282
de Bakker, K., Boonstra, A., & Wortmann, H. (2012). Risk managements'
communicative effects influencing IT project success. International Journal of
Project Management, 30(4).
DeMarco, T., & Lister, T. (1999). Peopleware: Productive projects and teams
(2nd ed.). New York: Dorset House Publishing.
Denscombe, M. (1998). The good research guide: For small-scale social
research projects. Buckingham: Open University Press.
Denzin, N. K. (1978). The research act: A theoretical orientation to sociological
methods (2nd ed.). New York: McGraw-Hill.
Denzin, N. K., & Lincoln, Y. S. (2011). Introduction: The discipline and practice
of qualitative research. In N. K. Denzin, & Y. S. Lincoln (Eds.), The Sage
handbook of qualitative research (pp. 1-19). Thousand Oaks: Sage
Publications, Inc.
Dervin, B. (1997). Given a context by any other name: Methodological tools for
taming the unruly beast. In P. Vakkari, R. Savolainen, & B. Dervin (Eds.),
Information seeking in context (pp. 13-38). London: Taylor Graham.
Drucker, P. F. (1955). The Practice of Management. Oxford: Butterworth
Heinemann.
Dvir, D., & Lechler, L. (2004). Plans are nothing, changing plans is everything:
The impact of changes on project success. Research Policy, 33(1), 1-15.
Dvir, D., Lipovetsky, S., Shenhar, A., & Tishler, A. (1998). In search of project
classification: A non-universal approach to project success factors. Research
Policy, 27(9), 915-935.
Easterby-Smith, M., Thorpe, R., & Jackson, P. R. (2008). Management
research (3rd ed.). London: Sage Publications.
Edinburgh Business Directory. (2008). Retrieved October 22nd, 2008, from
http://www.edinburghdirectory.info
El Sawah, S., Tharwat, A. A., & Rasmy, M. H. (2008). A quantitative model to
predict the Egyptian ERP implementation success index. Business Process
Management Journal, 14(3), 288-306.
Elitzur, R., Gavious, A., & Wensley, A. K. (2012). Information systems
outsourcing projects as a double moral hazard problem. Omega, 40(3), 379-
389.

Reference list
283
Elsevier. (2012). J. Rodney Turner. Retrieved December 19th, 2012, from
http://www.journals.elsevier.com/international-journal-of-project-
management/editorial-board/jrodney-turner/
Eriksson, P., & Kovalainen, A. (2008). Qualitative methods in business
research. London: Sage Publications.
Erlandson, D. A., Harris, E. L., Skipper, B. L., & Allen, S. D. (1993). Doing
naturalistic inquiry: A guide to methods. London: Sage Publications Ltd.
Evans, M. W., Abela, A. M., & Beltz, T. (2002). Seven characteristics of
dysfunctional software projects. Crosstalk: The Journal of Defense Software
Engineering, 15(4), 16-20.
Eveleens, J. L., & Verhoef, C. (2010). The rise and fall of the Chaos report
figures. IEEE Software, 27(1), 30-36.
Ewusi-Mensah, K. (1997). Critical issues in abandoned information systems
development projects. Communications of the ACM, 40(9), 74-80.
Fielding, N., & Thomas, H. (2001). Qualitative Interviewing. In N. Gilbert (Ed.),
Researching Social Life (2nd ed., pp. 123-144). London: Sage Publications.
Fisher, E. (2011). What practitioners consider to be the skills and behaviours of
an effective people project manager. International Journal of Project
Management, 29(8), 994-1002.
Flowers, S. (1996). Software failure: Management failure. Chichester: John
Wiley.
Flyvbjerg, B., Bruzelius, N., & Rothengatter, W. (2003). Megaprojects and risk:
An anatomy of ambition. Cambridge: Cambridge University Press.
Forster, N. S., & Rockart, J. F. (1989). Critical success factors: An annotated
bibliography [Electronic version]. Retrieved October 14th, 2011, from
http://dspace.mit.edu/bitstream/handle/1721.1/2258/SWP-3041-20243692-
CISR-191.pdf?sequence=1
Fortune, J., & White, D. (2006). Framing of project critical success factors by a
systems model. International Journal of Project Management, 24(1), 53-65.
Fortune, J., & White, D. (2009). The project-specific formal system model.
International Journal of Managing Projects in Business, 2(1), 36-52.

Reference list
284
Fowler, A., & Walsh, M. (1999). Conflicting perceptions of success in an
information systems project. International Journal of Project Management,
17(1), 1-10.
Fowler, J. J., & Horan, P. (2007). Are information systems’ success and failure
factors related?: An exploratory study. Journal of Organizational and End
User Computing, 19(2), 1-22.
Gaddis, P. O. (1959). The project manager. Harvard Business Review,
1959(May-Jun), 89-97.
Gaitros, D. A. (2004). Common errors in large software development projects.
Crosstalk: The Journal of Defense Software Engineering, 17(3), 21-25.
Gardiner, P. D., & Stewart, K. (2000). Revisiting the golden triangle of cost, time
and quality: The role of NPV in project control, success and failure.
International Journal of Project Management, 18(4), pp. 251-256.
Gauld, R. (2007). Public sector information system project failures: Lessons
from a New Zealand hospital organization. Government Information
Quarterly, 24(1), 102-114.
Gelbard, R., & Carmeli, A. (2009). The interactive effect of team dynamics and
organizational support on ICT project success. International Journal of
Project Management, 27, 464-470.
Gilbert, N. (2001). Research, theory and method. In N. Gilbert (Ed.),
Researching Social Life (2nd ed., pp. 14-27). London: Sage.
Ginzberg, M. J. (1981). Key recurrent issues in the MIS implementation
process. MIS Quarterly, 5(2), 47-59.
Glass, R. L. (1999). Evolving a new theory of project success. Communications
of the ACM, 42(11), 17-19.
Glass, R. L. (2003). Facts and fallacies of software engineering. Boston:
Addison Wesley.
Glass, R. L. (2004). On modeling and discomfort. IEEE Software, 21(2), 102-
103.
Glass, R. L. (1998). Software runaways. New York: Prentice-Hall.
Glass, R. L. (2006). The Standish report: Does it really describe a software
crisis? Communications of the ACM, 49(8), 15-16.

Reference list
285
Goldratt, E. M., & Cox, J. (1984). The Goal. Aldershot: Gower.
Gorla, N., & Lin, S-C. (2010). Determinants of software quality: A survey of
information systems project managers. Information and Software
Technology, 52(6), 602-610.
Gray, R. J. (2001). Organisational climate and project success. International
Journal of Project Management, 19(2), 103-109.
Guba, E. G., & Lincoln, Y. S. (1981). Effective evaluation: Improving the
usefulness of evaluation results through responsive and naturalistic
approaches. San Francisco: Jossey-Bass.
Guba, E. G., & Lincoln, Y. S. (1998). Competing paradigms in qualitative
research. In N. K. Denzin, & Y. S. Lincoln (Eds.), The landscape of qualitative
research: Theories and issues (pp. 195-220). London: Sage Publications Ltd.
Halfpenny, P. (2003). Poistivism in the Twentieth Century. In G. Ritzer, & B.
Smart (Eds.), Handbook of social theory (pp. 371-385). London: Sage
Publications Ltd.
Hall, H. (2004). The knowledge trap: An intranet implementation in a corporate
environment [PhD thesis]. Edinburgh: Edinburgh Napier University.
Hall, T., Beecham, S., Verner, J., & Wilson, D. (2008). The impact of staff
turnover on software projects: The importance of understanding what makes
software practitioners tick. Proceedings of the SIGMIS Computer Personnel
Doctoral Consortium and Research Conference, (pp. 30-39). Charlottesville,
USA.
Hallgren, M., & Maaninen-Olsson, E. (2005). Deviations, ambiguity and
uncertainty in a project-intensive organization. Project Management Journal,
36(3), 17-26.
Han, W-M., & Huang, S-J. (2007). An empirical analysis of risk components and
performance on software projects. The Journal of Systems and Software,
80(1), 42-50.
Haried, P., & Ramamurthy, K. (2009). Evaluating the success in international
sourcing of information technology projects: The need for a relational client-
vendor approach. Project Management Journal, 40(3), 56-71.
Hart, M. A. (2008). Insights on Brooks’ law and launch. PDMA Visions
Magazine, 32(6), 6-8.

Reference list
286
Hartman, F. T. (2000). Don't park your brain outside: A practical guide to
improving stakeholder value with SMART project management. Upper Darby:
Project Management Institute.
Hartman, F., & Ashrafi, R. A. (2002). Project management in the information
systems and information technologies industries. Project Management
Journal, 33(3), 5-15.
Hawari, A., & Heeks, R. (2010). Explaining ERP failure in a developing country:
A Jordanian case study. Journal of Enterprise Information Management,
23(2), 135-160.
Heiskanen, A., Newman, M., & Eklin, M. (2008). Control, trust, power, and the
dynamics of information system outsourcing relationships: A process study of
contractual software development. Journal of Strategic Information Systems,
17(4), 268-286.
Hofmann, H. F., & Lehner, F. (2001). Requirements engineering as a success
factor in software projects. IEEE Software, 18(4), 58-66.
Hsu, J. S-C., Lin, T-C., Zheng, G-T., & Hung, Y-W. (2012). Users as knowledge
co-producers in the information system development project. International
Journal of Project Management, 30(1), 27-36.
Hughes, B., & Cotterell, M. (2006). Software Project Management (4th ed.).
Maidenhead: McGraw-Hill Education.
Hyvari, I. (2006). Success of projects in different organisational conditions.
Project Management Journal, 37(4), 31-41.
Ika, L. A. (2009). Project success as a topic in project management journals.
Project Management Journal, 40(4), 6-19.
Institute of Electrical and Electronics Engineers. (2004). Guide to the software
engineering body of knowledge. Los Alamitos: IEEE Computer Society.
Ives, M. (2005). Identifying the contextual elements of project management
within organisations and their impact on project success. Project
Management Journal, 36(1), 37-50.
Jaafari, A. (2003). Project management in the age of complexity and change.
Project Management Journal, 34(4), 47-57.
Jeet, K., Bhatia, N., & Minhas, R. S. (2011). A model for estimating the impact
of low productivity on the schedule of a software development project. ACM
SIGSOFT Software Engineering Notes, 36(4), 1-6.

Reference list
287
Jiang, J. J., & Klein, G. (1999). Risks to different aspects of system success.
Information & Management, 36(5), 263-272.
Jiang, J. J., & Klein, G. (2001). Software project risks and development focus.
Project Management Journal, 32(1), 4-9.
Jiang, J. J., Chen, E., & Klein, G. (2002). The importance of building a
foundation for user involvement in information system projects. Project
Management Journal, 33(1), 20-26.
Jiang, J. J., Klein, G., & Ellis, T. S. (2002). A measure of software development
risk. Project Management Journal, 33(3), 30-41.
Johnson, R. B. (1997). Examining the validity structure of qualitative research.
Education, 118(2), 282-292.
Johnson, P., & Duberley, J. (2000). Understanding management research.
London: Sage Publications.
Jones, C. (1996). Our worst current development practices. IEEE Software,
13(2), 102-104.
Jones, C. (2006). Social and technical reasons for software project failures.
CrossTalk: The Journal of Defense Software Engineering, 19(6), 4-9.
Jones, C. (2004). Software project management practices: Failure versus
success. CrossTalk: The Journal of Defense Software Engineering, 17(10),
5-9.
Jørgensen, M., & Moløkken-Østvold, K. (2006). How large are software cost
overruns? A review of the 1994 CHAOS report. Information and Software
Technology, 48(4), 297-301.
Jugdev, K., & Müller, R. (2005). A retrospective look at our understanding of
project success. Project Management Journal, 36(4), 19-31.
Kanter, J., & Walsh, J. J. (2004). Toward more successful project management.
Information Systems Management, 21(2), 16-21.
Kappelman, L. A., McKeeman, R., & Zhang, L. (2006). Early warning signs of IT
project failure: The dominant dozen. Information Systems Management,
23(4), 31-36.
Kearns, G. S. (2007). How the internal environment impacts informations
systems project success: An investigation of exploitative and explorative
firms. The Journal of Computer Information Systems, 48(1).

Reference list
288
Keil, M., Cule, P. E., Lyytinen, K., & Schmidt, C. (1998). A framework for
identifying software project risks. Communications of the ACM, 41(11), 76-
83.
Kendra, K., & Taplin, L. J. (2004). Project success: A cultural framework.
Project Management Journal, 35(1), 30-45.
Kerzner, H. (1987). In search of excellence in project management. Journal of
Systems Management, 38(2), 30-39.
Khandelwal, V. K., & Ferguson, J. R. (1999). Critical success factors (CSFs)
and the growth of IT in selected geographic regions. Proceedings of the 32nd
Hawaii International Conference on System Sciences, (pp. 1-13). Hawaii,
USA.
Kim, C. S., & Peterson, D. K. (2001). Developers' perceptions of information
systems success factors. The Journal of Computer Information Systems;
Winter, 41(2), 29-35.
Kim, H-W. (2004). A process model for successful CRM system development.
IEEE Software, 21(4), 22-28.
Kim, H-W., & Pan, S. L. (2006). Towards a process model of information
systems implementation. The DATA BASE for Advances in Information
Systems, 37(1), 59-76.
King, S. F., & Burgess, T. F. (2006). Beyond critical success factors: A dynamic
model of enterprise system innovation. International Journal of Information
Management, 26(1), 59-69.
King, S. F., & Burgess, T. F. (2008). Understanding success and failure in
customer relationship management. Industrial Marketing Management, 37(4),
421-431.
Klakegg, O. J. (2009). Pursuing relevance and sustainability: Improvement
strategies for major public projects. International Journal of Managing
Projects in Business, 2(4), 499-518.
Klein, G., Jiang, J. J., & Tesch, D. B. (2002). Wanted: Project teams with a
blend of IS professional orientations. Communications of the ACM, 45(6), 81-
87.
Koskela, L., & Howell, G. (2002). The underlying theory of project management
is obsolete. Proceedings of the PMI Research Conference, 2002, (pp. 293-
307). Seattle, USA.

Reference list
289
Kutsch, E., & Hall, M. (2005). Intervening conditions on the management of
project risk: Dealing with uncertainty in information technology projects.
International Journal of Project Management, 23(8), 591-599.
Kwon, T. H., & Zmud, R. W. (1987). Unifying the fragmented models of
information systems implementation. In R. J. Boland, & R. A. Hirschheim,
Critical issues in information systems research (pp. 227-251). New York:
Wiley.
Labuschagne, A. (2003). Qualitative research: Airy fairy or fundamental? The
Qualitative Report, 8(1), 100-103.
Lacity, M. C., Khan, S. A., & Willcocks, L. P. (2009). A review of the IT
outsourcing literature: Insights for practice. Journal of Strategic Information
Systems, 18(3), 130-146.
Larsen, K. R. (2001). Antecedents of implementation success: A
comprehensive framework. Proceedings of the 34th Hawaii International
Conference on System Sciences, (pp. 1-10). Hawaii, USA.
Larsen, M. A., & Myers, M. D. (1999). When success turns into failure: A
package-driven business process re-engineering project in the financial
services industry. Journal of Strategic Information Systems, 8(4), 395-417.
Lechler, T. (1998). When it comes to project management, it's the people that
matter: An empirical analysis of project management in Germany. In F.
Hartman, G. Jergeas, & J. Thomas, IRNOP III: The nature and role of
projects in the next 20 years: Research issues and problems (pp. 205-15).
Calgary: University of Calgary.
Lee, B., & Miller, J. (2004). Multi-project management in software engineering
using simulation modelling. Software Quality Journal, 12(1), 59-82.
Lee, G. (2003). The flexibility and complexity of information systems
development projects [PhD Thesis]. Minnesota, USA: University of
Minnesota.
Lee, N., & Lings, I. (2008). Doing business research: A guide to theory and
practice. London: Sage Publications.
Leishman, T. R., & Cook, D. A. (2004). Risk factor: Confronting the risks that
impact software project success. Crosstalk: The Journal of Defense Software
Engineering, 17(5), 31-34.

Reference list
290
Lim, C. S., & Mohamed, M. Z. (1999). Criteria of project success: An exploratory
re-examination. International Journal of Project Management, 17(4), 243-248.
Lin, B. (2007). Information technology capability and value creation: Evidence
from the US banking industry. Technology in Society, 29, 93-106.
Lin, W. T. (2009). The business value of information technology as measured
by technical efficiency: Evidence from country-level data. Decision Support
Systems, 46(4), 865-874.
Lincoln, Y. S., & Guba, E. G. (1985). Naturalistic inquiry. Newbury Park: Sage.
Lipovetsky, S., Tishler, A., Dvir, D., & Shenhar, A. (1997). The relative
importance of project success dimensions. R&D Management, 27(2), 97-106.
Lorenzi, N. M., & Riley, R. T. (2000). Managing change. Journal of the
American Medical Informatics Association, 7(2), 116-124.
Lu, X-H., Huang, L-H., & Heng, M. S. (2006). Critical success factors of inter-
organizational information systems: A case study of Cisco and Xiao Tong in
China. Information & Management, 43(3), 395-408.
Lycett, M., & Paul, R. J. (1999). Information systems development: A
perspective on the challenge of evolutionary complexity. European Journal of
Information Systems, 8(2), 127-135.
Lyytinen, K. (1987). Different perspectives on information systems: Problems
and solutions. ACM Computing Surveys, 19(1), 5-46.
Magal, S. R., Carr, H. H., & Watson, H. J. (1988). Critical success factors for
information center managers. MIS Quarterly, 12(3), 413-425.
Mahaney, R. C., & Lederer, A. L. (2003). Information systems project
management: An agency theory interpretation. The Journal of Systems and
Software, 68(1), 1-9.
Masticola, S. P. (2007). A simple estimate of the cost of software project failures
and the breakeven effectiveness of project risk management. 29th
International Conference on Software Engineering (ISCE '07) Workshops,
(pp. 1-4). Minneapolis, USA.
May, L. (1998). Major causes of software project failures. CrossTalk, 11(7), 9-
12.
Mays, N., & Pope, C. (1995). Rigour and qualitative research. British Medical
Journal, 311, 109-112.

Reference list
291
McLain, D. (2009). Quantifying project characteristics related to uncertainty.
Project Management Journal, 40(4), 60-73.
Merla, E. (2005). Beginning at the ending. Proceedings of the PMI Global
Conference (2005), (pp. 1-7). Edinburgh, Scotland.
Merriam, S. B. (1995). What can I tell from an N of 1?: Issues of validity and
reliability in qualitative research. PAACE Journal of Lifelong Learning, 4, 51-
60.
Miles, M. B., & Huberman, A. M. (1988). Drawing valid meaning from qualitative
data: Towards a shared craft. In D. M. Fetterman (Ed.), Qualitative
approaches to evaluation in education: the silent scientific revolution (pp.
222-244). New York: Praeger.
Milis, K., & Mercken, R. (2002). Success factors regarding the implementation
of ICT investment projects. International Journal of Production Economics,
80(1), 105-117.
Milosevic, D. (2004). Managing new product development projects. In P. W.
Morris, & J. K. Pinto, The Wiley Guide to Managing Projects (pp. 1287-1314).
Hobeken: John Wiley.
Milosevic, D., & Patanakul, P. (2005). Standardized project management may
increase development projects success. International Journal of Project
Management, 23(3), 181-192.
Moore, J. H. (1979). A framework for MIS development projects. MIS Quarterly,
3(1), 29-38.
Morris, P. W. (2010). Research and the future of project management.
International Journal of Managing Projects in Business, 3(1), 139-146.
Morris, P. W. (2004). The irrelevance of project management as a professional
discipline [Electronic version]. Retrieved March 19th, 2011, from
http://www.indeco.co.uk/filestore/IrrelevanceofPMDiscipline.pdf
Morris, P. W. (1994). The management of projects. London: Thomas Telford.
Morris, P. W. (1999). Updating the project management bodies of knowledge
[Electronic version]. Retrieved March 17th, 2011, from
http://www.indeco.co.uk/filestore/UpdatingthePMBodiesofKnowledge.pdf
Morse, J. M., Barrett, M., Mayan, M., Olson, K., & Spiers, J. (2002). Verification
strategies for establishing reliability and validity in qualitative research.
International Journal of Quality Methods, 1(2), 13-22.

Reference list
292
Mostrous, A., & Elliot, F. (2009, February 2nd). £18bn scandal as Whitehall's IT
plans spin out of control. The Times. London. Retrieved February 27th, 2009,
from Times Online: http://business.timesonline.co.uk/tol/business/industry_
sectors/technology/article5636437.ece
Moustakas, C. (1994). Phenomenological research methods. Thousand Oaks:
Sage Publications, Inc.
Moynihan, T. (1996). An inventory of personal constructs for information
systems project risk researchers. Journal of Information Technology, 11(4),
359-371.
Müller, J., & Turner, R. (2007b). Matching the project manager’s leadership
style to project type. International Journal of Project Management, 25(1), 21-
32.
Müller, J., & Turner, R. (2007a). The influence of project managers on project
success criteria and project success by type of project. European
Management Journal, 25(4), 298-309.
Munns, A. K., & Bjeirmi, B. F. (1996). The role of project management in
achieving project success. International Journal of Project Management,
14(2), 81-87.
Myers, M. D. (2009). Qualitative research in business & management. London:
Sage Publications.
Na, K-S., Li, X., Simpson, J. T., & Kim, K-Y. (2004). Uncertainty profile and
software project performance: A cross-national comparison. The Journal of
Systems and Software, 70(1-2), 155-163.
Na, K-S., Simpson, J. T., Xiaotong, X., Singh, T., & Kim, K-Y. (2007). Software
development risk and project performance measurement: Evidence in Korea.
The Journal of Systems and Software, 80(4), 596-605.
Nah, F. F-H., Lau, J. L-S., & Kuang, J. (2001). Critical factors for successful
implementation of enterprise systems. Business Process Management, 7(3),
285-296.
Nakatsu, R. T., & Iacovou, C. L. (2009). A comparative study of important risk
factors involved in offshore and domestic outsourcing of software
development projects: A two-panel Delphi study. Information & Management,
46(1), 57-68.

Reference list
293
Nandhakumar, J. (1996). Design for Success?: Critical success factors in
executive information systems development. European Journal of Information
Systems, 5(1), 62-72.
Nasir, M. H., & Sahibuddin, S. (2011). Critical success factors for software
projects: A comparative study. Scientific Research and Essays, 6(10), 2174-
2186.
Nedjah, N., da Silva, R. M., & de Macedo Mourelle, L. (2012). Compact yet
efficient hardware implementation of artificial neural networks with
customized topology. Expert Systems with Applications , 39(10), 9191–9206.
Ngai, E. W., Law, C. C., & Wat, F. K. (2008). Examining the critical success
factors in the adoption of enterprise resource planning. Computers in
Industry, 59(6), 548-56.
Nicholas, J., & Hidding, G. (2010). Management principles associated with IT
project success. International Journal of Management and Information
Systems, 4(5), 147-156.
Noy, D. (2009). Setting up targeted interviews: A primer for students and new
interviewers. The Qualitative Report, 14(3), 454-465.
Packendorff, J. (1995). Inquiring into the temporary organization: New directions
for project management research. Scandinavian Journal of Management,
11(4), 319-333.
Papke-Shields, K. E., Beise, C., & Quan, J. (2010). Do project managers
practice what they preach, and does it matter to project success?
International Journal of Project Management, 28(7), 650-662.
Paré, G., & Elam, J. J. (1997). Using case study research to build theories of
information technology implementation. In A. S. Lee, J. Liebenau, & J. I.
DeGross (Eds.), Information systems and qualitative research (pp. 31-68).
New York: Chapman & Hall.
Patton, M. Q. (1990). Qualitative evaluation and research methods. Newbury
Park: Sage.
Patton, M. Q. (2002). Qualitative research and evaluation methods (3rd ed.).
London: Sage Publications.
Peppard, J., & Ward, J. (2004). Beyond strategic information systems: Towards
an IS capability. Journal of Strategic Information Systems, 13(2), 167-194.

Reference list
294
Pereira, J., Cerpa, N., Verner, J., Rivas, M., & Procaccino, J. D. (2008). What
do software practitioners really think about project success: A cross cultural
comparison. The Journal of Systems and Software, 81(6), 897-907.
Peterson, D. K., Kim, C., Kim, J. H., & Tamura, T. (2002). The perceptions of
information systems designers from the United States, Japan, and Korea on
success and failure factors. International Journal of Information Management,
22(6), 421-439.
Petter, S. (2008). Managing user expectations on software projects: Lessons
from the trenches. International Journal of Project Management, 26(7), 700-
712.
Pickard, A. J. (2007). Research methods in information. London: Facet
Publishing.
Pinto, J. K., & Covin, J. G. (1989). Critical factors in project implementation: A
comparison of construction and R&D projects. Technovation, 9(1), 49-62.
Pinto, J. K., & Prescott, J. E. (1990). Planning and tactical factors in the project
implementation process. Journal of Management Studies, 27(3), 305-27.
Pinto, J. K., & Prescott, J. E. (1988). Variations in critical success factors over
the stages of the project life cycle. Journal of Management, 14(1), 5-18.
Pinto, J. K., & Slevin, D. P. (1988). Critical success factors across the project
life cycle. Project Management Journal, 19(3), 67-75.
Potter, S. (Ed.). (2006). Doing postgraduate research (2nd ed.). Milton Keynes:
The Open University.
Procaccino, J. D., & Verner, J. M. (2006). Software project managers and
project success: An exploratory study. The Journal of Systems and Software,
79(11), 1541-1551.
Procaccino, J. D., Verner, J. M., & Lorenzet, S. J. (2006). Defining and
contributing to software development success. Communications of the ACM,
49(8), 79-83.
Procaccino, J. D., Verner, J. M., Darter, M. E., & Amadio, W. J. (2005). Toward
predicting software development success from the perspective of
practitioners: An exploratory Bayesian model. Journal of Information
Technology, 20(3), 187-200.
Project Management Institute. (2008). A guide to the project management body
of knowledge (4th ed.). Newton Square: Project Management Institute.

Reference list
295
Pyett, P. M. (2003). Validation of qualitative research in the real world.
Qualitative Health Research, 13(8), 1170-1179.
Pyster, A. B., & Thayer, R. H. (2005). Software engineering project
management 20 years later. IEEE Software, 22(5), 18-21.
Reel, J. S. (1999). Critical success factors in software projects. IEEE Software,
16(3), 18-23.
Rehman, I. U., Ullah, S., Rauf, A., & Shahid, A. A. (2010). Scope management in agile versus traditional software development methods analysis design. Proceedings of the 2010 National Software Engineering Conference, (pp. 10:1-10:6). Rawalpindi, Pakistan.
Remus, U., & Wiener, M. (2009). Critical success factors for managing offshore
software development projects. Journal of Global Information Technology
Management, 12(1), 6-29.
Richardson, G., & Ives, B. (2004). Systems development processes. Computer,
37(5), 84-86.
Richmond, B. (1993). Systems thinking: Critical thinking skills for the 1990s and
beyond. System Dynamics Review, 9(2), 113-133.
Rigby, D., & Bilodeau, B. (2005). The Bain 2005 management tool survey.
Strategy & Leadership, 33(4), 4-12.
Rincon, P. (2012, July 4th). Higgs boson-like particle discovery claimed at LHC.
Retrieved September 23rd, 2012, from BBC News:
www.bbc.co.uk/news/world-18702455
Rockart, J. F. (1979). Chief executives define their own data needs. Harvard
Business Review, 1979(Mar-Apr), 81-92.
Rodríguez, D., Ruiz, M., Riquelme, J. C., & Harrison, R. (2011). Multiobjective
simulation optimisation in software project management. Proceedings of the
13th Annual Conference on Genetic and Evolutionary Computation, (pp.
1883-1890). Dublin, Ireland.
Rodriguez-Repiso, L., Setchib, R., & Salmeron, J. L. (2007). Modelling IT
projects success: Emerging methodologies reviewed. Technovation, 27(10),
582-594.
Ropponen, J., & Lyytinen, K. (2000). Components of software development risk:
How to address them? A project manager survey. IEEE Transactions on
Software Engineering, 26(2), 98-112.

Reference list
296
Rothenberger, M. A., Srite, M., & Jones-Graham, K. (2010). The impact of
project team attributes on ERP system implementations. Information
Technology & People, 32(1), 80-109.
Sabherwal, R., Jeyaraj, A., & Chowa, C. (2006). Information system success:
Individual and organizational determinants. Management Science, 52(12),
1849-1864.
Saleh, Y., & Alshawi, M. (2005). An alternative model for measuring the
success of IS projects: The GPIS model. The Journal of Enterprise
Information Management, 18(1), 47-63.
Salmeron, J. L., & Herrero, I. (2005). An AHP-based methodology to rank
critical success factors of executive information systems. Computer
Standards & Interfaces, 28(1), 1-12.
Sauer, C., & Cuthbertson, C. (2003). State of IT project management: UK 2002-
2003: A Computer Weekly report. Retrieved January 10th, 2005, from
http://www.bestpracticehelp.com/The_State_of_IT_Project_Management_in_
the_UK_2003_2004.pdf
Sauer, C., & Reich, B. H. (2007). What do we want from a theory of project
management? A response to Rodney Turner. International Journal of Project
Management, 25(1), 1-2.
Sauer, C., Gemino, A., & Reich, B. H. (2007). The impact of size and volatility
on IT project performance: Studying the factors influencing project risk.
Communications of the ACM, 50(11), 79-84.
Sauser, B. J., Reilly, R. R., & Shenhar, A. J. (2009). Why projects fail? How
contingency theory can provide new insights: A comparative analysis of
NASA’s Mars Climate Orbiter loss. International Journal of Project
Management, 27(7), 665-679.
Savolainen, P., Ahonen, J. J., & Richardson, I. (2012). Software development
project success and failure from the supplier's perspective: A systematic
literature review. International Journal of Project Management, 30(4), 1-12.
ScotlandIS. (2008). Retrieved September 12th, 2008, from
http://www.scotlandis.com
ScotlandIS. (2012). Retrieved July 19th, 2012, from http://www.scotlandis.com

Reference list
297
Seiler, S., Lent, B., Pinkowska, M., & Pinazza, M. (2012). An integrated model
of factors influencing project managers' motivation: Findings from a Swiss
survey. International Journal of Project Management, 30(1), 60-72.
Sharma, A., Sengupta, S., & Gupta, A. (2011). Exploring risk dimensions in the
Indian software industry. Project Management Journal, 42(5), 78-91.
Sharp, J. A., Peters, J., & Howard, K. (2002). The management of a student
research project (3rd ed.). Aldershot: Gower Publishing.
Shenhar, A. J., & Dvir, D. (2005). Project management research: Challenges
and opportunities. Retrieved February 22nd, 2006, from Stevens Institute of
Technology, Hoboken: http://howestevens.edu
Shenhar, A. J., Levy, O., & Dvir, D. (1997). Mapping the dimensions of project
success. Project Management Journal, 28(2), 5-13.
Shenton, A. K. (2004). Strategies for ensuring trustworthiness in qualitative
research projects. Education for Information, 22(2), 63-75.
Skulmoski, G. J., & Hartman, F. T. (2010). Information systems project manager
soft competencies: A project-phase investigation. Project Management
Journal, 41(1), 61-80.
Slevin, D. P., & Pinto, J. K. (2004). An overview of the behavioural issues in
project management. In P. W. Morris, & J. K. Pinto, The Wiley Guide to
Managing Projects (pp. 99-122). Hobeken: John Wiley.
Slevin, D. P., & Pinto, J. K. (1987). Balancing strategy and tactics in project
implementation. Sloan Management Review, 29(1), 33-41.
Smuts, H., van der Merwe, A., Kotzé, P., & Loock, M. (2010). Critical success
factors for information systems outsourcing management: A software
development lifecycle view. Proceedings of the 2010 Annual Research
Conference of the South African Institute of Computer Scientists and
Information Technologists, (pp. 304-313). Bela Bela, South Africa.
Smyth, H., & Morris, P. W. (2007). An epistemological evaluation of research
into projects and their management: Methodological issues. International
Journal of Project Management, 25(4), 423-36.
Söderlund, J. (2004a). Building theories of project management: Past research,
questions for the future. International Journal of Project Management, 22(3),
183-191.

Reference list
298
Söderlund, J. (2004b). On the broadening scope of the research on projects: A
review and a model for analysis. International Journal of Project
Management, 22(8), 655-667.
Söderlund, J. (2011). Pluralism in project management: Navigating the
crossroads of specialization and fragmentation. International Journal of
Management Reviews, 13(2), 153-176.
Somers, T. M., & Nelsen, K. (2001). The impact of critical success factors
across the stages of enterprise resource planning implementations.
Proceedings of the 34th Hawaii International Conference on System
Sciences, (pp. 1-10). Hawaii, USA.
Sommerville, I. (2007). Software engineering (8th ed.). Harlow: Addison-Wesley.
Stainton-Rogers, W. (2006). Logics of inquiry. In S. Potter (Ed.), Doing
postgraduate research (2nd ed., pp. 73-91). Milton Keynes: The Open
University.
Standing, G., Guilfoyle, A., Lin, C., & Love, P. E. (2006). The attribution of
success and failure in IT projects. Industrial Management & Data, 106(8),
1148-1165.
Standish Group. (2004). 2004 Third quarter research report [Electronic version].
Retrieved January 10th, 2005, from
www.standishgroup.com/sample_research/PDFpages/q3-spotlight.pdf
Standish Group. (2009b, September). CHAOS actvity news [Electronic version].
Retrieved March 23rd, 2011, from email received from Standish Group
Standish Group. (1999). CHAOS: A recipe for success [Electronic version].
Retrieved January 24th, 2005, from http://www4.informatik.tu-
muenchen.de/lehre/vorlesungen/vse/WS2004/1999_Standish_Chaos.pdf
Standish Group. (2001). Extreme CHAOS [Electronic version]. Retrieved
January 25th, 2005, from
http://standishgroup.com/sample_research/extreme_chaos.pdf
Standish Group. (2009a, April 23rd). Standish newsroom - CHAOS 2009
[Electronic version]. Retrieved March 8th, 2011, from
http://www1.standishgroup.com/newsroom/chaos_2009.php
Standish Group. (1995). The Standish Group report: CHAOS [Electronic
version]. Retrieved January 10th, 2005, from
http://www.projectsmart.co.uk/docs/chaos-report.pdf

Reference list
299
Subramanyam, R., Weisstein, F. L., & Krishnan, M. S. (2010). User participation
in software development projects. Communications of the ACM, 53(3), 137-
141.
Sumner, M., Bock, D., & Giamartino, G. (2006). Exploring the linkage between
the characteristics of IT project leaders and project success. Information
Systems Management, 23(4), 43-49.
Szanto, B. (2005). The unconventional challenges of InfoTech. Technovation,
25(5), 469-476.
Tarbet, D. (2012). Optimized project management of systems and software
projects. Crosstalk: The Journal of Defense Software Engineering, 25(3), 26-
29.
Taylor, A. (2000). IT projects: Sink or swim. The Computer Bulletin, 42(1), 24-
26.
Taylor, H. (2007). Outsourced IT projects from the vendor perspective: Different
goals, different risks. Journal of Global Information Management, 15(2), 1-27.
Tesch, D., Kloppenborg, T. J., & Frolick, M. N. (2007). IT project risk factors:
The project management professionals perspective. Journal of Computer
Information Systems, 47(4), 61-69.
Tesch, D., Sobol, M. G., Klein, G., & Jiang, J. J. (2009). User and developer
common knowledge: Effect on the success of information system
development projects. International Journal of Project Management, 27(7),
657-664.
Thamhain, H. J. (2004). Linkages of project environment to performance:
Lessons for team leadership. International Journal of Project Management,
22(7), 533-544.
Thi, C. H., & Swierczek, F. W. (2010). Critical success factors in project
management: Implications from Vietnam. Asia Pacific Business Review,
16(4), 567-589.
Thite, M. (2000). Leadership styles in information technology projects.
International Journal of Project Management, 18, 235-241.
Thomas, G., & Fernández, W. (2008). Success in IT projects: A matter of
definition. International Journal of Project Management, 26(7), 733-742.
Thomsett, R. (2002). Radical project management. Upper Saddle River:
Prentice Hall.

Reference list
300
Thomsett, R. (1993). Third wave project management. Englewood Cliffs:
Prentice Hall.
Tiernan, C., & Peppard, J. (2004). Information technology: Of value or a
vulture? European Management Journal, 22(6), 609-623.
Tiwana, A., & Keil, M. (2004). The one minute risk assessment tool.
Communications of the ACM, 47(11), 73-77.
Tiwana, A., & Mclean, E. R. (2003). The tightrope to e-business project
success. Communications of the ACM, 46(12), 345-350.
Turner, J. R. (1996). Editorial: International Project Management Association
global qualification, certification and accreditation. International Journal of
ProjectManagement, 14(1), 1-6.
Turner, J. R. (2005). Project management research conferences 2006(editorial).
International Journal of Project Management, 23(8), 573-574.
Turner, J. R. (1999). The Handbook of Project Based Management (2nd ed.).
London: McGraw-Hill.
Turner, J. R. (2006c). Towards a theory of project management: The functions
of project management. International Journal of Project Management, 24(3),
187-189.
Turner, J. R. (2006d). Towards a theory of project management: The nature of
the functions of project management. International Journal of Project
Management, 24(4), 277-279.
Turner, J. R. (2006a). Towards a theory of project management: The nature of
the project. International Journal of Project Management, 24(1), 1-3.
Turner, J. R. (2006b). Towards a theory of project management: The nature of
the project governance and project management. International Journal of
Project Management, 24(2), 93-95.
Turner, J. R., & Müller, R. (2005). The project manager's leadership style as a
success factor on projects: A literature review. Project Management Journal,
36(2), 49-61.
Turner, J. R., Ledwith, A., & Kelly, J. (2009). Project management in small to
medium-sized enterprises. International Journal of Managing Projects in
Business, 2(2), 282-296.

Reference list
301
Ugwu, O. O., & Kumaraswamy, M. M. (2007). Critical success factors for
construction ICT projects: Some empirical evidence and lessons for
emerging economies. ITCon, 12(Special issue), 231-249.
Verner, J. M., & Evanco, W. M. (2005). In-house software development: What
project management practices lead to success? IEEE Software, 22(1), 86-93.
Verner, J. M., Evanco, W. M., & Cerpa, N. (2007). State of the practice: An
exploratory analysis of schedule estimation and software project success
prediction. Information and Software Technology, 49, 181-193.
Verner, J. M., Overmyer, S. P., & McCain, K. W. (1999). In the 25 years since
The Mythical Man-Month what have we learned about project management?
Information and Software Technology, 41(14), 1021-1026.
Verner, J. M., Overmyer, S. P., & McCain, K. W. (1999). In the 25 years since
The Mythical Man-Month what have we learned about project management?
Information and Software Technology, 41(14), 1021-1026.
Verner, J., Beecham, S., & Cerpa, N. (2010). Stakeholder dissonance:
Disagreements on project outcome and its impact on team motivation across
three countries. Proceedings of 2010 Special Interest Group on Management
Information System's 48th Annual Conference on Computer Personnel
Research, (pp. 25-33). Vancouver, Canada.
Vithanage, D. K., & Wijayanayake, W. M. (2007). Insight to the large scale
information systems implementation in Sri Lanka. Proceedings of the Second
International Conference on Industrial and Information Systems, (pp. 33-39).
Peradeniya, Sri Lanka.
Wallace, L., & Keil, M. (2004). Software project risks and their effect on
outcomes. Communications of the ACM, 47(4), 68-73.
Wallace, L., Keil, M., & Rai, A. (2004). How software project risk affects project
performance: An investigation of the dimensions of risk and an exploratory
model. Decision Sciences, 35(2), 289-321.
Walsh, J. J., & Kanter, J. (1988). Toward more successful project management.
Journal of Systems Management, 39(1), 16-21.
Wang, Y., & Li, F. (2009). How does project managers’ personality matter?
Building the linkage between project managers’ personality and the success
of software development projects. Proceeding of the 24th ACM SIGPLAN
Conference Companion on Object Oriented Programming Systems
Languages and Applications, (pp. 867-874). Orlando, USA.

Reference list
302
Wang, J., Mo, H., Fahui, W., & Fengjun, J. (2011). Exploring the network
structure and nodal centrality of China’s air transport: network: A complex
network approach. Journal of Transport Geography, 19(4), 712–721.
Warkentin, M., Moore, R. S., Bekkering, E., & Johnston, A. C. (2009). Analysis
of systems development project risks: An integrative framework. The DATA
BASE for Advances in Information Systems, 40(2), 8-27.
Wateridge, J. (1998). How can IS/IT projects be measured for success?.
International Journal of Project Management, 16(1), 59-63.
Wateridge, J. (1995). IT projects: A basis for success. International Journal of
Project Management, 13(3), 169-172.
Wateridge, J. (1997). Training for IS/IT project managers: a way forward.
International Journal of Project Management, 15(5), 283-288.
Weinberg, G. M. (2003). Destroying communication and control in software
development. CrossTalk: The Journal of Defense Software Engineering,
16(4), 4-8.
Westerveld, E. (2003). The Project Excellence Model: Linking success criteria
and critical success factors. International Journal of Project Management,
21(6), 411-418.
Wight, O. W. (1983). The executive's guide to successful MRPII (2nd ed.).
Englewood Cliffs, USA: Prentice-Hall.
Williams, T., Klakegg, O. J., Walker, D. H., Andersen, B., & Magnussen, O. M.
(2012). Identifying and acting on early warning signs in complex projects.
Project Management Journal, 42(3), 37-53.
Winklhofer, H. (2002). Information systems project management during
organisational change. Engineering Management Journal, 14(2), 33.
Winklhofer, H. (2001). Organizational change as a contributing factor to IS
failure. Proceedings of the 34th Hawaii International Conference on System
Sciences, (pp. 1-9). Hawaii, USA.
Winter, M., & Smith, C. (2006). Rethinking project management: Final report
[Electronic version]. Retrieved August 29th, 2007, from
http://www.mace.manchester.ac.uk/project/research/management/rethinkpm/
pdf/papers/report.pdf

Reference list
303
Winter, M., Smith, C., Morris, P., & Cicmil, S. (2006). Directions for future
research in project management: The main findings of a UK government-
funded research network. International Journal of Project Management,
24(8), 638-649.
Wirth, I. (1996). How generic and how industry specific is the project
management profession? International Journal of Project Management,
14(1), 7-11.
Wohlin, C., & Andrews, A. A. (2002). Analysing primary and lower order project
success drivers. Proceedings of the 14th International Conference on
Software Engineering and Knowledge Engineering, (pp. 393-400). Ischia,
Italy.
Wright, K., & Capps, C. (2011). A survey of information systems development
project performance. Academy of Information and Management Sciences
Journal, 14(1), 87-105.
Wright, M. K., & Capps, C. J. (2010). Information systems development project
performance in the 21st century. ACM SIGSOFT Software Engineering
Notes, 35(2), 1-10.
Xia, W., & Lee, G. (2004). Grasping the complexity of IS development projects.
Communications of the ACM, 47(5), 69-74.
Yeo, K. T. (2002). Critical failure factors in information system projects.
International Journal of Project Management, 20(3), 241-246.
Yetton, P., Martin, A., Sharma, R., & Johnston, K. (2000). A model of
information systems development project performance. Information Systems
Journal, 10(4), 263-289.
Young, R., & Jordan, E. (2008). Top management support: Mantra or
necessity? International Journal of Project Management, 26(7), 713-725.
Yourdon, E. (1997). Death march: The complete software developers guide to
surviving mission impossible projects. London: Prentice Hall.
Yu, A. G., Flett, P. D., & Bowers, J. A. (2005). Developing a value-centred
proposal for assessing project success. International Journal of Project
Management, 23(6), 428-436.
Zarifzadeh, S., Yazdani, N., & Nayyeri, A. (2012). Energy-efficient topology
control in wireless ad hoc networks with selfish nodes. Computer Networks ,
56(2), 902–914.

Reference list
304
Zielinski, D. (2005). Soft skills, hard truths. Training, 42(7), 18-23.
Zwikael, O. (2008b). Top management involvement in project management: A
cross country study of the software industry. International Journal of
Managing Projects in Business, 1(4), 498-511.
Zwikael, O. (2008a). Top management involvement in project management:
Exclusive support practices for different project scenarios. International
Journal of Managing Projects in Business, 1(3), 387-403.

Appendices
305
Appendices
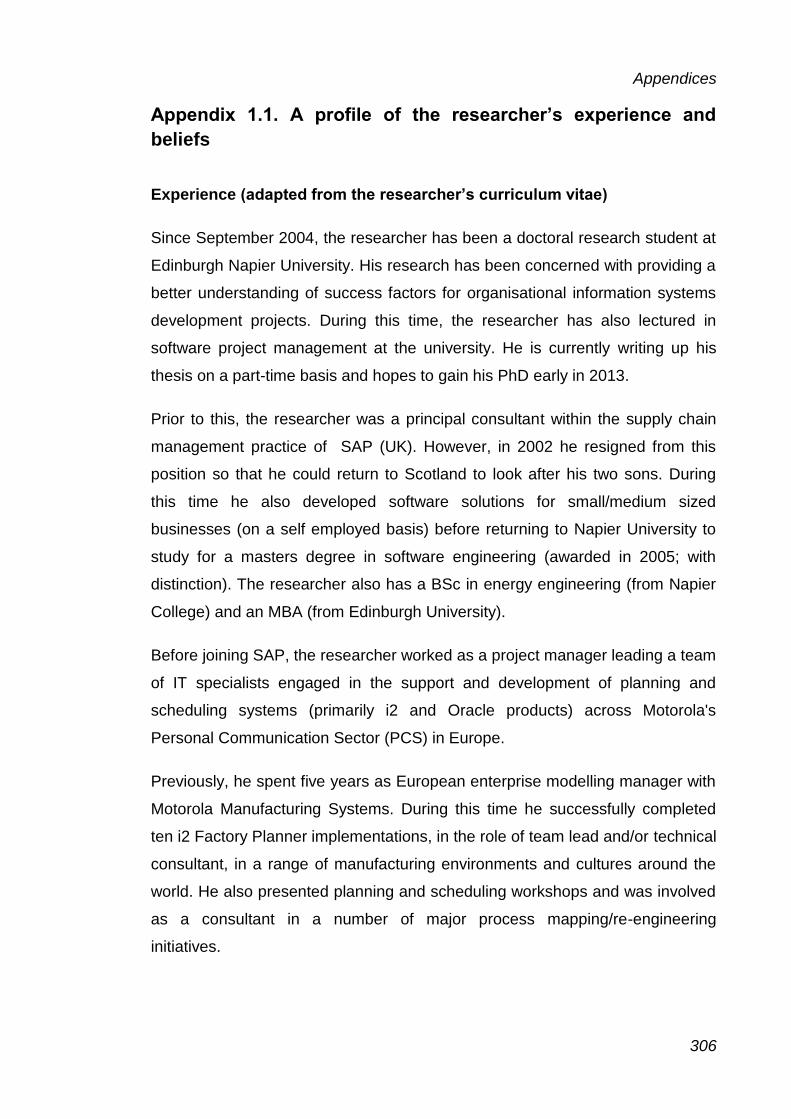
Appendices
306
Appendix 1.1. A profile of the researcher’s experience and
beliefs
Experience (adapted from the researcher’s curriculum vitae)
Since September 2004, the researcher has been a doctoral research student at
Edinburgh Napier University. His research has been concerned with providing a
better understanding of success factors for organisational information systems
development projects. During this time, the researcher has also lectured in
software project management at the university. He is currently writing up his
thesis on a part-time basis and hopes to gain his PhD early in 2013.
Prior to this, the researcher was a principal consultant within the supply chain
management practice of SAP (UK). However, in 2002 he resigned from this
position so that he could return to Scotland to look after his two sons. During
this time he also developed software solutions for small/medium sized
businesses (on a self employed basis) before returning to Napier University to
study for a masters degree in software engineering (awarded in 2005; with
distinction). The researcher also has a BSc in energy engineering (from Napier
College) and an MBA (from Edinburgh University).
Before joining SAP, the researcher worked as a project manager leading a team
of IT specialists engaged in the support and development of planning and
scheduling systems (primarily i2 and Oracle products) across Motorola's
Personal Communication Sector (PCS) in Europe.
Previously, he spent five years as European enterprise modelling manager with
Motorola Manufacturing Systems. During this time he successfully completed
ten i2 Factory Planner implementations, in the role of team lead and/or technical
consultant, in a range of manufacturing environments and cultures around the
world. He also presented planning and scheduling workshops and was involved
as a consultant in a number of major process mapping/re-engineering
initiatives.

Appendices
307
Before joining Motorola, the researcher gained a tremendous amount of
practical manufacturing experience. Starting as a production engineer, his
career progression encompassed the roles of MRPII project coordinator,
production manager and production controller with NEI and Rolls-Royce. He
also spent two years as a manufacturing systems consultant with a leading
software house providing ERP implementation consultancy, project
management and technical support to a variety of manufacturing customers.
In summary, the researcher has acted as team lead/project manager/principal
consultant for more than twenty information systems implementations and has
acquired significant experience in leading teams through all stages of the
project life cycle. As a hands-on professional, he has gained demonstrable
experience in developing and executing project plans, performing in depth
requirements analysis, producing functional requirements, building data models,
developing system designs, coding solutions, producing and executing test
plans, and developing and delivering training material.
Beliefs
During his professional IT career, the researcher has developed certain beliefs
regarding the success of OISD and IS projects. First of all, competence is
paramount (success is highly unlikely if you don’t know what you’re doing) and,
more often than not, is based on appropriate experience. For a project
manager, this means having excellent technical, business, people and learning
skills. These skills also need to be mirrored across the project team to match
the demands of the project. Skill deficiencies in the project team become
operational responsibilities of the project manager and should be addressed as
such. Although the project manager should not (normally) engage in technical
activities, technical skills are still important to enhance understanding of the
project and improve communication with technical parties (especially the project
team).
Typically, an IS or OISD project will face a number of challenges, although
these tend to differ on a project by project basis. None-the-less, the project
manager still needs to attend to numerous aspects of project management if the

Appendices
308
project is to be successful. Many of these aspects tend not to be considered as
failure factors. Instead, they are givens; taken for granted and seldom
acknowledged. In this respect, success and failure factors are different.
Although a project can fail due to a few failure factors, a successful project
depends on numerous success factors.
The project manager’s primary purpose is optimise the work of the project team.
At a basic level, this entails making sure that barriers that impede the progress
of the project team are removed or minimised. It also involves protecting the
project team from detrimental external influences, and identifying and exploiting
factors that enhance project team productivity. However, it is often necessary to
ensure that the demands being placed on the project team are realistic and fair;
for example, through effective management of the client’s expectations.
The researcher believes in an eight step implementation approach. The
objectives of the approach are to deliver a solution that (1) produces the
maximum business benefit (at the earliest opportunity) and (2) is owned by the
business. It has eight steps:
(1) Assess the problem;
(2) Initiate the project;
(3) Confirm the requirements;
(4) Design;
(5) Build;
(6) Test;
(7) Implement;
(8) Use the solution.
All that said, the majority of project management practices, as espoused in text
books, institutional literature63 and commercially available training courses64
63 For example, that provided by the Project Management Institute (PMI) and the Association
for Project Management (APM).
64 For example, PRINCEII (Projects in controlled environments).

Appendices
309
have relevance. However, they should be applied with a good measure of
common sense. In particular, heavy-weight methodologies can be extremely
detrimental to small to medium sized projects. As such, the researcher
considers the use of cut-down versions of these methodologies and also the
use of specific elements of these methodologies to be good practice. As a rule,
project management techniques must add value to a project and their use
should be respected by the project team.

Appendices
310
Appendix 2.1. Turner’s theory of project management:
corollaries and roles
Corollaries (outcomes: processes unless otherwise indicated)
1. Project contract and procurement management;
2. Information management;
3. Financial management;
4. Resource management;
5. Project appraisal;
6. Project definition;
7. Work breakdown structure (artefact);
8. Risk management;
9. The management of the project;
10. The project and project management life-cycles (artefacts);
11. Scope management;
12. Requirements management;
13. Benefits management;
14. Project organisation (actor);
15. Quality management;
16. Cost management;
17. Time management (project planning).
Roles (actors)
1. Project owner;
2. Ends users;
3. Project sponsor;
4. Resources (project team);
5. Project broker65;
6. Project steward66;
7. Project manager.
65 “Works with the owner and sponsor to define the required outcome (benefit) from the project,
and the output (change) which will achieve that” (Turner, 2006c, p.189).
66 “Works with the owner and sponsor to define the required outcome (benefit) from the project,
and the output (change) which will achieve that” (Turner, 2006c, p.189).

Appendices
311
Source: Turner (2006c, p. 189). Refer also to Turner (2006a; 2006b; 2006c;
2006d).

Appendices
312
Appendix 2.2. OISD project success factor studies
ID Article Project/system/ process type
Factor type T D P Domain DS Methodology (or data source) Notes
1 Averweg & Erwin (1999)
Decision support systems
Critical success factors
D I I Decision support systems in South Africa.
I Unknown number of structured interviews (business managers, end users, IT personnel and academics) in 18 non-government organisations.
Primary development language seems to be user oriented 4GLs.
2 Bannerman (2008)
Software projects
Major risk factors
B B I/C Software projects in government agencies in an Australian state.
I 23 structured interviews (project/IT/business managers) and qualitative analysis.
Includes projects implementing packaged software products.
3 Berntsson-Svensson & Aurum (2006)
Software projects
Success factors
B B I/C
Financial services, consulting and telecommunications industries in Swedish and Australian companies.
S Survey (and some open ended questions) completed by software practitioners and managers. Sample size not provided.
4 British Computer Society (2004)
Complex software and IT projects
Key players, key success factors
B S C UK public and private sector, software and IT projects.
U
Evidence (written and oral) from 70 directors, managers, project managers and software engineers from the private and public sectors, as well as academic experts. Methodology not specified.
No mention of in-house development. Perspective seems to be that of the client.
5 Brocke, Uebernickel, & Brenner (2009)
IT projects Success factors
B B I/C European telecommunications firm.
C Five case studies (two development projects). Methodology not specified.
6 Bussen & Myers (1997)
Executive information systems
Risk factors D I I Large organisation in New Zealand.
C Case study.
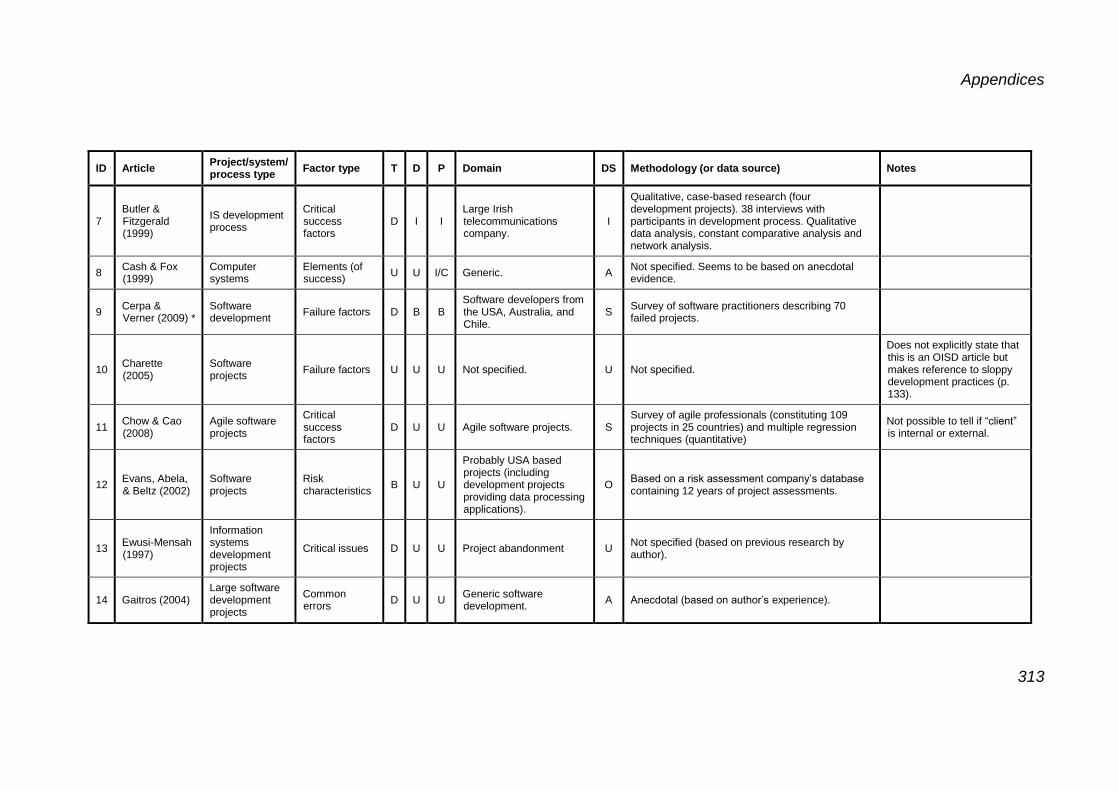
Appendices
313
ID Article Project/system/ process type
Factor type T D P Domain DS Methodology (or data source) Notes
7 Butler & Fitzgerald (1999)
IS development process
Critical success factors
D I I Large Irish telecommunications company.
I
Qualitative, case-based research (four development projects). 38 interviews with participants in development process. Qualitative data analysis, constant comparative analysis and network analysis.
8 Cash & Fox (1999)
Computer systems
Elements (of success)
U U I/C Generic. A Not specified. Seems to be based on anecdotal evidence.
9 Cerpa & Verner (2009) *
Software development
Failure factors D B B Software developers from the USA, Australia, and Chile.
S Survey of software practitioners describing 70 failed projects.
10 Charette (2005)
Software projects
Failure factors U U U Not specified. U Not specified.
Does not explicitly state that this is an OISD article but makes reference to sloppy development practices (p. 133).
11 Chow & Cao (2008)
Agile software projects
Critical success factors
D U U Agile software projects. S Survey of agile professionals (constituting 109 projects in 25 countries) and multiple regression techniques (quantitative)
Not possible to tell if “client” is internal or external.
12 Evans, Abela, & Beltz (2002)
Software projects
Risk characteristics
B U U
Probably USA based projects (including development projects providing data processing applications).
O Based on a risk assessment company’s database containing 12 years of project assessments.
13 Ewusi-Mensah (1997)
Information systems development projects
Critical issues D U U Project abandonment U Not specified (based on previous research by author).
14 Gaitros (2004) Large software development projects
Common errors
D U U Generic software development.
A Anecdotal (based on author’s experience).

Appendices
314
ID Article Project/system/ process type
Factor type T D P Domain DS Methodology (or data source) Notes
15 Han & Huang (2007)
Software projects
Software risks D U U Generic software projects. S Web based survey of 115 project managers combined with statistical analysis.
16 Hartman & Ashrafi (2002) *
IS/IT projects Critical success factors
B B B Canadian software projects.
I 36 structured interviews (covering 12 projects).
17 Jiang & Klein (1999)
Information systems development
Risks D U U Information systems development in the USA.
S Survey (86 useable questionnaires) of IS project managers combined with statistical analysis.
Perspective is probably client/in house (based on wide variety of organisational settings) but not possible to verify.
18 Jiang & Klein (2001)
Software projects
Risks D U U IS software development in the USA.
S Survey (152 useable questionnaires) of IS project managers, project leaders and professionals, combined with statistical analysis.
Refer to Jiang & Klein (1999).
19 Jiang, Klein, & Ellis (2002)
Software development
Risks D U U Information systems development in the USA.
S Survey of 152 IS project managers combined with statistical analysis.
20 Jones (2004) Software project management practices
(Opposing) major factors
D B U
Large software projects (probably in the USA) including information systems, corporations and government agencies.
U Analysis (no details provided) of 250 projects.
21 Kanter & Walsh (2004)
Software development project
Major problem areas
D I I IT organisation in a large , decentralised company in USA.
C Case study (presented anonymously).
22 Keil, Cule, Lyytinen, & Schmidt (1998)
Software projects
Risk factors D U U Software development projects in Finland, Hong Kong, and the USA.
P Three panels of experienced software project managers from Finland, Hong Kong, and the USA. Use of Delphi method.
23 Kim & Peterson (2001)
Information systems
Success factors
D I I Internal information systems development in the USA.
S 79 questionnaires completed by software developers working for large conglomerate companies in the USA. Statistical analysis.

Appendices
315
ID Article Project/system/ process type
Factor type T D P Domain DS Methodology (or data source) Notes
24 Klein, Jiang, & Tesch (2002)
System development projects
Leading indicators
D U I/C IS development in companies in the USA.
S
Survey of 239 experienced IS professionals (IS department managers, IS project leaders, IS analysts and others) from six large private organizations in the USA.
25 Leishman & Cook (2004)
Software projects
Risk factors B U U Software projects. A Anecdotal evidence. Makes a single reference to software companies.
26 Magal, Carr, & Watson (1988)
Information centres (ICs)
Critical success factors
U U I/C ICs in the USA. S Survey of 311 IC managers, directors and analysts combined with statistical analysis.
Includes application development.
27 Mahaney & Lederer (2003)
Information systems development projects
Reasons for failure and risk factors
D B I/C Information systems development in the USA.
I Structured interviews with 12 IS project managers in a variety of industries in the USA.
28 May (1998) Software projects
Failure causes U U U Software development projects (probably in the USA).
I Interviews with practitioners and consultants.
29 Merla (2005) IT projects Key success factors
U U U
“Addresses the typical problems encountered in Information Technology projects” (p.1).
O Post implementation project reviews in an unspecified organisation
Does not explicitly state that this is an OISD article but makes reference to code development tools (p. 6).
30 Milis & Mercken (2002)
ICT investment projects
Success factors
U U I/C ICT investment projects (no details provided).
I
Limited field study of four ICT projects in Belgian banks. Grounded theory approach. 16 in-depth interviews and document analysis. Qualitative data analysis.
31 Moore (1979) MIS software development projects
Characteristics D B U MIS software development projects.
S Survey of 24 department (project) managers in various organisations. Statistical analysis.

Appendices
316
ID Article Project/system/ process type
Factor type T D P Domain DS Methodology (or data source) Notes
32 Moynihan (1996) *
Information systems projects
Factors/themes D S S Information systems projects in Ireland.
I
14 personal construct elicitation sessions with experienced application systems developers managing bespoke software-intensive application development projects for external clients.
33 Nakatsu & Iacovou (2009)
Software development projects
Key risk factors D S C Offshore and domestic outsourcing.
P
A two-panel Delphi study (one domestic and one offshore). 32 participants: experienced IT project managers.
34
Procaccino, Verner, & Lorenzet (2006)
Software development
Process success drivers
D B U Software development in USA.
S Online survey of 30 developers at 20 US based software development organizations/departments.
35 Reel (1999) Software projects
Critical success factors
U U U Software projects. A Not specified. Assumed to be anecdotal.
36 Richardson & Ives (2004)
Software development processes
Reasons for project failure
D U U Software development projects.
O Based on findings of previous studies (no specified).
37 Ropponen & Lyytinen (2000)
Software development
Risk components
D B U Software development in Finland.
S Survey of 83 Finnish project managers. Statistical analysis.
38 Salmeron & Herrero (2005)
Executive information systems
Critical success factors
D U I/C Executive information systems.
O Analytic hierarchy process (AHP) based research based on 18 EIS users.
39 Sauer & Cuthbertson (2003)
IT project management in the UK
Risk factors B B U IT project management in the UK.
S Web survey of 1,456 IT project managers.
40 Sharma, Sengupta, & Gupta (2011) *
Software projects
Risk factors (dimensions)
D S B Software projects in India. S 300 questionnaires (IT professionals) and quantitative analysis.
Makes specific reference to in-house and outsourced development.

Appendices
317
ID Article Project/system/ process type
Factor type T D P Domain DS Methodology (or data source) Notes
41 Standish Group (1995)
IT application development
Success factors
U U U
US companies with an MIS (8380 applications). Companies, operating in a range of industries, vary in size.
S Surveys (365 respondents), focus groups and personal interviews (IT executive managers).
42 Standish Group (2001)
IT application development
Success factors
U U U Not specified (refer to notes).
S Not specified (refer to notes).
Domain and methodology details assumed to be similar to Standish Group (1995).
43 Standish Group (2009b)
IT application development
Success factors
U U U Not specified (refer to notes).
S Not specified (refer to notes).
Domain and methodology details assumed to be similar to Standish Group (1995).
44 Taylor (2000) IT projects Critical success factors
U U U IT projects in the UK. I Detailed questioning of 38 members of the BCS, APM and Institute of management.
45
Tesch, Kloppenborg, & Frolick (2007)
Software development projects
Risks D U U Software development projects (USA).
S Survey of 23 project management professionals (PMP) practitioners followed by group (panel) work.
46 Tiwana & Keil (2004)
Software development
Key risk drivers D U C Software development projects.
S Survey of 61 IS/IT directors in a variety of companies and statistical analysis.
Perspective seems to be predominantly client based.
47 Ugwu & Kumaraswamy (2007)
ICT projects Critical success factors
B U C ICT projects in the construction industry.
S Survey of 40 client based stakeholder groups. QS = quantity surveyor?
48 (Verner & Evanco, 2005)
In-house software development
Project management practices
D I I In-house software development (in Australia and the USA?).
S Survey (questionnaire) or 101 in-house development practitioners and statistical analysis.

Appendices
318
ID Article Project/system/ process type
Factor type T D P Domain DS Methodology (or data source) Notes
49 Verner, Overmyer, & McCain (1999)
Software development projects
Success and failure factors
D U U Software development projects (in the USA).
I Interviews with 20 software developers.
50 Wallace & Keil (2004)
Software development projects
Risk factors D U U Software development projects.
S Web based survey of 507 software project
Managers and statistical analysis.
51 Wallace, Keil, & Rai (2004)
Software projects
Risks D U U Software projects. S Mainly a survey of 507 software project managers and statistical analysis.
52 Walsh & Kanter (1988)
Application development
Major problem areas
D I I Application development. C Case study.
53
Warkentin, Moore, Bekkering, & Johnston (2009)
Information systems development projects
Risks D U I/C Information systems development projects.
S Two different open-ended questionnaires administered in two stages to IT professionals (eight in each stage).
54 Wateridge (1995)
IT projects Success factors
U U U IT projects. U Prior research.
55 Wohlin & Andrews (2002)
Software projects
Success drivers
D I I Software projects. C Case study is from 12 software projects from one
company with many divisions.
56 Yeo (2002) Information system projects
Critical failure factors
U U U Information system projects.
S Survey of 92 participants (associated with a failed IT project) and statistical analysis.

Appendices
319
Key:
T: type (D: development only, B: both development and packaged system implementation, U: unknown or vague, but development
verified in or inferred by article content).
D: development (B: both, I: in-house, S: supplier-based, U: unknown or vague).
P: perspective (B: both, C: client, I: in-house, S: supplier, U: unknown or vague).
DS: data source (A: anecdotal, C: case study, I: interviews, O: other, P: panels, S: survey, U: unknown).
*: studies containing a supplier’s perspective (article column).

Appendices
320
Appendix 2.3. Success (and failure) factors contained in OISD
project success factor studies
Nomenclature
Success (and failure) factors were coded as entity-characteristic combinations
and are hence depicted thus:
Entity (x): characteristic1, characteristic2, ... characteristicx.
where
x: number of characteristics attributed to the entity (factors per entity)
Actors
Change agents (1): existence of.
Client/host organisation (43): ability\to handle implementation, ability\to manage
goal conflict, ability\to manage privately held information, ability\to manage
shirking, ability\to manage task programmability, business readiness,
commitment, competence\management, competence\project management,
culture, emotional security, energy for project, enthusiasm for project,
expectations\realism, experience\similar projects, geographical distribution,
involvement, involvement\project requirements, involvement\project vision,
language differences with, level of change to be experienced, level of control
of project, opinion\information technology improving productivity,
optimism\unwarranted, organisational units involved, ownership, point of
contact\individuality, point of contact\role, politics, regional differences with,
relationship with suppliers, resistance to change, responsibility, restructuring,
staff turnover, supportiveness, top down management style, turnover,
understanding\CSFs, understanding\requirements, understanding\what they
want, willingness\to handle implementation, work environment.
Domain experts (2): access to, availability.
End users (40): attitude\positive, commitment, communication amongst,
competence\information technology, conflict amongst, cooperativeness,
departments\number of, disparity, effectiveness, enthusiasm, expectations,
expectations\realism, experience, experience\activities to be supported by
project deliverable, experience\information technology, feedback from,
hierarchical levels, involvement, involvement\adequate time for,
involvement\answering questions, involvement\coding walkthroughs,
involvement\estimating, involvement\project team, involvement\requirements

Appendices
321
definition, involvement\software design, involvement\software development,
number of, opinion\project deliverable meeting their needs, opinion\use of
information technology in the workplace, ownership, resistance to change,
satisfaction, staff turnover, supportiveness, training needs,
understanding\application type, understanding\project
deliverable\capabilities, understanding\project deliverable\limitations,
understanding\project roles, understanding\software development.
Implementation team (1): number of members\fit with project.
Partner organisations (2): competence, engagement of.
Project board (17): commitment, competence, competence\information
technology, competence\leadership skills, confidence, effectiveness,
expectations\realism, experience, involvement, lessons learned, ownership,
perceived benefit from project deliverable, priority for project, readiness for
the use of project deliverable, strength, supportiveness, willingness\to
provide resources.
Project champion (2): competence\leadership skills, existence of.
Project manager (14): characteristics, competence, competence\leadership
skills, competence\managerial skills, competence\people skills,
competence\project management, competence\social skills, conflict with
other project managers, effectiveness, experience, power,
supportiveness\adding extra personnel to meet an aggressive schedule\late
in project, supportiveness\long working hours, understanding\end users
needs.
Post implementation support team (1): competence.
Project sponsor (13): commitment, competence, existence of,
involvement\approval obtained at each stage, involvement\is consulted at all
stages of development, involvement\is consulted at all stages of
implementation, involvement\is informed of the project status at each stage,
involvement\project objectives, involvement\project requirements,
involvement\project vision, seniority, staff turnover, supportiveness.
Project stakeholders (8): competence, conflict amongst, continuous debate
amongst, continuous evaluation amongst, early identification of, involvement,
involvement\project team, politics.
Project team (60): ability\to carry out tasks efficiently, ability\to understand
human implications of project deliverable, ability\to work with project board,
ability\to work with uncertain objectives, adequately trained, attitude\positive,

Appendices
322
characteristics, collaboration, commitment, communication\intra team,
communication amongst, competence, competence\administrative skills,
competence\availability when required, competence\fit with project,
competence\information technology, competence\interpersonal skills,
competence\negotiation skills, competence\skills mix, competence\social
skills, competence\software development, competence\teamwork,
competence\technical, competence\when required, conflict amongst, degree
of fracture, diversity, effectiveness, experience, experience\application type,
experience from working on project, focussed, hard working, high performing,
involvement\decision making, involvement\ex project, level of feedback
received from project manager, morale, number of members, number of
members\fit with project, pressurisation of, remuneration for working long
hours, role clarity, role definition, staff turnover, understanding\application
area, understanding\application type, understanding\development
environment, understanding\development methods,
understanding\development platform, understanding\development tools,
understanding\client/host organisation\business sector,
understanding\client/host organisation\country, understanding\client/host
organisation\culture, understanding\client/host organisation\issues,
understanding\client/host organisation\language, understanding\client/host
organisation\operations, understanding\client/host organisation\target
operations, understanding\requirements, willingness to be constrained by
formal standards.
Project team\systems architect (1): effectiveness.
Supplier organisation (8): adequate staffing, commitment,
competence\technical, dependency on, number of, supportiveness,
understanding\project complexity, understanding\requirements.
Supplier organisation\consultants (1): number of.
Artefacts
Best practices (1): utilisation of.
Business case (1): fitness for purpose.
Business data (1): fitness for purpose.
Change requests (3): agreement of, conflict amongst, number of.
Control system (1): fitness for purpose.
Design specification (2): fitness for purpose, stability.

Appendices
323
Estimates (4): accuracy, developer driven, fitness for purpose, reliability.
Evaluation mechanisms (1): fitness for purpose.
Issues\communication (1): number of.
Issues\implementation (1): number of.
Issues\information (1): number of.
Issues\technical (1): number of.
IT infrastructure (2): fitness for purpose, standardisation.
Methodologies\development (3): fitness for purpose, fit with project, utilisation
of.
Methodologies\development\agile (1): utilisation of.
Methodologies\development\formal (1): fitness for purpose.
Methodologies\development\life cycle models (1): fitness for purpose.
Methodologies\project management (1): utilisation of.
Methodologies\project management\practices\essential (1): utilisation of.
Methodologies\project management\practices\formal (1): utilisation of.
Monitoring system (1): fitness for purpose.
Objectives\business (1): clarity.
Project budget (2): fitness for purpose, level of detail.
Project contracts (1): outcome based.
Project deliverable (24): architecture\fitness for purpose, complexity, criticality,
customisation, ease of use, ease of validation, fitness for purpose, flexibility,
functionality, links to other systems, links to other systems\future, need for
new software, operational efficiency, perceived utility, performance,
productivity, reliability, reversibility, sensitivity, sophistication, standardisation,
tailoring, technology acquisition, utilisation of.
Project deliverable\hardware (4): complexity, fitness for purpose, need for new
hardware, standardisation.
Project deliverable\software\database (1): complexity.

Appendices
324
Project deliverable\technology (6): availability, complexity, fitness for purpose,
maturity, stability, utilisation of\on prior projects.
Project deliverable\user interface (1): fitness for purpose.
Project documentation (1): fitness for purpose.
Project due date (3): artificial, determined with adequate requirements, realism.
Project milestones (2): fitness for purpose, granularity.
Project mission (1): clarity.
Project objectives (13): agreement of, alignment to client/host organisation,
challenging, clarity, communication of, completeness, fitness for purpose,
realisation of, realism, robustness, stability, understanding of, utilisation of\to
convince others.
Project plan (9): currency, fitness for purpose, has built in resource buffers,
incorporates project risks, level of detail, negative effect on project team\life,
negative effect on project team\motivation, realism, reasonableness.
Project resources (4): consistent application of, loss of to competing projects,
sufficiency, utilisation of.
Project specification (3): ability to meet, completeness, stability.
Project success criteria (3): agreement of, continuous evaluation of, fitness for
purpose.
Project team environment (1): fitness for purpose.
Project vision (1): clarity.
Requirements (22): accuracy, agreement of, availability, clarity, communication
of, completeness, conflict amongst, correctness, currency, excessiveness,
fitness for purpose, ignored for the sake of technology, known in advance,
level of detail, minimisation, negotiation of, optimisation, realism\accepted by
project team as such, scope creep, stability, strategic content, understanding
of.
Requirements\business (2): ambiguity, stability.
Reward mechanisms (1): fitness for purpose.
Software maintenance procedures (1): fitness for purpose.
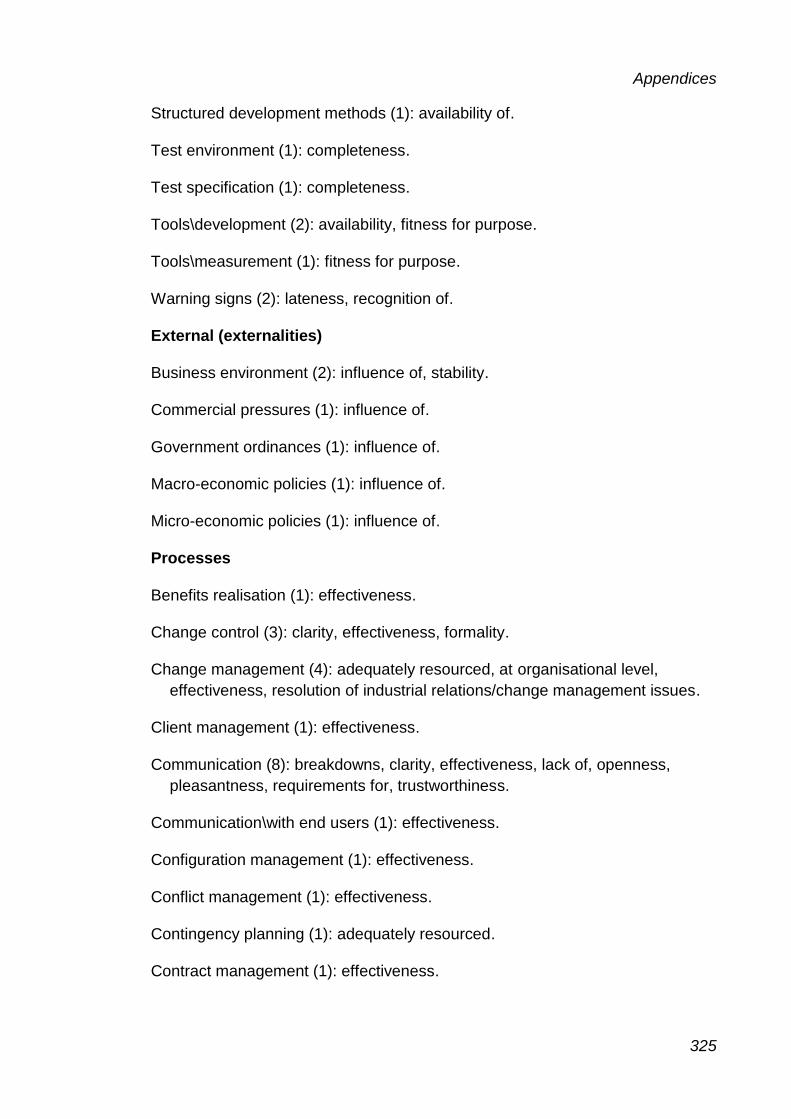
Appendices
325
Structured development methods (1): availability of.
Test environment (1): completeness.
Test specification (1): completeness.
Tools\development (2): availability, fitness for purpose.
Tools\measurement (1): fitness for purpose.
Warning signs (2): lateness, recognition of.
External (externalities)
Business environment (2): influence of, stability.
Commercial pressures (1): influence of.
Government ordinances (1): influence of.
Macro-economic policies (1): influence of.
Micro-economic policies (1): influence of.
Processes
Benefits realisation (1): effectiveness.
Change control (3): clarity, effectiveness, formality.
Change management (4): adequately resourced, at organisational level,
effectiveness, resolution of industrial relations/change management issues.
Client management (1): effectiveness.
Communication (8): breakdowns, clarity, effectiveness, lack of, openness,
pleasantness, requirements for, trustworthiness.
Communication\with end users (1): effectiveness.
Configuration management (1): effectiveness.
Conflict management (1): effectiveness.
Contingency planning (1): adequately resourced.
Contract management (1): effectiveness.

Appendices
326
Cost management (2): accuracy, effectiveness.
Data conversion (1): effectiveness.
Decision making (1): timeliness.
Estimating (2): effectiveness, to agreed targets.
Expectation management\end users (1): effectiveness.
Human resource management (1): effectiveness.
Interface management (1): effectiveness.
Issue management (2): effectiveness, proactive approach to.
Personnel management (1): effectiveness.
Personnel recruitment (1): delays in.
Personnel selection (1): effectiveness.
Post mortem reviews (1): effectiveness.
Programme management (1): leadership.
Project (14): adherence\business purpose, benefit\quantification of, benefit\to
client/host organisation, complexity, conflict amongst, cost, delivery strategy,
functional decomposition, getting a quick start, politics, schedule pressure,
similarity to previous projects, size, urgency.
Project closure (1): authorities\definition of.
Project conceptualisation (1): effectiveness.
Project control (2): effectiveness, responsiveness to project status.
Project control\suppliers (1): effectiveness.
Project execution (1): effectiveness.
Project governance (1): effectiveness.
Project management (3): effectiveness, evolutionary, proactive approach to.
Project monitoring (3): effectiveness, monitors progress closely, to agreed
targets.

Appendices
327
Project monitoring\milestone tracking (1): effectiveness.
Project monitoring\suppliers (1): effectiveness.
Project\processes (6): alignment to development approach, existence of,
following of, maturity, review at the end of each phase, standardisation.
Prototyping (1): rapidity.
Requirements analysis (1): effectiveness.
Requirements definition (4): effectiveness, number of methods used,
thoroughness, utilisation of prototypes.
Requirements elicitation (2): effectiveness, time available for.
Requirements management (2): effectiveness, risks associated with.
Resource management (2): delays in, effectiveness.
Risk analysis (2): assumptions\fitness for purpose, effectiveness.
Risk assessment (2): continuous, effectiveness.
Risk management (3): continuous, effectiveness, proactive approach to.
Role/responsibility definition (1): effectiveness.
Software design (1): effectiveness.
Software development (8): cost, development environment, development
language, duration, effectiveness, evolutionary approach, freedom of choice
of platform, methods used.
Software development\walkthroughs (1): frequency.
Software implementation (1): delays in.
Software testing (1): effectiveness.
Software testing\UAT (1): effectiveness.
Subcontracting (1): risks associated with.
System implementation (1): effectiveness.
Target business processes (5): complexity, level of change, level of managerial
activity being supported, maturity, number of.

Appendices
328
Training (1): effectiveness.
Training\end users (1): effectiveness.
Training\project team (1): effectiveness.
Victory celebrations (1): prematurity.

Appendices
329
Appendix 2.4. The 60 most cited success (and failure) factors
contained in OISD project success factor studies
Rank Entity type Entity Characteristic Citations
1 Actor End users Involvement 18
2 Actor Project board Supportiveness 14
Actor Project team Competence 14
Process Project planning Effectiveness 14
5 Artefact Requirements Stability 11
Process Project management Effectiveness 11
7 Artefact Requirements Fitness for purpose 10
8 Artefact Estimates Fitness for purpose 7
Artefact Project deliverable\technology Maturity 7
Artefact Requirements Clarity 7
Process Communication Effectiveness 7
12 Actor Client/host organisation Staff turnover 6
Actor Project team Competence\fit with project
6
Process Change control Effectiveness 6
Process Project control Effectiveness 6
Process Project monitoring Effectiveness 6
Process Project Size 6
Process Risk management Effectiveness 6
19 Actor Project manager Experience 5
Actor Project team Competence\ technical
5
Actor Project team Experience 5
Artefact Requirements Completeness 5
Process Estimating Effectiveness 5
Process Project Complexity 5
Actor Client/host organisation Involvement 4
Actor End users Involvement\ requirements definition
4
Actor Project board Commitment 4
Actor Project board Involvement 4

Appendices
330
Rank Entity type Entity Characteristic Citations
Actor Project team Understanding\ host organisation\ operations
4
Artefact Project objectives Fitness for purpose 4
Artefact Project plan Fitness for purpose 4
Artefact Requirements Understanding of 4
Process Change management Effectiveness 4
Process Requirements definition Effectiveness 4
35 Actor Client/host organisation Commitment 3
Actor Client/host organisation Ownership 3
Actor Client/host organisation Politics 3
Actor End users Commitment 3
Actor End users Resistance to change
3
Actor Project sponsor Existence of 3
Actor Project team Number of members\fit with project
3
Actor Supplier organisation Number of organisations
3
Artefact Issues\technical Number of 3
Artefact IT infrastructure Fitness for purpose 3
Artefact Methodologies\development Utilisation of 3
Artefact Project budget Fitness for purpose 3
Artefact Project deliverable Complexity 3
Artefact Project deliverable Fitness for purpose 3
Artefact Project deliverable Links to other systems
3
Artefact Project objectives Stability 3
Artefact Project resources Sufficiency 3
Artefact Requirements Communication of 3
External Business environment Stability 3
Process Communication Lack off 3
Process Expectation management Effectiveness 3
Process Project reporting Effectiveness 3
Process Requirements management Effectiveness 3
Process Role/responsibility definition Effectiveness 3
Process Software development Effectiveness 3

Appendices
331
Rank Entity type Entity Characteristic Citations
Process Training\end users Effectiveness 3
Table 1. The 60 most cited OISD project success factors (success factors with three or more citations from a sample of 56 articles)
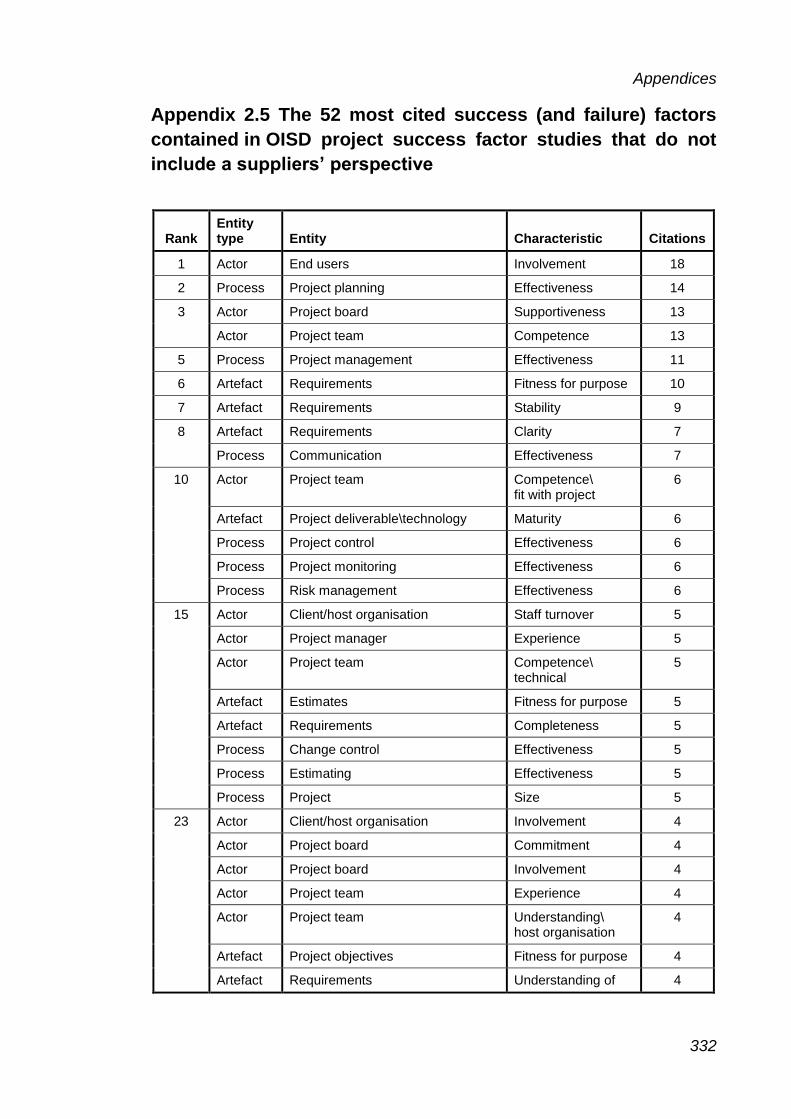
Appendices
332
Appendix 2.5 The 52 most cited success (and failure) factors
contained in OISD project success factor studies that do not
include a suppliers’ perspective
Rank Entity type Entity Characteristic Citations
1 Actor End users Involvement 18
2 Process Project planning Effectiveness 14
3 Actor Project board Supportiveness 13
Actor Project team Competence 13
5 Process Project management Effectiveness 11
6 Artefact Requirements Fitness for purpose 10
7 Artefact Requirements Stability 9
8 Artefact Requirements Clarity 7
Process Communication Effectiveness 7
10 Actor Project team Competence\ fit with project
6
Artefact Project deliverable\technology Maturity 6
Process Project control Effectiveness 6
Process Project monitoring Effectiveness 6
Process Risk management Effectiveness 6
15 Actor Client/host organisation Staff turnover 5
Actor Project manager Experience 5
Actor Project team Competence\ technical
5
Artefact Estimates Fitness for purpose 5
Artefact Requirements Completeness 5
Process Change control Effectiveness 5
Process Estimating Effectiveness 5
Process Project Size 5
23 Actor Client/host organisation Involvement 4
Actor Project board Commitment 4
Actor Project board Involvement 4
Actor Project team Experience 4
Actor Project team Understanding\ host organisation
4
Artefact Project objectives Fitness for purpose 4
Artefact Requirements Understanding of 4

Appendices
333
Rank Entity type Entity Characteristic Citations
Process Change management Effectiveness 4
Process Project Complexity 4
Process Requirements definition Effectiveness 4
33 Actor Client/host organisation Commitment 3
Actor Client/host organisation Politics 3
Actor End users Commitment 3
Actor End users Involvement\ requirements management
3
Actor End users Resistance to change
3
Actor Supplier organisation Number of organisations
3
Artefact Issues\technical Number of 3
Artefact IT infrastructure Fitness for purpose 3
Artefact Methodologies\development Utilisation of 3
Artefact Project budget Fitness for purpose 3
Artefact Project objectives Stability 3
Artefact Project plan Fitness for purpose 3
Artefact Project resources Sufficiency 3
Process Communication Effectiveness 3
Process Expectation management Effectiveness 3
Process Project reporting Effectiveness 3
Process Requirements management Effectiveness 3
Process Role/responsibility management Effectiveness 3
Process Software development Effectiveness 3
Process Training\end users Effectiveness 3
Table 1. The 52 most cited OISD project success factors (success factors with three or more citations from a sample of 52 articles)

Appendices
334
Appendix 3.1. Entity-based coding book
Actors
Change agents, client organisation, domain experts, end users, host
organisation, implementation team, partner organisations, project board, project
champion, project manager, post implementation support team, project sponsor,
project stakeholders, project team, project team\systems architect, supplier
organisation, supplier organisation\consultants, supplier organisation\project
team\offshore.
Artefacts
Business case, business data, change requests, control systems, estimates,
evaluation mechanisms, issues\communication, issues\implementation,
issues\information, issues\system operation, issues\technical, IT infrastructure,
measurement tools, methodologies\project management, methodologies\project
management\practices\essential, methodologies\project management
practices\formal, methodologies\software development, methodologies\software
development\agile, methodologies\software development\formal,
methodologies\software development\life cycle models, monitoring systems,
objectives\business, project budget, project contracts, project deliverable,
project deliverable\hardware, project deliverable\software\database, project
deliverable\technology, project deliverable\user interface, project documents,
project due date, project milestones, project mission, project objectives, project
plan, project resources, project specification, project success criteria, project
team work environment, project vision, requirements, reward mechanisms,
software development tools, software maintenance procedures, software testing
environment, specifications\software design, specifications\software testing,
warning signs.
Externalities
Best practices, business environment, commercial pressures, government
ordinances, macro-economic policies, micro economic policies.

Appendices
335
Processes
Benefits realisation, change control, change management, client management,
communication, communication with end users, configuration management,
conflict management, contingency planning, contract management, cost
management, data migration, decision making, estimating, expectation
management\end users, human resources management, interface
management, issue management, project closure, project conceptualisation,
project control, project control\suppliers, personnel recruitment, personnel
selection, project execution, project governance, project management, project
monitoring, project monitoring\suppliers, post mortem reviews, project planning,
project quality control, project reporting, programme management, project,
project\processes, prototyping, project start-up, requirements analysis,
requirements definition, requirements elicitation, requirements management,
resource management, risk analysis, risk assessment, risk management,
role/responsibility definition, software design, software development, software
development\walkthroughs, software testing, software testing\user acceptance
testing, subcontracting, system implementation, target business processes,
training, training\end users, training\project team, victory celebrations.
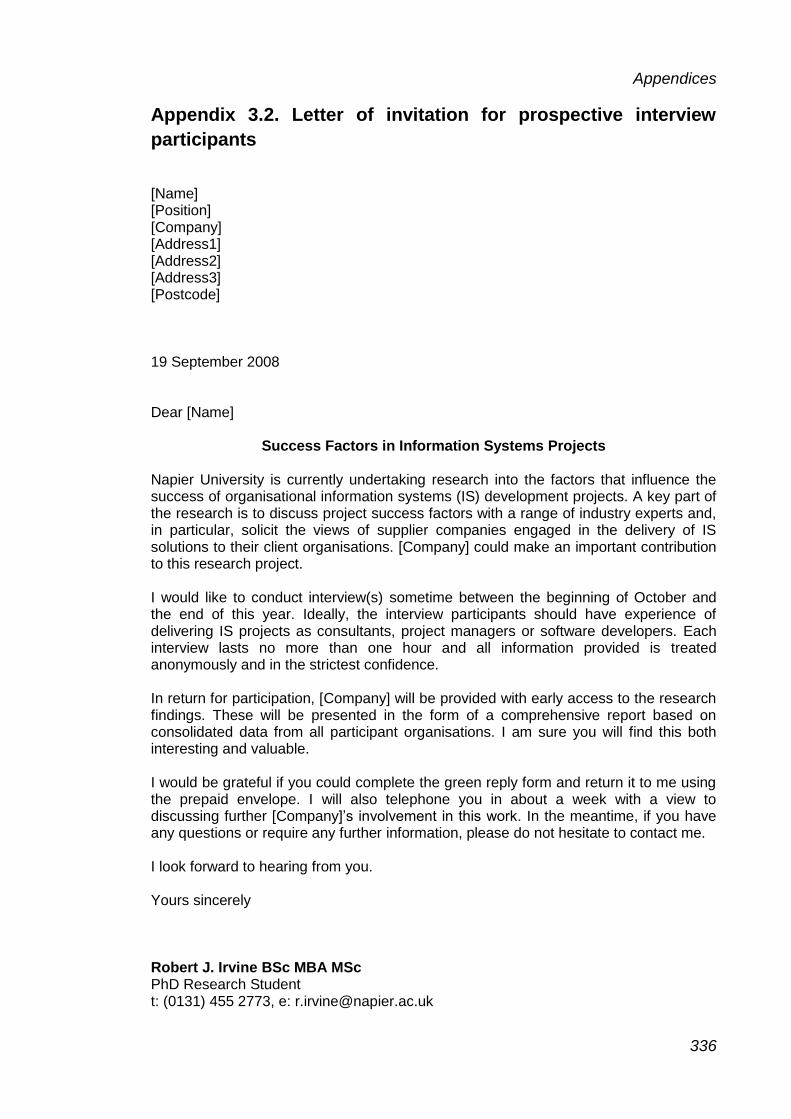
Appendices
336
Appendix 3.2. Letter of invitation for prospective interview
participants
[Name] [Position] [Company] [Address1] [Address2] [Address3] [Postcode] 19 September 2008 Dear [Name]
Success Factors in Information Systems Projects
Napier University is currently undertaking research into the factors that influence the success of organisational information systems (IS) development projects. A key part of the research is to discuss project success factors with a range of industry experts and, in particular, solicit the views of supplier companies engaged in the delivery of IS solutions to their client organisations. [Company] could make an important contribution to this research project. I would like to conduct interview(s) sometime between the beginning of October and the end of this year. Ideally, the interview participants should have experience of delivering IS projects as consultants, project managers or software developers. Each interview lasts no more than one hour and all information provided is treated anonymously and in the strictest confidence. In return for participation, [Company] will be provided with early access to the research findings. These will be presented in the form of a comprehensive report based on consolidated data from all participant organisations. I am sure you will find this both interesting and valuable. I would be grateful if you could complete the green reply form and return it to me using the prepaid envelope. I will also telephone you in about a week with a view to discussing further [Company]’s involvement in this work. In the meantime, if you have any questions or require any further information, please do not hesitate to contact me. I look forward to hearing from you. Yours sincerely Robert J. Irvine BSc MBA MSc PhD Research Student t: (0131) 455 2773, e: [email protected]

Appendices
337
Appendix 3.3. Response form for prospective interview
participants

Appendices
338
Appendix 3.4. Interview participant guidelines
This appendix contains the slides used as a guide for the participants during the fieldwork interviews.

Appendices
339
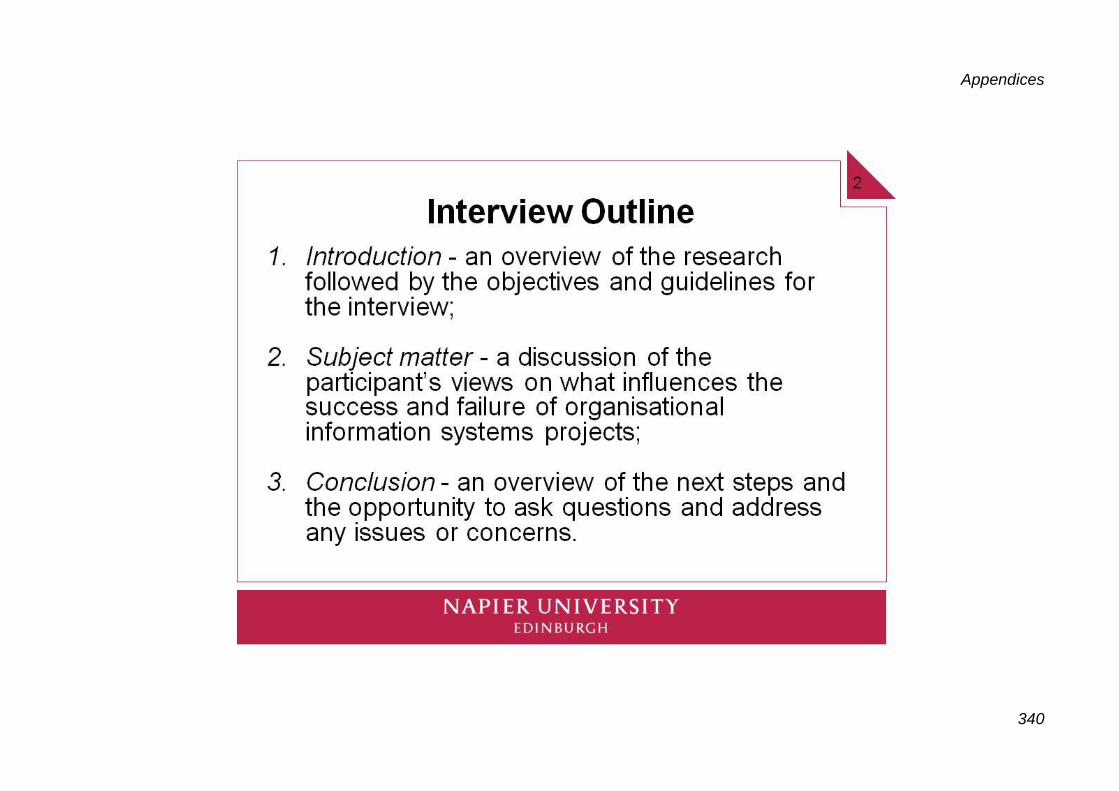
Appendices
340

Appendices
341

Appendices
342

Appendices
343

Appendices
344

Appendices
345

Appendices
346

Appendices
347

Appendices
348
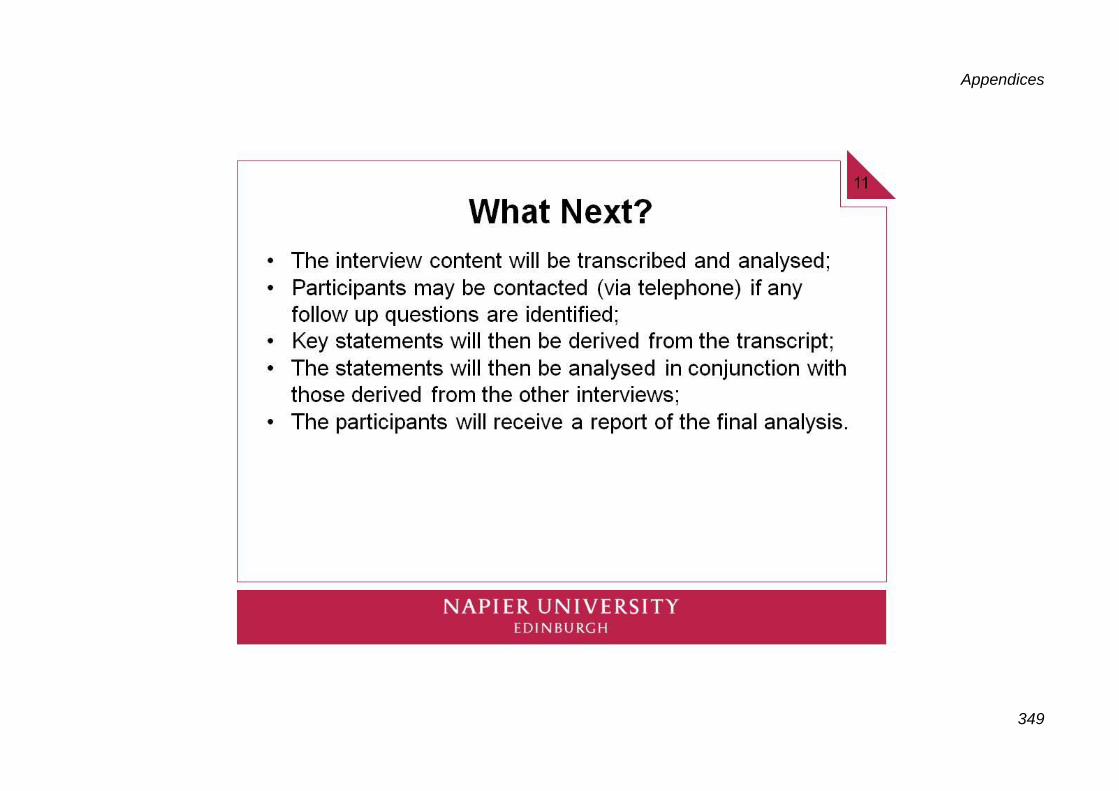
Appendices
349

Appendices
350

Appendices
351
Appendix 3.5. Requirements specification for the propagation
software
1 Stage one requirements
1.1 Functional requirements
Functionality is required to:
(1) Read the input files (described below) and construct the relationship
network;
(2) For each factor in the relationship network (or otherwise as specified by
the parameters in the parameters.txt input file):
(1) Propagate the factor’s influence to all of its target factors (one by
one), repeating the process while the termination code of the
target factor is found to be zero;
(2) When a non-zero termination code is encountered (as listed
below), terminate the propagation process and record the reason
for termination;
Code Description (reason)
0 Continue with propagation process
1 [suc:project:success] encountered
2 Factor causes loop
3 Maximum chain length exceeded
4 Factor is impotent (has no outbound relationships)
(3) If the termination code equals one:
(1) Increment the activity level for each of the factors and
relationships involved in the propagation process;
(2) Write the details of the causal chain to the output.txt file
(described below);
(4) Once the chain has been terminated, repeat all of the steps above
for the next factor in the relationship network;
(3) Write the output files (as described below).

Appendices
352
1.2 Input files
1.2.1 parameters.txt
Field # Description
1 Id
2 Value
Parameter Id Description
AGREEMENTLEVEL Minimum interview count (agreement amongst interviews) used by the propagation process to determine if a factor should be treated as a base factor. Base factors are those with an interview count greater than or equal to the agreement level.
DATAFOLDER The data folder within which the input and output subfolders will be located. Note: this value must also be implemented as a command line argument.
MAXCHAINLENGTH Maximum chain length allowed by the propagation process
1.2.2 relationships.txt
Field # Description
1 Source factor Id
2 Source factor’s project type (1 to 5)
3 Influence type: (dir)ectly or (inv)ersely proportional. These map to -p-> (positive) and -n-> (negative) respectively for output reports.
4 Target factor Id
5 Target factor’s project type (1 to 5)
1.3 Output files
1.3.1 chains.txt (flat file)
For each unique chain generated by the propagation process, write the source
factor id, influence type, target factor id, chain length, relationship path and
termination details (code and reason).

Appendices
353
1.3.2 log.summary.txt (flat file)
Write a summary of the propagation process (e.g. parameters, data set
analysis, run time properties, propagation analysis and termination analysis).
Incorporate entity and factor breakdown by entity type and project type as
appropriate.
1.3.3 log.entities.txt
For each entity in the relationship network, write the following data:
Field # Description
1 Entity Id
2 Activity level
3 Total inbound relationship count
4 Active inbound relationship count
5 Total outbound relationship count
6 Active outbound relationship count
7 Target entity count (number of other entities influenced by this entity)
1.3.4 log.factors.txt
For each factor in the relationship network, write the following data:
Field # Description
1 Factor Id
2 Project type
3 Activity level
4 Active chain count
5 Average chain length
6 Total inbound relationship count
7 Active inbound relationship count
8 Total outbound relationship count
9 Active outbound relationship count
10 Total loop count
11 Average loop length
12 MCL chain count
13 Inactive (impotent) chain count

Appendices
354
1.3.5 log.factors.base.txt
Identical to log.factors.txt but only for base factors with interview counts greater
than or equal to the AGREEMENTLEVEL parameter.
1.3.6 log.relationships.txt
For each relationship in the relationship network, write the following data:
Field # Description
1 Source factor Id
2 Relationship type
3 Target factor Id
4 Activity level
1.3.6 log.entities.targets.txt
For (source) entities in the relationship network that have active relationships
with their target entities, write the following data:
Field # Description
1 Source entity Id
2 Target entity Id
3 Activity level
2 Stage two enhancements 2.1 Functional requirements
Functionality required to:
(1) Cope with the large number of unique propagation chains:
(1) Implement total, active and output chains;
(2) Add new parameters to restrict/modify the propagation process;
(3) Split output files;
(2) Restrict data input (relationships) by record and interview Id;
(3) Implement interview counts by entity, factor and relationship.

Appendices
355
2.2 Input files
2.2.1 parameters.txt (new parameters)
Parameter Description
ACTIVECHAINLIMIT Limits the number of active chains
ACTIVITYUPDATECODE Activity update code: 1 - detailed, 2 – estimated. Note: is now redundant - should be set to 2 only.
AGREEMENTLEVEL Agreement level between interviews required for a base factor to be propagated. Can be used to propagate selected factors only.
BASEFACTORID Limits the propagation process to this factor (overrides factor range parameters)
CHAINSPEROUTPUTFILE Number of (output) chains per output (chains) file
DATASETNAME Name of the data set e.g. All interviews
FACTORRANGEBEGIN Limits the propagation process to factors greater than or equal to this factor
FACTORRANGEEND Limits the propagation process to factors less than or equal to this factor
MAXOUTPUTCHAINS Maximum number of output chains
PROPAGATIONNAME Name of the propagation e.g. Project interventions
PROPAGATE Should the propagation process be executed (yes/no). Normally set to yes
TERMINATIONCODE Termination code used by the propagation process to denote an output chain. Note: is now redundant - should always be set to 1
TERMINATIONFACTORID Factor used by the propagation process to denote an active chain (normally suc:project:success)
2.2.2 relationships.txt (modified)
Field # Description
1 Interview Id (new) (ignore record if interview Id is not present in interviews.txt)
2 Source factor Id
3 Source factor’s project type
4 Influence type
5 Target factor Id
6 Target factor’s project type
7 Read record (new) (yes/no) (ignore record if not set to yes)

Appendices
356
2.2.3 interviews.txt (new)
Field # Description
1 Interview Id
2.3 Output files
2.3.1 chains.n.txt (n=1...x)
As above but only for a restricted number of active causal chains as specified
by the parameters in the parameters.txt file.
2.3.2 log.summary.txt
Update to include new propagation data. In particular, differentiate between
total and active chains (entities and factors).
2.3.3 log.entities.txt (modified)
For each entity in the relationship network, write the following data:
Field # Description
1 Entity Id
2 Interview count (new)
3 Activity level
4 Total inbound relationship count
5 Active inbound relationship count
6 Total outbound relationship count
7 Active outbound relationship count
8 Target entity count
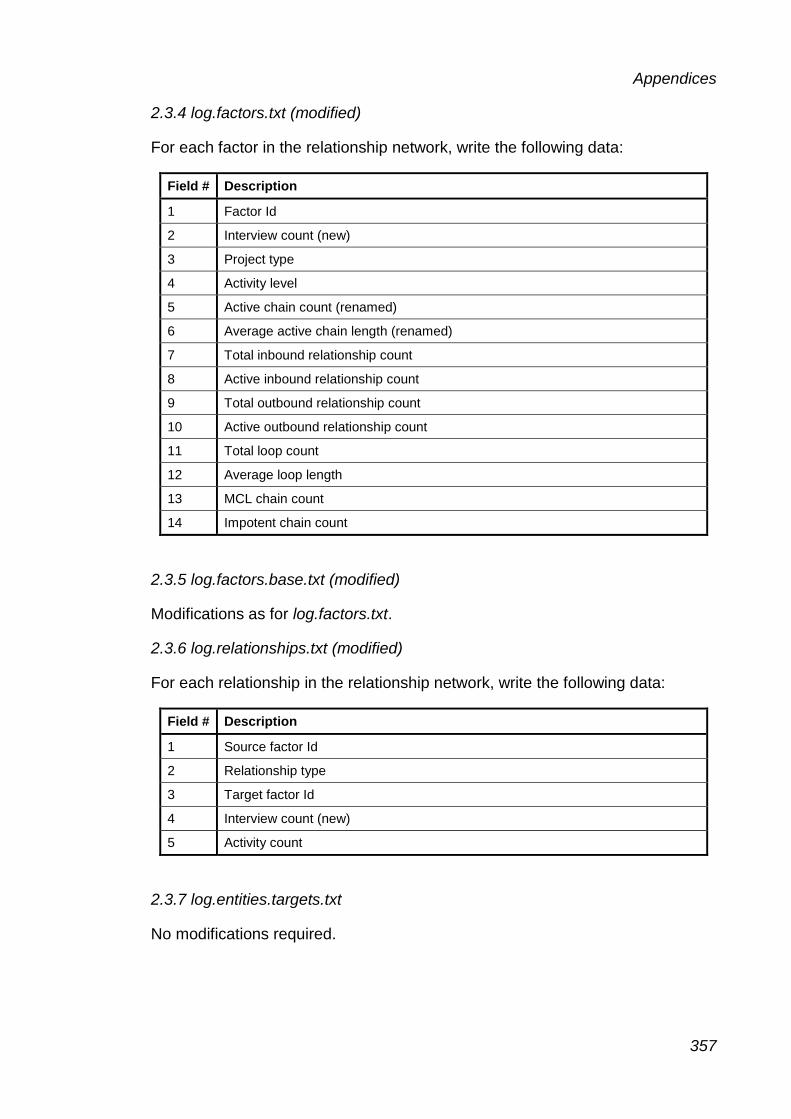
Appendices
357
2.3.4 log.factors.txt (modified)
For each factor in the relationship network, write the following data:
Field # Description
1 Factor Id
2 Interview count (new)
3 Project type
4 Activity level
5 Active chain count (renamed)
6 Average active chain length (renamed)
7 Total inbound relationship count
8 Active inbound relationship count
9 Total outbound relationship count
10 Active outbound relationship count
11 Total loop count
12 Average loop length
13 MCL chain count
14 Impotent chain count
2.3.5 log.factors.base.txt (modified)
Modifications as for log.factors.txt.
2.3.6 log.relationships.txt (modified)
For each relationship in the relationship network, write the following data:
Field # Description
1 Source factor Id
2 Relationship type
3 Target factor Id
4 Interview count (new)
5 Activity count
2.3.7 log.entities.targets.txt
No modifications required.

Appendices
358
2.3.8 log.interviews.txt (new)
For each interview in the relationship network, write the following data:
Field # Description
1 Interview Id
3 Stage three enhancements
3.1 Functional requirements
Functionality required to:
(1) Count the interactions between all factors and those contained in the
interactions.txt file;
(2) Count the interactions between all factors and the base factor when the
base factor and target factor are set to the same value.
3.2 Input files
3.2.1 parameters.txt (new parameters)
Parameter Description
PROCESSLOOPDATA Should loop data be processed (true or false: defaults to false)
3.2.2 interactions.txt (new)
Field # Description
1 Factor Id
3.3 Output files
3.3.1 output.n.txt
No modifications required.
3.3.2 log.summary.txt
Add PROCESSLOOPDATA parameter and interactions count.

Appendices
359
3.3.3 log.entities.txt
No modifications required.
3.3.4 log.factors.txt (modified)
For each factor in the relationship network, write the following data:
Field # Description
1 Factor Id
2 Interview count
3 Project type
4 Activity level
5 Active chain count
6 Average active chain length
7 Total inbound relationship count
8 Active inbound relationship count
9 Total outbound relationship count
10 Active outbound relationship count
11 Total loop count
12 Average loop length
13 MCL chain count
14 Impotent chain count
15 Interaction level
3.3.5 log.factors.base.txt (modified)
Modifications as for log.factors.txt.
3.3.6 log.relationhips.txt
No modifications required.
3.3.7 log.entities.relationships.txt
No modifications required.
3.3.8 log.interviews.txt
No modifications required.

Appendices
360
3.3.9 log.interactions.txt (new)
For each factor in the relationship network, write the following data:
Field # Description
1 Factor Id
2 Chains with loops count
3 Average loop length
4 ...x Number of interactions with factor[1...n] as specified in interactions.txt (n=number of factors in interactions.txt, x=3+n)

Appendices
361
Appendix 3.6. Class design for the propagation software
1 General
Implements the functionality described in the propagation software
requirements document (Appendix 3.5) as an object-oriented (console)
application written in C# (developed using Microsoft’s Visual Studio 2005).
2 Classes
The application comprises seven classes:
Class Description
Chain Used to instantiate chain objects used by the propagation process
Counter Used to instantiate counter objects used to count interactions between factors and those specified in the interactions.txt input file
Entity Used to instantiate entity objects derived from the relationships.txt input file
Factor Used to instantiate factor objects derived from the relationships.txt input file
Loop Used to instantiate loop objects identified during the propagation process
PropagationApp Used to instantiate the propagation application object which in turn executes the propagation process
Relationship Used to instantiate relationship objects derived from the relationships.txt input file

Appendices
362
2.1 Chain class
The class contains the following accessible (read only) properties:
Property (type) Description
Id (string) Identifier (assigned when the causal chain is terminated)
IsDirect (bool) Does the source factor have a directly (as opposed to inversely) proportional relationship with the target factor? Note: direct = positive and inverse = negative
Length (int) Length
SourceFactor (Factor) Source factor
TargetFactor (Factor) Target factor
TerminationCode (int) Termination code
TerminationReason (string) Termination reason
The class contains the following methods:
Method signature Description
public void AddRelationship(
Relationship objRelationship)
Adds a relationship
public Chain Duplicate() Returns a duplicate chain
private ArrayList DuplicateRelationshipList() Duplicates the chain’s relationship list (used by the Duplicate() method)
public bool FactorCausesLoop(
Factor objFactor)
Does the factor cause a loop in the chain? If so, updates the factor’s loop and interaction data.
public void IncrementInteractionLevels() Increments interaction levels between factors and base factor (loop analysis mode only)
private void ResetRelationshipList(
ArrayList newList)
Resets the chain’s relationship list (used by the Duplicate() method)
public static void SetPropagationApp( PropagationApp objPropagationApp)
Sets (stores) the propagation application object
public void Terminate(
int intId,
Factor objTargetFactor,
int intTerminationCode,
string strTerminationReason)
Terminates the chain
public string ToString() Returns a string representation of the chain
public void UpdateChainData() Updates the chain’s activity data
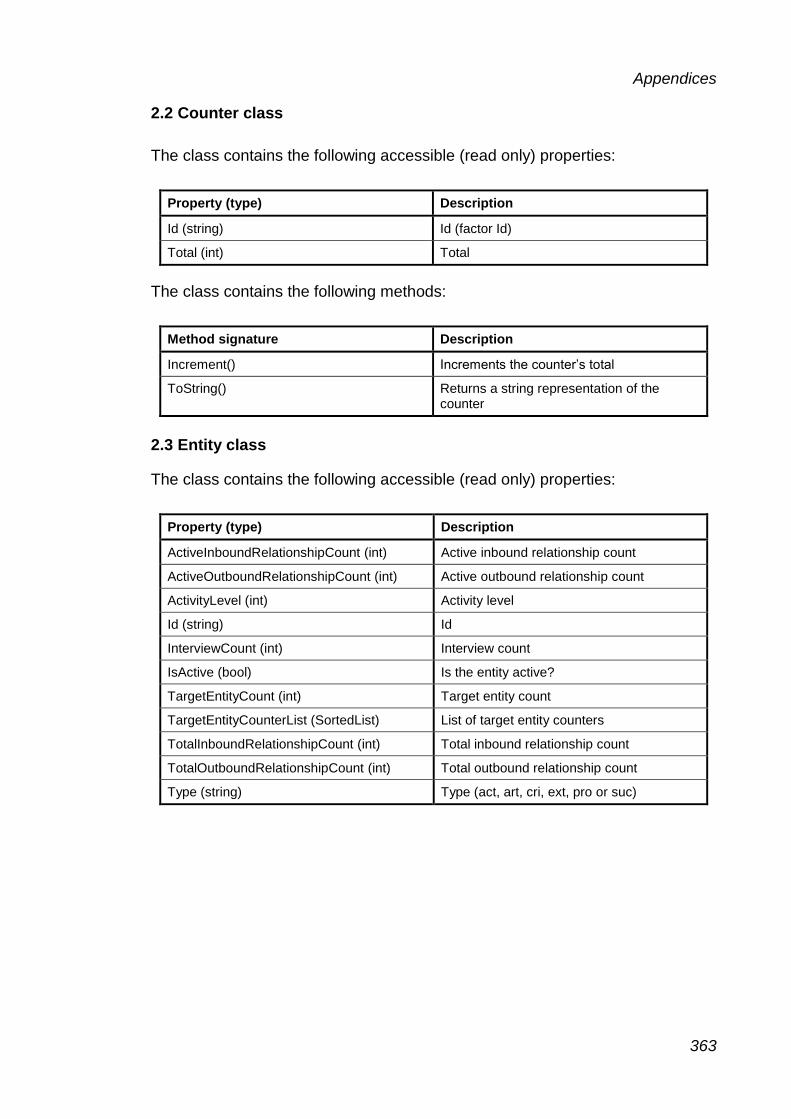
Appendices
363
2.2 Counter class
The class contains the following accessible (read only) properties:
Property (type) Description
Id (string) Id (factor Id)
Total (int) Total
The class contains the following methods:
Method signature Description
Increment() Increments the counter’s total
ToString() Returns a string representation of the counter
2.3 Entity class
The class contains the following accessible (read only) properties:
Property (type) Description
ActiveInboundRelationshipCount (int) Active inbound relationship count
ActiveOutboundRelationshipCount (int) Active outbound relationship count
ActivityLevel (int) Activity level
Id (string) Id
InterviewCount (int) Interview count
IsActive (bool) Is the entity active?
TargetEntityCount (int) Target entity count
TargetEntityCounterList (SortedList) List of target entity counters
TotalInboundRelationshipCount (int) Total inbound relationship count
TotalOutboundRelationshipCount (int) Total outbound relationship count
Type (string) Type (act, art, cri, ext, pro or suc)

Appendices
364
The class contains the following methods:
Method signature Description
public void AddFactor(Factor objFactor) Adds a factor
public void AddInterview(string strId) Adds an interview Id
public void AddTargetEntityCounter(
Counter objCounter)
Adds a target entity counter
public string ToString() Returns a string representation of the entity
public void UpdateActivity() Updates the entity’s activity
Public void UpdateTargetEntityActivity(
string strId)
Updates the entity’s target entity activity
2.4 Factor class
The class contains the following accessible (read only) properties:
Property (type) Description
ActiveChainCount (int) Active chain count
ActiveBaseFactorCount (int) Active base factor count (number of base factors that depend on this factor to propagate their influences to affect project success)
ActiveBaseFactorList (SortedList) List of active base factors (see above)
ActiveInboundRelationshipCount (int) Active inbound relationship count (active vulnerability)
ActiveOutboundRelationshipCount (int) Active outbound relationship count (active potency)
ActiveVulnerableFactorCount (int) Active vulnerable factor count (see below)
ActiveVulnerableFactorList (SortedList) List of active vulnerable factors affected by this factor
ActivityLevel (int) Activity level
ActiveRelationshipCount (int) Active relationship count (see below)
ActiveRelationshipList (SortedList) List of active relationships
AverageActiveChainLength (double) Average active chain length
AverageActiveChainPosition (double) Average active chain position (position relative to end of chain)
AverageLoopLength (double) Average loop length
ChainsWithLoopsCount (int) Chains with loops count
Entity (Entity) Entity
Id (string) Id
ImpotentChainCount (int) Impotent chain count

Appendices
365
Property (type) Description
InteractionCounterList (SortedList) List of interaction counters
InteractionLevel (int) Level of interaction with base factor (loop analysis mode only)
InterviewCount (int) Interview count
IsActive (bool) Is the factor active?
IsBase (bool) Is the factor a base factor?
IsImpotent (bool) Is the factor impotent (factor has no outbound relationships)?
IsPotent (bool) Is the factor potent (factor has outbound relationships)?
IsRoot (bool) Is the factor a root factor (factor has no inbound relationships)?
IsVulnerable (bool) Is the factor vulnerable (factor has inbound relationships)?
LastNumericId (int) Last numeric Id (static property) used to create unique numeric Ids for factors
LoopCount (int) Loop count
MCLChainCount (int) MCL chain count
NumericId (int) Numeric Id
ProjectType (int) Project type
ShouldPropagate (bool) Should the factor be propagated?
TotalInboundRelationshipCount (int) Total inbound relationship count (total vulnerability)
TotalOutboundRelationshipCount (int) Total outbound relationship count (total potency)
The class contains the following methods:
Method signature Description
public void AddActiveBaseFactor(
Factor objFactor)
Adds an active base factor
public void AddActiveRelationship(
Relationship objRelationship)
Adds an active relationship
public void AddActiveVulnerableFactor(
Factor objFactor)
Adds an active vulnerable factor
public void AddInboundRelationship(
Relationship objRelationship)
Adds an inbound relationship
public void AddInteractionCounter(
Counter objCounter)
Adds an interaction counter
public void AddInterview(string strId) Adds an interview Id

Appendices
366
Method signature Description
public void AddOutboundRelationship(
Relationship objRelationship)
Adds an outbound relationship
publicVoid IncrementInteractionLevel() Increments the interaction level between the factor and the base factor (loop analysis mode only)
public void Propagate() Initiates propagation with a new chain
public void Propagate(Chain objChain) Terminates the chain or propagates to target factors
public void Propagate(
Chain objChain,
Relationship objRelationship)
Adds a relationship to the chain and propagates
private void PropagateToTargets(
Chain objChain)
Propagates to target factors
public static void SetPropagationApp(
PropagationApp objPropagationApp)
Sets (stores) the propagation application object
public string ToString() Returns a string representation of the factor
public void UpdateActivity() Updates the factor’s activity
public void UpdateChainData(
int intChainLength)
Updates the factor’s chain data
public void UpdateCumulativeActiveChainPosition(
int intChainPosition)
Updates the cumulative active chain position (used to calculate the average chain position)
public void UpdateLoopData(
int intChainLength)
Updates the factor’s loop data
public void UpdateRelationshipActivity() Updates the factor’s relationship activity
2.5 Loop class
The class contains the following accessible (read only) properties:
Property (type) Description
Id (string) Loop Id
Length (int) Loop length
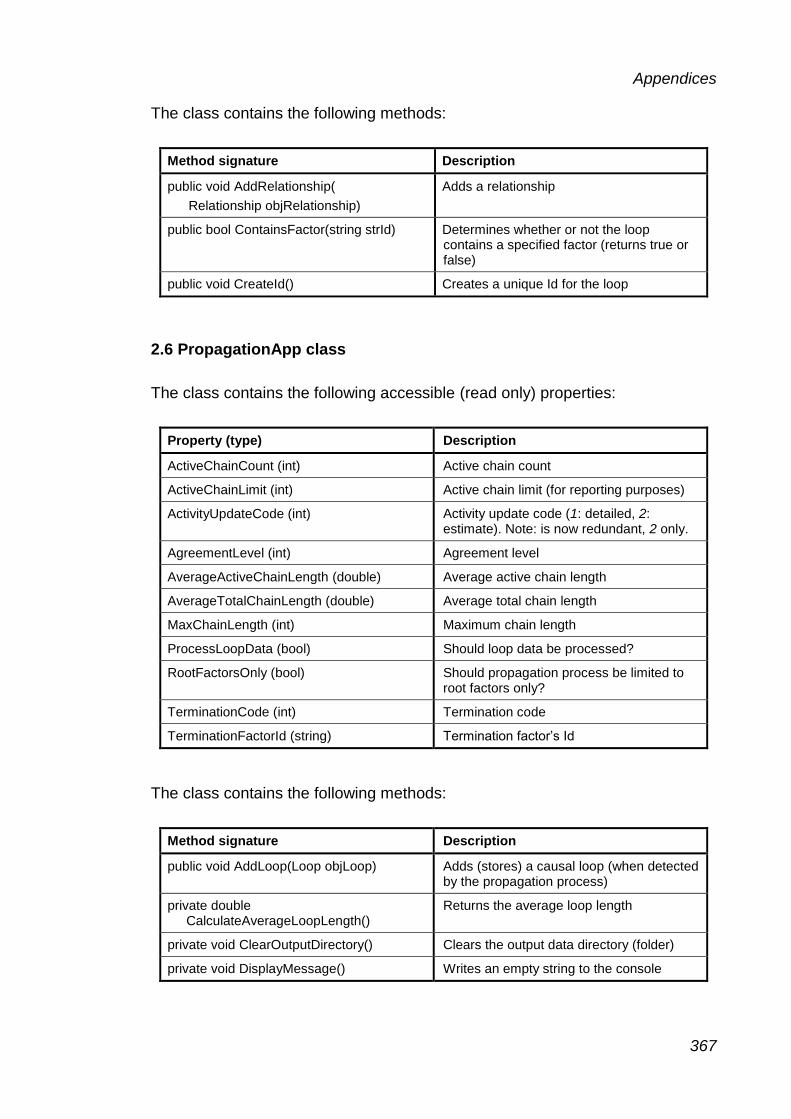
Appendices
367
The class contains the following methods:
Method signature Description
public void AddRelationship(
Relationship objRelationship)
Adds a relationship
public bool ContainsFactor(string strId) Determines whether or not the loop contains a specified factor (returns true or false)
public void CreateId() Creates a unique Id for the loop
2.6 PropagationApp class
The class contains the following accessible (read only) properties:
Property (type) Description
ActiveChainCount (int) Active chain count
ActiveChainLimit (int) Active chain limit (for reporting purposes)
ActivityUpdateCode (int) Activity update code (1: detailed, 2: estimate). Note: is now redundant, 2 only.
AgreementLevel (int) Agreement level
AverageActiveChainLength (double) Average active chain length
AverageTotalChainLength (double) Average total chain length
MaxChainLength (int) Maximum chain length
ProcessLoopData (bool) Should loop data be processed?
RootFactorsOnly (bool) Should propagation process be limited to root factors only?
TerminationCode (int) Termination code
TerminationFactorId (string) Termination factor’s Id
The class contains the following methods:
Method signature Description
public void AddLoop(Loop objLoop) Adds (stores) a causal loop (when detected by the propagation process)
private double CalculateAverageLoopLength()
Returns the average loop length
private void ClearOutputDirectory() Clears the output data directory (folder)
private void DisplayMessage() Writes an empty string to the console
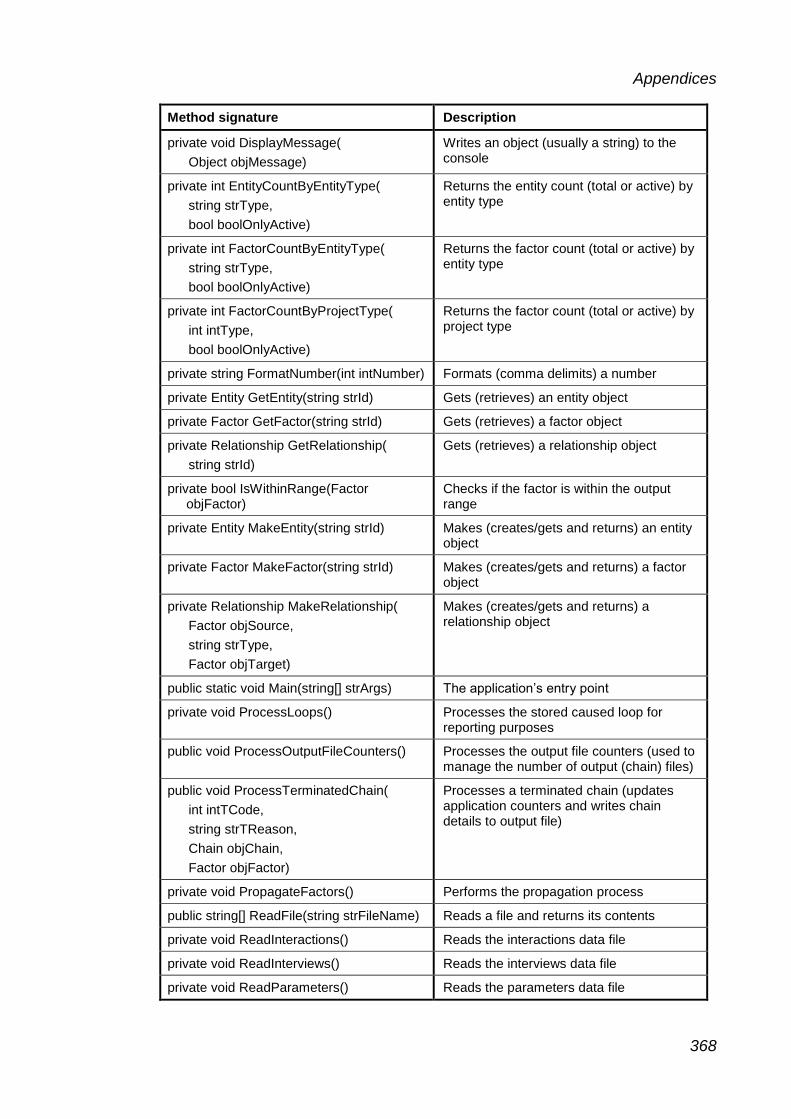
Appendices
368
Method signature Description
private void DisplayMessage(
Object objMessage)
Writes an object (usually a string) to the console
private int EntityCountByEntityType(
string strType,
bool boolOnlyActive)
Returns the entity count (total or active) by entity type
private int FactorCountByEntityType(
string strType,
bool boolOnlyActive)
Returns the factor count (total or active) by entity type
private int FactorCountByProjectType(
int intType,
bool boolOnlyActive)
Returns the factor count (total or active) by project type
private string FormatNumber(int intNumber) Formats (comma delimits) a number
private Entity GetEntity(string strId) Gets (retrieves) an entity object
private Factor GetFactor(string strId) Gets (retrieves) a factor object
private Relationship GetRelationship(
string strId)
Gets (retrieves) a relationship object
private bool IsWithinRange(Factor objFactor)
Checks if the factor is within the output range
private Entity MakeEntity(string strId) Makes (creates/gets and returns) an entity object
private Factor MakeFactor(string strId) Makes (creates/gets and returns) a factor object
private Relationship MakeRelationship(
Factor objSource,
string strType,
Factor objTarget)
Makes (creates/gets and returns) a relationship object
public static void Main(string[] strArgs) The application’s entry point
private void ProcessLoops() Processes the stored caused loop for reporting purposes
public void ProcessOutputFileCounters() Processes the output file counters (used to manage the number of output (chain) files)
public void ProcessTerminatedChain(
int intTCode,
string strTReason,
Chain objChain,
Factor objFactor)
Processes a terminated chain (updates application counters and writes chain details to output file)
private void PropagateFactors() Performs the propagation process
public string[] ReadFile(string strFileName) Reads a file and returns its contents
private void ReadInteractions() Reads the interactions data file
private void ReadInterviews() Reads the interviews data file
private void ReadParameters() Reads the parameters data file

Appendices
369
Method signature Description
private void ReadRelationships() Reads the relationships data file
private void RunApp() Runs the application (reads input files, performs propagation and writes output files)
public string ToString() Returns a string representation of the propagation application
public void UpdateLongestChainLength(
int intChainLength)
Updates the longest chain length
private void WriteLogs() Writes the output logs (entities, factors, relationships, interactions and summary)
public void WriteToOutputFile() Writes an empty string to the current output file
public void WriteToOutputFile(Object objObject)
Writes a string to the current output file
2.7 Relationship class
The class contains the following accessible (read only) properties:
Property (type) Description
ActiveBaseFactorCount (int) Active base factor count (see above)
ActivityLevel (int) Activity level
AverageActiveChainPosition (double) Average active chain position (see above)
Id (string) Id
InfluenceType (string) Influence type
InterviewCount (int) Interview count
IsActive (bool) Is the relationship active?
SourceFactor (Factor) Source factor
TargetFactor (Factor) Target factor

Appendices
370
The class contains the following methods:
Method signature Description
public void AddActiveBaseFactor(
Factor objFactor)
Add an active base factor (see above)
public void AddInterview(string strId) Adds an interview Id
public string ToString() Returns a string representation of the relationship
public void UpdateActivity() Updates the relationship’s activity

Appendices
371
Appendix 3.7. List of propagation runs performed during the relationship analysis
Run Base factor(s) MCL Additional information
1 All factors 10
2 All factors 11
3 All factors 12
4 All factors 13
5 All factors 14
6 All factors 15
7 All factors 16
8 All factors 17
9 All factors 18
10 All factors 19
11 All factors 20 Maximum practicable MCL value for the propagation of all factors
12 act:c-o:arrogance 100 Factor analysis (random factor)
13 act:c-o:expectations 100 Factor analysis (random factor)
14 act:c-o:infighting 100 Factor analysis (random factor)
15 act:c-o:understanding\p-status 100 Factor analysis (random factor)
16 act:c-o\domain-experts:availability 100 Factor analysis (random factor)
17 act:c-o\end-users:comfort-level 100 Factor analysis (random factor)
18 act:c-o\end-users:involvement 100 Factor analysis (random factor)

Appendices
372
Run Base factor(s) MCL Additional information
19 act:c-o\p-board:staff-turnover 100 Factor analysis (random factor)
20 act:c-o\p-sponsor:involvement 100 Factor analysis (random factor)
21 act:c-o\p-sponsor:understanding\issues 100 Factor analysis (random factor)
22 act:c-o\p-team:empowerment 100 Factor analysis (random factor)
23 act:s-o:ability\learning 100 Factor analysis (random factor)
24 act:s-o:need-for-business 100 Factor analysis (random factor)
25 act:s-o:trustworthiness 100 Factor analysis (random factor)
26 act:s-o\p-manager:competence 100 Factor analysis (random factor)
27 act:s-o\p-manager:competence\communication-skills 100 Factor analysis (random factor)
28 act:s-o\p-manager:trustworthiness 100 Factor analysis (random factor)
29 act:s-o\p-team:energy 100 Factor analysis (random factor)
30 act:s-o\p-team:fear-of-losing-face 100 Factor analysis (random factor)
31 act:s-o\p-team:proximity-to-c-o 100 Factor analysis (random factor)
32 act:s-o\p-team:staffing-level 100 Factor analysis (random factor)
33 art:existing-system:account-of 100 Factor analysis (random factor)
34 art:issues:early-resolution-of 100 Factor analysis (random factor)
35 art:p-charter:fitness-for-purpose 100 Factor analysis (random factor)
36 art:p-deliverable:ease-of-use 100 Factor analysis (random factor)
37 art:p-objectives:fitness-for-purpose 100 Factor analysis (random factor)
38 art:p-plan:fitness-for-purpose 100 Factor analysis (random factor)
39 art:prototypes:utilisation-of 100 Factor analysis (random factor)

Appendices
373
Run Base factor(s) MCL Additional information
40 art:requirements:clarity 100 Factor analysis (random factor)
41 art:requirements:fitness-for-purpose 100 Factor analysis (random factor)
42 ext:business-environment:recession 100 Factor analysis (random factor)
43 pro:communication:effectiveness 100 Factor analysis (random factor)
44 pro:communication-with-c-o:face-to-face 100 Factor analysis (random factor)
45 pro:estimating:effectiveness 100 Factor analysis (random factor)
46 pro:personnel-recruitment:effectiveness 100 Factor analysis (random factor)
47 pro:p-start-up:effectiveness 100 Factor analysis (random factor)
48 pro:software-development:difficulty 100 Factor analysis (random factor)
49 pro:software-development:hacks 100 Factor analysis (random factor)
50 pro:software-testing:effectiveness 100 Factor analysis (random factor)
51 pro:training\c-o\end-users:amount-of 100 Factor analysis (random factor)
52 requirements:fitness-for-purpose 100 Loop analysis (most active factors): TF=BF
53 pro:project:duration 100 Loop analysis (most active factors): TF=BF
54 art:issues:number-of 100 Loop analysis (most active factors): TF=BF
55 act:c-o:understanding\what-they-want 100 Loop analysis (most active factors): TF=BF
56 pro:change:control:effectiveness 100 Loop analysis (most active factors): TF=BF
57 act:c-o:understanding\what-they-want 100 Loop analysis (random factor): TF=BF
58 act:c-o\end-users:feedback-from 100 Loop analysis (random factor): TF=BF
59 act:c-o\end-users:involvement 100 Loop analysis (random factor): TF=BF
60 act:s-o\p-manager:understanding\s-o\p-team 100 Loop analysis (random factor): TF=BF

Appendices
374
Run Base factor(s) MCL Additional information
61 art:estimates:fitness-for-purpose 100 Loop analysis (random factor): TF=BF
62 art:issues:number-of 100 Loop analysis (random factor): TF=BF
63 art:p-budget:fitness-for-purpose 100 Loop analysis (random factor): TF=BF
64 art:p-charter:fitness-for-purpose 100 Loop analysis (random factor): TF=BF
65 art:p-plan:fitness-for-purpose 100 Loop analysis (random factor): TF=BF
66 art:p-specification:fitness-for-purpose 100 Loop analysis (random factor): TF=BF
67 art:requirements:fitness-for-purpose 100 Loop analysis (random factor): TF=BF
68 art:requirements:priorities 100 Loop analysis (random factor): TF=BF
69 art:requirements:scope-creep 100 Loop analysis (random factor): TF=BF
70 pro:change-control:effectiveness 100 Loop analysis (random factor): TF=BF
71 pro:communication-with-c-o:effectiveness 100 Loop analysis (random factor): TF=BF
72 pro:communication-with-c-o\end-users:effectiveness 100 Loop analysis (random factor): TF=BF
73 pro:project:duration 100 Loop analysis (random factor): TF=BF
74 pro:project:schedule-pressure 100 Loop analysis (random factor): TF=BF
75 pro:training\c-o\end-users:effectiveness 100 Loop analysis (random factor): TF=BF
76 All factors 15 Criteria analysis (cri:c-o:satisfaction)
77 All factors 15 Criteria analysis (cri:project:benefit\to-c-o)
78 All factors 15 Criteria analysis (cri:project:adherence\requirements)
79 All factors 15 Criteria analysis (cri:project:adherence\p-budget)
80 All factors 15 Criteria analysis (cri:c-o:payment-from)
81 All factors 15 Criteria analysis (cri:project:profitability\to-s-o)

Appendices
375
Run Base factor(s) MCL Additional information
82 All factors 15 Criteria analysis (cri:c-o:repeat-business-from)
83 All factors 15 Criteria analysis (cri:p-deliverable:utilisation-by-c-o\end-users)
84 All factors 15 Criteria analysis (cri:c-o\p-board:satisfaction)
85 All factors 15 Criteria analysis (cri:c-o\end-users:satisfaction)
86 All factors 15 Criteria analysis (cri:project:adherence\schedule)
87 All factors 15 Criteria analysis (cri:p-deliverable:utilisation-by-c-o)
88 All factors 2 Special case: identification of shortest chains
89 All factors 5 Special case: analysis of success criterion relationships
90 pro:p-intervention:effectiveness 15 Special case: project intervention
91 suc:project:success 15 Special case: project success as a success factor (TF=BF)
92 All factors 15 Special case: target factor set to act:s-o\p-team:staffing-level
Notes:
(1) Target factor set to suc:project:success in all propagation runs unless otherwise stated;
(2) TF=BF: Target factor set equal to base factor;
(3) A maximum chain length (MCL) value of 15 allows all active base factors in the relationship network to be identified;
(4) Base factors for propagation runs 11 to 30 were randomly selected.
Appendices Appendices
376
Appendix 3.8. Difficulties and limitations encountered during
the fieldwork process
Despite appropriate planning, design and testing, a number of difficulties and
limitations were encountered during the research. Although these did not
detract significantly from the quality of the research, they should still be
disclosed. The following are of particular note.
Fieldwork process: Stage 2: Interview arrangement
The research did not secure its target of 40 interviews, although it did exceed its
lower limit of 30. There were a number of reasons for this. First, only 58 letters
were sent to prospective companies. With hindsight, it may have been prudent
to identify (by way of an additional company directory) and send out letters to a
third batch of companies. Second, the researcher failed to make contact with a
number of participants despite repeated telephone calls. Third, a number of the
potential participants stated that they had no interest in the research while
others did not consider themselves to be IS suppliers. One participant declined
because he had already participated in a number of similar interviews.
However, the main reason for failing to reach the target of 40 interviews seems
to have been the economic downturn (or “credit crunch”) that was becoming
prevalent at the time. As one company explained, they could not spare the time
to be interviewed i.e. they could not release personnel, even for an hour, to
spend time on non-revenue generating work. The economic downturn may also
have been the reason for several companies withdrawing from the research
after agreeing to participate. For example, when approached, one major
database provider stated: “We can definitely help you with this.” Unfortunately,
no interviews took place with this company. Similar scenarios took place with a
number of other companies. This attrition was particularly disappointing as, at
one stage, the research had provisionally secured its target of 40 interviews.
The research failed to secure a participant population that matched the required
job functions. Originally, the intent was to secure participants who were either
project managers, consultants or software developers. However, the final
sample included two additional groups: software development managers and

Appendices Appendices
377
company directors. Although all of these individuals had hands-on OISD project
experience, the addition of these extra groups diluted the possibility of
conducting comparisons between the views provided by the different job
functions. For example, it was not possible to compare the views of consultants
and project managers, simply because each job function group now had fewer
members than had been originally anticipated.
The time and effort taken to secure interview participants took considerably
longer than expected i.e. nearly five months of elapsed time and approximately
five weeks’ worth of effort. There were a number of reasons for this, the majority
of which became apparent during the follow-up step (Step 2.6). First, the
company information obtained from Stage 1 proved to be incorrect. In addition
to the undelivered letters, one company had moved premises and the letter was
lost in the process. This led to a prolonged series of telephone calls to locate
the named contact. Similarly, in a number of cases, the named contact was
found to be no longer with the company. Usually, this led to a series of
telephone calls until an appropriate individual could be located. In all of the
cases, this person had not had sight of the letter (see below). A number of
contacts also reported that they had not received the letter; although others
remembered having sight of the letter, primarily due to the green response form,
but did not know its current location. In these cases, one of three courses of
action were followed:
(1) Sufficient information to secure involvement was to provided to the
participant during the telephone conversation;
(2) The letter was resent;
(3) Supplementary information was emailed to the participant.
A number of the named contacts also proved extremely difficult to reach.
Basically, at the time of repeated telephone calls, all were seemingly
unavailable. Indeed, in a few cases, despite repeated attempts, it proved
impossible to contact the named individual.
Appendices Appendices
378
Fieldwork process: Stage 3: Data collection
Some of the interviews proved quite difficult to control. There were several
reasons for this. An advantage of using open-ended questions was that it
provided the participant with licence to identify and discuss subject matter of
their own choice. The participants also had control of the amount of coverage
they gave each subject and the order in which it was articulated. However, this
freedom came at a price in that it allowed the participants to deviate from
subject matter pertinent to the research question. Another control related
problem manifested itself in two of the interviews. In both cases, the participants
began to discuss their views as soon as the initial pleasantries had been
concluded. That is, prior to the introductory presentation and before the
recorder had been switched on. In both cases the researcher interjected as
quickly as possible to ask if it would be possible to record the conversation from
that point, to which both agreed. The final reason relates to the post-interview
activities. Normally, the main part of the interview process was terminated once
the participant felt that they had exhausted their views on the subject matter, at
which point the recorder would be switched off. The participant would then be
provided with the opportunity to ask any question which they might have. The
next stages of the research were also explained to the participant. However, on
all occasions the conversation between the researcher and the participant
continued beyond this point. In a few cases, the participants began to discuss
other issues that were relevant to the research, prompting the researcher to as
if would be possible to switch the recorder back on.
The research process had no control over the participants’ motivation or
preparation for their interviews. The same was true for the “truthfulness” of the
participants in terms of the information they provided. It was also extremely
difficult to identify and quantify each of these characteristics. However, a
number of participants did provide some useful indicators. For example, several
participants clearly expressed their motivation for taking part in the research.
One participant, from a large multinational consultancy firm, explained that he
was participating because the company believed in building links with
educational establishments. Another stated that he considered the research
Appendices Appendices
379
objectives to be interesting and the results to be potentially valuable. One
participant even stated that he had decided to participate in the research
because it would force him to examine the way in which he performed his job as
a project manager. A few participants also provided indications of the amount of
preparation they had made prior to the interview. One participant used a
PowerPoint presentation to structure his responses. Another brought notes and
clearly indicated that she had spent time talking to other project managers in the
organisation prior to the interview. Conversely, one participant clearly stated
that he should have given more thought to the subject matter prior to the
interview. Finally, as to the “truthfulness” of the participants, there was no
indication that any of the participants were providing erroneous information. On
the contrary, a number of the participants clearly indicated where they had no
direct experience of a given scenario and were instead providing a view based
on second hand information. In such cases, the information provided was
excluded from the research.
A few of the interviews were held in locations with considerable background
noise; the worst of which being coffee houses. Consequently, some of the
interview recordings were found to contain inaudible segments that could not be
fully transcribed. Although these segments were quite short, they did represent
a minor loss in the data collection process.
As mentioned above, one participant declined to be recorded, forcing the
researcher to take notes during the interview. This presented three problems,
each of which detracted from the quality of the information obtained from the
interview. First, having no shorthand skills, the researcher was not capable of
producing a verbatim account of the interview. Second, the time taken making
notes detracted from the researcher’s ability to engage in the interview. Third, it
was decided that the notes should be reviewed and recorded immediately after
the interview. However, this process served to introduce a degree of distortion
of the information originally provided by the participant.
A great deal of care was taken to minimise interview bias in order that the
participants would express their views without influence from the researcher

Appendices Appendices
380
and the interview process. For example, the researcher’s views on the subject
matter were not presented in any form either before or during the interview
(although they would sometimes be discussed after the interview was
complete). Also, participants were never asked a direct question that might lead
them to discuss a particular success factor. For example, “Do you think that risk
management plays an important part in OISD projects?” However, interview
bias can never to completely eliminated. For example, any interjection by the
interviewer during the interview constitutes bias as it interferes and thus
influences the participants responses. More so, the participant’s perception of
the interviewer may well influence the responses they provide. This is a valid
criticism of the research because not all of the interview participants were
treated equally. For example, if the researcher perceived the interviewee to be
somewhat apprehensive about the interview process, he would attempt to put
him or her at ease (for example, pointing out that the participant’s career to
date, although quite short, was very relevant to the research) in an attempt to
maximise rapport between the interviewer and interviewee.
The aim of the research was to investigate success factors for OISD projects.
However, by employing an interview technique, the research did not collect data
directly from projects, as would have been the case, for example, by direct
observation or through access to project documentation. Instead, the data
collected by the interview process reflects the views and experiences of
practitioners involved in OISD projects.
Fieldwork process: Stage 4: Qualitative analysis
The coding and analysis of transcripts can be considered, at least in part, to be
a subjective process, relying, among other things, on the skills of the researcher
as opposed to any objective criteria. As a result, transcripts can be coded and
analysed in different ways. Consider, for example, the coding process. The
transcripts were coded in such a way that requirements management emerged
as the factor with the most coverage. However, requirements management
could also have been coded based using its constituent activities e.g. elicitation,
triage and specification (Davis, Hickey, & Zweig, 2004, p. 397).

Appendices Appendices
381
Fieldwork process: Stage 5: Relationship analysis
The factor propagation process, performed by the propagation software, gave
rise to two problems. Both of these problems were due to the large number of
active causal chains (those influencing project success) in the relationship
network. The set of active causal chains in the relationship network is otherwise
referred to as the solution space.
At the start of the quantitative analysis stage, the researcher’s expectation was
for a solution space comprising perhaps two or three thousand causal chains,
each containing (on average) 10 relationships/factors. Collectively, these chains
would influence project success via four or five success criteria. As the data
coding process proceeded (identifying success factors and relationships), it was
unclear as to whether or not this expectation would be met67. However, when
the software was first used to execute the propagation process, runtime errors
indicated that the solution space was far larger than expected.
The first problem was that the software wrote the details of the active causal
chains to a single output file. This approach is appropriate for relatively small
solution spaces (for example, those comprising 10 thousand causal chains) but
not for those containing larger volumes of data. Indeed, in this case, the solution
space was so large that it caused fatal runtime errors. To rectify this, the
software was modified to write active chain details to a series of smaller output
files. Two parameters were implemented to control the size and number of
these files. As the actual size of the solution space was still unknown at this
point, a number of other parameters were also added to the software. These
parameters allowed the software to propagate subsets of factors hence limiting
the solution space explored. These, and other, parameters affecting the output
generated by the propagation process are described in Appendix 3.5
(requirements specification for the propagation software).
67 A case of “not being able to see the wood for the trees.”

Appendices Appendices
382
The second problem is best explained in relation to one of the software’s
parameters: the maximum chain length (MCL) parameter. As its name
suggests, the MCL parameter limits the length of causal chains identified by the
propagation process. In summary, causal chains exceeding this length are
simply discarded by the software. The parameter was implemented as a safety
measure to ensure that propagation process could not, for whatever reason,
generate a causal loop of infinite length thus causing the software to “run away”;
that is, fail to terminate properly. However, the MCL parameter also serves to
limit the size of the solution space explored during the propagation process.
Given the expectation for the solution space (as described above), it was
envisaged that a MCL value of around 15 would suffice.
Running the propagation process with the MCL parameter set to 15 caused the
software to discard a large number of causal chains. This meant that the actual
solution space was larger than that being explored and that the MCL parameter
value should be increased. However, increasing the MCL value has other
effects (refer to Table 1).
MCL Active chains Run time
10 1,871,584 0h 03m
11 4,134,456 0h 06m
12 8,832,575 0h 14m
13 18,276,244 0h 31m
14 36,548,070 1h 04m
15 70,712,931 2h 09m
16 132,514,714 4h 17m
17 240,753,472 8h 07m
18 424,740,287 14h 50m
19 728,827,213 26h 39m
20 1,104,742,289 42h 02m
Table 1. Active chain counts and run time values for MCL values between 10 and 20
As Table 1 shows, incrementing the MCL value increased the number of active
chains identified by the propagation process. As discussed above, this is

Appendices Appendices
383
because the MCL value restricted the size of the solution space that can be
explored by the software. A positive number of discarded chains (i.e. those that
exceed the MCL value) indicated that the solution space was only being
partially explored and that the MCL value should be increased. However,
incrementing the MCL value significantly increased the time required to perform
the propagation process. And, with the runtime approximately doubling with
each MCL increment (refer to Table 1), running the software with a MCL value
above 20 became impracticable. The question therefore is: Does this actually
matter? In other words, for the purposes of this research, was it acceptable to
explore only subsets of the actual solution space?
An investigation of the entire solution space would have been the ideal. This
would have allowed the analysis to provide definitive values for the total number
of active chains, the number of factors involved and precise activity levels for
these factors. However, because the software can investigate subsets of the
solution space, it can still be used to provide estimates of these values. For
example, because it was found that the relative activity levels of the most active
factors and criteria changed little as the MCL value was increased beyond a
value of 15, the software can still be used to provide descriptive statistics for
factor and criteria activity levels in the propagation process. The software, can
also be used to perform propagation runs on a factor by factor basis, the results
of which can be aggregated and extended to provide estimates for the total
number of causal chains and loops. Hence, although the entire solution space
cannot be explored, the software is still fit for purpose in providing a better
understanding of the way in which OISD project success factors interact to
influence project success (the second research objective).

Appendices
384
Appendix 4.1. Interview participant details
Participant Role
Experience (years)
Application domain(s)
Typical project size
Role Total
Team
members
Duration
(months)
P1 Software developer (contractor) 5 5 Various 3 4
P2 Software developer (contractor) 5 5 Various 4 6
P3 Consultant 7 11 Various 3 6
P4 Consultant 25 30 Various 4 9
P5 Software developer (sole trader) 4 25 Various 1 6
P6 Software developer 10 12 Web, e-commerce 4 12
P7 Director 8 8 Various (hardware) 10 18
P8 Consultant 12 12 Various 8 9
P9 Consultant 20 20 Financial, commercial 1 6
P10 Project manager 30 30 Various 12 18
P11 Consultant 18 18 Financial, commercial 3 4
P12 Consultant 10 10 Financial, commercial 3 4
P13 Director 14 14 Various 10 12
P14 Project manager 6 11 Various 6 9
P15 Development manager 2 10 Various 4 9
P16 Consultant 20 20 Commercial 6 12
P17 Software developer 8 8 Various 4 6

Appendices
385
Participant Role
Experience (years)
Application domain(s)
Typical project size
Role Total
Team
members
Duration
(months)
P18 Development manager 4 12 Law 3 4
P19 Director 1 6 CRM 8 12
P20 Project manager 5 20 CRM 12 18
P21 Director 10 20 Various 10 18
P22 Project manager 11 13 Various 6 9
P23 Consultant 6 10 Various 3 3
P24 Project manager 12 30 Various 6 9
P25 Director 5 16 CRM 15 18
P26 Consultant 11 11 CRM 8 12
P27 Software developer (sole trader) 11 16 Various 1 4
P28 Software developer (sole trader) 2 30 Various 1 6
P29 Software developer (sole trader) 3 7 Various 2 4
P30 Project manager 2 15 Various 20 24
P31 Consultant 20 30 Various 10 18
P32 Development manager 4 12 Law 3 4
P33 Managing director 13 35 Automated documentation 3 3
Total: 324 532 Mean: 6 10
Mean: 10 16
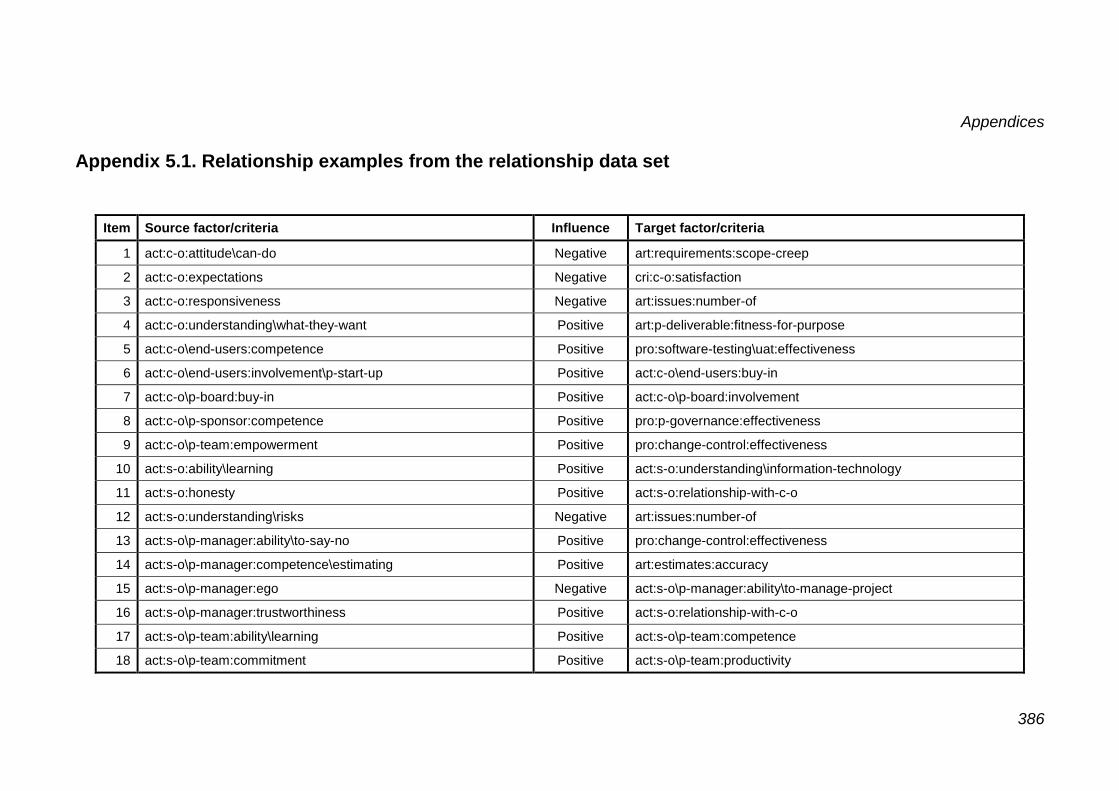
Appendices
386
Appendix 5.1. Relationship examples from the relationship data set
Item Source factor/criteria Influence Target factor/criteria
1 act:c-o:attitude\can-do Negative art:requirements:scope-creep
2 act:c-o:expectations Negative cri:c-o:satisfaction
3 act:c-o:responsiveness Negative art:issues:number-of
4 act:c-o:understanding\what-they-want Positive art:p-deliverable:fitness-for-purpose
5 act:c-o\end-users:competence Positive pro:software-testing\uat:effectiveness
6 act:c-o\end-users:involvement\p-start-up Positive act:c-o\end-users:buy-in
7 act:c-o\p-board:buy-in Positive act:c-o\p-board:involvement
8 act:c-o\p-sponsor:competence Positive pro:p-governance:effectiveness
9 act:c-o\p-team:empowerment Positive pro:change-control:effectiveness
10 act:s-o:ability\learning Positive act:s-o:understanding\information-technology
11 act:s-o:honesty Positive act:s-o:relationship-with-c-o
12 act:s-o:understanding\risks Negative art:issues:number-of
13 act:s-o\p-manager:ability\to-say-no Positive pro:change-control:effectiveness
14 act:s-o\p-manager:competence\estimating Positive art:estimates:accuracy
15 act:s-o\p-manager:ego Negative act:s-o\p-manager:ability\to-manage-project
16 act:s-o\p-manager:trustworthiness Positive act:s-o:relationship-with-c-o
17 act:s-o\p-team:ability\learning Positive act:s-o\p-team:competence
18 act:s-o\p-team:commitment Positive act:s-o\p-team:productivity

Appendices
387
Item Source factor/criteria Influence Target factor/criteria
19 act:s-o\p-team:competence\issue-resolution Positive pro:software-development:progress
20 act:s-o\p-team:confidence Positive act:s-o\p-team:ability\to-provide-bad-news
21 act:s-o\p-team:gel Positive act:s-o\p-team:teamwork
22 act:s-o\p-team:proximity-to-c-o Positive act:c-o:involvement
23 act:s-o\p-team:teamwork Positive act:s-o\p-team:productivity
24 act:s-o\p-team:understanding\p-vision Positive act:s-o\p-team:buy-in
25 act:s-o\sales-team:ethics Negative pro:sales-process:overselling
26 art:change-requests:sign-off Positive art:requirements:fitness-for-purpose
27 art:issues:number-of Positive pro:project:cost
28 art:p-charter:fitness-for-purpose Positive act:s-o\p-team:understanding\risks
29 art:p-deliverable:usability Positive art:p-deliverable:fitness-for-purpose
30 art:p-docs:ambiguity Negative art:p-docs:fitness-for-purpose
31 art:prototypes:fitness-for-purpose Positive act:c-o\end-users:feedback-from
32 art:requirements:detail Negative art:requirements:scope-creep
33 art:requirements:fitness-for-purpose Negative pro:software-development:effort
34 art:software-development-tools:maturity Positive pro:software-development:effectiveness
35 cri:c-o:satisfaction Positive suc:project:success
36 cri:project:benefit\to-c-o Positive cri:c-o:satisfaction
37 pro:change-control:effectiveness Negative art:requirements:scope-creep
38 pro:communication-with-c-o:face-to-face Positive act:s-o:relationship-with-c-o
39 pro:expectation-management:effectiveness Positive act:c-o:buy-in

Appendices
388
Item Source factor/criteria Influence Target factor/criteria
40 pro:p-conceptualisation:consensus Positive pro:p-conceptualisation:effectiveness
41 pro:project:complexity Positive art:issues:number-of
42 pro:project:duration Positive act:c-o:staff-turnover
43 pro:project:schedule-pressure Positive art:issues:number-of
44 pro:requirements-definition:effectiveness Positive art:requirements:clarity
45 pro:risk-management:effectiveness Negative art:issues:number-of
46 pro:sales-process:overselling Positive act:c-o:expectations
47 pro:software-development:hacks Negative art:p-deliverable:fitness-for-purpose
48 pro:software-testing:duration Negative cri:project:adherence\schedule
49 pro:supplier-selection:effectiveness Positive act:s-o:relationship-with-c-o
50 pro:training\c-o\end-users:amount-of Positive cri:p-deliverable:utilisation-by-c-o\end-users
Note: all of the examples in the table can also be found in the active relationship network i.e. all of the relationships are active.

Appendices
389
Appendix 5.2. OISD project success factors identified by the
relationship analysis as base factors but not cited in the
literature
The success (and failure) factors listed in this section were identified as base
factors by the relationship analysis conducted as part of this research project
but were not cited by the success factor analysis performed as part of the
literature review.
Nomenclature
Success (and failure) factors were coded as entity-characteristic combinations
and are hence depicted thus:
Entity (x): characteristic1, characteristic2, ... characteristicx.
where
x: number of characteristics attributed to the entity (factors per entity).
Actors
Client organisation (77): arrogance, assumptions\validity, attitude\can do,
bullying of supplier organisation\probability of, business objectives\clarity,
business priorities\changes in, business processes\changes in, business
requirements, business units\number of, buy-in, changes of mind, comfort
level, competence\communication skills, competence\sales process,
corporate governance, cost cutting exercises, culture\blame,
culture\supportive of open honest communication, employees\number of,
engagement of, expectations, expectations\alignment with project
deliverable, expectations\competence\s o, familiarity with supplier
organisation\project team, financial pressures, infighting, influence over
supplier organisation, interest in project, involvement\meetings\progress,
involvement\meetings\supplier organisation\project review boards,
involvement\project conceptualisation\background research,
involvement\project conceptualisation\business case development,
involvement\procurement process, involvement\requirements definition,
involvement\sales process, involvement\software design, lessons learned,
new product introductions\number of, open access to,
operations\complexity, operations\peculiarities, organisation\degree of,
personal agendas, reasonableness, resource availability, responsiveness,
risk\aversion to, size, stability, structure\clarity, structure\layers\number of,
supportiveness\for project manager, terminology\degree of,
trustworthiness, understanding\business case, understanding\change

Appendices
390
management, understanding\client organisation\operations,
understanding\communication plan\need for, understanding\information
technology, understanding\project deliverable, understanding\project
governance, understanding\project governance\need for,
understanding\project, understanding\project\effort\client organisation,
understanding\project\involvement in, understanding\project\technical
challenge, understanding\project start-up\prior to, understanding\project
status, understanding\risks, understanding\scope creep\effects of,
understanding\sign off\need for, understanding\supplier organisation-client
organisation relationships, understanding\software development,
understanding\what they want\flexibility, willingness to accept that they are
building the wrong project deliverable, willingness to pay for project,
willingness to provide funding.
Client organisation\domain experts (2): involvement\software testing,
understanding\client organisation\operations.
Client organisation\end users (38): ability\to reach agreement, accessibility,
belief that they are being listened to, buy-in, changes of mind, comfort
level, comfort level\project deliverable, competence, confidence\utilisation
of project deliverable, control of, desire\for project deliverable, emotional
investment, expectations\volatility, fear of change imposed by project, fear
of project objectives, ideas from, interest in project, involvement\ex project,
involvement\meetings\workshops\requirements, involvement\optimal,
involvement\project start-up, involvement\requirements elicitation,
involvement\sales process, involvement\software testing,
involvement\software testing\UAT, likelihood of providing information,
perception of project deliverable, perception of supplier
organisation\project team, personal agendas, understanding\client
organisation\operations, understanding\project deliverable,
understanding\project deliverable\how to use, understanding\project
deliverable\reason for, understanding\supplier organisation\terminology,
understanding\what they think they want, understanding\what they want,
willingness to take responsibility, willingness to take responsibility for
software testing\UAT\sign off.
Client organisation\facilitators (1): effectiveness.
Client organisation\IT department (1): protectionism.
Client organisation\middle management (1): control of.
Client organisation\project board (17): buy-in, communication amongst, effort,
involvement\ex-project, involvement\project start-up,

Appendices
391
involvement\requirements elicitation, management style, personal
agendas, popularity with staff, proximity to supplier organisation\project
team, staff turnover, understanding\client organisation\business rules,
understanding\client organisation\industry sector, understanding\client
organisation\operations, understanding\client organisation\workflow,
understanding\issues, understanding\project.
Client organisation\project manager (7): authority, competence\decision
making, empowerment, involvement\change control,
involvement\requirements definition, length of service\with client,
understanding\client organisation\who to talk to.
Client organisation\project sponsor (10): competence\decision making,
direction from\consistency, involvement, involvement\ex project,
involvement\project start-up, management of client organisation\project
team, responsibility for project, understanding\issues,
understanding\project, understanding\risks.
Client organisation\project team (6): ability\to perform multiple roles,
empowerment, involvement\change control, involvement\continuous,
understanding\business case, willingness to make decisions.
Client organisation\project team\requirements analysts (1):
involvement\project conceptualisation.
Client organisation\stakeholders (6): comfort level\roles, fear of
accountability, involvement\meetings\workshops\requirements,
involvement\requirements elicitation, understanding\project deliverable,
understanding\project\roles.
Communication participants (11): ability to question, cultural diversity,
experience, language differences amongst, number of, proximity amongst,
qualifications, understanding\common, understanding\other participants,
willingness to communicate, willingness to explain matters.
Decision makers (5): communication amongst, distribution\number of,
distribution\seniority, experience, qualifications.
Project documentation authors (5): ability\to structure an argument,
competence\writing skills, competence\writing skills\documentation
structuring, competence\writing skills\spelling, competence\writing
skills\utilisation of grammar.
Supplier organisation (43): ability\learning, ability\to provide resources,
ability\to say no, accreditation\quality, actions\accidental,

Appendices
392
actions\intentional, attitude\can do, awareness\information technology,
business priorities\ex project, business view\long term, commercial
pressures, competence\communication skills, competence\issue
management, competitive pressures, culture\blame, culture\supportive of
open honest communication, fear of losing repeat business from client,
financial pressures, honesty, involvement\meetings\supplier
organisation\project review boards, involvement\requirements definition,
need for business, partnership with client organisation, passion\for
providing solutions that work, proximity to client organisation, quality
accreditation, relationship with client organisation, relationship with client
organisation\trust, resource availability, resource availability\learning,
supportiveness\for project manager, supportiveness\technical, training
policy, trustworthiness, understanding\client organisation\business
environment, understanding\client organisation\business requirements,
understanding\client organisation\culture, understanding\client
organisation\terminology, understanding\information technology,
understanding\project, understanding\project\effort\supplier organisation,
understanding\risks, understanding\supplier organisation-client
organisation relationships.
Supplier organisation\executive management (8): ability\to manage project
manager, communication with client organisation\project board, effort,
involvement, involvement\meetings\supplier organisation\project review
boards, involvement\project governance, relationship with client
organisation\project board, understanding\supplier organisation\project
team.
Supplier organisation\project manager (101): ability\to ask questions,
ability\to deal with supplier organisation\project team issues, ability\to
deliver bad news\honestly, ability\to deliver bad news\quickly, ability\to
explain matters, ability\to filter information, ability\to handle work load,
ability\to implement project governance, ability\to manage project, ability\to
manage supplier organisation\project team, ability\to manage third party
supplier organisations, ability\to say no, ability\to trust others, ability\to use
client organisation \terminology, ability\to work without management
intervention, ability to obtain sign off, affiliation, approach,
background\operations, characteristics\approachability,
characteristics\emotional detachment, characteristics\flexibility,
characteristics\is understanding, characteristics\native language\foreign,
characteristics\proactive, characteristics\to enhance supplier
organisation\project team work environment, characteristics\to provide
morale support to supplier organisation\project team, characteristics\to
work alongside supplier organisation\project team, communication with

Appendices
393
supplier organisation\project team\regularity, competence\arbitration skills,
competence\change management, competence\coaching skills,
competence\communication skills, competence\communication skills\multi-
level, competence\decision making, competence\estimating,
competence\issue escalation, competence\issue identification,
competence\issue management, competence\issue resolution,
competence\motivational skills, competence\negotiation skills,
competence\people management\soft, competence\project planning,
competence\relationship management, competence\resource
management, competence\technology management, control of project,
courage\to ask for funding, cultural background, desire\to be successful,
ego, empowerment, evaluation criteria\iron triangle, experience\volatile
business environments, fit with project, focus on project management
tasks, instinct, investment in, involvement\project monitoring,
involvement\project start-up, involvement\sales handover,
involvement\sales process, involvement\sales process\bidding,
involvement\with supplier organisation\project team, lessons learned,
ownership, performance criteria\project budget, performance
criteria\requirements, performance criteria\schedule, personality\fit with
client, priority given to project management role, proximity to supplier
organisation\project team, relationship with client organisation\project
board, relationship with supplier organisation\project team, respect\from
others, trustworthiness, understanding\client organisation,
understanding\client organisation\business plans, understanding\client
organisation\expectations, understanding\client organisation\industry
sector, understanding\client organisation\operations\roles,
understanding\client organisation\project management,
understanding\client organisation\programme management,
understanding\client organisation\requirements, understanding\client
organisation\structure, understanding\issue escalation\paths,
understanding\issues, understanding\project deliverable,
understanding\project governance, understanding\project,
understanding\project\from beginning, understanding\project status,
understanding\project tasks, understanding\project vision,
understanding\requirements, understanding\risks, understanding\supplier
organisation\project team, understanding\supplier organisation\project
team\competence, utilisation level, workload.
Supplier organisation\post-implementation support team (4): involvement,
understanding\client organisation\operations, understanding\issues\post
implementation support, understanding\project deliverable\utilisation of.

Appendices
394
Supplier organisation \project team (135): ability\learning, ability\to ask
questions, ability\to identify potential software defects, ability\to perform
multiple roles, ability\to provide bad news, ability\to say no, ability\to utilise
available resources, absences, access to client organisation\end users,
accountability\definition of, affiliation\to client, age of, aversion to spend
time on project documentation, background\industry sector, benefits
package\fitness for purpose, buy-in, characteristics\inquisitiveness,
characteristics\knowing when to ask for assistance, characteristics\self
motivated, characteristics\takes pride in work, characteristics\tendency to
admit mistakes, characteristics\to admit they do not understand,
characteristics\unwillingness to fail, communication with client,
communication with client organisation\end users, communication with
client organisation\project team, communication with third party supplier
organisations, competence\business, competence\communication skills,
competence\decision making, competence\estimating,
competence\feature management, competence\interpretation skills,
competence\issue resolution, competence\listening skills,
competence\multi skilled, competence\people management,
competence\problem solving, competence\requirements elicitation,
competence\research skills, competence\software development tools,
competence\writing skills, competitiveness\with third party supplier
organisations, confidence, confidence\as perceived by client
organisation\end users, coordination\with third party supplier
organisations, cultural diversity, desire\to keep client happy,
effort\communicating with client, effort\expended, empathy\with client,
empowerment, energy, enthusiasm, experience\access to,
experience\industry sector, experience\technical, fear of losing face,
flexibility to work overtime, friction with third party supplier organisations,
gel, interest in project\as perceived by client organisation\end users,
interest in project tasks, involvement\communication with client
organisation\end users, involvement\meetings\workshops\design,
involvement\meetings\workshops\requirements, involvement\post
implementation support, involvement\project planning,
involvement\procurement process, involvement\requirements definition,
involvement\sales handover, involvement\sales process, involvement\with
client organisation\end users, lessons learned, likelihood of asking
questions, likelihood to ask for help, likelihood to second guess\client
organisation\end users, management of\ease of, motivation, optimism,
overtime worked, overtime worked\unpaid, personal agendas,
pressure\personally applied, productivity, professionalism, proximity
amongst, proximity to client, proximity to client organisation\end users,
proximity to client organisation\project team, proximity to third party
supplier organisations, relationship with client, relationship with client

Appendices
395
organisation\end users, relationship with third party supplier organisations,
respect for supplier organisation\project manager,
responsibilities\definition of, structure\definition of, task variation,
teamwork, understanding\client organisation\business objectives,
understanding\client organisation\business strategy, understanding\client
organisation\expectations, understanding\client organisation\industry
sector, understanding\client organisation\stakeholders,
understanding\client organisation\structure, understanding\client
organisation\technology, understanding\client organisation\terminology,
understanding\client organisation\who to talk to, understanding\project
benefits, understanding\project deliverable\potential benefits,
understanding\project deliverable\usability, understanding\people
management, understanding\project objectives, understanding\project,
understanding\project\dependencies, understanding\project\outcome,
understanding\project\roles, understanding\project\slippages,
understanding\project politics, understanding\project tasks,
understanding\project tasks\other team members, understanding\project
tasks\priorities, understanding\project vision,
understanding\requirements\client organisation\end users,
understanding\risks, understanding\roles and responsibilities,
understanding\roles and responsibilities\other team members,
understanding\system implementation, visibility of future project tasks,
willingness to ask for help, willingness to take responsibility, willingness to
work overtime, willingness to work together, work environment.
Supplier organisation\project team\consultants (2): involvement\excessive,
lessons learned.
Supplier organisation\project team\requirements analysts (12): ability\to block
requirements outwith project specification, ability\to dig deeper, ability\to
say no, characteristics\firm but fair, competence, competence\listening
skills, effectiveness, involvement\requirements elicitation,
involvement\sales process, understanding\application type,
understanding\business, understanding\client organisation\industry sector.
Supplier organisation\project team\software testers (2): involvement\software
build, proximity to\supplier organisation\project team.
Supplier organisation\sales team (11): ethics, experience, involvement\post
sales, involvement\sales handover, involvement\supplier
organisation\commercial aspects, promises\realism, responsibility for
project success, sales commission, understanding\project deliverable,
understanding\project, understanding\software development.

Appendices
396
Third party supplier organisations (4): fit with project, politics, responsiveness
to supplier organisation\project team requests, understanding\project
objectives.
Artefacts
Business case (2): benefit\to client organisation\end users, referral back to.
Change requests (2): documentation of, sign off.
Coding standards (1): fitness for purpose.
Client specification (1): fitness for purpose.
Decisions\software design (5): compromise, documentation of, fitness for
purpose, number of, political content.
Estimates (1): granularity.
Existing system (2): account of, scale\integrity.
Invitation to tender (2): fitness for purpose, vagueness.
Issues (3): early identification of, early resolution of, number of.
Issues\organisational\client organisation (1): number of.
Issues\software defects (4): early resolution of, number of, severity, time
available for\resolution.
IT infrastructure\hardware (1): fitness for purpose.
IT infrastructure\operating system (1): fitness for purpose.
Methodologies\project management (1): fitness for purpose.
Methodologies\software development\formal (1): utilisation of.
Project assumptions (1): fitness for purpose.
Project budget (8): existence of, fat, realism, sign off, stability, training
provision, utilisation of\effectiveness, wriggle room.
Project charter (2): fitness for purpose, length\appropriateness.
Project deliverable (18): configurability, defects, efficiency, extensibility,
familiarity to client organisation\end users, fit with client organisation\end
user working practices, functionality\end user computing, hacks, integrity,

Appendices
397
interference from third party applications, intuitiveness, maintainability,
reliability\functionality, reliability\maintainability, scalability, stability,
structure, usability.
Project deliverable\interim (1): early delivery of.
Project deliverable\third party (1): availability.
Project deliverable\user interface (2): aesthetics, familiarity to client
organisation\end users.
Project documentation (7): ambiguity, length\appropriateness, readability,
sign off, structure\logical, understanding of, utilisation of.
Project documentation\client organisation\end users\instructions (1): fitness
for purpose
Project due date (2): existence of, rigidity.
Project objectives (1): achievability.
Project plan (4): accuracy, dependencies\account of, sign off, training
provision.
Project proposal/bid (3): assumptions\documentation of,
assumptions\understanding of, fitness for purpose.
Prototypes (4): features\requested by client organisation\end users, fitness
for purpose, potential risk associated with, utilisation of.
Project specification (4): continuous referral to, fitness for purpose,
supportiveness\of s o client relationship, wriggle room.
Project success criteria (1): definition of.
Quality framework (1): fitness for purpose.
Requirements (15): agreement of\client organisation, alignment with client
organisation\end users\requirements, alignment with project budget,
alignment with project charter, amount of, documentation of, language
used\consistency, length of time to delivery, meaningfulness, minimum
implementation footprint, priorities, readability, scope shrinkage, sign off,
tangibility.
Software components (1): fitness for purpose.
Appendices
398
Software development artefacts (3): appropriate utilisation of, maturity,
support for.
Software development tools (4): improvements in, maturity, usefulness,
utilisation of.
Specifications\requirements (1): fitness for purpose.
Standards\software development (4): fitness for purpose, number of,
PRINCE2 alikeness, standardisation.
External
Business environment (1): recession.
Competition\client (1): new product introductions\number of.
Competition\supplier (1): fierceness.
Exchange rates (1): stability.
Information technology (1): rate of change.
Legislation (2): adherence to, introduction of.
Mass market software (2): cost, quality.
Professional qualifications (1): standardisation.
Takeovers\client organisation (1): threat of.
Processes
Change control (3): adherence to, evaluation of trade-offs, robustness.
Change management (2): disruption to client, effort.
Client complaint process (1): effectiveness.
Communication (3): discussion, face to face, honesty.
Communication with client (14): clarity, continuous, effectiveness, face to
face, informality, medium\fitness for purpose, multi level, openness,
regularity, regularity\need for, through third party supplier organisations,
time available for, utilisation of communication logs, utilisation of client
terminology.
Communication with client organisation\end users (1): face to face.

Appendices
399
Data preparation (1): effectiveness.
Decision making (1): effectiveness.
Dependency management (1): effectiveness.
Expectation management (1): effectiveness.
Issue escalation (2): effectiveness, rapidity.
Issue identification (1): effectiveness.
Issue management (1): timeliness.
Issue monitoring\software defects (1): effectiveness.
Issue resolution (2): effectiveness, rapidity.
issue resolution\software defects (1): effectiveness.
Meetings\progress (3): effectiveness, involvement\from client, regularity.
Meetings\supplier organisation\project review boards (3): effectiveness,
format\open forum, regularity.
Meetings\supplier organisation\quality review (1): effectiveness.
Meetings\workshops\design (1): effectiveness.
Meetings\workshops\project team on boarding session (1): effectiveness.
Meetings\workshops\requirements (1): effectiveness.
Personnel recruitment (1): effectiveness.
Post implementation support (3): effectiveness, effort\issues\outwith project
deliverable, language differences with client organisation\end users.
Procurement process (2): analysis, involvement of correct client
organisation\personnel.
Project conceptualisation (1): consensus.
Project governance (3): cost, early introduction of, management of.
Project management (1): cost.

Appendices
400
Project (28): commercial model, complications, definition of,
delivery\incremental, difficulty, duration, efficiency, effort, evolution, fit with
client organisation\business objectives, fit with supplier organisation, fit
with supplier organisation\experience, fit with supplier
organisation\industry sector, fit with supplier organisation\technology,
flexibility\commercial, flexibility to adjust project deliverable, methodology,
novelty, opportunity leverage, price\fixed, priority\volatility, rigidity, scale of
implementation\integrity, schedule pressure\short term, scope\fixed,
slippages, technical innovation, uniqueness.
Project start-up (5): available information, controlled, explanation to client
organisation\change control, explanation to client organisation\sign off, pre
meeting data gathering.
Project tasks (1): adherence\schedule.
Relationship building (1): effectiveness.
Relationship management (1): effectiveness.
Relationship management\client organisation\end users (1): effectiveness.
Requirements definition (6): access to client organisation\domain experts,
approach\iterative, boundaries\clarity, utilisation of face to face meetings,
utilisation of test plans, utilisation of use cases.
Requirements elicitation (2): personnel involved in\number of, proximity to
client.
Resource management (1): ability\to provide additional support.
Resource planning (1): effectiveness.
Sales process (12): available information, commercial negotiations, due
diligence, guess work, management of, objectiveness, overselling,
overselling\project deliverable, overselling\project duration, relationship
building, suitability of projects being bid for, thoroughness.
Sales process\bidding (2): available information, communication with client
organisation\face to face.
Sales process\client organisation\internal (1): overselling.
Software coding (1): effectiveness.

Appendices
401
Software development (12): coordination, difficulty, difficulty\unforeseen,
effort, effort\rework, hacks, incremental, off shoring, progress, revision
cycles, slippages, time available for.
Software testing (6): automation, defects detected, duration, management of,
thoroughness, time available for.
Software testing\integration (1): effectiveness.
Software testing\UAT (3): amount of, defects detected, sign off.
Stakeholder management\project board (1): effectiveness.
Supplier selection (3): effectiveness, supplier organisation
references\obtainment of, weighting system\fitness for purpose.
System implementation (2): effectiveness, parallel running with existing
system.
System implementation\design (1): effort.
System implementation\planning (1): effort.
Training\client organisation\end users (10): amount of, approach,
approach\train the trainer, class size, cost, peers in training
classes\number of, preparation for, time available for, training material,
utilisation of business data.
Training\supplier organisation\project manager (4): effectiveness, fit with
project management role, on the job, p manager mentoring.
Training\supplier organisation\project team (4): amount of, on the job, resource availability, time available for.

Appendices
402
Appendix 5.3. Active causal chain examples
art:requirements:fitness-for-purpose
-p->
art:business-case:fitness-for-purpose
-p->
act:c-o:buy-in
-n->
act:c-o:resistance-to-change
-n->
cri:p-deliverable:utilisation-by-c-o
-p->
cri:project:benefit\to-c-o
-p->
cri:c-o:satisfaction
-p->
act:c-o:willingness-to-pay-for-project
-p->
cri:project:profitability\to-s-o
-p->
suc:project:success
Example 1. Fit for purpose requirements
art:p-plan:fitness-for-purpose
-p->
act:s-o:resource-availability
-p->
act:s-o\p-team:staffing-level
-n->
act:s-o\p-team:management-of\ease-of
-n->
act:s-o\p-manager:workload
-n->
act:s-o\p-manager:ability\to-manage-project
-n->
act:c-o:politics
-n->
art:requirements:priorities
-p->
art:p-deliverable:fitness-for-purpose
-p->
cri:c-o:satisfaction
-p->
suc:project:success
Example 2. Fit for purpose project plan
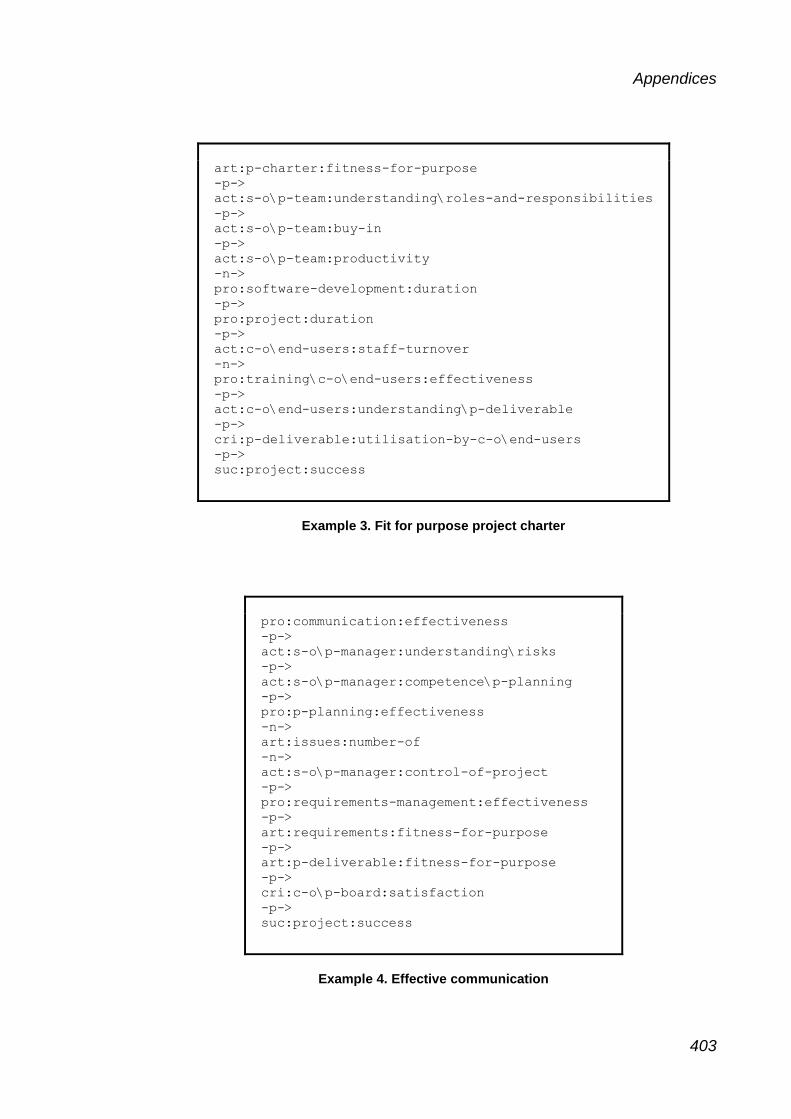
Appendices
403
art:p-charter:fitness-for-purpose
-p->
act:s-o\p-team:understanding\roles-and-responsibilities
-p->
act:s-o\p-team:buy-in
-p->
act:s-o\p-team:productivity
-n->
pro:software-development:duration
-p->
pro:project:duration
-p->
act:c-o\end-users:staff-turnover
-n->
pro:training\c-o\end-users:effectiveness
-p->
act:c-o\end-users:understanding\p-deliverable
-p->
cri:p-deliverable:utilisation-by-c-o\end-users
-p->
suc:project:success
Example 3. Fit for purpose project charter
pro:communication:effectiveness
-p->
act:s-o\p-manager:understanding\risks
-p->
act:s-o\p-manager:competence\p-planning
-p->
pro:p-planning:effectiveness
-n->
art:issues:number-of
-n->
act:s-o\p-manager:control-of-project
-p->
pro:requirements-management:effectiveness
-p->
art:requirements:fitness-for-purpose
-p->
art:p-deliverable:fitness-for-purpose
-p->
cri:c-o\p-board:satisfaction
-p->
suc:project:success
Example 4. Effective communication

Appendices
404
act:c-o\end-users:involvement
-p->
art:requirements:fitness-for-purpose
-p->
art:business-case:fitness-for-purpose
-p->
act:c-o:willingness-to-provide-funding
-p->
art:p-budget:fitness-for-purpose
-p->
act:s-o\p-team:staffing-level
-n->
act:s-o\p-team:management-of\ease-of
-n->
act:s-o\p-manager:workload
-n->
act:s-o\p-manager:ability\to-manage-project
-n->
act:c-o:politics
-n->
act:s-o\p-team:work-environment
-p->
act:s-o\p-team:teamwork
-p->
act:s-o\p-team:competence\issue-resolution
-n->
art:issues:number-of
-n->
act:s-o\p-manager:control-of-project
-p->
pro:requirements-management:effectiveness
-n->
pro:project:duration
-n->
act:c-o:involvement
-p->
act:s-o:relationship-with-c-o
-p->
pro:communication-with-c-o:effectiveness
-p->
act:c-o:comfort-level
-p->
pro:communication:effectiveness
-p->
act:s-o\p-manager:understanding\risks
-p->
act:s-o\p-manager:competence\p-planning
-p->
act:s-o\p-manager:effectiveness
-p->
art:p-deliverable:fitness-for-purpose
-p->
cri:c-o:satisfaction
-p->
suc:project:success
Example 5. End users’ involvement

Appendices
405
act:c-o:arrogance
-n->
act:c-o:understanding\project\technical-challenge
-p->
pro:sales-process:due-diligence
-n->
pro:sales-process:overselling
-p->
act:c-o:expectations
-p->
pro:software-development:difficulty
-n->
art:software-components:fitness-for-purpose
-p->
art:p-deliverable:fitness-for-purpose
-p->
cri:c-o:satisfaction
-p->
cri:c-o:repeat-business-from
-p->
suc:project:success
Example 6. Client arrogance
act:s-o\p-manager:competence\communication-skills
-p->
act:s-o\p-team:respect-for-s-o\p-manager
-p->
act:s-o\p-team:buy-in
-p->
act:s-o\p-team:productivity
-n->
pro:software-development:duration
-p->
pro:project:duration
-n->
act:c-o:buy-in
-p->
cri:p-deliverable:utilisation-by-c-o
-p->
cri:project:benefit\to-c-o
-p->
cri:c-o:satisfaction
-p->
suc:project:success
Example 7. Project manager’s communication skills

Appendices
406
pro:training\c-o\end-users:amount-of
-p->
pro:project:cost
-n->
cri:c-o:satisfaction
-p->
act:c-o:willingness-to-pay-for-project
-p->
cri:project:profitability\to-s-o
-p->
suc:project:success
Example 8. Amount of end users’ training
art:existing-system:account-of
-p->
art:requirements:fitness-for-purpose
-p->
art:business-case:fitness-for-purpose
-p->
act:c-o:willingness-to-provide-funding
-p->
art:p-budget:fitness-for-purpose
-p->
act:s-o\p-team:staffing-level
-n->
act:s-o\p-team:management-of\ease-of
-n->
act:s-o\p-manager:workload
-n->
act:s-o\p-manager:ability\to-manage-project
-n->
act:c-o:politics
-n->
act:s-o\p-team:work-environment
-p->
act:s-o\p-team:teamwork
-p->
act:s-o\p-team:competence\issue-resolution
-n->
art:issues:number-of
-n->
act:s-o\p-team:confidence
-p->
(continued on next page)
Example 9. Taking account of the existing system

Appendices
407
(continued from previous page)
-p->
act:s-o\p-team:ability\to-provide-bad-news
-p->
art:estimates:fitness-for-purpose
-p->
act:s-o\p-manager:control-of-project
-p->
pro:resource-management:effectiveness
-p->
pro:issue-identification:effectiveness
-p->
pro:issue-resolution:effectiveness
-n->
pro:project:slippages
-p->
pro:project:duration
-p->
act:c-o\end-users:staff-turnover
-n->
pro:training\c-o\end-users:effectiveness
-p->
act:c-o\end-users:feedback-from
-p->
art:prototypes:features\requested-by-c-o\end-users
-p->
act:c-o\end-users:buy-in
-n->
act:c-o\end-users:resistance-to-change
-n->
act:c-o\end-users:involvement
-p->
pro:communication-with-c-o\end-users:effectiveness
-p->
art:requirements:detail
-n->
art:requirements:scope-creep
-p->
pro:software-development:slippages
-p->
pro:project:schedule-pressure
-n->
pro:software-testing:time-available-for
-p->
pro:software-testing:effectiveness
-n->
art:issues\software-defects:number-of
-n->
art:p-deliverable:fitness-for-purpose
-p->
cri:project:benefit\to-c-o
-p->
suc:project:success
Example 9 (continued). Taking account of the existing system

Appendices
408
pro:p-start-up:effectiveness
-p->
act:c-o:understanding\project
-n->
art:issues:number-of
-n->
act:s-o\p-manager:control-of-project
-p->
pro:requirements-management:effectiveness
-p->
art:requirements:fitness-for-purpose
-p->
art:business-case:fitness-for-purpose
-p->
act:c-o:buy-in
-p->
cri:p-deliverable:utilisation-by-c-o
-p->
cri:project:benefit\to-c-o
-p->
suc:project:success
Example 10. Effective project start-up
pro:estimating:effectiveness
-p->
art:estimates:fitness-for-purpose
-p->
act:s-o\p-manager:control-of-project
-n->
art:issues:number-of
-p->
pro:project:difficulty
-p->
pro:software-development:effort
-p->
pro:project:cost
-n->
cri:c-o:satisfaction
-p->
act:c-o:willingness-to-pay-for-project
-p->
cri:project:profitability\to-s-o
-p->
suc:project:success
Example 11. Effective estimating

Appendices
409
act:c-o\p-sponsor:understanding\issues
-p->
act:c-o\p-sponsor:involvement
-p->
pro:p-governance:effectiveness
-p->
pro:change-control:effectiveness
-p->
art:requirements:priorities
-p->
art:p-plan:fitness-for-purpose
-n->
art:issues:number-of
-n->
art:p-deliverable:fitness-for-purpose
-p->
cri:project:benefit\to-c-o
-p->
cri:c-o:satisfaction
-p->
suc:project:success
Example 12. Project sponsor’s understanding of (project) issues
act:c-o\p-board:staff-turnover
-p->
art:change-requests:number-of
-p->
pro:project:duration
-n->
act:c-o:buy-in
-n->
act:c-o:resistance-to-change
-n->
cri:p-deliverable:utilisation-by-c-o
-p->
cri:project:benefit\to-c-o
-p->
cri:c-o:satisfaction
-p->
act:c-o:willingness-to-pay-for-project
-p->
cri:project:profitability\to-s-o
-p->
suc:project:success
Example 13. Staff turnover in the project board

Appendices
410
act:s-o\p-team:staffing-level
-n->
act:s-o\p-team:management-of\ease-of
-n->
act:s-o\p-manager:workload
-n->
act:s-o\p-manager:ability\to-manage-project
-n->
act:c-o:politics
-n->
act:s-o\p-team:work-environment
-p->
act:s-o\p-team:teamwork
-p->
act:s-o\p-team:competence\issue-resolution
-n->
art:issues:number-of
-n->
act:s-o\p-manager:control-of-project
-p->
pro:requirements-management:effectiveness
-p->
art:requirements:fitness-for-purpose
-p->
art:business-case:fitness-for-purpose
-p->
act:c-o:willingness-to-provide-funding
-p->
art:p-budget:fitness-for-purpose
-n->
art:change-requests:number-of
-p->
pro:project:duration
-n->
act:c-o:involvement
-p->
act:s-o:relationship-with-c-o
-p->
pro:communication-with-c-o:effectiveness
-p->
act:c-o:comfort-level
-p->
pro:communication:effectiveness
-p->
act:s-o\p-manager:understanding\risks
-p->
act:s-o\p-manager:competence\p-planning
-p->
act:s-o\p-manager:effectiveness
-p->
art:p-deliverable:fitness-for-purpose
-p->
cri:c-o:satisfaction
-p->
suc:project:success
Example 14. Project team’s staffing level

Appendices
411
pro:software-development:difficulty
-n->
art:software-components:fitness-for-purpose
-n->
pro:software-development:duration
-p->
pro:project:duration
-p->
pro:project:priority\volatility
-n->
art:p-plan:fitness-for-purpose
-n->
art:issues:number-of
-n->
art:p-deliverable:fitness-for-purpose
-p->
cri:project:benefit\to-c-o
-p->
cri:c-o:satisfaction
-p->
suc:project:success
Example 15. Software development difficulty
ext:business-environment:recession
-p->
act:c-o:politics
-n->
act:s-o\p-team:work-environment
-p->
act:s-o\p-team:teamwork
-p->
act:s-o\p-team:competence\issue-resolution
-n->
art:issues:number-of
-n->
act:s-o\p-manager:control-of-project
-p->
pro:requirements-management:effectiveness
-p->
art:requirements:fitness-for-purpose
-p->
cri:p-deliverable:utilisation-by-c-o\end-users
-p->
suc:project:success
Example 16. Recession in the business environment

Appendices
412
art:p-deliverable:ease-of-use
-p->
art:p-deliverable:fitness-for-purpose
-p->
cri:project:benefit\to-c-o
-p->
cri:c-o:satisfaction
-p->
act:c-o:willingness-to-pay-for-project
-p->
cri:project:profitability\to-s-o
-p->
suc:project:success
Example 17. Project deliverable’s ease of use
pro:personnel-recruitment:effectiveness
-p->
act:s-o\p-team:competence
-p->
act:s-o\p-team:management-of\ease-of
-n->
act:s-o\p-manager:workload
-n->
act:s-o\p-manager:ability\to-manage-project
-n->
act:c-o:politics
-n->
act:s-o\p-team:work-environment
-p->
act:s-o\p-team:teamwork
-p->
art:p-deliverable:fitness-for-purpose
-p->
cri:c-o:satisfaction
-p->
suc:project:success
Example 18. Effective personnel recruitment

Appendices
413
act:s-o\p-team:proximity-to-c-o
-p->
act:c-o:involvement
-p->
act:s-o:relationship-with-c-o
-p->
pro:communication-with-c-o:effectiveness
-p->
act:c-o:understanding\what-they-want
-p->
art:estimates:fitness-for-purpose
-p->
art:p-plan:fitness-for-purpose
-n->
art:issues:number-of
-n->
art:p-deliverable:fitness-for-purpose
-p->
cri:project:profitability\to-s-o
-p->
suc:project:success
Example 19. Proximity of the project team to the client organisation
pro:communication-with-c-o:face-to-face
-p->
act:s-o:relationship-with-c-o
-p->
pro:issue-resolution:effectiveness
-n->
art:issues:number-of
-n->
pro:training\c-o\end-users:time-available-for
-p->
pro:training\c-o\end-users:effectiveness
-p->
pro:software-testing\uat:effectiveness
-p->
art:p-deliverable:fitness-for-purpose
-p->
cri:project:adherence\requirements
-p->
cri:p-deliverable:utilisation-by-c-o\end-users
-p->
suc:project:success
Example 20. Face-to-face communication with the client
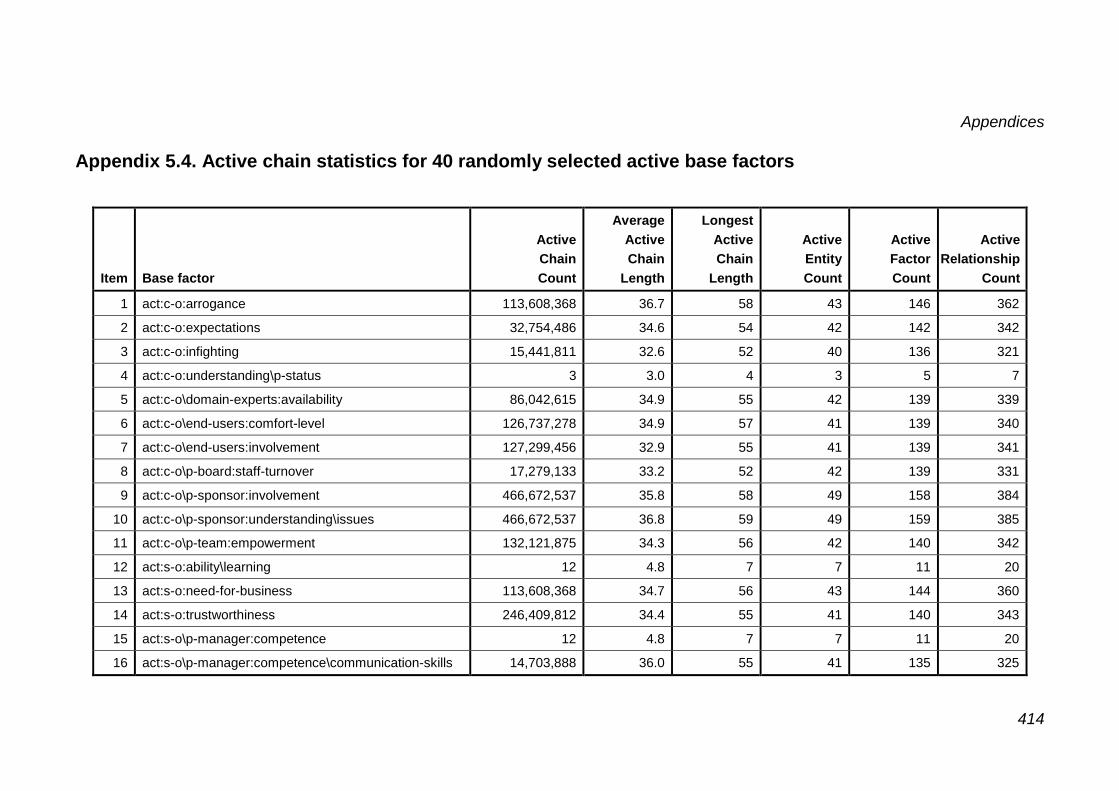
Appendices
414
Appendix 5.4. Active chain statistics for 40 randomly selected active base factors
Item Base factor
Active
Chain
Count
Average
Active
Chain
Length
Longest
Active
Chain
Length
Active
Entity
Count
Active
Factor
Count
Active
Relationship
Count
1 act:c-o:arrogance 113,608,368 36.7 58 43 146 362
2 act:c-o:expectations 32,754,486 34.6 54 42 142 342
3 act:c-o:infighting 15,441,811 32.6 52 40 136 321
4 act:c-o:understanding\p-status 3 3.0 4 3 5 7
5 act:c-o\domain-experts:availability 86,042,615 34.9 55 42 139 339
6 act:c-o\end-users:comfort-level 126,737,278 34.9 57 41 139 340
7 act:c-o\end-users:involvement 127,299,456 32.9 55 41 139 341
8 act:c-o\p-board:staff-turnover 17,279,133 33.2 52 42 139 331
9 act:c-o\p-sponsor:involvement 466,672,537 35.8 58 49 158 384
10 act:c-o\p-sponsor:understanding\issues 466,672,537 36.8 59 49 159 385
11 act:c-o\p-team:empowerment 132,121,875 34.3 56 42 140 342
12 act:s-o:ability\learning 12 4.8 7 7 11 20
13 act:s-o:need-for-business 113,608,368 34.7 56 43 144 360
14 act:s-o:trustworthiness 246,409,812 34.4 55 41 140 343
15 act:s-o\p-manager:competence 12 4.8 7 7 11 20
16 act:s-o\p-manager:competence\communication-skills 14,703,888 36.0 55 41 135 325

Appendices
415
Item Base factor
Active
Chain
Count
Average
Active
Chain
Length
Longest
Active
Chain
Length
Active
Entity
Count
Active
Factor
Count
Active
Relationship
Count
17 act:s-o\p-manager:trustworthiness 246,409,812 34.4 55 41 140 343
18 act:s-o\p-team:energy 14,703,876 34.0 53 41 135 322
19 act:s-o\p-team:fear-of-losing-face 23,612,860 35.3 55 41 140 341
320 act:s-o\p-team:proximity-to-c-o 505,963,634 35.8 57 41 143 351
21 act:s-o\p-team:staffing-level 38,763,883 31.9 52 41 139 338
22 art:existing-system:account-of 41,945,193 33.2 55 42 141 338
23 art:issues:early-resolution-of 15,441,811 32.6 52 40 136 321
24 art:p-charter:fitness-for-purpose 29,407,721 35.0 55 41 137 325
25 art:p-deliverable:ease-of-use 13 4.7 6 6 10 20
26 art:p-objectives:fitness-for-purpose 2 2.0 2 2 3 4
27 art:p-plan:fitness-for-purpose 22,662,472 31.7 51 41 135 328
28 art:prototypes:utilisation-of 364,239,914 34.4 58 41 143 355
29 art:requirements:clarity 29,319,619 33.7 53 41 139 339
30 art:requirements:fitness-for-purpose 66,720,075 32.1 54 41 141 340
31 ext:business-environment:recession 197,177,022 34.8 57 45 147 366
32 pro:communication:effectiveness 87,295,247 32.9 53 41 138 338
33 pro:communication-with-c-o:face-to-face 523,703,261 34.8 56 42 142 351
34 pro:estimating:effectiveness 46741,253 33.8 54 42 138 337
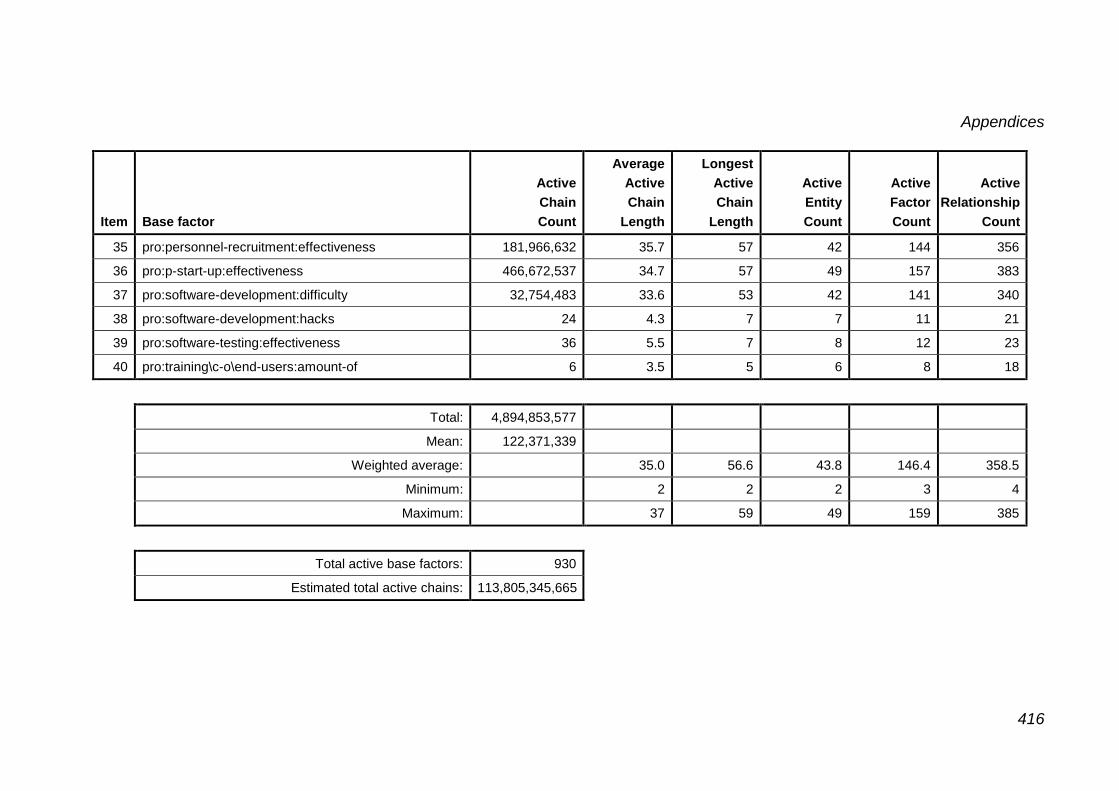
Appendices
416
Item Base factor
Active
Chain
Count
Average
Active
Chain
Length
Longest
Active
Chain
Length
Active
Entity
Count
Active
Factor
Count
Active
Relationship
Count
35 pro:personnel-recruitment:effectiveness 181,966,632 35.7 57 42 144 356
36 pro:p-start-up:effectiveness 466,672,537 34.7 57 49 157 383
37 pro:software-development:difficulty 32,754,483 33.6 53 42 141 340
38 pro:software-development:hacks 24 4.3 7 7 11 21
39 pro:software-testing:effectiveness 36 5.5 7 8 12 23
40 pro:training\c-o\end-users:amount-of 6 3.5 5 6 8 18
Total: 4,894,853,577
Mean: 122,371,339
Weighted average: 35.0 56.6 43.8 146.4 358.5
Minimum: 2 2 2 3 4
Maximum: 37 59 49 159 385
Total active base factors: 930
Estimated total active chains: 113,805,345,665
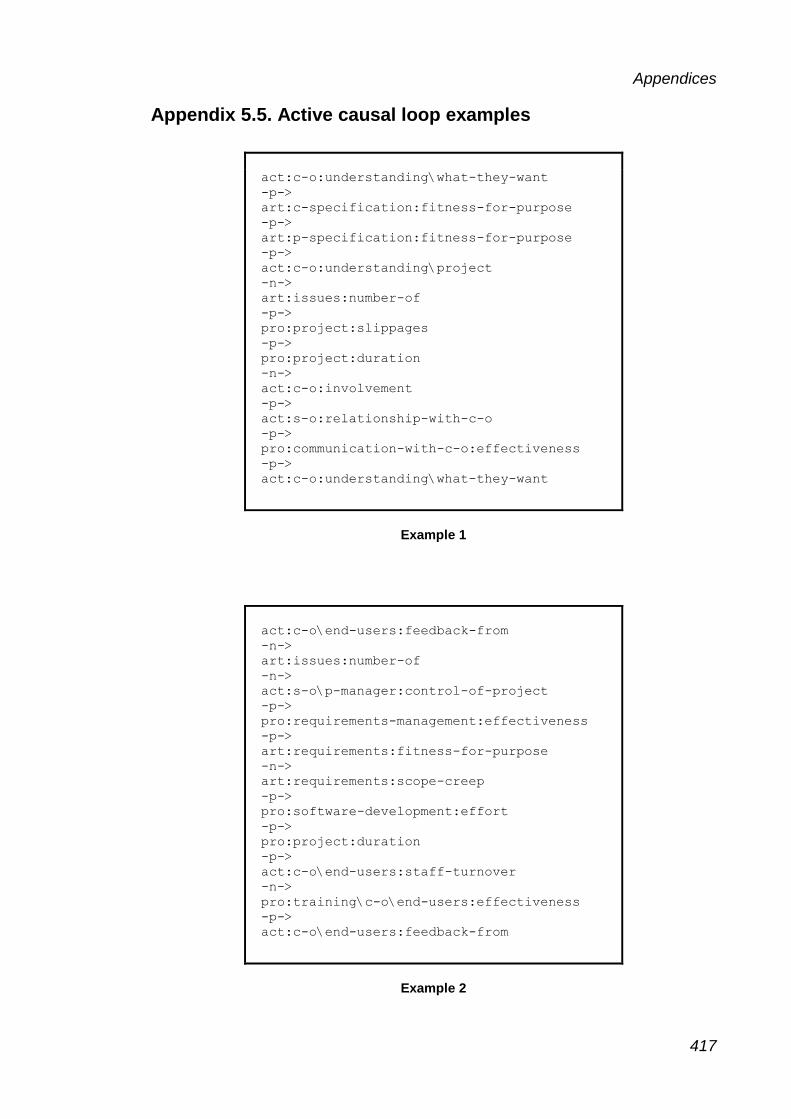
Appendices
417
Appendix 5.5. Active causal loop examples
act:c-o:understanding\what-they-want
-p->
art:c-specification:fitness-for-purpose
-p->
art:p-specification:fitness-for-purpose
-p->
act:c-o:understanding\project
-n->
art:issues:number-of
-p->
pro:project:slippages
-p->
pro:project:duration
-n->
act:c-o:involvement
-p->
act:s-o:relationship-with-c-o
-p->
pro:communication-with-c-o:effectiveness
-p->
act:c-o:understanding\what-they-want
Example 1
act:c-o\end-users:feedback-from
-n->
art:issues:number-of
-n->
act:s-o\p-manager:control-of-project
-p->
pro:requirements-management:effectiveness
-p->
art:requirements:fitness-for-purpose
-n->
art:requirements:scope-creep
-p->
pro:software-development:effort
-p->
pro:project:duration
-p->
act:c-o\end-users:staff-turnover
-n->
pro:training\c-o\end-users:effectiveness
-p->
act:c-o\end-users:feedback-from
Example 2

Appendices
418
act:c-o\end-users:involvement
-p->
art:requirements:fitness-for-purpose
-p->
art:business-case:fitness-for-purpose
-p->
act:c-o:buy-in
-n->
act:c-o:resistance-to-change
-p->
pro:change-management:effort
-p->
pro:change-management:effectiveness
-p->
act:c-o\end-users:buy-in
-p->
art:requirements:agreement-of
-p->
pro:change-control:effectiveness
-p->
art:requirements:priorities
-p->
art:p-budget:fitness-for-purpose
-p->
act:s-o\p-team:staffing-level
-n->
act:s-o\p-team:management-of\ease-of
-n->
act:s-o\p-manager:workload
-n->
act:s-o\p-manager:ability\to-manage-project
-n->
act:c-o:politics
-n->
act:s-o\p-team:work-environment
-p->
act:s-o\p-team:teamwork
-p->
act:s-o\p-team:competence\issue-resolution
-n->
art:issues:number-of
-p->
pro:project:duration
-p->
act:c-o\end-users:staff-turnover
-n->
pro:training\c-o\end-users:effectiveness
-n->
act:c-o\end-users:fear-of-change-imposed-by-project
-p->
act:c-o\end-users:resistance-to-change
-n->
act:c-o\end-users:involvement
Example 3

Appendices
419
act:s-o:relationship-with-c-o
-n->
act:c-o:politics
-n->
act:s-o\p-team:work-environment
-p->
act:s-o\p-team:teamwork
-p->
act:s-o\p-team:competence\issue-resolution
-n->
art:issues:number-of
-n->
act:s-o\p-manager:control-of-project
-p->
pro:requirements-management:effectiveness
-n->
pro:project:duration
-n->
act:c-o:involvement
-p->
act:s-o:relationship-with-c-o
Example 4
act:s-o\p-manager:understanding\s-o\p-team
-p->
act:s-o\p-manager:ability\to-deal-with-s-o\p-team-issues
-p->
act:s-o\p-team:productivity
-n->
pro:software-development:duration
-p->
pro:project:duration
-n->
act:c-o:involvement
-p->
act:s-o:relationship-with-c-o
-p->
pro:communication-with-c-o:effectiveness
-p->
act:c-o:comfort-level
-p->
pro:communication:effectiveness
-p->
act:s-o\p-manager:understanding\s-o\p-team
Example 5

Appendices
420
art:estimates:fitness-for-purpose
-p->
art:p-plan:fitness-for-purpose
-p->
act:s-o\p-team:competence\fit-with-project
-n->
pro:software-development:slippages
-p->
pro:project:schedule-pressure
-p->
art:issues:number-of
-n->
pro:training\c-o\end-users:time-available-for
-p->
pro:training\c-o\end-users:effectiveness
-p->
act:c-o\end-users:feedback-from
-p->
art:specifications\software-design:fitness-for-purpose
-p->
art:estimates:fitness-for-purpose
Example 6
art:issues:number-of
-p->
pro:project:difficulty
-p->
pro:software-development:effort
-p->
pro:software-development:duration
-p->
pro:project:duration
-n->
act:c-o:involvement
-p->
act:s-o:relationship-with-c-o
-n->
act:c-o:politics
-p->
art:requirements:scope-creep
-n->
art:p-plan:fitness-for-purpose
-n->
art:issues:number-of
Example 7
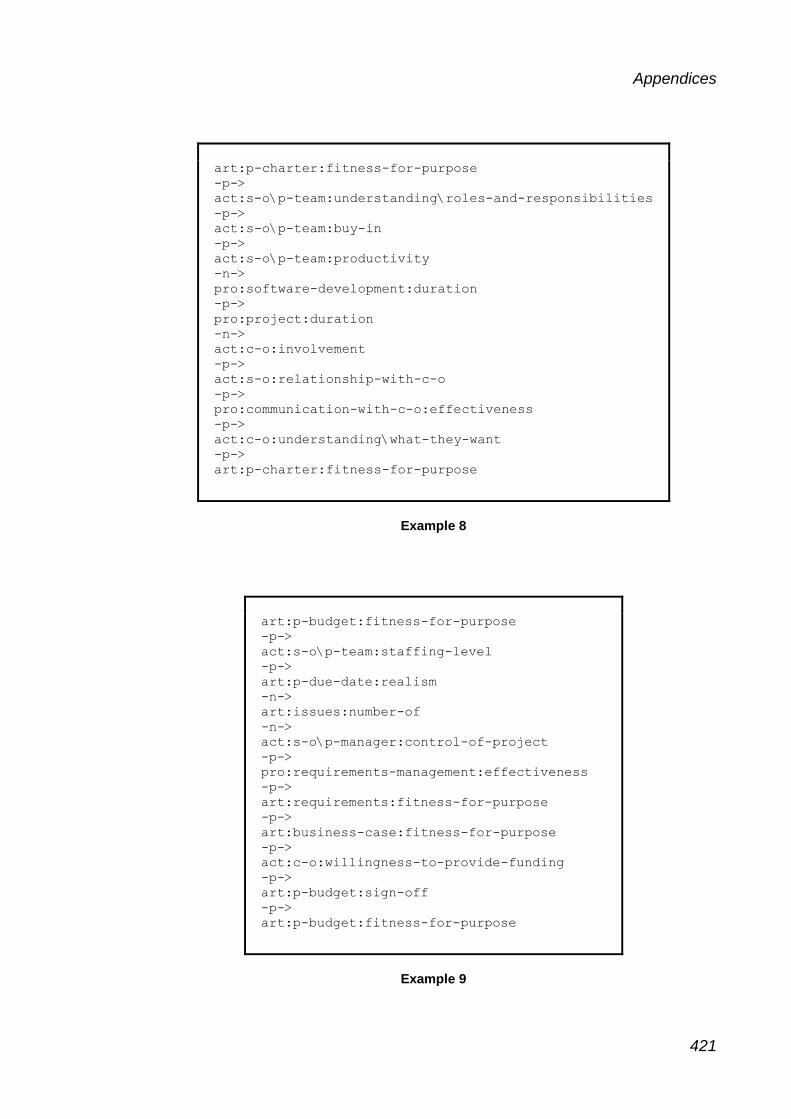
Appendices
421
art:p-charter:fitness-for-purpose
-p->
act:s-o\p-team:understanding\roles-and-responsibilities
-p->
act:s-o\p-team:buy-in
-p->
act:s-o\p-team:productivity
-n->
pro:software-development:duration
-p->
pro:project:duration
-n->
act:c-o:involvement
-p->
act:s-o:relationship-with-c-o
-p->
pro:communication-with-c-o:effectiveness
-p->
act:c-o:understanding\what-they-want
-p->
art:p-charter:fitness-for-purpose
Example 8
art:p-budget:fitness-for-purpose
-p->
act:s-o\p-team:staffing-level
-p->
art:p-due-date:realism
-n->
art:issues:number-of
-n->
act:s-o\p-manager:control-of-project
-p->
pro:requirements-management:effectiveness
-p->
art:requirements:fitness-for-purpose
-p->
art:business-case:fitness-for-purpose
-p->
act:c-o:willingness-to-provide-funding
-p->
art:p-budget:sign-off
-p->
art:p-budget:fitness-for-purpose
Example 9

Appendices
422
art:p-plan:fitness-for-purpose
-p->
act:s-o:resource-availability
-p->
act:s-o\p-team:staffing-level
-n->
act:s-o\p-team:management-of\ease-of
-n->
act:s-o\p-manager:workload
-n->
act:s-o\p-manager:ability\to-manage-project
-n->
act:c-o:politics
-n->
act:s-o\p-team:work-environment
-p->
act:s-o\p-team:teamwork
-p->
act:s-o\p-team:competence\issue-resolution
-n->
art:issues:number-of
-n->
act:s-o\p-manager:control-of-project
-p->
pro:requirements-management:effectiveness
-p->
art:requirements:fitness-for-purpose
-p->
art:business-case:fitness-for-purpose
-p->
act:c-o:buy-in
-n->
act:c-o:resistance-to-change
-p->
pro:change-management:effort
-n->
pro:change-management:effectiveness
-p->
act:c-o\end-users:buy-in
-n->
act:c-o\end-users:resistance-to-change
-n->
act:c-o\end-users:involvement
-p->
art:specifications\software-design:fitness-for-purpose
-p->
art:estimates:fitness-for-purpose
-n->
pro:software-development:duration
-p->
pro:project:duration
-n->
art:p-plan:accuracy
-p->
art:p-plan:fitness-for-purpose
Example 10

Appendices
423
Appendix 5.6. Causal loop statistics for 20 randomly selected active factors
Item Factor
Active
Loop
Count
Average
Active
Loop
Length
Longest
Active
Loop
Length
Active
Entity
Count
Active
Factor
Count
Active
Relationship
Count
1 act:c-o:understanding\what-they-want 605,486 32.2 50 33 85 174
2 act:c-o\end-users:feedback-from 855,146 30.9 50 33 94 195
3 act:c-o\end-users:involvement 1,325,860 31.1 50 33 95 198
4 act:s-o:relationship-with-c-o 1,113,539 31.1 50 34 89 190
5 act:s-o\p-manager:understanding\s-o\p-team 1,403,164 30.7 50 33 93 195
6 art:estimates:fitness-for-purpose 1,516,620 30.5 50 33 95 198
7 art:issues:number-of 1,956,959 30.1 50 33 95 198
8 art:p-budget:fitness-for-purpose 1,097,433 30.7 50 33 95 198
9 art:p-charter:fitness-for-purpose 2 10.0 10 7 11 12
10 art:p-plan:fitness-for-purpose 1,822,480 30.4 50 33 95 198
11 art:p-specification:fitness-for-purpose 219,002 32.5 50 31 78 157
12 art:requirements:fitness-for-purpose 1,785,370 30.4 50 33 95 198
13 art:requirements:priorities 466,755 31.6 50 33 95 198
14 art:requirements:scope-creep 1,422,284 30.7 50 33 95 198
15 pro:change-control:effectiveness 717,146 32.0 50 33 95 196
16 pro:communication-with-c-o:effectiveness 878,143 31.7 50 33 86 181

Appendices
424
Item Factor
Active
Loop
Count
Average
Active
Loop
Length
Longest
Active
Loop
Length
Active
Entity
Count
Active
Factor
Count
Active
Relationship
Count
17 pro:communication-with-c-o\end-users:effectiveness 983,771 31.6 50 33 96 198
18 pro:project:duration 2,002,974 30.0 50 34 99 211
19 pro:project:schedule-pressure 975,703 30.0 50 33 95 198
20 pro:training\c-o\end-users:effectiveness 1,609,613 30.5 50 33 95 198
Mean: 1,137,873
Weighted average: 30.7 50.0 33.1 94.2 196.7
Minimum: 10 10 7 11 12
Maximum: 33 50 34 99 211
Note: all factors in sample were known to appear in causal loops prior to random selection.

Appendices Appendices
425
Appendix 7.1. Additional recommendations for further research
In addition to the key recommendations presented in Chapter 7, a number of
additional recommendations were also identified. These are discussed below.
7.1.1 Recommendations to improve knowledge development in the field of
OISD project success factors
As demonstrated in Chapter 2, research into OISD project success factors
continues to be a vibrant research area (as does research into IS project
success factors). Yet, knowledge development in the field seems to have been
impeded due to the disparate nature of its success factor studies. Moreover, the
literature review encountered a number of issues that might hinder the
development of knowledge in the field. Hence, this section presents a number
of recommendations to improve knowledge development in the field of OISD
project success factors.
Research into OISD project success factors has done little to define its basic
terms. In particular, the majority of studies do not provide adequate descriptions
for the factors they identify. Studies that seek to identify project success factors
are classified as descriptive research; that is, they describe real-world projects.
However, there is evidence to suggest that real-world success factors differ
substantially from their normative counterparts, as presented in the project
management literature. In other words, theory and reality are somewhat
different for OISD project success factors (although this research provided
evidence that this disparity might be somewhat overstated). To address this
issue, more qualitative studies are required. This would allow the use of thick,
rich description to leave the reader with little doubt as to the meaning of the
factors identified.
There is also a need to clarify the lexicon of terms (labels) used to identify
success factors. In essence, these terms need to be properly defined and
synonymous terms identified and resolved. Consider, for example, project board
(executive management) support; a widely cited success factor for OISD
projects. Although some authors use the term “support” (for example, Brocke,

Appendices Appendices
426
Uebernickel & Brenner, 2009; Milis & Mercken, 2002), others use the term
“commitment” (for example, Keil, Cule, Lyytinen & Schmidt, 1998; Sauer &
Cuthbertson, 2003), seemingly to describe the same concept. However, other
authors (for example, Sharma, Sengupta & Gupta, 2011; Wallace & Keil, 2004)
use both terms in their studies, suggesting that support for a project and
commitment to a project are not synonymous. Although it can be argued that
the project board’s commitment to a project is not evidence of their ability to
provide support for the project, it is also evident that some authors seem to
consider the terms to be synonymous. Hence, clarification for these and other
terms is required.
The 56 studies that formed the basis of the success factor analysis (performed
as part of the literature review) covered both in-house and supplier-based
software development. However, in the majority of studies (33 articles), this
distinction was not clear. The same can be said for studies that investigated
“software projects.” Again, it was sometimes unclear as to whether these
studies were investigating OISD projects or projects that were undertaken to
produce non-organisational software products (for example, embedded
software, computer games, etc.). Hence, there is a need for OISD project
success factor researchers to take greater care in defining the scope of their
research.
The success factor analysis found that, until relatively recently, there had been
little opportunity for “learning” from prior studies, with many articles failing to
provide limitations, lessons learned or recommendations for further research.
Similarly, discussions of validity and reliability were also found to be rare and, in
some cases, the research methodology was not made clear. Hence, OISD
project success factor researchers also need to take greater care in these
areas.
With a few exceptions (most notably, Ika, 2009), there is a lack of articles with
the sole purpose of performing a comprehensive analysis of prior research into
project success (and, hence, success factors and success criteria) with a view
to determining the state-of-the-art of the research area and providing

Appendices Appendices
427
recommendations for further research. There are no such articles focussing on
OISD projects. Unfortunately, all too many project management researchers are
not familiar with the “depth of literature” in their field and are failing to
acknowledge the contributions made by prior research (Morris, 2010, p. 143).
Hence, the provision of retrospective articles of this type would serve to
enhance understanding of the literature and assist knowledge development in
the field of OISD project success factors.
7.1.2 Research into the management of OISD project success factors
Prior research has identified numerous success factors for OISD projects.
Although it has failed to identify a “critical few” that apply to all OISD projects, it
is reasonable to suggest that research in the field has contributed to the
awareness of project managers regarding OISD project success factors.
However, for OISD projects to be successful, project managers also need to
understand how to address success factors during the course of the project
(Larsen & Myers, 1999, p. 397). Unfortunately, the research literature offers little
advice on how success factors can be used to help alleviate the problems faced
by project managers in practice (Clarke, 1999, p. 139; Nakatsu & Iacovou,
2009, p. 64). Indeed, the literature is almost completely silent on the subject of
success factor management. Hence, project managers have been left to attend
to OISD success factors as they have always done: intuitively (Jugdev & Müller,
2005, p. 24). Clearly then, there is requirement for research into the
management of OISD project success factors.
This research adds a new dimension to this requirement. If, indeed, OISD
projects do contain a large number of success factors, numerous linear chains
and a large core of causal loops, how should success factors and the way in
which they influence project success be managed? Although this research
showed how highly active factors (those located at convergence/divergence
points in the network with high receptivity and range values) can be used to
monitor project performance, the issue of how success factors should be
managed remains extremely pertinent; an issue that presents a wide range of
descriptive and theoretical opportunities for research in the field.
Appendices Appendices
428
7.1.3 Extending the recommendations for further research beyond OISD
project success factors
The recommendations for further research presented in this appendix and in
Chapter 7 relate specifically to the field of OISD project success factors.
However, there is also a need to extend the scope of these recommendations
beyond OISD projects to encompass IS/IT projects and projects in general. For
example, the need for qualitative research that makes appropriate use of thick,
rich description is equally well-founded for generic, IS/IT and OISD projects as it
is for supplier-based OISD projects.