
Project Risk Management. What is Risk? Risk and uncertainty are equivalent.
104
Project Risk Management
-
date post
19-Dec-2015 -
Category
Documents
-
view
221 -
download
0
Transcript of Project Risk Management. What is Risk? Risk and uncertainty are equivalent.

Project Risk Management

What is Risk?
Risk and uncertainty are equivalent

Three Definitions• Risk
– A possible future event which if it occurs will lead to an undesirable outcome.
• Project Risk– The cumulative effect of the chances of an
uncertain occurrence that will adversely affect project objectives.
• Risk Management– A systematic and explicit approach for
identifying, quantifying, and controlling project risk.

DEFINITIONPROJECT RISK MANAGEMENT IS THE ART AND SCIENCE OF
IDENTIFYING, ASSESSING, AND RESPONDING TO PROJECTRISK THROUGHOUT THE LIFE OF A PROJECT AND IN THE BEST INTERESTS OF ITS OBJECTIVES
PROJECT RISK IS THE CUMULATIVE EFFECT OF THE CHANCES OF UNCERTAIN OCCURRENCES ADVERSELY AFFECTING PROJECT OBJECTIVES

RISK MANAGEMENT PURPOSE
IDENTIFY FACTORS THAT ARE LIKELY TO IMPACT THE PROJECT OBJECTIVES OF SCOPE, QUALITY, COST AND TIME
QUANTIFY THE LIKELY IMPACT OF EACH FACTOR
GIVE A BASELINE FOR PROJECT NON-CONTROLLABLES
MITIGATE IMPACTS BY EXERCISING INFLUENCE OVER PROJECT CONTROLLABLES
THE PMBOK ALSO POINTS OUT THAT RISK MANAGEMENT INCLUDES MAXIMIZING THE RESULTS OF POSITIVE EVENTS AND MINIMIZING THE CONSEQUENCES OF ADVERSE EVENTS.

ISSUES
A RISK SHOULD ONLY BE TAKEN WHEN THE POTENTIAL BENEFIT AND CHANCES OF WINNING EXCEED THE REMEDIAL COST OF AN UNSUCCESSFUL DECISION AND CHANCES OF LOSING BY A SATISFACTORY MARGIN
WHAT WILL BE GAINED?WHAT COULD BE LOST?WHAT ARE THE CHANCES OF SUCCESS (AND FAILURE)?WHAT CAN BE DONE IF THE DESIRED RESULT IS NOT ACHIEVED?IS THE POTENTIAL REWARD WORTH THE RISK?
POTENTIAL FREQUENCY OF LOSSAMOUNT AND RELIABILITY OF INFORMATION AVAILABLEPOTENTIAL SEVERITY OF LOSSMANAGEABILITY OF THE RISKVIVIDNESS OF THE CONSEQUENCESPOTENTIAL FOR (ADVERSE) PUBLICITYWHOSE MONEY IS IT?

NATURE OF RISK MANAGEMENT
WHEN SPEAKING OF RISK, THINK OF ONLY HAZARDOUS ONES
EVERYDAY COMMON DAY ONES ARE IGNORED
RARELY DO WE SYSTEMATICALLY IDENTIFY ALL RISKS INVOLVED
HOWEVER, INCLINED TO CONSIDER RISK DIFFERENTLY RELATIVE TO FAMILY - VERY PRECIOUS AND LOTS OF POTENTIAL
EXAMPLES:SMALL CHILDREN - STAY AWAY FROM ROAD - RISK ID & AVOIDANCEHOW DID DAY GO? - DO MORE TO HELP THEM - INFO FEEDBACK
THESE ACTIONS ARE ESTABLISHING THE BASIC ELEMENTS OF MANAGING PROJECT RISK INTO OUR CHILDREN
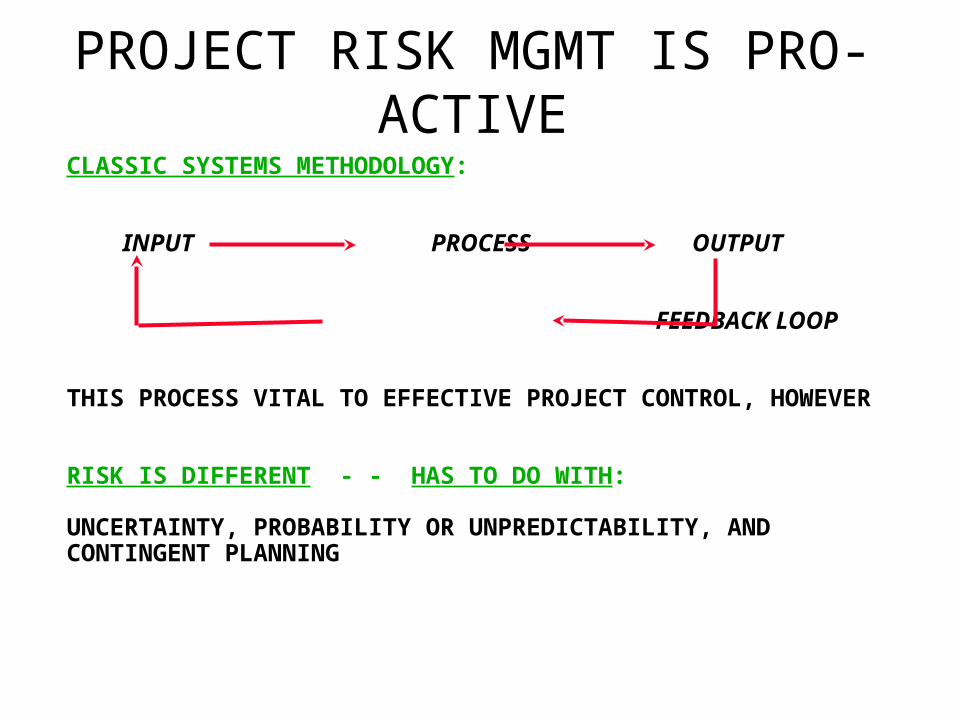
PROJECT RISK MGMT IS PRO-ACTIVE
CLASSIC SYSTEMS METHODOLOGY:
INPUT PROCESS OUTPUT
FEEDBACK LOOP
THIS PROCESS VITAL TO EFFECTIVE PROJECT CONTROL, HOWEVER
RISK IS DIFFERENT - - HAS TO DO WITH:
UNCERTAINTY, PROBABILITY OR UNPREDICTABILITY, AND CONTINGENT PLANNING

REACTIVE vs. PRO-ACTIVE
CRISIS MANAGEMENT -- REACTIVE MODE -- SELECT RESPONSE
PRO-ACTIVE -- ANTICIPATE AND PLAN TO AVOID
RISK & DECISION MAKING:
TAKE RISK IF POTENTIAL BENEFIT AND CHANCE OF WINNING EXCEEDS COST OF UNSUCCESSFUL DECISION AND CHANCES OF LOSING BY A SATISFACTORY MARGIN (CLASSIC COST / BENEFIT ANALYSIS)

Project Risk Management
R iskIdentifica tion
11.1
R iskQ uantifica tion
11.2
R isk ResponseD evelopm ent
11.3
R isk ResponseC ontro l
11.4
P ro jec t R iskM anagem ent
11.0

PMBOK Risk
• Opportunities - Positive outcome
• Threats - Negative outcome

Benefits of Risk Management
• More and better information is available during planning and decision making
• Project objectives are verified
• Improved communications
• Higher probability of project success
• Proactive approach
• Project might be canceled

Why Organizations don’t doRisk Management
• Unwillingness to admit risks exist
• Postpone the hard parts of the project until later
• Risk management costs money– Up front investment of time– Can’t prove it’s necessary
• Think health insurance

Why Organizations don’t doRisk Management
• “Can Do” management style severely inhibits risk management
• Risk identification can make you look like a whiner

Ways to AvoidRisk Management
• “Managing risk is everybody’s business”
• “There is only one risk: The project might fail. And we’re managing that by working real hard to assure that doesn’t happen.”

The Uncertainty Spectrum
TOTALCERTAINTY
TOTALUNCERTAINTY
GENERALUNCERTAINTY
SPECIFICUNCERTAINTY
(Unknownunknowns) (Knowns)
NOInformation
CompleteInformation
PartialInformation
(Knownunknowns)
SCOPE OF PROJECT RISK MANAGEMENT*
*Note: in this range the information to be sought is known

Project Risk
Project Risk
Scope
IntegrationCommunication
Human Resources
Procurement
Cost
Quality
Time
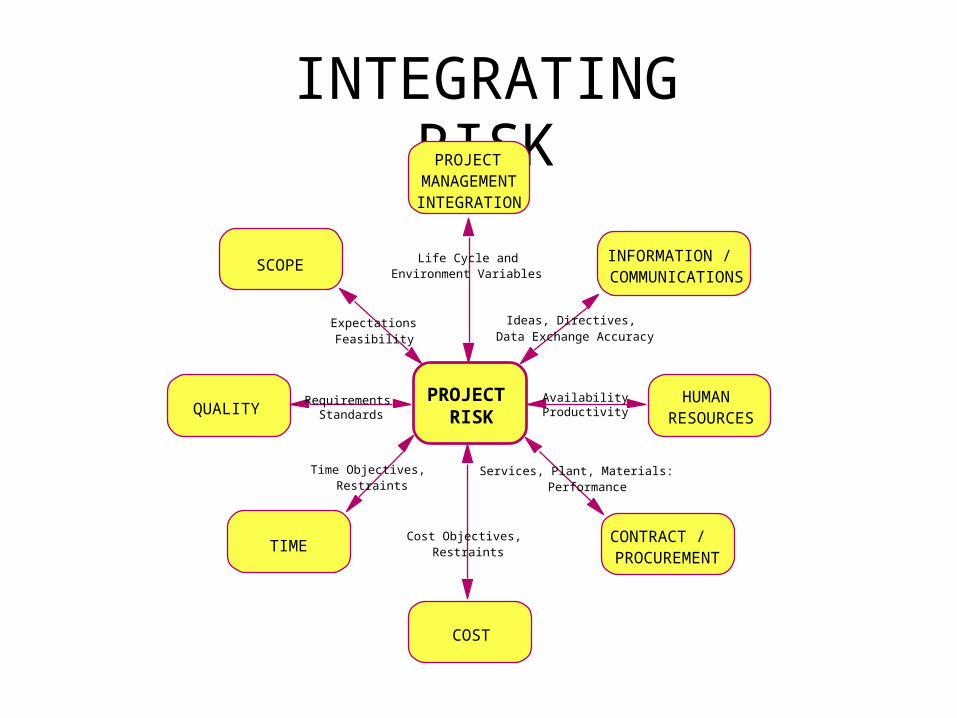
INTEGRATING RISKPROJECT
MANAGEMENT INTEGRATION
SCOPE
QUALITY
TIME
COST
HUMAN RESOURCES
CONTRACT / PROCUREMENT
INFORMATION / COMMUNICATIONS
PROJECT RISK
Life Cycle and Environment Variables
Services, Plant, Materials: Performance
Cost Objectives, Restraints
Time Objectives, Restraints
Expectations Feasibility
Ideas, Directives, Data Exchange Accuracy
Requirements Standards
AvailabilityProductivity
Project Risk Management
A subset of project management that includes the processes concerned with
identifying, analyzing, and responding to project risk.

Risk Management Objectives
• Reduce the number of surprise events
• Minimize consequences of adverse events
• Maximize the results of positive events

Risk Classification
• Business risks vs. pure (insurable) risks
• Classified by uncertainty (business risks)
• Classified by impact on project elements
• Classified by their nature
• Classified by their source
• Classified by their probability to occur and amount at stake
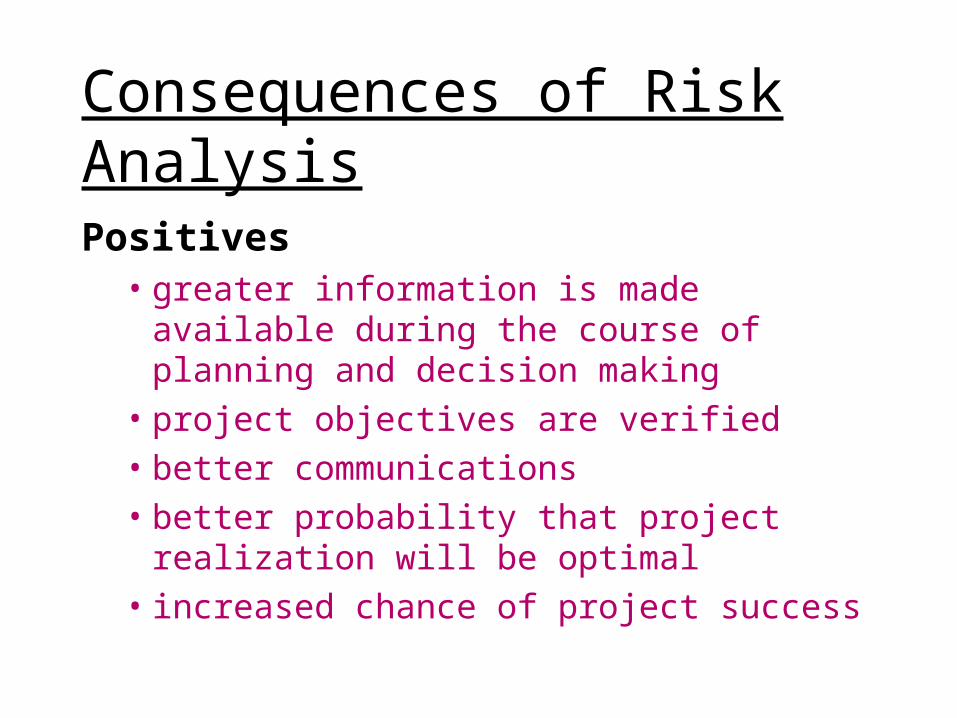
Consequences of Risk Analysis
Positives• greater information is made available during
the course of planning and decision making• project objectives are verified• better communications• better probability that project realization will be
optimal• increased chance of project success

Consequences of Risk Analysis
Negatives• belief that all risks have been accounted for• project could be shut down

Some Considerations
• Real information is the key.• The relationship between uncertainty and
information is inverse.• For the project manager, conditions of relative
uncertainty (partial information) are the rule.• There is a natural resistance to formal risk
analysis.• Risks should only be taken to achieve a project
objective.
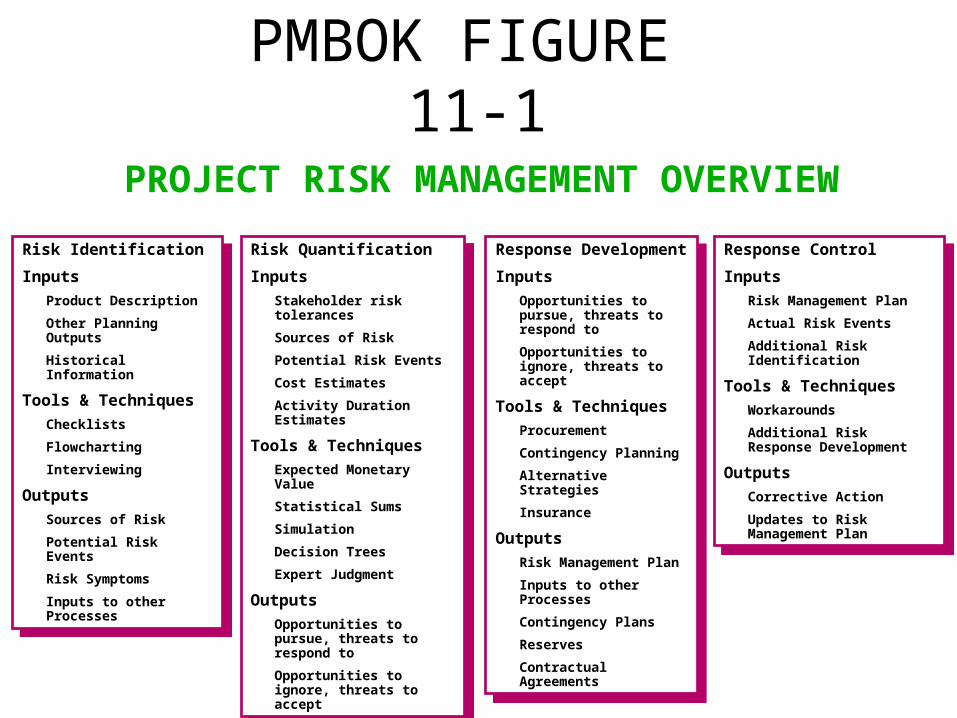
PMBOK FIGURE 11-1
PROJECT RISK MANAGEMENT OVERVIEW
Risk Identification
Inputs
Product Description
Other Planning Outputs
Historical Information
Tools & Techniques
Checklists
Flowcharting
Interviewing
Outputs
Sources of Risk
Potential Risk Events
Risk Symptoms
Inputs to other Processes
Risk Identification
Inputs
Product Description
Other Planning Outputs
Historical Information
Tools & Techniques
Checklists
Flowcharting
Interviewing
Outputs
Sources of Risk
Potential Risk Events
Risk Symptoms
Inputs to other Processes
Risk Quantification
Inputs
Stakeholder risk tolerances
Sources of Risk
Potential Risk Events
Cost Estimates
Activity Duration Estimates
Tools & Techniques
Expected Monetary Value
Statistical Sums
Simulation
Decision Trees
Expert Judgment
Outputs
Opportunities to pursue, threats to respond to
Opportunities to ignore, threats to accept
Response Development
Inputs
Opportunities to pursue, threats to respond to
Opportunities to ignore, threats to accept
Tools & Techniques
Procurement
Contingency Planning
Alternative Strategies
Insurance
Outputs
Risk Management Plan
Inputs to other Processes
Contingency Plans
Reserves
Contractual Agreements
Response Control
Inputs
Risk Management Plan
Actual Risk Events
Additional Risk Identification
Tools & Techniques
Workarounds
Additional Risk Response Development
Outputs
Corrective Action
Updates to Risk Management Plan
Response Control
Inputs
Risk Management Plan
Actual Risk Events
Additional Risk Identification
Tools & Techniques
Workarounds
Additional Risk Response Development
Outputs
Corrective Action
Updates to Risk Management Plan

Risk Identification
R iskIdentification
11.1
R iskQ uantifica tion
11.2
R isk ResponseD evelopm ent
11.3
R isk ResponseC ontro l
11.4
P ro jec t R iskM anagem ent
11.0
Risk identification is determining which risks are likely to affect the project and documenting the characteristics of each.

Typical Life Cycle ProfilesRisk versus Amount at Stake
Total project life cycleINCREASING
RISK
$
VALUE
TIME
Plan Accomplish
Phase 1Conceive
Phase 2Develop
Phase 3Execute
Phase 4Finish
Opportunity & Risk
Amount at Stake
(period when highestrisks are incurred)
(period of highestrisk impact)

Inputs to Risk Identification
• Product description– Specification– SOW– Contract
• Other planning outputs– WBS– OBS– Cost and Schedule estimates

Inputs to Risk Identification
• Historical information– Commercial databases– Corporate memory– Corporate database (lessons learned)– Websites
Inputs to Risk Identification
• Assumptions– Explicit– Implicit
• Critical success factors

PHASE 1: RISK IDENTIFICATIONIDENTIFY ALL POSSIBLE RISKS WHICH MAY SIGNIFICANTLY IMPACT
THE SUCCESS OF THE PROJECT -- CAN DO THIS BY:
CAUSE-AND-EFFECT ANALYSIS (WHAT COULD HAPPEN WHAT ENSUES)
EFFECT-AND-CAUSE ANALYSIS (WHAT OUTCOMES TO AVOID HOW THEY MIGHT OCCUR)
BRING IN THE EXPERTS ON THE PROGRAM AND QUESTION THEM
BRAINSTORM
WBS - INDIVIDUAL WORK PACKAGES PLUS COMBINATIONS THEREOF
WILLOUGHBY TEMPLATES, SEI TAXONOMY AND CHARELLET CHECKLIST
Risk typically examines possibility of suffering harm or loss; however, Risk Identification is also concerned with opportunities (positive outcomes) and threats (negative outcomes).
Risk typically examines possibility of suffering harm or loss; however, Risk Identification is also concerned with opportunities (positive outcomes) and threats (negative outcomes).

TYPES OF RISK
• Business vs. Insurable Risk
• Risk Sources– External Unpredictable– External Predictable– Internal Non-Technical– Technical– Legal

TYPES OF RISK (2)• Knowns
– An item or situation containing no uncertainty
• Known Unknowns
– Things which we know exist but do not know how they will affect us. These can be identified and evaluated.
• Unknown Unknowns
– Those risks that cannot be identified and evaluated (unexpected needs). These can be handled via contingency allowances.

TYPES OF RISK (3)• Risks can also be classified as:
– External Unpredictable
– External Predictable
– Internal Non-Technical
– Technical
– Legal

EXTERNAL UNPREDICTABLE • Regulatory
• Natural Hazards
• Postulated Events
• Unexpected Side Effects of the Project
• Failure to Complete Project Due to Uncontrollable External Events

EXTERNAL PREDICTABLE• Market Risks
• Operational
• Environmental Impacts
• Social Impacts
• Currency Risk
• Inflation
• Taxes

INTERNAL, NON-TECHNICAL
• Management
• Schedule
• Cost
• Cash Flow
• Loss of Potential Benefit or Profit

TECHNICAL
• Changes in Technology
• Performance Uncertainty
• Risks Associated with Project’s Technology
• Design
• Sheer Size or Complexity

LEGAL• Licensing
• Patent Rights
• Contractual Difficulties
• Outsider Suits
• Insider Suits
• Force Majeure (PMI’s Word)

OTHER RISK ID SOURCES• Overly Aggressive Cost Estimates
• Overly Aggressive Duration Estimates
• Staffing Plan - Personnel With Special Skills
• Procurement Management Plan
• Historical Project Files & Project Team Knowledge
• Commercial Databases

KEEP IN MIND
• How can you assess risks?– Break things down into individual elements and
determine their relationships
• What risks should you assess?– All of them– Concentrate on those with greatest impact and
most likely probability of occurrence
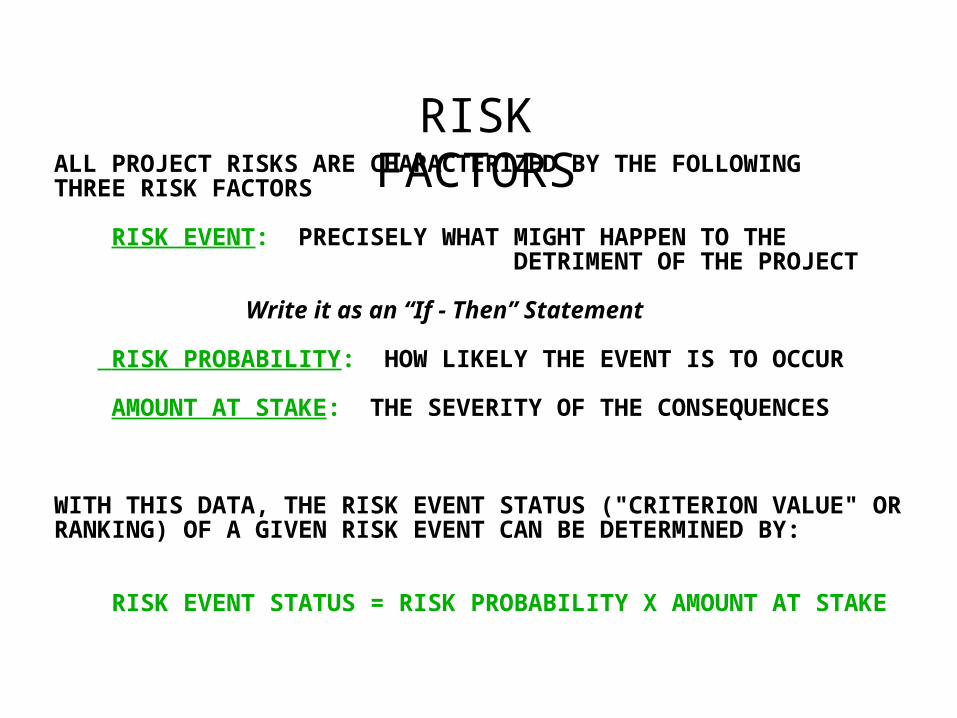
RISK FACTORSALL PROJECT RISKS ARE CHARACTERIZED BY THE FOLLOWING
THREE RISK FACTORS
RISK EVENT: PRECISELY WHAT MIGHT HAPPEN TO THE DETRIMENT OF THE PROJECT
Write it as an “If - Then” Statement
RISK PROBABILITY: HOW LIKELY THE EVENT IS TO OCCUR
AMOUNT AT STAKE: THE SEVERITY OF THE CONSEQUENCES
WITH THIS DATA, THE RISK EVENT STATUS ("CRITERION VALUE" ORRANKING) OF A GIVEN RISK EVENT CAN BE DETERMINED BY:
RISK EVENT STATUS = RISK PROBABILITY X AMOUNT AT STAKE

RISK EVENT vs. RISK SYMPTOM
RISK EVENT ARE DISCRETE OCCURRENCES
RISK SYMPTOM TRIGGERS
THESE ARE INDIRECT MANIFESTATIONS OF ACTUAL RISK EVENTS
EXAMPLES OF RISK SYMPTOMS:
POOR MORALE = EARLY WARNING SIGN OF SCHEDULE DELAY
EARLY PROJECT COST OVERRUN = POTENTIAL POOR PROJECT OVERALL ESTIMATING

Risk IdentificationTools and Techniques
• Checklists– Project Healthcheck
• Flowcharting– Cause & Effect (fishbone or Ishikawa charts
• What could happen What ensues
– Effect & Cause• Outcomes to avoid How they occur
– System or Process flowcharts

Risk IdentificationTools and Techniques
• Interviewing
• Brainstorming

Outputs• Sources of risk (i.e., categories)
– Stakeholder actions– Estimates– Staffing plans– Common sources of risk:
• Changes in requirements
• Design errors, omissions, and misunderstandings
• Poorly defined R & R
• Insufficiently skilled staff
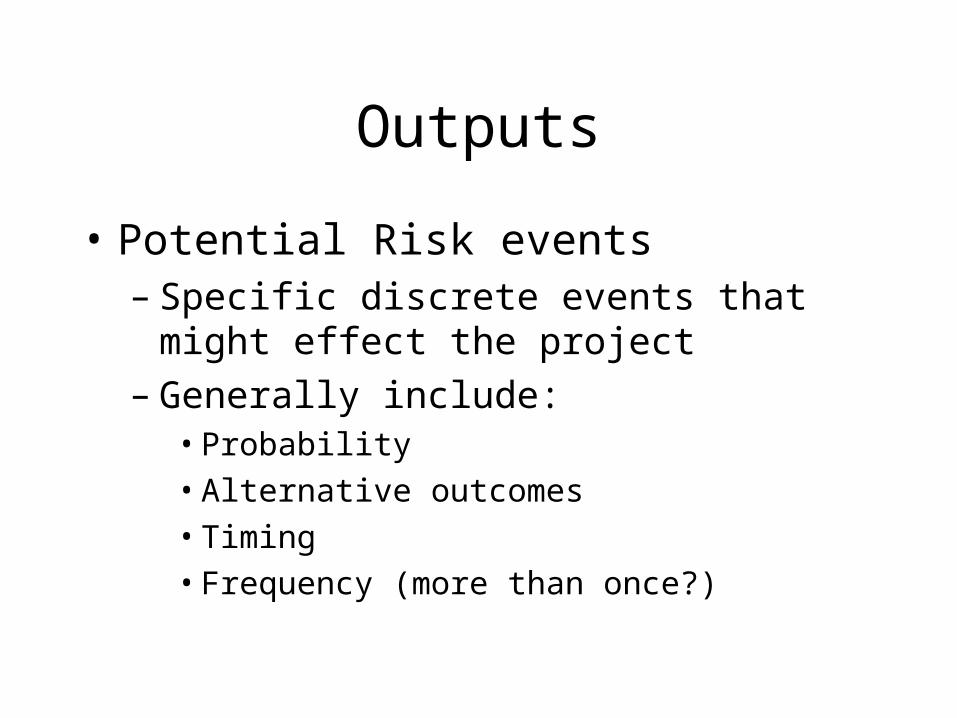
Outputs
• Potential Risk events– Specific discrete events that might effect the
project– Generally include:
• Probability
• Alternative outcomes
• Timing
• Frequency (more than once?)

Outputs
• Risk Symptoms– Triggers, or trip wires, or indicators– Indirect manifestations of risk events
• Poor morale
• Lack of reported progress
• Inputs to other processes– Improved estimating– More training

Risk Quantification
R iskIdentification
11.1
R iskQ uantifica tion
11.2
R isk ResponseD evelopm ent
11.3
R isk ResponseC ontro l
11.4
P ro jec t R iskM anagem ent
11.0
Risk quantification consists of evaluating the risks and risk interactions to assess the range of possible project outcomes.

PHASE 2: RISK QUANTIFICATION
INCREASE THE UNDERSTANDING OF THE PROJECT
IDENTIFY THE ALTERNATIVES AVAILABLE
ENSURE THAT UNCERTAINTIES AND RISKS ARE ADEQUATELY CONSIDERED IN A STRUCTURED AND SYSTEMATIC WAY AND INCORPORATED INTO THE PLANNING AND DEVELOPMENT PROCESS
ESTABLISH THE IMPLICATIONS OF THESE UNCERTAINTIES ON ALL OTHER ASPECTS OF THE PROJECT
GOALS OF QUANTIFICATION (OR ASSESSMENT)

Risk Quantification - Inputs
• Stakeholder risk tolerances
• Sources of risk
• Potential risk events
• Cost estimates
• Activity duration estimates

Risk QuantificationTools and Techniques• Expected monetary value
• Statistical sums
• Simulation
• Decision trees
• Expert judgment

RISK ANALYSIS TECHNIQUESBRAINSTORMING - SPONTANEOUS CONTRIBUTION OF IDEAS FROM TEAM
DELPHI METHOD - METHOD TO DERIVE CONSENSUS USING EXPERT OPINION
MONTE CARLO - ITERATIVE SIMULATION USING RANDOM NUMBERS TO INCORPORATE PROBABILISTIC DATA AND DERIVE A PROBABILITY DISTRIBUTION OF THE FINAL RESULT
SENSITIVITY ANALYSIS - EVALUATE EFFECT OF A CHANGE IN A SINGLE VARIABLE ON THE ENTIRE PROJECT
DECISION TREE ANALYSIS - GRAPHICAL "EITHER / OR" CHOICES
UTILITY THEORY - TAKES ATTITUDE OF DECISION MAKER INTO ACCOUNT
DECISION THEORY - TECHNIQUE TO REACH DECISION UNDER UNCERTAINTYAND RISK. POINTS TO BEST POSSIBLE COURSE NO MATTERTHE FORECAST ACCURACY
PROBABILITY ANALYSIS - NEXT PAGE

SIMPLE PROBABILITYSIMPLE PROBABILITY EQUATION:
Pr (Event #1) x Pr (Event #2) = Pr (Both Events)
0.70 X 0.80 = 0.56 OR 56%
NOTE: THIS APPLIES TO INDEPENDENT EVENTS ONLY
OR
P(t) = P(A) * P(B)

PROBABILITY EXAMPLEDATA:
Probability of Scope = 0.70Probability of No Scope = 0.30
Probability of Approval = 0.80Probability of No Approval = 0.20
EXAMPLE:
Pr(Scope) x Pr(Approval) = 0.70 x 0.80 = 0.56Pr(Scope) x Pr(No Approval) = 0.70 x 0.20 = 0.14Pr(No Scope) x Pr(Approval) = 0.30 x 0.80 = 0.24Pr(No Scope) x Pr(No Approval) = 0.30 x 0.20 = 0.06 Total= 1.00
PRACTICAL APPLICATION -- DECISION TREE ANALYSIS

Expected Monetary Value (EMV)
• Product of two values– Risk event probability– Risk event value
• Valuation of the risk event is key– Must include tangible as well as intangible
value– 1 week slippage with minor client impact– 6 week slippage with major client impact

Expected Monitary Value Example Given the following:
Cost Probability
Optimistic $100,000 0.20
Most likely $130,000 0.60
Pessimistic $180,000 0.20
Expected Value Calculation:
Optimistic $100,000 x 0.20 = 20,000
Most likely $130,000 x 0.60 = 78,000
Pessimistic $180,000 x 0.20 = 36,000
Expected Monitary Value $134,000
(*EMV = Opt imistic + 4(most likely) + Pessimistic)6
* formula if probability is not known

EMV Example
• If no probabilities are given, useEMV=(Opt + 4*ML + Pes)/6
• EMV= ($100 +4*$130+$180)*1000/6
= $133,333

Descriptive Statistics
• Mean
• Mode
• Median
• Variance
• Standard Deviation
• Range

Descriptive Statistics Example
Test scores are 10, 20, 25, 40, 45, 45, 50, 55, 55, 60, 60, 60, 65, 65, 65, 70, 70, 70, 70, 70, 75, 80, 80, 85, 90, 90, 90, 95, 100
Mean: number obtained by dividing the sum of a set of quantities by the number of quantities in the set. (answer is 1855 / 29=64)
Mode: value or item occurring most frequently in a series of observations. (answer is 70 -it occurs 5 times)
Median: middle value in a distribution, above and below which lie an equal number of values (answer is 65)
Variance: average of the squares of the variations from the mean of a frequency distribution. (answer is 486.4)
Standard deviation: square root of the variance. (answer is 22)
Range: measure of the dispersion equal to the difference or interval between the smallest and the largest of the set of quantities. (answer is 90 or 100-10)

Approximations
• Mean = (Opt + 4*ML + Pes)/6
• SD = (Max - Min)/6

Exercise
Opt ML Pess EMV SDev Vari
Proj. A 100,000 125,000 180,000 130,000 13,000 169,000,000
Proj.B 80,000 100,000 125,000 100,833 7,500 5,625,000
Proj.C 75,000 130,000 180,000 129,167 17,500 306,250,000

So What?• Normal Distribution
– Mean is expected value– Mean = Mode = Median– Standard deviation is a measure of dispersion
about the mean• 68.27% of cases occur between Mean + SD and
Mean - SD
• 95.45% of cases occur between Mean+2SD and Mean-2SD
• 99.73% of cases occur between Mean+3sd and Mean-3SD

Mean
+ SD + 2SD + 3SD- SD- 2SD- 3SD
Blue = 68%
Blue + Green = 95%
Blue + Green + Red = 99.7%
Normal Distribution
34.1% 34.1%
13.6% 13.6% 1.1%1.1%

Mode
Mean
Median
Skewed Normal Distribution
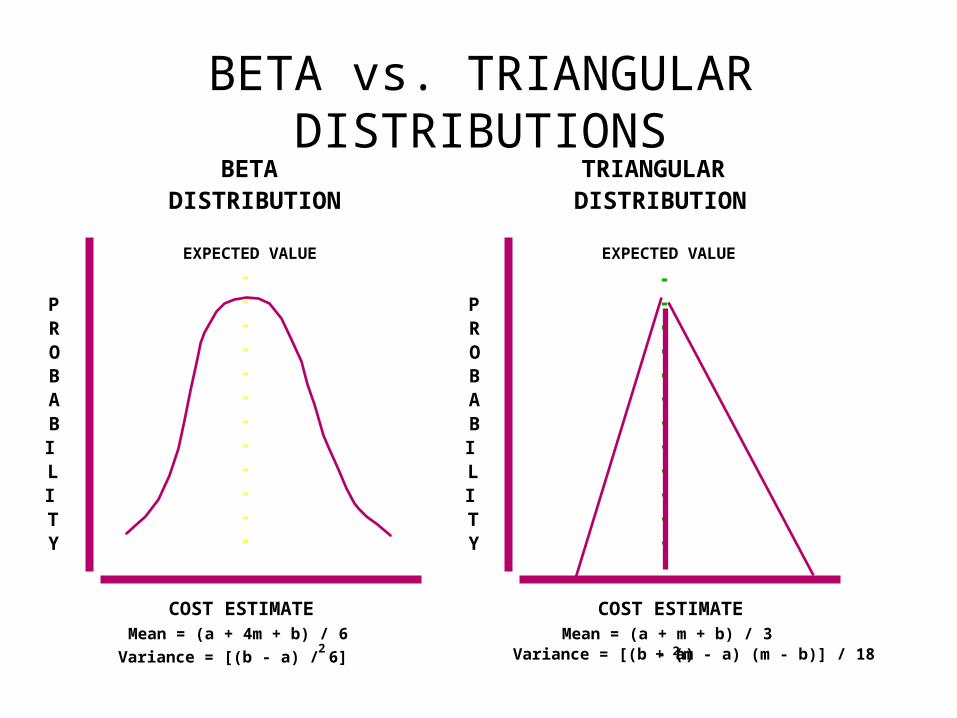
BETA vs. TRIANGULAR DISTRIBUTIONS
EXPECTED VALUE
COST ESTIMATE
PROBABILITY
EXPECTED VALUE
COST ESTIMATE
PROBABILITY
BETA DISTRIBUTION
TRIANGULAR DISTRIBUTION
Variance = [(b - a) / 6]
Mean = (a + 4m + b) / 6 2
Mean = (a + m + b) / 3 Variance = [(b - a) 2 + (m - a) (m - b)] / 18

Simulation
Simulation uses a representation or model of a
system to analyze the behavior or
performance of the system.• Monte Carlo analysis is best known• results used to quantify risk of various schedule
choices

Monte Carlo
• Requires Optimistic, Most Likely, and Pessimistic estimates.
• Uses random number generator to select which value to use
• Calculates the database multiple times to develop a probability distribution of the data
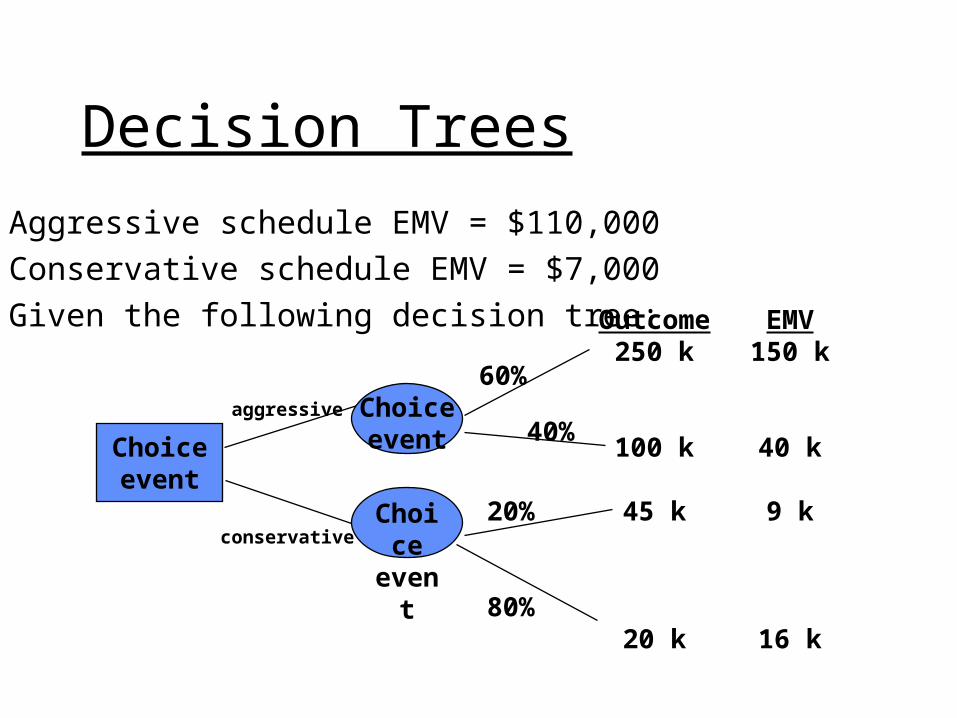
Decision Trees
Aggressive schedule EMV = $110,000
Conservative schedule EMV = $7,000
Given the following decision tree: Outcome250 k
100 k
45 k
20 k
EMV150 k
40 k
9 k
16 k
60%
40%
20%
80%
aggressive
conservative
Choiceevent
Choiceevent
Choiceevent
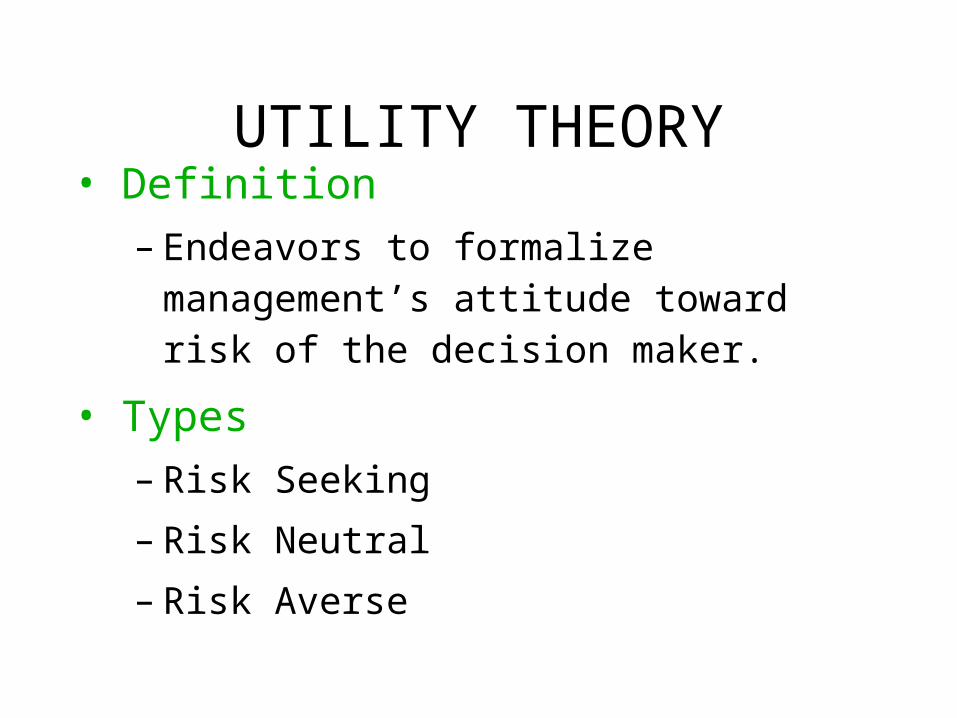
UTILITY THEORY• Definition
– Endeavors to formalize management’s attitude toward risk of the decision maker.
• Types
– Risk Seeking
– Risk Neutral
– Risk Averse
Expert Judgment
Expert judgment can often be applied in lieu of or in addition to the mathematical techniques described above.
Derived from:• team members• others in or outside of organization• published findings• industry averages / statistics

QUALITY RISK
GOALS OF RISK MANAGEMENT
- INCREASE UNDERSTANDING OF PROJECT
- IMPROVE PLANS, DELIVERY, AND ID GREATEST RISKS
- WHERE TO FOCUS ATTENTION
REMAINING MAJOR PROJECT RISK AREA ...
WHAT IF PROJECT FAILS TO PERFORM AS EXPECTED DURING OPERATIONAL LIFE / PRODUCT LIFE CYCLE?
CONFORMANCE TO QUALITY REQUIREMENT REMEMBERED LONG AFTER COST AND SCHEDULE PERFORMANCE.
QUALITY MANAGEMENT HAS MOST IMPACT ON LONG-TERM PERCEIVED & ACTUAL SUCCESS OF PROJECT

SCHEDULE RISK
CAN MANAGE “CRITICAL PATH” BUT NOT MANAGE DURATION
REASON --> SCHEDULE RISK
HIGHEST RISK PATH = PATH WITH MOST PROJECT COMPLETION RISK
RISK IN ALL ACTIVITY DURATION BECAUSE FUTURE IS UNCERTAIN
LONGEST DURATION ACTIVITY RISKIEST
THEREFORE, NEED TO ID & MANAGE WHAT COULD CONTRIBUTE TO PROJECT DELAY -- COULD OVERRIDE MANAGEMENT OF CRITICAL PATH
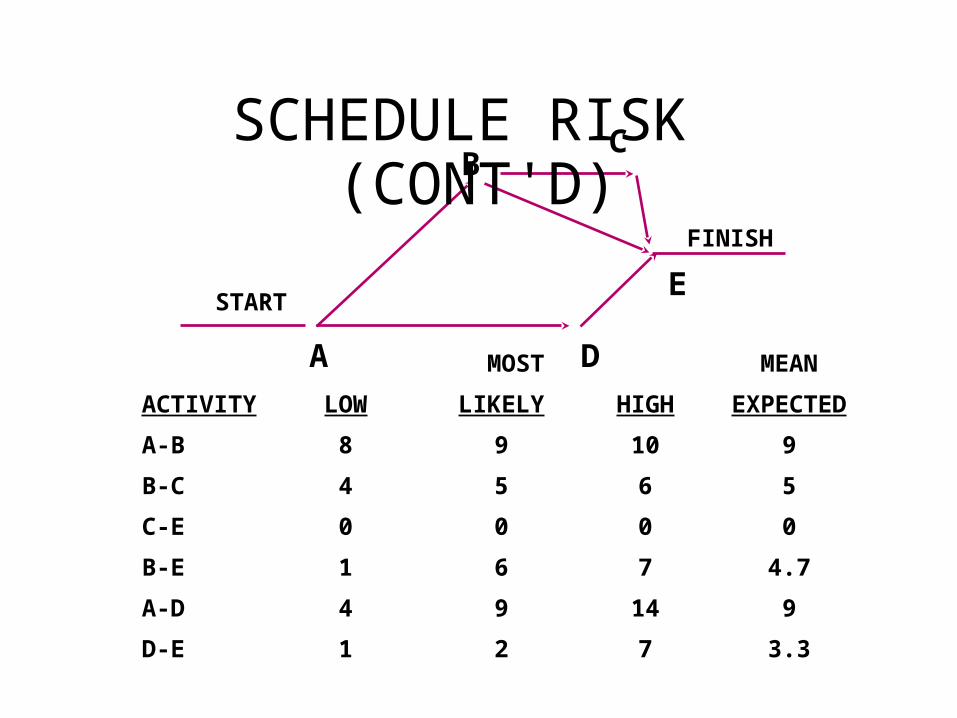
C
START
FINISH
A D
B
E
MOST MEAN
ACTIVITY LOW LIKELY HIGH EXPECTED
A-B 8 9 10 9
B-C 4 5 6 5
C-E 0 0 0 0
B-E 1 6 7 4.7
A-D 4 9 14 9
D-E 1 2 7 3.3
SCHEDULE RISK (CONT'D)

SCHEDULE RISK (CONT'D)
START
FINISH
A D
B
E
SUM OF SUM OF SUM OF
PATH MOST LIKELY MEANS HIGHS
A-B-C-E 14 14 16
A-B-E 15 13.7 17
A-D-E 11 12.3 21
MOST RISKY A-B-E A-B-C-E A-D-E

Risk Quantification- Outputs
Opportunities to pursue, threats to respond to
Opportunities to ignore, threats to accept

Risk Response Development
R iskIdentification
11.1
R iskQ uantifica tion
11.2
R isk ResponseD evelopm ent
11.3
R isk ResponseC ontro l
11.4
P ro jec t R iskM anagem ent
11.0
Risk response development defines the enhancement steps for opportunities and responses to threats.

Risk Response Development
• Defines steps for– enhancing opportunities– responding to threats

Types of Responses
• Avoidance - eliminate
• Mitigation– Reduce EMV by reducing probability– Reduce Impact - buy insurance
• Acceptance– Active: develop plan to deal with risk if it
occurs – Passive: Accept risk (e.g., lower profit)

PLANNING ALTERNATIVES
• Project Managers have Several Response Options– Avoidance– Absorption– Adjustment– Deflection– Contingent Planning– A Combination of the Above
AVOIDANCE
• Defined
– Characterized by project manager statements such as: “This alternative is totally unacceptable to me
– You would take the appropriate steps to avoid this situation.
ABSORPTION
• Risk is Recognized-But Not Acted Upon
• Accept the Risk AS IS
• It’s a Matter of Policy• Retained & Absorbed (by prudential
allowances)
• Unrecognized, Unmanaged, or Ignored (by default)

ADJUSTMENT• Modification of the Project
– Scope
– Budget
– Schedule
– Quality Specification
– Combination of the Above

DEFLECTION
• Involves transfer of risk by such means as:
– Contracting Out to Another Party
– Insurance or Bonding
– By Recognizing it in the Contract

CONTINGENT PLANNING
CONTINGENT PLANNING IS A MEANS TO ADDRESS RISKS TO THE PROJECT THROUGH A FORMAL PROCESS AND PROVIDE RESOURCESTO MEET THE RISK EVENTS.
IT IS THE ESTABLISHMENT OF MANAGEMENT PLANS TO BE INVOKEDIN THE EVENT OF SPECIFIED RISK EVENTS
EXAMPLES:
THE PROVISION AND PRUDENT MANAGEMENT OF A CONTINGENCY ALLOWANCE IN THE BUDGET
THE PREPARATION OF SCHEDULE ALTERNATIVES AND WORK-AROUNDS
EMERGENCY RESPONSES TO DEAL WITH MAJOR SPECIFIC AREAS OF RISK
AN ASSESSMENT OF LIABILITIES IN THE EVENT OF A COMPLETE PROJECT SHUT-DOWN

Types of Responses
• Prevent risk from occurring– Reduce the probability that the event will occur– Eliminate means P=0
• Reduce the impact (think “containment”)– Buy insurance (monetary)– Alternative strategies (additional supplier to
PDQ)
CONTRACT STRATEGY
• To Select the Right Form of Contract Requires:– Identification of Specific Risks– Determination of how they should be shared
between the parties, and – The insertion of clear, legal language in the
contract documents to put it into effect.
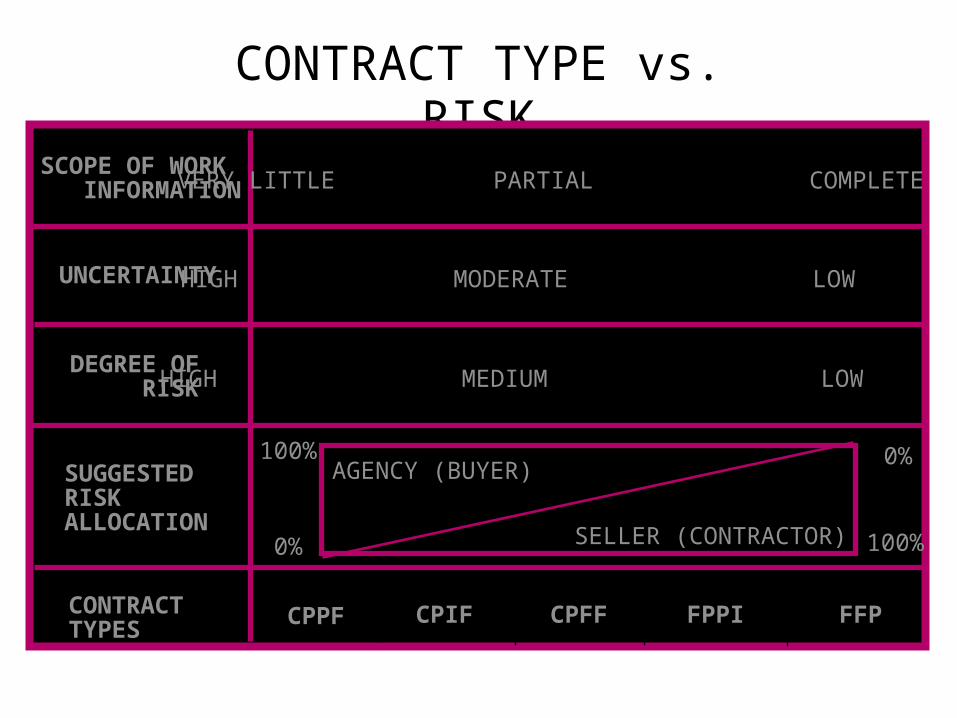
CONTRACT TYPE vs. RISK
SCOPE OF WORK INFORMATION
UNCERTAINTY
DEGREE OF RISK
SUGGESTED RISKALLOCATION
CONTRACTTYPES
CPPF CPIF CPFF FPPI FFP
VERY LITTLE PARTIAL COMPLETE
HIGH MODERATE LOW
HIGH MEDIUM LOW
100%
0%
0%
100%
AGENCY (BUYER)
SELLER (CONTRACTOR)
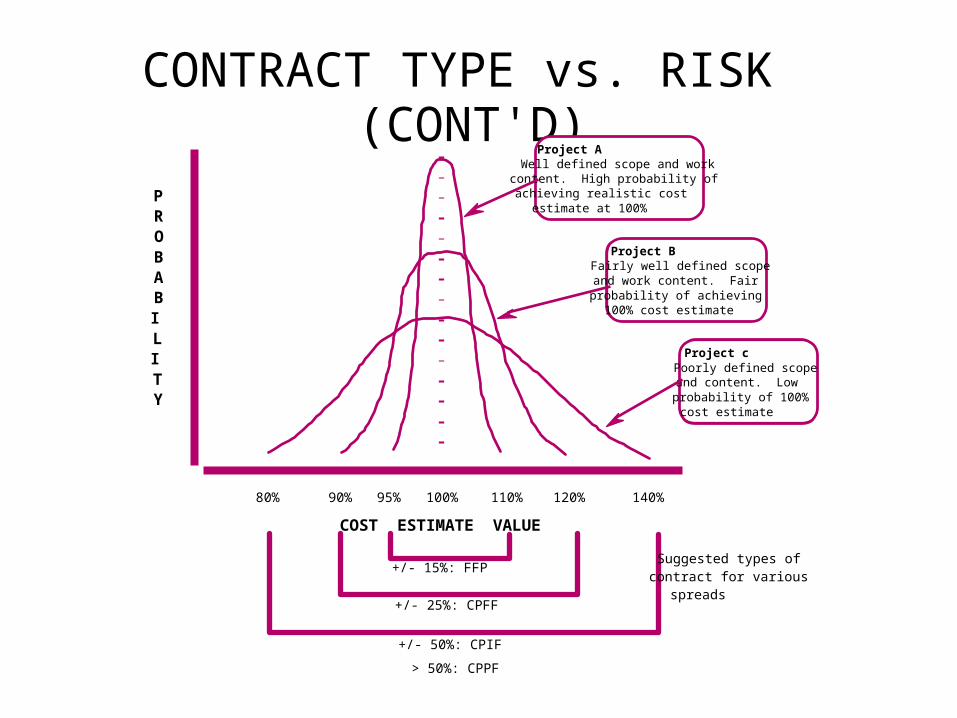
CONTRACT TYPE vs. RISK (CONT'D)
COST ESTIMATE VALUE
PROBABILITY
80% 90% 95% 100% 110% 120% 140%
+/- 15%: FFP
+/- 50%: CPIF
+/- 25%: CPFF
> 50%: CPPF
Project A Well defined scope and work content. High probability of achieving realistic cost estimate at 100%
Project c Poorly defined scope and content. Low probability of 100% cost estimate
Project B Fairly well defined scope and work content. Fair probability of achieving 100% cost estimate
Suggested types of contract for various spreads

FAST-TRACKING
• Awarding contracts before all the information is complete to reduce the overall time for the project
• Much higher risk category!!
• Appropriate contingency allowances must be increased accordingly.

Risk Response Development - Inputs
Opportunities to pursue, threats to respond to
Opportunities to ignore, threats to accept

Risk Response DevelopmentTools and Techniques• Procurement
– Buy outside skills
• Contingency planning– what to do if the event occurs
– containment
• Alternative strategies– Prevention
• Insurance

Risk Response Development - Outputs• Risk management plan
• Inputs to other processes
• Contingency plans
• Reserves
• Contractual agreements

Risk Response Control
R iskIdentification
11.1
R iskQ uantifica tion
11.2
R isk ResponseD evelopm ent
11.3
R isk ResponseC ontro l
11.4
P ro jec t R iskM anagem ent
11.0
Risk response control involves responding to changes in risk over the life of the project.
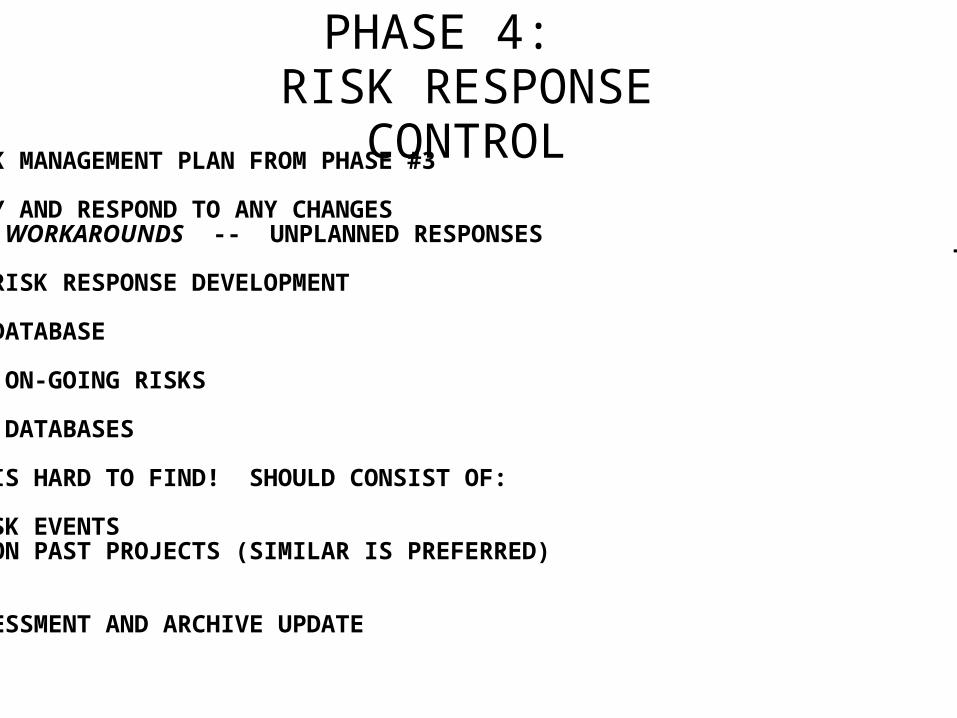
PHASE 4: RISK RESPONSE
CONTROL• EXECUTE THE RISK MANAGEMENT PLAN FROM PHASE #3
-ID, QUANTIFY AND RESPOND TO ANY CHANGES EXECUTE WORKAROUNDS -- UNPLANNED RESPONSES TO NEGATIVE EVENTS -ADDITIONAL RISK RESPONSE DEVELOPMENT
•CURRENT PROJECT DATABASE
-DOCUMENTING ON-GOING RISKS
•BUILD HISTORICAL DATABASES
RELIABLE DATA IS HARD TO FIND! SHOULD CONSIST OF:
-RECORDED RISK EVENTS -EXPERIENCE ON PAST PROJECTS (SIMILAR IS PREFERRED)
•POST-PROJECT ASSESSMENT AND ARCHIVE UPDATE

Risk Response Control
• Respond to the changes in project risk over the life of the project

Risk Response Control - Inputs
• Risk management plan
• Actual risk events
• Additional risk identification

Risk Response ControlTools and Techniques
• Workarounds– Unplanned responses to unforeseen risks that
actually occur
• Additional risk response development– Revisions to the response, if it proves
inadequate

Risk Response Control - Outputs
• Corrective action– Implementing the risk management plan when
the risk occurs
• Updates to risk management plan– Revisions to the risk management plan as
circumstances require• Risk never materializes
• Probability of occurrence is reduced

Risk DocumentationHistorical database
Current project database
Post project assessment and archive update• Lessons learned• Plan variances• Actuals• Methods, tools and techniques• Case studies

SUMMARY
PROJECTS ARE LAUNCHED TO TAKE ADVANTAGE OF OPPORTUNITIES,BUT OPPORTUNITIES ARE ASSOCIATED WITH UNCERTAINTIES WHICHHAVE RISKS ATTACHED
RISK CAN NEVER BE 100% ELIMINATED
FOR THE PROJECT TO BE VIABLE, THE EXPECTED VALUE RESULTINGFROM A FAVORABLE PROBABILITY OF GAIN MUST BE HIGHER THANTHE CONSEQUENCES AND PROBABILITY OF LOSS
THEREFORE, THE RISKS ASSOCIATED WITH A PROJECT MUST RECEIVECAREFUL EXAMINATION IN THE CONTEXT OF THE ORGANIZATION'SWILLINGNESS OR AVERSION TO TAKING RISKS
THIS IS THE DOMAIN OF PROJECT RISK MANAGEMENT, WHICH FORMSA VITAL AND INTEGRAL PART OF PROJECT MANAGEMENT

When Should Risk Assessments be Carried Out?
Risk assessments should be carried out
as early as possible and then continuously.

Don’t take the risk if...
• the organization cannot afford to lose.• the exposure to the outcome is too great.• the situation (or project) is not worth it.• the odds are not in the project’s favor.• the benefits are not clearly identified.• there appear to be a large number of acceptable
alternatives.

Don’t take the risk if...
• the risk does not achieve the project objective.• the expected value from baseline assumptions is
negative.• the data is unorganized, without structure or
pattern.• there is not enough data to understand the results.• a contingency plan for recovery is not in place
should the results prove unsatisfactory.