PROJECT REPORT (17MBAPR407) ON “A STUDY ON …
75
PROJECT REPORT (17MBAPR407) ON “A STUDY ON CONSTRUCTION OF OPTIMAL PORTFOLIO USING SINGLE INDEX MODEL AT ANANDRATHI SHARES AND STOCK BROKERS LIMITED, BANGALORE” BY V.H.RAMASUBRAMANIAN 1IA17MBA59 Submittedto VISVESVARAYA TECHNOLOGICAL UNIVERSITY, BELAGAVI In partial fulfillment of the requirements for the award of the degree of MASTER OF BUSINESS ADMINISTRATION Under the guidance of INTERNAL GUIDE EXTERNAL GUIDE Mallika B K Madhu R Assistant Professor Assistant Vice President Dept. of MBA, AIT AnandRathi Shares and Stock Brokers LTD Department of MBA Acharya Institute of Technology AcharyaDr.SarvepalliRadhakrishnan Road Acharya PO, Soladevanahalli, Bangalore-560 107 March 2019
Transcript of PROJECT REPORT (17MBAPR407) ON “A STUDY ON …

PROJECT REPORT (17MBAPR407) ON
“A STUDY ON CONSTRUCTION OF OPTIMAL PORTFOLIO
USING SINGLE INDEX MODEL AT ANANDRATHI SHARES
AND STOCK BROKERS LIMITED, BANGALORE”
BY
V.H.RAMASUBRAMANIAN
1IA17MBA59
Submittedto
VISVESVARAYA TECHNOLOGICAL UNIVERSITY,
BELAGAVI
In partial fulfillment of the requirements for the award of the degree of
MASTER OF BUSINESS ADMINISTRATION
Under the guidance of
INTERNAL GUIDE EXTERNAL GUIDE
Mallika B K Madhu R
Assistant Professor Assistant Vice President
Dept. of MBA, AIT AnandRathi Shares and
Stock Brokers LTD
Department of MBA
Acharya Institute of Technology
AcharyaDr.SarvepalliRadhakrishnan Road
Acharya PO, Soladevanahalli, Bangalore-560 107
March 2019

ANANDRATHI
Date : 18 Feb 2019
Ramasubramanian V H
Bangalore
TO WHOMSOEVER IT MAY CONCERN
This is to certify that Mr. Ramasubramanian V H bearing USN 11Al7MBA59 has successfully completed his Internship in the project titled 'A Study on Construction of Optimal Portfolio using Single Index Model' with AnandRathi Group for the period dated 3rd January 20 I 9 to 16th February 2019.
We ,.vish him all the best in hi s future endeavors.
For Anand Rathi Share and Stock Brokers Limited.
Authorized Signatory
Anand Rathi Share & Stock Brokers Ltd. CIN No.: U67120MH1991PLCOS4106
2nd Floor, Bikaner Pinnacle, No. 1 Rhenius Street, Off Richmond Road, Bangalore • 560 025. India Tel. : +91-80-4624 5200 (Regional Office)
4th Floor, Silver Metropolis, Jiai Coach Compound, Opp, Bimbisar Nagar, Goregaon (E), Mumbai 400 0€3 Tel. : +91 22 6698 3700 / 4001 3700 • Fax : +91 22 6698 3770 (Registered Office)
www.rathl.com

ACHARYA INSTITUTE OF TECHNOLOGY
(Affiliated to Visvesva raya Tee hnologica I University, Belagavi, Approved by AICTE, New Delhi and Ace redited by NBA and NAAC)
Date: 22/03/2019
CERTIFICATE
This is to certify that Mr. V H Ramasubramanian bearing USN
lIAl 7MBA59 is a bonafi<le student of Master of Business Administration
course of the Institut~ 201 7-19 batch, affiliated to Visvesvaraya
Technological University, Belagavi. Internship report on "A Study on
Construction of Optimal Portfolio using Single Index Model, at
AnandRathi Shares & Stock Brokers Ltd." Bangalore is prepared hy him
under the guidance of Prof. Mallika B K, in partial fulfillment of the
requirements for the award of the degree of Master of Business
Administration, Visvesvaraya Technological University, Belagavi, Karnataka.
Signature of Principal/Dean Academics
Dr. Devarajaiah R.M. Dean-Academics
t\"' 1ARYA INSTITUTE OF TECHNOL{)(W Benga!uru-107 _
Acharya Dr. Sarvepalli Radhakrishnan Road, Soladevanahall i, Acharya PO., Bengaluru 560 107, Karnataka, India • www.acharya.ac. in/ait • Ph: +91-80-225 555 5:i Extn. : 2102 • Fax: +91-80-237 002 42 • E-mail: [email protected]

DECLARATION
I V.H.Ramasubramanian, hereby declare that the Proj ect report entitled .. A Study on
constrnction of optimal portfolio using single index model"' with reference to .. An andRathi
shares and stock brokers Ltd, Bengaluru·· prepared by me under the guidance of Prof. l\lallika
B K, faculty of M.B.A Department, A.IT and external assistance by :\lr .. Madhu.R Assistant
Vice President, AnandRathi shares and stock brokers Ltd. I also declare that thi s Project
work is towards the partial fulfilment of the uni versity Regulations for the award of degree of
Master o f Business Administration by Visvesvaraya Technological University, Belagavi. I have
undergone a summer proj ect for a period of Six weeks. I further declare that this Project is based
on the original study undertaken by me and has not been submitted for the award o f any
degree/diploma from any other University / Institu tion.
Place: Bengalur-u Date: C>l(o4j~otq
~ Signature of the student

ACKNOWLEDGEMENTS
I deem it a privilege to thank our Principal Dr. Prakash M R, Dr. Devarajaiah R M, Dean
Academics and thanks to Dr. M.M Bagali, HOD, Department of MBA, for having giving me the
opportunity to do the project, which has been a very valuable learning experience.
I am truly grateful to my Internal guide Mrs. Mallika B K and my External guide Mr. Madhu
R, Assistant Vice President, AnandRathi shares and stock brokers Ltd for their research
guidance, encouragement and opportunities provided.
My sincere and heartfelt thanks to all my teachers at the department of MBA, Acharya Institute
of Technology for their valuable support and guidance.
Last, but not least, I want to express my deep appreciation to my parents for their unstinted
support.
Place: Bengaluru V.H.Ramasubramanian
Date: USN: 1IA17MBA59

TABLE OF CONTENTS
CHAPTER NO. CHAPTERS PAGE NO.
EXECUTIVE SUMMARY 1
1 INTRODUCTION 2
1.1 Introduction 3
1.2 Industry Profile 3-10
1.3 Company Profile 11
1.4 Promoters 11
1.5 Vision, Mission and Quality Policy 12
1.6 Products and Service Profile 12-13
1.7 Area of Operation 13
1.8 Competitors Information 14
1.9 SWOT Analysis 14-15
1.10 Future growth and Prospects 15
1.11 Financial Statement 16-23
2 CONCEPTUAL BACKGROUND AND LITERATURE
REVIEW
24
2.1 Theoretical Background of the Study 25-29
2.2 Literature Review 30-34
3 RESEARCH DESIGN 35
3.1 Statement of Problem 36
3.2 Need for the Study 36
3.3 Objective of the Study 36
3.4 Scope of the Study 37
3.5 Research Methodology 37-39
3.6 Limitations of the Study 40

4 ANALYSIS AND INTERPRETATION 41
Analysis and Interpretation of Data 42-55
5 FINDINGS, SUGGESTIONS AND CONCLUSION 56
5.1 Findings 57
5.2 Suggestions/ Recommendation 58
5.3 Conclusion 59
BIBLIOGRAPHY
ANNEXURE

LIST OF TABLES
TABLE
NO.
TITLES PAGE
NO.
1.11.1 Table showing Current Ratio 20
1.11.2 Table showing Proprietary Funds Ratio 21
1.11.3 Table showing Asset Turnover Ratio 22
1.11.4 Table showing Net Profit Ratio 23
4.1 Table showing descriptive statistics of top 50 Nifty stocks 42-44
4.2 Table showing determination of excess return and ranking of the stocks 45-47
4.3 Table showing determination of Cut-Off point 48-51
4.4 Table showing identification of stocks which constitutes Optimum
Portfolio
52
4.5 Table showing determination of Absolute Proportion on Investment 53
4.6 Determination of Relative Proportion on Investment 54

LIST OF GRAPHS
GRAPH NO. TITLES PAGE NO.
1.11.1 Graph showing Current Ratio 20
1.11.2 Graph showing Proprietary Funds Ratio 21
1.11.3 Graph showing Asset Turnover Ratio 22
1.11.4 Graph showing Net Profit Ratio 23
4.5.1 Graph showing Absolute Proportion 53
4.6.1 Graph showing Relative Proportion of Investment 55

1
EXECUTIVE SUMMARY
This study was made with the intension of constructing an efficient optimal equity portfolio
using the effective and very more popular utility of Sharpe’s Single Index Model. In order
to get more knowledge about the Indian securities market the Internship was done in one of
the stock broking agency called ANANDRATHI SHARES AND STOCK BROKERS
LIMITED. As an Investor and the fund managers know Indian Securities market is high
volatile, risky and highly sensitive. The portfolio construction with the help of Single Index
model became necessity to minimize the risk and to maximize the return on investment.
This study is targeted to create awareness in the minds of investors. Here the study is for 50
companies listed in NSE where risk and return is determined and based on the cut off point
the selected 10 companies portfolio construction is determined. The selection of securities is
made based on the return and excess return to beta ratio. Excess return to beta ratio is
identified by comparing the excess return in to the particular stock’s beta. Standard deviation
is the process where it is used to measure the variability of the securities and the relationship
of the mean variable of the securities for the selected stock.
Cut-off rate helps the author to select securities in a scientific way. Here all the securities
selected whose excess return to beta ratio is more than the cut-off rate. Cut-off rate helped to
identify the securities and the investment proportion to be made on those securities.
Findings and suggestions will give more clarity of this study and it will help the fund
managers and the professional investors to make wise decision on their investment. Hope this
study and constructed portfolio will help the investors, fund managers and other institutional
investors to make appropriate investment.

2
CHAPTER-1
INTRODUCTION

3
1.1 INTRODUCTION
The project with the title to study the portfolio construction at AnandRathi shares and
stock brokers Ltd enables an investor to have an investment diversification based upon
the risk and return. This study is based on the return on annual basis taken for 52 weeks
and computed average to determine the return and risk. To conduct the study the data is
collected from the NSE and Yahoo Finance website taking 50 listed companies for 5
years.
The study gives majorly an clear idea of the investment avenues wherein stock market
is taken as one of the major avenue to determine their diversification of funds. So the
investors therefore can utilize this methodology of sharpe index model to construct
their optimum portfolio. Any beginner investors can definitely use this optimum
portfolio construction before making the investment.
1.2 INDUSTRY PROFILE
Financial Services
The Indian financial services have undergone a complete magical since 19th century.
Before the financial services emerged Commercial banks and other financial
organization henpecked the area. They found financial requirement of the industries in
India. Only after economic liberalization financial services sector has acquired some
prominence. Now this financial services sector has grown into an emerging industry, in
fact the present world’s largest industry.
Financial services may be explained as the services and projects rendered by Institutions
that is banks of different kind for the aspiration of financial transactions, other finance
associated activities in Finance world such Insurance, Loans, Credit cards, Money
management furthermore investment opportunities to provide the knowledge on this
stock market and upcoming trends in the market.
The financial service industry is explained as “The accumulation of organizations where
its main focus is to facilitate and intermediate financial transactions of Individual,
Banks and other institutional investors to result from allocation of their activities
through time.”
4
Financial services consists of various types, they are:
1. Wholesale financial services.
2. Retail financial services.
Wholesale financial services: Services are availed by financial industry and
businessmen, which are utilized for transition into ultimate final retail products through
directly or indirectly.
Retail financial services: Services are offered to the individuals, directly thrown to
consumption needs.
It is categorised into following:
• Traditional Activities.
• Modern Activities.
Traditional Activities: The financial institutions and intermediaries have been offering
variety of financial services consisting of both money market and capital market
activities. Traditional activities are further grouped as fund based and non fund based
activities.
ASSET/ FUND BASED FINANCIAL SERVICES
➢ Hire Purchasing
➢ Forfeiting
➢ Mutual Fund
➢ Exchange Traded Funds
➢ Consumer finance
➢ Housing Finance
FEE BASED FINANCIAL SERVICES
➢ Merchant Banking
➢ Letter of Credit
➢ Credit Rating
➢ Securitization of debts
➢ Stock Broking

5
Modern Activities: Modern activities consist of subsequent services
1. Offering project and forecast advisory services straight from the formulation of
financial project report till the budgeting of funds for beginning the project with
the essential government approvals.
2. Rendering planning service for Merger and Acquisition and assistance for their
smooth carrying of business.
3. Acting as trustee and advisors to the debenture holders.
4. Projecting and constructing financial collaborations with the joint ventures
through selecting acceptable joint venture patner firms, composing joint venture
agreements.
In this services stock broking financial services is captured to the detailed study of
my research.
FINANCIAL MARKET: It is described as any market where the sellers and buyers of
financial securities participate in trade of equities, bonds, currencies with that of
derivatives. This market is transparent in evaluating, basic regulation on selling and
buying, fees, cost and also market forces determine the securities price that trade in
market. The market means the aggregation of available sellers and buyers of various
certain goods, services and also the transaction of actives between them. They deal with
Stocks, Bonds and Commodities which include agricultural products and precious
metals.
Types in Financial market
• Money Market
• Capital Market
MONEY MARKET: It is a financial market. Its main role is to deal with financial
securities whose maturity period is up to 1 year, it is a market for short term funds. This
money market instrument is replacement of money, because it does not manage with
money. It just offers credit instrument facilities like Commercial Papers, Treasury Bills,
Promissory Notes, Certificate of Deposits and Bills of Exchange. These instrument are

6
beneficiary to the government, to the various units and organizations to borrow funds
accessible in this market to accomplish their short term needs and requirement. The
financial urge in money market instrument is generally low default risk, high
marketability and maturity with 1 year.
Money Market Instruments:
• Commercial Papers
• Certificate of Deposits
• Promissory Notes
• Bills of Exchange
• Treasury Bills
Commercial Papers: It is popular in corporate industry to finance their working capital
requirements, it is unsecured promissory note in nature issued by blue chip companies.
This is issued in time range that lies between 15days - 1year.
Certificate of Deposits: It is generally furnished by some Commercial banks or other
related Financial Institutions, which is very easily transferable in nature from one
person to the other. Its maturity ranges between 91days – 1year. It can be provided to
any Co-operatives, Individuals and Organizations.
Promissory Notes: It is signed document which contains a written promise for paying
certain amount of money to specified person or the bearer of that document at
mentioned date or on demand.
Bills of Exchange: It is a kind of instrument in written format containing an
unconditional order, specifying a definite person for paying money or to the order of
mentioned person for paying money or to the order of mentioned person, or to the
holder of bills of exchange. It is only valid if it is underwrite by the maker of the
particular instrument.

7
Treasury Bills: It is a sort of financial bills, that are similar character of promissory
notes, it is basically issued and offered by the government for fixed period of time under
some discount but not abundant of 1 year, favouring to pay stated amount to the bearer
of treasury bill instrument.
CAPITAL MARKET: It mentions the kind of financial market, where we can
generate funds from various market instruments for company’s growth and sometime
for national growth. These are generally used by professional investors to gain more
profit out of their market condition. Its main character is to deal with both medium and
long term funds. It is an arrangement to marketing and buying, selling securities in
market. It can be known as Securities market.
This security market is mainly categorized into 2 major segments called Primary and
Secondary market.
1. Primary Market: It is a place where the investors buy securities that are directly
issued by the company. New securities are furnished in this kind of market.
2. Secondary Market: In this market Bonds, Stocks, Options and Futures which are
previously issued can be bought and sold. After the initial issuance, investors have
the right to purchase from the other investors.
STOCK MARKET OVERVIEW:
They play a very important role in economy. It enables to trade in shares which are of
public company. If a firm wants to raise its business they can raise funds through stock
market. They help in funding new projects or for business which have expansion plans.
The stocks and securities of various companies are traded by the registered members so
it is called as Standardized association. There are 23 recognized Stock Exchanges in
India.
Bombay Stock Exchange: It is the oldest in the world, which is famous for the large
number of companies that are listed, recently they have also come up with screen based
trading system with prologue of the Bombay online trading system.
8
Alternate name for BSE was “The Native Share & Stock Brokers Association”. They
were the first to get the permanent recognition from government through Securities
Contracts Regulation Act 1956. In addition with dematerialization, Detutsche Borse
Singapore Exchange were the best World’s Exchange.
Today, BSE is ranked number 1 Stock Exchange with respect to companies which are
listed and 5th according to the World. An investor has option to choose from more than
4700 listed companies.
It is the first stock exchange to enjoy iconic status and is worldwide. It consists of 30
stocks which constitute 12 major sectors. “SPICE” was the first Exchange Trade Fund
which assist investors a trading tool for the trading purpose of investment, trading,
arbitrage and hedging which is very easy to handle.
BSE was 1st to receive Information Security Management System. Standard BS7799-
2002 certification, Online Trading System (BOLT). It was designed for safeguard
market integrity through enhancing transparency in their working.
Vision
“Emerge as a best prime stock exchange through providing excellence in class global
practice in various technologies, innovations, projects and finally customer services.”
National Stock Exchange: Established in November 1992, with the capital of 25crores.
They took the helping hand of the International Securities Consultancy of Hong Kong.
Financial institutions, Insurances Companies Limited and Stock Holding Corporation
were the promotions for NSE. They focus on providing nationwide securities trading
facilities to investors to add on they strengthen the move towards professionalization
towards capital market.
Different players are as follows:
• Trading members
• Participants
They provide a automated which is fully screen based trading mechanism that consists
principle of order driven market. Investors have option to stay at their office and
execute the trading by linking with communication network. Then all the share prices

9
are displayed at which the buyers and sellers are willing to transact. When such prices
are matched the transaction will be complete and the final step is to get the confirmation
slip.
Vision: Sustaining as market leader, establishing and maintaining the global present and
facilitating the people to financially well-being.
Securities and Exchange Board of India: It was setup for protecting interest of
investors by government of India 1988. SEBI act, 1992 and Securities Contract
Regulation Act, 1956 empowered SEBI. Protecting rights the investors and regulating
capital market are primary functions of SEBI. Its headquarters is situated at Mumbai.
The companies of NIFTY50 are shown below
SL
No
Company Name
1 Bharti Infratel Ltd
2 Tata Motors Ltd
3 Bharat Petroleum Corporation Ltd
4 Axis Bank Ltd
5 Indian Oil Corporation
6 State Bank of India
7 Bharti Airtel Ltd
8 Oil & Natural Gas Corporation Ltd
9 Mahindra and Mahindra Ltd
10 Hindustan Petroleum Corporation Ltd
11 Housing Development Finance Corporation Ltd
12 Asian Paints Ltd
13 Indiabulls Housing Finance Ltd
14 Grasim Industries Ltd
15 NTPC Ltd
16 Maruti Suzuki India Ltd
17 Dr. Reddy’s Laboratories Ltd
18 Bajaj Auto Ltd
19 Power Grid Corporation of India Ltd

10
20 Eicher Motors Ltd
21 Tata Steel Ltd
22 Adani Ports and Special Economic Zone Ltd
23 ITC Ltd
24 Yes Bank Ltd
25 UPL Ltd
26 Kotak Mahindra Bank Ltd
27 HDFC Bank Ltd
28 JSW Steel
29 Bajaj Finance Ltd
30 Vedanta Ltd
31 Hero MotoCrop Ltd
32 Sun Pharmaceutical Industries Ltd
33 ICICI Bank Ltd
34 Coal India Ltd
35 Bajaj Finserv Ltd
36 Hindalco Industries Ltd
37 Zee Entertainment Enterprises Ltd
38 Reliance Industries Ltd
39 Indusind Bank Ltd
40 GAIL (India) Ltd
41 Cipla Ltd
42 Ultratech Cement Ltd
43 Titan Company Ltd
44 Larsen & Toubro Ltd
45 Wipro Ltd
46 Hindustan Unilever Ltd
47 HCL Technologies Ltd
48 Infosys Ltd
49 Tata Consultancy Services Ltd
50 Tech Mahindra Ltd

11
1.3 COMPANY PROFILE
Introduction
AnandRathi is a main full administration speculation bank established in 1994 offering
a wide scope of money related administrations and riches the executives answers for
organizations, partnerships, high– total assets people and families. The firm has quickly
extended its impression to more than 350 areas crosswise over India with worldwide
nearness in Hong Kong,Dubai and London. Established by Mr. Anand Rathi and Mr.
Pradeep Gupta, the gathering today utilizes more than 2,500 experts all through India
and its global workplaces.
The company's theory is altogether customer driven, with a reasonable spotlight on
giving long haul esteem expansion to customers, while keeping up the most astounding
models of magnificence, morals and polished methodology. The whole firm exercises
are partitioned crosswise over unmistakable customer gatherings: Individuals, Private
Clients, Corporates and Institutions. AnandRathi has been named The Best Domestic
Private Bank in India by Asiamoney in their Fifth Annual Private Banking Poll 2009.
The firm has risen a champ over every key fragment in Asiamoney's biggest review of
high total assets people in India.
1.4 PROMOTERS
1 Anand Rathi Founder & Chairman
2. Pradeep Gupta Co founder & Vice Chairman
3. Amith Rathi Managing Director
4. Charan Das Arba Director
5. Priti Pradeep Gupta Director

12
1.5 VISION, MISSION AND QUALITY POLICY
Vision:
“To be a shining example as a LEADER IN INNOVATION and the first choice for
Clients and Employees”
Mission:
“To be India’s multinational firm providing complete financial services with solutions
across the globe”
Quality Policy:
The firm’s quality approach is totally client driven, with a reasonable spotlight on
giving long term value addition to customers, while keeping up the most excellence
services, morals and professionalism. The main aim of the firm is to provide efficient
services to their customers with appropriate financial advices and with adequate
solutions to their problems.
1.6 PRODUCT AND SERVICE PROFILE
Product Offerings:
Equities
Derivatives
Commodities
Currencies
Documents against payments
Portfolio management services
Insurance
Mutual funds
Fixed deposits
Loan against shares
13
Services Offerings:
Private wealth management services
Institutional services
Investment banking services
Currency consultancy
Corporate insurance advisory
Investment services
✓ Preferred client services
✓ Privilege client services
1.7 AREA OF OPERATIONS
• Nagpur
• Delhi
• Ahmadabad
• Hyderabad
• Kolkata
• Mumbai
• Jaipur
• Bangalore
• Pune
• Chennai
• Dehradun
• Bangkok
• Hong Kong

14
1.8 COMPETITORS
• Zerodha
• ICICI Direct
• Share Khan
• Kotak Securities
• Mothilal Oswal
• India Bulls Securities
• Karvy
• Alchemy Capital Management
• Angel Broking
1.9 SWOT ANALYSIS
Strength:
▪ India’s leading broking house.
▪ Strict risk control systems.
▪ Company with well diversified portfolio.
▪ Multiple products under single roof.
▪ Huge customer base.
▪ Strong customer relationship.
▪ Dedicated employees with good research team.
▪ Strong online platform.
Weakness:
▪ Lack of digital marketing.
▪ Does not have effective direct marketing strategies.
▪ Not having unique product.
▪ Lack of advertisement.
▪ Rural areas has less penetration.

15
Opportunities:
▪ Financial sector boom.
▪ Opening new branches at different locations.
▪ Increase in income and spending power.
▪ Growing customer awareness about stock market.
Threats:
▪ Huge competition from other brokers.
▪ Customer’s needs, preference and taste changes.
▪ Market uncertainty.
▪ Government rules and regulation.
▪ Stiff competition from existing players in the market.
▪ Broad economic factors like inflation.
▪ Price war pursuant to competitors.
1.10 FUTURE GROWTH PROSPECTS
➢ AnandRathi deplayed Elina Network ENPAQ Unified Gateway at their branch
locations.
➢ AnandRathi got a network infrastructure solution that integrated their trading
application, connectivity, network security and manageability in one platform.
➢ 100% branch trading uptime.
➢ AnandRathi uses ASDL or cable broadband from any ISP to create a VPN to their
HQ Elina Network’s auto failover works between any combinations of network
connections or leased line fails, trading traffic moves to the VPN over broadband.
➢ Simultaneously an SMS or EMAIL alret is triggered to the AnandRathi Network
administor, letting them quickly escalate the issue to the ISP.
➢ Creating a DEMAT account to buy and sell with the help of exchange stock
without fraud damage to certificate.
➢ Strong financial advisory role through fundamental and technical analysis.

16
1.11 FINANCIAL STATEMENT ANALYSIS
Profit & Loss Statement for the year ended 31st
March 2018 & 2017
(Amount in Crores)
Particulars
Amount as on
31.03.2018
Amount as on
31.03.2017
INCOME
Operating Income
Brokerages and Commission 27.63 13.21
Total Revenue 27.63 13.21
EXPENSES
Employee Cost 11.62 7.24
Salaries, Wages and Bonus 10.69 6.52
Workmen and Staff Welfare Expenses 0.29 0.25
Other Employee Cost 0.06 0.03
Operating and Establishment Expenses 2.13 1.40
Commission, Brokerage and Discounts 0.07 0.00
Rent, Rates and Taxes 1.75 1.21
Repairs and Maintenance 0.13 0.06
Insurance 0.09 0.04
Electricity and Power 0.16 0.02
Administration and Other Expenses 3.50 1.70
Printing and Stationery 0.45 0.33
Professional and Legal Fees 0.69 0.15
Advertisement and Sales Promotion 0.55 0.23
Other General Expenses 1.80 1.00
Provision and Contingencies 1.12 3.03

17
Particulars
Amount as on
31.03.2018
Amount as on
31.03.2017
Total Expenditure 18.37 13.37
Operating Profit 9.26 -0.16
Other Income
Other Interest Income 0.13 0.07
Interest from Investment 0.22 0.11
Others 0.00 3.05
Operating Profit
Other Interest 0.00 0.01
Depreciation 0.34 0.11
Profit before Taxation and Exceptional Items 9.27 2.94
Exceptional Income / Expenses
Profit Before Tax 9.27 2.94
Profit After Tax 5.99 1.98
Appropriations
Other Appropriations 12.31 6.33
Earnings Per Share
Adjusted Earnings Per Share 21.00 34.00

18
Balance Sheet for the year ended 31st March 2018 and 2017 (Amount in Crores)
A.EQUITY AND LIABILITIES
1.Share Holders Funds
a)Share Capital
b)Reserves and Surplus
2.Non Current Liabilities
a)Deferred Tax Assets
3.Current Liabilities
a) Other Current Liabilities
b)Short Term Provisions
TOTAL LIABILITIES
B.ASSETS
1. Non Current Assets
a)Non Current Assets
b)Long Term Loans and Advances
2.Current Assets
a)Sundry Debtors
b)Cash and Bank
c)Other Current Assets
d)Short Term Loans and Advances
TOTAL ASSETS
31.03.2018 31.03.2017
2.91
10.04
0.03
2.14
0.04
1.02
3.23
4.83
3.70
1.05
0.23
12.95
0.03
2.18
15.16
5.35
9.81
15.16
0.58
6.38
0.03
1.55
0.08
1.86
3.22
2.05
1.06
0.06
0.37
6.96
0.03
1.63
8.62
5.08
3.54
8.62

19
Ratio Analysis
It is a financial statement analysis which indicates the company’s financial performance
and gives the information of companies P&L A\C and Balance Sheet. It helps us to
determine the company’s financial position.
Types of Ratio Analysis:
• Current Ratio
• Liquid Ratio
• Proprietary Ratio
• Gross Profit Ratio
• Net Profit Ratio
• Working Capital Ratio
• Fixed Assets Turnover Ratio
• Debt Equity Turnover Ratio
• Stock Turnover Ratio
• Profits on Funds Employed

20
1. Current Ratio
Current Ratio = Current Assets / Current Liabilities
Table 1.11.1: Table showing Current Ratio (Amount in Crores)
Year
Current Assets
Current Liabilities
Current ratio
in rupees
in rupees
2018 9.81 2.18 4.50
2017 3.54 1.63 2.17
Graph 1.11.1: Graph showing Current Ratio
INTERPRETATION
AnandRathi Current Ratio in the year 2017 is 2.17 and in 2018 is 4.50. From the graph
it is evident that Current Ratio of AnandRathi is increasing. The increasing in Current
Ratio indicates good solvent position of the company and shows good performance and
proper utilization of inventory and is efficient in collection of Debtors.
0
0.5
1
1.5
2
2.5
3
3.5
4
4.5
5
2018 2017
Current Ratio

21
2. Proprietary Funds Ratio
Proprietary Funds Ratio = Shareholders Fund /Total Assets
Table 1.11.2: Table showing Proprietary Funds Ratio (Amount in Crores)
Year
Shareholders’
Funds
Total Assets
Proprietary
Funds Ratio
in rupees
in rupees
2018 12.95 15.16 0.85
2017 6.96 8.62 0.81
Graph 1.11.2: Graph showing Proprietary Funds Ratio
INTERPRETATION
AnandRathi Proprietary Funds Ratio for the year 2017 is 0.81 and in the year 2018 is
0.85. From the graph it is evident that proprietary Funds Ratio of AnandRathi is
increasing. The increasing in Proprietary Funds Ratio indicates that in the company
there is proper utilization of capital funds for the long term assets.
0.79
0.8
0.81
0.82
0.83
0.84
0.85
0.86
2018 2017
Proprietary Funds Ratio

22
3. Asset Turnover Ratio
Asset Turnover Ratio = Sales / Total Assets
Table 1.11.3: Table showing Asset Turnover Ratio (Amount in Crores)
Year
Sales
Total Assets
Asset
Turnover
Ratio
in rupees
in rupees
2018 27.63 15.16 1.82
2017 13.21 8.62 1.53
Graph 1.11.3: Graph showing Asset Turnover Ratio
INTERPRETATION
AnandRathi Asset Turnover Ratio for the year 2017 is 1.53 and in the year 2018 is 1.82.
From the graph it is evident that Asset Turnover Ratio of AnandRathi is increasing. The
increasing in Asset Turnover Ratio indicates that company used its Assets efficiently
and effectively and is most likely to have no management problems.
0
0.5
1
1.5
2
2.5
3
2018 2017
Asset Turnover Ratio

23
4. Net Profit Ratio
Net Profit Ratio = Net Profit after Tax / Net Sales * 100
Table 1.11.4: Table showing Net Profit Ratio (Amount in Crores)
Year
Net Profit
After Tax
Net Sales
Net profit
Ratio
in rupees
in rupees
2018 5.99 27.63 21.68%
2017 1.98 13.21 14.99%
Graph 1.11.4: Graph showing Net Profit Ratio
INTERPRETATION
AnandRathi Net Profit for the year 2017 is 14.99% and in the year 2018 is 21.68%.
From the above graph it is evident that Net Profit Ratio of AnandRathi is increasing.
The increase in Net Profit indicates that the company’s profitability position is good.
0.00%
5.00%
10.00%
15.00%
20.00%
25.00%
2018 2017
Net Profit Ratio

24
CHAPTER 2
CONCEPTUAL BACKGROUND AND LITERATURE REVIEW

25
2.1 THEORETICAL BACKGROUND OF THE STUDY
Introduction to Optimal Portfolio
The Investor constantly likes to buy a pair of combination of stocks which will provide
high return with low risk. The investor wants to just maintain a satisfactory income with
reward to risk ratio. In ancient time the stock analyst always tend to have attention more
on return aspect of the company’s stock. In the recent times risk have received and
pulled a more attention, for that analyst. Are providing both risk as well as return
estimates to investors.
While making a investment decision, risk and return plays a very important role to
generate returns. These decisions will help investors to know whether he should invest
or not and also it helps in a portfolio which stock to include in order to balance investors
investment. To make a proper decision on investment and to manage the proper
portfolio is very important. An investor always tries to maximize his returns with risk.
In a traditional approach the investors’ objectives in terms of return, appreciation in
capital from the selected stock is just to satisfy their needs and wants. Another famous
approach is modern approach. In this Markowitz model is built to select a stock based
on the analysis of risk and return. Markowitz constructed a model as a foundation to
quantify the risk and his contribution to the portfolio segment on popularly called as
‘Modern Portfolio Theory’. He contributed an analytical tool making analysis, to select
optimal portfolio to the investors. For this he won Nobel Prize and later he was called
as ‘Father of Modern Portfolio Theory’.
According to Markowitz, meaningful measure of selecting optimal portfolio is to
calculate variance of the rate of return of the selected stocks, if the sample size is take
for 50 companies then according to the Markowitz model there as to find out correlation
between the each 50 stocks. Earlier it was find to the investor to make a satisfactory
profit, but later there comes a problems in data to analysis it, Markowitz tried several
times to identify the solution for that problem.
26
One of the students of Markowitz called William Sharpe helped Markowitz in solving
the issue that he had. William Sharp introduced a model called ‘Sharpe Single index
model’ which constituently reduce its data calculation. A well simplify model where the
fluctuations in the stock price e of a company in the market are equally inter collected to
the fluctuation in the market index. William Sharpe just connected the individual stock
behavior to market index behavior this resulted in reduce paper work and well
organized optimal portfolio sharp model is consider as best model investments.
Elaborate Information about the topic
Meaning of Portfolio
Portfolio is the process where the investor gets the clear idea of risk and return by
constructing the Optimal Portfolio. The Portfolio is combination of the return and risk
for the securities in the stock market
Return
Returns the investor gets in market.
Risk
Risk is the possible outcomes of the stock that occurs from the actual outcomes and
expected returns.
There are 2 kinds of risk
➢ Systematic Risk
➢ Unsystematic Risk
Systematic Risk – Systematic Risk are those risk in which the individual securities
where the returns are caused by affecting the market as whole like market changes and
inflation.
Unsystematic Risk – Unsystematic Risk are those risk which is caused unique to
company and company strikes.

27
Introduction to Sharpe Single Index Model
An attempt made here is to get a clear view and insight idea which is included in
Sharpe’s Single Index model and to study how to construct optimum portfolio by using
this model NSE Nifty is the main indicator of NSE India and it is mostly be broadly
traded exchange in India. NSE Nifty is taken as market performance index and daily
closing price is considered in order to comparing with the daily closing price of selected
securities, and the closing price is taken from 1st April 2012 to 31st March 2018. This
Sharpe index model is formulated here by using the daily closing price of Nifty 50
companies and the daily closing price of Nifty Index closing price.
Here in this proposed form of calculation formulates a variety of unique cut off rates
and helps to select those securities to construct efficient optimal portfolio those
securities is having an excess returns to beta ratio is more than that of cut off rate. After
this a well proportionate of investment in each securities selected is calculated on the
basis of securities beta value, excess return to beta ration, unsystematic risk and cut off
rate of each of the assets or securities concerned.
Steps involved in Construction of Optimal Portfolio
Step 1: Calculation on year on year return.
Step 2: Calculation on expected return and various risk.
Step 3: Examine the best performing stock on various securities raised on their returns
& risk and ranking those securities accordingly.
Step 4: Constructing the best performing stocks in portfolio.
Step 5: Determine the cut-off point of stock to choose the best securities.
Step 6: Identifying the best performing securities which results optimum portfolio.
Step 7: Determining securities for the proportion of investment for the identical
securities.
The simplified model proposes that the relationship between each pair of securities can
indirectly be measured by comparing each security to a common factor market
28
performance index that is shared amongst all the securities. As a result the model can
reduce the burden of large input requirement. SIM has gained its popularity to a great
extent in the arena of investment finance as compared to Markowitz’s model.
Assumptions made
The SIM is based on the following assumptions:
• All investors have homogenous expectations.
• A uniform holding period is used in estimating risk and return for each security.
• The price movementsof a security in relation to another do not depend primarily
upon the nature of those two securities alone. They could reflect a greater
influence that might have cropped up as a result of general business and economic
conditions.
• The relation between securities occurs only through their individual influences
along with some indices of business and economic activities.
• The indices to which the returns of each security are correlated are likely to be
some securities market proxy.
• The random disturbance terms has an expected value zero and a finite variance. It
is not correlated with the return on market portfolio as well as with the error term
for any other securities
SIM divides the return into two parts:
➢ Unique part
➢ Market related part
Unique part: The intercept term is called by the Greek name ‘Alpha’ and is a micro
event affecting an individual security but not all securities in general. It is obviously the
value Ri when Rm = 0.
Market related part: Rm on other hand is a micro event that is broad based and affects
all or most of the firms. Beta the slope of the line, is referred to as ‘Beta Coefficient’.
It is a measure of sensitivity of the security return to the movements in overall market
returns. It shows how risky a security is, if the security is held in a well diversified
portfolio.

29
SIM Risk Characteristic Line: The line represents SIM is also known as the risk
characteristic line. The concept of risk characteristic line conveys the message about the
nature of security simply by observing its value as follows:
1. Securities having > 1 are classified as aggressive securities, since they go up faster
than the market in a ‘bull’(rising market), go down in a ‘bear’(falling market)
2. Securities having < 1 are categorized as defensive securities, since their returns
fluctuate less than the market variability as a whole.
3. Finally, the limitating case of securities having = 1, are neutral securities, since
their return fluctuate at the same rate with the rate of market variability of return.
Limitations: One of the most important limitations with SIM is that it does not
consider uncertainty in the market as time progresses instead the model optimizes for a
single point in the time. Moreover, this model assumes that security prices move
together only because of common co movement with the market. Many researchers
have identified that there influences beyond the general business and market conditions
like industry oriented factors that cause securities to move together .
However, empirical evidence shows that the more complicated models have not been in
a position to outperform the SIM terms of their ability to predict ex-ante covariances
between security returns.

30
2.2 REVIEW OF LITERATURE
1.Francis Mary and G. Rathika (2015): Their investigation focused on portfolio
development by utilizing the month to month shutting costs of 10 organizations
recorded in NSE and CNX Pharma. The time of study was from September 2010 to
September 2014. Put together up with respect to the cut-off an incentive out of the 10
organizations just a single organization is chosen for the ideal portfolio development.
2. Nithya.J (2014) for large cap companies he constructed an effective portfolio. He
calculated the risk and return by using SIM. He selected 8 stocks from Pharma sector.
3. Chauhan (2014) built a portfolio utilizing top 10 loads of NIFTY. In the
investigation, it was observed to be a simple and straightforward technique to compute
ideal portfolio. In this strategy, less number of factors are utilized. It is named Single
Index Model as it utilizes just a solitary list for portfolio development. Nalini (2014) in
her investigation considered 15 loads of different segments from S&P list, taking BSE
4. Gopalakrishna, Muthu (2014) explains the rational investors about the alternatives
in the investment. He tries to compare the traditional and modern portfolio theory. This
study aims to test whether SIM provides an explanation of stock return of IT sector.
Data was collected from 2004-2008. He used regression on market return and
investigated 4 stocks.
5. Mandal & Niranjan (2013) used 21 stocks from 10 years i.e April - March 2011 the
daily prices was collected. Cut-off rate was determined the stocks which was greater
than the cut- off rates were selected. The he used different statistical tools, charts and
diagram for the better interpretation of the results.
6. Dileep & Rao, Kesava (2013) analyzed applicability, utility of SIM in Indian
context. In terms of rate of return he evaluated the performance of the portfolio. He took
30 companies and collected all the necessary data by using secondary sources. As a
result only 4 companies were selected for the optimal construction.
7. Kumar, Arun & Manjunatha (2013) constructed portfolio using SIM. The data was
collected from S&P CNX Nifty for the time period of 5 years. He selected 6 securities
out of fifty companies for the optimal portfolio construction. He stated that market
index and stock prices move in the same direction.
31
8. Saravana & Natarajan (2012) calculated the portfolio was 4 companies from NSE
and used NSE Nifty as market index. He aimed at minimizing the portfolio risk.
9. Nanda, Mahanty & Tiwari (2012) selected some random stocks to build a portfolio,
he compared the return with that of the bench mark.
10. Debasish, Sataswaroop & Khan, Jakki Samir (2012) a 14th stocks were selected
from manufacturing sector like automobile, cement, paints, textiles etc which are traded
in NSE. The daily prices of these stocks were collected from Jan 2003 to Nov 2012. He
calculated beta, variance, unsystematic risk and return of each stock. Among 14 selected
stocks only 3 stocks were taken for consideration.
11. Meenakshi and Sarita (2012) stated that Sharpe Single index model is very simple
and was easy for the construction of the portfolio.
12. Tanja Mago . C (2009) this was a technique to solve the issues that are arise on
optimum portfolio in constructing the values. The problems that are arise to solve that
the new kind of approach were been used to decide the market setting. The theoretically
the paper was been done with the experiment, they measures the intervals with the
values. By the share ratio to trade off the assessment. It is been estimated that the share
ratio developed the approach for the portfolio that maximum ideal ratios was been
developed. Thus, the sample distribution was possible in the optimum risk for the trade-
off that is constructed from data analysis.
13. Woo Gon Kim, Jun Zhong, Ming-Hsiang Chen & Ersem Karadag (2009)
analyzed between 1st Jan 1998 & 31st Dec 2004 the risk adjustment concert of three
restaurant segments. As an analytical structure the Jenson, the Treynor and Sharpe index
were used. The findings have are not entirely consistent with quick service segment out
performs other two segments. As a result restaurants are having much unsystematic risk.
14. Markus Ebner & Thorsten Neumann (2008) examined differences correlation in
derive variance- covariance and stock returns in US by time-varying factor model. The
problem can be answered by three approaches, 1.Random walk model, 2.Flexible least
squares and 3.Moving window least square model. This study result suggests that time
variant estimation is carrying low weight than time-varying estimate and it increases the
efficiency and effectiveness of portfolio selection.

32
15. Fikriyah Abdullah, Taufiq Hassan & Shamsher Mohamed (2007) analyzed the
difference between conventional and Islamic mutual fund performance in Malaysian
financial market. In order to achieve the objectives Sharpe’s Index, Jenson test and
adjusted Sharpe index were used. In the result findings they observed two different
performances. In Bullish trend Islamic funds low performed than conventional funds
and in bearish market Islamic funds are better than conventional funds.
16. Kwok Wai Yu, Xiaoqiyang & Hung Wong (2007) analyzed the portfolio
management and measures in application with the Sharpe rule. They stated tat for the
improvement investment should be made in some other assets. With the help of rule
they satisfy the condition stating that the old portfolio can be added with new stocks,
where return can be multiplied by the sum of Elasticity of the value of risk.
17. Beliakov & Bagirov (2006) studied performance of numeric on various methods for
the calculations for the Conditional Values at Risk (CVR) this will carry out evaluation
of optimum portfolio for the measurement of risk. They executed that this method for
the purpose of the smooth construction of portfolio with efficiently getting the portfolio
returns and they also analyzed parallel execution computer based cluster for the method.
18. David Moreno, Paulina Marco and Ignaciolmeda (2005) analyzed investor of
portfolio seek to evaluate the portfolio return. This study specially investigates weather
Markowitz model is less efficient that Arch-type risk adjusted return model. The same
examination is carried down with replica based on Lower Partial Moment (LPM) which
takes into account that irregularity in the sharing of takings. No model is efficient in
finding out effective average performance. Reward to semi-variance ratio is effective
than other variance based replica of portfolio performance.
19. Brandt & Clara (2005) studied an approach to dynamic portfolio for selection of
that easy for the implementation of the Markowitz paradigm. They widened assets and
statistically they optimized the portfolio for space of extent. They reviewed the
conditional portfolio and portfolios which are for timing. They decided that portfolio
which is managed by static in their choice and the horizons which were for up to five
years is for dynamic strategy.

33
20. Seegopaul, Hamish, Gupta, Francis, Prestbo & Johan (2005) the researcher
analyzed that the greatest arrangements for single index for large cap in the domestic so
that the equities are marginal in the difference for the performance that the long period
in single index are the significant in its value for the overall plan in the study.
21. Detemple, Garcia & Rindisscher (2003) analyzed that the new simulation is based
on approach for the construction with allocation of realistic environment of complex
dynamic situations for variable state. They also examined for the stocks where the
returns of the stocks are predicted with dividend yields, where the investors will be
having relative risk on their wealth. They examined the analysis by using BSE Sensex,
S&P 500 index as an empirical data for evidence.
22. Schaerf (2002) studied the problems related to portfolio selected. Optimum
portfolio gives clear picture of returns and gives clear picture of how to balance to
investors while investing in various securities. He also determines the constraints for
additional cardinality of portfolio and for quantity of individual assets for Markowitz
model of seminal mean-variance.
23. Sahalia & Brandt (2001) explained about the asset allocation of problem in which
conditional movements of the portfolio returns are partly predictable. They both
explained how the weights of the optimal portfolio depend on predictive variable.
optimal portfolio weights they both combine the predictive weights in to Sharpe’s single
index model. So, that the best time captures differential in the investment decisions.
24. Doumpos (2000) examines that research study is classified into four basic classes,
models which is focusing on perception for securities and for the analysis. For behavior
of this study, the models which focuses on rapid spot for the security. The evaluation of
securities based on various investor performances in an portfolio.
25. Finnerty (2000) analyzed that study is related to the high inflationary situation for
portfolios in 1970’s based on risk, returns of traditional portfolio. Portfolio consists of
bonds, securities and stocks with an increased inclusion of the commodities for the
allocation of the assets.
26. Zopounidis (1998) examines that study is concerned for the analysis multi criteria
in which portfolio selection done accordingly a methodological background: is a
conglomerate objective for mathematical programming, heterogeneous attribute.

34
27. Irwin & Landa (1987) they examined that the mixed benefits of portfolio is an
alternative class. The very significant justification of portfolio commodity is provides an
inflation hedge. Thus the hedging function may be excellent source of diversification
portfolio. The situation of inflationary can be characterized with purposeful increase in
price of the commodity, the value during such periods will be offered for duration and
usually stocks will perform very poorly at the increased inflationary situations.
28. Merton (1980) examines the difficulties which are precisely expected while
constructing optimum portfolio for returns of the investors. The investor can assign on
the various stocks where the investor gets the maximum returns for their investments
with less risk in optimal portfolio, which is governed by government for rate of interest
and for risky stocks
29. Ross (1976) studied on the alternative pricing of asset theorem which is called as
Arbitrage Pricing Theory (APT). The theory is mainly based on less restrictive
assumptions. Under arbitrage condition theory explains that return on any one of the
stocks will be related to assets of systematic or risk factor. The portfolio which is having
the same risk factor cannot expect the same returns for stocks. Basically APT theory
fails to advise the nature of the stock and the number of the factors.
30. Eltonetal (1976) he tried to develop successfully an optimum portfolio of heuristic
by defining single average correlation coefficient of all correlation coefficients. He
always use to manage and obtain the optimized portfolio thus this answer was
computationally intensive while satisfying while substituting the portfolios.
31. Maller, Durand, Jafarpour & Tobin (1958) examined about the Mean- Variance
of optimization. Markowitz model presents that the solution for the “black box” is for
maximizing the returns for period of risk given. Usually risk is calculated on standard
deviation of portfolio where the result is efficient in the frontier for the possible
portfolios hyperbola, the portfolio is calculated on each security and result is given for
each of the security regarding their risk and other aspects in the construction of
portfolio. It is calculated for the risky assets in the optimum portfolio. Portfolio which is
having the tangency is expected to get maximum returns for their portfolios in Sharpe’s
SIM.

35
CHAPTER 3
RESEARCH DESIGN
36
3.1 STATEMENT OF PROBLEM
The investor has faced many problems while choosing the securities from the large set
of securities. They do not know how much to invest, at what proportion they need to
allocate their investments in different securities. So by using Sharpe Single Index Model
Investors will get a clear picture of which Stocks is performing well and at which
proportion they can invest. The present study entitles “Optimal Portfolio Construction
using Sharpe’s Single Index Model” for these top 50 stocks from NSE were taken for
calculation.
3.2 NEED FOR THE STUDY
Every investor goes to confusion as how much to invest and to which stocks to consider
for his portfolio. To avoid such confusions and difficulties Sharpe index model is
constructed to minimize those attributes by helping investors to build strong portfolio
keeping into account of their needs which suits them best. This topic was selected to
prove by using Shapes Index Model investors can easily construct optimal portfolio
which has less risk with high return.
3.3 OBJECTIVE OF THE STUDY
• To calculate Risk and Return of all Stocks listed in Nifty 50.
• To get practical knowledge of Single Index Model.
• To calculate proportion for each stock to be invested in portfolio.
• To construct an Optimal Portfolio for Stocks listed in NIFTY 50.

37
3.4 SCOPE OF THE STUDY
The companies which are restricted are only for top 50 stocks in Nifty. Based on their
performance 50 companies are selected from the NSE. The other factors are not for the
analysis only the share price of the companies, index values, government securities, rate
of return and beta value, residual values and cutoff point are calculated for the analysis
of optimal portfolio construction.
3.5 RESEARCH METHODOLOGY
Secondary data is used for study. www.yahoofinance.com and www.nseindia.com were
websites used for collecting data.. For the current study Nifty 50 index is considered as
Market Index. Weekly NSE indices and prices of all the 50 stocks of Nifty 50 are taken
for the period between April 1, 2013 to March 31, 2018.
The steps followed are
Step 1: Framework for Mean Return on various stocks
Mean return stock is calculated on the selected stocks in financial industry by analyzing
the current price divided by the preceding previous price to estimate the percentage of
the return for the current financial year.
Ri =
𝒑𝒕− 𝑷𝒕−𝟏
𝑷𝒕−𝟏
Ri = i t security of stock
Pt = stock of current period
Pt-1 = stock of preceding period

38
Step 2: Calculation of Excess Return to Beta
The relationship between the reward ratio and potential risk is known as excess return.
The stocks of riskless stocks difference and expected return is known as excess return.
Based on these excess returns of stocks Beta is ranked from ascending to descending
order.
Excess Return to Beta = 𝑹𝒊−𝑹𝒇
𝜷𝒊
Ri = return expected for stock i
Rf = 365 days T-bills
βi = un-diversifiable risk of stock i
Step 3: Calculation of Cut-Off point
Cut off point is calculated to get the complete picture about those stocks
which are preferable to invest
Ci = 𝝈𝒎
𝟐 ∑ (𝑹𝒊−𝑹𝒇)𝜷𝒊𝒏𝒊=𝟏
𝟏+ 𝝈𝒎𝟐 ∑
𝜷𝒊𝟐
𝝈𝒆𝒊𝟐
𝒏𝒊=𝟏
𝝈𝒆𝒊𝟐 = residual variance
β = beta value of individual security i
σm = risk of market
Ri – Rf = excess return

39
Step 4: Calculation of Absolute Proportion on Investment
Absolute Proportion helps the investors to determine about the valuation of business
and financial performance. Absolute values tries to know the companies intrinsic worth
for the projected flows of the cash.
ZI = 𝜷𝒊
𝝈𝒆𝒊𝟐 ((
𝑹𝒊−𝑹𝒇
𝜷𝒊)−𝑪)
𝝈𝒆𝒊𝟐 = Residual Variance
Ri = Rate of Return
Rf = 365 days Treasury Bills
βi = Beta value of Individual Security
Step 5: Calculation of Relative Proportion on Investment
Constant mix of investments means bringing the portfolios which are deviated away
from the allocation of asset. This process is usually done like buying the assets which
are underweight and selling the assets
Xi = 𝒁𝒊
∑ 𝒁𝒊𝒏𝒊=𝟏
Zi = Absolute Proportion
∑ 𝐙𝐢𝐧𝐢=𝟏 = Total of Selected Variance

40
3.6 LIMITATION OF THE STUDY
• Only Risk and Return calculation done for the future outcomes
• Data collected is secondary data, which may include lack of information
• This study is not at all appropriate for short term investors
• The data of closing price of the securities is considered for 5 years which may
not give exact impact.
• All the calculations were not be able to brought into the report as calculations
were done on weekly basis

41
CHAPTER 4
DATA ANALYSIS AND INTERPRETATION
42
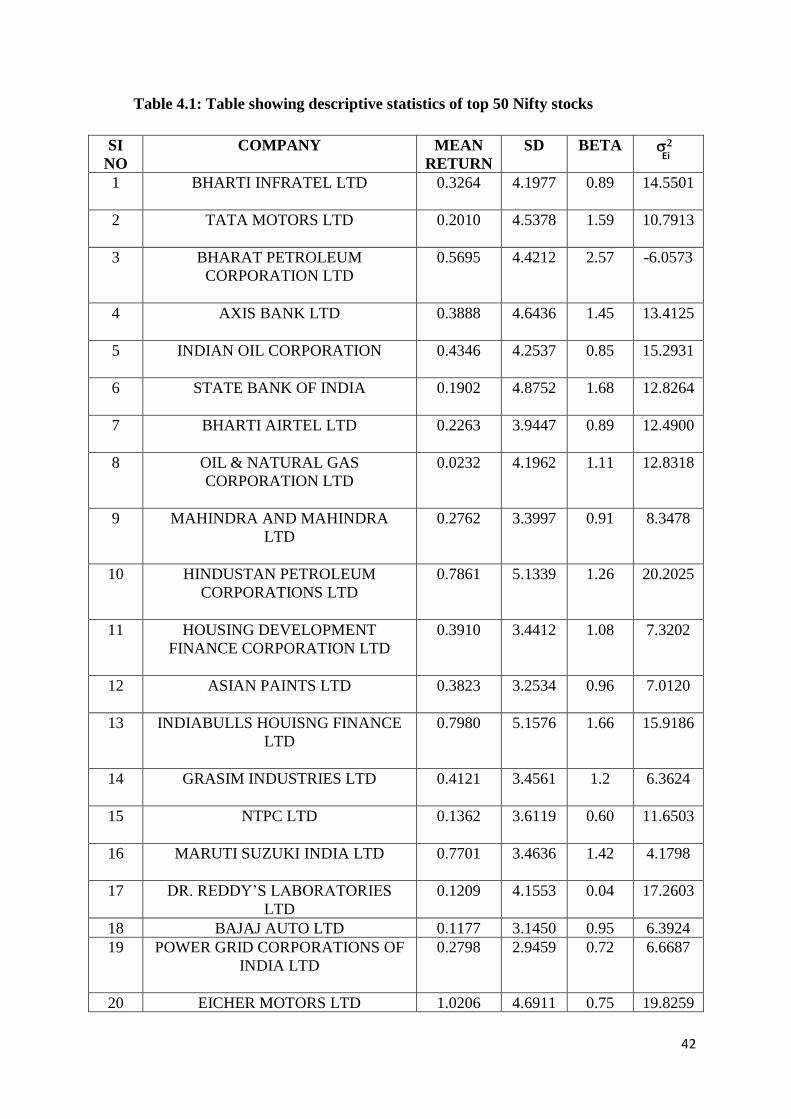
Table 4.1: Table showing descriptive statistics of top 50 Nifty stocks
SI
NO
COMPANY MEAN
RETURN
SD BETA
2
Ei
1 BHARTI INFRATEL LTD
0.3264 4.1977 0.89 14.5501
2 TATA MOTORS LTD
0.2010 4.5378 1.59 10.7913
3 BHARAT PETROLEUM
CORPORATION LTD
0.5695 4.4212 2.57 -6.0573
4 AXIS BANK LTD
0.3888 4.6436 1.45 13.4125
5 INDIAN OIL CORPORATION
0.4346 4.2537 0.85 15.2931
6 STATE BANK OF INDIA
0.1902 4.8752 1.68 12.8264
7 BHARTI AIRTEL LTD
0.2263 3.9447 0.89 12.4900
8 OIL & NATURAL GAS
CORPORATION LTD
0.0232 4.1962 1.11 12.8318
9 MAHINDRA AND MAHINDRA
LTD
0.2762 3.3997 0.91 8.3478
10 HINDUSTAN PETROLEUM
CORPORATIONS LTD
0.7861 5.1339
1.26 20.2025
11 HOUSING DEVELOPMENT
FINANCE CORPORATION LTD
0.3910 3.4412 1.08 7.3202
12 ASIAN PAINTS LTD
0.3823 3.2534 0.96 7.0120
13 INDIABULLS HOUISNG FINANCE
LTD
0.7980 5.1576 1.66 15.9186
14 GRASIM INDUSTRIES LTD
0.4121 3.4561 1.2 6.3624
15 NTPC LTD
0.1362 3.6119 0.60 11.6503
16 MARUTI SUZUKI INDIA LTD
0.7701 3.4636 1.42 4.1798
17 DR. REDDY’S LABORATORIES
LTD
0.1209 4.1553 0.04 17.2603
18 BAJAJ AUTO LTD 0.1177 3.1450 0.95 6.3924
19 POWER GRID CORPORATIONS OF
INDIA LTD
0.2798 2.9459 0.72 6.6687
20 EICHER MOTORS LTD 1.0206 4.6911 0.75 19.8259

43
21 TATA STEEL LTD
0.3858 5.1699 1.12 21.8651
22 ADANI PORTS AND SPECIAL
ECONOMIC ZONE LTD
0.4899 5.4030
1.5 20.4701
23 ITC LTD
0.1585 3.2382 0.76 8.2468
24 YES BANK LTD
0.6486 5.6431 1.9 17.8502
25 UPL LTD
-2.2061 8.6452 0.98 71.0164
26 KOTAK MAHINDRA BANK
LTD
0.5123 3.2662 1.05 6.3941
27 HDFC BANK LTD
0.4573 2.4111 1.08 1.2918
28 JSW STEEL
0.6436 4.1440 0.61 15.7303
29 BAJAJ FINANCE LTD
1.1531 4.5924 1.16 15.8738
30 VEDANTA LTD
0.4342 6.3518 1.43 32.4182
31 HERO MOTOCROP LTD
0.3984 3.5651 0.96 9.1373
32 SUN PHARMACEUTICAL
INDUSTRIES LTD
0.1448 4.2365 0.24 17.7246
33 ICICI BANK LTD
0.2701 4.6476 1.47 13.2233
34 COAL INDIA LTD
0.0464 4.0080 0.67 14.3239
35 BAJAJ FINSERV LTD
0.8247 4.1007 0.9 13.6757
36 HINDALCO INDUSTRIES LTD
0.4783 5.3792 1.52 19.9794
37 ZEE ENTERTAINMENT
ENTERPRISES LTD
0.4597 3.5638 0.76 10.4616
38
RELIANCE INDUSTRIES LTD
0.3696
3.3245
1.20
5.4700
39 INDUSIND BANK LTD
0.6463 3.6917 1.33 6.7714
40 GAIL (INDIA) LTD 0.3217 4.1869 0.88 14.5281
41 CIPLA LTD
0.1913 3.4328 0.49 10.8534
42 ULTRATECH CEMENT LTD
0.3738 3.6253 1.45 4.9923
43 TITAN COMPANY LTD 0.6019 4.0802 0.85 13.8472

44
44 LARSEN & TURBO LTD
0.3792 3.9626 1.44 7.6637
45 WIPRO LTD
0.1377 3.3292 0.44 10.3331
46 HINDUSTAN UNILEVER LTD
0.4560 3.3915 0.85 8.7015
47 HCL TECHNOLOGIES LTD
0.4232 3.4882 0.43 11.4508
48 INFOSYS LTD
0.2316 3.3071 0.59 9.5875
49 TATA CONSULTANCY SERVICES
LTD
0.2970 3.1477 0.85 7.1072
50 TECH MAHINDRA LTD
0.4480 3.7837 0.72 12.3068
Source: Weekly data for 5 years has been compiled to Year on Year Average
INTERPRETATION:
1. From the above data, we can say that company that yields the highest return is
BAJAJ FINANCE LIMITED and the company with lowest return is UPL
LIMITED
2. Beta value of an industry indicates the relationship of company with that of market.
Securities whose beta values are greater than 1 are highly sensitive. Higher Beta
value of YES BANK indicates a greater volatility than the index.
3. Standard deviation measures the risk of the stock. From the above calculation UPL
has higher risk and HDFC BANK LTD has the lowest risk.
4. Residual Variance shows the difference between return companies and market, UPL
has the highest residual variance indicating the return of the company and the
market is highest for the company. On the other hand Bharat Petroleum Corporation
Ltd has lowest indicating that it is the least deviates from the market.

45
Table 4.2: Table showing determination of excess return and ranking of the stocks
(Risk free rate of return is 6.5 p.a. that is 0.125 per week)
COMPANY MEAN
RETURN
(Ri)
TREASURY
BILLS
(Rf)
BETA EXCESS
RETURN
WITH
BETA
RANK
BHARTI INFRATEL LTD
0.3264 0.125 0.89 0.2263 25
TATA MOTORS LTD
0.2010 0.125 1.59 0.0478 41
BHARAT PETROLEUM
CORPORATION LTD
0.5695 0.125 2.57 0.1730 34
AXIS BANK LTD
0.3888 0.125 1.45 0.1819 31
INDIAN OIL
CORPORATION
0.4346 0.125 0.85 0.3642 15
STATE BANK OF INDIA
0.1902 0.125 1.68 0.0388 43
BHARTI AIRTEL LTD
0.2263 0.125 0.89 0.1138 38
OIL & NATURAL GAS
CORPORATION LTD
0.0232 0.125 1.11 -0.0917 47
MAHINDRA AND
MAHINDRA LTD
0.2762 0.125 0.91 0.1662 36
HINDUSTAN PETROLEUM
CORPORATIONS LTD
0.7861 0.125 1.26 0.5247 07
HOUSING DEVELOPMENT
FINANCE CORPORATION
LTD
0.3910 0.125 1.08 0.2463 20
ASIAN PAINTS LTD
0.3823 0.125 0.96 0.2680 19
INDIABULLS HOUISNG
FINANCE LTD
0.7980 0.125 1.66 0.4054 11
GRASIM INDUSTRIES LTD
0.4121 0.125 1.2 0.2393 22
NTPC LTD
0.1362 0.125 0.60 0.0187 45
MARUTI SUZUKI INDIA
LTD
0.7701 0.125 1.42 0.4543 08
DR. REDDY’S LAB LTD 0.1209 0.125 0.04 -0.1025 48

46
BAJAJ AUTO
LTD
0.1177 0.125 0.95 -0.0077 46
POWER GRID
CORPORATIONS OF INDIA
LTD
0.2798 0.125 0.72 0.215 28
EICHER MOTORS LTD
1.0206 0.125 0.75 1.1941 01
TATA STEEL LTD
0.3858 0.125 1.12 0.2329 23
ADANI PORTS AND
SPECIAL ECONOMIC
ZONE LTD
0.4899 0.125 1.5 0.2433 21
ITC LTD
0.1585 0.125 0.76 0.0441 42
YES BANK LTD
0.6486 0.125 1.9 0.2756 18
UPL LTD
-2.2061 0.125 0.98 -2.3788 50
KOTAK MAHINDRA BANK
LTD
0.5123 0.125 1.05 0.3689 14
HDFC BANK LTD
0.4573 0.125 1.08 0.3077 16
JSW STEEL 0.6436 0.125 0.61
0.8502 03
BAJAJ FINANCE LTD
1.1531 0.125 1.16 0.8863 02
VEDANTA LTD
0.4342 0.125 1.43 0.2162 27
HERO MOTOCROP LTD
0.3984 0.125 0.96 0.2849 17
SUN PHARMACEUTICAL
INDUSTRIES LTD
0.1448 0.125 0.24 0.0825 40
ICICI BANK LTD
0.2701 0.125 1.47 0.0987 39
COAL INDIA LTD
0.0464 0.125 0.67 -0.1173 49
BAJAJ FINSERV LTD
0.8247 0.125 0.9 0.7774 04
HINDALCO
INDUSTRIES LTD
0.4783 0.125 1.52 0.2324 24
ZEE ENTERTAINMENT
ENTERPRISES LTD
0.4597 0.125 0.76 0.4404 10
RELIANCE INDUSTRIES 0.3696 0.125 1.20 0.2038 29
47
INDUSIND BANK LTD
0.6463 0.125 1.33 0.3920 12
GAIL (INDIA) LTD
0.3217 0.125 0.88 0.2235 26
CIPLA LTD
0.1913 0.125
0.4
9
0.1353 37
UTRATECH CEMENT LTD
0.3738 0.125 1.45 0.1716 35
TITAN COMPANY LTD
0.6019 0.125 0.85 0.5611 06
LARSEN & TURBO LTD
0.3792 0.125 1.44 0.1765 33
WIPRO LTD
0.1377 0.125 0.44 0.0289 44
HINDUSTAN UNILEVER
LTD
0.4560 0.125 0.85 0.3894 13
HCL TECHNOLOGIES LTD
0.4232 0.125 0.43 0.6935 05
INFOSYS LTD
0.2316 0.125 0.59 0.1807 32
TATA CONSULTANCY
SERVICES LTD
0.2970 0.125 0.85 0.2024 30
TECH MAHINDRA LTD
0.4480 0.125 0.72 0.4486 09
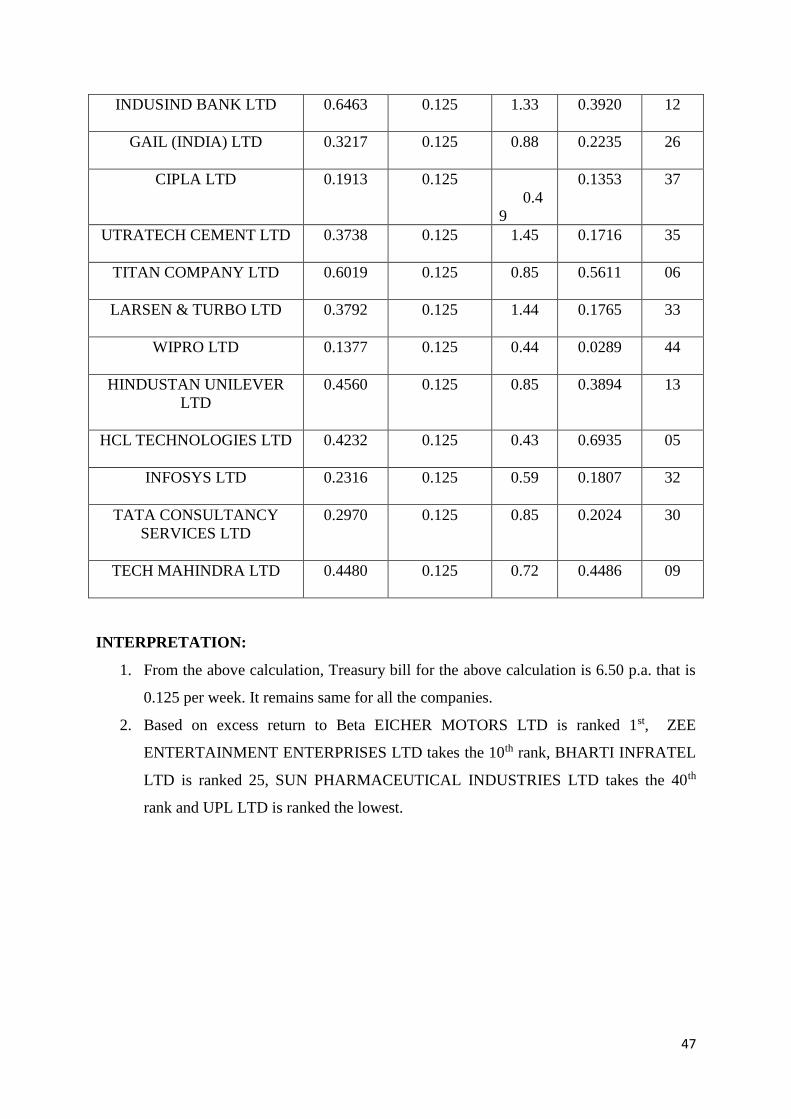
INTERPRETATION:
1. From the above calculation, Treasury bill for the above calculation is 6.50 p.a. that is
0.125 per week. It remains same for all the companies.
2. Based on excess return to Beta EICHER MOTORS LTD is ranked 1st, ZEE
ENTERTAINMENT ENTERPRISES LTD takes the 10th rank, BHARTI INFRATEL
LTD is ranked 25, SUN PHARMACEUTICAL INDUSTRIES LTD takes the 40th
rank and UPL LTD is ranked the lowest.

48
Table 4.3: Table showing determination of Cut-off Point
Rank Ranked companies ((Ri-
Rf)*b)
/RV
Cumulative B2/RV Cumulative Cut-
off
Point
1 EICHER MOTORS
LTD
0.0267 0.0267 16.6028 16.6028 0.1184
2 BAJAJ FINANCE
LTD
0.0752 0.1019 17.9103 34.5131 0.2938
3 JSW STEEL
0.0201 0.122 18.5027 53.0158 0.3271
4 BAJAJ FINSERV
LTD
0.0460 0.168 17.5906 70.6064 0.3859
5 HCL
TECHNOLOGIES
LTD
0.0112 0.1792 16.5119 87.1183 0.3964
6 TITAN COMPANY
LTD
0.0293 0.2085 24.6805 111.7988 0.4129
7 HINDUSTAN
PETROLEUM
CORPORATIONS
LTD
0.0412 0.2497 38.5042 150.303 0.4275
8 MARUTI SUZUKI
INDIA LTD
0.2192 0.4689 9.2006 159.5036 0.4394
9 TECH MAHINDRA
LTD
0.0189 0.4878 27.4331 186.9367 0.4398
10 ZEE
ENTERTAINMENT
ENTERPRISES LTD
0.0243 0.5121 23.7551 210.6918 0.4398
11 INDIABULLS
HOUISNG FINANCE
LTD
0.0702 0.5823 39.2643 249.9561 0.4354
12 INDUSIND BANK
LTD
0.1024 0.6847 17.2760 267.2321 0.4284
13 HINDUSTAN
UNILEVER LTD
0.0323 0.717 22.3452 289.5773 0.4265
14 KOTAK
MAHINDRA BANK
0.0636 0.7806 17.3349 306.9122 0.4212

49
15
INDIAN OIL
CORPORATION
0.0172
0.7978
41.9869
348.8991
0.4198
16 HDFC BANK LTD
0.2778 1.0756 4.1984 353.0975 0.3839
17 HERO MOTOCROP
LTD
0.0287 1.1043 32.0842 385.1817 0.3805
18 YES BANK LTD
0.0557 1.16 64.7735 449.9552 0.3737
19 ASIAN PAINTS LTD
0.0352 1.1952 26.1957 476.1509 0.3694
20 HOUSING
DEVELOPMENT
FINANCE
CORPORATION
LTD
0.0392 1.2344 29.7211 505.872 0.3637
21 ADANI PORTS AND
SPECIAL
ECONOMIC ZONE
LTD
0.0267 1.2611 84.1468 590.0188 0.3599
22 GRASIM
INDUSTRIES LTD
0.0541 1.3152 26.5931 616.6119 0.3526
23 TATA STEEL LTD
0.0134 1.3286 93.8992 710.5111 0.3508
24 HINDALCO
INDUSTRIES LTD
0.0269 1.3555 85.9572 796.4683 0.3473
25 BHARTI INFRATEL
LTD
0.0123 1.3678 64.2979 860.7662 0.3457
26 GAIL (INDIA) LTD
0.0119 1.3797 64.9961 925.7623 0.3441
27 VEDANTA LTD
0.0136 1.3933 149.9289 1075.6912 0.3421
28 POWER GRID
CORPORATIONS OF
INDIA LTD
0.0167 1.41 31.0172 1106.7084 0.3397
29 RELIANCE
INDUSTRIES LTD
0.0537 1.4637 26.8357 1133.5441 0.3317

50
30 TATA
CONSULTANCY
SERVICES LTD
0.0206 1.4843 35.1228 1168.6669 0.3288
31 AXIS BANK LTD
0.0285 1.5128 73.7230 1242.3899 0.3239
32 INFOSYS LTD
0.0066 1.5194 53.0640 1295.4539 0.3228
33 LARSEN & TURBO
LTD
0.0478 1.5672 43.4136 1338.8675 0.3148
34 BHARAT
PETROLEUM
CORPORATION
LTD
-0.1886 1.3786 -35.022 1303.8455 0.3544
35 UTRATECH
CEMENT LTD
0.0723 1.4509 29.095 1332.9405 0.3366
36 MAHINDRA AND
MAHINDRA LTD
0.0165 1.4674 50.2414 1383.1819 0.3328
37 CIPLA LTD
0.0030 1.4704 80.2137 1463.3956 0.3318
38 BHARTI AIRTEL
LTD
0.0072 1.4776 109.7345 1573.1301 0.3288
39 ICICI BANK LTD
0.0161 1.4937 133.9645 1707.0946 0.3207
40 TATA MOTORS
LTD
0.0112 1.5049 225.7654 1932.86 0.3077
41 SUN
PHARMACEUTICAL
INDUSTRIES LTD
0.0003 1.5052 214.8436 2147.7036 0.3076
42 ITC LTD
0.0031 1.5083 187.0916 2334.7952 0.3039
43 STATE BANK OF
INDIA
0.0085 1.5168 330.4962 2665.2914 0.2927
44 WIPRO LTD
0.0005 1.1573 357.9972 3023.2886 0.2917
45 NTPC LTD
0.0006 1.5179 624.1232 3647.4118 0.2901
46 BAJAJ AUTO LTD
-0.0011 1.5168 -831.888 2815.5238 0.2823

51
47 OIL & NATURAL
GAS
CORPORATION
LTD
-0.0088 1.148 -139.915 2675.6088 0.2758
48 DR. REDDY’S
LABORATORIES
LTD
-9.5016 -8.3536 -168.393 2507.2158 0.2758
49 COAL INDIA LTD
-0.0037 -8.3573 -122.099 2385.1168 0.2736
50 UPL LTD
-0.0322 -8.3895 -29.8555 2355.2613 0.2671
INTERPRETATION
1. Based on excess of return to Beta ratio the above table, company is ranked from the
highest value
2. From the above calculation we found out firstly calculation of absolute return of all
fifty companies from which cumulative value was drawn.
3. In the next stage we calculated for all fifty companies from which cumulative values
was drawn
4. Lastly with the help of above calculation cut off point was derived which helped us in
knowing the most eligible companies.
The cut off value is 0.4398. The stocks which are above the cut off rate are taken into
consideration for further calculations.

52
Table 4.4: Table showing identification of Stocks which constitutes Optimum Portfolio
From the above table we are able to see the list of ten companies which are eligible for
Construction of Optimal Portfolio. These ten companies are selected with the help of
Risk and Return.
SI NO COMPANY NAME
1 EICHER MOTORS LIMITED
2 BAJAJ FINANCE LIMITED
3 JSW STEEL
4 BAJAJ FINSERV LIMITED
5 HCL TECHNOLOGIES LIMITED
6 TITAN COMPANY LIMITED
7 HINDUSTAN PETROLEUM
CORPORATION LIMITED
8 MARUTI SUZUKI INDIA LTD
9 TECH MAHINDRA LIMITED
10 ZEE ENTERTAINMENT
ENTERPRISES LIMITED

53
Table 4.5: Table showing determination of Absolute Proportion on Investment
SL
NO
COMPANY Mean TB BETA RV CUT
OFF
Zi
1 EICHER MOTORS LIMITED 1.0206 0.125 0.75 19.8259 0.1184 0.0285
2 BAJAJ FINANCE LIMITED 1.1531 0.125 1.16 15.8738 0.2938 0.0386
3 JSW STEEL 0.6436 0.125 0.61 15.7303 0.3271 0.0159
4 BAJAJ FINSERV LIMITED 0.8247 0.125 0.9 13.6757 0.3859 0.0222
5 HCL TECHNOLOGIES
LIMITED
0.4212 0.125 0.43 11.4508 0.3964 0.0095
6 TITAN COMPANY LIMITED 0.6019 0.125 0.85 13.8472 0.4129 0.0074
7 HINDUSTAN PETROLEUM
CORPORATION LIMITED
0.7861 0.125 1.26 20.2025 0.4275 0.0053
8 MARUTI SUZUKI INDIA
LTD
0.7701 0.125 1.42 4.1798 0.4394 0.0049
9 TECH MAHINDRA
LIMITED
0.448 0.125 0.72 12.3068 0.4398 0.0005
10 ZEE ENTERTAINMENT
ENTERPRISES LIMITED
0.4597 0.125 0.76 10.4616 0.4398 0.0000
Absolute Proportion on Investment helps investors to estimate performance of various
stocks which are selected for construction of Portfolio
Graph 4.5.1: Graph showing the Absolute Proportion
0
0.005
0.01
0.015
0.02
0.025
0.03
0.035
Zi

54
The table shows a list of ten companies for which absolute proportion on investment
has been calculated. Absolute proportion helps investors to estimate performance of
various stocks which are selected for construction of portfolio. Usually absolute
proportion tries to vary with the companies intrinsic values of cash.
Bajaj Finance Limited has got the highest proportion of stock that is 0.0326 and Zee
Entertainment has got the least proportion of stock that is 0.0000
Table 4.6: Table showing determination of Relative Proportion on Investment
SL NO COMPANY Zi Xi
1 EICHER MOTORS LIMITED 0.0285 22.4763%
2 BAJAJ FINANCE LIMITED 0.0326 25.7098%
3 JSW STEEL 0.0159 12.5394%
4 BAJAJ FINSERV LIMITED 0.0222 17.5079%
5 HCL TECHNOLOGIES
LIMITED
0.0095 7.4921%
6 TITAN COMPANY LIMITED 0.0074 5.8360%
7 HINDUSTAN PETROLEUM
CORPORATION LIMITED
0.0053 4.1798%
8 MARUTI SUZUKI INDIA
LTD
0.0049 3.8644%
9 TECH MAHINDRA
LIMITED
0.0005 0.3943%
10 ZEE ENTERTAINMENT
ENTERPRISES LIMITED
0.0000 0.0000%

55
Graph 4.6.1: Graph showing relative proportion of Investment
INTERPRETATION
The above graph contains a list of ten companies and its Relative proportion on
investment. BAJAJ FINANCE LIMITED has the highest volatility of relative
proportion on investment with 25.7078% followed by EICHER MOTORS LIMITED,
BAJAJ FINSERV LIMITED, JSW STEEL, HCL TECHNOLOGIES LIMITED,
TITAN COMPANY LIMITED, HINDUSTAN PETROLEUM CORPORATION
LIMITED, MARUTI SUZUKI INDIA LIMITED, TECH MAHINDRA LIMITED
AND ZEE ENTERTAINMENT ENTERPRISES LIMITED with 22.4763%,
17.5079%, 12.5397%, 7.4921%, 5.8360%, 4.1798%, 3.8644%, 0.3943% and 0.0000%
respectively. Since ZEE ENTERTAINMENT ENTERPRISES LIMITED has the least
volatility of relative proportion on investment it is suggested not to make investment on
this stock.
Xi
EICHER MOTORS LIMITED
BAJAJ FINANCE LIMITED
JSW STEEL
BAJAJ FINSERV LIMITED
HCL TECHNOLOGIES LIMITED
TITAN COMPANY LIMITED
HINDUSTAN PETROLEUMCORPORATION LIMITED
MARUTI SUZUKI INDIA LTD
TECH MAHINDRA LIMITED

56
CHAPTER 5
FINDINGS, SUGGESTIONS AND CONCLUSION

57
5.1 FINDINGS
• It is estimated that the EICHER MOTORS LTD has got the highest return of
1.0206 compared to all other 50 companies which are selected from NSE Nifty for
Construction of Portfolio
• BHARAT PETROLEUM CORPORATION LTD has the highest volatile of stock
due to systematic risk β = 2.57 and DR. REDDY’S LABORATORIES LTD has
low volatile of stock due to systematic risk β = 0.04 (β>1)
• UPL LTD has the highest risk of 71.0164 and BHARAT PETROLEUM
CORPORATION LTD has the lowest risk of -6.0573
• Standard deviation measures the investors volatility of annual stock of returns
• The 365 days T-BILLS are selected from RESERVE BANK OF INDIA i.e. 6.5%
per annum (0.125% per week) for calculating excess return of stock.
• For construction of Optimal Portfolio 50 companies was taken from NSE website
and EICHER MOTORS LTD is ranked as the first to invest.
• For Optimal portfolio construction 50 companies are selected from NSE website
and 10 companies are preferable for construction of the portfolio.
• It is observed that Sharpe’s single index model gives an easy mechanism of
constructing an optimal portfolio of stocks for a rational investor by analyzing the
reason behind the inclusion of securities in the portfolio with their respective
weights.

58
5.2 SUGGESTIONS
• According to the study BAJAJ FINANCE LTD has the highest proportion of
investment in the constructed portfolio i.e. 25.7098%. in order to earn maximum
returns the investors can invest maximum money in the BAJAJ FINANCE LTD stock
• During the study the investors are asked to ignore UPL LTD, COAL INDIA LTD,
BAJAJ AUTO LTD, DR. REDDY’S LABORATORIES LTD and OIL & NATURAL
GAS CORPORATION LTD as they all yield negative returns.
• The suggestions and recommendations are purely based on Sharpes Single Index
Model where to advice for the investors which one is preferable to purchase or sell the
securities.

59
5.3 CONCLUSION
• Study adopts an empirical research design to build optimal portfolio with leverage of
Sharpe’s Single Index Model, the stocks or the companies are selected from the
constituents of Nifty 50
• Portfolio management helps investor to get clear picture about the return and risk it
also helps investors to know which stock is preferable and which is having less risk
• Based on this 10 companies were selected for construction of optimal portfolio they
are EICHER MOTORS LIMITED, BAJAJ FINANCE LIMITED, JSW STEEL,
BAJAJ FINSERV LIMITED, HCL TECHNOLOGIES LIMITED, TITAN
COMPANY LIMITED, HINDUSTAN PETROLEUM CORPORATION LIMITED,
MARUTI SUZUKI INDIA LTD, TECH MAHINDRA LIMITED and ZEE
ENTERTAINMENT ENTERPRISES LIMITED.
• The diversification of investment helps the investors to achieve highest portfolio
return at the low risk and Sharpes Index Model helps the investors to select securities
for the construction of optimal portfolio
• It is clear that the construction of optimal portfolio investment by using SIM is easier
and more comfortable.
• SIM can show how risky a security is, if the security is held in a well diversified
portfolio.
• This study is extended to large sample that is 50 companies to get a accurate result.
• This study will contribute a lot in the field of investment finance.

BIBLIOGRAPHY
REFERENCE
1. Prakash, S., & Sundar, C. (Oct 2014). Article Quantitative Analysis of Indian
Mutual Funds : Equity Scheme. Indian Journal of Finance, 8(10), 20-31.
2. Nalini, R. (Sep 2014). An Empirical study on the Utility of Sharp Single Index
Model in Optimal Portfolio constructions. Indian Journal of Finance, 8(9), 57-67.
3. Gupta, S. K., & Rao, R. P. (Jun 2014). An Empirical Analysis of stock Markets and
economic growth after liberalization in India. Finance India, 28(2), 499-527.
4. Garge, A., & Suman. (Sep 2014). Stock market returns and volatility: A study of
five most emerging markets of World. Finance India, 28(3), 949-965.
5. Zabiulla. (Mar 2014), Portfolio strategies of fund managers in the Indian capital
market. IIMB management review, 26(1), 28-58.
6. De, S. S., & Chakraborty, T. (Jan 2015). Foreign Portfolio Investment and Stock
Market volatility in India. 9(1), 49-49.
7. Tandel, H. D. (Nov 2013). Creating an Optimal Portfolio on capital S&P BSE
Sensex using Sharp Index Model. Journal, 3(11), 2331-4245.
8. Goyal., Amiit., & Welch, I. (1999), Predicting the Equity Premium. Manuscript
Journal University of California at Los Angeles, 14, 453-890.
9. Pearson, N. D. (1991), Consumption and Portfolio Choice with Incomplete Markets
and Short Scales Constraints. The Infinity Dimensional Case, Journal of Economic
Theory, 45, 259-305.
10. Heaton, J., & Lucas, D. J. (1999) Portfolio Choice in the Presence of Background
Risk. Journal North Western University, 3, 345-458.
11. Brennan., Michael., Schwarts, E., & Lagnado, R. (1997). Strategic Assets
Allocation. Journal of Economic Dynamics and Control, 21, 1397-1403.
12. Davidson, M. (2010). Expected Return and Portfolio Rebalancing. International
Journal of Economics and Finance, 3, 15-137.
13. Till, H. (Aug 1993). Risk And Reward. Journal Fow Publications, 4, 342-420.

14. Orti, F. J., Saez, J., & Terceno, A. (2002). On the Treatment of Uncertainty in
Portfolio Selection. Journal Fuzzy Economic Review VII, 2, 165-182.
15. Henry (Apr 2006). Investor Modern Portfolio Theory’s Evolutionary Road Stock.
Journal Portfolio Construction, Money Management , 1, 112-178.
16. Du, P. AJ., & Ward, M. (2009). A Note on Applying the Portfolio Management
Investment Analysts’ Journal, 4, 78-89.
17. Fisher, D. E., & Jordan,R. J. (2000). Security Analysis and Portfolio Management
by (6thedition), Journal Pearson Publication, 6, 123-192.
18. Borkovec., Milan., Domowitz., Ian., Vitaly., & Servin. (2010). Portfolio
Optimization and The Cost of Trading, Journal of Investing, 7, 63-76.
19. Axiona, (Dec 2006). Research shows use of Multiple Risk Models Improves
Portfolio Construction Results Anonymous. Marketing Business Weekly, 6, 56-98.
20. Benari, Y. (1988). An Asset Allocation Paradigm. Journal of Portfolio Managemen,
Winter, 22-26
21. Elton, E.J. et al (1978). Optimum Portfolio from Simple Ranking Devices. Journal
of Portfolio Management, Spring, 15-19.
22. Lintner, J. (1965). Volatility of Risky Assets and the Selection of Risky
Investments in Stock Portfolio and Capital Budget. Review of Economics and
Statistics, 47, 13-37.
23. Mossin, J. (1966). Equilibrium in Capital Asset Market. Econometrica, 35, 768-
783.
24. Sharpe, W.F. (1964). Capital Asset Prices: A Theory of Market Equilibrium under
Condition of Risk. Journal of Finance, 19, 425-442.
25. Sharpe, W.F. (1963). A Simplified Model for Portfolio Analysis. Management
Science, 9, Jan, 277-93.
26. Sinaee, H. and Moradi, H. (2010). Risk-Return Relationship in Iran Stock Market.
International Research Journal of Finance and Economics, 41, 10-17.

BOOKS REFERRED
• Fundamentals of Investment – Alexander, Sharpe, Bailey, 3/e, PHL, 2001.
• Security Analysis & Portfolio Management – Nagaranjan K & Jayabal G, 1st
Edition, New Age International, 2011.
• Security Analysis & Portfolio Management – Dhanesh Khatri, 1st Edition,
Macmillan, 2010.
• Security Analysis & Portfolio Management – Talwar, 1st Edition, Cengage, 2016.
WEBSITE
➢ www.bseindia.com
➢ www.nseindia.com
➢ www.rbi.com
➢ www.moneycontrol.com
➢ www.riskcontrol.com

ANNEXURE
COMPANY MEAN RETURN
BHARTI INFRATEL LTD
0.3264
TATA MOTORS LTD
0.2010
BHARAT PETROLEUM CORPORATION
LTD
0.5695
AXIS BANK LTD
0.3888
INDIAN OIL CORPORATION
0.4346
STATE BANK OF INDIA
0.1902
BHARTI AIRTEL LTD
0.2263
OIL & NATURAL GAS CORPORATION
LTD
0.0232
MAHINDRA AND MAHINDRA LTD
0.2762
HINDUSTAN PETROLEUM
CORPORATIONS LTD
0.7861
HOUSING DEVELOPMENT FINANCE
CORPORATION LTD
0.3910
ASIAN PAINTS LTD
0.3823
INDIABULLS HOUISNG FINANCE LTD
0.7980
GRASIM INDUSTRIES LTD
0.4121
NTPC LTD
0.1362
MARUTI SUZUKI INDIA LTD
0.7701
DR. REDDY’S LABORATORIES LTD
0.1209
BAJAJ AUTO LTD
0.1177
POWER GRID CORPORATIONS OF
INDIA LTD
0.2798
EICHER MOTORS LTD
1.0206

TATA STEEL LTD
0.3858
ADANI PORTS AND SPECIAL
ECONOMIC ZONE LTD
0.4899
ITC LTD
0.1585
YES BANK LTD
0.6486
UPL LTD
-2.2061
KOTAK MAHINDRA BANK LTD
0.5123
HDFC BANK LTD
0.4573
JSW STEEL
0.6436
BAJAJ FINANCE LTD
1.1531
VEDANTA LTD
0.4342
HERO MOTOCROP LTD
0.3984
SUN PHARMACEUTICAL INDUSTRIES
LTD
0.1448
ICICI BANK LTD
0.2701
COAL INDIA LTD
0.0464
BAJAJ FINSERV LTD
0.8247
HINDALCO INDUSTRIES LTD
0.4783
ZEE ENTERTAINMENT ENTERPRISES
LTD
0.4597
RELIANCE INDUSTRIES LTD
0.3696
INDUSIND BANK LTD
0.6463
GAIL (INDIA) LTD
0.3217
CIPLA LTD
0.1913
ULTRATECH CEMENT LTD
0.3738

TITAN COMPANY LTD
0.6019
LARSEN & TURBO LTD
0.3792
WIPRO LTD
0.1377
HINDUSTAN UNILEVER LTD
0.4560
HCL TECHNOLOGIES LTD
0.4232
INFOSYS LTD
0.2316
TATA CONSULTANCY SERVICES LTD
0.2970
TECH MAHINDRA LTD
0.4480
Compilation is based on
1. Data: Weekly share prices of sampled securities and weekly market index
2. Period: 1st April 2013 to 31st March 2018

ACHARYA INSTITUTE OF TECHNOLOGY
DEPARTMENT OF MBA
ACHARYA PROJECT(17MBAPR407)-WEEKLY REPORT
NAME OF THE STUDENT: V.H.RAMASUBRAMANIAN
INTERNAL GUIDE: MALLIKA.B.K
USN: lIAl 7MBA59
COMPANY NAME: ANANDRATHI SHARES AND STOCK BROKERS LIMITED
WEEK WORK UNDERTAKEN
3rd Jan 2019 - 9th Industry Profile and Company Jan 2019 Profile
10th Jan 2019 -l 7th Jan 2019
18th Jan2019 -25th Jan 201,
26th Jan 2019-2ndFeb 2019
Preparation of Research instrument for data collection
Data collection
Analysis and finalization of report
Jrd Feb 2019 - 9th
Feb 2019 Fin dings and Suggestions
10th feb2019 -161h Feb 2019 Conclusion and Final Report
College Seal
EXTERNAL GUIDE
SIGNATURE
H
INTERNAL GUIDE
SIGNATURE
- . ~ . . . .
, ~ I ; ., : •_, I I •• u • ;
-, .. \ · · : .. : . :~, r . :· .: ~ . . . · ,_ ~ .6
;, ~~~- ~,, .... -~-~: .;~ J 1
1 0 i