Indian Case Study on ZLDIndian Case Study on ZLD -The ... Case Study on ZLDIndian Case Study on ZLD...
77
Indian Case Study on ZLD Indian Case Study on ZLD -The Tirupur The Tirupur Indian Case Study on ZLD Indian Case Study on ZLD The Tirupur The Tirupur Textile cluster experience Textile cluster experience 28 th January, 2014 I. Sajid Hussain, Chief Operating Officer Tamilnadu Water Investment Company Limited. www.twic.co.in www.twic.co.in [email protected]
Transcript of Indian Case Study on ZLDIndian Case Study on ZLD -The ... Case Study on ZLDIndian Case Study on ZLD...
Indian Case Study on ZLDIndian Case Study on ZLD --The TirupurThe TirupurIndian Case Study on ZLD Indian Case Study on ZLD The Tirupur The Tirupur Textile cluster experienceTextile cluster experience
28th January, 2014
I. Sajid Hussain, Chief Operating OfficerTamilnadu Water Investment Company Limited.
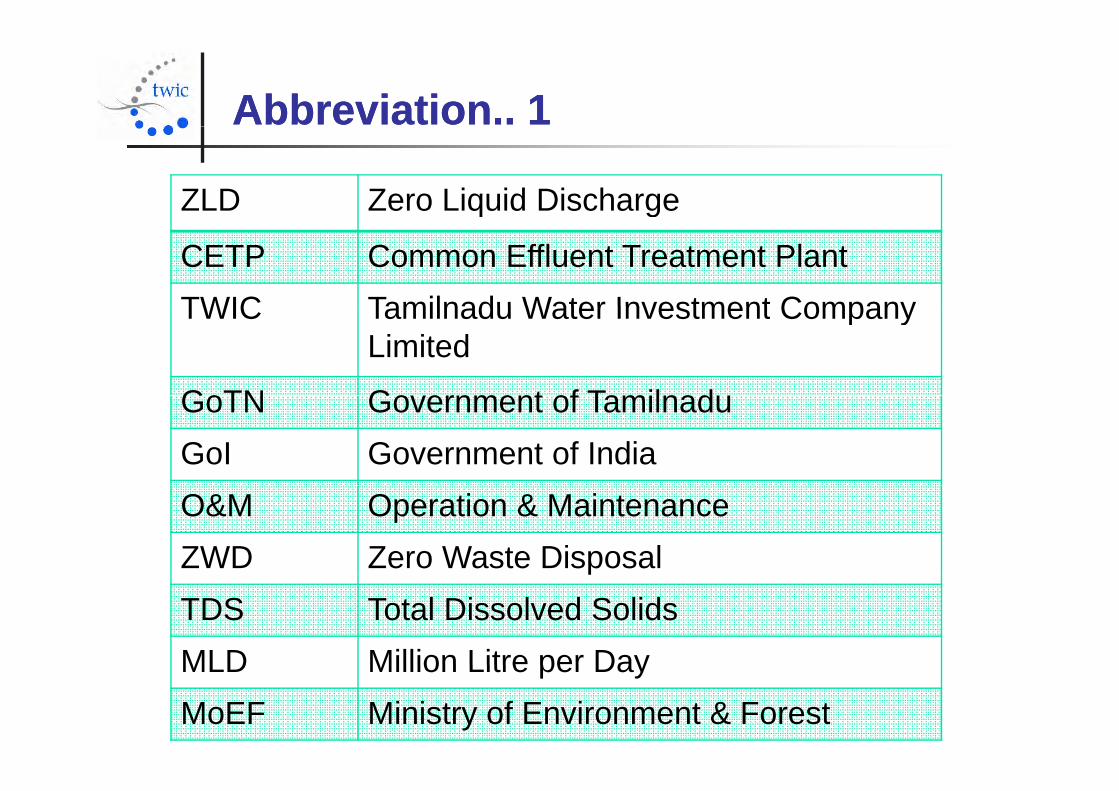
Abbreviation.. 1Abbreviation.. 1
ZLD Zero Liquid Dischargeq g
CETP Common Effluent Treatment PlantTWIC Tamilnadu Water Investment CompanyTWIC Tamilnadu Water Investment Company
Limited
GoTN Go ernment of TamilnadGoTN Government of TamilnaduGoI Government of IndiaO&M Operation & MaintenanceZWD Zero Waste DisposalTDS Total Dissolved SolidsMLD Million Litre per DayMLD Million Litre per DayMoEF Ministry of Environment & Forest
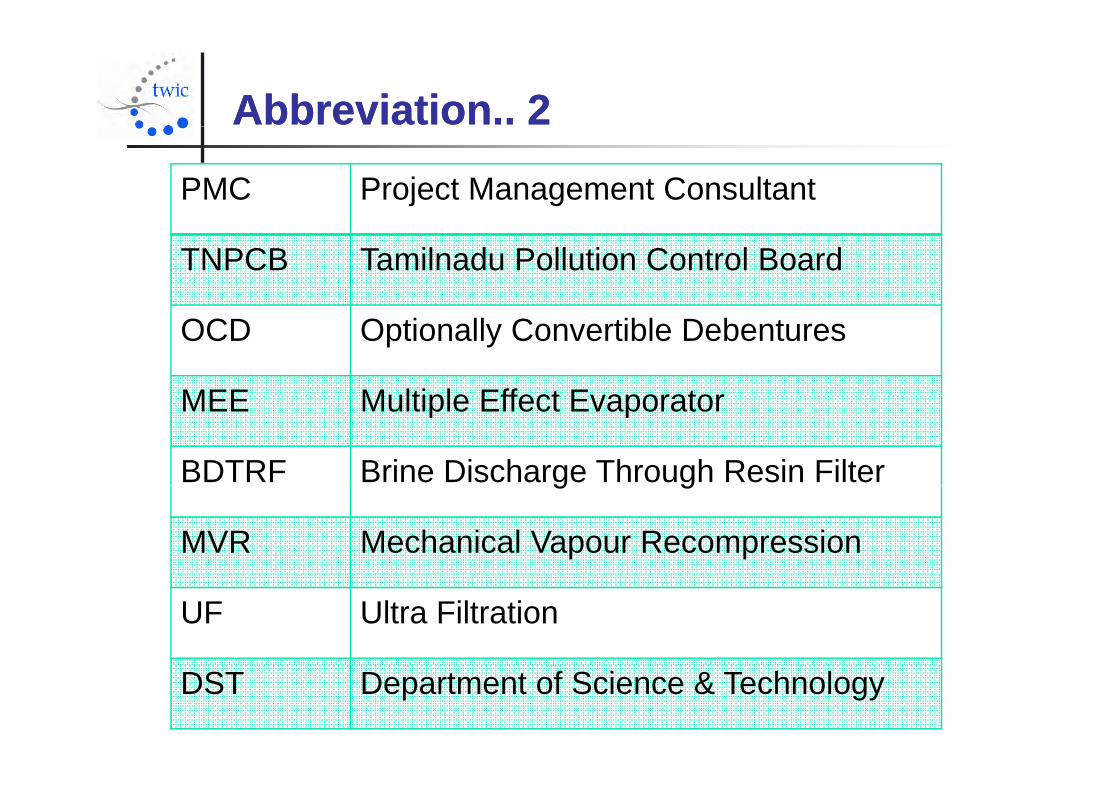
Abbreviation.. 2Abbreviation.. 2
PMC Project Management Consultant
TNPCB Tamilnadu Pollution Control Board
OCD Optionally Convertible Debentures
MEE Multiple Effect EvaporatorMEE Multiple Effect Evaporator
BDTRF Brine Discharge Through Resin Filterg g
MVR Mechanical Vapour Recompression
UF Ultra Filtration
DST Department of Science & Technology
CONTENTSCONTENTSSection A : Introduction to TWIC
Section B : Concept of ZLD
Section C : Brief on Tirupur CETP’Sp
Section D : Technical Challenges andSection D : Technical Challenges and
how it was overcome.
CONTENTSCONTENTSSection E : Our Technical solution to the
problem
Section F : Case Study of A Textile CETP
- Arulpuram CETP
Section G : The Way Forward
Section H :Approach to ZLD
Section I : Conclusions
Section A: Introduction to TWICSection A: Introduction to TWIC
GenesisGenesisGenesisGenesis
TWIC f d t t th fi t PPP i t TWIC was formed to promote the first PPP in waterSector, namely the New Tirupur Water Project (185MLD 1000 Crore)MLD, 1000 Crore)
Promoted by Infrastructure Leasing and FinancialPromoted by Infrastructure Leasing and FinancialServices Limited (IL&FS) [54%] and Government ofTamil Nadu (GoTN) [46%]( ) [ ]
Over the last few years, TWIC has been in the forefronty ,of a number of initiatives both in the urban water spaceas well management of industrial effluent
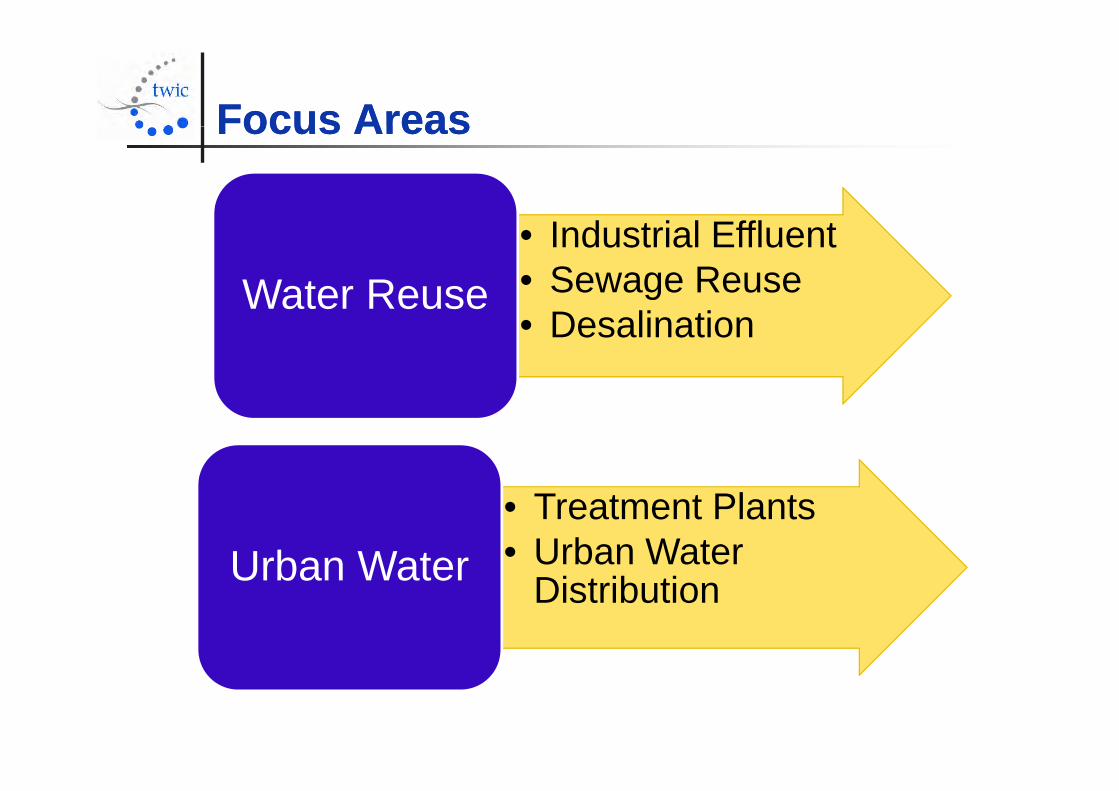
Focus AreasFocus AreasFocus AreasFocus Areas
• Industrial Effluent• Sewage ReuseWater Reuse• Desalination
Water Reuse
• Treatment Plants• Treatment Plants• Urban Water Urban Water DistributionUrban Water
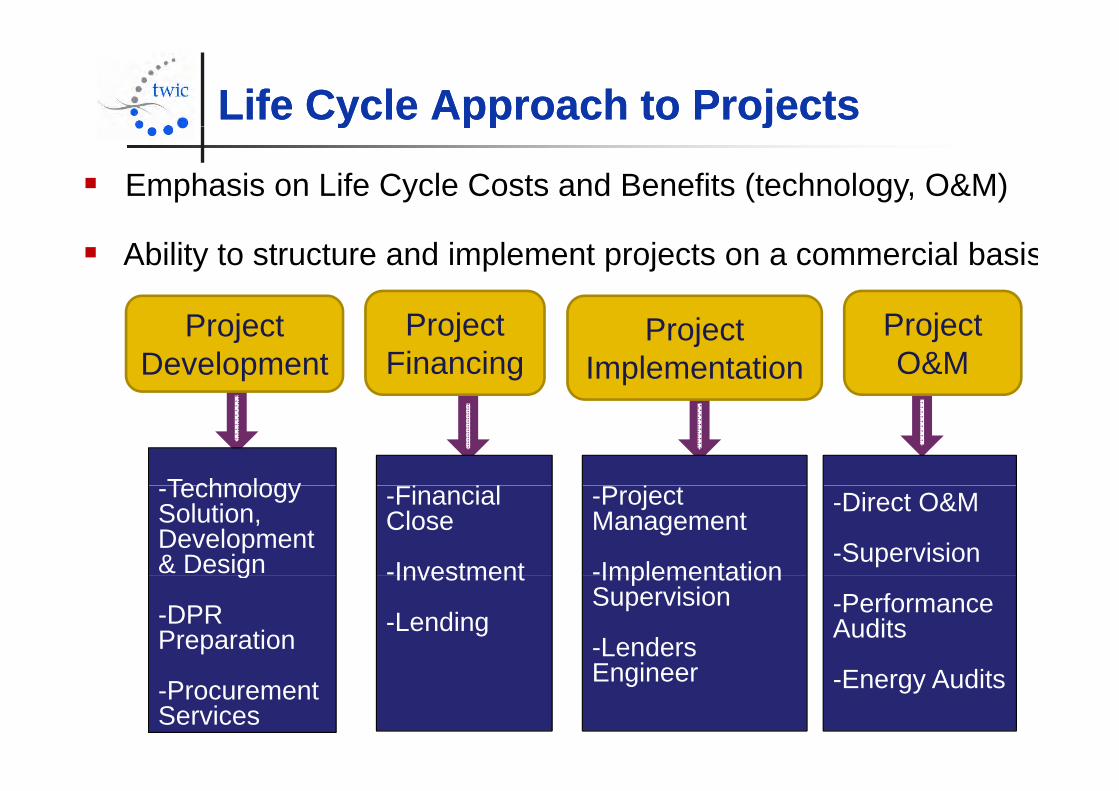
Life Cycle Approach to ProjectsLife Cycle Approach to Projectsy pp jy pp j
Emphasis on Life Cycle Costs and Benefits (technology, O&M)
Ability to structure and implement projects on a commercial basis
Project Development
Project Financing
Project Implementation
Project O&M
Technology-Technology Solution, Development & Design
-Financial Close
-Investment
-Project Management
-Implementation
-Direct O&M
-Supervisiong
-DPR Preparation
Investment
-Lending
Implementation Supervision
-Lenders E i
-Performance Audits
-Procurement Services
Engineer -Energy Audits
Section B: Concept of ZLDSection B: Concept of ZLD
Concept of ZLDConcept of ZLDpp
ZLD – meaning zero discharge of wastewater from ZLD meaning zero discharge of wastewater fromIndustries.
A ZLD system involves a range of advanced wastewater A ZLD system involves a range of advanced wastewatertreatment technologies to recycle, recovery and re-use ofthe ‘treated’ wastewater and thereby ensure there is noydischarge of wastewater to the environment.
A typical ZLD system comprises of the followingyp y p gcomponents:
Pre-treatment (Physico-chemical & Biological)Pre treatment (Physico chemical & Biological)
Reverse Osmosis (Membrane Processes)
E t & C t lli (Th l P ) Evaporator & Crystallizer (Thermal Processes)
Need for ZLD .. 1Need for ZLD .. 1 Most polluting industries such as Pharma, Pulp& Paper,
Tanneries, Textile Dyeing, Chemicals , Power Plants etcgenerate wastewater with high salinity/TDS.
Conventional ‘Physico-chemical-biological’ treatment doesnot remove salinity in the treated effluent. The TDS content isywell above the statutory limit of 2100 mg/l.
Discharge of saline but treated wastewater pollutes ground Discharge of saline but treated wastewater pollutes groundand surface waters.
Several states in India including Tamilnadu are waterstressed. Competing demands for water from agriculture anddomestic use has limited industrial growth.
Need for ZLD .. 2Need for ZLD .. 2 TN has taken a lead on ZLD due to absence of fully flowing
perennial river Most rivers originate from neighboring statesand water sharing is enmeshed in disputes. Several landmarkpollution cases and court battles have hastened this, such asthe Vellore and Tirupur court cases. Other states such asGujarat and Karnataka also are now are considering ZLD.
Location of industries in ‘Inland areas’ and issues related tosea discharge of ‘treated’ wastewater.
Hi h t f t (> R 40) d t t t l ti High cost of water (> Rs. 40) and statutory regulations areprime drivers for ZLD.
MAIN MOTIVATORS- Water Scarcity, water economics,regulatory pressure.
International Context .. 1International Context .. 1 In the early seventies, increased salinity of the United States
C l d Ri d t P Pl t di h t d thColorado River, due to Power Plant discharges, created theregulatory context to push for ZLD in the US.
For new industrial projects, where gaining an approval for adischarge agreement might traditionally take five years withdischarge agreement might traditionally take five years, withZLD it could be a matter of 12 months. As a result, ZLDt h l ff ti l l d i th US d l ttechnology effectively evolved in the US and later grewglobally.
In Germany, stringent regulation in the 1980’s resulted in ZLDsystems for Coal Fired Power Plantssystems for Coal Fired Power Plants.
(Source GWI)(Source GWI)
International Context .. 2International Context .. 2
In China, a chemical company Yunnan Yuntianhua (YTH, p y (
Group)for a Coal-to-Chemicals plant in an environmentally
iti l ti f th l t l d i Chisensitive location, one of the largest grasslands in China
(inner Mongolia)has gone in for ZLD. This is paving the way
for more such projects in the region.
ZLD system for the tanning sector in Lorca, Spain is based
on membrane techniques, designed to lower the waterq , g
salinity to levels suitable for re-use at an agricultural and
i d t i l l lindustrial level.
Benefits of ZLDBenefits of ZLDBenefits of ZLDBenefits of ZLD
Installing ZLD technology is beneficial for the plant’s waterg gy pmanagement; encouraging close monitoring of water usage,avoiding wastage and promotes recycling by conventional
d f l i l tiand far less expensive solutions.
High operating costs can be justified by high recovery oft ( 90 95%) d i f l b d t fwater (>90-95%) and recovering of several by products from
the salt.
A more sustainable growth of the industry while meetingmost stringent regulatory norms.
Possibility of use of sewage for recovery of water, forIndustrial and municipal use, using ZLD technologies.
Reduction in water demand from the Industry frees up waterfor Agriculture and Domestic demands.
Challenges in ZLDChallenges in ZLD “Is the Holy Grail of Industrial wastewater Treatment...” Global
Water Intelligence
Challenges in ZLDChallenges in ZLD
Water Intelligence. ZLD results in generation of hazardous solid wastes creating
disposal challenges- need to think of Zero Waste Disposal (ZWD) Plants. Generate products/ by-products out of the waste.
Economic viability- cost and availability of water, regulatorypressure are the real driving force.
High Carbon foot print- is this environmentally sustainable?g p y High Operating cost and financial impact on the industry and
its Regional/ National/Global competitivenessits Regional/ National/Global competitiveness. Technology shortcomings.
Section C: Brief on Tirupur Textile CETP’s
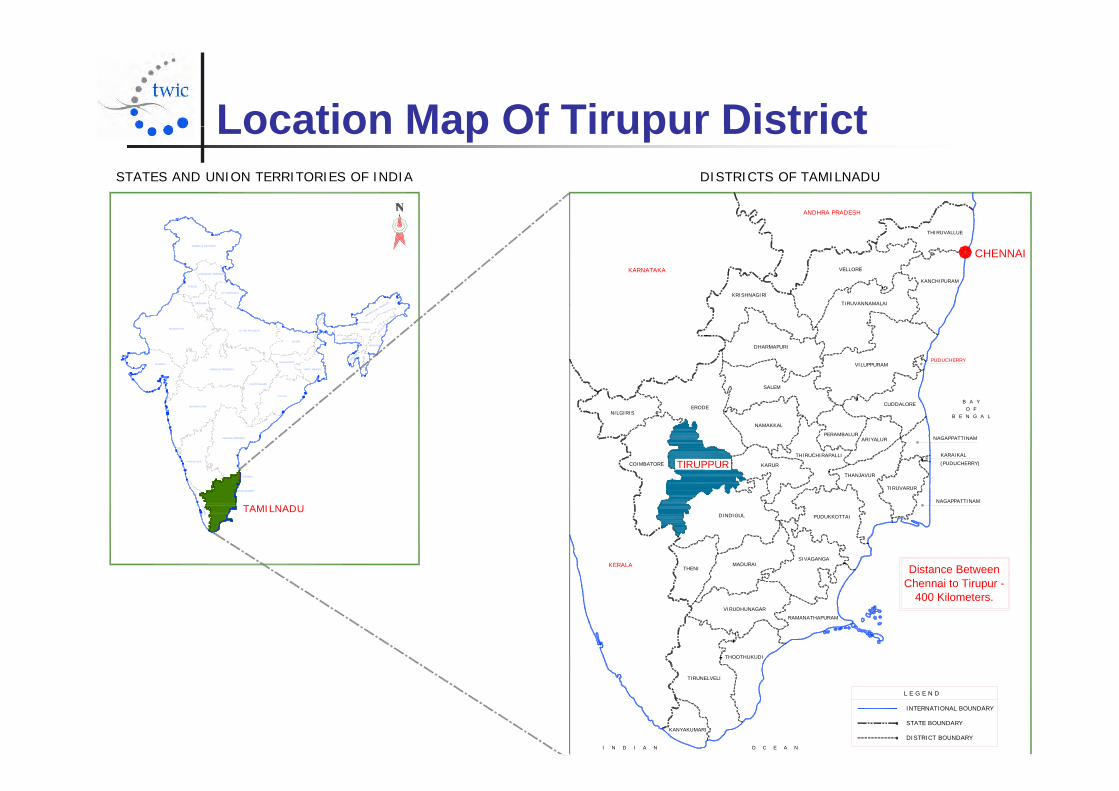
Location Map Of Tirupur DistrictLocation Map Of Tirupur District
ANDHRA PRADESH
STATES AND UNION TERRITORIES OF INDIA DISTRICTS OF TAMILNADU
KARNATAKA
THIRUVALLUE
CHENNAIVELLORE
KANCHIPURAM
TIRUVANNAMALAIKRISHNAGIRI
RADESHHARYANA
UTTARANCHAL
PUNJAB
HIMACHAL PRADESH
JAMMU & KASHMIR
DHARMAPURI
VILUPPURAM
SALEM
PUDUCHERRY
UTTAR PRADESH
ARUNACHAL PRAD
NAGA
LAND
MANIPUR
TRIP
URA
MIZ
ORAM
ASSAM
MEGHALAYA
RAJASTHAN
GUJARAT
WEST BENGAL
JHARKHAND
ORISSA
CHATTISGARH
MADHYA PRADESH
BIHAR
SIKK
IM
DELHI
B A YO F
B E N G A L
ERODE
NAMAKKAL
THIRUCHIRAPALLI
PERAMBALURARIYALUR
CUDDALORE
NAGAPPATTINAM
THANJAVUR
COIMBATORE TIRUPPUR KARUR
NILGIRIS
KARAIKAL(PUDUCHERRY)KARNATAKA
ANDHRA PRADESH
CHENNAI
ORISSA
MAHARASTRA
GO
A
KERALA
TIRUVARUR
PUDUKKOTTAI
SIVAGANGAMADURAI
DINDIGUL
THENI
NAGAPPATTINAM
KERALA TAMILNADU
PONDICHERRY
Distance Between
RAMANATHAPURAM
VIRUDHUNAGAR
THOOTHUKUDI
Chennai to Tirupur -400 Kilometers.
I N D I A N O C E A N
TIRUNELVELI
KANYAKUMARISTATE BOUNDARY
DISTRICT BOUNDARY
L E G E N D
INTERNATIONAL BOUNDARY
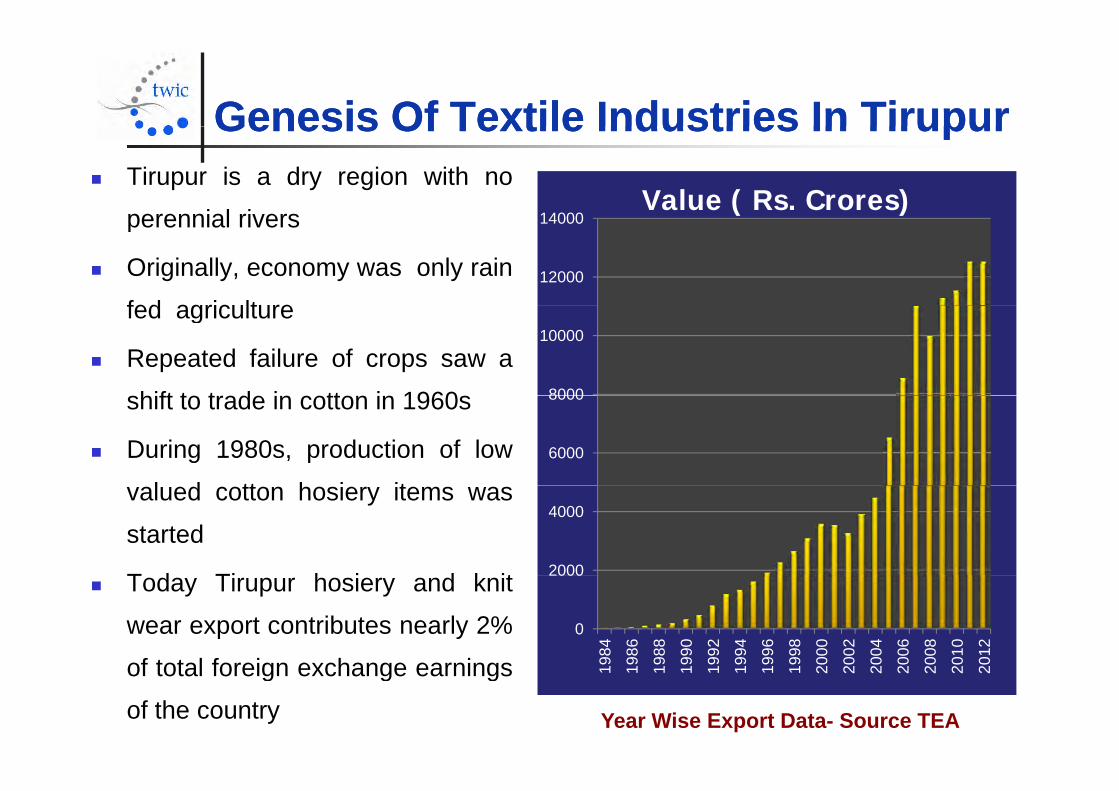
Genesis Of Textile Industries In TirupurGenesis Of Textile Industries In TirupurGenesis Of Textile Industries In TirupurGenesis Of Textile Industries In Tirupur Tirupur is a dry region with no
perennial rivers 14000Value ( Rs. Crores)
perennial rivers
Originally, economy was only rain
fed agriculture12000
14000
fed agriculture
Repeated failure of crops saw a
hift t t d i tt i 1960 8000
10000
shift to trade in cotton in 1960s
During 1980s, production of low
l d tt h i it6000
8000
valued cotton hosiery items was
started
T d Ti h i d k it 2000
4000
Today Tirupur hosiery and knit
wear export contributes nearly 2%
of total foreign exchange earnings0
2000
984
986
988
990
992
994
996
998
000
002
004
006
008
010
012
of total foreign exchange earnings
of the country
1 1 1 1 1 1 1 1 2 2 2 2 2 2 2
Year Wise Export Data- Source TEA
Brief History..1Brief History..1Brief History..1Brief History..1 Based on the directions of the Madras High Court and TNPCB
in 2005 the bleaching and dyeing units in Tirupur implementedin 2005 the bleaching and dyeing units in Tirupur implementedCETPs and IETPs to meet the Zero Liquid Discharge (ZLD)norms
The broad technology adopted by the effluent treatment plantsconsists of a pre treatment system followed by water recoverysystem (using reverse osmosis) and the reject managementsystem (using reverse osmosis) and the reject managementsystem (based on evaporator)
450 units collectively have set up 20 CETPs while balance 450 units collectively have set up 20 CETPs while balance150 units have set up their own individual effluent treatmentplants (IETPs). TWIC was engaged by 9 CETPs
The total investment in this treatment system is estimated tobe Rs.800 crores (for 20 CETPs). This investment has beenlargely funded by the bleaching and dyeing units (20 to 30%)largely funded by the bleaching and dyeing units (20 to 30%)and the balance has been arranged through commercialbanks as loans (70 to 80%)
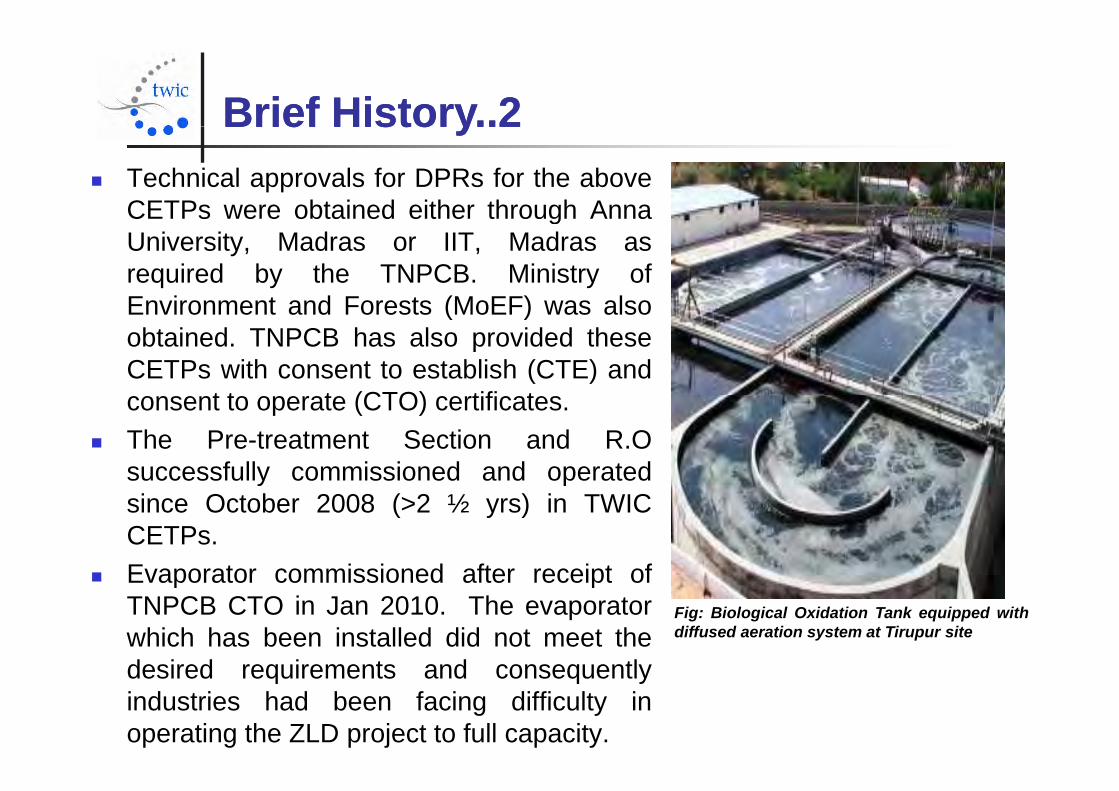
Brief History..2Brief History..2Brief History..2Brief History..2 Technical approvals for DPRs for the above
CETPs were obtained either through AnnaCETPs were obtained either through AnnaUniversity, Madras or IIT, Madras asrequired by the TNPCB. Ministry ofEnvironment and Forests (MoEF) was alsoEnvironment and Forests (MoEF) was alsoobtained. TNPCB has also provided theseCETPs with consent to establish (CTE) and
t t t (CTO) tifi tconsent to operate (CTO) certificates. The Pre-treatment Section and R.O
successfully commissioned and operatedy psince October 2008 (>2 ½ yrs) in TWICCETPs.
Evaporator commissioned after receipt of Evaporator commissioned after receipt ofTNPCB CTO in Jan 2010. The evaporatorwhich has been installed did not meet thedesired requirements and consequently
Fig: Biological Oxidation Tank equipped withdiffused aeration system at Tirupur site
desired requirements and consequentlyindustries had been facing difficulty inoperating the ZLD project to full capacity.
Brief History..3Brief History..3yy TWIC also developed alternate solution which would reduce load on
the evaporator. These proposals had been submitted to TNPCB by theCETP f lCETPs for approval
In Oct 2010, GoTN/GoI sanctioned Rs 320 Cr as subsidy for the 20CETPs. So far 50% of the amount has been disbursed
In August 2010, a petition of contempt of court was filed in the MadrasHigh Court in August 2010. While disposing of the case after varioushearings Madras High Court closed all the industries in Tirupurhearings, Madras High Court closed all the industries in Tirupurthrough the order of January 31, 2011
The order stated that in case the industries have to reopen andd t t i l th ld d t ti f th TNPCB d th tconduct trial runs, they would need to satisfy the TNPCB and the court
appointed committee of their readiness TWIC made a presentation to GoTN in June 2011 on re-opening ofp p g
CETPs for demonstration of ZLD based on “brine reuse technology”. Itwas proposed to demonstrate this in one CETP for a 3 month periodand thereafter on successful demo, implement the same in otherCETPs. Required funding for modifications was also indicated. Thiswas accepted by GoTN and necessary orders for demonstration atArulpuram CETP and also funding for 20 CETPs was announced.

Tirupur Textile Effluent Management Tirupur Textile Effluent Management Project, Tirupur.. 1Project, Tirupur.. 1Project, Tirupur.. 1Project, Tirupur.. 1
Project: TWIC has developed and established 9 Textiledyeing CETPs with a capacities ranging from 3 MLD to 11dyeing CETPs with a capacities ranging from 3 MLD to 11MLD(Combined Capacity 53 MLD) in Tirupur based on ZeroLiquid Discharge. The major components are BIOT, RO,Liquid Discharge. The major components are BIOT, RO,Evaporator and Pipeline.
Project Cost : Rs 572 Croresj TWIC Role : TWIC has supported the Client in the following
areas, Preparation of Detailed Project Report Selection of Technology & Preparation of Project Specification D i E i i P t f t t Design Engineering, Procurement of contractor Arranging Finance for the project Implementation Supervision Implementation Supervision O&M for 15 yrs as Independent Operator as advised by GoTN.
Tirupur Textile Effluent Management Tirupur Textile Effluent Management Project Tirupur 2Project Tirupur 2
Benefits of this Project:The project for ZLD is perhaps the first of its kind in the world
Project, Tirupur.. 2Project, Tirupur.. 2
The project for ZLD is perhaps the first of its kind in the world.Key benefits of the project are Recycling >98% of the water.y g Reuse of > 90% of the salt. Cleaning of the local environment
Current status TWIC has also developed an alternate technology called
“T t d B i R T h l ” hi h b t ti ll“Treated Brine Reuse Technology” which substantiallyreduces the dependence on the evaporators.
Technology demonstration has enabled reopening of the Technology demonstration has enabled reopening of thedyeing units after closure by high court.
This has been successfully demonstrated at Arulpuram This has been successfully demonstrated at ArulpuramCETP and is now being implement in the remaining 6TWIC developed CETPs.
Tirupur Textile Effluent Management Tirupur Textile Effluent Management Project Tirupur 3Project Tirupur 3Project, Tirupur.. 3Project, Tirupur.. 3
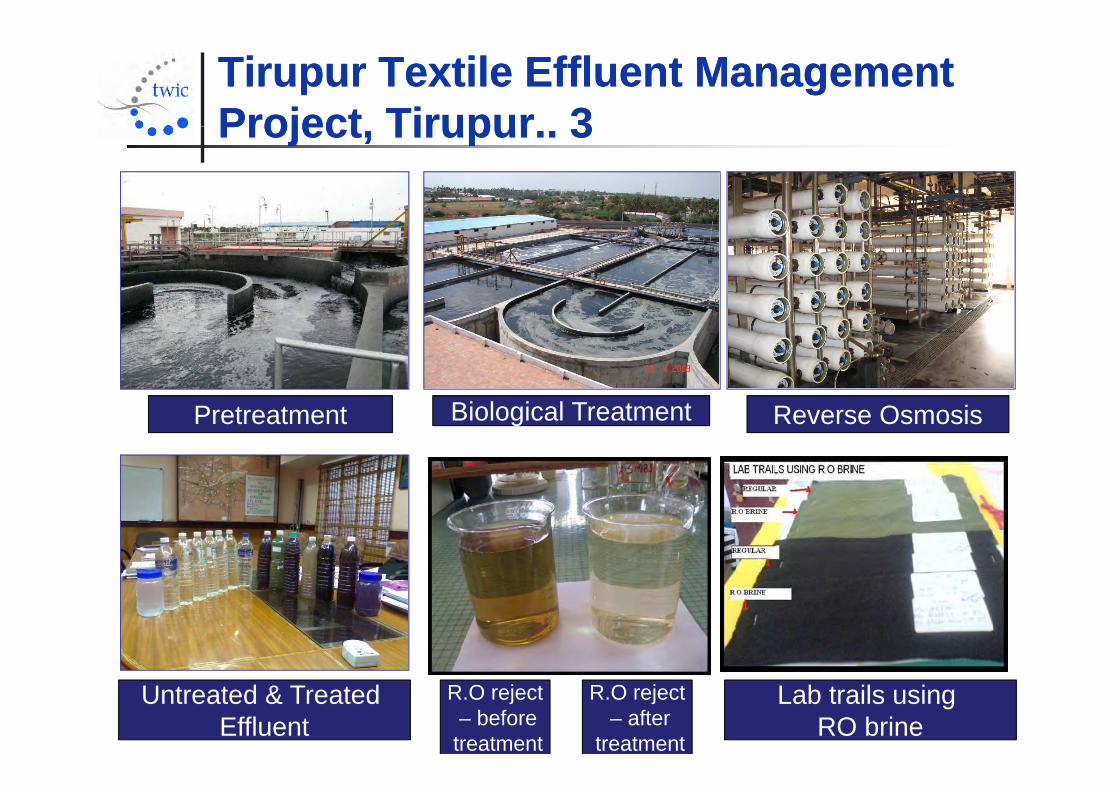
Pretreatment Biological Treatment Reverse Osmosis
Untreated & Treated Effluent
Lab trails using RO brine
R.O reject– beforetreatment
R.O reject– after
treatment
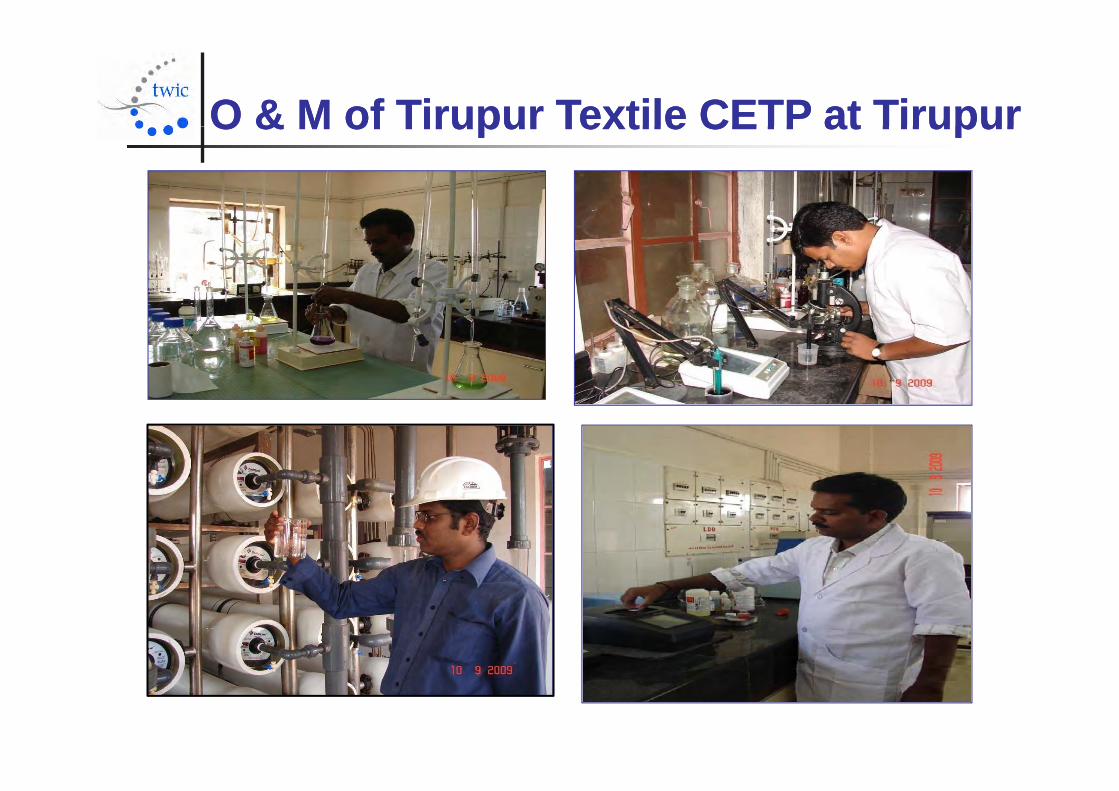
OO & M of Tirupur Textile CETP at Tirupur& M of Tirupur Textile CETP at TirupurO O & M of Tirupur Textile CETP at Tirupur& M of Tirupur Textile CETP at Tirupur
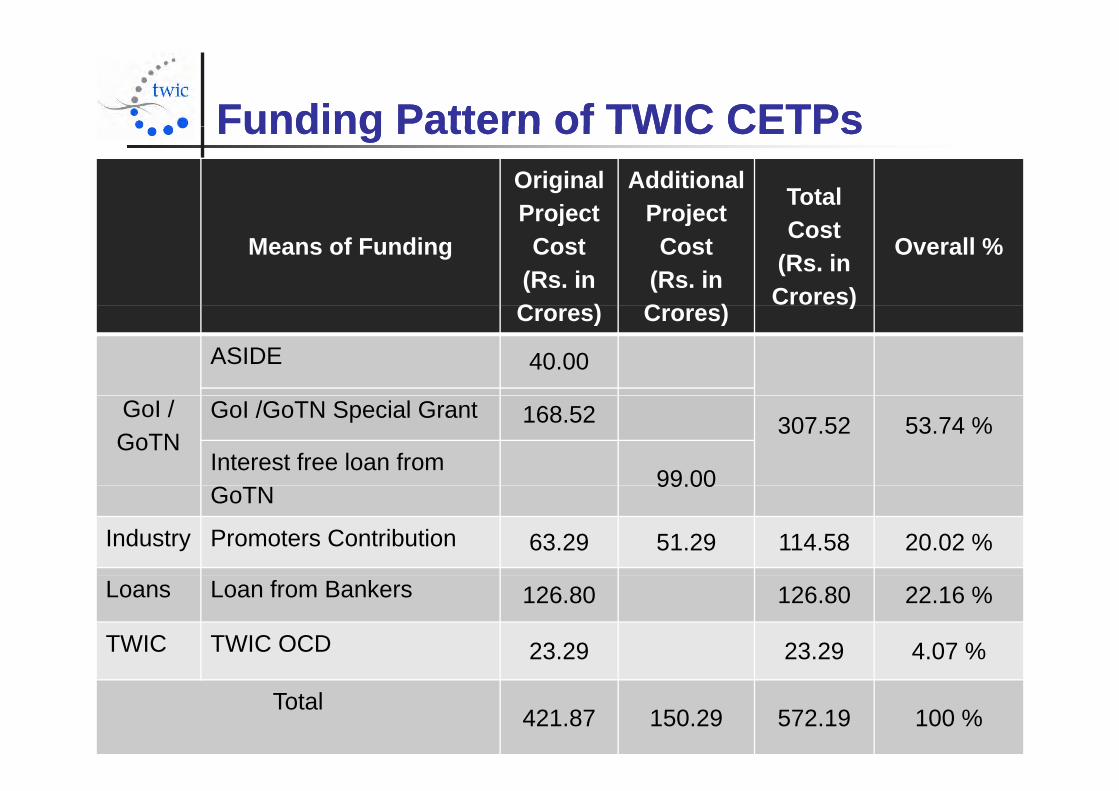
Funding Pattern of TWIC CETPsFunding Pattern of TWIC CETPsOriginalProject
Additional Project Total
Funding Pattern of TWIC CETPsFunding Pattern of TWIC CETPs
Means of FundingProject
Cost (Rs. in C )
Project Cost
(Rs. in C )
Cost (Rs. in Crores)
Overall %
Crores) Crores) )
ASIDE 40.00
GoI / GoTN
307.52 53.74 %GoI /GoTN Special Grant 168.52
Interest free loan from 99.00
GoTN99.00
Industry Promoters Contribution 63.29 51.29 114.58 20.02 %
Loans Loan from Bankers 126.80 126.80 22.16 %
TWIC TWIC OCD 23.29 23.29 4.07 %
Total421.87 150.29 572.19 100 %
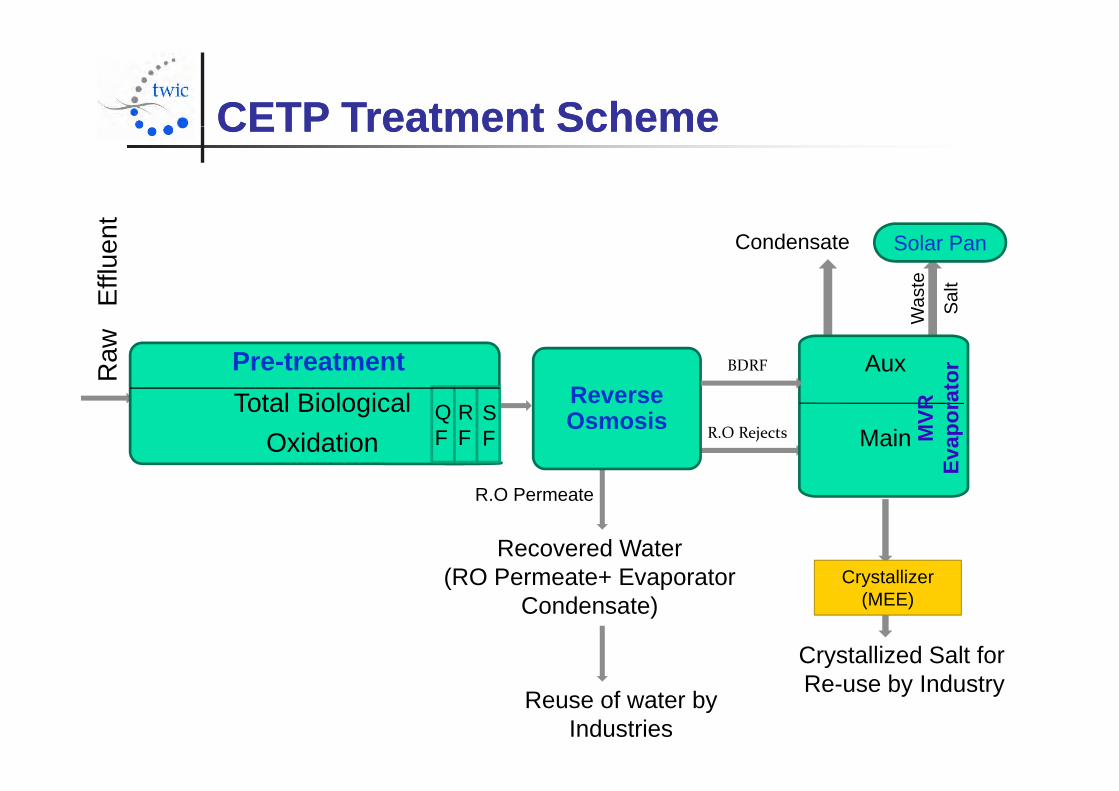
CETPCETP Treatment SchemeTreatment SchemeCETP CETP Treatment SchemeTreatment Scheme
Condensate
Effl
uent
aste
Salt
Solar Pan
Reverse
Raw
Wa S
T t l Bi l i lPre-treatment Aux
R atorBDRF
R.O Rejects
Reverse Osmosis
Total Biological Oxidation
QF
RF
SF Main M
VREv
apor
a
Recovered Water (RO Permeate+ Evaporator
R.O Permeate
Crystallizer(RO Permeate+ Evaporator Condensate)
Crystallized Salt for
Crystallizer (MEE)
Reuse of water by Industries
yRe-use by Industry
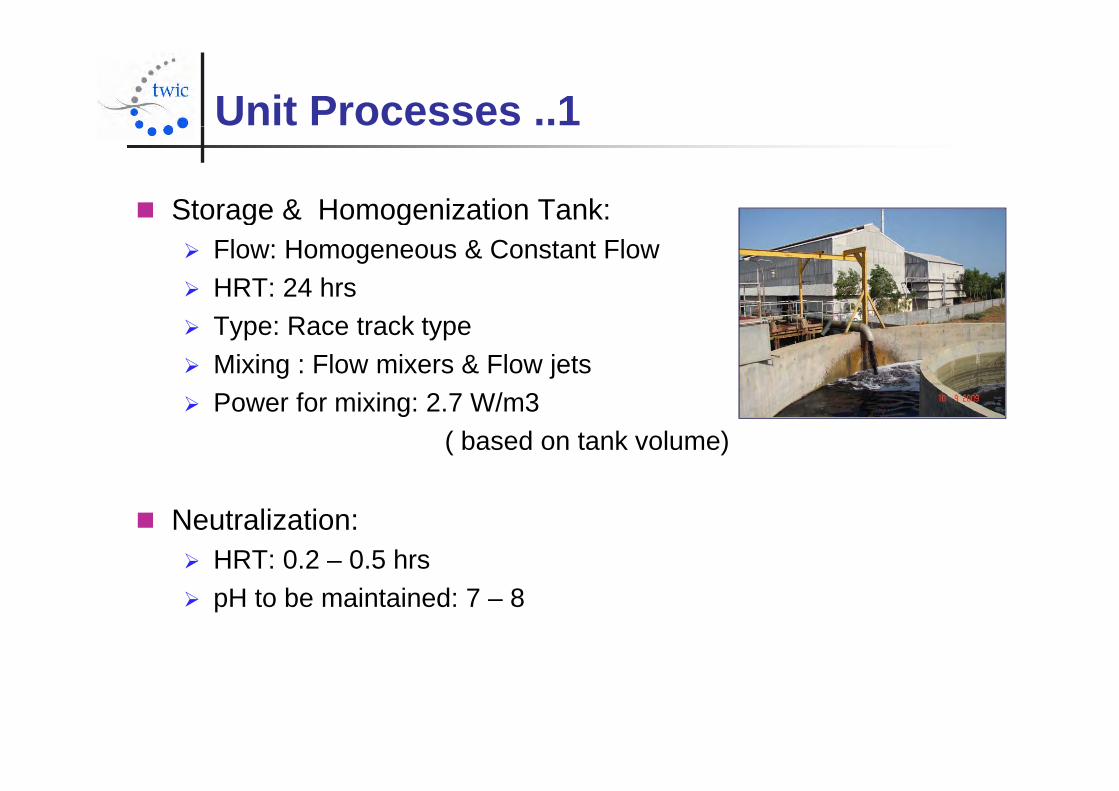
Unit Processes ..1
Storage & Homogenization Tank: Storage & Homogenization Tank: Flow: Homogeneous & Constant Flow HRT: 24 hrs Type: Race track type Mixing : Flow mixers & Flow jets
P f i i 2 7 W/ 3 Power for mixing: 2.7 W/m3 ( based on tank volume)
Neutralization: HRT: 0.2 – 0.5 hrs pH to be maintained: 7 – 8
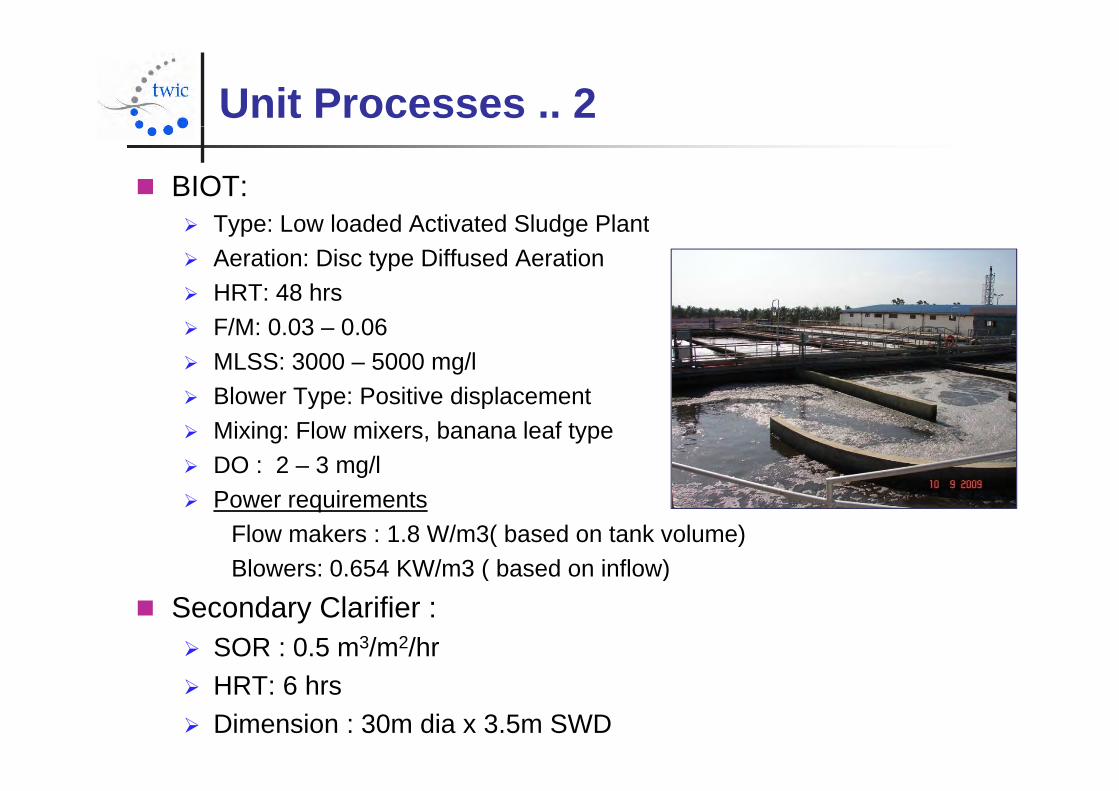
Unit Processes .. 2
BIOT:T L l d d A ti t d Sl d Pl t Type: Low loaded Activated Sludge Plant
Aeration: Disc type Diffused Aeration HRT: 48 hrs F/M: 0.03 – 0.06 MLSS: 3000 – 5000 mg/l Blower Type: Positive displacement Blower Type: Positive displacement Mixing: Flow mixers, banana leaf type DO : 2 – 3 mg/l Power requirements
Flow makers : 1.8 W/m3( based on tank volume)Blowers: 0.654 KW/m3 ( based on inflow)Blowers: 0.654 KW/m3 ( based on inflow)
Secondary Clarifier : SOR : 0.5 m3/m2/hr HRT: 6 hrs Dimension : 30m dia x 3.5m SWD
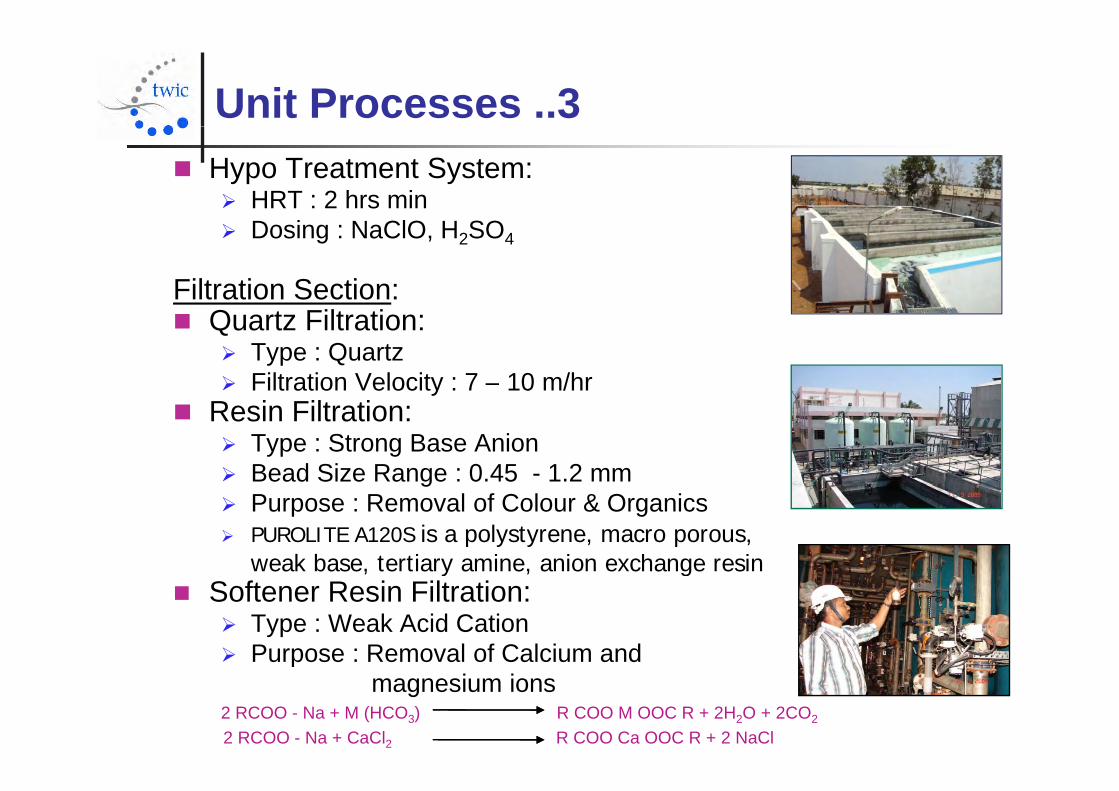
Unit Processes ..3 Hypo Treatment System:
HRT : 2 hrs min Dosing : NaClO, H2SO4
Filtration Section: Quartz Filtration:
Type : Quartz Filtration Velocity : 7 – 10 m/hry
Resin Filtration: Type : Strong Base Anion Bead Size Range : 0.45 - 1.2 mmg Purpose : Removal of Colour & Organics PUROLITE A120S is a polystyrene, macro porous,
weak base, tertiary amine, anion exchange resin, y , g Softener Resin Filtration:
Type : Weak Acid Cation Purpose : Removal of Calcium andp
magnesium ions2 RCOO - Na + M (HCO3) R COO M OOC R + 2H2O + 2CO2
2 RCOO - Na + CaCl2 R COO Ca OOC R + 2 NaCl
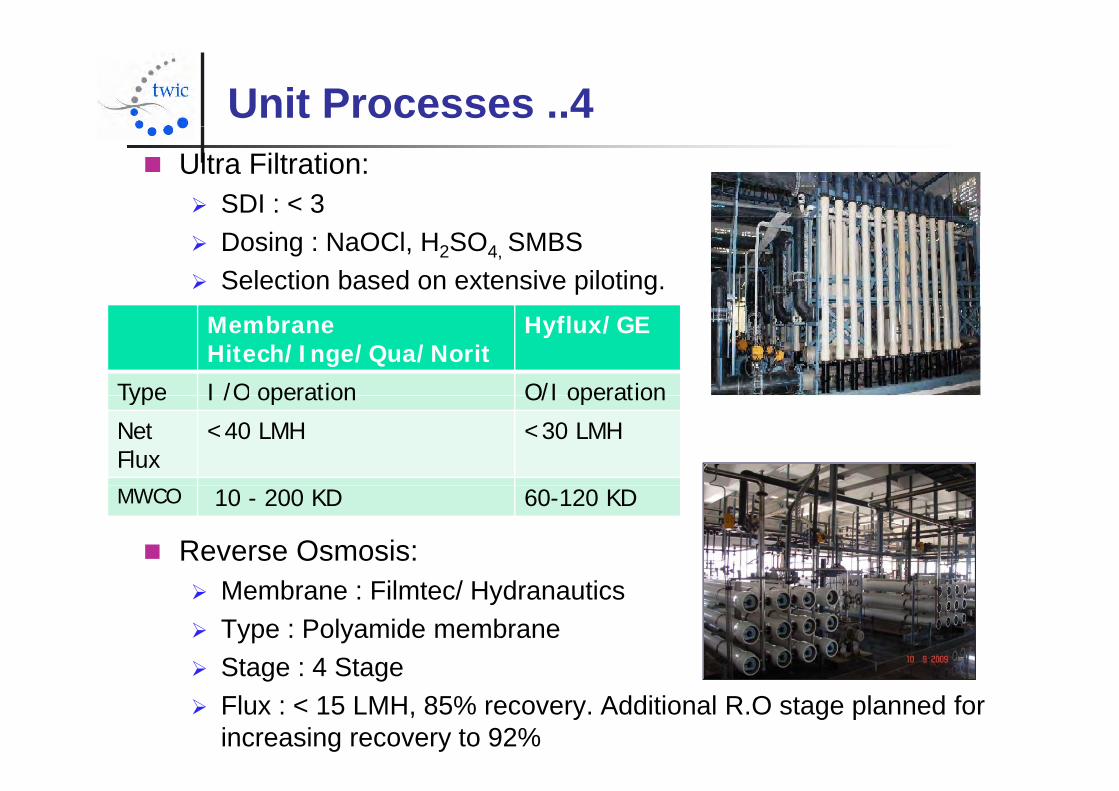
Unit Processes ..4 Ultra Filtration:
SDI : < 3 Dosing : NaOCl, H2SO4, SMBS Selection based on extensive piloting.
Membrane Hitech/Inge/Qua/Norit
Hyflux/GE
Type I /O operation O/I operationType I /O operation O/I operation
Net Flux
<40 LMH <30 LMH
Reverse Osmosis:
MWCO 10 - 200 KD 60-120 KD
Membrane : Filmtec/ Hydranautics Type : Polyamide membrane Stage : 4 Stage Stage : 4 Stage Flux : < 15 LMH, 85% recovery. Additional R.O stage planned for
increasing recovery to 92%
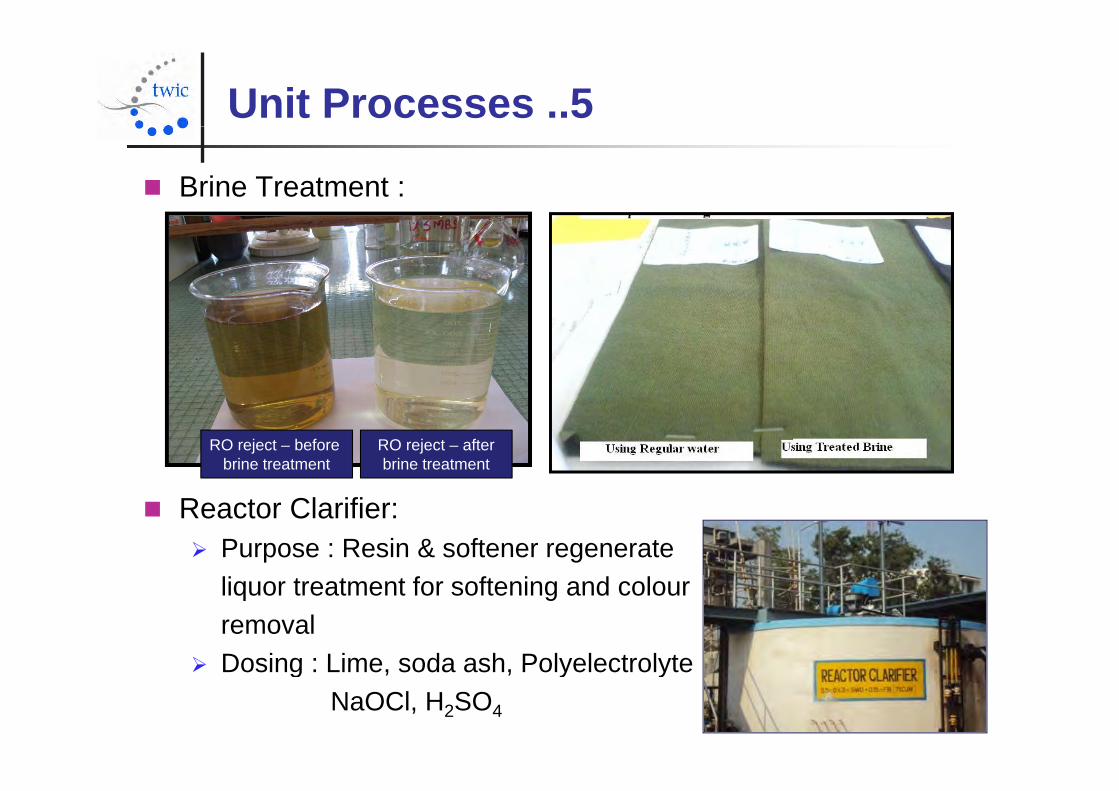
Unit Processes ..5
Brine Treatment :
RO reject – before brine treatment
RO reject – afterbrine treatment
Reactor Clarifier: Purpose : Resin & softener regenerate
liquor treatment for softening and colour removal
Dosing : Lime soda ash Polyelectrolyte Dosing : Lime, soda ash, PolyelectrolyteNaOCl, H2SO4
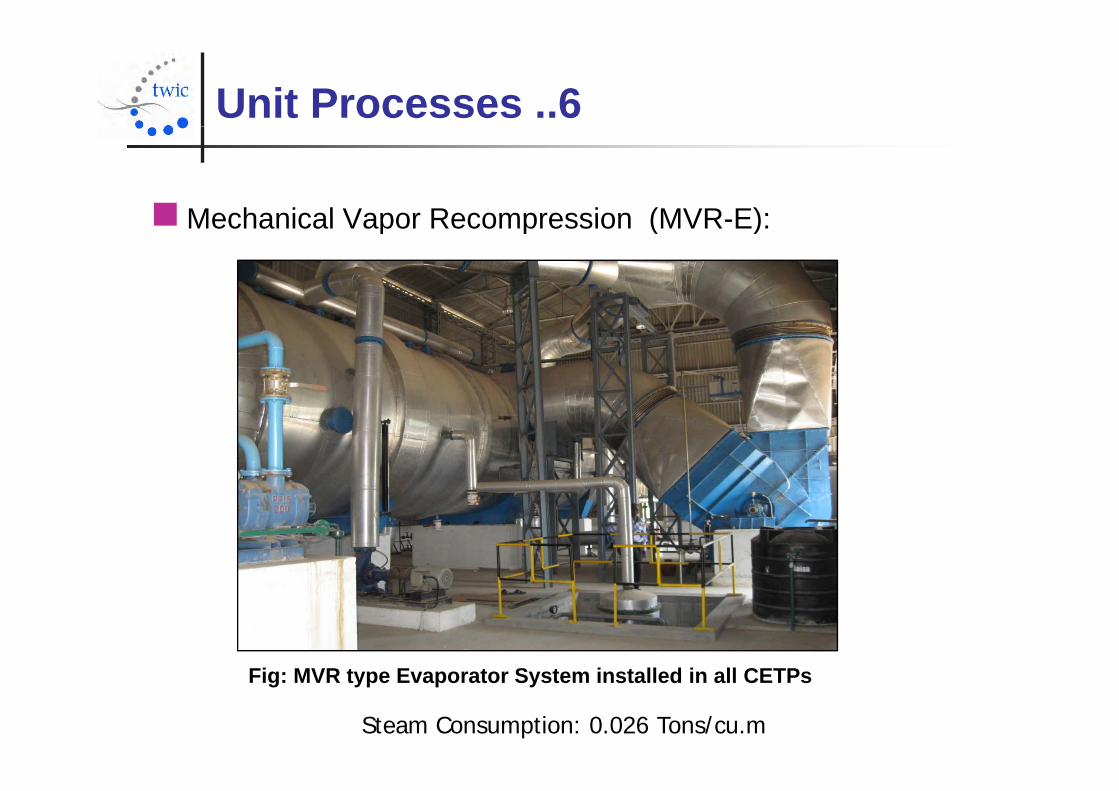
Unit Processes ..6
Mechanical Vapor Recompression (MVR E):Mechanical Vapor Recompression (MVR-E):
Fig: MVR type Evaporator System installed in all CETPs
Steam Consumption: 0.026 Tons/cu.m
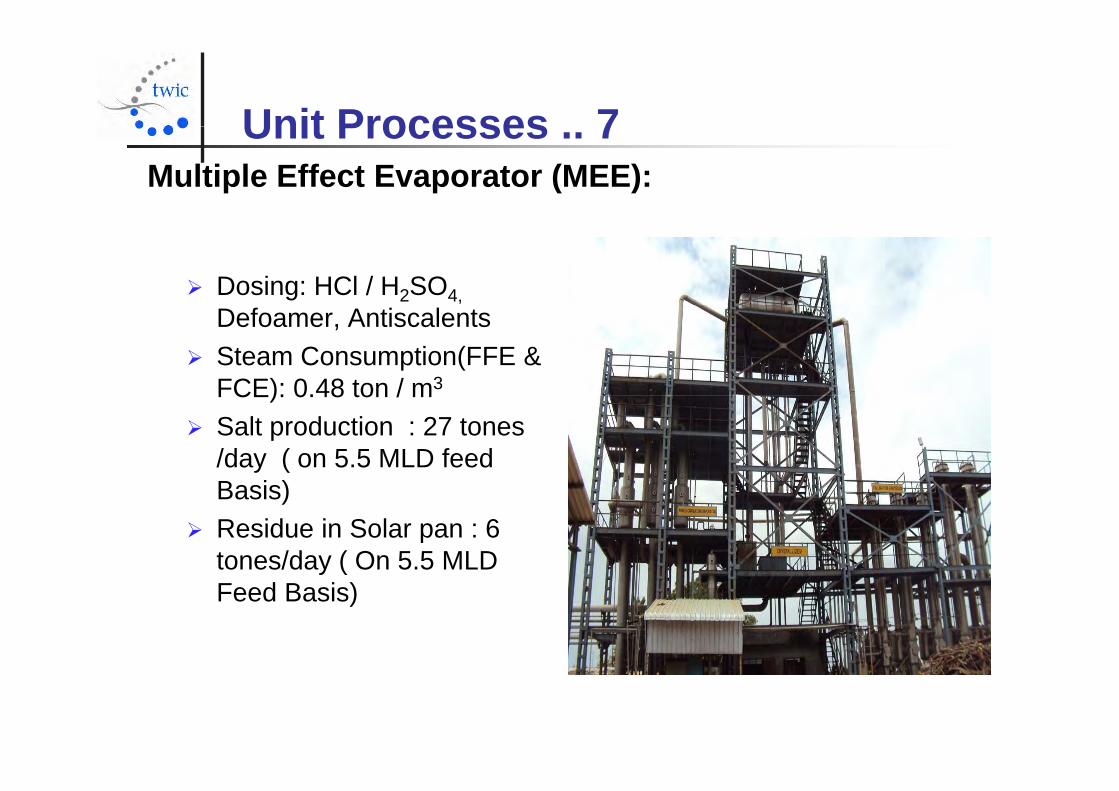
Unit Processes 7Unit Processes .. 7Multiple Effect Evaporator (MEE):
Dosing: HCl / H2SO4, Defoamer, Antiscalents
Steam Consumption(FFE & FCE): 0.48 ton / m3 FCE): 0.48 ton / m
Salt production : 27 tones /day ( on 5.5 MLD feed Basis)Basis)
Residue in Solar pan : 6 tones/day ( On 5.5 MLDFeed Basis)
Unit Processes 8Unit Processes …8
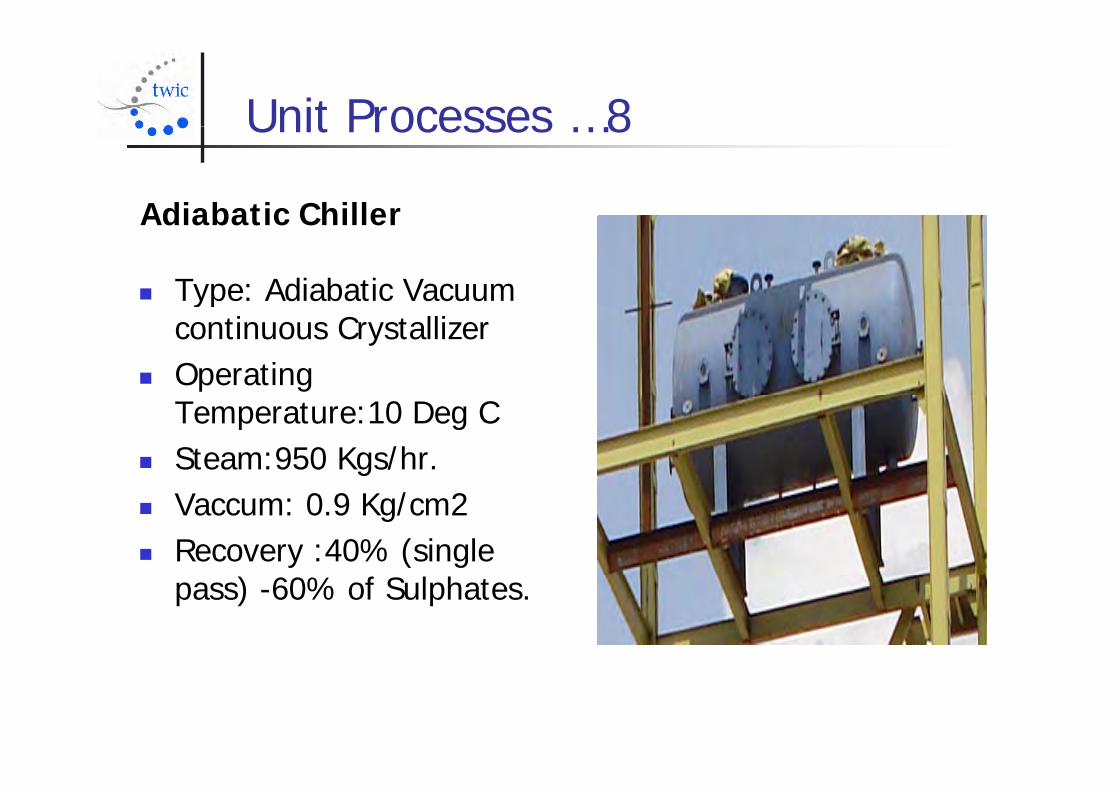
Adiabatic ChillerAdiabatic Chiller
Type: Adiabatic Vacuum ypcontinuous Crystallizer
Operating Temperature:10 Deg C
Steam:950 Kgs/hr. Vaccum: 0.9 Kg/cm2 Recovery :40% (single
pass) -60% of Sulphates.
Unit Processes 9Unit Processes …9
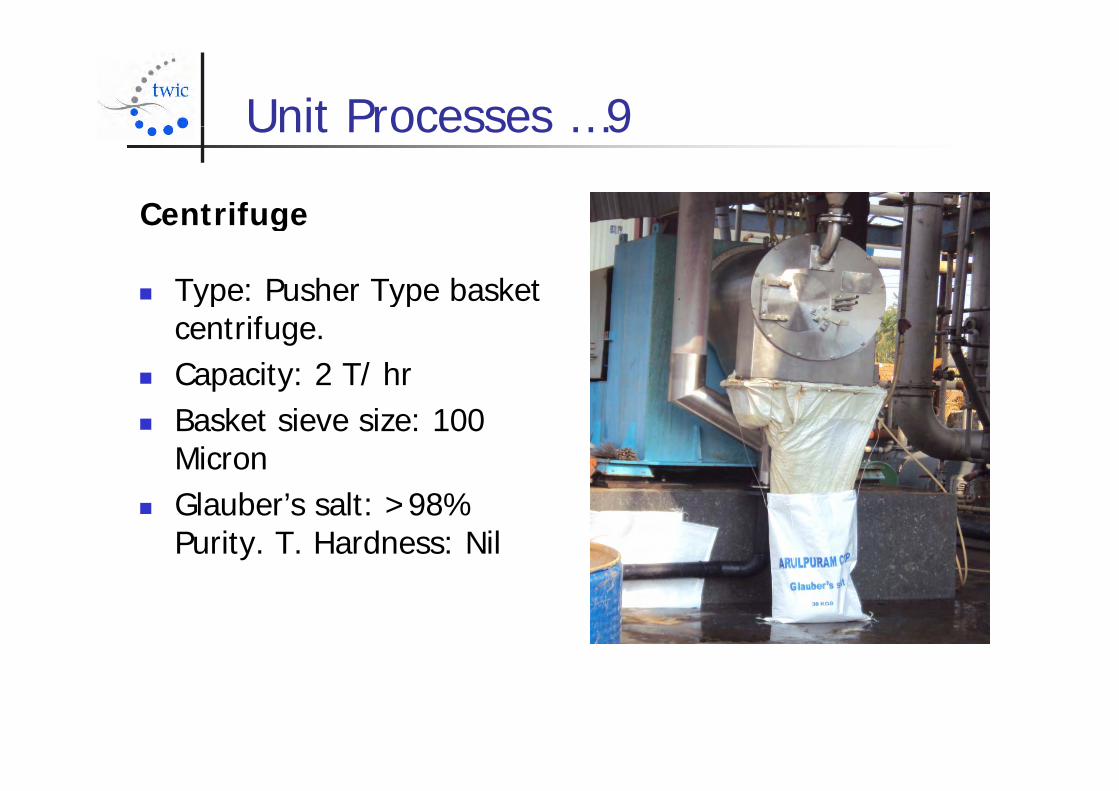
CentrifugeCentrifuge
Type: Pusher Type basket yp ypcentrifuge.
Capacity: 2 T/ hr Basket sieve size: 100
Micron Glauber’s salt: >98%
Purity. T. Hardness: Nil
SectionSection DD::TechnicalTechnical ChallengesChallenges andandSectionSection DD::TechnicalTechnical ChallengesChallenges andandhowhow itit waswas overcomeovercome
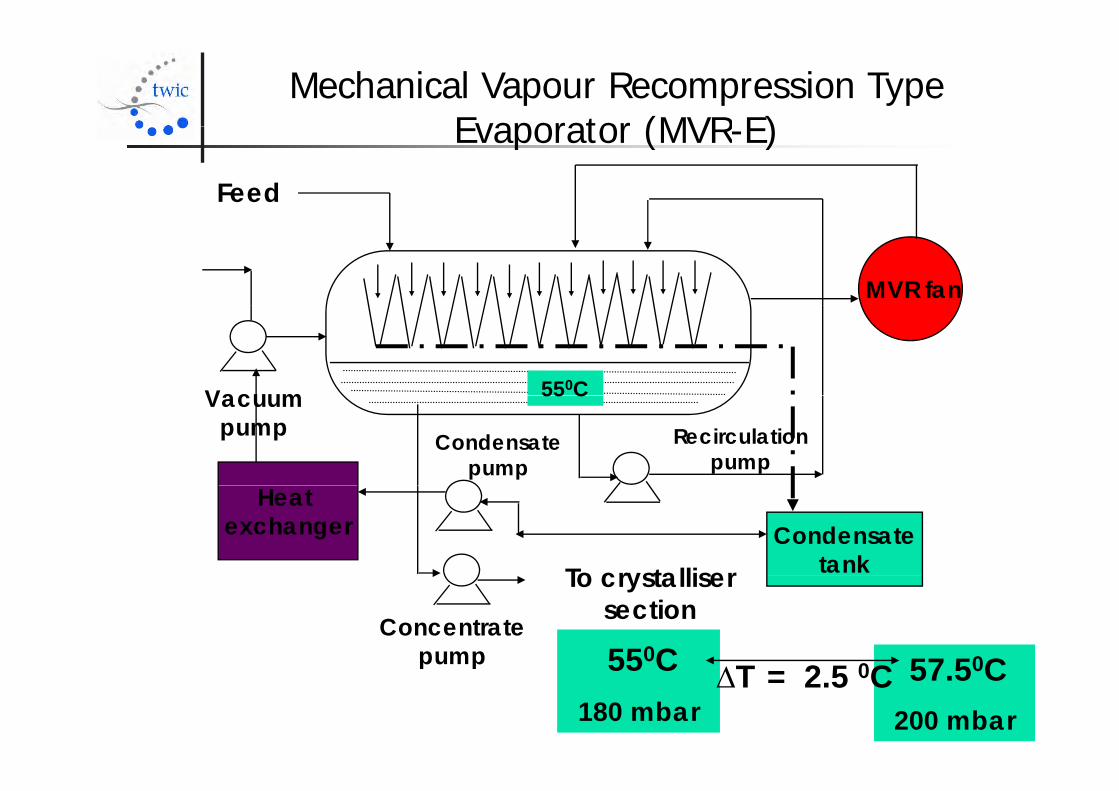
Mechanical Vapour Recompression Type Evaporator (MVR E)
Feed
Evaporator (MVR-E)
MVR fan
550CVacuum 55 CVacuum pump Recirculation
pumpCondensate
pump
Condensate tankTo crystalliser
Heat exchanger
To crystalliser sectionConcentrate
pump 550C 57 50CT 2 5 0Cp p 55 C
180 mbar57.50C
200 mbar∆T = 2.5 0C
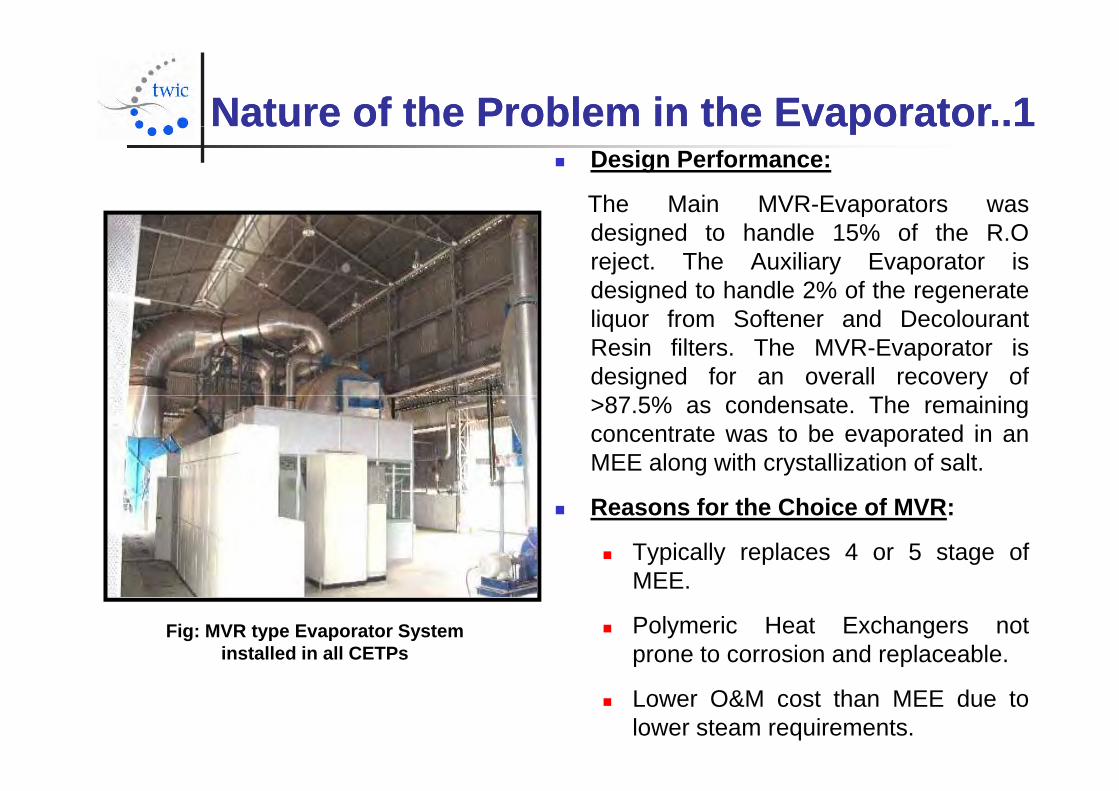
Nature of the Problem in the Evaporator..1 Nature of the Problem in the Evaporator..1 atu e o t e ob e t e apo atoatu e o t e ob e t e apo ato Design Performance:
The Main MVR-Evaporators waspdesigned to handle 15% of the R.Oreject. The Auxiliary Evaporator isdesigned to handle 2% of the regenerateliquor from Softener and DecolourantResin filters. The MVR-Evaporator isdesigned for an overall recovery of>87.5% as condensate. The remainingconcentrate was to be evaporated in anMEE along with crystallization of salt.
Reasons for the Choice of MVR:
Typically replaces 4 or 5 stage ofMEEMEE.
Polymeric Heat Exchangers notprone to corrosion and replaceable.
Fig: MVR type Evaporator System installed in all CETPs p p
Lower O&M cost than MEE due tolower steam requirements.
Nature of the Problem in the Evaporator..2Nature of the Problem in the Evaporator..2 Actual Performance of MVR:
MVR Feed at 80-85% of design
Nature of the Problem in the Evaporator..2 Nature of the Problem in the Evaporator..2
MVR Feed at 80 85% of design MVR Recovery at <70% (due to elevation in b.p resulting in
lowering of ∆T). Reduced recovery resulted in lower TDS in the concentrate and
higher volume, resulting in overloading of the downstream MEE/Crystallizer.
No glauber Salt crystallization. Reduced recovery in MVR requiredadditional MEE stages and an Adiabatic Chiller to achieve desiredfeed volume, recovery and concentration to achieve crystallization.
Inability to handle BDTRF (decolorant and Softener resinregenerate) liquor due to choking of the polymeric heat exchangersdue to higher hardness and organics.g g
Based on the above situation it was estimated that two streams ofSeven effect Evaporators for MVR concentrate and BDTRF+ChillerMother liquor will be required which will not only increase theMother liquor will be required which will not only increase thecapital cost by Rs. 10 Crores per MLD but also increase theoperating cost to Rs. 300-350 per m3 of reject for evaporation andcrystallization.
Other issues with Evaporator 1Other issues with Evaporator 1Other issues with Evaporator.. 1Other issues with Evaporator.. 1 Use of the conventional Sodium Chloride based dyeing is problematic since
crystallization of Chloride salt will produce a salt contaminated withy pHardness and Colour due to its crystallization nature.
Although the industry has accepted to use Sodium Sulphate for dyeing , theffl t t i ll t i Chl id t ( b t 20% f th t t l lt l d)effluent typically contains Chlorides too (about 20% of the total salt load).
Therefore it is a mixed salt.
Separate crystallization strategies are required for Sulphate (adiabatic Separate crystallization strategies are required for Sulphate (adiabaticchiller) and the mixed salt (from the mother liquor of the chiller).
>99% purity sodium sulphate can be obtained by Chilling, however thep y p y g,mother liquor of the chiller will be a mixed salt and will be contaminated withHardness & Colour and therefore unfit for reuse.
% f ( % f At best 80% of the sulphate (or 60 % of the total salt assuming 80: 20 ratioof Sulphate : Chloride) can be recovered in the adiabatic chiller. Meaningatleast 40% of the total salt in the effluent which is present in the chillermother liquor would be a mixed salt and will need to be evaporated. Sincemother liquor will have high, hardness, colour, silica etc, this will be a wastesalt unfit for reuse.
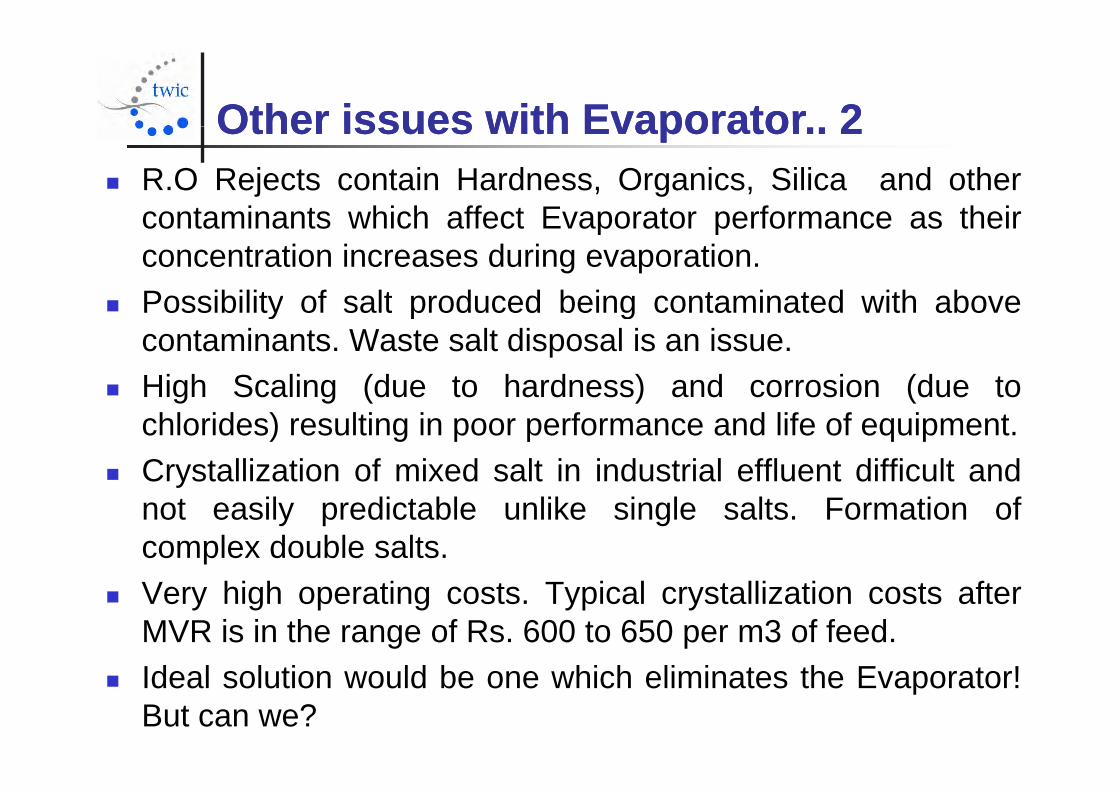
Other issues with Evaporator 2Other issues with Evaporator 2Other issues with Evaporator.. 2Other issues with Evaporator.. 2 R.O Rejects contain Hardness, Organics, Silica and other
contaminants which affect Evaporator performance as theircontaminants which affect Evaporator performance as theirconcentration increases during evaporation.
Possibility of salt produced being contaminated with above Possibility of salt produced being contaminated with abovecontaminants. Waste salt disposal is an issue.
High Scaling (due to hardness) and corrosion (due toHigh Scaling (due to hardness) and corrosion (due tochlorides) resulting in poor performance and life of equipment.
Crystallization of mixed salt in industrial effluent difficult andynot easily predictable unlike single salts. Formation ofcomplex double salts.
Very high operating costs. Typical crystallization costs afterMVR is in the range of Rs. 600 to 650 per m3 of feed.
Ideal solution would be one which eliminates the Evaporator!But can we?
SectionSection EE:: OurOur TechnicalTechnical SolutionSolution ToToSectionSection EE:: OurOur TechnicalTechnical SolutionSolution ToToTheThe ProblemProblem
How is salt used in Dyeing?How is salt used in Dyeing?How is salt used in Dyeing?How is salt used in Dyeing?
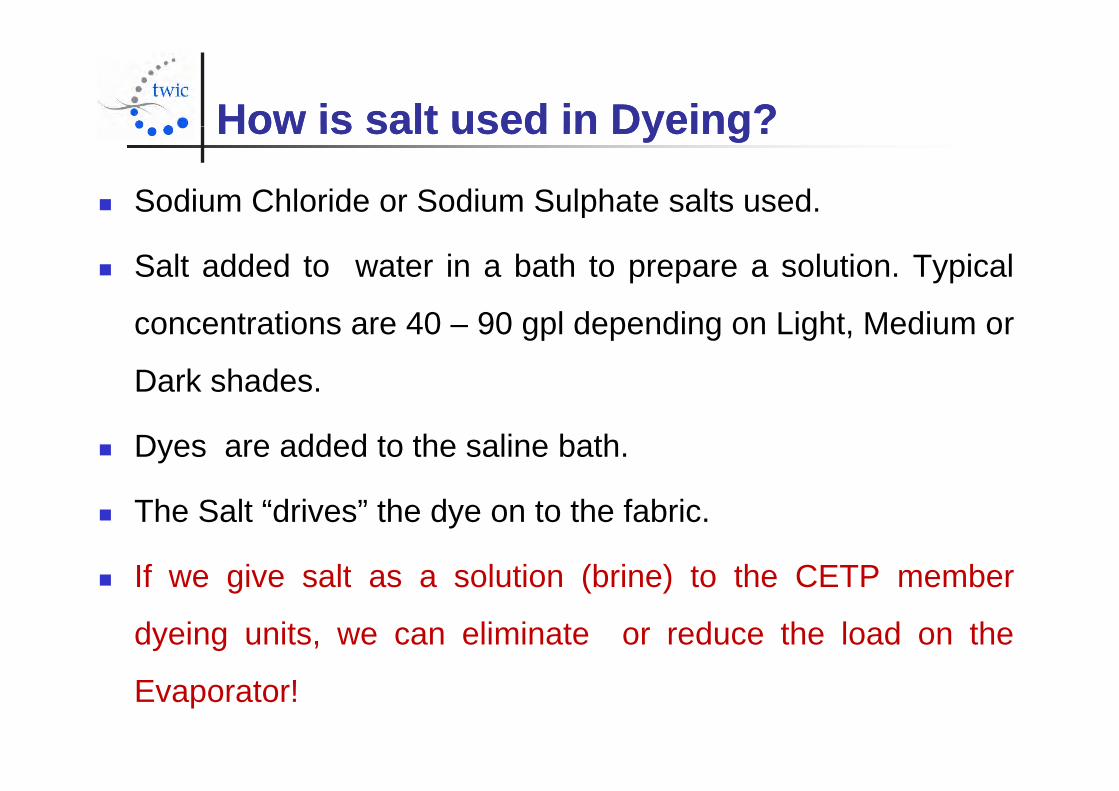
Sodium Chloride or Sodium Sulphate salts used.p
Salt added to water in a bath to prepare a solution. Typical
concentrations are 40 – 90 gpl depending on Light, Medium or
Dark shades.
Dyes are added to the saline bath.
The Salt “drives” the dye on to the fabric.
If we give salt as a solution (brine) to the CETP member If we give salt as a solution (brine) to the CETP member
dyeing units, we can eliminate or reduce the load on the
Evaporator!
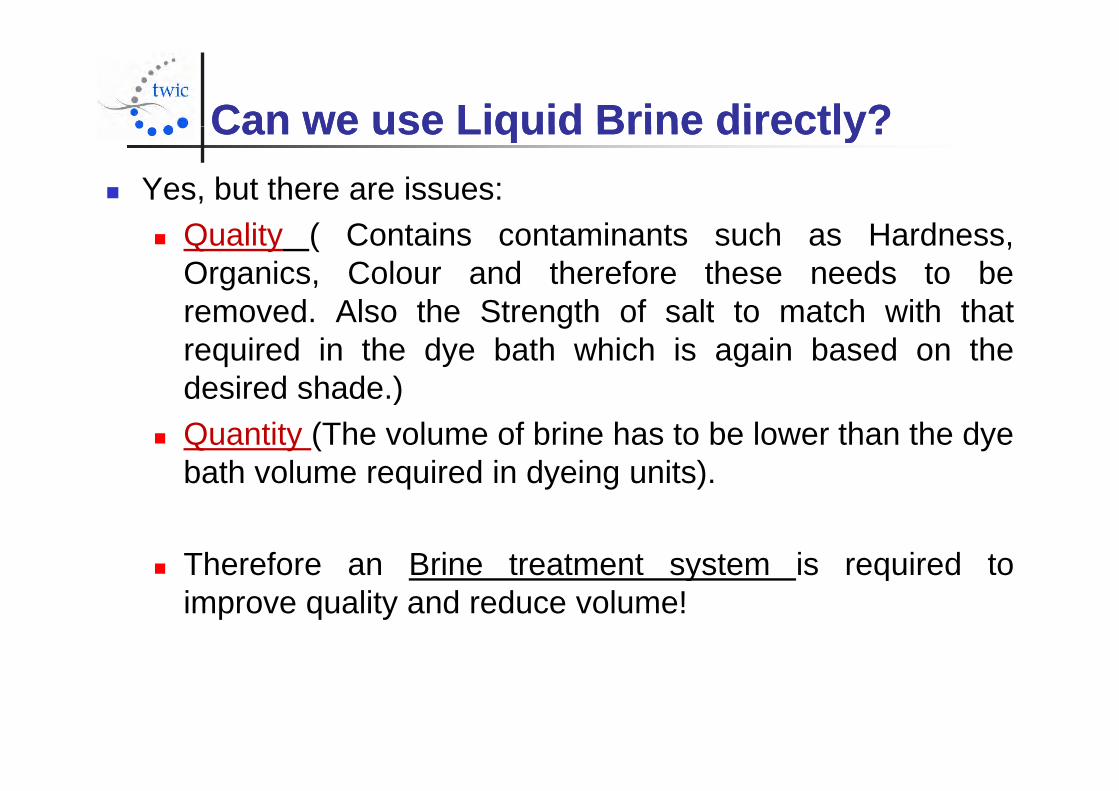
Can we use Liquid Brine directly?Can we use Liquid Brine directly?Can we use Liquid Brine directly?Can we use Liquid Brine directly? Yes, but there are issues:
Quality ( Contains contaminants such as Hardness,Organics, Colour and therefore these needs to beremoved Also the Strength of salt to match with thatremoved. Also the Strength of salt to match with thatrequired in the dye bath which is again based on thedesired shade.)desired shade.)
Quantity (The volume of brine has to be lower than the dyebath volume required in dyeing units).q y g )
Therefore an Brine treatment system is required toe e o e a e ea e sys e s equ ed oimprove quality and reduce volume!
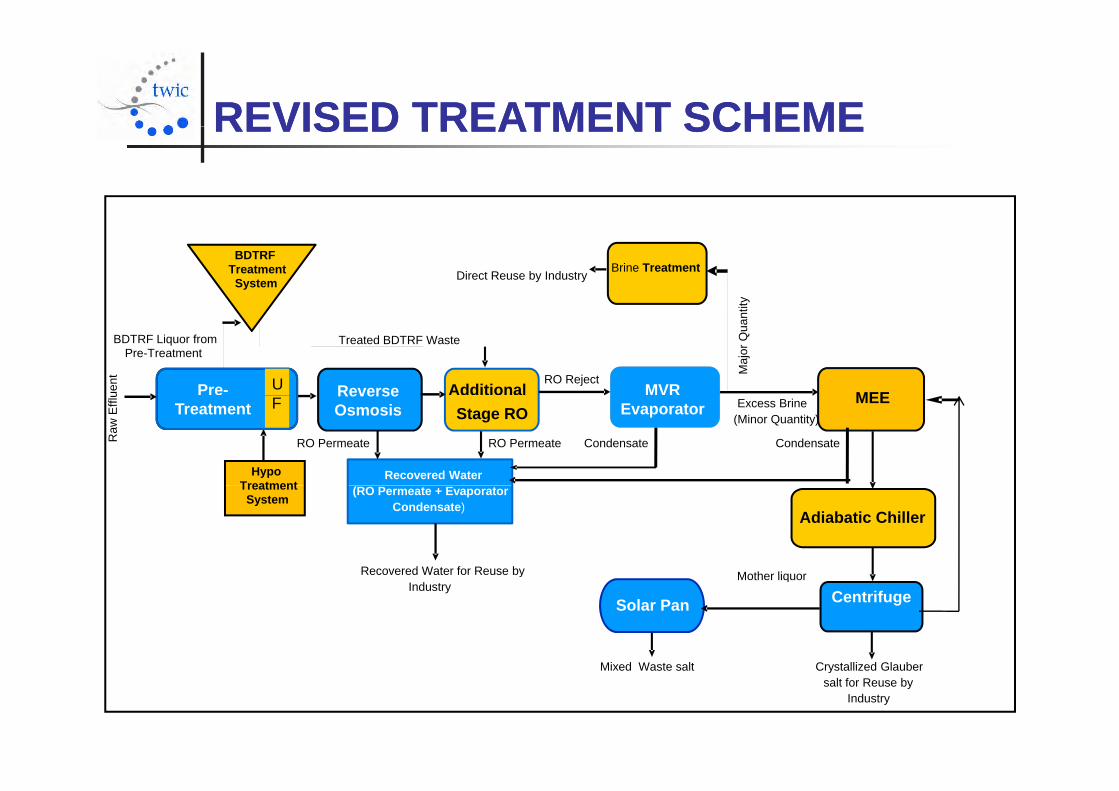
REVISED TREATMENT SCHEMEREVISED TREATMENT SCHEMEREVISED TREATMENT SCHEMEREVISED TREATMENT SCHEME
SystemTreatment Direct Reuse by Industry
ty
BDTRF
SystemBrine Treatment
U
BDTRF Liquor from Pre-Treatment
Treated BDTRF Waste
uent RO Reject
Maj
or Q
uant
it
Pre- Reverse Additional MVR MEEU
MVR EvaporatorF
CondensateRaw
Effl
u
RO Permeate CondensateRO Permeate
Excess Brine (Minor Quantity)
Treatment
Hypo Treatment
Reverse Osmosis Stage RO Evaporator
Recovered Water
MEEF
Mother liquorRecovered Water for Reuse by
Treatment System
(RO Permeate + Evaporator Condensate)
Adiabatic Chiller
Centrifuge
Crystallized GlauberMixed Waste salt
Mother liquoryIndustry
CentrifugeSolar Pan
Crystallized Glauber salt for Reuse by
Industry
Mixed Waste salt
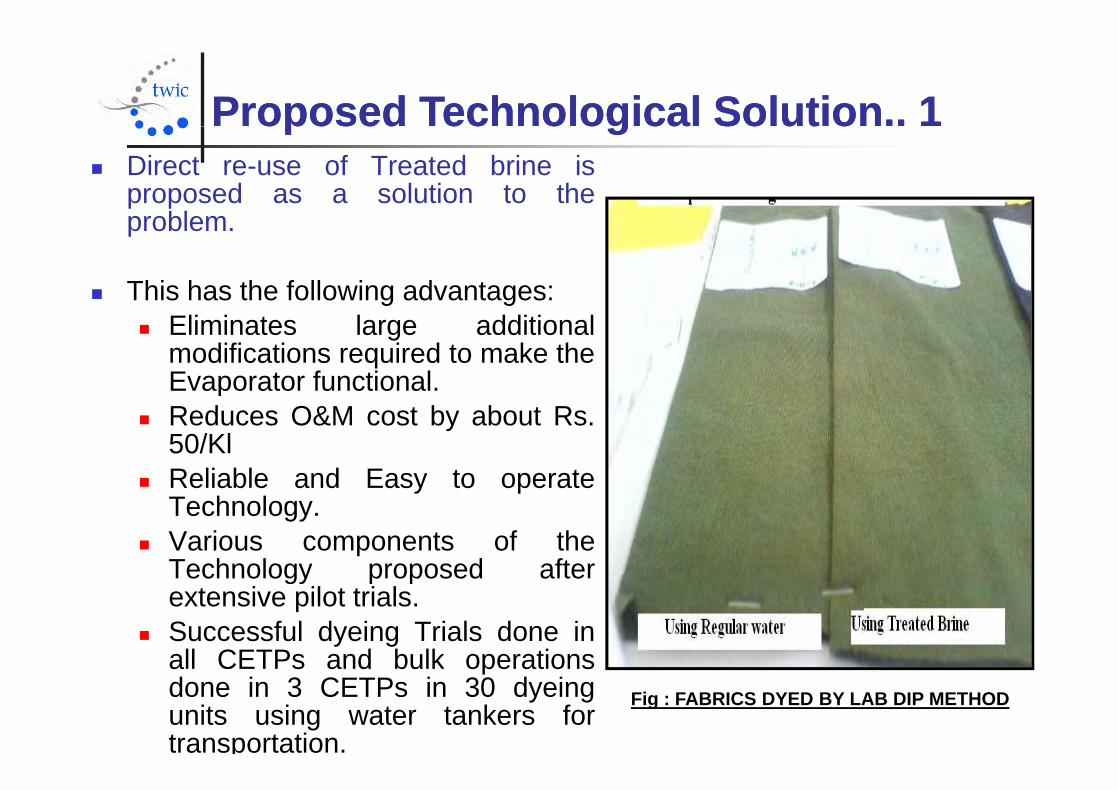
Proposed Technological Solution.. 1 Proposed Technological Solution.. 1 oposed ec o og ca So ut ooposed ec o og ca So ut o Direct re-use of Treated brine is
proposed as a solution to theblproblem.
This has the following advantages:g g Eliminates large additional
modifications required to make theEvaporator functional.p
Reduces O&M cost by about Rs.50/Kl
Reliable and Easy to operate Reliable and Easy to operateTechnology.
Various components of theTechnology proposed afterTechnology proposed afterextensive pilot trials.
Successful dyeing Trials done inall CETPs and bulk operationsall CETPs and bulk operationsdone in 3 CETPs in 30 dyeingunits using water tankers fortransportation.
Fig : FABRICS DYED BY LAB DIP METHOD
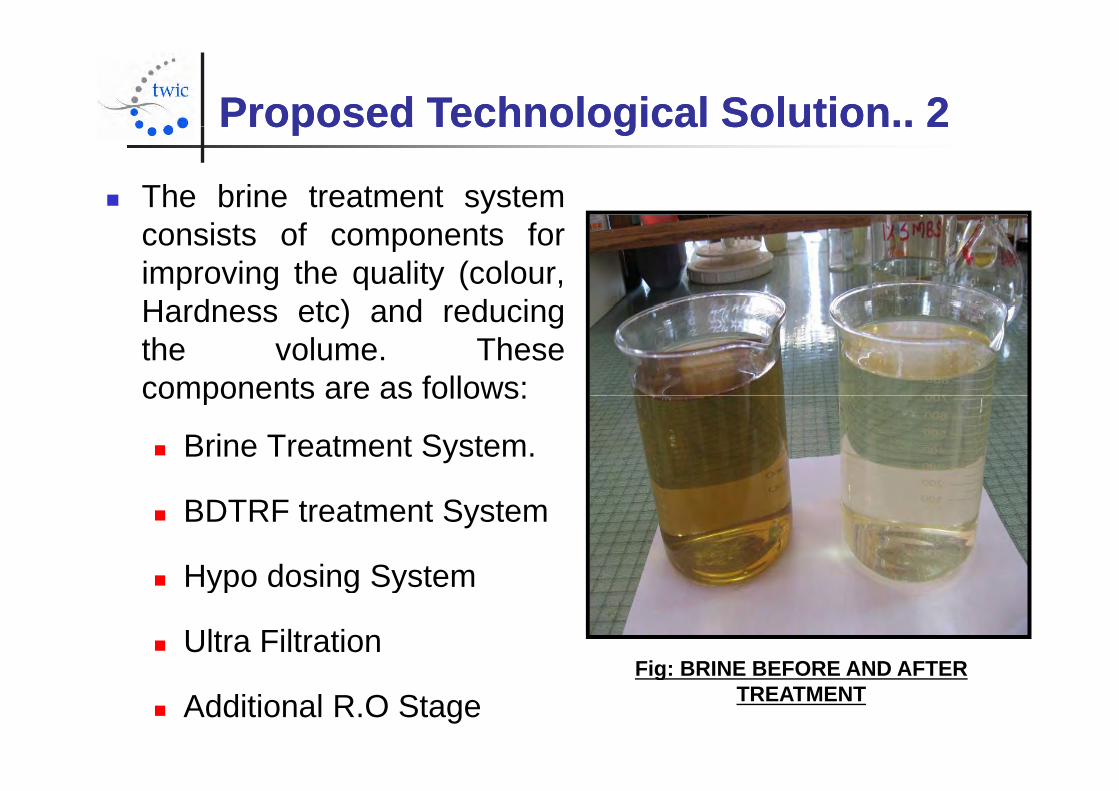
Proposed Technological Solution.. 2Proposed Technological Solution.. 2Proposed Technological Solution.. 2Proposed Technological Solution.. 2
The brine treatment systemconsists of components forimproving the quality (colour,Hardness etc) and reducingHardness etc) and reducingthe volume. Thesecomponents are as follows:components are as follows:
Brine Treatment System.
BDTRF treatment System
Hypo dosing System Hypo dosing System
Ultra FiltrationFig: BRINE BEFORE AND AFTER
Additional R.O StageFig: BRINE BEFORE AND AFTER
TREATMENT
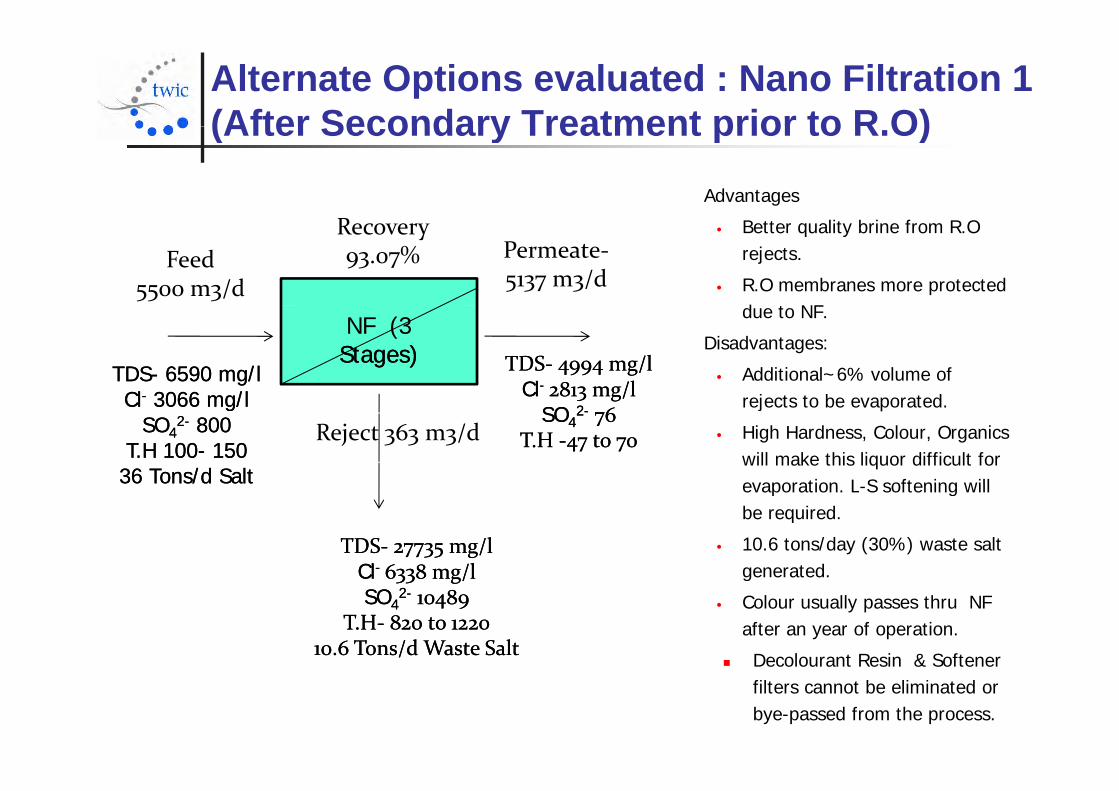
Alternate Options evaluated : Nano Filtration 1 (After Secondary Treatment prior to R O)(After Secondary Treatment prior to R.O)
Advantages
Better quality brine from R.O rejects.
R.O membranes more protected d t NF
Feed5500 m3/d
Permeate‐5137 m3/d
Recovery 93.07%
due to NF.
Disadvantages:
Additional~6% volume of j t t b t d
TDS- 6590 mg/lCl- 3066 mg/l
TDS- 6590 mg/lCl- 3066 mg/l
TDS‐ 4994 mg/lCl- 2813 mg/l
TDS‐ 4994 mg/lCl- 2813 mg/l
NF (3 Stages)NF (3 Stages)
rejects to be evaporated.
High Hardness, Colour, Organics will make this liquor difficult for evaporation L S softening will
Cl- 3066 mg/lSO4
2- 800T.H 100- 150
36 Tons/d Salt
Cl- 3066 mg/lSO4
2- 800T.H 100- 150
36 Tons/d Salt
Cl 2813 mg/lSO4
2- 76T.H ‐47 to 70
Cl 2813 mg/lSO4
2- 76T.H ‐47 to 70Reject 363 m3/d
evaporation. L-S softening will be required.
10.6 tons/day (30%) waste salt generated.
//
TDS‐ 27735 mg/lCl- 6338 mg/l
TDS‐ 27735 mg/lCl- 6338 mg/l generated.
Colour usually passes thru NF after an year of operation.
Decolourant Resin & Softener
Cl 6338 mg/lSO4
2- 10489T.H‐ 820 to 1220
10.6 Tons/d Waste Salt
Cl 6338 mg/lSO4
2- 10489T.H‐ 820 to 1220
10.6 Tons/d Waste Salt Decolourant Resin & Softener
filters cannot be eliminated or bye-passed from the process.
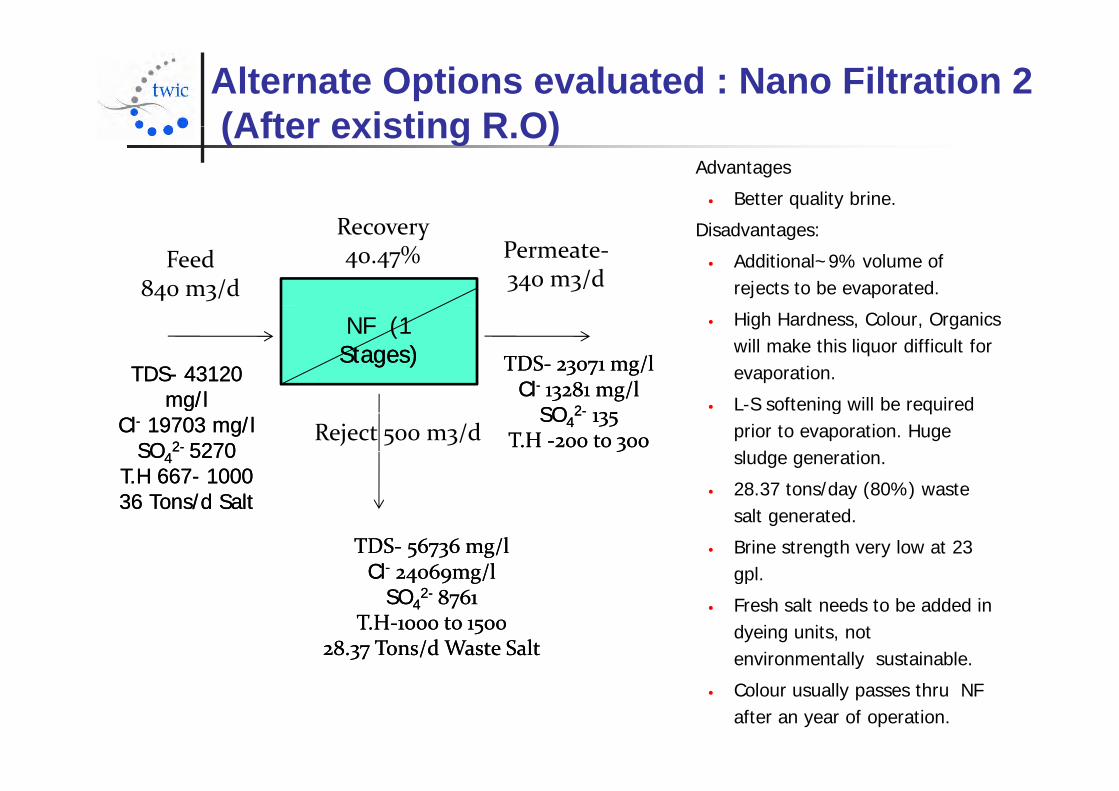
Alternate Options evaluated : Nano Filtration 2(After existing R O)(After existing R.O)
Advantages
Better quality brine.
Disadvantages:
Additional~9% volume of rejects to be evaporated.
Feed840 m3/d
Permeate‐340 m3/d
Recovery 40.47%
High Hardness, Colour, Organics will make this liquor difficult for evaporation. TDS- 43120
mg/lTDS- 43120
mg/l
TDS‐ 23071 mg/lCl- 13281 mg/l
TDS‐ 23071 mg/lCl- 13281 mg/l
NF (1 Stages)NF (1 Stages)
L-S softening will be required prior to evaporation. Huge sludge generation.
28 37 tons/day (80%) waste
mg/lCl- 19703 mg/l
SO42- 5270
T.H 667- 1000
mg/lCl- 19703 mg/l
SO42- 5270
T.H 667- 1000
Cl 13281 mg/lSO4
2- 135T.H ‐200 to 300
Cl 13281 mg/lSO4
2- 135T.H ‐200 to 300Reject 500 m3/d
28.37 tons/day (80%) waste salt generated.
Brine strength very low at 23 gpl
36 Tons/d Salt36 Tons/d Salt
TDS‐ 56736 mg/lCl- 24069mg/l
TDS‐ 56736 mg/lCl- 24069mg/l gpl.
Fresh salt needs to be added in dyeing units, not environmentally sustainable.
Cl 24069mg/lSO4
2- 8761T.H‐1000 to 1500
28.37 Tons/d Waste Salt
Cl 24069mg/lSO4
2- 8761T.H‐1000 to 1500
28.37 Tons/d Waste Salt environmentally sustainable.
Colour usually passes thru NF after an year of operation.
Section F : Case Study of A Textile CETP
- Arulpuram CETP
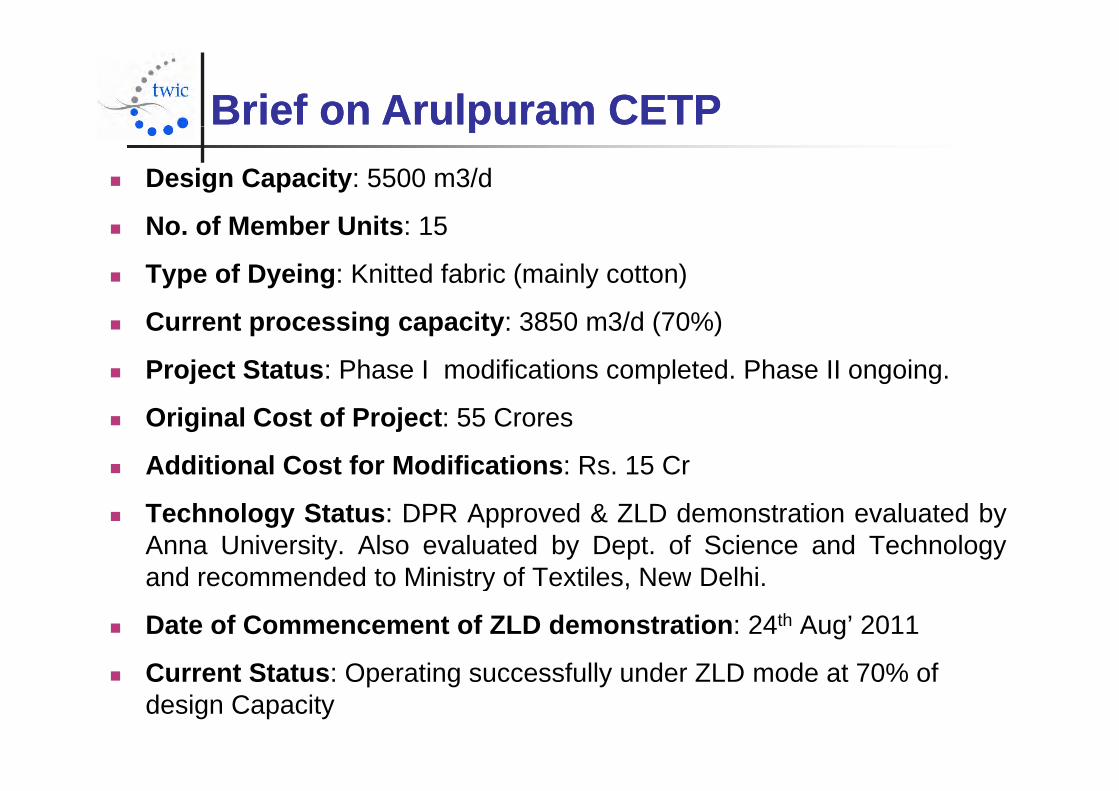
Brief on Arulpuram CETPBrief on Arulpuram CETPpp Design Capacity: 5500 m3/d
N f M b U i 1 No. of Member Units: 15
Type of Dyeing: Knitted fabric (mainly cotton)
Current processing capacity: 3850 m3/d (70%)
Project Status: Phase I modifications completed. Phase II ongoing.
Original Cost of Project: 55 Crores
Additional Cost for Modifications: Rs. 15 Cr
Technology Status: DPR Approved & ZLD demonstration evaluated byAnna University. Also evaluated by Dept. of Science and Technologyand recommended to Ministry of Textiles New Delhiand recommended to Ministry of Textiles, New Delhi.
Date of Commencement of ZLD demonstration: 24th Aug’ 2011
C t St t O ti f ll d ZLD d t 70% f Current Status: Operating successfully under ZLD mode at 70% of design Capacity
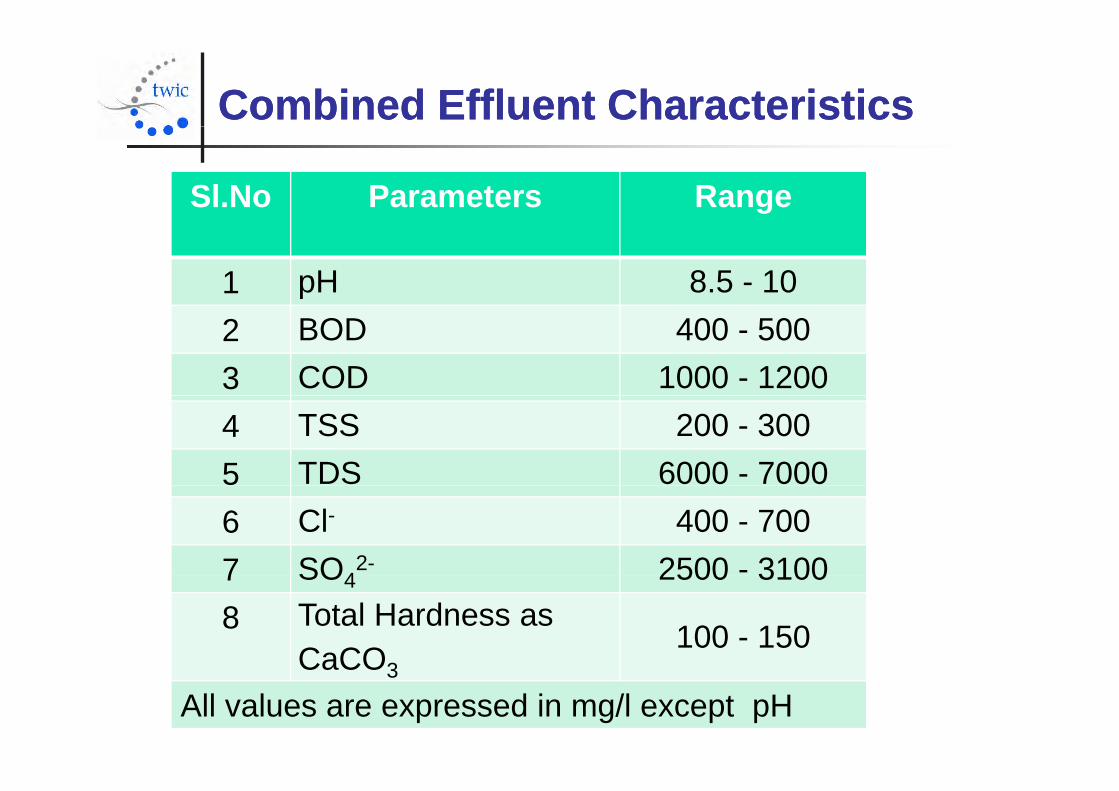
Combined Effluent CharacteristicsCombined Effluent Characteristics
Sl.No Parameters Range
1 pH 8.5 - 102 BOD 400 - 5003 COD 1000 - 12004 TSS 200 - 3005 TDS 6000 - 70006 Cl- 400 - 7007 SO4
2- 2500 - 31007 SO4 2500 31008 Total Hardness as
CaCO3100 - 150
CaCO3
All values are expressed in mg/l except pH
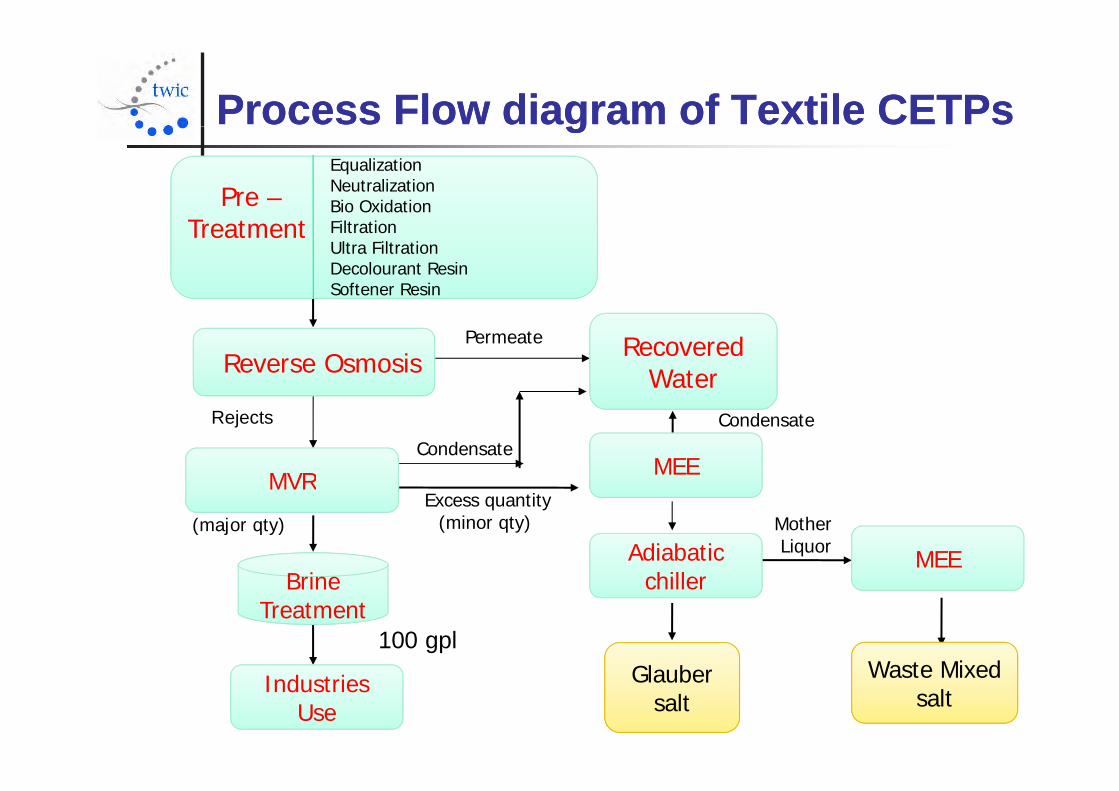
Process Flow diagram of Textile CETPsProcess Flow diagram of Textile CETPsgg
Pre –EqualizationNeutralizationBio Oxidation
Treatment FiltrationUltra FiltrationDecolourant ResinSoftener Resin
Recovered Water Reverse Osmosis
Permeate
MVR MEE
Rejects CondensateCondensate
Excess quantity (minor qty)
MVR
B iMEEAdiabatic
hill
MotherLiquor
(major qty)
TreatmentBrine
Treatmentchiller
Gl b100 gpl
Waste MixedIndustries Use
Glauber salt
Waste Mixed salt
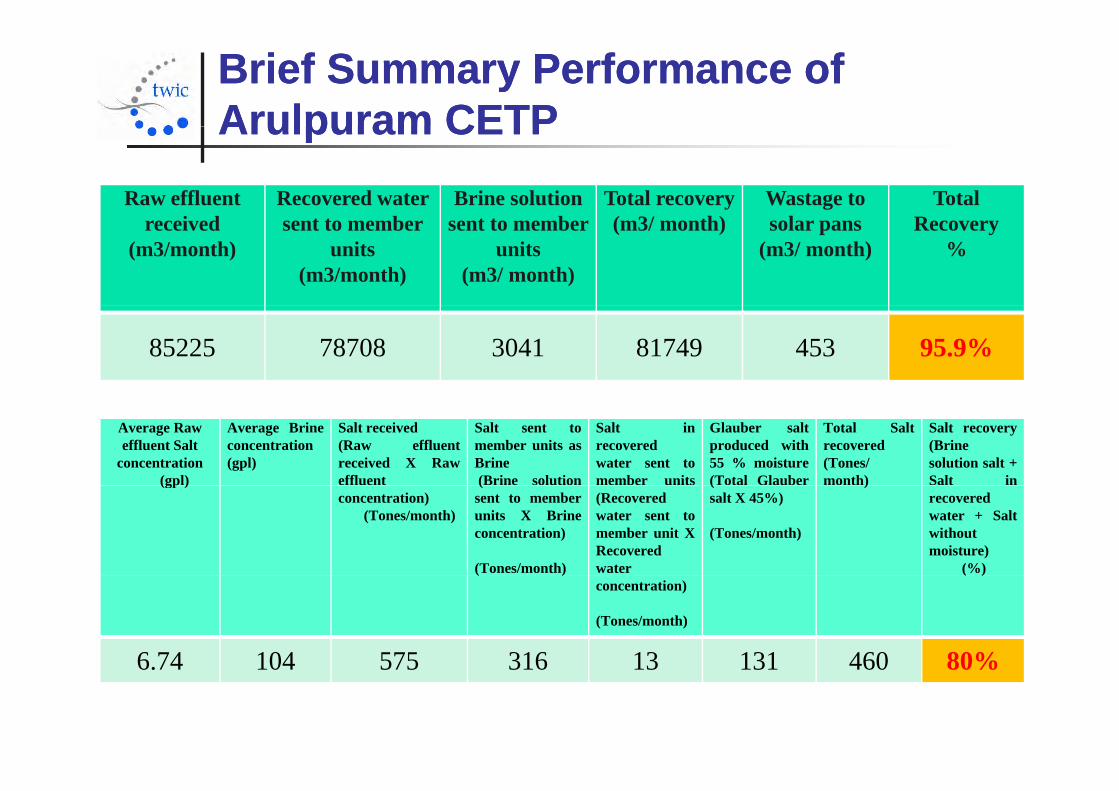
Brief Summary Performance of Brief Summary Performance of Arulpuram CETPArulpuram CETPArulpuram CETPArulpuram CETP
Raw effluent Recovered water Brine solution Total recovery Wastage to Total received
(m3/month)sent to member
units (m3/month)
sent to member units
(m3/ month)
(m3/ month) solar pans(m3/ month)
Recovery%
85225 78708 3041 81749 453 95.9%
Average Raw effluent Salt
concentration(gpl)
Average Brineconcentration(gpl)
Salt received(Raw effluentreceived X Raweffluent
Salt sent tomember units asBrine(Brine solution
Salt inrecoveredwater sent tomember units
Glauber saltproduced with55 % moisture(Total Glauber
Total Saltrecovered(Tones/month)
Salt recovery(Brinesolution salt +Salt in(gp )
concentration)(Tones/month)
(sent to memberunits X Brineconcentration)
(Tones/month)
(Recoveredwater sent tomember unit XRecoveredwater
(salt X 45%)
(Tones/month)
)recoveredwater + Saltwithoutmoisture)
(%)( )concentration)
(Tones/month)
( )
6 74 104 575 316 13 131 460 80%6.74 104 575 316 13 131 460 80%
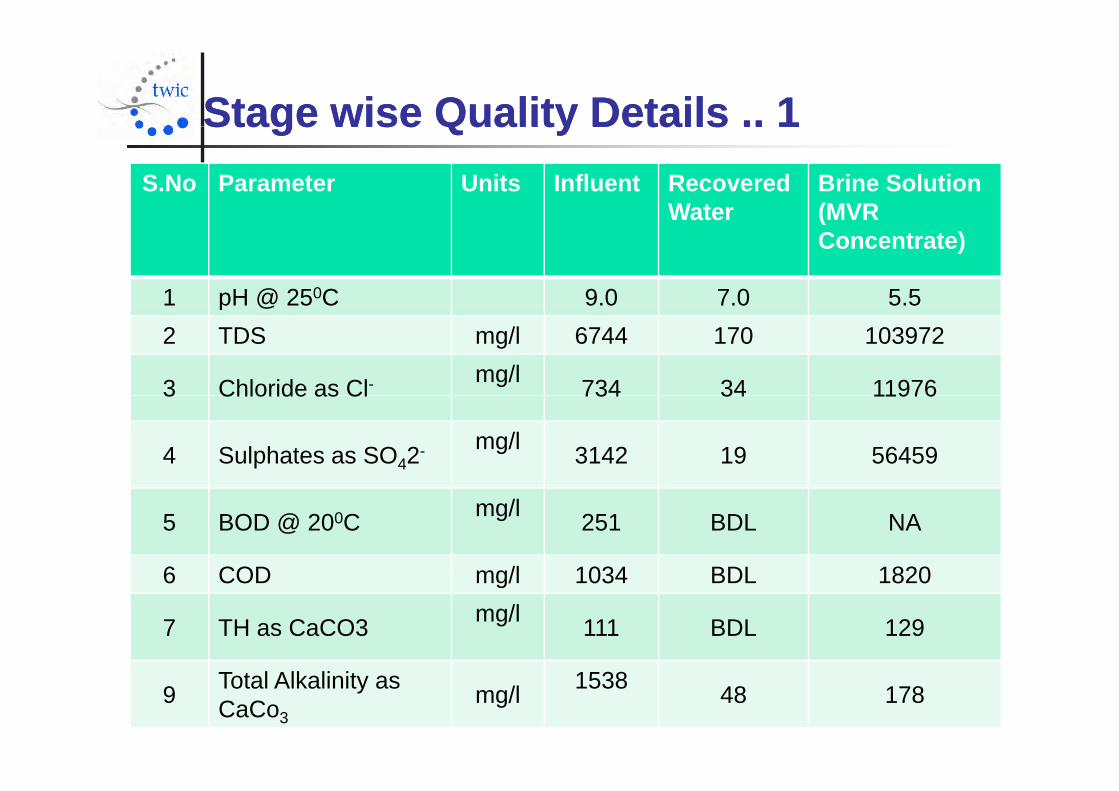
Stage wise Quality Details .. 1Stage wise Quality Details .. 1S.No Parameter Units Influent Recovered
WaterBrine Solution(MVR
Stage wise Quality Details .. 1Stage wise Quality Details .. 1
Water (MVR Concentrate)
1 pH @ 250C 9.0 7.0 5.5p @2 TDS mg/l 6744 170 103972
3 Chloride as Cl- mg/l 734 34 119763 Chloride as Cl 734 34 11976
4 Sulphates as SO42- mg/l 3142 19 56459
5 BOD @ 200C mg/l 251 BDL NA
6 COD mg/l 1034 BDL 18206 COD mg/l 1034 BDL 1820
7 TH as CaCO3 mg/l 111 BDL 129
9 Total Alkalinity as CaCo3
mg/l 1538 48 178
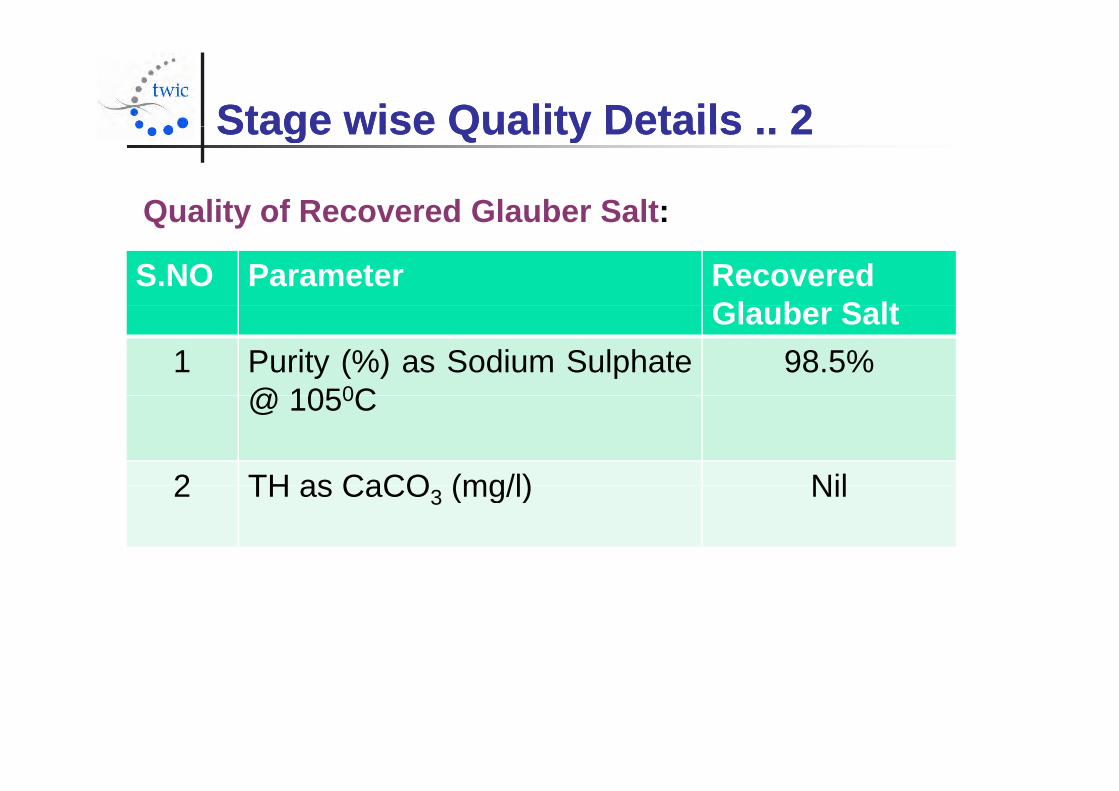
Stage wise Quality Details 2Stage wise Quality Details 2Stage wise Quality Details .. 2Stage wise Quality Details .. 2
Quality of Recovered Glauber Salt:
S.NO Parameter Recovered Gl b S lt
Quality of Recovered Glauber Salt:
Glauber Salt1 Purity (%) as Sodium Sulphate
@ 1050C98.5%
@ 1050C
2 TH as CaCO (mg/l) Nil2 TH as CaCO3 (mg/l) Nil
Approvals & Inspections done for the Approvals & Inspections done for the Arulpuram Demo 1Arulpuram Demo 1Arulpuram Demo .. 1Arulpuram Demo .. 1
DPR Approved by CES, Anna Universitypp y , y
Evaluation of the demonstration done by Anna University andreport dated 31st Oct’11 Submitted to TNPCBreport dated 31st Oct 11 Submitted to TNPCB.
Evaluation also done by Secretary DST, GoI, who submittedhis recommendation to MoT, GoI.
Also two members of the Technical committee constitutedso t o e be s o t e ec ca co ttee co st tutedby MoT also visited and have submitted their satisfactoryrecommendations to MoTrecommendations to MoT.
Following the above MoT advised all CETPs to followTWIC Technology with TWIC as the Operator.
Approvals & Inspections done for the Approvals & Inspections done for the Arulpuram DemoArulpuram Demo 22Arulpuram Demo .. Arulpuram Demo .. 22
Inspections were also done by court appointed Monitoring Inspections were also done by court appointed MonitoringCommittee and the Flying Squad and other officials of TNPCB.
Monitoring by PCB: 24 hrs online Flow metering of raw,recovered water, brine and freshwater (4 Nos) in each dyeingmember units & over 20 flow meters in the CETP uploadedcontinuously to a dedicated website / CETP Server.y
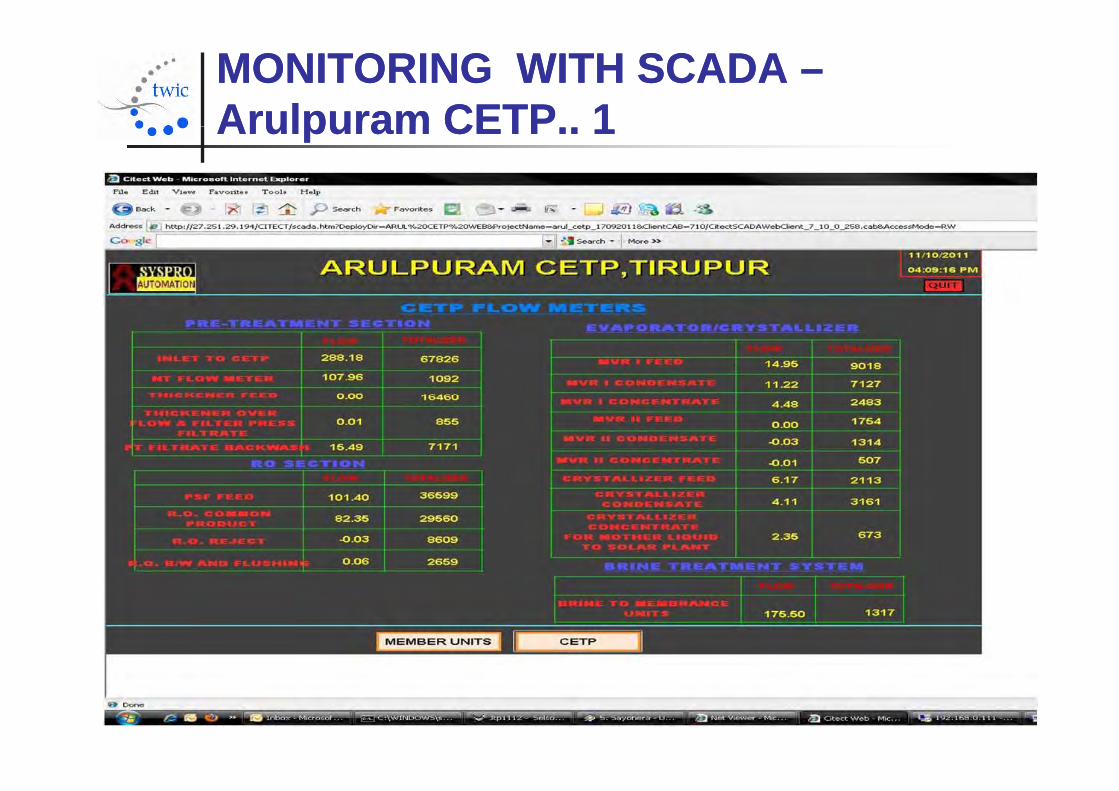
MONITORING WITH SCADA MONITORING WITH SCADA ––Arulpuram CETPArulpuram CETP 11Arulpuram CETP.. Arulpuram CETP.. 11
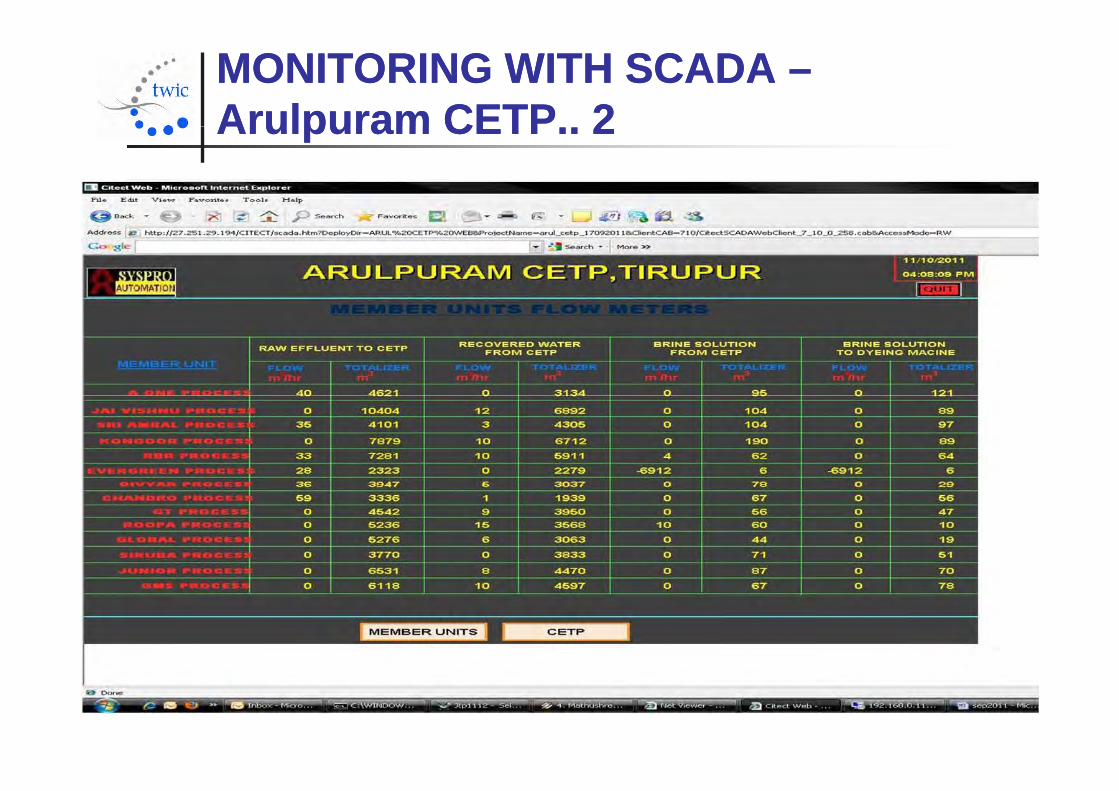
MONITORING WITH SCADA MONITORING WITH SCADA ––Arulpuram CETP 2Arulpuram CETP 2Arulpuram CETP.. 2Arulpuram CETP.. 2
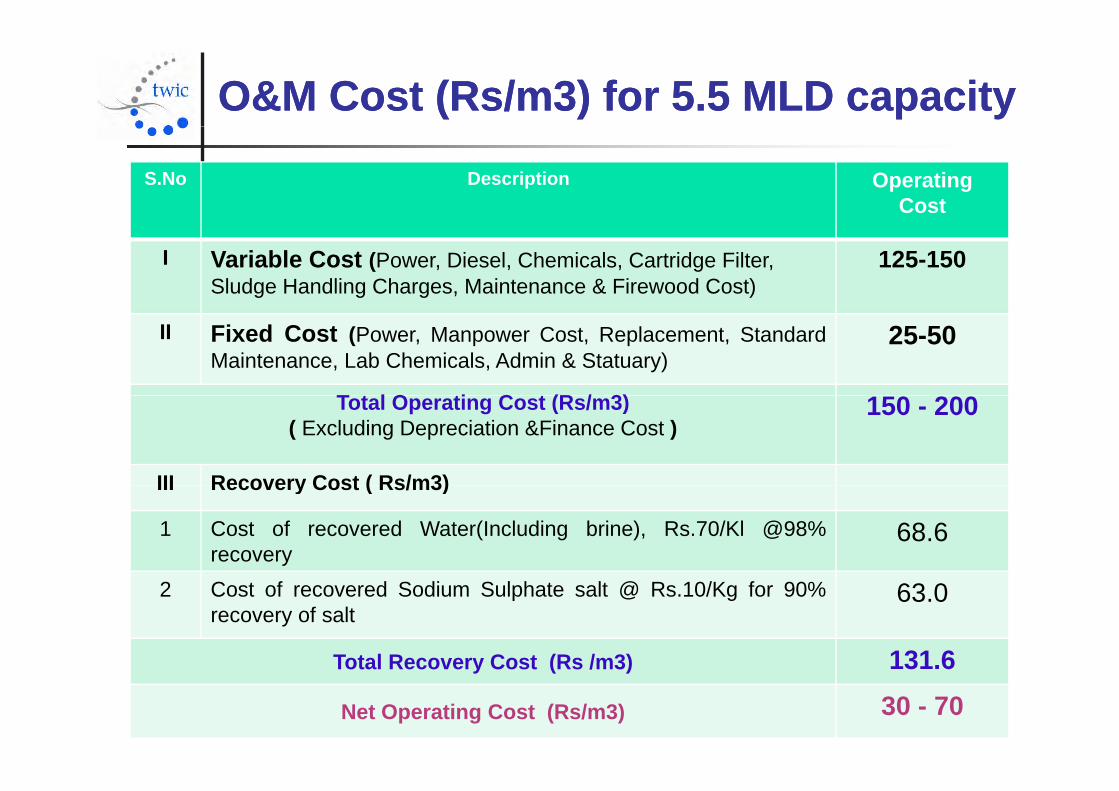
O&M Cost (Rs/m3) for 5.5 MLD capacityO&M Cost (Rs/m3) for 5.5 MLD capacity
S.No Description OperatingCost
I Variable Cost (Power, Diesel, Chemicals, Cartridge Filter, Sludge Handling Charges, Maintenance & Firewood Cost)
125-150
II Fixed Cost (Power, Manpower Cost, Replacement, StandardMaintenance, Lab Chemicals, Admin & Statuary)
25-50
T t l O ti C t (R / 3)Total Operating Cost (Rs/m3) ( Excluding Depreciation &Finance Cost )
150 - 200
III Recovery Cost ( Rs/m3)III Recovery Cost ( Rs/m3)
1 Cost of recovered Water(Including brine), Rs.70/Kl @98%recovery
68.6
2 Cost of recovered Sodium Sulphate salt @ Rs.10/Kg for 90%recovery of salt
63.0
Total Recovery Cost (Rs /m3) 131 6Total Recovery Cost (Rs /m3) 131.6
Net Operating Cost (Rs/m3) 30 - 70
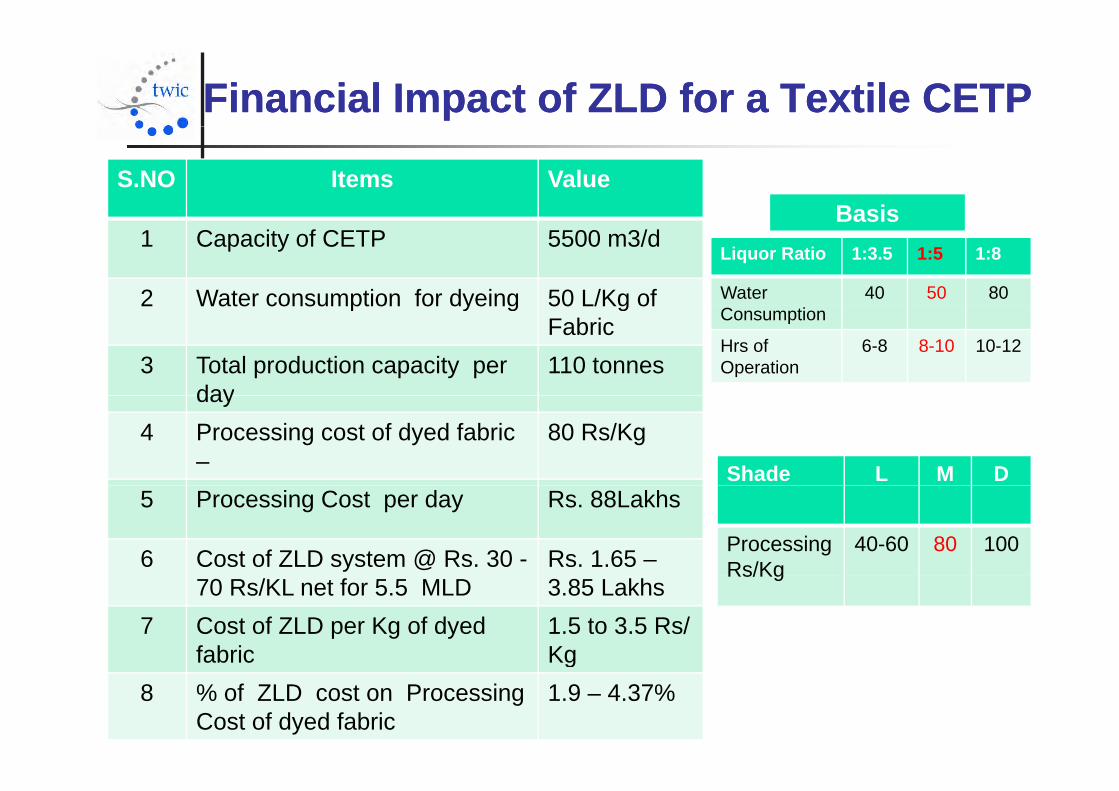
Financial Impact of ZLD for a Textile CETPFinancial Impact of ZLD for a Textile CETP
BasisS.NO Items Value
Basis1 Capacity of CETP 5500 m3/d
2 Water consumption for dyeing 50 L/Kg of
Liquor Ratio 1:3.5 1:5 1:8
Water 40 50 802 Water consumption for dyeing 50 L/Kg of Fabric
3 Total production capacity per day
110 tonnes
Consumption
Hrs of Operation
6-8 8-10 10-12
day4 Processing cost of dyed fabric
–80 Rs/Kg
Shade L M D5 Processing Cost per day Rs. 88Lakhs
6 Cost of ZLD system @ Rs. 30 - Rs. 1.65 – Processing Rs/Kg
40-60 80 100
70 Rs/KL net for 5.5 MLD 3.85 Lakhs7 Cost of ZLD per Kg of dyed
fabric1.5 to 3.5 Rs/ Kg
Rs/Kg
g8 % of ZLD cost on Processing
Cost of dyed fabric1.9 – 4.37%
RecognitionRecognitionRecognitionRecognition Government of Tamilnadu (G.O 132 dtd 31.12.12)
Has nominated TWIC as PMA for implementing onbehalf of the government for the following:
D di t d f d l t d O&M f CETP f Dedicated agency for development and O&M of CETPs forGoTN
Industrial water supply through Reuse of Sewerage water andpp y g gDesalination.
Government of India TWIC’s technology for ZLD recognized by Ministry of
Textiles and has been evaluated and accepted by theDept. of Science and Technology (DST).TWIC h b K l d t t th Mi i t f TWIC has been a Knowledge partner to the Ministry ofTextiles.

SectionSection GG :: TheThe WayWay ForwardForward forfor TirupurTirupuryy ppCETPsCETPs
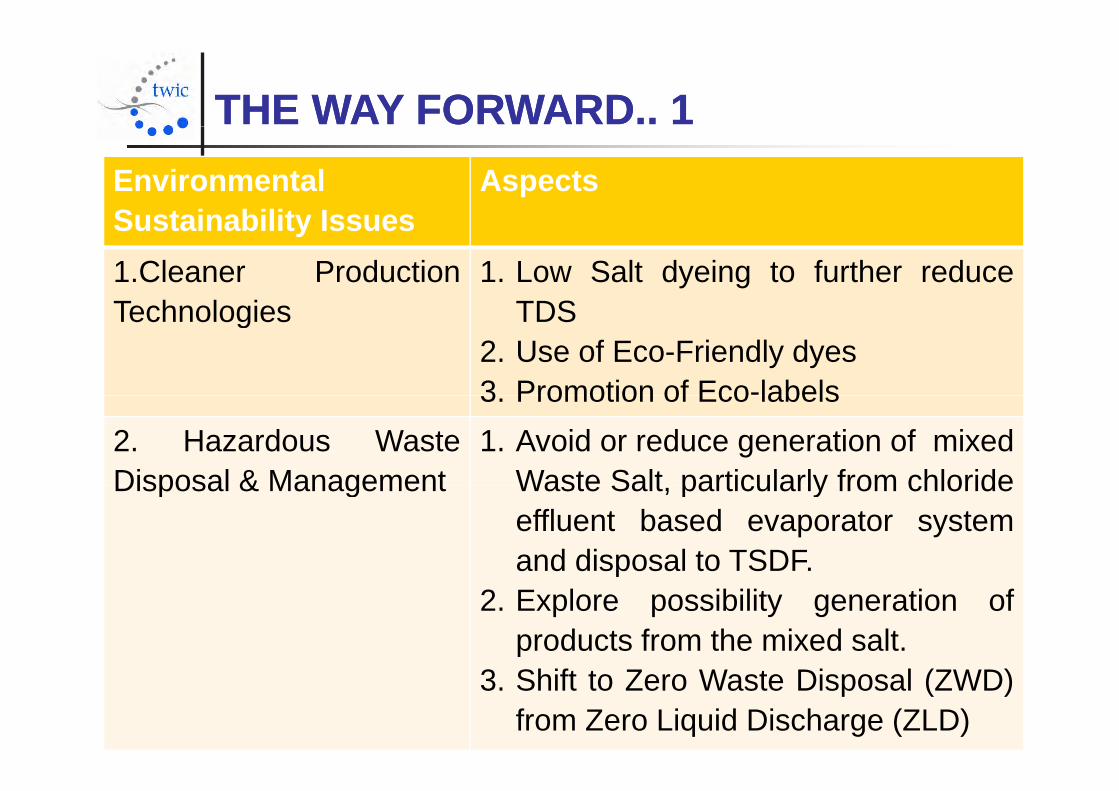
THE WAY FORWARD.. 1THE WAY FORWARD.. 1EnvironmentalSustainability Issues
AspectsSustainability Issues1.Cleaner ProductionTechnologies
1. Low Salt dyeing to further reduceTDSTechnologies TDS
2. Use of Eco-Friendly dyes3 Promotion of Eco-labels3. Promotion of Eco labels
2. Hazardous WasteDisposal & Management
1. Avoid or reduce generation of mixedWaste Salt particularly from chlorideDisposal & Management Waste Salt, particularly from chlorideeffluent based evaporator systemand disposal to TSDF.p
2. Explore possibility generation ofproducts from the mixed salt.
3. Shift to Zero Waste Disposal (ZWD)from Zero Liquid Discharge (ZLD)
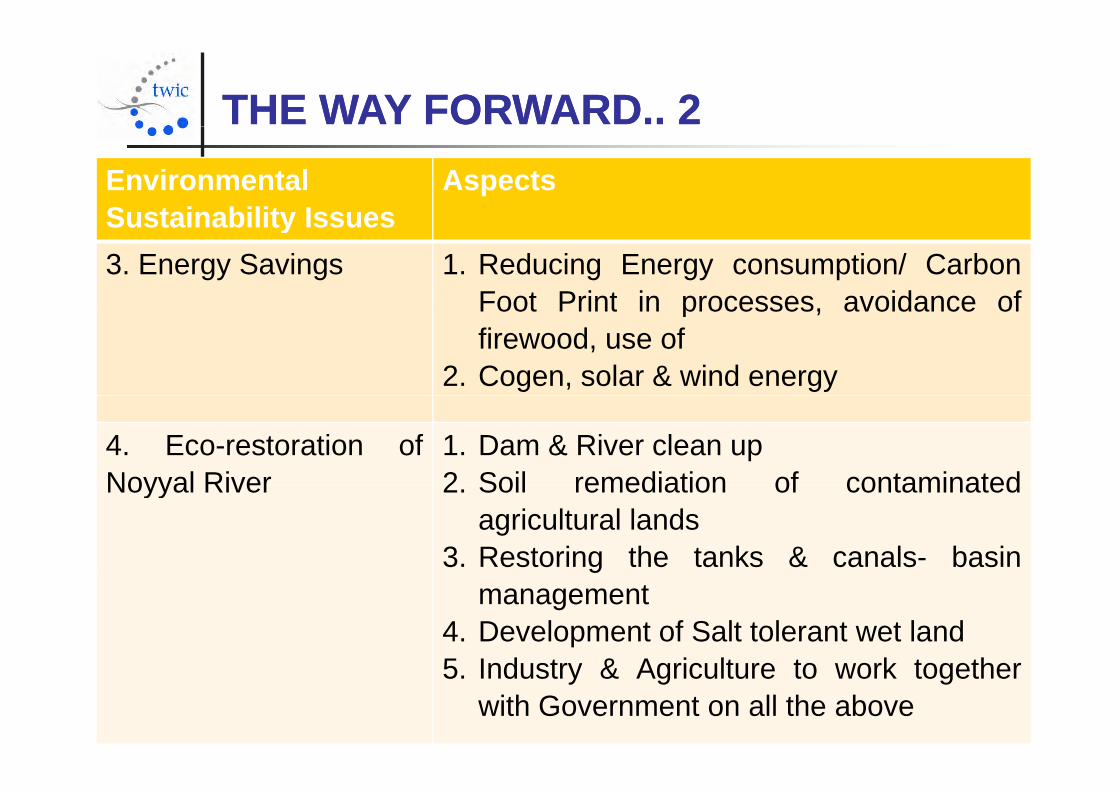
THE WAY FORWARD.. 2THE WAY FORWARD.. 2EnvironmentalSustainability Issues
AspectsSustainability Issues3. Energy Savings 1. Reducing Energy consumption/ Carbon
Foot Print in processes avoidance ofFoot Print in processes, avoidance offirewood, use of
2. Cogen, solar & wind energy
4. Eco-restoration ofNoyyal River
1. Dam & River clean up2 Soil remediation of contaminatedNoyyal River 2. Soil remediation of contaminated
agricultural lands3. Restoring the tanks & canals- basin
management4. Development of Salt tolerant wet land5 Industry & Agriculture to work together5. Industry & Agriculture to work together
with Government on all the above
SectionSection HH :: ApproachApproach toto ZLDZLD
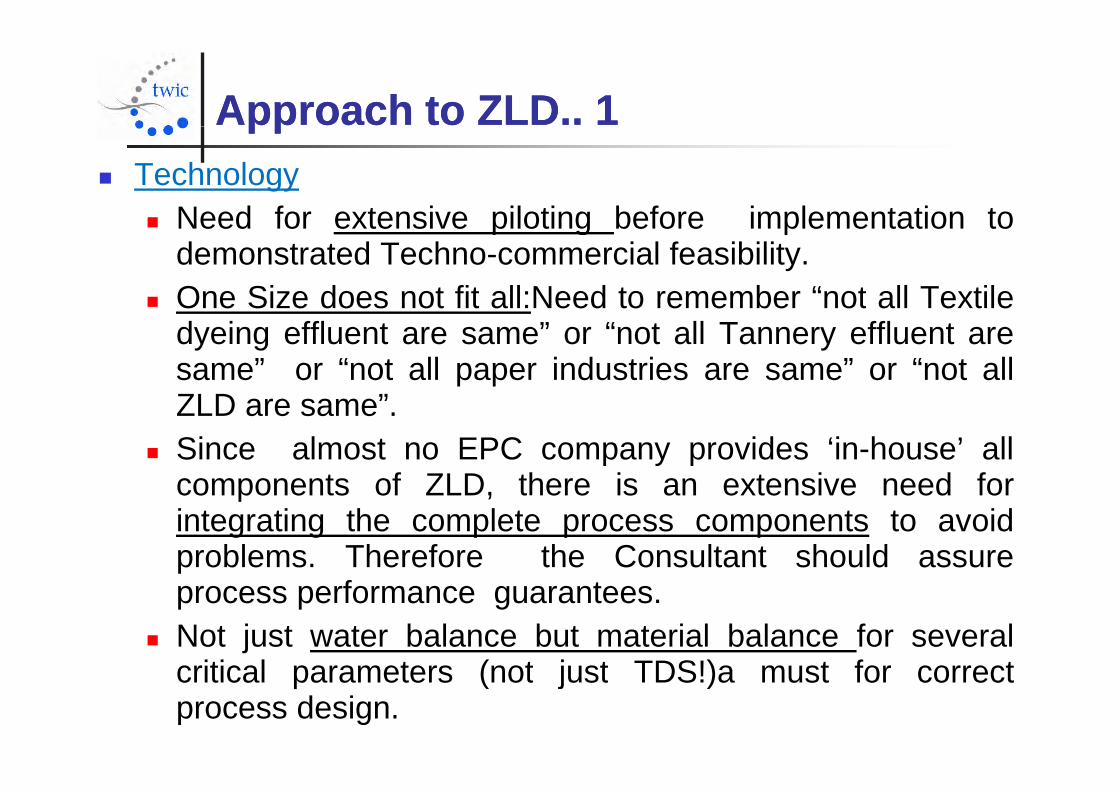
Approach to ZLD.. Approach to ZLD.. 11pppp Technology
Need for extensive piloting before implementation to Need for extensive piloting before implementation todemonstrated Techno-commercial feasibility.
One Size does not fit all:Need to remember “not all Textile One Size does not fit all:Need to remember not all Textiledyeing effluent are same” or “not all Tannery effluent aresame” or “not all paper industries are same” or “not allZLD ”ZLD are same”.
Since almost no EPC company provides ‘in-house’ allcomponents of ZLD there is an extensive need forcomponents of ZLD, there is an extensive need forintegrating the complete process components to avoidproblems. Therefore the Consultant should assureprocess performance guarantees.
Not just water balance but material balance for severaliti l t ( t j t TDS!) t f tcritical parameters (not just TDS!)a must for correct
process design.
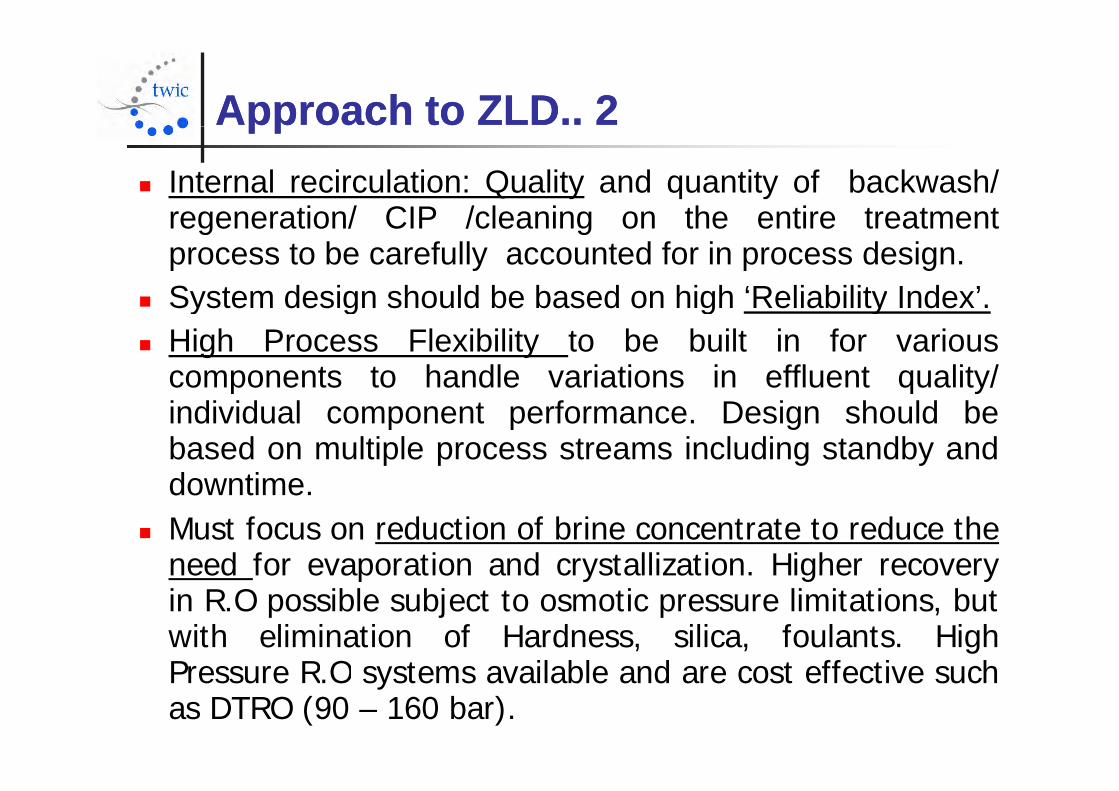
Approach to ZLD.. Approach to ZLD.. 22pppp Internal recirculation: Quality and quantity of backwash/
regeneration/ CIP /cleaning on the entire treatmentregeneration/ CIP /cleaning on the entire treatmentprocess to be carefully accounted for in process design.
System design should be based on high ‘Reliability Index’. System design should be based on high Reliability Index . High Process Flexibility to be built in for various
components to handle variations in effluent quality/individual component performance. Design should bebased on multiple process streams including standby anddowntimedowntime.
Must focus on reduction of brine concentrate to reduce theneed for evaporation and crystallization. Higher recoveryneed for evaporation and crystallization. Higher recoveryin R.O possible subject to osmotic pressure limitations, butwith elimination of Hardness, silica, foulants. HighP R O t il bl d t ff ti hPressure R.O systems available and are cost effective suchas DTRO (90 – 160 bar).
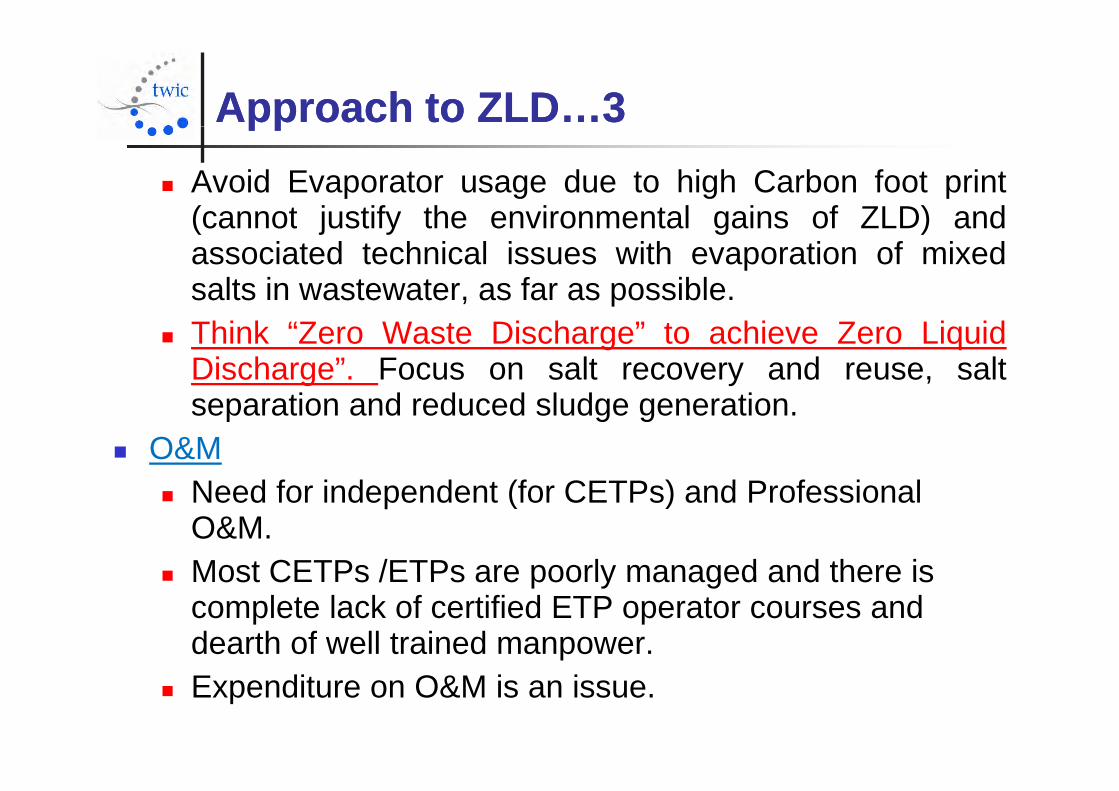
Approach to ZLD…3Approach to ZLD…3pppp Avoid Evaporator usage due to high Carbon foot print
(cannot justify the environmental gains of ZLD) and(cannot justify the environmental gains of ZLD) andassociated technical issues with evaporation of mixedsalts in wastewater, as far as possible.p
Think “Zero Waste Discharge” to achieve Zero LiquidDischarge”. Focus on salt recovery and reuse, salt
ti d d d l d tiseparation and reduced sludge generation. O&M
N d f i d d t (f CETP ) d P f i l Need for independent (for CETPs) and Professional O&M.
Most CETPs /ETPs are poorly managed and there is Most CETPs /ETPs are poorly managed and there is complete lack of certified ETP operator courses and dearth of well trained manpower.
Expenditure on O&M is an issue.
Approach to ZLD…4Approach to ZLD…4pppp
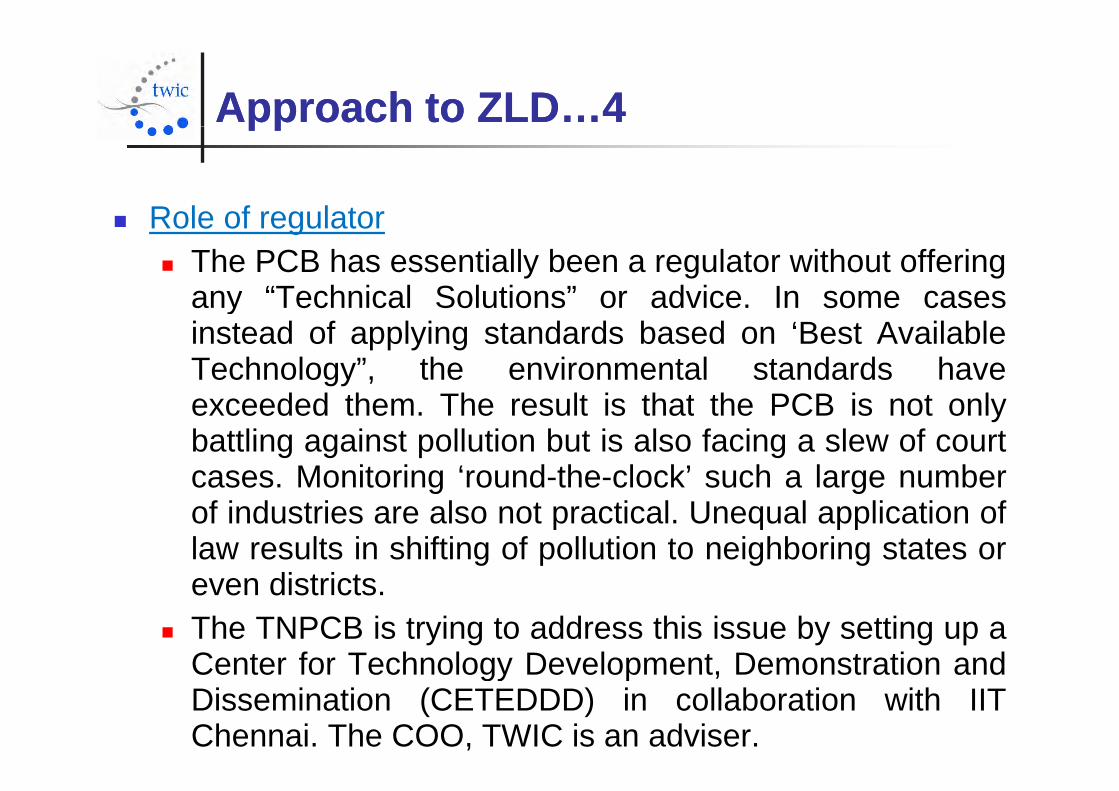
Role of regulator Role of regulator The PCB has essentially been a regulator without offering
any “Technical Solutions” or advice. In some casesany Technical Solutions or advice. In some casesinstead of applying standards based on ‘Best AvailableTechnology”, the environmental standards have
d d th Th lt i th t th PCB i t lexceeded them. The result is that the PCB is not onlybattling against pollution but is also facing a slew of courtcases. Monitoring ‘round-the-clock’ such a large numbercases. Monitoring round the clock such a large numberof industries are also not practical. Unequal application oflaw results in shifting of pollution to neighboring states or
di t i teven districts. The TNPCB is trying to address this issue by setting up a
Center for Technology Development Demonstration andCenter for Technology Development, Demonstration andDissemination (CETEDDD) in collaboration with IITChennai. The COO, TWIC is an adviser.
SectionSection II :: CONCLUSIONSCONCLUSIONS
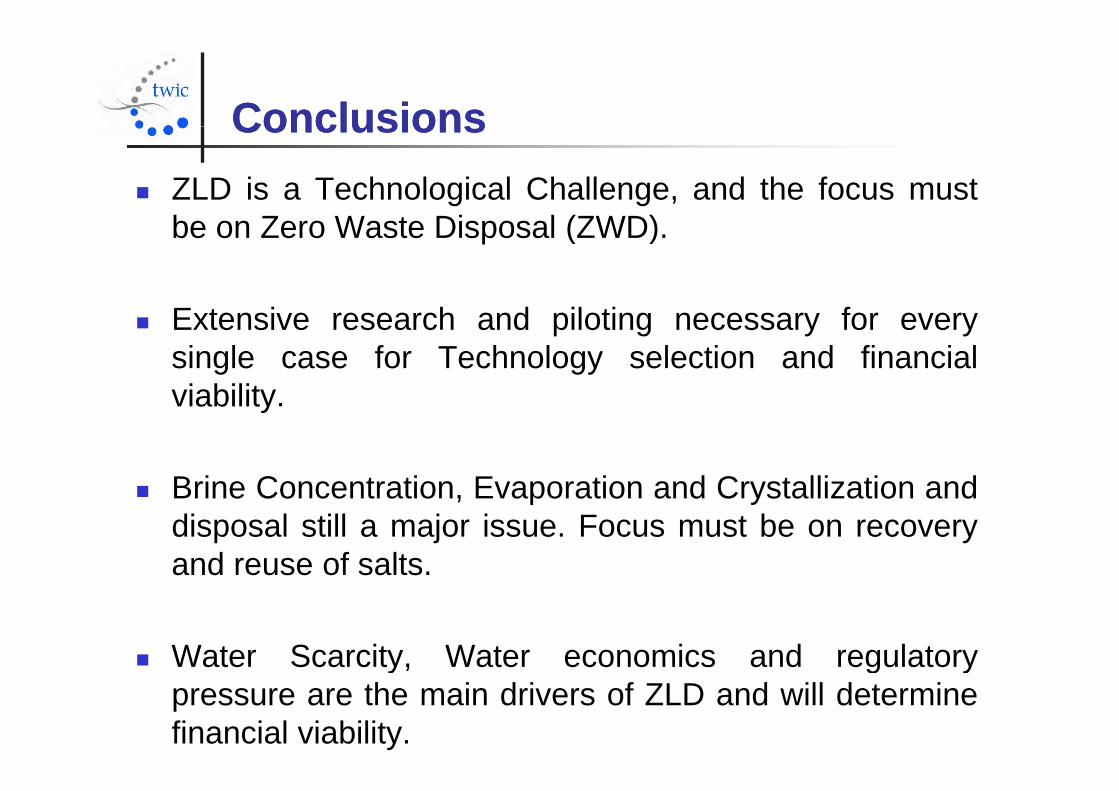
ConclusionsConclusionsConclusionsConclusions ZLD is a Technological Challenge, and the focus must
b Z W t Di l (ZWD)be on Zero Waste Disposal (ZWD).
Extensive research and piloting necessary for everysingle case for Technology selection and financialviabilityviability.
Brine Concentration Evaporation and Crystallization and Brine Concentration, Evaporation and Crystallization anddisposal still a major issue. Focus must be on recoveryand reuse of salts.a d euse o sa s
Water Scarcity, Water economics and regulatory Water Scarcity, Water economics and regulatorypressure are the main drivers of ZLD and will determinefinancial viability.
Name : I. Sajid Hussain
Designation : Chief Operating Officer
Contact address : Tamilnadu Water Investment Photograph of Photograph of
Company Ltd,
“Polyhose Towers”(SPIC Annex BLDG)
1st Floor,No.86, Mount Road,
speakerspeaker
Guindy, Chennai – 600 032
Email : [email protected]
Phone : 044 – 223561890/ 91
Mob : +91 9940676679
Website : www.twic.co.in
31/01/2014 International Conference on “Green Enterprises and Green Industrial Parks”