
Proceedings of the I.R.E. February
97
90 Proceedings of the I.R.E. February characteristic the tube current will experience con- siderable distortion but the voltage maintained across the tuned circuit may still be very pure. The harmonic components of the latter will not in general be more than two or three per cent under these ad- verse conditions provided the ratio L/C is kept small. 12 / Ez E2 ICC '58 rvet 41u= -93.7v et. = 86.5" eP E, -4" =24 7005x RC I2 E2 1. E2 7280sz Fig. 5-Cathode-ray oscillograms showing oscillation over the tube characteristic as a function of the quantity L/ RC. Good wave form is accompanied by good fre- quency stability. The latter is important since when once the tuned circuit parameters are adjusted it is desirable that the frequency remain constant. Nota- ble work on the frequency stability of dynatron oscillators has been carried on by Groszkowski,4 Moullin,5 van der Po1,5 and others. Their results ap- ply equally well to the transitron oscillator. It has been shown that variations in frequency depend di- rectly on the amount of harmonics present in the oscillation voltage. If the voltage contains no har- monics or if the amount of _harmonics remains con- stant the frequency of the system will also remain constant irrespective of any changes in the operating conditions such as changes in the supply voltage. Under normal conditions the transitron oscillator will not experience changes in frequency of more than a few hundredths of one per cent for relatively large variations in the direct anode voltage if the change in tube capacitance is negligible. In these re- spects it may be compared to a crystal oscillator without temperature control. It may be safely stated that in general the wave form and frequency stability of the oscillations are much better than those of the 4 J. Groszkowski, "The interdependence of frequency varia- tion and harmonic content, and the problem of constant -fre- quency oscillators," PROC. I.R.E., vol. 21, pp. 958-981; July (1933). 6 E. B. Moullin, "The effect of curvature of the characteristic on the frequency of the dynatron generator," Jour. I.E.E. (London), vol. 73, no. 440, pp. 186-195; August, (1933). 6 B. van der Pol, "The nonlinear theory of electric oscilla- tions," PRoc. I.R.E., vol. 22, pp. 1051-1086; September (1934). ordinary back -coupled triode oscillator operating under similar circumstances. The same may also be said for the amplitude of the oscillations. It will be shown later that as the frequency is changed, for example by varying the capacitance C, the ampli- tude of oscillations will not vary greatly over a wide range of frequency. FREQUENCY OF OSCILLATION For general use it is not necessary to calibrate the oscillator, since the frequency may be predicted fairly accurately from the formula / 1 27r 1/ LC R2 L2 (2) This expression, easily derived,5'7 is based on the as- sumption that the tuned circuit is connected to a constant negative resistance satisfying (1). Because of the excellent wave form of the transitron oscil- lator, equation (2) has been found to hold closely even when operating well over the bends of the tube characteristic. The effect of the curvature of the characteristic on the frequency has been carefully studied and reported in the literature,4,5,° As men- tioned previously, the change in frequency is caused by the introduction of slight harmonics as the bends of the characteristic are traversed. The presence of the harmonics causes the frequency to be lower than that given by (2). In extreme cases this correction may amount to fifty cycles in one million. In the audio -frequency range the correction is negligible. For best results the coil resistance R should be as low as possible. The quantity R2/L2 is then small in com- parison with 1/LC and (2) reduces to 1 f ~ 2 (3) 7N/re Additional factors which influence the frequency may well be noted here. Thus if the coil L consists of an iron -cored choke, changes in the direct anode current flowing through it may change the induc- tance of the coil two or three per cent. This may be corrected by employing parallel feed for the direct anode voltage or by using air -core coils. The latter is to be preferred if space and weight are not important since the choke required for the parallel feed will still influence the oscillation frequency to some ex- tent. If a variable inductance is to be used to extend the frequency range, short-circuiting out the unused portion of the inductance will serve to cut down har- 7 A. W. Hull, "The dynatron, a vacuum tube possessing negative resistance," PROC. I.R.E., vol. 6, pp. 5-37; February, (1918).
Transcript of Proceedings of the I.R.E. February

90 Proceedings of the I.R.E. February
characteristic the tube current will experience con-siderable distortion but the voltage maintainedacross the tuned circuit may still be very pure. Theharmonic components of the latter will not in generalbe more than two or three per cent under these ad-verse conditions provided the ratio L/C is kept small.
12 /
Ez
E2
ICC
'58 rvet41u= -93.7vet. = 86.5"ePE,
-4" =24 7005xRC
I2
E2
1.
E2
7280sz
Fig. 5-Cathode-ray oscillograms showing oscillation over thetube characteristic as a function of the quantity L/ RC.
Good wave form is accompanied by good fre-quency stability. The latter is important since whenonce the tuned circuit parameters are adjusted it isdesirable that the frequency remain constant. Nota-ble work on the frequency stability of dynatronoscillators has been carried on by Groszkowski,4Moullin,5 van der Po1,5 and others. Their results ap-ply equally well to the transitron oscillator. It hasbeen shown that variations in frequency depend di-rectly on the amount of harmonics present in theoscillation voltage. If the voltage contains no har-monics or if the amount of _harmonics remains con-stant the frequency of the system will also remainconstant irrespective of any changes in the operatingconditions such as changes in the supply voltage.Under normal conditions the transitron oscillatorwill not experience changes in frequency of morethan a few hundredths of one per cent for relativelylarge variations in the direct anode voltage if thechange in tube capacitance is negligible. In these re-spects it may be compared to a crystal oscillatorwithout temperature control. It may be safely statedthat in general the wave form and frequency stabilityof the oscillations are much better than those of the
4 J. Groszkowski, "The interdependence of frequency varia-tion and harmonic content, and the problem of constant -fre-quency oscillators," PROC. I.R.E., vol. 21, pp. 958-981; July(1933).
6 E. B. Moullin, "The effect of curvature of the characteristicon the frequency of the dynatron generator," Jour. I.E.E.(London), vol. 73, no. 440, pp. 186-195; August, (1933).
6 B. van der Pol, "The nonlinear theory of electric oscilla-tions," PRoc. I.R.E., vol. 22, pp. 1051-1086; September (1934).
ordinary back -coupled triode oscillator operatingunder similar circumstances. The same may also besaid for the amplitude of the oscillations. It will beshown later that as the frequency is changed, forexample by varying the capacitance C, the ampli-tude of oscillations will not vary greatly over a widerange of frequency.
FREQUENCY OF OSCILLATION
For general use it is not necessary to calibrate theoscillator, since the frequency may be predictedfairly accurately from the formula
/ 127r 1/ LC
R2
L2(2)
This expression, easily derived,5'7 is based on the as-sumption that the tuned circuit is connected to aconstant negative resistance satisfying (1). Becauseof the excellent wave form of the transitron oscil-lator, equation (2) has been found to hold closelyeven when operating well over the bends of thetube characteristic. The effect of the curvature of thecharacteristic on the frequency has been carefullystudied and reported in the literature,4,5,° As men-tioned previously, the change in frequency is causedby the introduction of slight harmonics as the bendsof the characteristic are traversed. The presence ofthe harmonics causes the frequency to be lower thanthat given by (2). In extreme cases this correctionmay amount to fifty cycles in one million. In theaudio -frequency range the correction is negligible.For best results the coil resistance R should be as lowas possible. The quantity R2/L2 is then small in com-parison with 1/LC and (2) reduces to
1
f ~ 2(3)7N/re
Additional factors which influence the frequencymay well be noted here. Thus if the coil L consists ofan iron -cored choke, changes in the direct anodecurrent flowing through it may change the induc-tance of the coil two or three per cent. This may becorrected by employing parallel feed for the directanode voltage or by using air-core coils. The latter isto be preferred if space and weight are not importantsince the choke required for the parallel feed willstill influence the oscillation frequency to some ex-tent. If a variable inductance is to be used to extendthe frequency range, short-circuiting out the unusedportion of the inductance will serve to cut down har-
7 A. W. Hull, "The dynatron, a vacuum tube possessingnegative resistance," PROC. I.R.E., vol. 6, pp. 5-37; February,(1918).

FEBRUARY 1939VOLUME 27 NUMBER 2
Broadcast studio a -f systems designTransitron oscillatorDirectivity of metal horns-Fixed-focus electron gunVelocity -modulated tubesTroposphere, stratosphere ionizationCommunication by phase modulation"Flat -shooting" antenna arraysTelevision pickup tubeLow -frequency alternatorIonosphere characteristics
Institute of Radio Engineers

96 Proceedings of the I.R.E. February
in these tests to make them a part of the receiver.The relative merits of these horns were determinedboth from an intercomparison of the received powerwith and without the horn attached and from the
30X
TRANSMITTER
Fig. 2-Arrangement of apparatus used in obtaining directionalcharacteristics of pipes and horns.
sharpness of the directional patterns plotted frommeasurements made as the horns were pointed atvarious angles relative to the incoming signal. To-gether, these two kinds of information supply a fairlycomplete specification of their properties.
In some cases the transmitter and receiver werelocated at opposite corners of a room about 20 feetsquare. In others the test signals were transmittedout of an upstairs window to the receiver locatedon the ground a 100 or so wavelengths away. Resultsfrom the two methods were in general agreement.Fig. 2 shows the general arrangement of the appara-tus when the indoor experiments were in progress.
It should be possible to use as the transmitter anyof the conventional forms of generators such as, for
TUNEDCOAXIAL
C
ADJUSTABLEPISTON, P
Fig. 3-Schematic of the component parts of the receiver con-sisting of a conical horn and a cylindrical pipe with tuneddetector and adjustable piston.
instance, the Barkhausen, magnetron, or negative -grid types. The one actually used was a wave -guideadaptation of the Barkhausen oscillator. It has al-ready been described.' The corresponding receiver isshown in schematic form by Fig. 3. A photograph isshown in Fig. 4. It will be observed that protractorsare provided on the two principal axes so that boththe angles of azimuth and elevation may be meas-ured.
The receiver proper is of the resonant -cavity typeand is made up of a short section of tuned wave guidebounded at one end by a movable piston and at theother by a diametral conductor of adjustable length.This conductor carries a calibrated silicon -crystalrectifier of special construction whose direct -currentresponse, measured either on a potentiometer or amicroammeter, enables relative gains to be meas-ured. The construction of the detector and the ar-rangement of its associated tuned wires are bothshown in Fig. 5 for each of two alternate arrange-ments. This tuning together with the piston adjust-ment may be regarded as part of the process ofmatching the detector to the horn pickup device.When this matched condition has been obtainedthere is not only approximately an optimum of re -
Fig. 4-The complete receiver and mounting.
ceived power but there is also a minimum of stand-ing wave in the space between the horn and the de-tector. Under this condition the receiver as a wholeapproximates a perfect absorber.
The condition of minimum reflection may, if neces-sary, be verified by measurements with a small trav-eling detector which samples the wave power in thepipe between the cavity and the horn. The construc-tion of the latter device is shown by Fig. 6. It con-sists of a crystal detector preferably of the form shownas Fig. 5(b) provided with an extremely short pickupwire extending through a narrow slot cut in the topof the pipe. A rack-and-pinion drive permits smoothmotion along the slot. A centimeter scale is useful inmeasuring the position of the detector. The pickupwire on the detector is made just long enough to givea readable deflection on the direct-current microam-meter to which the detector is connected and whenproperly adjusted it offers no appreciable discontinu-ity to the passing waves and consequently does not

1939 Hahn and Metcalf: Velocity -Modulated Tubes 113
distance without a great increase in cross section,and because of the strong focusing field this systemis relatively insensitive to stray fields. In general alength of from 1 to 4 inches is sufficient for mostapplications unless the frequency of the velocitymodulation is very low.
The primary problem in the design of retarding -field collectors is one of shaping the collector so thatthe effects of orbital velocity of the electrons arereduced to a minimum, and the returning beam isdirected at the proper angle. With cylindrical beamsit has been found that a collector with spherical shapeis quite satisfactory, and yields current -voltage char-acteristics which have conductances of from 200 to2000 micromhos per milliampere of beam current.The exact radius of curvature is a function of the
-301,
+3 0 V.
+500 V.
COLL ECTOR+ 4 V
Fig. 7
space -charge density and the focusing fields and istherefore somewhat difficult to calculate. In thereceiving tubes tested this radius was from 1/2.inch .
to 1 inch.TEST RESULTS
OscillatorsThe simplest type of oscillator utilizing the fore-
going principles is one using the retarding -field col-lector in either of the processes previously described.Fig. 7 shows a cross section of the tube with attachedcircuits, while Fig. 8 is a photograph of the tube withthe oscillating circuit in place. This type of tube oscil-lates with at least a ± 15 per cent range of any volt-age at any one frequency and by changing the directvoltage of the radio -frequency grid it will oscillateover a frequency range of 5 to 1. The major portionof the experimental work on this type of tube wasdone with beam currents of one milliampere or less,but even with this small current, oscillations wereeasily obtained at a wavelength of 14 centimeters. Byobserving the anode characteristic during oscillationit is estimated that the beam current was modulatedfrom 30 per cent to 100 per cent and that the output
voltage was the order of one volt. Further tests wereconducted with tubes having beam currents of 30milliamperes, in which case about four watts of radio -frequency power were obtained in a lamp load at awavelength of 50 centimeters.
3Fig. 8
The major application of this type of oscillatorwas a superregenerative receiver, the quench fre-quency being applied on either the collector or thefocusing grid. Receivers of this type were tested in
OUTPUT
OSCI LLATORGP 11D4*L
400V.
400V.DETECTORGR 11)41
CATHODEFig. 9
the field on 37- and 25 -centimeter transmission, andproved to be very simple to construct.
Tubes for superheterodyne reception were con-structed as shown in Fig. 9. The signal is received

114 Proceedings of the I.R.E. February
on grid No. 1 which velocity modulates the beam atsignal frequency, while grid No. 2 velocity modulatesthe beam at oscillator frequency. By operating theretarding -field collectors at a point of maximumcurvature the current in this element has an inter-mediate -frequency component. In order to allow thereturning electrons to cause oscillation in the oscil-lator grid but not in the signal grid, the collector istilted at an angle so that the returning beam will
Fg. 10
strike the end shield between these two grids. If it isdesired to use a separate oscillator, the collector maybe tilted at an angle sufficient to allow the returningelectrons to strike the last end shield. Tubes of thistype were tested at 37 centimeters with an 18 -mega-cycle intermediate -frequency amplifier and provedto be good converters. The beam current was lessthan one milliampere and the highest voltage was350 volts.
RADIO -FREQUENCY AMPLIFIERS
Radio -frequency amplifiers were first tested at 50to 200 megacycles in order to facilitate accurate
measurement of the radio -frequency voltages. Fig.10 is a cross section of a radio -frequency amplifierfor receiver use in this frequency band utilizing drift -tube sorting. Fig. 11 is a photograph of a similartube in metal.
The elements numbered 2, 4, 6, 8, 10, 12, 14, and15 were operated at 300 volts direct current. Thedirect voltage of radio -frequency grid No. 3 andradio -frequency anode No. 13 were adjusted for .
maximum output at the frequency used. This usuallywas about 10 to 30 volts positive. Focusing elements5, 7, 9, and 11 were connected together and thevoltage adjusted to give maximum beam current.This occurred at about 30 volts positive.
The mutual conductance of grid No. 3 to anodeNo. 13 was measured by first obtaining the voltagegain between them and then measuring the outputimpedance by cutting the voltage across the outputcircuit to one half, with a shunt resistance. With a
-----i.
1L, I
4 5
Fig. 11
beam current of 0.8 milliampere and a frequency of100 megacycles the mutual conductance was about200 micromhos. This value checked calculationswithin the accuracy that the average velocity in thedrift tube could be estimated. Although the value ofmutual conductance obtained in this particular tubewas probably too low for practical application atthis frequency, it illustrates the principles involved.It is also interesting to note that the operation isnot at all critical to voltage, and that both the inputand output resistance of the tube were so high as notto affect the attached circuits.
Radio -frequency amplification by means of retard-ing -field action was also tried. In this case the return-ing conduction-current -modulated beam was col-lected on an element at one side of the axis by tiltingthe collector. The mutual conductance of this typeof tube depends almost entirely on the slope of thecollector current -voltage characteristic, which in thecase of the tube tested was low, the mutual con-ductance being only 300 micromhos.
Radio -frequency amplifiers using drift -tube sort-ing, with auxiliary magnetic focusing have provedvery effective for high-power outputs. Coils surround-ing the tube provide sufficient focusing field so that

Kurtz and Larsen: A Low -Frequency Alternator 149
OrI
c = Cmin -Eta (1 - cos cot). (7)
From this expression the maxmium value of c be-comes I
= Cmin + -Eco
(2).
Solving (8) for I yields
or
where
EwI = (Cm= - Cmin)
2
I = CcoE
Cmaz - CminC
2
(8)
(9)
(10)
With resistance added to the circuit the variablecondenser will neither completely charge nor dis-charge during each half cycle, hence (9) may bewritten thus
I < CcoE. (11)
It is now possible to compute the magnitude of theIR sin cot term in the denominator of (5) and to com-pare it with E. This term should be small comparedto E if c is to vary sinusoidally. Hence, from (11),
IR < CwER E,whence
CcoR << 1. (12)
The physical dimensions of the alternator show that(12) can be maintained without making R too small.Hence (5) may be simplified by dropping the secondterm in the denominator, thus:
1c = -[CoR/ sin cot --cos cot + M].
Combining the sine and cosine terms, yields
c =1-[ M - 1 + (CoRco)2 cos (cot + a)] (13)
co
where tan a = CoRco. From (13) it is apparent that,
= -[ M -I Y1 + (C0R0.)-1 , (14)co
and1
Cmin =E-[ M - --Y1 + (CoRco)2] . (15)
Using (14) and (15) the expression for C of (10) be-comes
Cmaz Cmin /2 EcoN/1
+ (CoRO./) . (16)
Solving for M/E from (15) and using the value for Cfrom (16) yields
M/E = Cmin + C. (17)
Substituting the values for C from (16) and M/Efrom (17) into (13) gives the final desired expressionfor c, namely,
c = Cmin + C[1 - cos (cot + a)]. (18)
If, therefore, the restrictions as set forth by (12) areadhered to, a sinusoidal voltage may be producedacross R by giving c a sinusoidal variation; bothphase and magnitude relations between current andcapacitance are given by (18).
At the lower frequencies considered in this alter-nator the term CoRco under the square -root radicalin (16) is much smaller than unity. Hence where Cis known the current maximum becomes, with butnegligible error, from (16)
I = CEw. (19)
It follows, then, that for a given alternator the cur-rent output through the grid resistance R is linearlyproportional to the battery potential E and to:thefrequency.
DESCRIPTION OF ALTERNATOR
The assembled view is shown in Fig. 3. The rotorand stator designs are shown in Fig. 4. The stator
Fig. 3 --Assembled view of the electrostaticlow -frequency alternhtor.
consists of a metal -foil pattern mounted on and in-sulated from a ground steel disk. The foil is insulatedfrom the disk by a thin sheet of paper and a tar -compound adhesive which secures the foil firmly tothe paper and the disk.

150 !Proceedings of the I.R.E.
The ordinates of the pattern are measured fromthe inside of the ring radially toward the center of
Fig. 4-Rotor and stator designs of thelow -frequency alternator.
the disk and are plotted for a total of 180 degrees.The expression for plotting the ordinates is given by
y = R - R2 - (2RH - H2) sin 0, (20)
where y is the ordinate, R the radius from the centerof the disk to the inside circumference of the ring,H the maximum ordinate, 0=xS/R where x is arclength along the circumference having radius R, andS the number of sectors or patterns per disk; in thiscase S =1. The derivation of (20) was given by theauthors in a previous paper;' it is thus sufficient tostate here that the result gives a sinusoidal changein coincident area as the rotor sector passes over thestator pattern.
The rotor sector is mounted on a rotor disk in thesame manner as the stator pattern is mounted on thestator disk. The sector with its edges radially cut, asshown, occupies one half of the rotor area.
This type of mounting serves the dual purpose ofaffording complete shielding and directing the elec-trostatic flux lines in such a fashion that the capaci-tance is practically proportional to the coincidentarea of the rotor and stator sectors; thus the capaci-tance variation is sinusoidal in nature and the ex-pression as set forth by (18) is satisfied.
The stator -pattern ring extends beyond the rotorso as to permit connection to a grid -resistance leadwithout distorting the electrostatic field. The rotorsector is connected to a battery for potential supply
1 E. B. Kurtz and M. J. Larsen, "An electrostatic generator,"Trans. A.I.E.E. (Elec. Eng.), vol. 54, pp. 950-955; September,(1935).
by means of a light brush, not shown, which rides onthe slip ring. All other parts of the model aregrounded.
The stator disk is supported by three hard -rubberrings, each of which has a hole bored off center andslides on a rod so that centering and separation dis-tance from the rotor are easily controlled. Thedimensions of the alternator may be estimated bycomparison with the foot -scale shown at the bottomof the assembled view. While this model was drivenby means of a pulley with belt drive, any drive issatisfactory which does not transmit excessive vibra-tion to the rotor.
CALIBRATION AND OPERATION
The circuit parameters for the alternator just de-scribed were approximately
C=50 micromicrofarads when rotor and statorwere relatively close,
Co = 200 micromicrofarads,R=0.5 megohm or less,co =300 or less, andE=0 to 300 volts.
These values satisfy the condition imposed by (12)and make CoRco so small that (16) may be writtenas (19). Thus the voltage across the grid resistor be-comes
Ea = IR = CERco. (21)
If facilities are available for measuring C accur-ately, no further calibration is necessary, assuming,of course, that E, R, and w are known. C, however,can be measured, using (21), by means of a vacuum -tube voltmeter. The alternator is run at a relativelyhigh speed so that a frequency of 40 or 50 cycles persecond is generated; at this frequency the voltmeter,across R, may be read, and knowing the other values,C may be computed. Once found, assuming C is of avalue that satisfies (12), it remains the same andmay be used in (21) at any frequency. Thus E, maybe controlled by the three remaining independentvariables, namely, E, R, and w.
The wave form will be equally good at all fre-quencies below the upper limit because the electro-static field between rotor and stator is purely a spacefunction. Hence frequencies of only fractional per-iodicity may be generated with assurance that theyare relatively pure sine waves.

Broadcast Studio Audio-Frequency Systems Design*HOWARD A. CHINNt, MEMBER, I.R.E.
Summary-The operating and performance requirements ofmodern broadcast studio audio frequency facilities are presentedtogether with specific fidelity characteristics as determined by thepresent state of the art. A typical studio audio frequency systemdesign, incorporating the features necessary for practical operations,is also given.
INTRODUCTION
HE design of audio -frequency facilities forbroadcast stations divides itself, naturally, intotwo categories. First, there is the design of the
individual circuit components. Second, there is thedesign of the complete system utilizing these com-ponents. System design, furthermore, may be sub-divided into studio, portable master control (pro-gram distribution), building monitoring, and trans-mitter audio -frequency facilities.
This paper, which is confined to studio audio -fre-quency systems, outlines present-day operating andperformance requirements. Specific fidelity charac-teristics are stated and a typical system design pre-sented.
OPERATING REQUIREMENTS
The operating requirements of a complete studioaudio -frequency system can readily be outlined.Facilities are required for amplifying the exceedinglylow output voltage of present-day microphones tothe level that will permit transmission, without im-pairment of quality, on available program circuits.Furthermore, means are required for combining intoone program channel, in any desired proportion,program elements from several sources. This process,which is known as "mixing," provides the multiple -microphone, transition, and "fading" effects whichcontribute so much to program continuity. Finally,means are needed for adjusting the resulting programmaterial to the desired power level without affectingthe "balance" which has been achieved by the mixingoperation. A master gain control is used for thispurpose.
In order that a fine degree of control may be main-tained over the resulting program material, it isnecessary to supplement the transmission facilitieswith visual and aural monitoring apparatus. Volumeindicator instruments and loud speakers are used forthis purpose.
* Decimal classification: 8550. Original manuscript re-ceived by the Instil ute, J tine 6, 1938; revised manuscript receivedby the Institute October 5, 1938. Presented before ThirteenthAnnual Convention, New York, N. Y., June 16, 1938
f Columbia 13roadcasting System, Inc., New York, New York.
February, 1939
"Cue" facilities are also required so that the occu-pants of both the studio and the control room mayhear the program that is in progress prior to the be-ginning of their own performances. Finally, it is
necessary to provide means for communication be-tween the control room and the studio itself duringthe course of rehearsals. These "rehearsal -break"facilities permit the program producer in the controlroom to interrupt the cast, rehearsing in the studio,in order to direct them in their work,
One of the foremost requisites of all broadcastfacilities is continuity of service throughout thebroadcast day. The need for such reliability arisesfrom the psychological reaction of the listener to aprogram interruption and from the keen competitionbetween the many stations. In planning the facilitiesit is necessary, therefore, to take many precautionarymeasures and to provide for the immediate restora-tion of service in the event that any piece of equip-ment becomes defective.
Emergency facilities are also required for use inthe event that any of the regular power supplies fail.These include the 110 -volt alternating -current pri-mary power source as well as any low or high voltagealternating- or direct -current power that is required.
Although the general operating requirements of acomplete studio audio -frequency system may thusbe simply stated, the actual accomplishment of thedesired results sometimes involves rather complexcircuit arrangements.
PERFORMANCE REQUIREMENTS
The over-all electrical performance requirementsof the complete studio audio -frequency facilities aredetermined, to a large extent, by such factors as thecharacteristics of the best commercially availableradio receivers, the ability of the ear to detect loss infidelity, and the economic aspects that are involved.Bearing these factors in mind, the present-day per-formance requirements of a modern broadcast studiosystem can be stated readily. It is to be noted thatthe following characteristics are those of the studiofacilities alone, and are not necessarily representativeof the over-all performance requirements of a com-plete broadcast installation.
The response -frequency characteristic of the en-tire program channel (neglecting any equalizationthat may be used to correct for shortcomings ofassociated microphones) should not deviate from the
Proceedings of the I.R.E. 83
158 Proceedings of the I.R.E. February
Contributors
H. G. BOOKER
Henry George Booker was born onDecember 14, 1910, at Barking, Essex,England. In 1930 he received the B.A.(Hons.) degree from the University ofLondon, and was a scholar of Christ'sCollege, Cambridge, from 1930 to 1934,
CLEDO BRUNETTI
being Wrangler at the University of Cam-bridge in 1933. Mr. Booker was an AllenScholar at the University of Cambridgefrom 1934 to 1935, Smith's Prizeman in1935, and received the Ph.D. degree in1936. At the present time he is a Fellowof Christ's College and Faculty AssistantLecturer in Mathematics at the Universityof Cambridge. During his sabbatical year,1937-1938, he engaged in ionosphere re-search at the Department of TerrestrialMagnetism at the Carnegie Institution ofWashington. Mr. Booker is a Fellow of theCambridge Philosophical Society.
Cledo Brunetti (A '37) was born April1, 1910, at Virginia, Minnesota. He re-ceived the B.E.E. degree from the Univer-
sity of Minnesota in 1932 and the Ph.D.degree in 1937. From 1932 to 1936 he wasa Teaching Fellow in the department ofelectrical engineering at the University ofMinnesota and from 1936 to 1937, an in-structor. Since 1937 Dr. Brunetti has beenan instructor in electrical engineering at
H. A. CHINN
Lehigh University. He is a member of TauBeta Pi, Eta Kappa Nu, and Sigma Xi.
40,
Howard A. Chinn (A '27-M '36) wasborn in New York City on January 5,
M. G. CROSBY
1906. He attended the Polytechnic Insti-tute of Brooklyn, later going to Massachu-setts Institute of Technology where hereceived the B.S. degree in 1927 and theM.S. degree in 1929. From 1927 to 1932he was a research assistant at Massachu-setts Institute of Technology. In 1932 Mr.Chinn became associated with the Colum-bia Broadcasting System where from 1932to 1933 he was research associate; from
1933 to 1934, radio engineer; 1934 to 1936,assistant to the Director of Engineering;and from 1936 to date, Engineer -in -Chargeof Audio Engineering.
Murray G. Crosby (A '25-M '38)was born at Elroy, Wisconsin, on Sep-tember 17, 1903. He attended the Uni-versity of Wisconsin from 1921 to 1925,and received the B.S. degree in electricalengineering in 1927. From 1925 to 1927 hewas with the Radio Corporation of Amer-ica, and from 1927 to date he has been withR.C.A. Communications, Inc.
H. A. FINKS
Herbert A. Finke was born October 28,1914. In 1934 he received the degree ofBachelor of Science in Physics. At thepresent time Mr. Finke is a fourth -year
0. H. GisH
student at the Massachusetts Institute ofTechnology.
Oliver H. Gish was born at Abilene,Kansas, on September 7, 1883. He received
1939 Institute News and Radio Notes 159
the B.S. degree from Kansas State Collegein 1908 and the A.M. degree from the Uni-versity of Nebraska in 1913. From 1911
to 1918 he was an instructor in mathe-matics and physics at the University ofNebraska. In 1918 he became researchengineer with the Westinghouse Electricand Manufacturing Company leavingthere in 1922 to go with the Departmentof Terrestrial Magnetism of the CarnegieInstitution of Washington where he isnow Assistant Director and Chief of Sec-tion of Terrestrial Electricity. Mr. Gishis a Member of the American Associationfor the Advancement of Science, AmericanGeophysical Union, Meteorological Soci-ety, Philosophical Society of Washington,
W. C. HAHN
Sigma Xi, and Washington Academy ofSciences. He is a Fellow of the AmericanPhysical Society.
W. W. HANSEN
W. C. Hahn (A '36) was born inCedarville, Illinois, in 1901. He receivedthe B.S. degree from Massachusetts Insti-tute of Technology in 1923. In 1922 and1923 he took the student engineeringcourse at the General Electric Company,
and in 1924 was sent to their Chicago officewhere he was in the transmission -line andrelay engineering department until 1932.Since 1933 Mr. Hahn has been in theirengineering general department at Schen-ectady.
William W. Hansen was born in 1909at Fresno, California. He received theA.B. degree in 1929 and the Ph.D. degree
L. M. HOLLINGSWORTH
in 1933 from Stanford University. Dr.Hansen was an instructor in physics atStanford University from 1930 to 1932;National Research Fellow from 1933 to1934; assistant professor of physics at
HARLEY IAMS
Stanford University from 1934 to 1937;and associate professor from 1937 to date.
Lowell M. Hollingsworth (A '37) wasborn at Portland, Oregon, on January 8,1907. He received the 13.S. degree in elec-trical engineering from Oregon State Col-lege in 1930 and the E.E. degree fromStanford University in 1935. From 1930
to 1932 Mr. Hollingsworth was with BellTelephone Laboratories. Since 1936 he hasbeen an instructor in engineering at SanFrancisco Junior College.
A. P. KING
Harley Iams (A '31-M '38) was bornon March 13, 1905, at Lorentz, WestVirginia. In 1927 he received the A.B. de-gree from Stanford University. Mr Iams
E. B. KURTZ
took the student course from 1927 to 1928,and from 1928 to 1930 was in the facsimileand television research department of theWestinghouse Electric and ManufacturingCompany. Since 1931 he has been doingtelevision research for the RCA Manu-facturing Company.
Archie P. King (A '30) was born inParis on May 4, 1901. He received the B.S.degree from California Institute of Tech-nology in 1927. From 1927 to 1930 he wasin the seismological research departmentof the Carnegie Institution of Washington,and from 1930 to date he has been withBell Telephone Laboratories. Mr. King isa Member of the American Institute ofElectrical Engineers.

160 Proceedings of the I.R.E.
E. B. Kurtz was born in 1894 at Cedar -burg, Wisconsin. He received the B.S. de-gree in electrical engineering in 1917 fromthe University of Wisconsin; the M.S. de-gree in 1919 from Union College; and thePh.D. degree in 1932 from Iowa StateCollege. From 1917 to 1919 he was withthe General Electric Company. Dr. Kurtzwas at the Iowa State College from 1919to 1925 and the Oklahoma Agriculturaland Mechanical College from 1925 to 1929.Since 1929 Dr. Kurtz has been Professor of
M. J. LARSEN
Electrical Engineering and Head of De-partment at the University of Iowa. He isa member of Tau Beta Pi, Sigma Xi, SigmaTau, and Phi Kappa Phi as well as being aFellow of the American Institute of Elec-trical Engineers and the American Asso-ciation for the Advancement of Science.
M. J. Larsen was born in 1909 atSpencer, Iowa. He received the B.S. degreein electrical engineering in 1933; the M.S.degree in 1934; and the Ph.D. degree in
1937 from the State University of Iowa.From 1928 to 1929 he was with the North-western Bell Telephone Company andspent the summer of 1937 in the researchdepartment of the Central CommercialCompany. Since 1937 he has been an in -
G. F. METCALF
structor in electrical engineering at theMichigan College of Mining and Tech-nology. He is a member of Sigma Xi, EtaKappa Nu, and the Society for Promotionof Engineering Education.
G. F. Metcalf (A '34-M '37) was bornon December 7, 1906, at Milwaukee, Wis-consin. He received the B.S. degree fromPurdue University in 1928, and that sameyear took the General Electric Company'sstudent engineering course. From 1929 to1931 Mr. Metcalf was in the researchlaboratory of that company and sincethen has been in their vacuum -tube engi-neering department.
George C. Southworth (M '26) wasborn at Little Cooley, Pennsylvania, onAugust 24, 1890. He received the B.S.degree in 1914 and the M.S. degree in 1916from Grove City College. In 1923 he wasawarded the Ph.D. degree from Yale Uni-versity. Dr. Southworth was assistantphysicist at the Bureau of Standards from1917 to 1918 and returned to Yale Univer-sity as an instructor from 1918 to 1923.He joined the research staff on radio com-munication of the American Telephone
G. C. SOUTHWORTH
and Telegraph Company in 1923 and wastransferred to Bell Telephone Laboratorieswhere he has been since 1935. In 1927 and1930 he was a De Forest (radio) lecturerat Yale University. He is a Member of theAmerican Physical Society and a Fellowfor the American Association for the Ad-vancement of Science.
For biographical sketches of T. R.Gilliland, S. S. Kirby, and Newbern Smith,see the PROCEEDINGS for January, 1939.

THEY SPEAK FOR THEMSELVES
Ode SILVER -MICAS
r ER%p4 a4f 61110)
IC°1 14"825 25 MtAff'
O
FOR
Ode CERAMICONS
OR WOW%911 MAK
One look at these two charts tells why Erie Silver
Mica Condensers and Erie Ceramicons are indis-
pensible for keeping push button tuned receivers
"tuned on the nose."
Erie Silver Micas eliminate condenser frequency
drift because their temperature coefficient is only
.000025/°C-negligible for all practical pur-
poses. And when frequency drift is present in other
circuit elements, the use of a proper value Erie
a
U
O
0
O5
OOO
OO
U.o0
cb 2 0
0
0>- _
a4 atU_J4
a-Ou.
30 40 50 60 70 80TEMPERATURE 6C
TYPE F ERIE SILVER MICA CONDENSER
TYPE. 9120
A
4.60
ts,
2 0 30 40 50 60 70 80
TEMPERATURE °CERIE CERAMICONS
Ceramicon can compensate for that change. These
silver -ceramic condensers have a definite, linear
and reproducable temperature coefficient.
Both of these units have been thoroughly triedand proven in the laboratory and in actual service.
Their characteristics are unusually good, and their
operation is unbelievably dependable.
Write today for specification booklets that givecomplete engineering data on these Erie Con-densers.
ERIE RESISTOR CORPORATION,gde,,TORONTO, CANADA LONDON, ENGLAND PARIS, FRANCE-J.E.CANETTI CO.
MANUFACTURERS OF RESISTORS CONDENSERS MOLDED PLASTICSProceedings of the I. R. E. February, 1939
Commercial Engineering DevelopmentsThese reports on engineering de-
velopments in the commercial fieldhave been prepared solely on thebasis of information received fromthe firms referred to in each item.
Sponsors of new developmentsare invited to submit descriptions onwhich future reports may be based.To be of greatest usefulness, theseshould summarize, with as muchdetail as is practical, the novel engi-neering features of the design. Ad-dress: Editor, Proceedings of theI.R.E., 330 West 42nd Street, NewYork, New York.
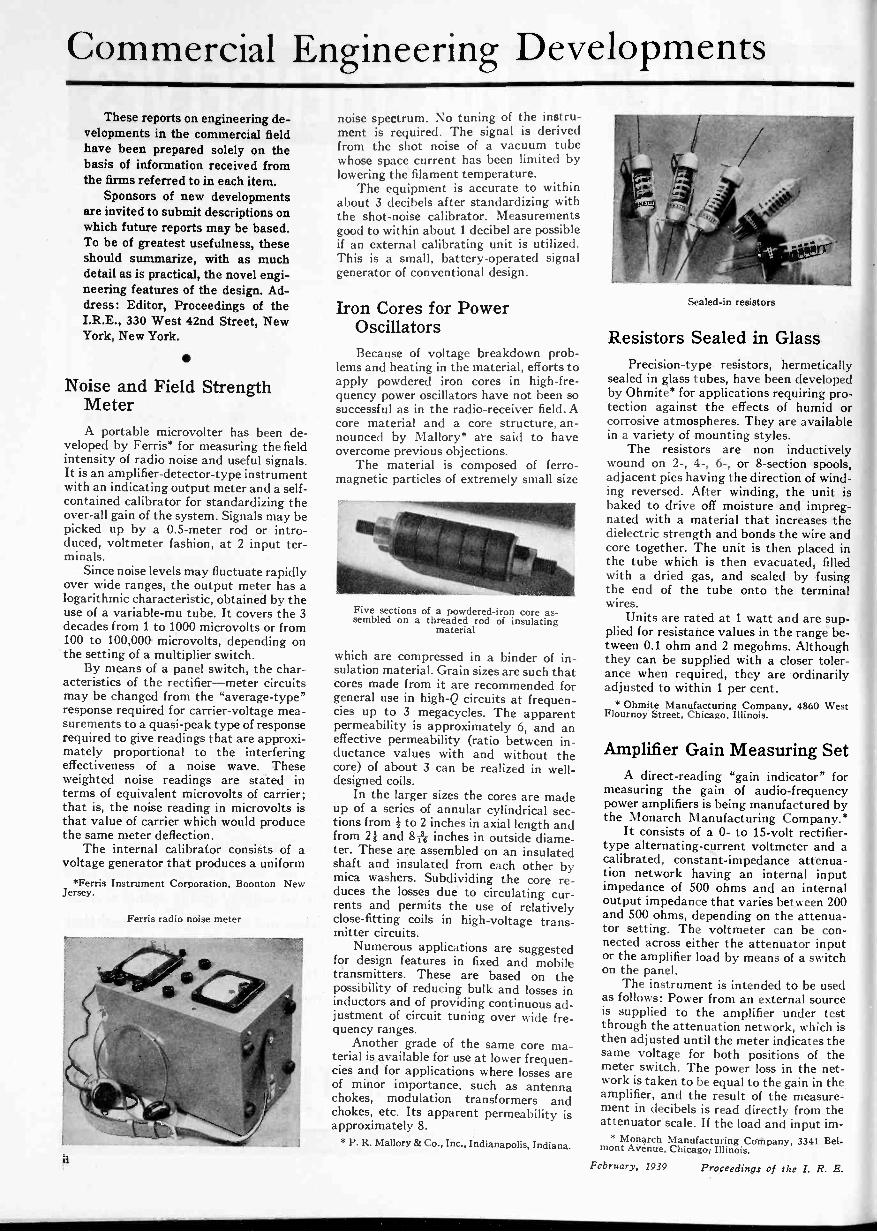
Noise and Field StrengthMeterA portable microvolter has been de-
veloped by Ferris* for measuring the fieldintensity of radio noise and useful signals.It is an amplifier -detector -type instrumentwith an indicating output meter and a self-contained calibrator for standardizing theover-all gain of the system. Signals may bepicked up by a 0.5 -meter rod or intro-duced, voltmeter fashion, at 2 input ter-minals.
Since noise levels may fluctuate rapidlyover wide ranges, the output meter has alogarithmic characteristic, obtained by theuse of a variable -mu tube. It covers the 3decades from 1 to 1000 microvolts or from100 to 100,000- microvolts, depending onthe setting of a multiplier switch.
By means of a panel switch, the char-acteristics of the rectifier-meter circuitsmay be changed from the "average -type"response required for carrier -voltage mea-surements to a quasi -peak type of responserequired to give readings that are approxi-mately proportional to the interferingeffectiveness of a noise wave. Theseweighted noise readings are stated interms of equivalent microvolts of carrier;that is, the noise reading in microvolts isthat value of carrier which would producethe same meter deflection.
The internal calibrator consists of avoltage generator that produces a uniform
*Ferris Instrument Corporation, Boonton NewJersey.
Ferris radio noise meter
B
noise spectrum. No tuning of the instru-ment is required. The signal is derivedfrom the shot noise of a vacuum tubewhose space current has been limited bylowering the filament temperature.
The equipment is accurate to withinabout 3 decibels after standardizing withthe shot -noise calibrator. Measurementsgood to within about 1 decibel are possibleif an external calibrating unit is utilized.This is a small, battery -operated signalgenerator of conventional design.
Iron Cores for PowerOscillatorsBecause of voltage breakdown prob-
lems and heating in the material, efforts toapply powdered iron cores in high -fre-quency power oscillators have not been sosuccessful as in the radio -receiver field. Acore material and a core structure, an-nounced by Mallory* are said to haveovercome previous objections.
The material is composed of ferro-magnetic particles of extremely small size
Five sections of a powderedsembled on a threaded rod of insulating
material
which are compressed in a binder of in-sulation material. Grain sizes are such thatcores made from it are recommended forgeneral use in high -Q circuits at frequen-cies up to 3 megacycles. The apparentpermeability is approximately 6, and aneffective permeability (ratio between in-ductance values with and without thecore) of about 3 can be realized in well-designed coils.
In the larger sizes the cores are madeup of a series of annular cylindrical sec-tions from 4 to 2 inches in axial length andfrom 24 and 8 inches in outside diame-ter. These are assembled on an insulatedshaft and insulated from each other bymica washers. Subdividing the core re-duces the losses due to circulating cur-rents and permits the use of relativelyclose -fitting coils in high -voltage trans-mitter circuits.
Numerous applications are suggestedfor design features in fixed and mobiletransmitters. These are based on thepossibility of reducing bulk and losses ininductors and of providing continuous ad-justment of circuit tuning over wide fre-quency ranges.
Another grade of the same core ma-terial is available for use at lower frequen-cies and for applications where losses areof minor importance, such as antennachokes, modulation transformers andchokes, etc. Its apparent permeability isapproximately 8.
* P. R. Mallory & Co., Inc., Indianapolis, Indiana.
Sealed -in resistors
Resistors Sealed in GlassPrecision -type resistors, hermetically
sealed in glass tubes, have been developedby Ohmite* for applications requiring pro-tection against the effects of humid orcorrosive atmospheres. They are availablein a variety of mounting styles.
The resistors are non inductivelywound on 2-, 4-, 6-, or 8 -section spools,adjacent pies having the direction of wind-ing reversed. After winding, the unit isbaked to drive off moisture and impreg-nated with a material that increases thedielectric strength and bonds the wire andcore together. The unit is then placed inthe tube which is then evacuated, filledwith a dried gas, and sealed by fusingthe end of the tube onto the terminalwires.
Units are rated at 1 watt and are sup-plied for resistance values in the range be-tween 0.1 ohm and 2 megohms. Althoughthey can be supplied with a closer toler-ance when required, they are ordinarilyadjusted to within 1 per cent.
* Ohmite Manufacturing Company, 4860 WestFlournoy Street, Chicago, Illinois.
Amplifier Gain Measuring SetA direct -reading "gain indicator" for
measuring the gain of audio -frequencypower amplifiers is being manufactured bythe Monarch Manufacturing Company.*
It consists of a 0- to 15 -volt rectifier-type alternating -current voltmeter and acalibrated, constant -impedance attenua-tion network having an internal inputimpedance of 500 ohms and an internaloutput impedance that varies between 200and 500 ohms, depending on the attenua-tor setting. The voltmeter can be con-nected across either the attenuator inputor the amplifier load by means of a switchon the panel.
The instrument is intended to be usedas follows: Power from an external sourceis supplied to the amplifier under testthrough the attenuation network, which isthen adjusted until the meter indicates thesame voltage for both positions of themeter switch. The power loss in the net-work is taken to be equal to the gain in the,amplifier, and the result of the measure-ment in decibels is read directly from theattenuator scale. If the load and input im-
* Monarch Manufacturing Cothpany, 3341 Bel-mont Avenue, Chicago, Illinois.
February, 1939 Proceedings of the I. R. E.

ASK YOURto check - up on these
NEW single unit loud speakers by BellTelephone Laboratories and Western
Electric-That give you high quality reproduction
at moderate power levels-That distribute sound over angles of 30°
to 45°-making them admirably suited formonitor or public address applications-
That reproduce so faithfully, that theartists are brought into the "presence" ofthe listener-
That add crystal clear "definition" thatenables monitor operators and productionmen to better evaluate program balance-
New speakers bring new significanceto the term:
ENGINEERlatest pate -setters!
That employ an entirely new diaphragmformation, new type permanent magnetand other new design features.
Ask your engineers about this suitablecompanion to the Western Electric 94 typeamplifier. Or better yet-order one speaker,evaluate its reproduction quality and letyour monitor operators and productionmen tell you how much it helps them!Then you'll order more!
DISTRIBUTORSCraybar Electric Co., Creybar Building, New York, N. Y.In Canada and Newfoundland, Northern Electric Co., Ltd.In other countrleaz International Standard Electric Corp.
S
HIGH QUALITY
DIRECTIVE BEAU
make the
750A and 751A
ideal for
\MIMING
Western ElectricRADIO TELEPHONE BROADCASTING EQUIPMENT',Pt'oceediugs of the I. R. E. February, 1939

BLILEYCRYSTALS
HOLDERSOVENS
ONLY carefully selected BrazilianQuartz is used in the manufacture of
Bliley General Communicationquency Crystals. As each individual crys-tal passes through its various processingoperations, many optical, mechanical andelectrical examinations are applied to in-sure the highest possible standards ofprecision and quality.
So that proper characteristics andfrequency accuracy can be guaranteed,each crystal is finally checked and cali-brated in the holder in which it will op-erate. Bliley crystal holders and ovenmountings are engineered particularlyfor dependable performance of BlileyCrystals from 20kc. to 30mc. Varioustypes are available to suit frequencyzontrol requirements throughout thecomplete crystal frequency range.
A competent engineering staff is main-tained for product research and develop-ment. Recommendations and quotationscovering quartz crystals for any stand-ard or special applications will gladly beextended without obligation. Write forcatalog G-10 describing Bliley GeneralCommunication Frequency Crystals.
BLILEY ELECTRIC CO.UNION STATION BUILDING ERIE, PA.
(Continued from page ii)
pedances of the amplifier are not equal, aterm (20 log impedance ratio) is applied tocorrect for the difference in impedancelevel. A chart relating the impedance ratioand the correction is supplied with theinstrument.
Monarch gain indicator
The attenuator is made up of resistiveelements, non -inductively wound on thincards and individually adjusted. It has atotal range of 110 decibels: 10 steps of 10decibels and 10 steps of 1 decibel.
Standards for High -FrequencyImpedance MeasurementsIn an effort to extend the range of com-
mercially practicable impedance measure-ments to higher frequencies, the GeneralRadio Company* has developed a fixedresistor of the straight -wire type and im-proved the characteristics of one of itsprecision -type variable air condensers.
In condensers of conventional con-struction, current enters at one end of therotor and stator stacks. The system wasanalyzed on the assumption that the cur-rent decreases linearly along the rotorshaft and stator -support rods and that theinductance and metallic resistance are uni-formly distributed. It was found that byfeeding the current into the center of eachstack, both the resistance and inductancewould be reduced to about of their valuesin an end -fed system.
The method adopted for feeding cur-rent at the center is shown in the accom-panying photograph. A heavy strip con-nector feeds the stator stack, and a circu-lar brass disk with a wide brush contactorfeeds the rotor.
In the design of the straight -wire resis-tor, manganin wire as small as 0.0006 inchin diameter was selected in order to mini-mize temperature coefficient and thechange in effective resistance with fre-quency due to skin effect. While the smallvalues of inductance and capacitance thatare inherent in the straight -wire type ofconstruction were desirable, further stud-ies showed that reducing one reactanceparameter at the expense of the otherwould often materially raise the frequency
* General Radio Company Cambridge, Massa-chusetts.
CREI Originated Training inPractical Radio Engineering
The manner in which the radio in-dustry has acknowledged CREI menas well -trained men is best exempli-fied by the fact that CREI studentsand graduates are now employed inmore than 275 U. S. broadcastingstations. Among our students are en-gineers in top positions and those"just breaking in" . . . it is thisdesire of most radiomen to acquiremore technical ability that forms thebackbone of a growing industry.
We, too, are keeping pace. Les-sons are under constant revision toembody latest developments and ad-vances in every branch of the field.The acquisition of our own well-equipped building is another stepin our constant effort to provide in-creased facilities for modern, prac-tical training.
Future in Practical
Radio Engineering"You will find it worthwhile to readthis interesting booklet. It containscomplete details about our schooland courses. Write for your freecopy today.
E. H. RIETZKE, Pres.
Dept. PR -23224 SIXTEENTH ST., N.W.
WASHINGTON,D.C.
iv February, 1939 Proceedings of the 1. R. E.
II 11111 1111 I I I I I I 1 1 1 1 1 I I I I I I I I I I I I I I I I I I I I
ERovoxCAPACITY and
METER RANG POLARIZING VOLTAGE 9f POWER f ACI OR
Y¢YIfj MIV N dEl V.BRIO° ANGE
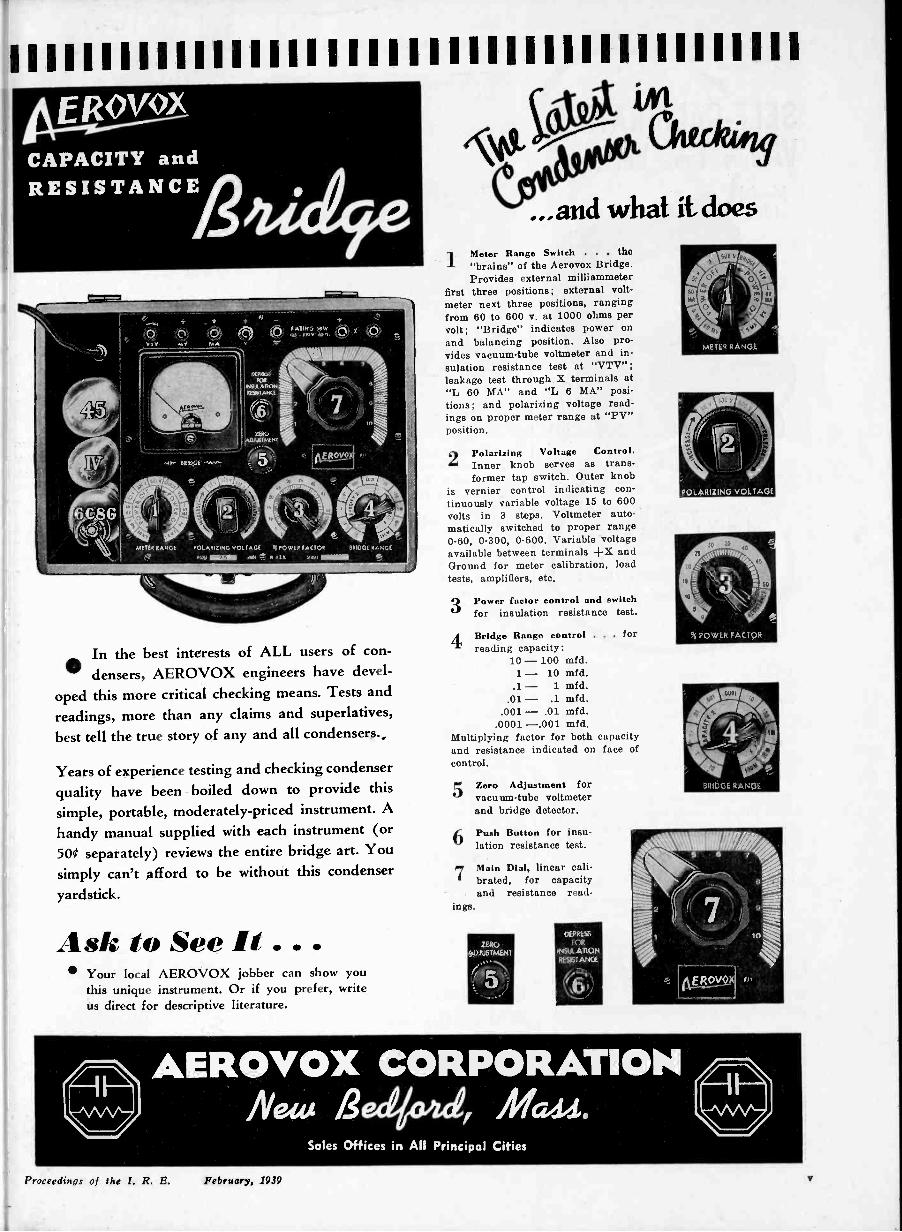
In the best interests of ALL users of con-densers, AEROVOX engineers have devel-
oped this more critical checking means. Tests andreadings, more than any claims and superlatives,
best tell the true story of any and all condensers..,
Years of experience testing and checking condenserquality have been boiled down to provide this
simple, portable, moderately -priced instrument. A
handy manual supplied with each instrument (or500 separately) reviews the entire bridge art. You
simply can't afford to be without this condenseryardstick.
Ask to See It . . Your local AEROVOX jobber can show you
this unique instrument. Or if you prefer, writeus direct for descriptive literature.
un
and what it doesMeter Range Switch . . . the"brains" of the Aerovox Bridge.Provides external milliammeter
first three positions; external volt-meter next three positions, rangingfrom 60 to 600 v. at 1000 ohms pervolt; "Bridge" indicates power onand balancing position. Also pro-vides vacuum -tube voltmeter and in-sulation resistance test at "VTV";leakage test through X terminals at"L 60 MA" and "L 6 MA" posi-tions; and polarizing voltage read-ings on proper meter range at "PV"position.
2
1
Polarizing Voltage Control.Inner knob serves as trans-former tap switch. Outer knob
is vernier control indicating con-tinuously variable voltage 15 to 600volts in 3 steps. Voltmeter auto-matically switched to proper range0-60, 0-300, 0-600. Variable voltageavailable between terminals +X andGround for meter calibration, loadtests, amplifiers, etc.
3
4
Power factor control and switchfor insulation resistance test.
Bridge Range control . . . forreading capacity:
10 - 100 mfd.1 - 10 mfd..1- 1 mfd.
.01- .1 mfd..001 - .01 mfd.
.0001 -.001 mfd.Multiplying factor for both capacityand resistance indicated on face ofcontrol.
5
6
7
ings.
Zero Adjustment forvacuum -tube voltmeterand bridge detector.
Push Button for insu-lation resistance test.
Main Dial, linear cali-brated, for capacityand resistance read -
KGWIJ I
5(
FOR
THSUL ATIONRESTS I ANTI
AEROVOX CORPORATION/Veto Becitaid, Mau.
Sales Offices in All Principal Cities
Proceedings of the I. R. R. February, 1939

An Outstanding PatentedCircuit Recommended Bythe Best Laboratories andTechnicians.
SELF -CALIBRATING
VACUUM TUBE VOLTMETER
Model1252
Only
$4833NetPrice
The initial operation ofadjusting bridge cancelsout error independent ofthe tube emission valuesor when replacing tubes.
Model 1252 is furnished with the exclusiveTriplett tilting type twin instrument. Oneinstrument indicates when bridge is in bal-ance-the other is direct reading in peakvolts. Above, below and null point indi-cated by the exclusive feature of the cir-cuit. Tube on Cable . . . Particularly desir-able for high frequency work. . .. Ranges:3-15-75-300 Volts.
Furnished complete with all necessary acces-sories including 1-84, 1-6P5, 1-76. Case ismetal with black wrinkle finish, 77/8 x 65/8 x45/8 inches. Etched panel is silver and redon black.
Model 1251 same as 1252 but with tube locatedinside case . . . DEALER PRICE $47.67
Model 1250 same as 1251 except ranges are 2.5,10, 50 volts .. . DEALER PRICE $36.67
ELECTRICAL INSTRUMENTS
The Triplett Electrical Instrument Co.212 Harmon Ave., Bluffton, OhioPlease send me more information on-
Model 1252; Model 1251; Model 1250Name
Address
City State
(Continued from page iv)
Center -fed condenser (with right-handstator stack removed to show the method of
making connections to the rotor)
limit below which the effective resistanceand reactance would remain within satis-factory limits. That is why the construc-tion shown in the following photographwas adopted.
The resistance wire is clamped downon a thin piece of mica, backed by two flatmetal plates which also serve as lugs forconnections. As a result, the inductance isdecreased below what it would be in freespace by virtue of the shielding effect ofthe current in the plates. The plates alsohelp to dissipate heat and improve thepower handling ability of the unit.
Resistors of this type are built in 7sizes between 1 and 100 ohms.
A 100 -ohm straight -wire resistor with theclamping plate removed to show the ele-
ment
Booklets, Catalogsand Pamphlets
The following commercial literature hasbeen received by the Institute.
ELIMINATORS Electro Products La-boratories, 549 West Randolph Street, Chi-cago, Illinois. Catalog 1138. 2 pages, 81X 11inches. Description of 3 low -hum -levelbattery eliminators.
INSTRUMENTS Triplett Electrical In-strument Co., Buffton, Ohio. Price Sheets50-I and 50-T, 8 pages, 61 X 11 inches. In-dicating instruments and tube- and ser-vice -test sets, prices and brief specifica-tions.INSTRUMENTS Roller -Smith r Com-pany, Bethlehem, Pennsylvania. Catalog48-a. 8 pages, 81X11 inches. Descriptionand dimensions of 3- and 4 -inch, round andsquare panel instruments.MARINE RADIO TELEPHONE West-ern Electric Company, 195 Broadway, NewYork, New York. Bulletin T1570. 4 pages,
8 X11 inches. 2 -way radio telepone equip-ment for inter -ship and ship -to -shore ser-vice on small boats.RADIO RANGE FILTER RCA Manu-facturing Company, Inc., Camden, NewJersey. Data Sheet No. 4. 2 pages, 8i X11inches. A unit to separate voice and rangesignals in an aircraft radio receiver.RELAYS C P. Clare & Co., 4541Ravenswood Avenue, Chicago, Illinois.Catalog CCI. 10 pages+cover, 81X11inches. Descriptions and specifications ondirect -current relays for low -power controlservice.MAGNETIC TELEPHONE WesternElectric Company, 195 Broadway, NewYork, New York. Bulletin T1543. 4 pages,8 X 11 inches. A sound -powered telephonefor intercommunication service on ship-board.TRANSFORMERS Robert M. FlakyCo., 266 So. Chapel Street, Newark, Dela-ware. Catalog T6. 16 pages, 81 X11 inches.Power and amplifier -coupling transfor-mers.TUBE DATA (KEN-RAD) . . . Ken-RadTube & Lamp Corporation, Owensboro,Kentucky. Engineering Bulletin 38-21, 29pages, 81X11 inches. Considerations in-volved in the application of converter andmixer tubes.UBE T DATA (KEN-RAD). . . Ken-RadTube & Lamp Corporation, Owensboro,Kentucky, Bulletin, 8 pages, 8i X11 inches."Essential Characteristics of Metal, 'G'Series, and Glass Radio Tubes" (tabulardata, base connections, and outline draw-ings.)TUBE DATA (RCA) RCA Manufac-turing Company, Harrison, New Jersey.Application Note No. 101. 9 pages, 81X 11inches. "On Input Loading of ReceivingTubes at Radio Frequencies."TUBE DATA (RAYTHEON) RaytheonProduction Corporation, Newton, Massa-chusetts. Data Sheets. 11 pages, 81X11inches. Description and characteristics of4 permatrons (magnetic -control gas -filledcontrol tubes).TUBE DATA (WESTINGHOUSE) West-inghouse Electric & Manufacturing Com-pany, Bloomfield, New Jersey. Bulletin No -/7. 4 pages, 81X 11 inches. Description andbrief summary of characteristics of igni-tions.VACUUM CONDENSER . . . Eitel McCul-lough, Inc., San Bruno, California. Bulle-tin, 4 pages, 81 X 11 inches. Description andperformance data on a vacuum -sealed -in -glass condenser for tank -circuit applica-tions.CONDENSERS. . . Tobe Deutschmann Cor-poration, Canton, Massachusetts. Catalog,12 pages, 81X 11 inches. Wet and dryelectrolytics and paper condensers, a list-ing of specifications.
vi February, 1939 Proceedings of the I. R. R.

t Pr.lhe minute he calls up I'm going to speakto him about Bobby. He's my cousin, andhe's just five weeks old. And they haven'tgot a telephone where he lives!
"One of these days his mother's goingto run out of his talcum. Or she'll want hisfather to stop at the drug store on the wayhome for oil. Or maybe she'll want to askthe doctor about that rash on his back -Bobby's back, I mean.
"Then suppose some week he gains sixounces. Don't they expect to tell theirfriends news like that?
"Well, how is Bobby's mother going todo all those things besides her marketing?
"I'm going to see if my Daddy can't fixit. He's always saying how good telephoneservice is - and how cheap."
BELL TELEPHONE SYSTEMYou are cordially invited to visit the Bell System exhibit at the Golden Gate International Exposition, San Francisco
Proceedings of the 1. R. E. February, 1939 xi

Time Table in Action...
You'll find the same dependability
in C -D CapacitorsEmphasis today is on comfort . . . luxury . . . style. ButON TIME is still the first consideration of the nation'srailroads. A capacitor, too, may have many fine quali-ties-each praiseworthy in itself. But unless these addup to DEPENDABILITY, your capacitor is not a goodinvestment. Cornell-Dubilier is proud of the fact that,in engineering circles today, the initials of C -D havecome to stand for capacitor dependability.
C -D engineers will be happy to cooperate with you onyour capacitor requirements. Catalog No. 160 listing theentire C -D line is available free of charge. Your in-quiries are invited.
ABOVE PHOTO COURTESY NEW YORK CENTRAL SYSTEM
lifilimmesagok.
DYKANOL FILTER CAPACITORS TYPE DUCarefully designed, compact, light -weight, safely -rated,furnished with universal mounting clamps, well -insulatedterminals, fire -proof, these units are without a doubtthe most dependable capacitors offered the radio in-dustry. Type TJU Dykanol capacitors are being used bypractically every broadcast and government station inthe world. For complete description see Catalog No. 160.
Product of the world's largest manufacturer of capacitors.
MICA DYKANOL PAPER
WET AND DRY ELECTROLYTIC CAPACITORS
CORNELL-DUMMERELECTRIC CORPORATION1012 Hamilton Boulevard, South Plainfield, New Jersey
Cable Address: "CORDU"
xii February, 1939 Proceedings of the I. R. E.
There are 6 different types-all of them small-all offering advantages radio set manufacturers
will appreciate!
The special construction of the 6SA7 provides excellent os-cillator frequency stability. The magnitude of input capaci-tance of the oscillator grid is not appreciably affected by
signal -grid bias. Changes in cathode current and in oscil-lator transconductance with AVC voltage are small.
RCA 6SK7... this is a new r -famplifier pentode offering thesame features as the 6SA7 plusmore stable amplifier operation...greater uniformity of amplifiergain...and higher gain per stage.This tube not only has the samegrid plate capacitance as tubeswearing grid caps, but also offerslower input and output capaci-tance values-- plus higher transconductance. Has remote cut-offcharacteristic and small waferoctal, 8 -pin base to fit standardoctal socket.
RCA 6S17... this is a new r -famplifier pentode with the samefeatures as the 6SK7 except thatthis tube has a sharp cut-off char-acteristic.RCA 6SF5 ... a new high -mutriode ... and the RCA 6SQ7... a
new duplex -diode high -mu tri-ode, are audio type tubes. Theyemploy the same single -endedconstruction and have the samecharacteristic features and advan-tages as the r -f pentodes. Base -shielding reduces hum voltagepicked up by grid lead fromheater leads, permits operationwith satisfactory hum level.
RCA 6SC7...a new twin triodeamplifier designed primarily forphase inverter service. Hum volt-age picked up by the grid leadfrom the heater leads is greatlyreduced because of inter -leadshielding between grid and heaterwithin the base.This permits oper-ation with satisfactory hum level.RCA preemie th Maple. Key every Sunday, t to 11
P.M., E.S.T., on the NBC Blue NetworkOver 325 million RCA radio tubes have beenpurchased by radio users ...in tubes, as In radio
sets, It pays to go RCA All the Way.
For complete details about any of these tubes write to the address below
Here are some of the fine features of the RCA6SA7 -a new Pentagrid Converter
Self -shielded envelopeComplete wiring below set panelNo grid lead to connectCleaner, neater chassisNo loose or broken grid leadsHigher conversion gainSmall frequency shift at high frequenciesEconomySimplification of tube renewal
A SERVICE OF THERADIO CORPORATION
OF AMERICA
RCA MANUFACTURING COMPANY, INC., HARRISON, N. J.
20
I0
I00
LOW RANGE-CstiCLES x 10
HIGH RANGE- kc
100 FREQUENCY 1000 10000
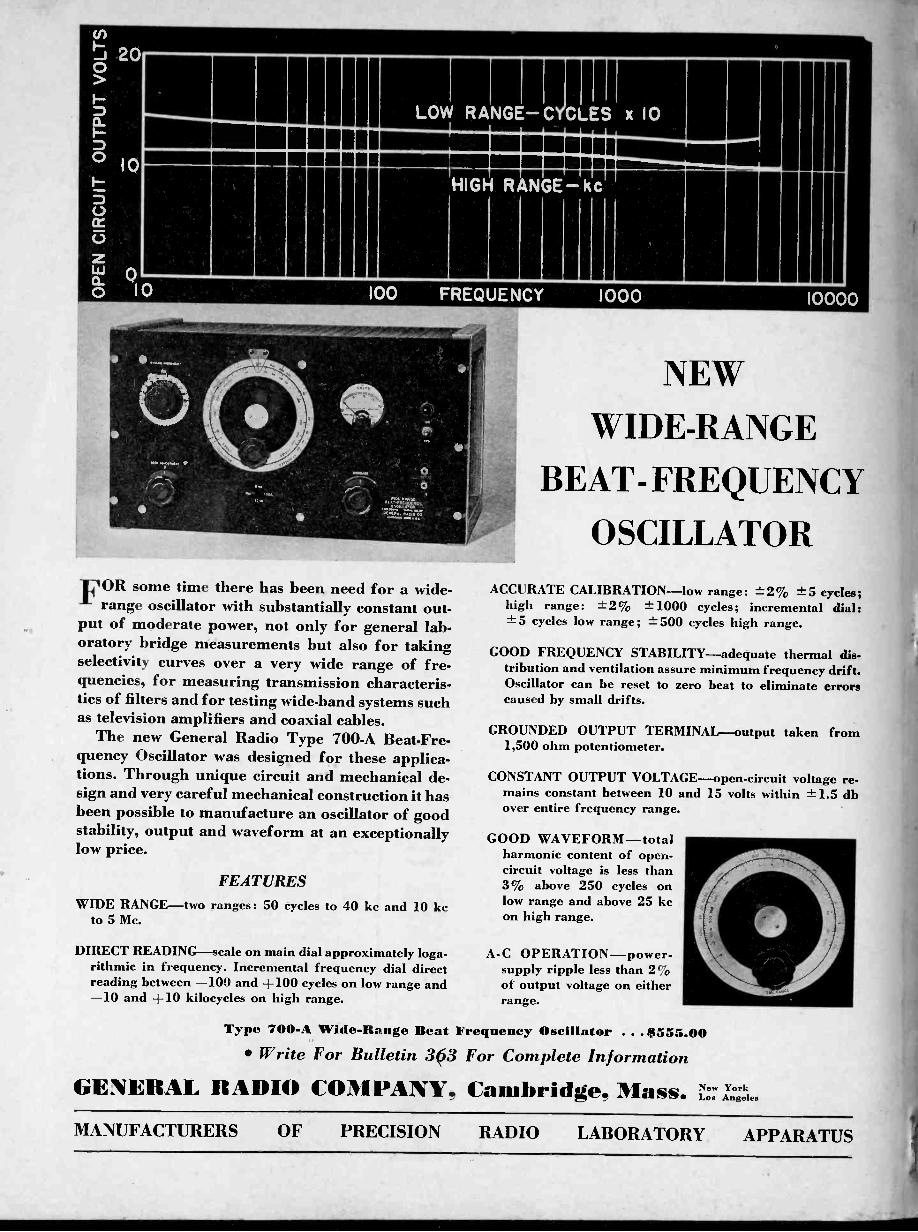
FOR some time there has been need for a wide -range oscillator with substantially constant out-
put of moderate power, not only for general lab-oratory bridge measurements but also for takingselectivity curves over a very wide range of fre-quencies, for measuring transmission characteris-tics of filters and for testing wide -band systems suchas television amplifiers and coaxial cables.
The new General Radio Type 700-A Beat -Fre-quency Oscillator was designed for these applica-tions. Through unique circuit and mechanical de-sign and very careful mechanical construction it hasbeen possible to manufacture an oscillator of goodstability, output and waveform at an exceptionallylow price.
FEATURESWIDE RANGE-two ranges: 50 cycles to 40 kc and 10 ke
to 5 Mc.
NEW
WIDE -RANGE
BEAT- FREQUENCY
OSCILLATORACCURATE CALIBRATION-low range: 2:2% --E5 cycles;
high range: ± 2 % ± 1000 cycles; incremental dial:5 cycles low range; ± 500 cycles high range.
GOOD FREQUENCY STABILITY-adequate thermal dis-tribution and ventilation assure minimum frequency drift.Oscillator can be reset to zero beat to eliminate errorscaused by small drifts.
GROUNDED OUTPUT TERMINAL-output taken from1,500 ohm potentiometer.
CONSTANT OUTPUT VOLTAGE-open-circuit voltage re-mains constant between 10 andover entire frequency range.
GOOD WAVEFORM-totalharmonic content of open -circuit voltage is less than3% above 250 cycles onlow range and above 25 kcon high range.
DIRECT READING-scale on main dial approximately loga- A -C OPERATION-power-rithmic in frequency. Incremental frequency dial direct supply ripple less than 2%reading between -100 and +100 cycles on low range and of output voltage on either-10 and +10 kilocycles on high range. range.
15 volts
Typo 700-A Wide -Range Beat Frequency Oscillator . . .$555.00 Write For Bulletin 363 For Complete Information
GENERAL RADIO COMPANY, Cambridge, Mass.
within ± 1.5 db
New YorkLos Angeles
MANUFACTURERS OF PRECISION RADIO LABORATORY APPARATUS

1939 Southworth and King: Directivity of Metal 1-lorns 99
cant when expressed in wavelengths for they arethen directly comparable with the cutoff limit of0.585 X. Below this limit no appreciable power maybe propagated through a wave guide.
60
50
040
30
0a- 20
10
00 3 4
AREA OF APERTURE IN SQUARE WAVELENGTHS
Fig. 9-Measured power improvements of metal pipe radiators,as a function of aperture. Data taken from Fig. 8.
It will be observed that the pattern in the planeof the electric force is in general somewhat sharperthan that in the magnetic plane. The rather irregularpattern shown in Fig. 8(d) is probably due to ex-
= 00D = 12.4 CMA= 0.52 T2
100L = 50CMD = 21.5CMA = 1.55 T2
(a)
(b)
= 200L = 42.5CM (C)D = 27.6CMA = 2.55X2
r_ L
=L = 36.5CMD =39.3 CIAA = 5.2 A2
(a)
ANGLE IN DEGREES+90. +60 +45 +30
.....ak_,.._00.0011- _
1
130. G =,14.4 DECIBELS
* ,e...111111111IliIIIP trif -------G= ILO DECIBELS
1
-- - --
le-/OrS7*-----4,--,--\,1=18.37C I BE Ly
0 0.4 0.6 0.8RELATIVE FIELD
1.0
+15
-15
+15
0
-15
+15
when the spacings between their elements are large.In the case at hand the difficulty may have been dueto the substantial .discontinuity that exists at the
point in the receiver where the 10 -centimeter pipeand the 25 -centimeter pipe join.
Fig. 9 shows the measured power improvementsfrom these various pipes plotted against the areas ofaperture in square wavelengths. The resulting curveturns out to be linear except for the larger diameters.If the function of a receiving device were merely thatof cutting out a section from an advancing wavefront and conveying the same, without reflection,back to a completely absorbing detector,. then weshould expect the power improvement to vary di-ectly with the area of aperture. If, however, there arepartial reflections or other effects tending to alterthe phase relations between the various componentsthen this optimum gain may not be fully realized.There are evidences of out-of -phase components ofthis kind in the secondary lobes of Fig. 8(e) and per-haps also in Fig. 8(d). These may account in part forthe nonlinearity of Fig. 9.
500= 50 CM
D = 54.8 cMA= 10.1X.2
= 60°L = 36.4CM
= 54.7CMA = 10.0 712
= 75°L = 28.6CM
0 D = 54,9 CMA= 10.17,2
-15
+15
0
-15
p= 900L =35.3CMD=63.4CMA =13.5 T2
(e)
(f)
(9)
(h)
ANGLE IN DEGREES+90 +60 +30 +15
G =18.7 DECIBELS
OP fillrMW
'7.G=15.9 DECIBELS
ELECTRIC -PLANE CHARACTERISTICMAGNETIC -PLANE CHARACTERISTIC
G=10,8 DECIBELS\ \/0 0.6 0.8
RELATIVE FIELD1.0
+15
-15
+15
0
-15
+15
-15
Fig. 10-Directional properties of metal horns of roughly the same length but of various angularopenings. Measurements were taken at a wavelength of 15.3 centimeters.
perimental error. It has not been feasible to repeatthis experiment under the conditions prevailing forthe other sizes of pipe. In the last figure there are thebeginnings of some secondary lobes similar in formto those often observed with ordinary antenna arrays
CONICAL HORNS
The work with horns of circular sections proceededalong several different directions. In one case it wasdesirable to know how the directive properties variedas the angle of flare was increased. In another case

100Proceedings of the I.R.E.
Februarywe were interested to see how these properties variedas the area of opening increased keeping the anglefixed at some value which the previous experimenthad found to be favorable. Other variations will beevident from the paragraphs that follow.
I#
L=OCMD=12.4CMA= 0.52 7t2
L =14.1CMD=.- 27.8CMA= 2.67,2
L =36SCM0=39.3CMA =
L =70.8CMD=64 CMA= 13.8712
L = 122CMD = 100 CMA = 33.6 7,2
(a)
(b)
(C)
(d)
(e)
90ANGLE IN DEGREES
+60 +45 +30
*sowri,roliA 41V---Df:::::417I
G =13.8 DECIBELS
G = 18.3 DECIBELS
G = 21.6 DECIBELS---____
+15
-15
+I.
11111110,
G= 22.0 DECIBELS\0 0.4 0.6
RELATIVE FIELDELECTRIC -PLANE CHARACTERISTICMAGNETIC -PLANE CHARACTERISTIC
0.8 1.0
-15
+15
0
Fig. 11-Directional properties of metal horns each of the sameangular opening but of different lengths. Measurements weretaken at a wavelength of 15.3 centimeters.
EFFECT OF VARYING ANGLEThe results of the experiments with straight pipesnaturally led to work on horns where the angle offlare was increased. It is convenient to regard thestraight pipe as a horn of zero angle. Accordingly,measurements were made beginning with zero andcontinuing in small steps up to 90 degrees. Resultswere obtained as shown in Fig. 10.It was not feasible to make the several horns ofexactly comparable dimensions. The extent to which
this desirable condition has been approximated willbe noted from the dimensions given in the figure.It is fairly conclusive, however, that the gain has in-creased progressively with the angle of flare up to anangle about 50 degrees, after which spurious effectshave become evident. This observed optimum holdsonly for the range of lengths noted above. In generallonger horns call for smaller optimum angles.
7, =20.2 CENTIMETERS
AREA OF APERTURE =3 SQUARE WAVELENGTHS
(a)
7, =15.3 CENTIMETERS
AREA OF APERTURE=5.2 SQUARE WAVELENGTHS
(b)
.X=12.6 CENTIMETERSAREA OF APERTURE =
7.7 SQUARE WAVELENGTHS
(c)
= 10.5 CENTIMETERS
AREA OF APERTURE =11.1 SQUARE WAVELENGTHS
(d)
ANGLE IN DEGREES+90 +60 +45 +30
G=16.6 DECIBELS
G=20.8 DECIBELS
= 21.9 DECIBELS
0 0.4 0.6RELATIVE FIELD
ELECTRIC -PLANE CHARACTERISTICMAGNETIC -PLANE CHARACTERISTIC
0.8
+15
0
0
1.0
Fig. 12-Directional properties of a metal horn as affected bychanges in frequency (wavelength).
EFFECT OF VARYING LENGTHA somewhat more significant result was obtainedfrom the measurements of several cones each of thesame angle (40 degrees) but of different length. It isconvenient to think of this series as having beenderived from an open pipe to which have been con-nected 40 -degree horns of various lengths. It is ap-parent from Fig.11 that, at first, directivity increasedprogressively with length but that little or no ad-vantage was gained by increasing the size of the hornbeyond that shown in the fourth figure. This resultwas to be expected, for we have not maintained theconditions for optimum angle.

1939 Southworth and King: Directivity of Metal Horns 101
EFFECT OF VARYING WAVELENGTH
From considerations of similitude it would be ex-pected that the most significant features of a di-rective system would be its dimensions measured inwavelengths. This means that two horns similar inform but differing in absolute dimensions would haveidentical directive properties provided they are oper-ated on wavelengths proportional to their respectivedimensions. As a consequence one should expect,from what has gone before, that the gain of a givenhorn should, in general, increase as the wavelengthis reduced, for, in effect, we have increased the virtualdimensions of the horn by decreasing the operatingwavelength. Tests were made on a single horn ateach of 4 wavelengths with results as shown in
Fig. 12.
SUMMARY OF RESULTS WITH SIMPLECONICAL HORNS
In order to reduce further the data above, themeasured gains, expressed as power ratios, havebeen plotted against certain significant variables. Thecurves shown should be regarded as convenient linesof reference for comparing experimental points ratherthan graphs justified by data.
Fig. 13 shows how the power ratios of the various40 -degree horns increased with the area of the aper-ture. The results are comparable with those indicatedby Fig. 8 for ordinary pipes. As before, the linearrelation holds only for the smaller horns. This hasalready been explained. Fig. 14 shows how the powerratio of one of the 40 -degree horns varied with wave-length.
160
40
120
100
crcr
00Ul
60
40
20
00
-O
4 0 12 16 20 24 28 32ARCA OF APERTURE IN SQUARE WAVELENGTHS
36
Fig. 13-Measured power improvement, resulting from varyingthe length of a horn, keeping angle of flare and wavelengthconstant.
Although the work reported by this paper was ofan exploratory kind, it has permitted two ratherdefinite conclusions. (1) Radiating pipes and hornsconstitute simple and convenient means for obtain-
ing directive gains amounting to 20 decibels or more.There is no reason to believe that this is the upperlimit. (2) Both in the case of straight pipes and in thecase of conical horns this gain, expressed as a powerratio, is within limits roughly proportional to area of
I60
160
140
120
100
cew 800a
60
40
20
00 2 3 4 5 6 7 8 9 10 II 12
AREA OF APERTURE IN SQUARE WAVELENGTHS
Fig. 14- Measured power improvement resultingfrom changing wavelength.
z0
0
aperture. Presumably it holds in a more general wayif we make appropriate changes in flare. This is moreor less in keeping with experience with ordinary an-tenna arrays such as for instance those used in trans-oceanic communication.
The inherent simplicity of the horn antenna makesit particularly useful at ultra -radio frequencies wheredifficulties are often encountered in maintaining theproper amplitude and phase relations between thevarious elements of an array. Horns have been oper-ated satisfactorily at frequencies of more than 3000megacycles (X =1.0 centimeters) with results thatseem to indicate that they should be even better atstill higher frequencies. The lower limit of operationappears to be dictated mainly by convenience andeconomic considerations and consequently is notwell established at this time. Electromagnetic hornspossess an interesting and possibly a very importantcharacteristic. Unlike tuned antenna arrays, thesedevices do not have critically sharp frequency char-acteristics. This principle should permit both easychanges in operating frequency and also the simul-taneous transmission of a wide frequency band with-out serious distortion.
APPENDIX
As explained above the gains reported in this paperrefer to a hypothetical nondirectional radiator. Suchgains may therefore be regarded as absolute. Accord-ing to this Primary reference standard, a short douNetradiator such as is sometimes used as a standard inradio work has an absolute gain of 1.76 decibels.Similarly a half -wave antenna in free space has again of 2.15 decibels.

102Proceedings of the
Three important steps were taken in referring thegains of these horns back to the primary referencestandard. They are as follows: First, the various di-rectional patterns shown above were related quanti-tatively to Figs. 8(a) and 8(b) by means of a verylarge number of measurements. Next their powerratios were compared with the areas of their respec-tive directional patterns and a proportionality estab-lished. An excellent agreement between these factorswas obtained.
It will be noted that the patterns of Figs. 8(a) and8(b) are not too removed from an ellipsoid and ap-pear almost to have resulted from a progressivesharpening beginning from a sphere. It thereforeseemed reasonable to consider a sphere of this kindas an arbitrary secondary reference standard and alsoto assume that the proportionality factor derivedabove should extend also to the sphere. Such a spheremay be regarded as one of the two spheres generatedby r = A cos 0 sin B where the origin is located at themouth of the radiating pipe with the conventional xaxis coincident with the principal axis of the cylinder.
When the proportionality factor obtained abovewas extended from Fig. 8(a) to the secondary refer-ence standard, a differential of 0.77 decibel was ob-tained. It is this quantity that is open to questionfor ordinarily it is not regarded as good radio practiceto assume that the power ratios of directive systemsare proportional to the areas of their respective pat-terns.
The final step consisted in relating the secondaryreference standard to the primary standard. Thisstep was mathematical and was based on the follow-ing reasoning. The power at a nondirective sourcenecessary to produce a given field intensity at agiven point in space is given by
SO
cP1 =--
47r .10
Pi= cE2.
E2 sin 0 d0 d4) (1)
(2)The power at the source, necessary for the second-
ary reference standard to produce the same field in-
tensity at the same point in the preferred direction is7 r
41P2 = fE2 cost sin3 0 d95 dB47r fo o
cE2P2 =
6
(3)
The ratio of the two powers necessary to produce thesame field intensity by the two methods is, therefore,
P1
-P2
This corresponds to a gain of 7.78 decibels. It repre-sents the differential between the primary and sec-ondary reference standards. Adding this figure to therelative gain of say Fig. 8(a) which in this case is 0.77decibel we obtain 8.55 decibels as the absolute di-rectivity of the latter. Other horns covered by thispaper were related to Figs. 8(a) and 8(b) by measure-ment and accordingly their directivities were ex-pressed absolutely. The errors involved by the ap-proximations made above are not believed to begreater than a tenth of a decibel.
Bibliography(1) G. C. Southworth, "Hyper -frequency wave guides-generalconsiderations." Bell Sys. Tech. Jour., vol. 15, pp. 284-309; April, (1936).(2) Carson, Mead, and Schelkunoff, "Hyper -frequency waveguides-mathematical theory," Bell Sys. Tech. Jour.,vol. 15, pp. 310-333; April, (1936).(3) W. L. Barrow, "Transmission of electromagnetic waves inhollow tubes of metal," PROC. I.R.E., vol. 24, pp. 1298-1328; October, (1936).(4) G. C. Southworth, "Some fundamental experiments withwave guides," PROC. I.R.E., vol. 25, pp. 807-822, July,(1937).(5) G. C. Southworth, "New experimental methods applicable toultra -short waves," Jour. App. Phys., vol. 8, pp. 660-665,October, (1937).(6) W. L. Barrow and F. M. Greene, "Rectangular hollow -piperadiators," PROC. I.R.E., vol. 26, pp. 1498-1519; Decem-ber, (1938).(7) L. J. Chu and W. L. Barrow, "Electromagnetic waves inhollow metal tubes of rectangular cross section," PROC.I.R.E., vol. 26, pp. 1520-1555; December, 1938.(8) W. L. Barrow and F. D. Lewis, "The sectoral electromag-netic horn," PROC. I.R.E., vol. 27, pp. 41-50; January,(1939).
(9) W. L. Barrow and L. J. Chu, "Theory of the electromagnetichorn," PROC. I.R.E., vol. 27, pp. 51-64; January, (1939).

A Fixed-Focus Electron Gun forCathode -Ray Tubes*
HARLEY IAMSt, MEMBER, I R E
Summary-Many cathode-ray tubes in use at the present timeemploy electrostatic focusing of the electron beam. It is customaryto supply these tubes with at least two anode voltages, one of which
is varied to bring the beam to a focus.However, an electrostatically focused electron gun can be designed
so that only one anode voltage is required, and so that the electronbeam remains in focus regardless of that anode voltage. A fixed-
foxus electron gun may be made by using a focusing field generated
by electrodes at a common anode potential and others at cathode
potential. The point at which the beam is brought to a focus is de-
termined by the dimensions of the electrodes which make up theelectron lens.
Developmental cathode-ray tubes have been built in which thebeam was brought to a focus with a single anode voltage, and inwhich the focus remained substantially constant at any voltage inthe test range between 750 and 2500 volts.
ITHIN the last decade, the number ofcathode-ray tubes in use by the radio indus-try has multiplied by many times. Once a
scientific curiosity, the cathode-ray tube has nowbecome a useful tool through the improvementseffected by a host of workers in the field of electron-ics. Within the last few years, publications in thisj ournal1,2,3,4,6,6,7 and elsewhere have described thebasic principles involved in the design of the electronguns used in these cathode-ray tubes. Even in theirpresent improved forms, cathode-ray oscillographand television tubes require an adjustment of thefocus of the electron beam at the time of installationand usually during use. If this adjustment were notnecessary, the power supplies for the tube could besimplified, and the tube would be simpler to operate.It is the purpose of this paper to describe an electrongun in which the focus of the electron beam is pre-determined by the construction, and in which thefocus is substantially independent of anode voltage.
* Decimal classification: R388. Original manuscript re_ceived by the Institute, June 17,1938.
f RCA Manufacturing Company, Inc., Harrison, NewJersey.
1 V. K. Zworykin, "Description of an experimental televisionsystem and the Kinescope," PROC. I.R.E., vol. 21, pp. 1655-1673;December, (1933).
2 I. G. Maloff and D. W. Epstein, "Theory of the electrongun," PROC. I.R.E. vol. 22, pp. 1386-1411; December, (1934).
3 R. T. Orth, P. A. Richards, and L. B. Headrick, "Develop-ment of cathode-ray tubes for oscillographic purposes," PRoc.I.R.E., vol. 23, pp. 1308-1323; November, (1935).
" D. W. Epstein, "Electron optical system of two cylinders asapplied to cathode-ray tubes," PROC. I.R.E., vol. 24, pp. 1095-1139; August, (1936).
5 V. K. Zworykin and W. H. Painter, "Development of theprojection Kinescope," PROC. I.R.E., vol. 25, pp. 937-953;August, (1937).
R. R. Law, "High current electron gun for projectionKinescopes," PROC. I.R.E., vol. 25, pp. 954-976; August, (1937).
7 D. B. Langmuir, "Theoretical limitations of cathode-raytubes," PROC. I.R.E., vol. 25, pp. 977-991; August, (1937).
February, 1939
A fixed -focus electron gun involves several fea-tures, the most important being (1) the use of elec-
trostatic focusing fields between electrodes at cathodepotential and electrodes at a common anode poten-tial, and (2) the choice of electrode dimensions such
that the electron beam is focused at the desired place.These principles may be illustrated by comparing the
design of a well-known type of electron gun with thatof a fixed -focus electron gun.
GRID Ns I ANODE
CATHODE 7 I I
GRIDBIAS
I I I
ANODEVOLTAGE
N* 2 ANODE
Fig. 1-Well-known type of electron gun.
A type of electron gun which often has been usedfor high -vacuum television or oscillograph tubes isillustrated in Fig. 1. Electrons emitted from thecathode are controlled by the grid, and acceleratedby the electrostatic field from the No. 1 anode. Theshape of the field is such as to cause the electrons tocross the axis of the gun a short distance from thecathode. From this point of crossing, the electronsmove through the No. 1 anode in somewhat divergingpaths. As the bundle of electrons nears the end of theNo. 1 anode, it enters an electrostatic field extendingfrom the No. 2 anode. The shape of the electrostaticfocusing field is such as to give to the electrons veloci-ties toward the axis proportional to their distancefrom the axis. When the strength of the electrostaticfield is adjusted by the user of the tube so that theelectrons converge to a point at the fluorescentscreen, the electron beam is said to be in focus.
It is customary to provide some means of control-ling the focus of the electron beam, such as connect-ing the No. 1 anode to a potentiometer across themain anode supply, or supplying the voltage to theNo. 1 anode by a separate variable power pack. Sucharrangements are useful and desirable for present-day tubes. However, when one of the anode voltagesis changed, either through choice, or because of line -
Proceedings of the L.R.E. 103

104Proceedings of the I.R.E. February
voltage variations, the beam must be brought to afocus again. Also, the focus may change when thetube is used for television reception because the vary-ing loads taken from poorly regulated power packsupset the proportionality of anode voltages.
510' DIA.
GRID Ne I ANCOE\CATHODE MM MM
4 i 7 I 21 MM
.030 .075° .0413`
FOCUSINGELECTRODE
NII 2 ANODE
343°DIA.
GRIDBIAS
ANODEVOLTAGE
8 TO SCREEN
Fig. 2-Fixed-focus electron gun.
In the conventional electron gun, the focus of thebeam changes when the ratio of the anode voltagesis altered because the relation between momentumof the electrons and forces deflecting them is altered.For example, when the No. 2 anode voltage is heldconstant and the No. 1 anode voltage is raised, themomentum of electrons entering the focusing field isincreased. The strength of the focusing field, how-ever, is lessened, with the result that the beam isfocused upon a point more distant from the electrongun. In the same way, the focus is affected by varia-tions of the No. 2 anode voltage.
The electron-gun design of Fig. 1 may be changedto make the focus independent of anode voltage byusing for the electron lens electrodes at cathode po-tential and at a common anode potential. Such anarrangement is shown in Fig. 2. In this case, theelectrons from the cathode are controlled and accel-erated into the anode region just as in the designshown in Fig. 1. The combination of electrostaticfields between the focusing electrode and the sectionsof the anode gives to the outermost electrons of thebundle a greater velocity toward the axis than isgiven to the electrons within the bundle. When thelength of the focusing electrode is great, or its diame-ter small, the beam is brought to a focus near theend of the electron gun, because the radial componentof velocity given the electrons is then large. By selec-tion of an appropriate length and diameter for thefocusing electrode, the radial velocity can be madejust sufficient to bring the bundle to a focus at thedesired point.
Once the electron beam has been focused in thisway, it remains focused regardless of the anode volt-age applied. This fact may be understood by regard-
ing the electrostatic focusing field as a means of de-flecting the electrons in the beam so that they allmeet in one point. The electrostatic field requiredto deflect a moving stream of electrons through afixed angle is proportional to the voltage throughwhich the electron stream has been accelerated. Ina fixed -focus electron gun, the focusing field occursbetween electrodes at cathode and at anode poten-tial. It follows, then, that the field deflecting theelectrons to the point of focus increases linearly withthe anode voltage and, hence, that the path of anelectron moving under influence of the focusing fieldsin the electron gun is the same regardless of anodevoltage.
Developmental cathode-ray tubes have been builtto verify this analysis. Because the computation ofshape of electrostatic fields in a complex electrodestructure is extremely difficult, and because the ac-curate tracing of paths of electrons through such fieldsis tedious, it was found more convenient to determinethe dimensions of the electrodes by trial and error.The cathode, grid, and anode structures were chosenfrom parts conveniently available. They were thenarranged so that the maximum beam current, thecontrol characteristic, and the gun -to-screen distancewere satisfactory for the desired use. Then the focus-ing electrode was added, as Fig. 2 shows, betweentwo parts of the anode.
2
taN ANODE VOLTAGE = 1000 V.
-200 -100 0 +100 +200 +300FOCUSING ELECTRODE POTENTIAL -VOLTS(WITH RESPECT TO CATHODE)
Fig. 3-Spot size as a function of focusing -electrode voltage.
In order to bring the electron beam to a focus onthe fluorescent screen when the focusing electrodewas at cathode potential, it was necessary to adjustvery carefully the distance L by which the focusingelectrode extended past the smaller-diameter portion
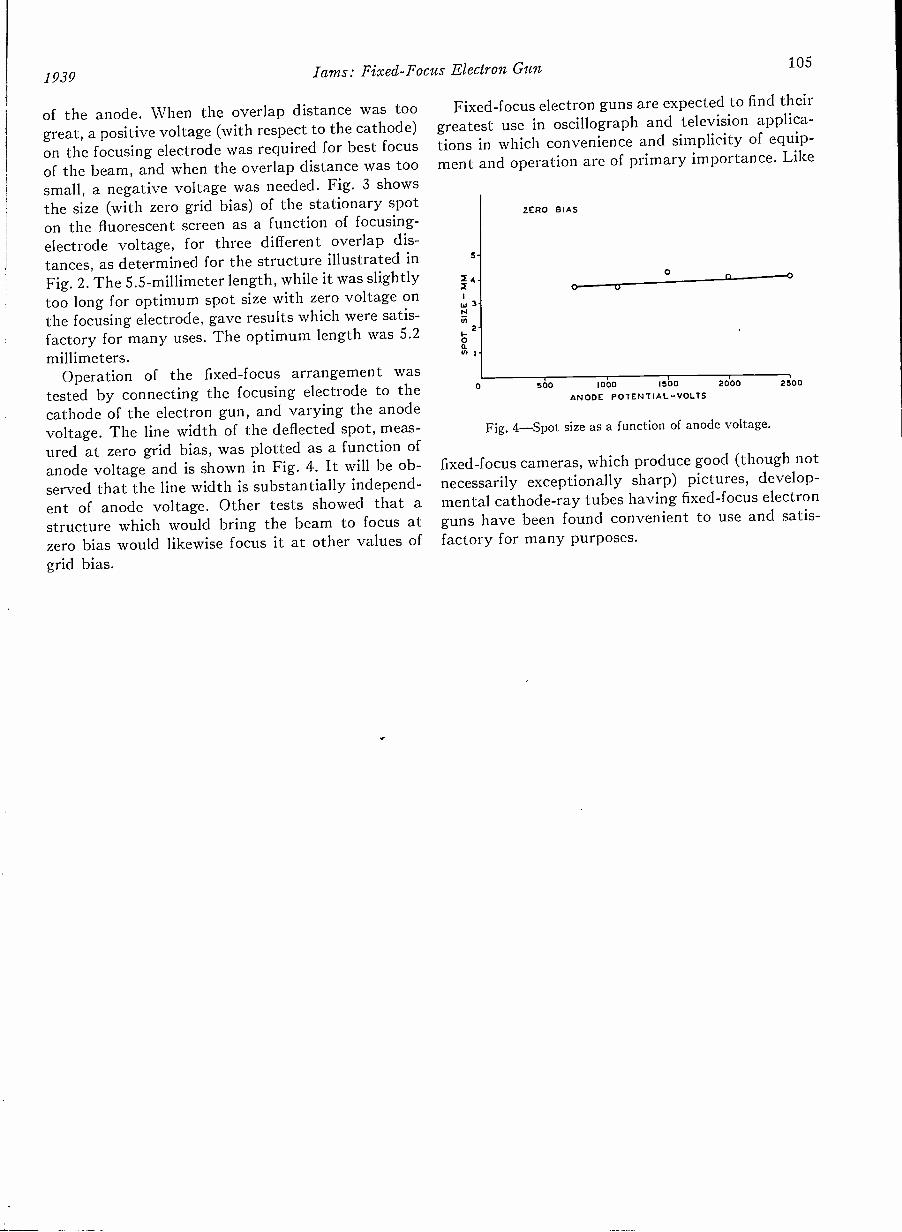
1939 Lams: Fixed -Focus Electron Gun 105
of the anode. When the overlap distance was toogreat, a positive voltage (with respect to the cathode)on the focusing electrode was required for best focus
of the beam, and when the overlap distance was toosmall, a negative voltage was needed. Fig. 3 showsthe size (with zero grid bias) of the stationary spoton the fluorescent screen as a function of focusing -electrode voltage, for three different overlap dis-tances, as determined for the structure illustrated inFig. 2. The 5.5 -millimeter length, while it was slightlytoo long for optimum spot size with zero voltage onthe focusing electrode, gave results which were satis-factory for many uses. The optimum length was 5.2millimeters.
Operation of the fixed -focus arrangement wastested by connecting the focusing electrode to thecathode of the electron gun, and varying the anodevoltage. The line width of the deflected spot, meas-ured at zero grid bias, was plotted as a function ofanode voltage and is shown in Fig. 4. It will be ob-served that the line width is substantially independ-ent of anode voltage. Other tests showed that astructure which would bring the beam to focus atzero bias would likewise focus it at other values ofgrid bias.
Fixed -focus electron guns are expected to find theirgreatest use in oscillograph and television applica-tions in which convenience and simplicity of equip-ment and operation are of primary importance. Like
5-
ZERO BIAS
X 4 -0 0
2 0
41 3'N
-1-0a.
0 500 1000 1500 2000 2500ANODE POTENTIAL -VOLTS
Fig. 4-Spot size as a function of anode voltage.
fixed -focus cameras, which produce good (though notnecessarily exceptionally sharp) pictures, develop-mental cathode-ray tubes having fixed-focus electronguns have been found convenient to use and satis-factory for many purposes.

Velocity -Modulated Tubes*W. Cb HAHNt, ASSOCIATE MEMBER, I.R.E., AND G. F. METCALFt, MEMBER, I.R.E.
Summary-This paper presents a simplified method of analyzingthe operation of vacuum tubes at ultra -high frequencies. In thisanalysis the effects of electron velocity, conduction current, and in-duced current are separated. The theory leads to the development ofa variety of new tubes.It is believed that these new tubes will be useful as oscillators,
detectors, converters, and amplifiers in the 5 -centimeter to 5 -meterfield. They have been used in receivers as oscillators and as super-heterodyne converters at 25 and 37 centimeters; and as oscillatingdetectors at 5 centimeters. Power oscillators have been built whichfurnish 10 watts at 80 centimeters. Radio frequency power amplifiershave been tested at 75 centimeters, with power outputs of 50 wattsand plate efficiencies of 20 to 30 per cent.
INTRODUCTION
THE effects of the transit time of the electronsin vacuum tubes operating at high frequencieshave been the subject of much study',2,3.4 in
recent years. In the analysis of these effects the varia-tions in electron velocity, in addition to the morefamiliar charge -density variations, play an importantrole. When the theory is so arranged as to allowseparate consideration of these variables, a clarifica-tion of thought results which points the way to newtypes of tubes. It is the purpose of this paper todescribe this method of analysis and illustrate itsapplication in the building of radio -frequency ampli-fiers, oscillators, superheterodyne detectors, etc., forwavelengths of 5 centimeters to 5 meters.
GRID IMPEDANCE
While the mutual conductance of ordinary tubesmay decrease somewhat at the shorter wavelengths,it is not the limiting factor at present. The conditionwhich usually determines the maximum frequency isabsorption of radio -frequency power by the grid andlesser extent by the plate.5,6 This energy reappears
* Decimal classification: R130. Original manuscript receivedby the Institute, June 22, 1938; revised manuscript received bythe Institute, September 28, 1938.
Engineering General Department, General Electric Company,Schenectady, New Yorkt Vacuum Tube Engineering !Department, General Electric
Company, Schenectady, New York1 W. E. Benham "Theory of the internal action of thermionic
systems at moderately high frequencies," Part I, Phil. Mag., vol.5, no. 29, p. 641; March, (1928); Part II, Phil. Mag., vol. 11,no. 70, p. 457; Feb., (1931).2 Johannes Muller, "Electron oscillations in high vacua,"
Hochfrequenz and Elektroakustik, vol. 41, p. 156; May, (1933).F. B. Llewellyn "Vacuum tube electronics at ultra -high fre-
quencies," PROC. I.R.E., vol. 21, pp. 1532-1573; November,(1933).
F. B. Llewellyn, "Note on vacuum tube electronics at ultra-high frequencies," PRoc. I.R.E., vol. 23, pp. 112-127; February,(1935).
6 D. 0. North, "Analysis of the effects of space charge on gridimpedance," PROC. I.R.E., vol. 24, pp. 108-158; January, (1936).
6 W. R. Ferris, "Input resistance of vacuum tubes as ultra-high -frequency amplifiers," PROC. I.R.E., vol. 24, pp. 82-104;January, (1936).
106
as an increase in the average kinetic energy of theelectrons to be converted ultimately into heat at theanode. Thus the problem of designing vacuum tubesfor ultra -high frequencies is essentially one of findinga new principle of operation in which the structuresused as grids and plates have a high impedance,viewed from the external circuit.
In present-day tubes the alternating grid voltageaffects directly the field around the cathode, produc-ing a corresponding variation in the charge densityof the electrons leaving it. The radio -frequency varia-tion in conduction current is then large, from thecathode all the way to the plate. Each of the elec-trons approaching the grid induces a current in it;similarly, the electrons leaving the grid plane andapproaching the plate or next element induce morecurrent in the grid. If the frequency is low, these twocomponents practically cancel each other, but as thefrequency is raised the components move apart intime phase, due to the transit angles involved, andthe induced current in the grid increases. This in-duced current, or rather the component of it in phasewith the alternating grid voltage, is responsible forgrid losses.
One method of reducing these losses is to reducethe transit angles, and is the method so far used.Another method would be to arrange the grid struc-ture so that the grid voltage does not directly produceconduction -current variations at signal frequency,but varies the velocity of the electron stream. Thevariations in longitudinal velocity thus produced arethen converted into variations in conduction current.By designing the grid structure to produce velocityvariations, it has been found possible to keep theconduction -current variation, at signal frequency,low enough so that a grid impedance of 50,000 ohmsis readily obtained throughout the wavelength rangeof 5 meters to 5 centimeters. In fact, for receiving -type tubes the grid impedance is of the order ofmagnitude of 50,000 ohms at 5 meters, and has ageneral trend upward with frequency.
Around this new type of grid action have beenbuilt tubes fulfilling the more usual functions ofradio -frequency amplification, detection, oscillation,etc., as well as various combinations of these func-tions.VELOCITY MODULATION
The over-all action of a tube using velocity modu-lation, or any other high -frequency tube for thatProceedings of the I.R.E.
February, 1939

Hahn and Metcalf: Velocity-Modulated Tubes 107
matter, is rather complicated when viewed as a unit.The great simplification introduced by separateconsideration of velocity and conduction -currentvariations allows a reasonably straightforward de-sign procedure. Before taking up the new designs inmore detail, it is well to define more accurately cer-tain quantities and introduce some nomenclature.
Consider the electrons passing a fixed point inspace within a vacuum tube. At this point they willhave a direct -current component of velocity, whichis independent of time, as well as an alternating -current component having the frequency of the im-
pressed signal. This velocity variation can be thoughtof as a time modulation of the direct -current velocityat that point. Similarly the charge density and con-duction current have constant direct -current valueswhich are modulated at signal frequency. The pointto be noted is that the modulation of these quantitiesis a time variation of the stream at a fixed point orplane in space, and not the variation in velocity, etc.,of a single electron during its passage through thetube.
Conduction -current modulation is based on thedirect -current value of conduction current. As this isconstant (except for the current intercepted by elec-trodes), the modulation in per unit, or per cent, is aconvenient way of comparing conditions in differentparts of the tube. Velocity modulation, on the otherhand, is based on the direct -current value of velocity,which varies in different parts of the tube. While it isoccasionally convenient to express this in per unit orper cent, comparisons are difficult because of thechange of base. For this reason it is usually desirableto express the velocity modulation in electron ..volts,i.e., excess or deficiency in kinetic energy caused bythe impressed signal.
As is usual where nonlinear devices are being an-alyzed, added simplification is introduced by con-sidering the signal components to be very small com-pared to the direct -current values. If, in addition,the effects of space charge on the movement of elec-trons are neglected, the equations are linear, andsuperposition can be used. These simplifications will
be used in this paper unless specific mention is madeto the contrary. It is to be noted that only the actionof space charge on the movement of electrons in thebeam is neglected, but not its effect in inducing cur-rents in the electrodes, which is of great importance.
Velocity -Modulation Grid
In explanation of this new type of grid, use will bemade of the four infinite, parallel, conducting per-meable planes of Fig. 1. A parallel flow of electronsperpendicular to the planes is assumed. All the planes
have the same direct voltage, for simplicity, and theplanes A and D are grounded for radio frequencywhile B and C are connected together and have aradio -frequency sine wave of signal applied. Repre-sent the instantaneous signal voltage by the sinewave of Fig. 2.
To start with, assume that the transit angle be-tween A and B and from C to D is small and thatthe electron stream passing plane A is not modulatedeither in velocity or conduction current. An electronentering the space AB at the positive maximum onthe voltage wave (I in Fig. 2) will be accelerated andgain a kinetic energy in electron volts equal to thesignal voltage of plane B. When this electron is be-tween planes B and C, it is not acted on by any field,so that the increased velocity is maintained eventhough the voltage on B and C is changing. If itpasses from C to D at the negative maximum (III inFig. 2), it is again in an accelerating field and the elec-tron gains further kinetic energy equal to the peaksignal voltage. If an electron entering at III is chosen,
Fig. 2
it loses kinetic energy between A and B. Between Band C the energy is unchanged and between C andD (V in Fig. 2) it again loses energy. Electrons en-tering at II and IV are unchanged in velocity. Ifelectrons entering at various other points on thevoltage wave are investigated, it will be found thaton leaving the plane D their velocity will have asinusoidal variation and the peak velocity modula-tion, measured in volts, will be equal to twice thesignal voltage. In other words, planes B and C, con-sidered as a grid, have produced a velocity modula-tion of twice the signal voltage. Note that the transitangle between planes B and C has been assumed tobe exactly r radians at signal frequency, and thatthe signal voltage is small enough so that the changein transit angle produced by the velocity variationis negligible.

108Proceedings of the I.R.E. February
It is convenient to think of planes AB as defininga short section in which a gradient, sinusoidal withtime, produces velocity modulation. This modula-tion persists in amplitude along the beam but suffersa retardation in time phase equal to the transit timeto any point. Planes C and D also produce a velocitymodulation which may be superimposed on that fromA and B. The gradient between C and D is the nega-tive of that between A and B and, therefore, if thetransit angle between B and C is an odd multiple of7r, the total resulting velocity modulation is twicethat produced by A and B; while if it is an even mul-tiple of 7r, the velocity modulation produced by Aand B is canceled by C and D. As shown in AppendixI, the velocity modulation is equal to the signal volt-age multiplied by twice the sine of half the transitangle between B and C, and lags the signal voltageby an angle of 90 degrees plus one half this transitangle.
0
00
(a)
00(b)
0 FAST0 SLOW
Fig. 3
00
The type of action so far considered has beenidealized to the extent that the transit angle A to Band from C to D has been assumed very small. Inthese spaces the electron approaches and recedesfrom the field-free grid space B to C. The spaces A toB and C to D will be called the approach spaces. Inactual constructions these spaces cannot be madenegligible, and consideration has to be given to theireffect. As they are increased in length it will be foundthat the amount of velocity modulation is decreasedfrom the ideal value of twice the signal voltage, andthe angular time lag is changed. For any given geo-metrical configuration and system of applied directvoltages, a ratio of longitudinal velocity modulationin volts to the applied signal voltage can be found.This ratio expressed as a time vector, is called thelongitudinal velocity coefficient of that particulararrangement considered as a grid. Since most actualgrids are not planes, the signal voltage also producesgradients perpendicular to the axis of the beam. Theratio of the transverse velocity modulation in volts tothe applied signal voltage is called the transverse -ve-locity coefficient. Ordinarily the longitudinal -velocitycoefficient is of most importance and, in the interests ofbrevity, the word longitudinal will be omitted except
where distinction between the two types is necessary.It will be noted that the velocity-modulation grid
is most effective when the approach and exit spaceshave small transit angles. This is another way ofsaying that the direct -current potentials on planesA, B, C, and D should be made as high as is conven-ient. This is one of the important differences betweenthis type of grid and the usual type. The latter re-quires that a voltage minimum shall exist in orderthat it may create a conduction -current modulation.For this reason the effects of space charge are muchless important in the new type of grid control.
In Appendix I formulas for velocity coefficientsfor the parallel -plane case are derived. Later in thepaper typical values of these coefficients are given.
CONVERSION OF VELOCITY MODULATION INTOCONDUCTION -CURRENT MODULATION
There are at least three well-defined methods ofconverting the velocity modulation produced by thegrid to the more readily usable conduction -currentmodulation. The three methods are deflection, drifttube, and retarding field.
Deflection ConversionIn this method transverse magnetic, or electro-static fields, or combinations of both are used to
separate the high -velocity electrons from the low-velocity electrons. Patches of high-velocity electronsoccur regularly every 360 degrees of transit angledown the beam, and if all the low-velocity electronsare removed, there will be left a beam with a variablecharge density. This represents 100 per cent conduc-tion -current modulation of half the total beam cur-rent. The low -velocity electrons could be removedto form another beam which would also be fullymodulated and the effect of the beams can be com-bined in a push-pull output circuit.
The deflection methods of conversion appear tolead to critical voltages on certain tube elements, aswell as sensitivity to external electric and magneticfields, etc. The other two methods to be describedseem to offer at least as much sensitivity to velocitymodulation without these disadvantages.Drift -Tube Conversion
Assume a long field -free space and an enteringbeam having velocity modulation but no charge-density modulation; that is, the electrons are evenlyspaced but the velocity varies from one to another.These entering electrons can be represented by therow in Fig. 3(a). They proceed down the beam andin the course of time the fast electrons tend to catchup on the electrons ahead while the slow electronslag behind the general average. This tends to group
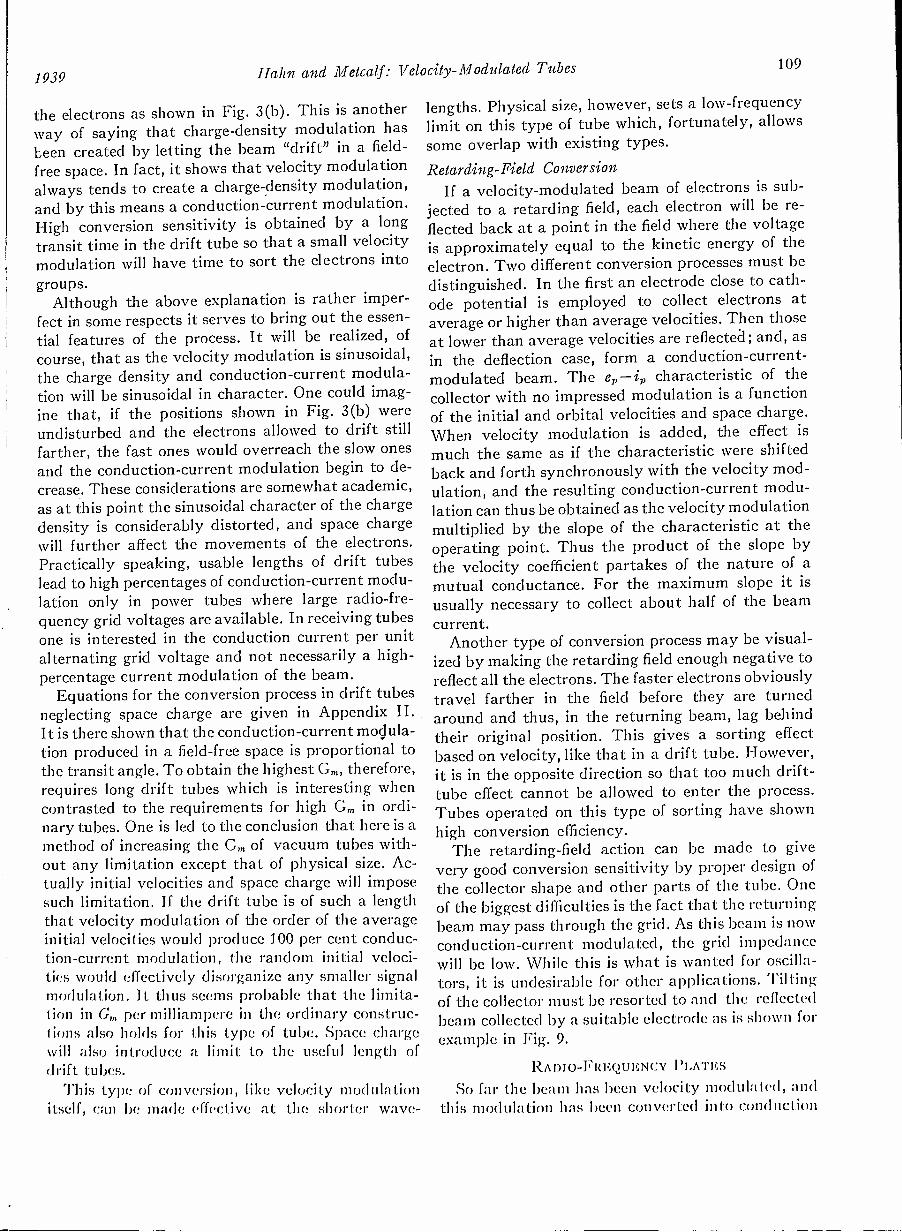
1939 Hahn and Metcalf: Velocity -Modulated Tubes 109
the electrons as shown in Fig. 3(b). This is anotherway of saying that charge -density modulation hasbeen created by letting the beam "drift" in a field -free space. In fact, it shows that velocity modulationalways tends to create a charge-density modulation,and by this means a conduction -current modulation.High conversion sensitivity is obtained by a longtransit time in the drift tube so that a small velocitymodulation will have time to sort the electrons intogroups.
Although the above explanation is rather imper-fect in some respects it serves to bring out the essen-tial features of the process. It will be realized, ofcourse, that as the velocity modulation is sinusoidal,the charge density and conduction -current modula-tion will be sinusoidal in character. One could imag-ine that, if the positions shown in Fig. 3(b) wereundisturbed and the electrons allowed to drift stillfarther, the fast ones would overreach the slow onesand the conduction -current modulation begin to de-crease. These considerations are somewhat academic,as at this point the sinusoidal character of the chargedensity is considerably distorted, and space chargewill further affect the movements of the electrons.Practically speaking, usable lengths of drift tubeslead to high percentages of conduction -current modu-lation only in power tubes where large radio -fre-quency grid voltages are available. In receiving tubesone is interested in the conduction current per unitalternating grid voltage and not necessarily a high -percentage current modulation of the beam.
Equations for the conversion process in drift tubesneglecting space charge are given in Appendix II.It is there shown that the conduction -current modula-tion produced in a field -free space is proportional tothe transit angle. To obtain the highest Gm, therefore,requires long drift tubes which is interesting whencontrasted to the requirements for high Gm in ordi-nary tubes. One is led to the conclusion that here is amethod of increasing the Gm of vacuum tubes with-out any limitation except that of physical size. Ac-tually initial velocities and space charge will imposesuch limitation. If the drift tube is of such a lengththat velocity modulation of the order of the averageinitial velocities would produce 100 per cent conduc-tion -current modulation, the random initial veloci-ties would effectively disorganize any smaller signalmodulation. It thus seems probable that the limita-tion in Gm per milliampere in the ordinary construc-tions also holds for this type of tube. Space chargewill also introduce a limit to the useful length ofdrift tubes.
"Phis type of conversion, like velocity modulationitself, can be made effective at the shorter wave-
lengths. Physical size, however, sets a low -frequencylimit on this type of tube which, fortunately, allowssome overlap with existing types.
Retarding -Field ConversionIf a velocity -modulated beam of electrons is sub-
jected to a retarding field, each electron will be re-flected back at a point in the field where the voltageis approximately equal to the kinetic energy of theelectron. Two different conversion processes must bedistinguished. In the first an electrode close to cath-ode potential is employed to collect electrons ataverage or higher than average velocities. Then thoseat lower than average velocities are reflected; and, asin the deflection case, form a conduction -current -modulated beam. The e,,-in characteristic of thecollector with no impressed modulation is a functionof the initial and orbital velocities and space charge.When velocity modulation is added, the effect ismuch the same as if the characteristic were shiftedback and forth synchronously with the velocity mod-ulation, and the resulting conduction -current modu-lation can thus be obtained as the velocity modulationmultiplied by the slope of the characteristic at theoperating point. Thus the product of the slope bythe velocity coefficient partakes of the nature of amutual conductance. For the maximum slope it isusually necessary to collect about half of the beam
current.Another type of conversion process may be visual-
ized by making the retarding field enough negative toreflect all the electrons. The faster electrons obviouslytravel farther in the field before they are turnedaround and thus, in the returning beam, lag behindtheir original position. This gives a sorting effectbased on velocity, like that in a drift tube. However,it is in the opposite direction so that too much drift -tube effect cannot be allowed to enter the process.Tubes operated on this type of sorting have shownhigh conversion efficiency.
The retarding -field action can be made to givevery good conversion sensitivity by proper design ofthe collector shape and other parts of the tube. Oneof the biggest difficulties is the fact that the returningbeam may pass through the grid. As this beam is nowconduction -current modulated, the grid impedancewill be low. While this is what is wanted for oscilla-tors, it is undesirable for other applications. Tiltingof the collector must be resorted to and the reflectedbeam collected by a suitable electrode as is shown for
example in Fig. 9.
RADIO -FREQUENCY PLATES
So far the beam has been velocity modulated, andthis modulation has been converted in to conduction

110Proceedings of the I.R.E. February
current. It now remains to utilize this current inproducing a radio-frequency output in the externalcircuit. The induced current flowing from any elec-trode to its external circuit is the result of the actionof the space charge of the beam on this electrode.
Consider an electron approaching an electrode. Ofthe total number of lines of force ending on the elec-tron, more and more will have their other end on theelectrode. This corresponds to an increase in theinduced charge on the electrode; and to supply this,a current must flow to the electrode from an externalcircuit. According to this idea all current will ceasewhen the electron hits the electrode; and, in effect,current to the electrode is the result of charges inmotion near it rather than those which are hitting it.Thus it must be expected that as a conduction-cur-rent -modulated beam of electrons approaches anelectrode, there will be an induced current in it.However, as the electrons exposed to the electrodehave a range of time -phase angles represented by thetransit time in the approach space, the total inducedcurrent will be somewhat less than the conduction -current modulation times the beam current. Assumeplane B in Fig. 1 is a solid collector, and plane A isa permeable conducting plane with a conduction -current -modulated beam entering from the left. Theelectrons moving between A and B cause inducedcurrents which flow in any external circuits connectedbetween A and B. If the transit angle A to B is small,the induced current is equal to the entering conduc-tion -current modulation times the beam current. Asthe angle from A to B is made larger the inducedcurrent drops off just as the velocity modulation didin the case of a grid. Thus, if it is desired to use aplane such as B as a radio -frequency plate, a closecomplementary plane A or its equivalent must beused.
Such a combination is not capable of providingany more induced current than 100 per cent of themodulated part of the beam current. If, however,one uses also planes C and D, making plane B per-meable, the induced current between planes A andB is in no wise changed and an additional inducedcurrent from C to D, through their associated externalcircuits, is also added. If the transit angle from B toC is made an odd multiple of 7r, then the inducedcurrent is doubled. This is an important feature as,in short-wave practice, high output impedances arehard to obtain; and this feature allows the use ofeither one fourth the impedance necessary with thesingle plate, or the production of four times thepower for the same modulated beam current.
At first glance this process may seem like gettingsomething for nothing. In the first place it must be
remembered that the mere production of inducedcurrent involves only a shifting of lines of force anddoes not in itself affect the velocity of an electron.The energy expended in the external circuit comesfrom the kinetic energy of the electron in the follow-ing manner. The induced current flowing in the ex-ternal circuit builds up a radio -frequency voltageacross it and thus between electrodes. This voltageproduces a gradient through which the beam mustpass, which in turn produces a velocity change orvelocity modulation in the beam. Since the beam hasconduction -current modulation, it presumably hassome charge -density modulation. The velocity modu-lation has such a time -phase relation with respect tothe charge -density variations that the places of highcharge density are slowed down and those of low-charge density are speeded up. There is thus a netreduction in average speed of the beam which is justsufficient to supply the external power.
Just as in the case of the double -ended grid we ob-tain a velocity modulation of twice the peak radio -frequency swing, so in the double -ended plate weobtain an induced current of twice the peak value ofthe modulated -beam current. The above result isshown mathematically in Appendix III.
The use of a double -ended plate not only doublesthe induced current, but has an added advantageThe beam leaving plane D has been slowed down bythe loss in kinetic energy to the load. It can now becollected at a voltage just high enough to keep anyelectrons from being reflected. Thus the heating lossof the collector is minimized and the plate efficiencyof the tube kept at a reasonable figure. While themodulation from the plate decreases the averagebeam velocity, the electrons at the minimum charge -density spots are increased in velocity. Under theseconditions, the plate efficiency of a collector runningat just sufficient voltage to collect all the electronsis about 50 per cent.
Consideration of the arguments used in connectionwith Fig. 1 would indicate that the use of four or sixpairs of planes connected in parallel to the load, in-stead of two pairs, would increase the induced cur-rent by factors of 4 or 6. However, a point is soonreached where the complications of paralleling elec-trodes at the load and of getting the phase anglesright, etc., especially at the wavelengths under con-sideration, become prohibitive. So far a single cylin-drical anode has proved a good compromise of sim-plicity versus efficiency. Perhaps later when the arthas progressed further, multiple plates may becomemore desirable from the circuit standpoint.
Where the double-ended plate is used with a re-tarding -field type of sorting, it becomes increasingly

1939 Hahn and Metcalf: Velocity-Modulated Tubes 111
difficult to collect the returning beam at the lowvoltage required for highest collector efficiency. Thusthe collector -loss considerations cited above are ofmost value where drift-tube sorting is used.
SUPERPOSITION OF EFFECTS
It will be realized that the velocity -modulationcharacteristic, the drift -tube effect, and the induced -
current characteristic together form a complete de-scription of the relations of any electrode to the elec-tron stream. As an illustration take the velocity -modulation grid, and again assume no modulation ofof the incoming beam. The velocity coefficient givesthe total velocity modulation produced as a result ofa given signal. The signal produces some velocitymodulation in the first approach space. In the inte-rior of the grid some conduction -current modulationis produced by drift -tube sorting. In the exit spacethis induces a current in the grid flowing from theexternal circuit. This current divided into the signalvoltage gives directly the grid impedance. While thenumerical calculations may not be shorter than whenusing a complete formula for the impedance directly,there is considerable advantage from a design stand-point in the segregation of the effects. Thus it canbe seen that the grid impedance goes down as thelength of the grid is increased, and where a high -impedance grid is desired the shortest length, whichgives nearly 7r as the transit angle, is the best.
If, as the operating frequency is raised, the directvoltage on the grid, and thus the velocity throughthe grid and end spaces, is raised so as to maintainconstant transit angle, the grid impedance has anupward trend. This is because the drift -tube sortingis proportional to the per -unit velocity modulationand the latter is decreasing. A drift tube r radianslong does not produce very much conduction -cur-rent modulation, so that the grid impedance is easilymade high.
In the radio -frequency plate the effect of the in-coming modulation of the beam may be simply super-imposed as an extra induced current on the effectsalready produced by the plate considered as a griddriven by the load alternating voltage. In this wayit can be seen that the plate impedance is exactlyequal to the grid impedance of the same structure.
In a drift tube the conduction current leads thevelocity modulation by a time -phase angle of 7r/2.Thus, if the grid is r radians long, the grid impedanceis not only high but is a pure reactance. In fact, it isequivalent to an added positive capacitance betweenthe grid and the end shields. If, however, the grid isoperated at an angle of 7r/2, then the grid impedancehas become a negative resistance. The possibility of
utilizing this effect in an oscillator was pointed outby Heil.? The difficulty with this type of tube isthat the grid is essentially a high -impedance struc-ture, and the resulting negative resistance is alsohigh making it difficult to produce an efficient outputcircuit.
This sort of negative -resistance action must bedistinguished from the negative resistance of tem-perature -limited diodes as predicted by North.' Inthe latter case the whole action, production ofvelocity modulation, drift -tube sorting, and inducedcurrent, takes place in the approach space. In thiscase the resulting negative resistance may .be higherthan that calculated for Heil's tube.
Finally it should be noted that, although field -free spaces were used in the idealized descriptionsso far given, the conceptions are not limited to suchspaces. For instance, a space with longitudinal direct -current fields merely varies the transit angle in amore complex fashion. If alternating -current fields
are present, the drift -tube sorting applies to each
increment of generated velocity modulation as
though the alternating -current field were absent inthe rest of the space. The total conduction -currentmodulation can then be expressed as the integral ofthese increments, due allowance being made fordrift -tube sorting.
DESIGNS OF GRIDS
As has been pointed out, the radio-frequency plateand grid use similar structures, and it will be appre-ciated that a well -.designed grid can be used with anydesired sorting process. For this reason the designof practical velocity -modulation grids will be takenup first.
In the design of such a structure, a balance mustbe obtained between the velocity coefficient and itscapacitance and inductance. Fig. 4 shows the crosssection of the grids used in tubes at 5 -meter, 30 -
centimeter, and 4.8 -centimeter wavelengths. Thecalculated velocity coefficients are 1.6, 1.3, and 0.8,respectively. The cold input capacitances are 3.0
and 1.8 micromicrofarads for the first two, the lastgrid being part of a concentric transmission line in-troduces no lumped capacitance. Although the5 -meter grid is only slightly longer than the 30 -centi-meter grid, they both operate with transit angles ofthe order of r radians at the applied frequency. Thisis possible by adjusting the direct voltage on thegrid. The 5 -meter tube operates at +30Q volts onthe end shields and +5 volts on the grid, while the
7 A. Arsenjewa-Heil and 0. Heil "A new method for the produc-tion of short undamped, electromagnetic waves of great in-tensity," Zeil. fur Phys. vol. 95, no. 11 and 12, pp. 752-762;(1935).

112Proceedings of the J.R.E. February
'I
30 -centimeter tube has +300 volts on both. Theadjustment of this voltage is not critical and maybe changed by ±20 per cent with little change of thevelocity coefficient. The 4.8 -centimeter design oper-ates at a transit angle of 37r radians at 1200 volts.
5 -meter grid
O
O
7_
O
O
7/A -
30 -centimeter grid 4.8 -centimeter gridFig. 4
The particular designs shown in Fig. 4 are not neces-sarily the optimum, but merely illustrate convenientconstructions which were studied extensively.
These grids were used with beam currents of 5milliamperes or less, depending on the design of theelectron -focusing system. The design of grids fortransmitting tubes in which much higher beam cur-rents are required, usually lead to larger structures
Fig. 5
and higher direct -current potentials, although, as nodirect current is necessarily collected on any of theseelements, the direct -current power supplied may bevery small. Fig. 5 is a cross section of a grid for use inthe region from 20 to 40 centimeters with beam cur-rents of 50 milliamperes or more and operating at3000 volts.
MEASUREMENT OF VELOCITY COEFFICIENTS
The most convenient method of determining veloc-ity -modulation factors is by use of a low -voltage col-lector. The change of direct-current potential ofsuch a collector, necessary to maintain constantcurrent with and without a known radio-frequencyvoltage applied to the grid, gives the peak value ofthe velocity modulation of the electrons. The ratioof this value to the peak input voltage is defined asthe velocity coefficient. In order to reduce the effectsof orbital motions and other defects of the collector,and to reduce the effects of the returning electronson the grid itself, the total beam current is kept small.
At the shorter wavelengths it is comparativelydifficult to determine the radio -frequency voltageapplied to the grid, and here recourse has been had tochecking the variation of velocity coefficient withrespect to the applied direct voltage and frequency.The checks obtained in this way show that the gridsare performing in the expected manner even at wave-lengths as low as 5 centimeters. By inference, then,
HIGH VOLTAGE
_L _L
T T T T LOW VOLTAGEFig. 6
the calculated values of velocity coefficient should bevery close to the actual values. Insofar as the radio -frequency voltages on the grid are concerned, thereis some possibility of using the velocity-modulationgrid as a voltage-measuring device, whose calibra-tion curve can be calculated.
DESIGN OF SORTING SPACEThe choice of the two methods used for convertingvelocity modulation into conduction-current modula-tion, that is, drift-tube sorting and retarding -fieldaction, is dependent on the tube application in-volved, but the principles of design can best be out-lined before this choice is made.As the drift -tube action is directly proportional tothe length of the drift tube and inversely proportionalto the electron velocity, the primary problem is todesign a structure which will maintain a low -voltagebeam in a focused condition for the necessary dis-tance. A structure which does this and also reducesthe effect of stray magnetic fields is shown in Fig. 6.The combination of alternate low- and high -voltage
electrodes results in a radial focusing field practicallythroughout the length of the beam. With such astructure a beam of charges may be sent a reasonable

1939 Hahn and Metcalf: Velocity -Modulated Tubes 113
distance without a great increase in cross section,and because of the strong focusing field this systemis relatively insensitive to stray fields. In general alength of from 1 to 4 inches is sufficient for mostapplications unless the frequency of the velocitymodulation is very low.
The primary problem in the design of retarding -field collectors is one of shaping the collector so thatthe effects of orbital velocity of the electrons arereduced to a minimum, and the returning beam isdirected at the proper angle. With cylindrical beamsit has been found that a collector with spherical shapeis quite satisfactory, and yields current -voltage char-acteristics which have conductances of from 200 to2000 micromhos per milliampere of beam current.The exact radius of curvature is a function of the
--30Yp
+500 V.
COLL ECTORI + 4 V.
+350 V.
Fig. 7
space -charge density and the focusing fields and istherefore somewhat difficult to calculate. In thereceiving tubes tested this radius was from 1/2 inchto 1 inch.
TEST RESULTSOscillators
The simplest type of oscillator utilizing the fore-going principles is one using the retarding -field col-lector in either of the processes previously described.Fig. 7 shows a cross section of the tube with attachedcircuits, while Fig. 8 is a photograph of the tube withthe oscillating circuit in place. This type of tube oscil-lates with at least a +15 per cent range of any volt-age at any one frequency and by changing the directvoltage of the radio -frequency grid it will oscillateover a frequency range of 5 to 1. The major portionof the experimental work on this type of tube wasdone with beam currents of one milliampere or less,but even with this small current, oscillations wereeasily obtained at a wavelength of 14 centimeters. Byobserving the anode characteristic during oscillationit is estimated that the beam current was modulatedfrom 30 per cent to 100 per cent and that the output
voltage was the order of one volt. Further tests wereconducted with tubes having beam currents of 30milliamperes, in which case about four watts of radio -frequency power were obtained in a lamp load at awavelength of 50 centimeters.
11/11111 11111!1111,.Ilp!c
.i0;11-1;
Fig. 8
The major application of this type of oscillatorwas a superregenerative receiver, the quench fre-quency being applied on either the collector or thefocusing grid. Receivers of this type were tested in
I. F. OUTPUT
OSCILLATORGRID"a
400V.
400V.DETECTORGRID4 I
CATHODEFig. 9
the field on 37- and 25 -centimeter transmission, andproved to be very simple to construct.
Tubes for superheterodyne reception were con-structed as shown in Fig. 9. The signal is received

114 Proceedings of 1/re I.R.E. February
on grid No. 1 which velocity modulates the beam atsignal frequency, while grid No. 2 velocity modulatesthe beam at oscillator frequency. By operating theretarding -field collectors at a point of maximumcurvature the current in this element has an inter-mediate -frequency component. In order to allow thereturning electrons to cause oscillation in the oscil-lator grid but not in the signal grid, the collector istilted at an angle so that the returning beam will
F.g. 10
strike the end shield between these two grids. If it isdesired to use a separate oscillator, the collector maybe tilted at an angle sufficient to allow the returningelectrons to strike the last end shield. Tubes of thistype were tested at 37 centimeters with an 18 -mega-cycle intermediate -frequency amplifier and provedto be good converters. The beam current was lessthan one milliampere and the highest voltage was350 volts.
RADIO -FREQUENCY AMPLIFIERS
Radio -frequency amplifiers were first tested at 50to 200 megacycles in order to facilitate accurate
measurement of the radio -frequency voltages. Fig.10 is a cross section of a radio -frequency amplifierfor receiver use in this frequency band utilizing drift-tube sorting. Fig. 11 is a photograph of a similartube in metal.
The elements numbered 2, 4, 6, 8, 10, 12, 14, and15 were operated at 300 volts direct current. Thedirect voltage of radio -frequency grid No. 3 andradio -frequency anode No. 13 were adjusted formaximum output at the frequency used. This usuallywas about 10 to 30 volts positive. Focusing elements5, 7, 9, and 11 were connected together and thevoltage adjusted to give maximum beam current.This occurred at about 30 volts positive.
The mutual conductance of grid No. 3 to anodeNo. 13 was measured by first obtaining the voltagegain between them and then measuring the outputimpedance by cutting the voltage across the outputcircuit to one half, with a shunt resistance. With a
Fig. 11
beam current of 0.8 milliampere and a frequency of100 megacycles the mutual conductance was about200 micromhos. This value checked calculationswithin the accuracy that the average velocity in thedrift tube could be estimated. Although the value ofmutual conductance obtained in this particular tubewas probably too low for practical application atthis frequency, it illustrates the principles involved.It is also interesting to note that the operation isnot at all critical to voltage, and that both the inputand output resistance of the tube were so high as notto affect the attached circuits.
Radio -frequency amplification by means of retard-ing -field action was also tried. In this case the return-ing conduction-current -modulated beam was col-lected on an element at one side of the axis by tiltingthe collector. The mutual conductance of this typeof tube depends almost entirely on the slope of thecollector current -voltage characteristic, which in thecase of the tube tested was low, the mutual con-ductance being only 300 micromhos.
Radio -frequency amplifiers using drift -tube sort-ing, with auxiliary magnetic focusing have provedvery effective for high -power outputs. Coils surround-ing the tube provide sufficient focusing field so that

1939 Hahn and Metcalf: Velocity -Modulated Tubes 115
less than one per cent of the beam current is lost tothe accelerating electrodes. Fifty watts useful out-put has been obtained, with a collector efficiency of20 to 30 per cent, and at a frequency of 360 mega-cycles. At present there seems to be no reason whytubes of this type cannot be built for higher powersand still shorter wavelengths.
Tubes embodying the principles described in theforegoing are not available as yet for commercialdistribution.
APPENDIX I
Velocity Coefficient for Parallel Plarles
Assume that the grid is composed of four infinite,conducting, permeable, parallel planes as in Fig. 1.Furthermore, let the voltage from planes A and Dto the cathode be simply V0, a direct voltage, whilethe voltage of planes B and C to the cathode isV, (1+5 sin wt). Planes B and C, connected together,form the grid, with a signal voltage of V,5 sin wt,and planes A and B are end shields. The transitangle from A to B and from C to D, at signal fre-quency, is taken as negligibly small, while that fromB to C is denoted by 0.
Neglecting space charge, the beam passing betweenA and B acquires by reason of the alternating -currentgradient, an increased velocity of V,5 sin wt electronvolts so that the total velocity at B is V, (1+5 sin wt)electron volts. In the space B to C, however, there isno field and no further velocity change is made untilthe beam reaches C. At this point, the beam velocity,referred to the signal voltage, is V, (1+5 sin (cot -0) ),because the transit angle 0 in the grid represents atime delay. In the space C to D the beam acquire_s afurther velocity of - V115 sin cot electron volts. Theminus sign is used as the gradient is in the reversedirection. Thus the total velocity at D, in electronvolts, is
V0(1 + (5 sin (wt - 0) - 6 sin wt)
the velocity of neighboring electrons is slightly dif-ferent. Let an electron enter at time 11 and anotherat time ti-l-dti. Now let the transit time of the firstelectron be to and the second to+dto. Then the twoelectrons will leave at times li+to and tid-dti+lo+dto.As conduction current is defined as the time rateat which a charge passes a given point, the enteringconduction current caused by the two electrons isproportional to 1/dt1 while the current leaving is
proportion to 1/(dti.-1--dt0), these quantities being thereciprocal of the difference in time between the elec-trons. Now if /0 is the actual entering conductioncurrent, then the current leaving is
[Io1+-dto
dt1
at time to later. It must be observed that the lag intime to must be inserted as it represents the timedelay in transit and is not automatically taken careof by the equation.
In case all alternating -current quantities aresmall, it can be seen that dto/dti, being an alternating -current quantity, is small compared to 1.0. Thus theleaving current minus the entering current delayedto seconds is [-/o(dto/dti)] at time (to -l -ti). Again,when alternating -current quantities are small, theircross products are neglected and thus /0 can be takenas the direct beam current. Now assume the enteringvelocity modulation is V Ai sin cot in electron voltsand the direct voltage of the drift tube is V,,. Thenthe entering kinetic energy of the electrons is
Vd + VAT sin wti in volts.
Also the velocity in centimeters per second is
v = 5.97 X 10⁷VVd + V At sin cal
V Al= 5.97 X 10⁷-\/17,/ 1 --I- sin cot)
2 Vd
= V0(1 + b(cos 0 - 1) sin wt - (5 sin 0 cos cot)
= V, - V06(2 sin 0/2) sin (cot - 7r/2 - 0/2).
Thus the longitudinal velocity coefficient is
inasmuch as ITAr<<174/. The transit -time to is
l 1
v 5.97 X 10⁷ -Old V Ar1 + sin wit
2174/
V 06 (2 sin °7r 0 7r 0
2- -
2 2 02
2 2 1 4
SID2
sin w15.97 X 10707,1 217,1
andVrib
in vectorial form.(Ito
APPENDIX IIDrift -Tube Sorting
cos wit.rlti 5.97 X 10⁷\/1',1 2 l7,1
A drift tube consists of a field -free space of length I. Assume no entering a I fermi ting conduction currentThe entering beam has velocity modulation so that and denote the leaving current minus the entering

116 Proceedings of the I.R.E.
current by Id. Then
11.017 mwId = cos w(ti 10)
5.97 X 107 X 2 X V2/2
Now if cb is the transit angle from one end of the drifttube to the other, based on the average or direct -current velocity
and
lw
=5.97 X 10⁷ X -07;
yhroV mId =
2Vdcos (A. - 4).
Again, the difference current Id, divided by theentering velocity modulation in volts and by thedirect beam current will be called the drift -tubefactor. In vectorial notation, this is
.75 -ae = -2Vd
ir
2-(I)
where ae is the drift -tube factor and
Id = acV mI0.
APPENDIX III
Radio -Frequency Plates of the Parallel -Plane Type
Consider two planes such as A and B in Fig. 1. Fromsymmetry there are no electron motions or currentsflowing parallel to theplanes so the problem is essential-ly one dimensional. The total current, the sum of theconduction current and the displacement current, issolenoidal, that is, in this one-dimensional case, ithas the same value simultaneously at all points inthe space A for B. If we leave out of consideration thedisplacement current between A and B due to thecapacitance of the planes in the absence of the beam,the rest of the total current must obviously be theinduced current due to the beam. This is, then simplythe average of the conduction current at all pointsin the space, taken at any instant of time. In thecase to be considered, the transit angle A to B issmall so that the induced current then simply be-
comes equal to the conduction current in the beamat a plane midway between A and B.
Assume a double -ended grid using all four planesin Fig. 1. The conduction current in the beam passingthrough the space A to B is assumed to be
/, sin wt.
In this case the induced current from A to B is alsoIe sin wt. Now if B is the transit angle between planesB and C, the conduction current passing between Cand D is
/e sin (wt -
and the induced current from C to D is the same. Thetotal induced current flowing from planes B and C tothe outside circuit is then
[sin (wt - 0) - sin 0]7r 0= I ,(2 sin -) sin (wt - - -
2 2 2
and if 0=7r, then the peak value of induced currentis 2/c.
Now assume that an external resistance R is con-nected from the planes B and C to A and D. Then avoltage
0 7r 0IeR(2 sin sin (cot - - -2 2 2
is developed and if 9 =-1r, this is
- 2I,R sin wt.
The velocity modulation produced at plane D by thisvoltage is, from Appendix I,
+ 41,R sin wt.
The total conduction current in the beam passingthrough plane D is
/0 ± /, sin (wt - 0) = lo - lc sin wt.Thus it can be seen that where the conduction cur-rent is a maximum, usually indicating high chargedensity, the electrons are slowed down, and viceversa.
Nonexistence of Continuous Intense Ionization inthe Troposphere and Lower Stratosphere*
0. H. GISHt, NONMEMBER, I.R.E., AND H. G. BOOKERf, NONMEMBER, I.R.E.
Summary-Evidence that radio waves are returned from thetroposphere and lower stratosphere has been interpreted by WatsonWatt and coworkers as pointing "to continuous ionization in sharplybounded thin strata, over long periods of 5 X10¹² ions/cc or more inregions around 6 to 10 km . . . at all times of day, in summer andin winter." Direct observations of the electrical state of the troposphereand lower stratosphere prove that the electrical conductivity of theseregions is something like nine orders of magnitude less than that sug-gested by Watson Watt and coworkers. Continuous recording ofelectrical conductivity during the flight of the Explorer II up to analtitude of nearly 22 kilometers shows a maximum ionic density ofonly 5300 ions/ cm' (at 14.8 kilometers). Balloon observationsthroughout the troposphere show no trace of ionic densities far inexcess of 4000 ions/ cm'. This evidence is further supported by manyyears of continuous recording of the electrical state of the troposphereat the Huancayo Magnetic Observatory, 3.3 kilometers above sealevel. Moreover, the power required to maintain the electrificationpostulated by Watson Watt and coworkers is startling when com-pared with that available from the sun and thunderstorms. Thestrength of radio echoes from the troposphere would seem to have beengreatly overestimated.
I. INTRODUCTION
VIDENCE that radio waves are returned fromlow levels in the atmosphere, even as lowas one kilometer has been reported in recent
years.''2'3'4'5'6'7'8'9 An extensive report' has been pub-lished by Watson Watt and coworkers. They findthat "the echoes from the lowest heights appear tobelong to a system of multiple reflections fromsharply defined heights which usually lie above sixkilometers and are not infrequently found at tenkilometers." They state that "all the evidence . . .
points to 0.7 as a fair approximation to the effectivereflection coefficient." This result, if true, is of Out-standing importance. But before one can accept its
* Decimal classification: R113. Original manuscript receivedby the Institute, May 10, 1938. Presented before U.R.S.I.-I.R.E.meeting, Washington, D. C., April 29, 1938.
t Department of Terrestrial Magnetism, Carnegie Institu-tion of Washington, Washington, D.C.
1 R. C. Colwell and A. W. Friend, "The D region of the iono-sphere," Nature, vol. 137, p. 782; May 9, (1936).
2 R. C. Colwell and A. W. Friend, "The lower ionosphere,"Phys. Rev., vol. 50, pp. 632-635; October 1, (1936).
3 R. C. Colwell and A. W. Friend, "Tropospheric radio wavereflections," Science, vol. 86, pp. 473-474; November 19, (1937).
' R. C. Colwell, A. W. Friend, N. I. Hall, and L. R. Hill,"The lower regions of the ionosphere," Nature, vol. 138, p. 245;August 8, (1936).
6 S. K. Mitra, "Return of radio waves from the middle atmos-phere," Nature, vol. 137, p. 867; May 23, (1936).
6 S. K. Mitra, "Some observations on the C regions of theionosphere," Nature, vol. 138, pp. 283-284; August 15, (1936).
7 H. Rakshit and J. N. Bhar, "Some observations on the Cregions of the ionosphere," Nature, vol. 138, p. 283; August 15,(1936).
6 R. A. Watson Watt, L. H. Bainbridge -Bell, A. F. Wilkins,and E. G. Bowen, "Return of radio waves from the middle atmos-phere," Nature, vol. 137, p. 866; May 23, (1936).
0 R. A. Watson Watt, A. F. Wilkins, and E. G. Bowen, "Re-turn of radio waves from the middle atmosphere-I," Proc. Roy.Soc., ser. A, vol. 161, pp. 181-196; July 15, (1937).
February, 1939
validity there are several possibilities which must betaken into consideration.
(1) The equipment required for investigatingechoes of such short delay time requires careful de-sign. Is it possible that the reported echoes are duesimply to imperfections in the equipment? There ap-pears to be fair agreement among the several work-ers in various parts of the world as to the majorfeatures of the reported reflections from the tropo-sphere and lower stratosphere, although they differas to a number of details. It seems reasonable to as-sume, therefore, that these echoes are not spuriousand do indicate return of part of the radiated energywith delay times corresponding to equivalent semi -paths of the order of 10 to 50 kilometers.
(2) It seems to be assumed that the echoes arebeing received from directly above the equipment.The possibility that they may be coming from ob-jects on the surface of the earth seems to be ignored.While this assumption may be true, its validity doesnot seem to have been proved.
(3) Even if the echoes are real and are coming fromoverhead, there still remains the possibility that theanalysis by Watson Watt and coworkers of the vari-ous echoes into a system of multiple reflections fromsharply defined heights of the order of 10 kilometersmay be wrong. They themselves point out that thisinterpretation would seem to involve "some dangerof showing a greater return of energy from the wholeatmosphere . . . than was originally incident." Thattheir interpretation does founder on precisely thisdifficulty has recently been proved by Appleton andPiddington." Moreover, the latter authors have car-ried out experiments which seem to show that, evenif there is any return of radio waves from a heightof about 10 kilometers, it is probably from atmos-pheric scattering patches rather than from sharplydefined reflecting strata, and that the amplitude ofthese echoes is at least four orders of magnitude lessthan that estimated by Watson Watt and coworkers.The observations of Appleton and Piddington arein complete agreement with the well -established factthat long-distance radio communication is main-tained via the E and F regions of the ionosphere.
lo E. V. Appleton and J. H. Piddington, "The reflexion coeffi-cients of ionospheric regions," Proc. Roy. Soc., ser. A, vol. 164, pp.467-476; February 18, (1938).
Proceedings of the 117

118 Proceedings of the I.R.E. February
We conclude that there does seem to be some evi-dence of the return of radio waves from the tropo-sphere and lower stratosphere, but that these echoesare exceedingly weak.
That these reflections are brought about primarilyby masses of highly ionized air, as is doubtless thecase in the ionosphere proper, is more or less directlyimplied in several reports. Watson Watt and co-workers state that their results point "to continuousionization in sharply bounded thin strata, over longperiods, of 5 X10¹² ions/cc. or more in regions aroundsix to ten kilometers . . . at all times of the day, in
that suggested by Watson Watt and coworkers. Sucha contingency has been indicated by Mitra5'6 and byAppleton and Piddington." In view of this directevidence concerning the electrical state of the tropo-sphere and lower stratosphere it seems quite inad-missible to attribute radio echoes from these regionsto continuous ionization over long periods of 5 X10"ions per cubic centimeter. One purpose of this paperis to review that direct evidence.
In sections II and III typical observations madein the Andes mountains of Peru at a height of 3.3kilometers above sea level are described. Sections II
JULY 6,1937
20
,
Ile,!I
1,e
1
I
,
t
;1
'
24
*i
eI,
75° WEST
1
IvS
MERIDIAN
I
el
II
HOURS
lift
DIivl
12
71i,
6
JULY 9,1937
o
111 4
i b
V Rr CAL SCALE
.f
IN wars OF
I
ir
/0-4
I
ESu
Pg.
II 1
fIL
6If
II
I I
I
I
V
I
AAA Mille AnWeatliklikaillilfralhii r
VERTICAL
^ 01
4 ggggg
SCALE
111111gs
IN UN TS or 10-4
ii
ESU
HIIIIIIIII
0 6 /2
I
1101
I
VERTICAL SCALE IN VOLTS PER METER 00 200 300
Fig. 1-Electrograms, Huancayo Magnetic Observatory, "quiet" day during dry season.
summer and in winter." They find some evidencethat there is no seasonal variation of large amplitudeand that "a gradual increase of ionization at tropo-spheric levels from sunrise to a maximum some hoursafter noon, with a decrease toward sunset, afterwhich a steady night-time minimum, notably belowafternoon value, but frequently still of substantialamount, is suggested." They describe observationsmade at times of several thunderstorms as being"almost conclusive in establishing a connection be-tween local thunderstorms and the replenishment ofstratified electrification at the 15 to 20 km level,or, less probably, at half these heights."
There has been accumulating for many years alarge amount of direct evidence concerning the elec-trical state of the troposphere. A certain amount ofdirect evidence is also available concerning theelectrical state of the lower stratosphere. These di-rect measurements prove that the electrical con-ductivity at heights of the order of 10 kilometers issomething like nine orders of magnitude less than
and III refer to nonthundery and thundery days,respectively. In section IV the evidence accruingfrom observations made during balloon flightsthroughout the troposphere and-on the occasion ofthe flight of Explorer //-well into the stratosphere,is reviewed. In section V the enormous rate of supplyof energy required to maintain the low-level electri-fication postulated by Watson Watt and coworkersis compared with the rate of supply of energy fromthe sun and from thunderstorms.
II. MOUNTAIN OBSERVATIONS-NOLOCAL THUNDER
Direct evidence concerning the electrical state ofthe lower atmosphere consists chiefly of measure-ments of ion density or of electrical conductivity thathave been made in the course of investigations ofatmospheric electricity throughout most of the trop-osphere on a number of occasions. On one occasion(the flight of the stratosphere balloon Explorer II)conductivity was registered throughout a flight

1939 Gish and Booker: Troposphere and Stratosphere Ionizati&n 119
which reached an altitude of 22 kilometers, and whichtherefore extended more than 10 kilometers into thestratosphere. The more numerous measurements of
the electric field strength in the troposphere shouldalso bear, though less directly, on this matter.Registrations of cosmic radiation made in recentyears with sounding balloons that reach well into thestratosphere, a few exceeding the altitude reached byExplorer II, should show abundant evidence of anyradiation, either corpuscular or photonic, which canreach the levels of the reported intense low-levelionization, and at the same time maintain the enor-
storms and seem to be the result of silent dischargethat sets in when the field intensity is great and otherconditions suitable.
A few illustrations which typify the more directtypes of evidence may be of interest. At the Huan-cayo Magnetic Observatory of the Department ofTerrestrial Magnetism of the Carnegie Institution ofWashington continuous registration is made (a) of themagnetic components, (b) of electric currents in theearth, (c) of reflections from the ionosphere, (d) ofcosmic radiation, (e) of the electric field strength inthe atmosphere, and (f) of the electrical conductivity
- FROM OhMARCH /4 /937
20
RAINFALL IN /NCH
II" IA
0.42
11 11.1 11111111
75 WEST MERi/AN HOURS8
SEE NOTE
VERTICAL SCALE IN UNITS OF 104 ESU 6
VERT/CAL SCALE /N UNITS OF 0-4 ESU -
PI1.
T /AL OR ENT
116.
/2
002MARCH 41937
/6
T'
JII
Ir
VERTICAL SCALE //V VOLTS PER METER 9 . eclo . . 4 890
Fig. 2-Electrograms, Huancayo Magnetic Observatory, rainy day (Note: Clearing in morningafter 10:05; early afternoon, March 18, increasing cloudiness, distant rain, and thunderto southwest at 14:00).
mous density of ion population required for the re-flection in the troposphere or lower stratosphere ofradio waves at nearly vertical incidence. Further-more, measurements of the electric field and otherelements of atmospheric electricity made at the sur-face of the earth, especially in mountains or onelevated plateaus, may also be expected to show evi-dence of strata of abnormal ion density if such occurat levels as low as three or four kilometers abovesea level, because it is not likely that such ionizedstrata would be everywhere parallel to the earth'ssurface, but would meet it at places having appro-priate altitude. At such places there should be essen-tially no steady electric field.
A brief review of these several classes of evidencegives no basis for expecting that the density of theion population in the troposphere ever exceeds a fewthousand ion pairs per cubic centimeter, except inthe immediate vicinity of storms. These exceptionsarc comparatively rare at a given place even during
of the air. The situation of this observatory in theAndes mountains of Peru, 12 degrees south of theequator at an altitude of 11,000 feet (3.3 kilometers),is of particular interest in the present considerationbecause of the high elevation and also because of thefrequency at which thunderstorms occur there. Onaccount of the latter circumstance measures of thestate of ionization provided by the registrations of airconductivity and of the intensity of cosmic radiationshould assist in testing the validity of the suggestion'that it is the "runaway" electrons from thunder-storms which produce the supposed ionized layers inthe lower stratosphere and troposphere. The gramsfor field strength or potential gradient and for airconductivity at Huancayo for two complete clays arereproduced in Figs. 1 and 2. Those in Fig. 1 arerepresentative of a day in the dry season that is freefrom storm. The first part of Fig. 2 is typical of con-ditions during general rain ; the latter part illustratesthe effect of a moderately intense local thunder-

120 Proceedings of the I.R.E. February
storm. There are two grams for conductivity in eachfigure, one representing the part contributed bypositive ions, designated "positive conductivity," theother the part due to negative ions, designated"negative conductivity." The ordinates on thesegrams, measured from a line through the "hourlyzeros," are proportional to the conductivity whichmay be evaluated in electrostatic units by means ofthe horizontal scale inserted below each gram. Interms of ions, one division on the scale is equivalentto 338 ions per cubic centimeter in the case of posi-tive conductivity and 264 ions per cubic centimeterin the case of negative conductivity. The abscissason all the grams correspond to time in hours countedfrom midnight. The ordinates on the gram for po-tential gradient, also measured from the time of"hourly zeros," may be evaluated in volts per meterby using the scale inserted at the bottom. The valueof gradient is designated positive when the trace isabove the line of zeros and negative when below.During fair weather the gradient is generally posi-tive. With rare exceptions, negative values are regis-tered only during storm. When the gradient is posi-tive, according to this convention, positively chargedions move toward the earth, negative ions moveaway from it, and the surface charge of the earth isnegative.
The meteorological notes for the period from theevening of July 8 to the evening of July 9, 1937,(Fig. 1) show that this was a day without storm, al-most without cloud, although "hazy and smoky"at least during daylight hours. The gradient waspositive throughout the day except for a few minutesfollowing 14:50 (Greenwich Civil Time) on July 9.This negative gradient was doubtless produced bya "whirlwind" in the vicinity of the observatory.During the daylight hours the gradient was large andthe conductivity was small, whereas during the nightthe relation was reversed. The gradient during thenight hours averaged 21 volts per meter, or aboutone fifth the average for daytime. The average con-ductivity at night was about four times that for thedaylight period, or in terms of ions, the averagenumber of positive small ions per cubic centimeterduring the night was 2220 and during daytime 560.The maximum was 3790 ions per cubic centimeter at5:38 on the early morning of July 9.
Despite the contrast in conductivity between day-time and night, the electric -current density, directedfrom air to earth, was nearly constant during the 24hours, averaging 3.1 X10-'9 ampere per square centi-meter for night and 3.6 X10-'6 ampere per squarecentimeter for daytime. This current is of about thesame magnitude as the average of the numerous ob-
servations made at sea level during the cruises of theyacht Carnegie, whereas a value several times asgreat would be expected at a station that is overthree kilometers above sea level unless the con-ductivity, and hence the corresponding ionic density,at that place decrease from the surface upwards forsome distance. The extent of this decrease of con-ductivity with altitude must be sufficient to makethe effective resistance of a column of air, from thesurface up to the ionosphere or other highly conduct-ing region of world-wide extent, the same as a cor-responding column over a sea -level station. Thesedata therefore strongly indicate that on a typical day,during the dry season at Huancayo (like that repre-sented in Fig. 1), the maximum ionic density at thesurface (3.3 kilometers above sea level) is about thatwhich could be maintained by the cosmic radiationand the radiations from radioactive matter whichescape from the earth into the atmosphere, and thatthe ionic density above the surface does not increasein the first kilometer or so.
The small ions for which values of density havebeen given are doubtless aggregates of a compara-tively few air molecules. Other ions (large ions) canbe formed from polluting substances in the air, forexample, smoke. They have a mass more than a mil-lion times that of an air molecule, and therefore, can-not appreciably affect the conductivity or the di-electric constant of air. That such large ions arepresent at Huancayo in greater quantity than thesmall ions is indicated by indirect observations.Although these make no direct contribution ofimportance to the conductivity, yet, since they areformed at the expense of small ions, the number ofthe latter is thereby diminished, possibly in the ex-treme case, to one fourth" the value that would befound in the air had it been free from the pollutingsubstances. Although there are indications that thecases of extreme diminution of small ions; throughthe formation of large ions, are more likely to occurduring daytime than at night, yet if it is assumed thatin case the air were not polluted the ionic density atnight would be greater by a factor of four, then theaverage density of positive ions derived from therecord for the night hours, July 8 to 9, would be8880 ions per cubic centimeter and the maximumfor that night would be 15,400 ions per cubic centi-meter. These values would of course be greater thanvalues found at the same altitude over a sea -levelstation because some ions are certainly produced inthe first kilometer or two from the surface by radio-
' Based on results of an investigation by 0. W. Torreson ofthe relation between nuclei of condensation, air conductivity, etc.,at the Huancayo Magnetic Observatory, to be published in afuture number of the Jour. Terr. Mag. and Attnos. Eke.

1939 Gish and Booker: Troposphere and Stratosphere Ionization 121
active matter in the air, which would, however, benegligible at 3.3 kilometers from the surface.
The greatest ionic density which could possiblybe allowed according to this liberal estimate is ofthe order of 15,000 ions per cubic centimeter for therecords here exhibited. None of the other records,which are at hand for nearly every day of the last 13years, show maximum values that exceed this bymore than 10 or 20 per cent. The comparatively fewexceptions occur occasionally during storms. Thismay then be regarded as very close to the maximumallowable ionic density at an altitude of 3.3 kilo-meters above sea level on days free from storm. Suchionic densities are obviously entirely inadequate tomodify the dielectric constant to an extent sufficientto effect the reflection of radio waves at verticalincidence.
III. MOUNTAIN OBSERVATIONS-THUNDERSTORM CONDITIONS
The state of ionization at times of storm may beillustrated by the records for March 17 to 18, 1937,reproduced in Fig. 2. This day was near the end of
the wet season which lasts about seven months withlight rain nearly every day. There was light rainthroughout the night (19:00 March 17 to 8:00March 18) followed by gradual clearing until shortlyafter noon of March 18 when the conditions char-acteristic of the regular afternoon thunderstorm be-gan to develop. At 14:00 the sky was 0.7 cloudedwith 0.4 cumulo-nimbus and with rain and thunderin the distance. At 15:00 light rain accompanied bythunder began at the observatory lasting about onehour. As is seen from the trace, the potential gradientwas considerably disturbed from at least two hoursbefore the afternoon rain began until about one anda half hours after it ended. During this time and dur-ing the light rain of the night before the gradientfluctuated between negative and positive values. Thegradient was sometimes so great that the spot oflight passed off the photographic paper, and some-times it varied so rapidly that the spot of light left atrace too faint to be followed, especially in the repro-duction. The records of conductivity for this day donot show the conspicuous difference between nightand day that was noted in Fig. 1, the average night-time values being somewhat less and those for day-time being appreciably greater than those for thetypical day of the dry season. The very small valuesof either positive or negative conductivity whichare registered at intervals during a storm are notconsidered in this general comparison. They shallbe briefly discussed in a following paragraph.
It will be seen at a glance that there is no over-all
increase in the conductivity, and hence of the ionicdensity, during the time of this storm. This is typi-cal of the records for stormy days at this station. Itmay be added that this conclusion is borne out by aninspection of records similar to these that have beenobtained at the Carnegie Institution's WatherooMagnetic Observatory, near Watheroo, WesternAustralia, since 1922, and at the United States Coastand Geodetic Survey's Tucson Observatory, co-operating with the Carnegie Institution of Washing-ton, since 1929. The latter station, located nearTucson, Arizona, at an altitude of 770 meters, lies ina region where intense thunderstorms are frequent,a circumstance which attaches special value to theevidence provided by the records obtained there.
The records of air conductivity at the earth's sur-face therefore give no support for the view that((runaway" electrons from thunderstorms are a po-tent ionizing agent in the atmosphere. This is alsoborne out by the fact that in the registrations ofcosmic radiation at Huancayo there is no conspicuousincrease in the rate of ionization that is definitelyassociated with these storms. Such effects as mayoccur according to the conception of C. T. R. Wil-son,12.1a,14 if as small as indicated by the observationsof Schonland and Viljoen," do not concern us here.It seems now to be Wilson's view that fields capableof accelerating electrons to the "runaway stage" canexist only at the tip of a linear discharge about thelower part of a cloud. Since the paths of such dis-charges are not straight vertical lines but have azigzag character, some of the electrons would doubt-less be sprayed out laterally, and should approachthe earth not too far from the storm to be noted atthese places. Only a very small fraction of the numberrequired to maintain reflecting layers in the lowerstratosphere or troposphere, if approaching close tothe surface, would become conspicuous in the regis-trations of air conductivity. Such effects are not ob-served, unless certain sudden increases of ionic den-sity that occur rarely and last for brief intervals onlyare to be ascribed to that source.
Such an event is shown on the record for negativeconductivity (Fig. 2) shortly after 22:00, March 17.The trace passed off the sheet but returned againalmost instantaneously. The positive conductivitywas slightly decreased at the same time. The gradi-
12 C. T. R. Wilson, "The acceleration of fl -particles in strongelectric fields such as those of thunderclouds," I'roc. Carob. Phil.Soc., vol. 22, pp. 534-538; March 15, (1925).
11 C. T. R. Wilson, "Some thundercloud problems," Jour.Frank. Inst., vol. 208, pp. 1-12; July, (1929).
14 C. T. R. Wilson, "Meeting for discussion of the ionosphere,"Proc. Roy Soc., ser. A, vol. 141, pp. 697-722; September 1, (1933).
" B. F. J. Schonland and J. P. T. Viljoen, "On penetratingradiation from thunderclouds,' Proc. Roy Soc., ser. A, vol. 140,pp. 314-333; May 3, (1933).
120 Proceedings of the I.R.E. February
storm. There are two grams for conductivity in eachfigure, one representing the part contributed bypositive ions, designated "positive conductivity," theother the part due to negative ions, designated"negative conductivity." The ordinates on thesegrams, measured from a line through the "hourlyzeros," are proportional to the conductivity whichmay be evaluated in electrostatic units by means ofthe horizontal scale inserted below each gram. Interms of ions, one division on the scale is equivalentto 338 ions per cubic centimeter in the case of posi-tive conductivity and 264 ions per cubic centimeterin the case of negative conductivity. The abscissason all the grams correspond to time in hours countedfrom midnight. The ordinates on the gram for po-tential gradient, also measured from the time of"hourly zeros," may be evaluated in volts per meterby using the scale inserted at the bottom. The valueof gradient is designated positive when the trace isabove the line of zeros and negative when below.During fair weather the gradient is generally posi-tive. With rare exceptions, negative values are regis-tered only during storm. When the gradient is posi-tive, according to this convention, positively chargedions move toward the earth, negative ions moveaway from it, and the surface charge of the earth isnegative.
The meteorological notes for the period from theevening of July 8 to the evening of July 9, 1937,(Fig. 1) show that this was a day without storm, al-most without cloud, although "hazy and smoky"at least during daylight hours. The gradient waspositive throughout the day except for a few minutesfollowing 14:50 (Greenwich Civil Time) on July 9.This negative gradient was doubtless produced bya "whirlwind" in the vicinity of the observatory.During the daylight hours the gradient was large andthe conductivity was small, whereas during the nightthe relation was reversed. The gradient during thenight hours averaged 21 volts per meter, or aboutone fifth the average for daytime. The average con-ductivity at night was about four times that for thedaylight period, or in terms of ions, the averagenumber of positive small ions per cubic centimeterduring the night was 2220 and during daytime 560.The maximum was 3790 ions per cubic centimeter at5:38 on the early morning of July 9.
Despite the contrast in conductivity between day-time and night, the electric -current density, directedfrom air to earth, was nearly constant during the 24hours, averaging 3.1 X10-" ampere per square centi-meter for night and 3.6 X10⁻¹⁶ ampere per, squarecentimeter for daytime. This current is of about thesame magnitude as the average of the numerous ob-
servations made at sea level during the cruises of theyacht Carnegie, whereas a value several times asgreat would be expected at a station that is overthree kilometers above sea level unless the con-ductivity, and hence the corresponding ionic density,at that place decrease from the surface upwards forsome distance. The extent of this decrease of con-ductivity with altitude must be sufficient to makethe effective resistance of a column of air, from thesurface up to the ionosphere or other highly conduct-ing region of world-wide extent, the same as a cor-responding column over a sea -level station. Thesedata therefore strongly indicate that on a typical day,during the dry season at Huancayo (like that repre-sented in Fig. 1), the maximum ionic density at thesurface (3.3 kilometers above sea level) is about thatwhich could be maintained by the cosmic radiationand the radiations from radioactive matter whichescape from the earth into the atmosphere, and thatthe ionic density above the surface does not increasein the first kilometer or so.
The small ions for which values of density havebeen given are doubtless aggregates of a compara-tively few air molecules. Other ions (large ions) canbe formed from polluting substances in the air, forexample, smoke. They have a mass more than a mil-lion times that of an air molecule, and therefore, can-not appreciably affect the conductivity or the di-electric constant of air. That such large ions arepresent at Huancayo in greater quantity than thesmall ions is indicated by indirect observations.Although these make no direct contribution ofimportance to the conductivity, yet, since they areformed at the expense of small ions, the number ofthe latter is thereby diminished, possibly in the ex-treme case, to one fourth" the value that would befound in the air had it been free from the pollutingsubstances. Although there are indications that thecases of extreme diminution of small ions; throughthe formation of large ions, are more likely to occurduring daytime than at night, yet if it is assumed thatin case the air were not polluted the ionic density atnight would be greater by a factor of four, then theaverage density of positive ions derived from therecord for the night hours, July 8 to 9, would be8880 ions per cubic centimeter and the maximumfor that night would be 15,400 ions per cubic centi-meter. These values would of course be greater thanvalues found at the same altitude over a sea -levelstation because some ions are certainly produced inthe first kilometer or two from the surface by radio -
11 Based on results of an investigation by 0. W. Torreson ofthe relation between nuclei of condensation, air conductivity, etc.,at the Huancayo Magnetic Observatory, to be published in afuture number of the Jour. Terr. Mag. and Atrnos. Elec.

1939 Gish and Booker: Troposphere and Stratosphere Ionization 121
active matter in the air, which would, however, benegligible at 3.3 kilometers from the surface.
The greatest ionic density which could possiblybe allowed according to this liberal estimate is ofthe order of 15,000 ions per cubic centimeter for therecords here exhibited. None of the other records,which are at hand for nearly every day of the last 13years, show maximum values that exceed this bymore than 10 or 20 per cent. The comparatively fewexceptions occur occasionally during storms. Thismay then be regarded as very close to the maximumallowable ionic density at an altitude of 3.3 kilo-meters above sea level on days free from storm. Suchionic densities are obviously entirely inadequate tomodify the dielectric constant to an extent sufficientto effect the reflection of radio waves at verticalincidence.
III. MOUNTAIN OBSERVATIONS-THUNDERSTORM CONDITIONS
The state of ionization at times of storm may beillustrated by the records for March 17 to 18, 1937,reproduced in Fig. 2. This day was near the end ofthe wet season which lasts about seven months withlight rain nearly every day. There was light rainthroughout the night (19:00 March 17 to 8:00March 18) followed by gradual clearing until shortlyafter noon of March 18 when the conditions char-acteristic of the regular afternoon thunderstorm be-gan to develop. At 14:00 the sky was 0.7 cloudedwith 0.4 cumulo-nimbus and with rain and thunderin the distance. At 15:00 light rain accompanied bythunder began at the observatory lasting about onehour. As is seen from the trace, the potential gradientwas considerably disturbed from at least two hoursbefore the afternoon rain began until about one anda half hours after it ended. During this time and dur-ing the light rain of the night before the gradientfluctuated between negative and positive values. Thegradient was sometimes so great that the spot oflight passed off the photographic paper, and some-times it varied so rapidly that the spot of light left atrace too faint to be followed, especially in the repro-duction. The records of conductivity for this day donot show the conspicuous difference between nightand day that was noted in Fig. 1, the average night-time values being somewhat less and those for day-time being appreciably greater than those for thetypical day of the dry season. The very small valuesof either positive or negative conductivity whichare registered at intervals during a storm are notconsidered in this general comparison. They shallbe briefly discussed in a following paragraph.
It will be seen at a glance that there is no over-all
increase in the conductivity, and hence of the ionicdensity, during the time of this storm. This is typi-cal of the records for stormy days at this station. Itmay be added that this conclusion is borne out by aninspection of records similar to these that have beenobtained at the Carnegie Institution's WatherooMagnetic Observatory, near Watheroo, WesternAustralia, since 1922, and at the United States Coastand Geodetic Survey's Tucson Observatory, co-operating with the Carnegie Institution of Washing-ton, since 1929. The latter station, located nearTucson, Arizona, at an altitude of 770 meters, lies ina region where intense thunderstorms are frequent,a circumstance which attaches special value to theevidence provided by the records obtained there.
The records of air conductivity at the earth's sur-face therefore give no support for the view that((runaway" electrons from thunderstorms are a po-tent ionizing agent in the atmosphere. This is alsoborne out by the fact that in the registrations ofcosmic radiation at Huancayo there is no conspicuousincrease in the rate of ionization that is definitelyassociated with these storms. Such effects as mayoccur according to the conception of C. T. R. Wil-son,12,13,14 if as small as indicated by the observationsof Schonland and Viljoen,15 do not concern us here.It seems now to be Wilson's view that fields capableof accelerating electrons to the "runaway stage" canexist only at the tip of a linear discharge about thelower part of a cloud. Since the paths of such dis-charges are not straight vertical lines but have azigzag character, some of the electrons would doubt-less be sprayed out laterally, and should approachthe earth not too far from the storm to be noted atthese places. Only a very small fraction of the numberrequired to maintain reflecting layers in the lowerstratosphere or troposphere, if approaching close tothe surface, would become conspicuous in the regis-trations of air conductivity. Such effects are not ob-served, unless certain sudden increases of ionic den-sity that occur rarely and last for brief intervals onlyare to be ascribed to that source.
Such an event is shown on the record for negativeconductivity (Fig. 2) shortly after 22:00, March 17.The trace passed off the sheet but returned againalmost instantaneously. The positive conductivitywas slightly decreased at the same time. The gradi-
12 C. T. R. Wilson, "The acceleration of /3 -particles in strongelectric fields such as those of thunderclouds," Proc. Carob. Phil.Soc., vol. 22, pp. 534-538; March 15, (1925).
13 C. T. R. Wilson, "Some thundercloud problems," Jour.Frank. Inst., vol. 208, pp. 1-12; July, (1929).
" C. T. R. Wilson, "Meeting for discussion of the ionosphere,"Proc. Roy Soc., ser. A, vol. 141, pp. 697-722; September 1, (1933).
" B. F. J. Schonland and J. P. T. Viljoen, "On penetratingradiation from thunderclouds," Proc. Roy Soc., ser. A, vol. 140,pp. 314-333; May 3, (1933).

122 Proceedings of the I.R.E. February
ent, although it is not clearly shown, was large anddoubtless of negative sign during this interval. Onemay ascribe aspects like this, in conductivity, toionization by collision. Sometimes the records of bothpositive and negative conductivity show such anom-alous increases simultaneously. In the case shownhere, however, it is thought that the positive ionswere driven from the earth by the intense negativefield at such a rate that a large density of positiveions could not be maintained.
I
/000IONIC
I
2000-DENSITY
I
3000/N ION-PAIRS/CM3
I
4000x
0
o
.. / Z6... "...10 41
0 LU.-.1 6 -,
Q0 41
V70
0 4.1
00 03
0a
Q
tO0 0J4-I,0
0 0 ...I0 'T
0 -a LEGEND
oeo
0
00 a = GERD/EN; /904,1905
0 = SM/RNOW; /907(3 FLIGHTS)
2(/ FLIGHT)uV . n = W/GAND; /9/3 (4 FLIGHTS)
0 = W/GAND; /9/4, /9/9,/920 (4 FLIGHTS)
0 ° x = GISH-SHERMAN; /935(FLIGHT, EXPLORER .71) -
0
:,)ccei:; . I 1 I
Fig. 3-Ionic density in the troposphere from measurements ofair conductivity in 13 balloon flights.
That the field when sufficiently intense removesnearly all the ions of sign opposite to that of the fieldis abundantly illustrated in Fig. 2. Thus from 20:30until after 21:20 the positive conductivity was nearlyzero. Before the afternoon thunderstorm, from 14:20until after 15:10, the negative conductivity wasnearly zero and thereafter, during the storm, thepositive and negative conductivity alternate in thatrole. Bearing this "electrode effect" in mind, one mayregard the unusually large value of negative con-ductivity indicated a few minutes after 22:00 asquite likely due to ionization by collision. Althoughthe possibility of ionization by some other energeticagency on such occasions is not definitely excludedby the evidence now at hand, yet visible evidence ofionization by collision is provided by the luminousphenomenon known as St. Elmo's fire which isrepeatedly seen during electrical storms.
IV. 013SERVATIONS IN TROPOSPHEREAND STRATOSPHERE
Measurements of the ionic density in the tropo-sphere made with instruments carried aloft inmanned balloons constitute a considerable body ofevidence. The results of 15 such flights,16,17,18,10,20,21on which air conductivity was measured with a Ger-dien type of apparatus, are shown in Fig. 3 with thealtitude as the ordinate and the ionic density, de-rived from the measure of conductivity, as the ab-scissa. All observations prior to the flight of thestratosphere balloon Explorer II were made man-ually. The points corresponding to those data gener-ally represent the mean of several successiveobservations made within a limited range of alti-tude so that the scatter of the points has therebybeen somewhat reduced. The conductivity was regis-tered continuously during the flight of Explorer II.The average value of conductivity over approxi-mately uniform altitude intervals was evaluatedfrom the gram. The intervals were 500 feet in thetroposphere and parts of the stratosphere, althoughgenerally 1000 feet in case of the latter. The pointswhich represent the data in Fig. 3 were derived fromdata taken from a slightly smoothed graph for con-ductivity. A more detailed representation of theExplorer II data would show much less scatter thanis shown by other observations. In no case doesthe original gram indicate an ionic density differingin order of magnitude from the values shown inFig. 3.
Balloon flights are of course not usually made inbad weather. Very special conditions, especiallylow -velocity surface winds and a clear sky, wereselected for the flight of Explorer II. Some of theflights with smaller balloons were, however, madeduring periods of disturbed weather. All of Gerdien'sthree flights were made when the sky was heavilyclouded, rain at times falling from clouds below theballoon and with thunderheads in sight. Two ofWigand's eight flights occurred during "cyclonal"
16 H. Gerdien, "Luftelektrische Messungen bei 2 Ballonfahr-ten," Gottingen, Nach. Ges. Wiss., Heft 4, pp. 277-299; (1904).
17 H. Gerdien, "Messungen der Dichte des Vertikalen elek-trischen Leitungsstromes in der freien Atmosphare bei derBallonfahrt vom 30. VIII. 1905," Gottingen, Nach. Ges. Wiss.,Heft 5, pp. 1-12; (1905).
18 H. Gish and K. L. Sherman, "Electrical conductivity of airto an altitude of 22 kilometers," Nat. Geog. Soc., Contr. Tech.Papers, Stratosphere Ser., no. 2, pp. 94-116; (1936).
19 D. A. Smirnow, "Vertical electric currents in the atmos-phere during balloon flight of July 26, 1907," (Russian), Bull.Acad. Sci. (St. Petersburg), pp. 759-774; (1908).
20 A. Wigand, "Die elektrische Leitfahigkeit in der freienAtmosphare, nach Messungen bei Hochfahrten im Freiballon,"Ann. der Phys., vol. 66, pp. 81-109; November 22, (1921).
21 A. Wigand, "Messungen der Ionisation and Ionenbewe-glichkeit bei Luftfahrten," Phys. Zeit., vol. 22, pp. 36-46; Janu-ary 15, (1921).
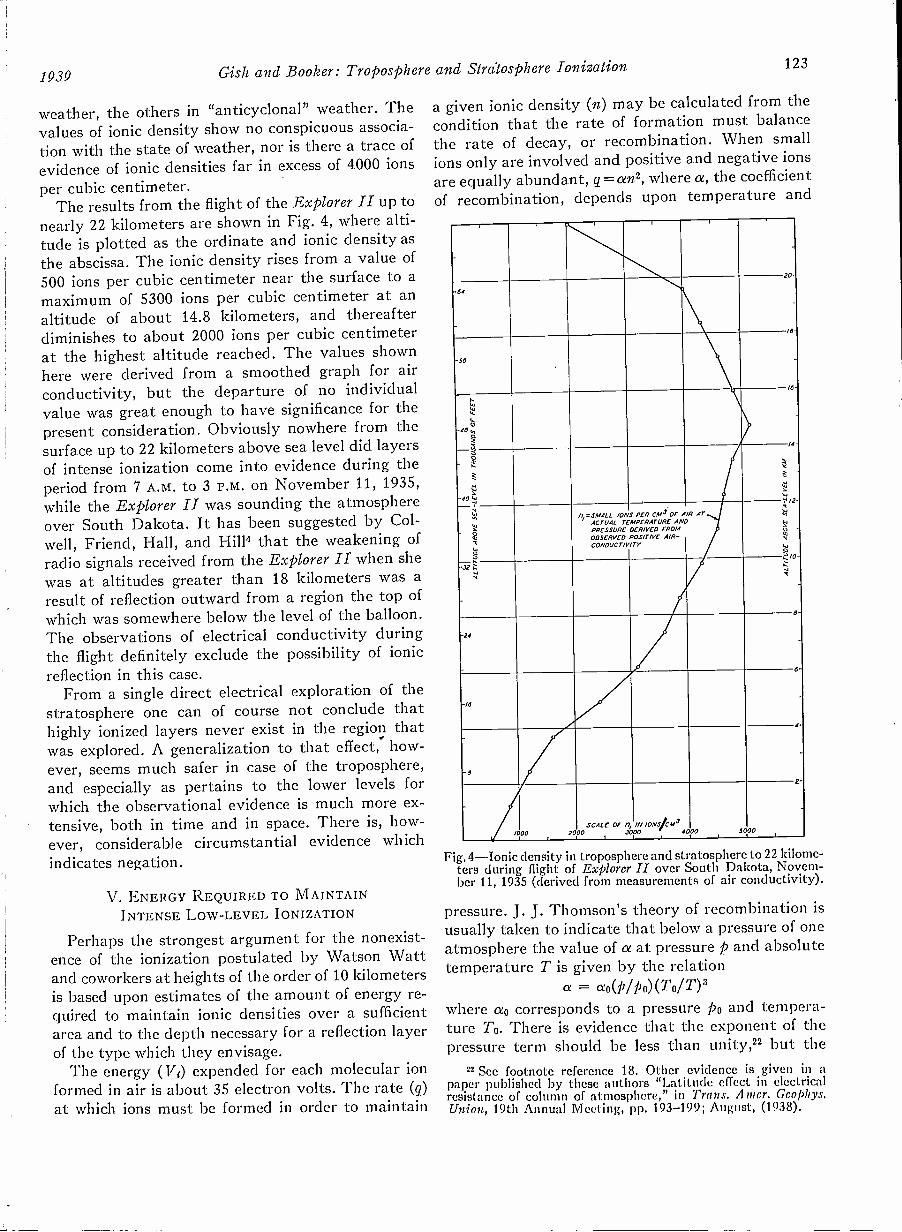
1939 Gish and Booker: Troposphere and Stratosphere Ionization 123
weather, the others in "anticyclonal" weather. Thevalues of ionic density show no conspicuous associa-tion with the state of weather, nor is there a trace ofevidence of ionic densities far in excess of 4000 ionsper cubic centimeter.
The results from the flight of the Explorer II up tonearly 22 kilometers are shown in Fig. 4, where alti-tude is plotted as the ordinate and ionic density asthe abscissa. The ionic density rises from a value of500 ions per cubic centimeter near the surface to amaximum of 5300 ions per cubic centimeter at analtitude of about 14.8 kilometers, and thereafterdiminishes to about 2000 ions per cubic centimeterat the highest altitude reached. The values shownhere were derived from a smoothed graph for airconductivity, but the departure of no individualvalue was great enough to have significance for thepresent consideration. Obviously nowhere from thesurface up to 22 kilometers above sea level did layersof intense ionization come into evidence during theperiod from 7 A.M. to 3 P.M. on November 11, 1935,while the Explorer II was sounding the atmosphereover South Dakota. It has been suggested by Col-well, Friend, Hall, and Hill' that the weakening ofradio signals received from the Explorer II when shewas at altitudes greater than 18 kilometers was aresult of reflection outward from a region the top ofwhich was somewhere below the level of the balloon.The observations of electrical conductivity duringthe flight definitely exclude the possibility of ionicreflection in this case.
From a single direct electrical exploration of thestratosphere one can of course not conclude thathighly ionized layers never exist in the region thatwas explored. A generalization to that effect, how-ever, seems much safer in case of the troposphere,and especially as pertains to the lower levels forwhich the observational evidence is much more ex-tensive, both in time and in space. There is, how-ever, considerable circumstantial evidence whichindicates negation.
V. ENERGY REQUIRED TO MAINTAININTENSE LOW-LEVEL IONIZATION
Perhaps the strongest argument for the nonexist-ence of the ionization postulated by Watson Wattand coworkers at heights of the order of 10 kilometersis based upon estimates of the amount of energy re-quired to maintain ionic densities over a sufficientarea and to the depth necessary for a reflection layerof the type which they envisage.
The energy ( Vi) expended for each molecular ionformed in air is about 35 electron volts. The rate (q)at which ions must be formed in order to maintain
a given ionic density (n) may be calculated from thecondition that the rate of formation must balancethe rate of decay, or recombination. When smallions only are involved and positive and negative ionsare equally abundant, g =ant, where a, the coefficientof recombination, depends upon temperature and
I I I I
20
-64
18
-56
/6
..1
1;
,-48
..._
E- t...
5-40tj.
/4
Z
...
,1
i;
po
ryr
n,..smALL IONSACTUAL TEMPERATUREPRESSUREOBSERVEDCONDUCT/
PER CA1 OF A/RAND
ocinveo FROMPOSITIVE AIR -ITY
AT
/2
'A'
L0712 I:
Zi
;-.
;44
8
-24
r
"16
6
-8
4
/000 2000SCALE OF fl
2000IN IONS/CM3
4000I
5000I
2
Fig. 4-Ionic density in troposphere and stratosphere to 22 kilome-ters during flight of Explorer II over South Dakota, Novem-ber 11, 1935 (derived from measurements of air conductivity).
pressure. J. J. Thomson's theory of recombination isusually taken to indicate that below a pressure of oneatmosphere the value of a at pressure p and absolutetemperature T is given by the relation
a = ao(p/ po)(To/T)3where ao corresponds to a pressure po and tempera-ture To. There is evidence that the exponent of thepressure term should be less than unity," but the
22 See footnote reference 18. Other evidence is given in apaper published by these authors "Latitude effect in electricalresistance of column of atmosphere," in Trans. A.mer. Geophys.Union, 19th Annual Meeting, pp. 193-199; August, (1938).

124 Proceedings of the LR.E. February
relation used here yields a conservative estimate.At p0= 760 millimeters, To =273 degrees Kelvin,ao 1.6 X10-0. For the stratosphere over middle lati-tudes in summer, T=220 degrees Kelvin. It followsthat the power P required to maintain an ionic den-sity n is Trig, in electron volts per cubic centimeter persecond, or P =1.59 Viq X10-'2 ergs per cubic centi-meter per second, or more explicitly
P = 1.59V iao(TolT)3(pl MO X 10-19
watts per cubic centimeter.
Near the base of the stratosphere, namely, at 11kilometers, p/p040.20. After introducing this andother numerical values
P = 3.4n2 X 10-24 watts per cubic centimeter.
For an ionic density, n =5 X10'2 ions per cubic centi-meter, indicated by Watson Watt, Wilkins, andBowen, P = 84 watts per cubic centimeter. This is,however, an exaggeration because the role played byfree electrons was not taken into account. Since thenumber of free electrons that are in equilibrium withions are a greater proportion when the ionization isintense, their role cannot be neglected even at thelow levels which are considered in this discussion. Amore precise consideration follows:
If electrons are set free and positive ions formed ata rate q per cubic centimeter per second; if electrons(N per cubic centimeter) attach to neutral molecules
per cubic centimeter) at a rate aoMN per cubiccentimeter per second and recombine with positiveions (n1 per cubic centimeter) at a rate al n1 N percubic centimeter per second, while the positive ionsalso disappear by combining with negative ions(n2 per cubic centimeter)-the negative ions beingformed only by the attachment of electrons to neu-tral molecules-then when the electronic and ionicdensities are steady, namely, when dN/dt=dni/dt=dn2/dt= 0, the relations between them are
for electrons: q = aoMN ainiN b (1)
for positive ions: q = angi2-1- ainiN c (2)
for negative ions: aoMN = anin2 d (3)
where b, c, and d are terms which represent the rateof removal or migration of electrons or ions from aunit volume. From such information as is availableabout al, the coefficient of recombination of elec-trons and positive ions, it seems that the term inwhich it appears may be neglected here because in themost unfavorable case28,24,25 (al =10-8 and ao =10-14)
23 E. V. Appleton, "Regularities and irregularities in the iono-sphere," Proc. Roy Soc., ser. A, vol. 162, pp. 451-479; October 15,(1937), estimates from the observed decay of electronic densityin the ionosphere that a1=10-$ in daytime and approximately
that term would amount to less than one per cent inthe lower stratosphere when ni is 10" ions per cubiccentimeter. No satisfactory estimates of the terms b,c, and d can be made although these are doubtlesstoo large to neglect. They are likely positive, that is,represent loss and not gain of ions and electrons fromthe region; hence the value of q which is estimated istoo small when, as is done here, these factors areneglected.
With these approximations, (1) and (2) give
N = (q/ aoM) (4)
nine = (q/ a) . (5)
For the conditions which are being consideredni+n2-42Vn1n2. Then from (5)
nl ± 712 = 2-V(q/a) (6)
From the approximate condition for reflection atvertical incidence
n1 + n2 (nidnie)/1/ = (int/47re2)(02 = D (7)
where me is the mass of an electron, mi is the mass ofan ion, co = 2irf for the frequency f, and D is equivalentionic density. Then from (4), (6), and (7)
\/(q/ a) = B k /(D/ B) 1 - 1] (8)
where B = (nze/mi) (aoM/a). For D 108 ions percubic centimeter, D/B>>1, (8) may be written
q = ao(nt ebni)MD (9)
The power required to maintain this state of ioniza-tion is
P = 1.59V; ao(nze/nti)AID
X 10-" watts per cubic centimeter (10)
= 6. 9a0Mf2 X 10-26 watts per cubic centimeter. (11)
The value of ao was derived from Bradbury's26 de-terminations of the probability of attachment (It) ofan electron to a neutral molecule in air. Bradburyfound that h is independent of pressure but is some-what dependent on electron energy. The values de-crease from 33 X10-6 at 0.1 volt, the lowest electronenergy used, to about 1 X10⁻⁶ in the range 1.2 to
equal to 2 X 10-i at night.24 C. Kenty, "The recombination of argon ions and electrons,"Phys. Rev., vol. 32, pp. 624-635; October, (1928), finds for 0.4 -volt electrons and positive ions in argon, al =2 X 10⁻¹⁰, which hesays may be in error by a factor of 5.25 N. E. Bradbury, "Ionization, negative -ion formation, andrecombination in the ionosphere," Terr. Mag., vol. 43, pp. 55-66;March, (1938), estimates that for electrons in thermal equilib-rium at 200 degrees Kelvin in oxygen, a1= 4X 10-60. The valuesof ao are discussed later.26 Bradbury, "Electron attachment and negative ion forma-tion in oxygen and oxygen mixtures," Phys. Rev., vol. 44, pp. 883-890; December 1, (1933).

1939 Gish and Booker: Troposphere and Stratosphere Ionization 125
1.6 volts, then increase to 5 X 10-41at 2 volts electron
energy after which a slight decrease is shown towardthe upper end of the energy range, which in the meas-urements extended to about 2.1 volts. This decreas-ing trend at the end, together with other considera-tions, indicates that for higher electron energies h isless than at two volts. The average number of col-lisions of an electron with molecules that occur beforeattachment takes place is 1/h and if v is the collisionalfrequency of electrons with molecules in air then thetime between collisions is 1/v, and the average timerequired for an electron to become attached, or theaverage life, is 1/hv. The average life of an electronmay also be seen from an examination of equation(1) to be 2/aoM. From these equivalent values of theaverage life, ao=21w1 M. Since h was found to beindependent of pressure while M and v doubtlessvary directly as the pressure, ao is thought to be inde-pendent of pressure, at least to a first approximation.Hence using the values for M and v for normal tem-perature and pressure, namely, 2.70 X10" per cubiccentimeter and 2.17 X10", respectively, the fol-lowing values of ao are calculated from values of htaken from the graph in Bradbury's paper.
Electron energy(volts)
0.1 0.2 0.4 0.6 0.8 1.2 1.6 2.0
Capture coefficientao in units of 10-"
53 32 14 7.2 4.0 1.6 1.6 8.0
Using the smallest value of ao, a critical frequency fof 12 megacycles, one finds that at an altitude of 11kilometers, where M= (1/5) 2.70 X10", the power
necessary to maintain the required ionization would
be 0.86 watt per cubic meter. This seems to be thelowest allowable estimate. Several known factors,which could not be taken into account, would haveincreased it. But even though this seems to be anunderestimate, the power required is startling, asmay be seen by a comparison with the rate at which
energy reaches the earth from the sun, which is 1340
watts per square meter of surface normal to the sun's
rays at the "top" of the atmosphere. If this energywere all used to ionize the atmosphere at an averagealtitude of 11 kilometers, the layer in which the re-quired ionic density is maintained would be at mostabout 1.5 kilometers thick for places where the sunis in the zenith.
The total electrical power of the thunderstorms ofthe earth has been estimated at about 2 X10° kilo-watts. If that aggregate power were suitably dis-tributed and used entirely for the formation of ionsat an average altitude of 11 kilometers, an ionizedlayer 25 meters thick for which the critical frequencyis 12 megacycles could be maintained over less thanone five thousandths of the earth's surface.
It seems then quite apparent from these examina-tions of more or less direct observations of electricalconductivity, as well as from consideration of theenergy requirement, that in seeking an understand-ing of the apparent return of radio waves from thetroposphere and lower stratosphere, variations in thephysical properties of the atmosphere other thanthat involving continuous intense ionization shouldreceive first attention.

Communication by Phase Modulation*MURRAY G. CROSBY', MEMBER, I.R.E.
Summary-Practical methods of generating and receivingphase modulation are described which open up the possibility of usingphase modulation as a communication system. A new receiver is de-scribed which uses an off -neutralized crystal filter and provides asimple practical receiver which has not been heretofore available forphase modulation. Other methods of reception are described and dis-cussed.
Propagation tests which were conducted between California andNew York indicate that the propagation characteristics of phasemodulation are substantially the same as those of amplitude modula-tion.
The noise characteristics of phase modulation are considered andit is shown that the signal -noise ratio at the output of the phase -modulation receiver is equal to the product of the phase deviation inradians and the carrier -noise ratio.
The chief advantage of phase modulation is realized at the trans-mitter where a power gain of about four -to -one is obtained andmodulating equipment is reduced by the ability to modulate at a lowlevel without the requirement of linearity in the stages following themodulator. The chief difficulty occurs at the receiver where the sus-ceptibility to micro phonics is increased and the circuits are slightlymore complicated.
INTRODUCTION
IDURING the course of the work on frequencymodulation which has been described in pre-vious publications,',2 development work on
phase modulation was also carried on by the engineersof R.C.A. Communications, Inc. The results of thefrequency -modulation propagation tests pointed theway to phase modulation as a means of eliminatingthe extreme distortion encountered when frequency
CARRIERSOURCE
(A) (B) (C)
OUTPUT
Fig. 1-Differential phase modulator.
modulation is transmitted over a multipath mediumsuch as the ionosphere. This could be done withoutlosing the advantages of frequency modulation withrespect to the ease of modulation and the ability touse class C amplification in all the transmitter stages.
* Decimal classification: R148 X R410. Original manuscriptreceived by the Institute, June 16, 1938. Presented before Thir-teenth Annual Convention, New York, N. Y., June 17, 1938.
t R.C.A. Communications, Inc., Riverhead, Long Island,New York.
1 Murray G. Crosby, "Frequency modulation propagationcharacteristics," PROC. I.R.E., vol. 24, pp. 898-913; June, (1936).
2 Murray G. Crosby, "Frequency modulation noise character-istics," PROC. I.R.E., vol. 25, pp. 472-514; April, (1937).
Accordingly, in the propagation tests the transmitterwas arranged to radiate phase modulation as well asfrequency and amplitude modulation so that allthree types could be compared. At the receiving endseveral different types of phase -modulation receiverswere developed and given a working test whichdemonstrated their relative advantages. The resultsof this work indicated that phase modulation pro-vides a new and important method of communica-tion with many advantages. In the following, theexperience received in that work is drawn upon todescribe the more practicable methods of generatingand receiving phase modulation with the object ofplacing the system upon a working basis as a meansof communication.
THE PHASE MODULATOR
When a wave is phase modulated, its instantaneousphase is deviated from the position it would havetaken if the modulation were not present. Such aphase shift may be introduced by passing the wavethrough a network which imparts a time delay to thewave so that the wave at the output of the networkhas a phase which is different from that at the input.The problem of generating phase modulation thusbecomes a problem of causing the modulating waveto impart time delay to the wave in accordance withthe modulating potentials. One method of doing thisis shown schematically in Fig. 1. Voltage from thecarrier source is fed directly to modulator tube 1.This voltage is represented by the vector El of vectordiagram (A) of Fig. 1. Phase -shifted, or time -delayed,voltage is fed to modulator 2 and is represented byvector E2. The resultant of these two voltages isformed in the common plate circuit of the two modu-lator tubes and is represented by Er. (The amplifica-tion effected in the modulator tubes is neglected inthe vector diagrams.) The modulator tubes are dif-ferentially modulated by energy fed to transformerT. Two instantaneous positions of differential modu-lation are shown in diagrams (B) and (C) of Fig. 1.It can be seen that the resultant voltage is deviatedin phase between limits which are determined bythe phase separation of the voltages fed to the twomodulator tubes.
In the phase modulator of Fig. 2, use is made of thefact that the phase of the output of a tuned amplifiervaries as the tuning is varied. Steady carrier energyis fed amplifier 1 which has tuned circuit TC in itsoutput. The tuning of TC is modulated by reactance
126 Proceedings of the I.R.E. February, 1939

Crosby: Communication by Phase Modulation 127
tube 2 which is given a 90-degree phase shift due tothe resistance -capacitance phase shifter, R,C. Thistype of reactance tube is the same type as is used in
automatic -frequency -control practice." In the par-ticular circuit of Fig. 2, the modulating potentialsare applied to the suppressor grid of the reactancetube.
A simple type of phase modulator, developed byH. E. Goldstine,5 takes advantage of the fact thatthe output of a crystal oscillator may be phase modu-lated by modulating one of the element voltages inthe same manner that the ordinary tuned -circuitoscillator may be frequency modulated by modu-lating one of the element voltages. Apparently eithertype of oscillator circuit has some degree of reactancetube effect inherent in it, but in the case of thecrystal oscillator the stability of the crystal preventsrapid frequency variations from taking place so thatonly phase deviations are effected.
The circuit of Fig. 3 shows a method of producingphase modulation in which a transmission line isemployed.6,7 By modulating the plate resistance of a
tube which acts as the terminating impedance of theline, at some point on the line, or for a given lengthof line, the combination of the incident wave of volt-age applied to the line and the variable amount of
reflected voltage produces a resultant which variesin phase. This can be seen from the vector diagrams
CARRIERSOURCE
FREQUENCYMULTIPLIERS,
LIMITERS,
POWERAMPLIFIER
MODULATIONINPUT
Fig. 2-Phase modulation by modulating a tuned circuitwith a reactance tube.
of Fig. 3(A) and (B) which show the vector relationsbetween the incident and reflected waves of voltage
3 D. E. Foster and S. W. Seeley, "Automatic tuning, simplifiedcircuits, and design practice," PROC. I.R.E., vol. 25, pp. 289-313;March, (1937).
Other types of reactance tubes in this use are described inU.S. Patents No. 2,033,231, No. 2,087,428, and No. 2,012,710.
° U.S. Patent No. 2,111,587.° U.S. Patent No. 2,085,418 also discloses how amplitude
modulation may be produced by the same method.7 A somewhat similar phase -modulating system, employing a
transmission -line section to modulate the tuned amplifier, isdescribed by Austin Eastman, "Fundamentals of VacuumTubes," McGraw-Hill Book Company, (1937), page 362.
for the point on the line at which these two voltagesare 90 degrees out of phase. The incident wave Eicombines with the reflected wave Er to form the re-sultant E when the terminating impedance of theline is such as to allow practically full reflection.When the terminating impedance is modulated to avalue which reduces the reflected wave to the valuegiven by Er' in Fig. 3(B), the resultant voltage takes
CARRIERSOURCE
MODULATIONINPUT
(A)
Fig. 3-Phase modulation by modulating the terminatingimpedance of a transmission line.
the new position E' which is shifted in phase by theamount (1).
A frequency -modulated oscillator may be ar-ranged to produce phase modulation by the applica-tion of a network in the modulating -potential circuitwhich passes these potentials with an amplitudeproportional to their frequency.8,' This system hasthe advantage that a high degree of phase modula-tion is obtainable. It was successfully used in thephase -modulation propagation tests during the year1931, but has the disadvantage that it lacks thestability of the master -oscillator systems which areused with the other methods.VI With any of the above phase modulators, the mostconvenient arrangement is that in which a low degreeof modulation is produced at the modulator andhigher degrees are obtained by the use of frequencymultiplication. Nonlinear distortion and concomi-tant amplitude modulation are reduced in this way.Concomitant amplitude modulation may be furtherreduced by the use of limiting in the stages followingthe modulators. The degree of modulation may alsobe increased by the use of cascade modulationn inwhich the radio -frequency output of one modulatoris fed to the radio -frequency input of another whichadds its phase deviation to that of the first.
B See U.S. Patent No. 2,085,793.° Flans Roder has also described this system in a discussion in
Pitoc. I.R.E., vol. 20, p. 887; May, (1932),1° U.S. Patent No. 2,104,318.
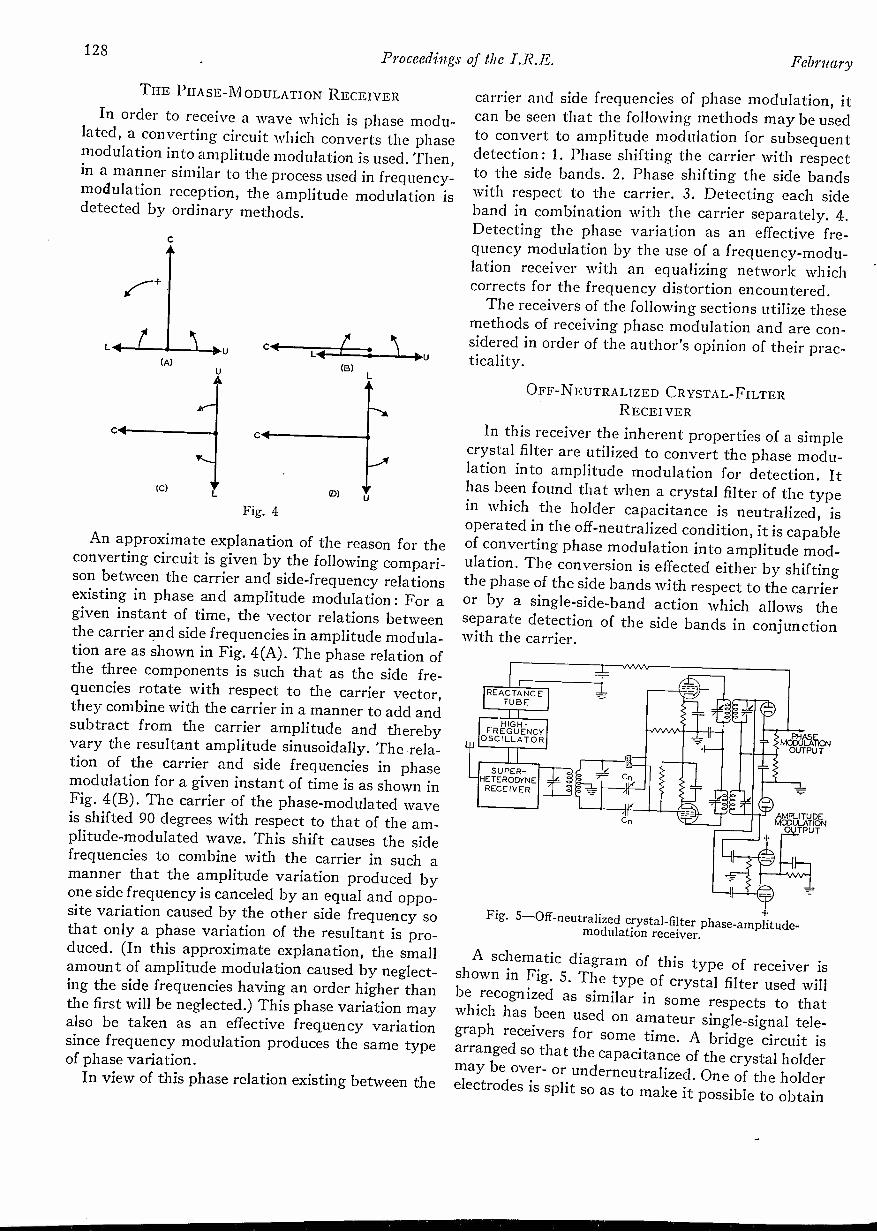
128 Proceedings of the I.R.E. February
TIIE PIIASE-M ODULATION RECEIVER
In order to receive a wave which is phase modu-lated, a converting circuit which converts the phasemodulation into amplitude modulation is used. Then,in a manner similar to the process used in frequency-modulation reception, the amplitude modulation isdetected by ordinary methods.
(A)
(C)
Fig. 4
(B)Ob.0
An approximate explanation of the reason for theconverting circuit is given by the following compari-son between the carrier and side -frequency relationsexisting in phase and amplitude modulation : For agiven instant of time, the vector relations betweenthe carrier and side frequencies in amplitude modula-tion are as shown in Fig. 4(A). The phase relation ofthe three components is such that as the side fre-quencies rotate with respect to the carrier vector,they combine with the carrier in a manner to add andsubtract from the carrier amplitude and therebyvary the resultant amplitude sinusoidally. The rela-tion of the carrier and side frequencies in phasemodulation for a given instant of time is as shown inFig. 4(B). The carrier of the phase-modulated waveis shifted 90 degrees with respect to that of the am-plitude -modulated wave. This shift causes the sidefrequencies to combine with the carrier in such amanner that the amplitude variation produced byone side frequency is canceled by an equal and oppo-site variation caused by the other side frequency sothat only a phase variation of the resultant is pro-duced. (In this approximate explanation, the smallamount of amplitude modulation caused by neglect-ing the side frequencies having an order higher thanthe first will be neglected.) This phase variation mayalso be taken as an effective frequency variationsince frequency modulation produces the same typeof phase variation.
In view of this phase relation existing between the
carrier and side frequencies of phase modulation, itcan be seen that the following methods may be usedto convert to amplitude modulation for subsequentdetection: 1. Phase shifting the carrier with respectto the side bands. 2. Phase shifting the side bandswith respect to the carrier. 3. Detecting each sideband in combination with the carrier separately. 4.Detecting the phase variation as an effective fre-quency modulation by the use of a frequency -modu-lation receiver with an equalizing network whichcorrects for the frequency distortion encountered.
The receivers of the following sections utilize thesemethods of receiving phase modulation and are con-sidered in order of the author's opinion of their prac-ticality.
OFF-NEUTRALIZED CRYSTAL-FILTERRECEIVER
In this receiver the inherent properties of a simplecrystal filter are utilized to convert the phase modu-lation into amplitude modulation for detection. Ithas been found that when a crystal filter of the typein which the holder capacitance is neutralized, isoperated in the off -neutralized condition, it is capableof converting phase modulation into amplitude mod-ulation. The conversion is effected either by shiftingthe phase of the side bands with respect to the carrieror by a single -side -band action which allows theseparate detection of the side bands in conjunctionwith the carrier.
AMPLITUDEMODULATION
0 TPUT
Fig. 5-Off-neutralized crystal -filter phase-amplitude -modulation receiver.
A schematic diagram of this type of receiver isshown in Fig. 5. The type of crystal filter used willbe recognized as similar in some respects to thatwhich has been used on amateur single -signal tele-graph receivers for some time. A bridge circuit isarranged so that the capacitance of the crystal holdermay be over- or underneutralized. One of the holderelectrodes is split so as to make it possible to obtain

1939 Crosby: Communication by Phase Modulation 129
both the over- and underneutralized outputs fromthe same crystal. It has been found that there isnegligible reaction between the two neutralizing cir-cuits with this arrangement and the two outputs areobtained substantially independent of each other.
The two crystal -filter outputs feed diode drivertubes which feed a differential detecting system forthe detection of phase modulation and for obtainingautomatic -frequency -control voltage. A pair of
parallel -connected infinite -impedance diode detectorsare also fed by the diode driver tubes for the purposeof detecting amplitude modulation.
The manner in which the off -neutralized crystalfilter converts phase modulation into amplitude mod-ulation may be explained as follows: Fig. 6 shows thesimplified circuit of one of the filters. When theneutralizing condenser C is made equal to thecapacitance of the crystal holder Ch the circuit actsas though Ch were removed. A simple resonancecurve is then obtained for the input-output charac-teristic. When the neutralizing condenser is made lessthan the holder capacitance, the circuit is said to beunderneutralized and acts as though Ch is onlyslightly reduced. The reactance characteristic of thecrystal for this underneutralized condition (assumingzero crystal resistance) is as shown in Fig. 7(A). Sincethe input voltage is fed to the crystal and R1 inseries, the output across R1 (assuming a constantinput voltage) will be dependent on the impedanceof the crystal and will have a characteristic as shownin Fig. 7(B). Whenr7a carrier and side bands arepassed through this type of filter, with the carriertuned to the peak frequency Fe, a major portion of
INPUT
Fig. 6-Equivalent circuit of the neutralized crystal filter. L, C,and R=equivalent constants of the crystal; Ch=holder ca-pacitance; Ch=neutralizing condenser.
the side bands appear in the fiat portions of the char-acteristic on both sides of the carrier frequency andthe rejection frequency F1. Since the reactance whichfeeds R1 is capacitive for these flat portions of thecharacteristic, the corresponding side bands will beshifted practically 90 degrees in phase while thecarrier will be unshifted. Such a shift in phase rela-tions converts the phase -modulated wave repre-sented by Fig. 4(B) to the relation portrayed byFig. 4(C) so that the relations are proper to produce
amplitude modulation. The side frequencies in thevicinity of the rejection frequency are substantiallyeliminated so that for these lower-modulation fre-quencies the phase modulation is converted to am-plitude modulation by the removal of one side band.The side frequencies in the immediate vicinity of thecarrier frequency are exalted with the carrier so that
cc
0
-FREQUENCY
Fey
(A
(B)
FREQUENCY
0 (D)
-N. FREQUENCY
Fig. 7-Reactance and input-output characteristics of off -neu-tralized crystal filters. (A) and (B)=underneutralized; (C)and (D) =overneutralized.
an increased output might be expected from thesemodulation frequencies. However, this exaltation iscompensated for by the phase shift being smaller inthis region and the efficiency of conversion fromphase to amplitude modulation being consequentlyless. Thus, in spite of this combination of single -side -band reception for some modulation frequencies andphase shifting of the side bands for the other modula-tion frequencies, a flat over-all output may be ob-tained without equalization. Although it is notindicated on the vector diagrams, a carrier exaltationis also effected by the filter. The degree of this carrierexaltation may be controlled by choice of R1 (Fig. 6)and choice of Q of the crystal.
When the neutralizing condenser is made largerthan the holder capacitance, the filter is said to beoverneutralized and the reactance characteristic ofthe crystal is changed as though the capacitance ofthe holder were replaced by an inductance. The re-actance characteristic is then as shown in Fig. 7(C)and the corresponding filter input-output charac-teristic is shown in Fig. 7(D). It is seen that thereactance which feeds R1 is inductive for the rangeof frequencies below the rejection frequency andabove the carrier frequency. Thus the side bands areshifted 90 degrees with respect to the carrier, but ina direction opposite to that effected by the under -neutralized filter. This converts the carrier and sidefrequencies of Fig. 4(B) to the relation shown in

130 Proceedings of the I.R.E. February
Fig. 4(1)). Comparing Figs. 4(C) and (D), it can beseen that the amplitude envelope is approaching amaximum point in the case of the underneutralizedfilter of Fig. 4(C) and a minimum point in the caseof the overneutralized filter of Fig. 4(D). Hence the
111III . ill1,4111 islem 1091111111611111111111bothoplm.ilkiillkiwi
Di,mop..,... .,.. ,.. .,
...........r"......."him - ill
Fig. 8-Typical input-output characteristics of slightly off -neu-tralized crystal filters. Input held constant.
amplitude envelopes are 180 degrees out of phaseand the detected outputs must be combined with a180 -degree phase reversal between them so as tomake the outputs additive. This combination cancelsamplitude modulation present on the incoming sig-nal. In the circuit of Fig. 5, the phase reversal iseffected by grounding the cathode of one of the diodesand making the other cathode the high potentialpoint.
In the above explanation it was assumed that ahigh degree of off -neutralization was used. That is,the neutralizing condenser was adjusted well beyondthe point of equality with the holder capacitance.When this is done, the rejection frequency occursclose to the carrier frequency and practically equaloutputs are obtained from the upper and lower sidebands which are disposed above the range betweenthe carrier frequency and the rejection frequency. Asthe neutralizing condenser is adjusted closer toequality with the holder capacitance, the rejectionfrequency moves out away from the carrier frequencyand the side band on the side of the rejection fre-quency is reduced with respect to the opposite sideband. This is shown in Fig. 8 in which typical under -and overneutralized filter characteristics are shown
for the case of a low degree of neutralization. Thefilters thus effect a single -side -band action as well asa carrier -exalting effect. As a consequence the recep-tion of amplitude modulation is possible on the samereceiver by combining the detector outputs in phase.This is done by means of the second pair of detectorsof the infinite -impedance type in the circuit of Fig. 5.It has been found that this type of reception of am-plitude modulation requires equalization to reducethe overaccentuated low -modulation frequencies.However, a simple equalizer such as a series con-denser and a shunt resistance serves the purpose verywell.
Adjusting for a low degree of off -neutralization isby far the preferred method of reception since itmakes possible the reception of amplitude modula-tion as well as phase modulation and also allows thedetection of a single side band in conjunction withthe carrier of either type of modulation. The latterpossibility sometimes aids in the reduction of inter-ference.
Automatic -frequency -control energy may be takenfrom the combined detector output due to the fre-quency discrimination effected by the fact that the
1H1MIIIMMMINIMMIIUINE111110111MI.11111M11111MINUMNIMIMIIIMEIMMIIMMIEVAIIIIMMIMMMII
MM111.1E1MM11IIIIEMEMmunuonwarammB
mgraCg
IIMMM1M1NEMIII11IIMM11Immtmousismmumun
somiummusitsommurisso
111111WIIIMIMM11111
mmumiimoommunmmiriummuu
onmNum-
imuiimig
mmussnmommiummumsommumumniimmummumnsimmumunummiammanummm
Imicams11 7 opm L rigiba........muRT-i- mi. Elm imi imemilwo.......in#_ .11, ............no E. 111111111111111E11111 MEE sr 11111101111MINMINIM
i I MI= 111011111111MEMEN-I -I- 71 NomminumNM
IIIIIIMIIIIIIMIIIINM Tim,
ElIPMENIIIIMEINUMII1
11111111111111111M
Fig. 9-Typical frequency -discrimination characteristic of off -neutralized crystal filters with diode driver tubes included.
two filter characteristics have their rejection pointson opposite sides of the carrier. Hence, as the fre-quency is varied away from the carrier frequency,the input to one detector decreases at a faster ratethan the input to the other. This produces a fre-quency -discrimination characteristic as shown inFig. 9. Because of the high selectivity of the crystalfilters, automatic frequency control is practically anecessity on this type of receiver.
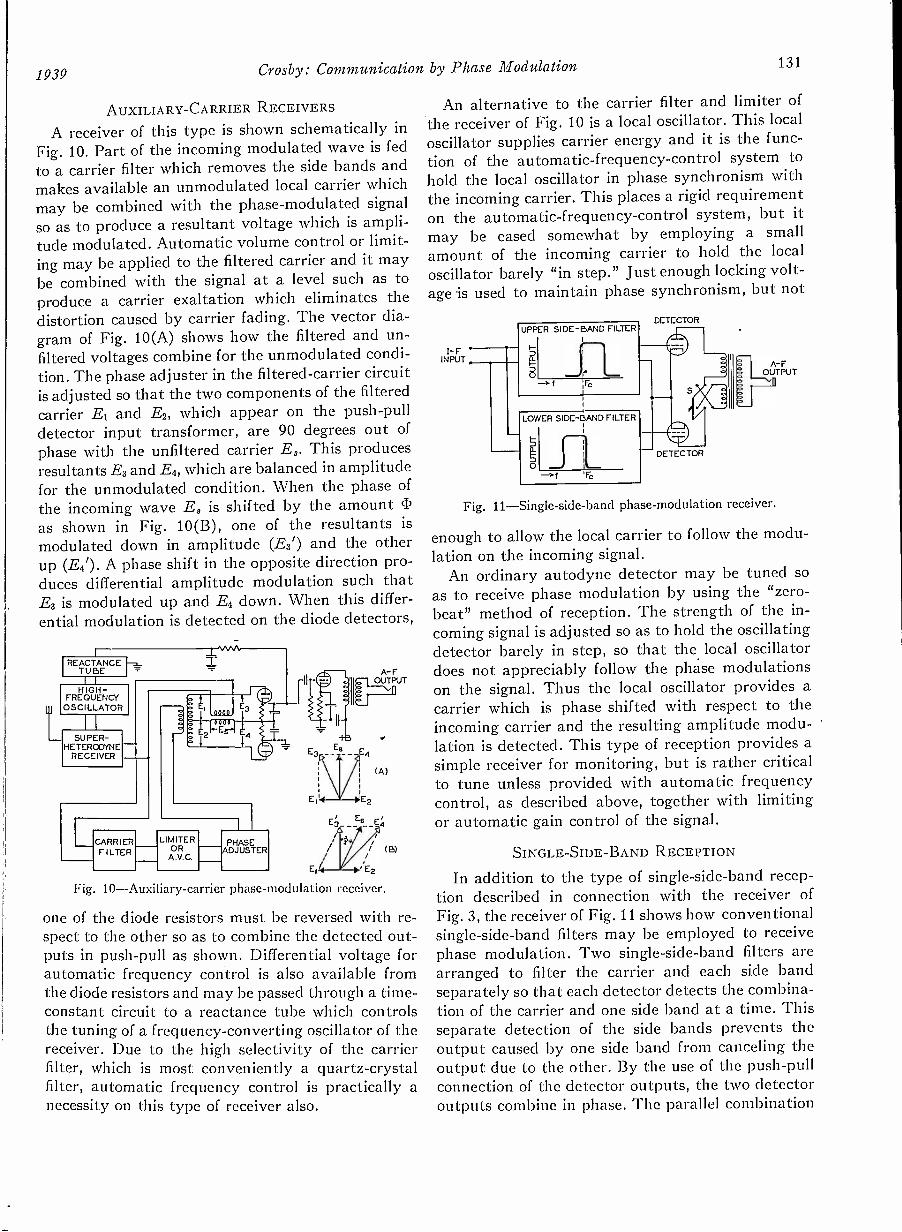
1939 Crosby: Communication by Phase Modulation 131
AUXILIARY -CARRIER RECEIVERS
A receiver of this type is shown schematically inFig. 10. Part of the incoming modulated wave is fedto a carrier filter which removes the side bands andmakes available an unmodulated local carrier whichmay be combined with the phase -modulated signalso as to produce a resultant voltage which is ampli-tude modulated. Automatic volume control or limit-ing may be applied to the filtered carrier and it maybe combined with the signal at a level such as toproduce a carrier exaltation which eliminates thedistortion caused by carrier fading. The vector dia-gram of Fig. 10(A) shows how the filtered and un-filtered voltages combine for the unmodulated condi-tion. The phase adjuster in the filtered-carrier circuitis adjusted so that the two components of the filteredcarrier E1 and E2, which appear on the push-pulldetector input transformer, are 90 degrees out of
phase with the unfiltered carrier E8. This producesresultants E3 and Eg, which are balanced in amplitudefor the unmodulated condition. When the phase ofthe incoming wave ED is shifted by the amount (1)
as shown in Fig. 10(B), one of the resultants ismodulated down in amplitude (E3') and the otherup (E41). A phase shift in the opposite direction pro-duces differential amplitude modulation such thatB3 is modulated up and Eg down. When this differ-ential modulation is detected on the diode detectors,
REACTANCETUBE
H IGH -FREOUENC(
OSCILLATOR
SUPER-HETERODYNE
RECEIVER
CARRIERFILTER
LIMITERORA C.
1
PHASEADJUSTER
A- FOUTPUT
E, lE2
Fig. 10-Auxi iary-carrier phase -modulation receiver.
one of the diode resistors must be reversed with re-spect to the other so as to combine the detected out-puts in push-pull as shown. Differential voltage forautomatic frequency control is also available fromthe diode resistors and may be passed through a time -
constant circuit to a reactance tube which controlsthe tuning of a frequency -converting oscillator of thereceiver. Due to the high selectivity of the carrierfilter, which is most conveniently a quartz -crystalfilter, automatic frequency control is practically anecessity on this type of receiver also.
An alternative to the carrier filter and limiter ofthe receiver of Fig. 10 is a local oscillator. This localoscillator supplies carrier energy and it is the func-tion of the automatic -frequency -control system tohold the local oscillator in phase synchronism withthe incoming carrier. This places a rigid requirementon the automatic-frequency -control system, but itmay be eased somewhat by employing a smallamount of the incoming carrier to hold the localoscillator barely "in step." Just enough locking volt-age is used to maintain phase synchronism, but not
1- FINPUT
OUTPUT
Fig. 11-Single-side-band phase -modulation receiver.
enough to allow the local carrier to follow the modu-lation on the incoming signal.
An ordinary autodyne detector may be tuned soas to receive phase modulation by using the "zero -beat" method of reception. The strength of the in-coming signal is adjusted so as to hold the oscillatingdetector barely in step, so that the local oscillatordoes not appreciably follow the phase modulationson the signal. Thus the local oscillator provides acarrier which is phase shifted with respect to theincoming carrier and the resulting amplitude modu-lation is detected. This type of reception provides asimple receiver for monitoring, but is rather criticalto tune unless provided with automatic frequencycontrol, as described above, together with limitingor automatic gain control of the signal.
SINGLE -SIDE -BAND RECEPTION
In addition to the type of single -side -band recep-tion described in connection with the receiver ofFig. 3, the receiver of Fig. 11 shows how conventionalsingle -side -band filters may be employed to receivephase modulation. Two single -side -band filters arearranged to filter the carrier and each side bandseparately so that each detector detects the combina-tion of the carrier and one side band at a time. Thisseparate detection of the side bands prevents theoutput caused by one side band from canceling theoutput due to the other. By the use of the push-pullconnection of the detector outputs, the two detectoroutputs combine in phase. The parallel combination

132 Proceedings of the I.R.E. February
of the detected outputs, obtained by throwing switchS, allows the reception of amplitude modulation.
EQUALIZED FREQUENCY -MODULATIONRECEPTION
The arrangement of Fig. 12 shows how a frequency -modulation receiver may be used for the receptionof phase modulation. When phase modulation isreceived on a frequency -modulation receiver, the
LiFREQUENCYMODULATION
R EC E IVER
0
EQUALIZER
PHASEMODULATION
OUTPUT
AUDIO FREQUENCY
(A)
Fig. 12-Frequency-modulation receiver equalized forphase -modulation reception.
inherent difference between frequency and phasemodulation makes the audio -frequency output di-rectly proportional to the audio frequency as shown
solid line of Fig. 12(A). By passingoutput through an equalizing network which passesthe audio frequencies inversely proportional to theirfrequency as shown by the dotted line of Fig. 12(A),the response is equalized so that the over-all outputis flat for phase -modulation reception.
PROPAGATION CHARACTERISTICS OF PHASEMODULATION
The general conclusion of the California-to -NewYork propagation tests was that the propagationcharacteristics of phase modulationwere substantiallythe same as those of amplitude modulation. If therewas any difference between the two systems, it wastoo small to be detected by the program and toneobservations which were applied to phase modula-tion in the same manner that they were applied tofrequency modulation.' This would be expected sincethe side -band characteristics of phase modulation arenot radically different from those of amplitude modu-lation.
Receivers of the off -neutralized crystal -filter andauxiliary -carrier type, as well as the corrected fre-quency modulation and single -side -band type, wereused in the propagation tests. Aside from the powergain resulting in improved signal strengths, the mostpredominant improvement was that caused by the
carrier exaltation effected by the phase -modulationreceivers. When a carrier -exalting amplitude -modula-tion receiver was set up for comparison, the onlydifference that could be noticed between the twotypes of modulation was the difference in signalstrengths.
It was found that the equalized -frequency -modula-tion type of phase modulation receiver is subject torather extreme fading distortion when selective fad-ing is encountered. The distortion took place duringthe fading minimums at which time a heavily over -modulated signal seemed to result. When this over -modulated signal was detected on the frequencymodulation receiver and passed through the equaliz-ing network which accentuated the lower modulationfrequencies, the result was a rough, crunching noisebearing little relation to the applied modulation andhaving a level far above that of the applied modula-tion. Removal of the frequency -modulation limitereffected no improvement.
A receiver of the single -side -band type (Fig. 11)was set up using a single filter so that only one sideband and the carrier could be received at a time.Filtered carrier was also provided so that carrier -exalted single -side -band reception was also possible.It was found that unless carrier -exalted receptionwas used, distortion due to the intermodulation be-tween modulation frequencies was rather high. Itwas also found that this single -side -band receptionwas more susceptible to fading than the double -side -band systems. Since carrier exaltation was providedon both systems, the difference could only be attrib-uted to a frequency diversity in which the probabil-ity of transmitting the signal by two side bands wasgreater than that in which only a single side bandwas used. This latter effect was noted on both theamplitude- and phase -modulation transmissions.
PHASE -MODULATION POWER GAINThe carrier power gain effected by phase modula-
tion over amplitude modulation for the unmodulatedcondition is the same as that for frequency modula-tion which is said to be four -to -one. This gain is due tothe fact that the phase-modulation transmitter maybe run continuously at its peak power output andupward modulation does not have to be provided for.When practicable systems are considered, it is foundthat the power gain ranges from approximately six-to -one for the most inefficient low-level amplitudemodulation systems to about three -to -one for thehigh-level systems in which the modulating power isabout equal to the radio -frequency input power.Thus the theoretical figure of four -to-one may betaken as an average value.

1939 Crosby: Communication by Phase Modulation 133
When the power gain is considered for the modu-lated condition, the magnitude of the signal -phasedeviation and the signal -noise ratio must be con-sidered. Since the receiver linearly converts phasedeviations of the carrier into output voltages, thesignal -noise ratio may be found by determining theratio between the phase deviation of the signal andthat of the noise. The effective phase deviation pro-duced by the noise may be deduced by determiningthe manner in which the carrier and noise voltagescombine to form a resultant, which will be bothphase and amplitude modulated. This has been donein the previously published paper on frequency mod-ulation2 in which equation (5) of that paper gives theresultant of the frequency -modulated wave and thenoise voltage. This equation may be changed to in-clude the phase modulation case by merely substi-tuting the phase deviation J) for the modulationindex Fd/F,. The equation may also be changed toconsider a single sinusoidal component of the noiseresultant instead of the complete resultant of thespectrum," so that the following equation results:
e= K sin [cot+ ci) cos pc
sin (wflat+ 4) cos pt)(1)
tan-'C/n+cos (I) cos pt)
in which K represents the amplitude envelope of thewave, w = 27r X carrier frequency, (J) = phase deviation
,...
- - --r- - -
4
0 112
4..te- .
I
220g -erT45:ul0
.'IN=S N41-
-- -
--' --L
- r/
L
0671 IE
1
7 f
OWNT1D. rYc
10
VI
Lan-05
a).
_
--
_
_
02,/ K 1 0
CI5E
I
Fig. 13-Relation between the effective phase deviation producedby the noise and the noise -carrier ratio.
of the signal, Con.: ---angular velocity of the beat notebetween the carrier and the noise frequency, p 27rX
" See page 479 of footnote 2 for description.
modulation frequency, C = peak amplitude of thecarrier, and n =peak amplitude of the noise com-ponent.
The final term in the phase angle of (1) describesthe phase deviation produced by the noise. The con-dition under which maximum phase deviation occursmay be found by equating the first derivative of thatterm to zero. When this is done for the unmodulatedcase (4)= zero), it is found that the peak phase devia-
-IPe
n
- z--o
s
-04
'2Fic
a59 a Qo
- - - IL , "DEGREES)4
0,4
0017
6
Fig. 14-Wave form of the phase deviationproduced by the noise.
tion occurs when the phase angle between the noiseand carrier voltages is equal to cos -4( -n/C). Sub-stituting this value of the phase angle in the originalequation, the peak phase deviation due to the noiseis found to be
(I)(peak) = tan-' 1/\/(C/n)2 - 1 = sin -1 n/C. (2)
When (2) is plotted for various carrier -noise ratios,the curve of Fig. 13 is obtained. It is seen thatfor the low noise -carrier ratios, the peak phase devi-ation of the noise, in radians is practically equal tothe noise -carrier ratio. The curve gradually departsfrom this equality as the noise -carrier ratio ap-proaches unity, where a peak phase deviation of1.57 radians (90 degrees) is obtained. This departurefrom equality occurs mostly in the vicinity of a noise -carrier ratio of unity (at a carrier -noise ratio of onedecibel, the departure is less than two decibels). Con-sequently, for most practical purposes, it may beassumed that the maximum value of the radians ofphase deviation produced by the noise is about equalto the peak noise -carrier ratio.
The wave form of this phase deviation producedby the noise has characteristics somewhat similar tothe wave form produced by the effective frequencydeviation of the noise as plotted in Fig. 4 of the pa-per on frequency -modulation noise characteristicspreviously referred to.2 This is shown in Fig. 14 inwhich one cycle of the noise phase deviation is plot-ted for carrier -noise ratios of 1.2 and 2. The wave

134 Proceedings of the I.R.E. February
form approaches a saw -tooth shape as unity carrier -noise ratio is approached and approaches a sinu-soidal shape as the carrier -noise ratio is made large.This fact will undoubtedly cause the crest factor ofthe noise to increase in the vicinity of unity carrier -
noise ratio. Such being the case, it can be seen thatwhen root -mean -square values are considered, thephase deviation of the noise in radians will be morenearly equal to the noise -carrier ratio.
Knowing the phase deviation of the noise, the nextstep would be to compare the over-all transmissionsof the noise for the cases of phase and amplitude
J-
tO
7-0 =1
W
-afl
LaZU0
20
12
8 k)
41111111111
U4
F 1140
P
2D I 40 6D eo1-149E PEVIAT 04 IN DEGREE;
130
Fig. 15-Theoretically determined fundamental and harmonicoutputs of a phase -modulation receiver.
modulation. However, this step is unnecessary sincethe noise component linearly produces a noise outputvoltage in the same manner for both systems. Con-sequently a comparison of the signal -noise ratioseffected by the noise components in the two- caseswill be all that is required. In the case of amplitudemodulation, the signal -noise ratio is known to beproportional to the product of the carrier -noise ratioand the modulation factor. In the case of phasemodulation the signal -noise ratio will be equal tothe signal phase deviation divided by the noise phasedeviation. Hence (subscript "p" indicates the phase -
modulation system),Sp/N, (peak values) = (D/sin-1- ii/C (3)
or, for most practical purposes,SplNp (peak values) = (DC/n. (4)
Thus the ratio between the signal -noise ratios ofthe phase- and amplitude -modulation receivers is,for most practical purposes, given by (subscript "a"indicates the amplitude -Modulation system)
Sp/Ni,(peak values) (ICP/NP
Sapv. MC./N.(5)
where M is the modulation factor in the amplitude -modulation system.
From (5) it can be seen that for equal carrierstrengths, the ratio between the signal phase devia-tion in radians and the modulation factor of theamplitude -modulation system gives the ratio of thesignal -noise ratios of the two systems. To evaluatethis factor, it remains to determine the permissiblesignal phase deviation used in the phase -modulationsystem.
It happens that harmonic distortion appearing inthe receiver output places a limitation on the phasedeviation for the receivers of the type which dependupon phase shifting of the carrier or side bands, orupon a single -side -band action. An analysis of theoutput of these types of receivers, which the authorintends to submit for publication at a future date,indicates that the output consists of the fundamentaland only the odd harmonics since the even harmonicsare balanced out by the push-pull detection system.The fundamental is proportional to the first -orderBessel function of the phase deviation J1(1)), the thirdharmonic is proportional to the third -order Besselfunction Ja(cI)), and so on. Thus, by consulting theBessel function tables, the curves of Fig. 15 are ob-tained showing the amplitude of the fundamentaland harmonics as the phase deviation is varied. Fromthese curves it can be seen that the phase deviationmay be carried to about one radian or 57.3 degreesfor a harmonic distortion of about 5 per cent. Al-though for high-fidelity program transmission, lessthan a radian of phase deviation might be used tokeep the distortion down, and for low -quality sys-tems a higher deviation and distortion would be al-lowable, for most purposes one radian could be con-sidered an average value for power calculations.
Substituting a signal phase deviation of one radianand a modulation factor of unity in (5), it can be seenthat for equal carrier -noise ratios the peak. signal -noise ratios obtained from the two systems are aboutequal. Consequently all of the gain caused by phasemodulation is effected by the increased carrier -noiseratio which is brought about by the increase in trans-mitter power of four -to-one. At a carrier -noise ratioof unity, about 4 decibels of this 6 -decibel gain arelost, but at a carrier -noise ratio of 1 decibel, lessthan 2 decibels are lost. This loss would be less ap-parent if root -mean -square instead of peak valueswere considered.
ADVANTAGES AND DISADVANTAGES
The main advantage obtained by the use of phasemodulation is realized at the transmitter. The reduc-tion of the amount of modulating equipment re-

1939 Crosby: Communication by Phase Modulation 135
quired and the power gain obtainable present an ad-vantage which greatly outweighs the small disad-vantages which the system has. Since modulation maybe accomplished at the master oscillator or its fol-lowing stage where the level is low, and since theamplitude linearity of the power amplifier may bepractically disregarded, many of the troubles en-countered in the use of amplitude modulation areeliminated. In general it may be said that for a givencomplement of tubes in the transmitter, practicallyfour times the carrier -power output can be realizedby phase modulation as compared to amplitudemodulation and this gain (6 decibels) is fully realizedin terms of signal -noise ratio at the receiver.
At the receiver, the main advantage obtained isthat caused by carrier exaltation. This, of course, isobtainable with amplitude modulation also. The re-ceiver is somewhat more complicated due to the ad-dition of the carrier -exalting circuits with theirrequirement of automatic frequency control. How-ever, in the case of the off -neutralized crystal -filterreceiver this complication is about the same as thatencountered when automatic frequency control is ap-plied to any type of receiver. Furthermore, it is theauthor's opinion that the improvement effected bycarrier exaltation alone makes the added complica-tion worth while.
The main difficulty encountered at the transmitteris the somewhat increased susceptibility to the intro-duction of alternating -current hum. However, al-most this same susceptibility is present with the useof amplitude modulation because fading sometimesconverts phase modulation into amplitude modula-tion
The chief difficulty at the receiver is the extremelyincreased susceptibility to microphonics on the oscil-lators. Apparently most oscillators are being micro -
phonically modulated with frequency modulationwhich does not show up in amplitude- or frequency -modulation reception, but when this small frequencydeviation is received as phase modulation the effec-tive phase deviation is very great. This is especiallytrue in the case of the microphonics having low peri-ods such as produced by bumps or jars of the oscil-lator tube or circuit. In the case of the ordinary high -frequency oscillator of a superheterodyne receiverreceiving a signal in the vicinity of 10 megacycles,the microphonics produced by a person walkingaround in the room are strong enough to be only afew decibels less than the receiver output due to fullmodulation. This susceptibility requires special treat-ment of the high -frequency oscillator. Shock- andsoundproofing may be employed together with care-ful design of the parts of the oscillator circuit to re-
duce the possibility of vibration. Another alternativeis the use of a crystal oscillator for the high -frequencyoscillator. Such a system requires either a tunablefirst intermediate frequency or the use of a low -fre-quency oscillator which heterodynes the crystal os-cillator so that a stabilized beat output is obtained.The stabilized beat output acts as the high -frequencyoscillator and is variable over the small range cov-ered by the low -frequency oscillator. This alternativeeliminates the necessity of soundproofing since thecrystal oscillator is stable enough to be free frommicrophonics and the low -frequency oscillators areoscillating at a low enough frequency so . that the
3cc
1C
30
20
0:. 0 /?I ______/.._
0 , 02 04 06 08 10 12 14 16
P AS D ,-A 1AT ON 14 RADIANS
ct
5
Fig. 16-Side-frequency amplitudes versus phase deviation forsingle -tone phase modulation.
frequency deviation due to the microphonics is small.However, such systems have the disadvantage ofadded complication and cost.
It might be contended that the presence of thehigher -order side frequencies of phase modulationplace this type of modulation at a disadvantage ascompared to amplitude modulation with respect toadjacent -channel interference. (See Fig. 16 showingthe relative amplitudes of the side frequencies forsingle -tone phase modulation.) However, the fol-lowing points dispute that contention :
1. The difference between the higher -order sidefrequencies produced by slightly overmodulatedphase- and amplitude -modulation transmitters is like-
ly to be quite small. Phase modulation does not havethe well-defined limit of 100 per cent modulation be-yond which all the higher -order side frequenciesincrease very rapidly.'2 Instead there is a gradualincrease of the second side frequency with only aslight amount of third side frequency at the fullmodulation of one radian.
2. In an analysis of the side frequencies of phaseand frequency modulation for the case of more than
f. J. Naar, "Some notes on adjacent channel interference,"PRoc. 1.12.1L., vol. 22, pp. 295-313; March, (1934).
136 Proceedings of the I.R.E.
one modulating frequency, which the author has sub-mitted for publication," it is shown that the presenceof the low modulation frequencies in conjunctionwith the high modulation frequencies reduces thehigher -order side -frequency amplitudes. In otherwords, the presence of a bass viol with a violin tendsto reduce the higher -order side frequencies whichwould be produced if the violin were present alone.This phenomenon is accumulative so that the greaterthe number of modulating frequencies in the modu-lating wave, the more will the wave be confined toits channel.
3. The amplitudes of the higher modulation fre-quencies of program and voice modulation (excludingfrequency inverting or other secrecy systems), whichproduce the out -of -channel interference, are knownto be less than those of the lower modulation fre-quencies. Hence only a small amount of adjacent -
channel interference should be caused by the higher -
order side frequencies of these higher modulationfrequencies. This situation also accentuates the ef-fect mentioned in point number 2.
13 Murray G. Crosby, "Carrier and side -frequency relationswith multi -tone frequency for phase modulation," RCA Rev.,vol. 3, pp. 103-106; July, (1938).
In view of the above points there is some doubt asto which system will produce the most adjacent -channel interference. At any rate, it can be seen thatthe difference will not be as great as the sinusoidalside -frequency resolution of phase modulation mightindicate.
ACKNOWLEDGMENT
The author gratefully acknowledges the helpfulsuggestions and encouragement received from MessrsH. H. Beverage and H. 0. Peterson during the courseof this work.
He also wishes to accredit the promotive en-thusiasm of Mr. C. W. Hansell together with theinventive contributions of Mr. Hansell and his staffat the Transmitting Design Laboratories of R.C.A.Communications, Inc. at Rocky Point, New York.
Mr. R. E. Schock assisted with the tests and de-velopment work at the receiving end.
Mr. J. W. Conklin was active in developing thetransmitter which was used in the propagation tests,and handled the transmissions during the early partof the tests. Mr. T. J. Boerner handled the trans-missions during the latter part of the tests.

Design of "Flat -Shooting" Antenna Arrays*W. W. HANSENt, NONWIEBER, I.R.E., AND L. M. HOLLINGSWORTHt,
ASSOCIATE MEMBER, I.R.E.
Summary-In a recent paper by Hansen and Woodyard it waspointed out that there are an infinite number of arrays that radiatemostly along the ground and which do not (necessarily) involve highradiating elements. Methods of design were given for two classesof such arrays. The present paper completes the solution of thisdesign problem and gives approximate formulas for the gain andnumber of array elements of all of these arrays not treated in theprevious paper. It is concluded that the two classes previously treatedare superior to the intermediate types here considered.
INTRODUCTION
N A recent paper' it was pointed out that a dis-tribution of vertical dipoles with (radial) densityeinopJ(163) out to some radius p 0 and zero there-
after would radiate mainly in a horizontal plane.Such a directional characteristic is desirable forbroadcast purposes and as arrays of the above typecan achieve such desirable radiation patterns with-out the use of expensive towers it seemed desirableto investigate further their possibilities and this wasdone so far as was seen to be possible at that time.Actually, of the infinite number of current distribu-tions possible under the above formula, two classeswere investigated; one in which n =0 and the radiusof the array is a wavelength or more; i.e., severalrings of antennas are used: and a second class in
which n is one or more and the array consists of asingle ring of elements in a circle of radius rathersmaller than the value corresponding to the firstmaximum of Jn. For these two classes of arrayssatisfactory formulas were given for the gain, andmethods for estimating the number of array elementsneeded were given, and from these it was concludedthat useful gains can be obtained from such arrays.
Moreover, study of the above -mentioned resultsshowed that for a given number of array elementssometimes one and sometimes the other of the twotypes was the better. But how about arrays usingseveral rings of antennas with n=1, 2, etc.? This isan important question for it might well be that, insome cases, such arrays might be better than thesingle ring Jr, or the multiple ring Jo arrays whichwere singled out for reasons of analytic convenience.Moreover plausible -sounding arguments can be putforward that would seem to show that such inter-mediate types are superior. For example, suppose we
* Decimal classification: R125. Original manuscript receivedby the Institute, June 21, 1938.
f Stanford University, Stanford, California.t San Francisco Junior College, San Francisco, California.1 W. W. Hansen and J. R. Woodyard, "A new principle in
directional antenna design," Puoc. I.R.E., vol. 26, pp. 333-345;March, (1938). Unless otherwise stated the notation of thisarticle will be used.
February, 1939
consider a large array of the Jo type. Then qualitativearguments can be adduced which show that an arrayof the same radius, but using a current distributioneioJi, should give almost identical gain. Now onemight think that this would be more economicalbecause of the elimination of the center antenna.Moreover it would seem offhand that e"0.1.2 should bebetter still as the gain would be about the same andone additional ring of antennas could be dispensedwith.
Now one would not like to build an expensivearray without being as sure as the state of the artallows that it is the optimum design and so onewould, in a practical case, feel impelled to investigateall possibilities. On the other hand such an investi-gation would be tedious in the highest degree, es-pecially with standard methods, as an array mighthave say 20 elements and, in addition, at least threevalues of must be tried. Even with the methods ofreference 1 the work would be quite boring, to saythe least.
It is the object of the present paper to avoid theneed for such numerical work, insofar as possible.Specifically we aim to find simple approximate ex-pressions for the number of array elements and thegain as a function of the diameter of the array andthe order of the Bessel function associated with thearray. Thus we shall be able to decide the questionraised above. Unfortunately we shall find in factthat the above qualitative argument is wrong-theintermediate types are not superior.
APPROXIMATE FORMULA FOR NUMBEROF ARRAY ELEMENTS
We first treat the problem of finding the minimumnumber of elements needed for an array of given nvalue and radius. Now a really accurate figure forthe minimum number of elements would have to takeinto account the allowable horizontal nonuniformityof coverage and certainly would be quite complex.However the addition of a quite small number ofarray elements will change an array from very badto very good in this respect so that if we use someuniform criterion for all arrays the absolute numberof antennas in any given array will never be far offwhile the difference in number between two arrayswill be given quite accurately. Now the principalpurpose of the present paper is to decide which
Proceedings of the I.R.E. 137
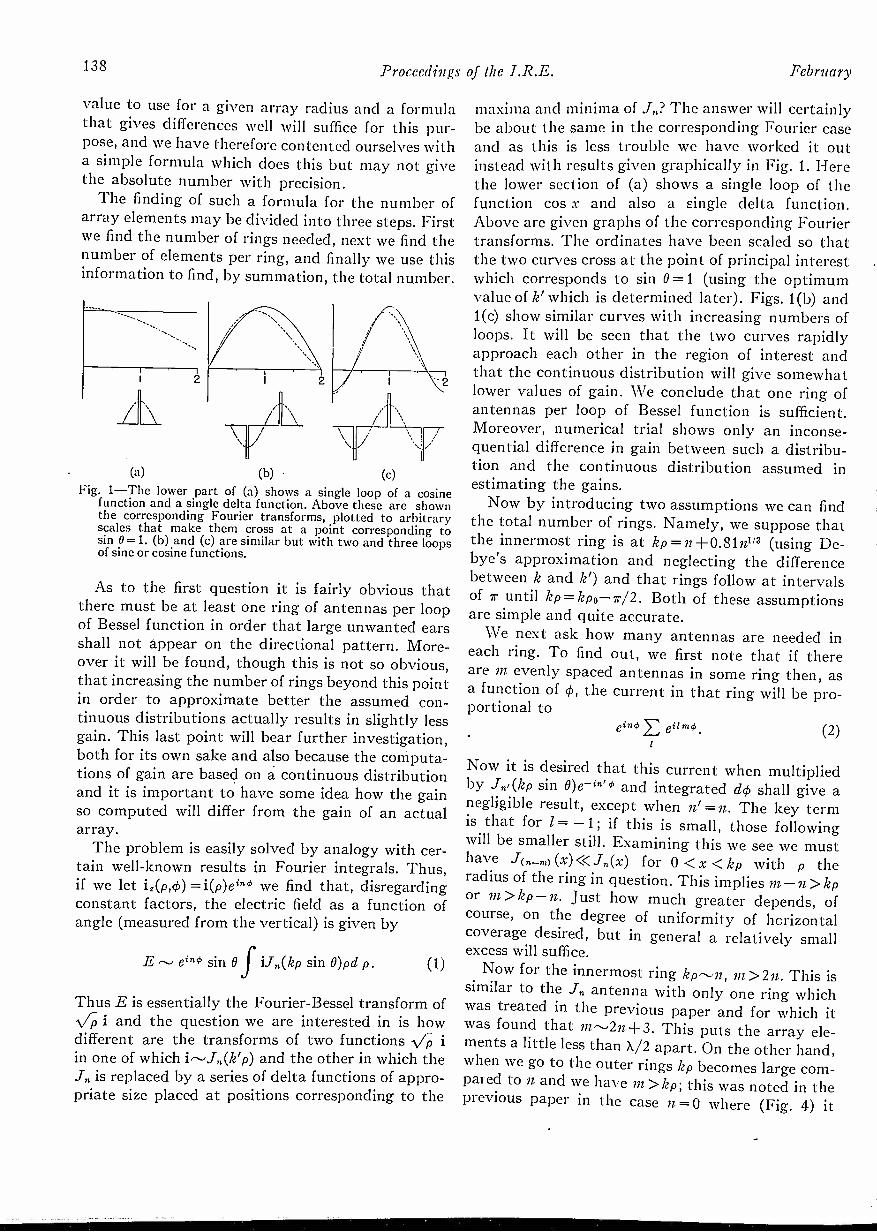
138 Proceedings of the I.R.E. February
value to use for a given array radius and a formulathat gives differences well will suffice for this pur-pose, and we have therefore contented ourselves witha simple formula which does this but may not givethe absolute number with precision.
The finding of such a formula for the number ofarray elements may be divided into three steps. Firstwe find the number of rings needed, next we find thenumber of elements per ring, and finally we use thisinformation to find, by summation, the total number.
(a) (b) (c)
Fig. 1-The lower part of (a) shows a single loop of a cosinefunction and a single delta function. Above these are shownthe corresponding Fourier transforms, plotted to arbitraryscales that make them cross at a point corresponding tosin 0 =1. (b) and (c) are similar but with two and three loopsof sine or cosine functions.
As to the first question it is fairly obvious thatbe at least one ring of antennas per loop
of Bessel function in order that large unwanted earsshall not appear on the directional pattern. More-over it will be found, though this is not so obvious,that increasing the number of rings beyond this pointin order to approximate better the assumed con-tinuous distributions actually results in slightly lessgain. This last point will bear further investigation,both for its own sake and also because the computa-tions of gain are based on a continuous distributionand it is important to have some idea how the gainso computed will differ from the gain of an actualarray.
The problem is easily solved by analogy with cer-tain well-known results in Fourier integrals. Thus,if we let iz(p,cb) =i(p)eino we find that, disregardingconstant factors, the electric field as a function ofangle (measured from the vertical) is given by
E eino sin 0 f Un(kp sin 0)pd p. (1)
Thus E is essentially the Fourier-Bessel transform of\/73 i and the question we are interested in is howdifferent are the transforms of two functions 1/pin one of which p) and the other in which theJ is replaced by a series of delta functions of appro-priate size placed at positions corresponding to the
maxima and minima of J? The answer will certainlybe about the same in the corresponding Fourier caseand as this is less trouble we have worked it outinstead with results given graphically in Fig. 1. Herethe lower section of (a) shows a single loop of thefunction cos x and also a single delta function.Above are given graphs of the corresponding Fouriertransforms. The ordinates have been scaled so thatthe two curves cross at the point of principal interestwhich corresponds to sin 0=1 (using the optimumvalue of k' which is determined later). Figs. 1(b) and1(c) show similar curves with increasing numbers ofloops. It will be seen that the two curves rapidlyapproach each other in the region of interest andthat the continuous distribution will give somewhatlower values of gain. We conclude that one ring ofantennas per loop of Bessel function is sufficient.Moreover, numerical trial shows only an inconse-quential difference in gain between such a distribu-tion and the continuous distribution assumed inestimating the gains.
Now by introducing two assumptions we can findthe total number of rings. Namely, we suppose thatthe innermost ring is at kp =n -1-0.81/z1/3 (using De -
bye's approximation and neglecting the differencebetween k and k') and that rings follow at intervalsof 7r until kp=kpo- 7/2. Both of these assumptionsare simple and quite accurate.
We next ask how many antennas are needed ineach ring. To find out, we first note that if thereare in evenly spaced antennas in some ring then, asa function of 43, the current in that ring will be pro-portional to
eino E eizmo. (2)
Now it is desired that this current when multipliedby J, (kp sin 0) e- in' 4' and integrated d4 shall give anegligible result, except when n' =n. The key termis that for 1= -1; if this is small, those followingwill be smaller still. Examining this we see we musthave J(,,) (x)<<J(x) for 0 < x < kp with p theradius of the ring in question. This implies in- 11> kpor m>kp-n. Just how much greater depends, ofcourse, on the degree of uniformity of horizontalcoverage desired, but in general a relatively smallexcess will suffice.
Now for the innermost ring in>2n. This issimilar to the J, antenna with only one ring whichwas treated in the previous paper and for which itwas found that m,2n-1-3. This puts the array ele-ments a little less than X/2 apart. On the other hand,when we go to the outer rings kp becomes large coin -pared to n and we have M > kp; this was noted in theprevious paper in the case n =0 where (Fig. 4) it

1939 Hansen and Hollingsworth: Design of "Flat -Shooting" Antenna Arrays 139
was found that p+1 was about right. Thismakes the antennas about X apart. For present pur-poses, then, we shall adopt the value m = kpd-n+1for the number of antennas in any given ring.
We may note in passing that, as a result of theabove, increasing n increases the number of arrayelements required in the rings that remain and itwill turn out that this more than compensates forthe decrease in number due to elimination of centralrings. It is for this reason that the qualitative argu-ment sketched in the introduction is incorrect.
Combining the above values for the number ofelements per ring with previous assumptions as tothe number of rings we find by summation an ap-proximation for the number of elements needed forany array.
N =27r
[(2kpo
- 1-r) (kpo2
(n 0.8111113)(n + 0.81n113 + 1)
-I- 2(n + 1) (kpo -I- -n - 0.811110)1 (3)
In Fig. 2 we have plotted lines of constant N on thekpo, n plane.
It will be noted that the lines of constant N ter-minate, leaving the upper left-hand corner of Fig. 2blank. We have done this because (3) obviously cannot hold when kpo is less than about n+0.81n"-1-7r.
10
N.110
0 5 10 15
k R,
Fig. 2-Values of N, the number of array elements,as given by formula (3).
Thus (3) breaks down in the region of antennas witha single ring. As is better explained later, these an-tennas are in some respects a class apart and weshall confine ourselves to a remark which, thoughonly qualitative, will suffice for our purpose. That is,we point out that a single ring array of very smalldiameter needs a minimum of 2n -I-1 array elementsand this number rises slowly with increasing arrayradius. Otherwise said, the constant N curves ofFig. 2 would, if continued, bend to the left and wouldrise slowly as they approached kpo = O.
APPROXIMATE FORMULA FOR THE GAIN
We now seek a simple formula for the gain of an(hypothetical) array consisting of a continuous dis-tribution of dipoles of radial density pf n(k' p)eino
out to some radius po and zero outside. Using variousformulas from footnote reference 1 we easily find the
0Fig. 3-Plot of the integrand of (5) for it =0, k'/k =1.14 kpo
=13.13. This is essentially E2 sin 0 where E is the field due toa continuous distribution of dipoles that would in practicebe approximated by a central antenna and four surroundingrings. Also plotted, for comparative purposes, is E2 sin 0 fora single dipole, i.e., sin3 0. The gain can be obtained by planim-etering the two curves and taking the ratio of the results.In this way the gain in this case was found to be 2.48.
gain to be given by
1 3= -[ f J(kip)J(kp)kpd(kp)1-2
gain 2
X [5 .1.7,(kip)J7,(hp sin 0) kpd(kp)12sin3 0 d e. (4)
The normal place to terminate such an array wouldbe at a point such that .1-7,(k'po) =0: indeed if wepropose to approximate the continuous distributionusing only one ring per loop of Bessel's function wecould hardly do otherwise.2 Fortunately this simpli-fies the first integration considerably, the result being
3 _ k2\2
gain 2 Jn(kpo)
J2(kpo sin 0)X
r/2sin3 0 d D. (5)- k2 sing 0)2
This is better but we still cannot do the last inte-gration analytically and when we remember that wewould like to explore the possibilities given by (say)0 <n S10, 0 < kpo <15 we see that some way ofavoiding numerical integration is highly desirable.
2 Note that if the continuous array terminates at sonic valueof k'po, the last ring of the actual array will be at a k' p value about,r/2 smaller. Thus the kpo that will appear in various formulasis somewhat larger than the actual radius of the correspondingarray.
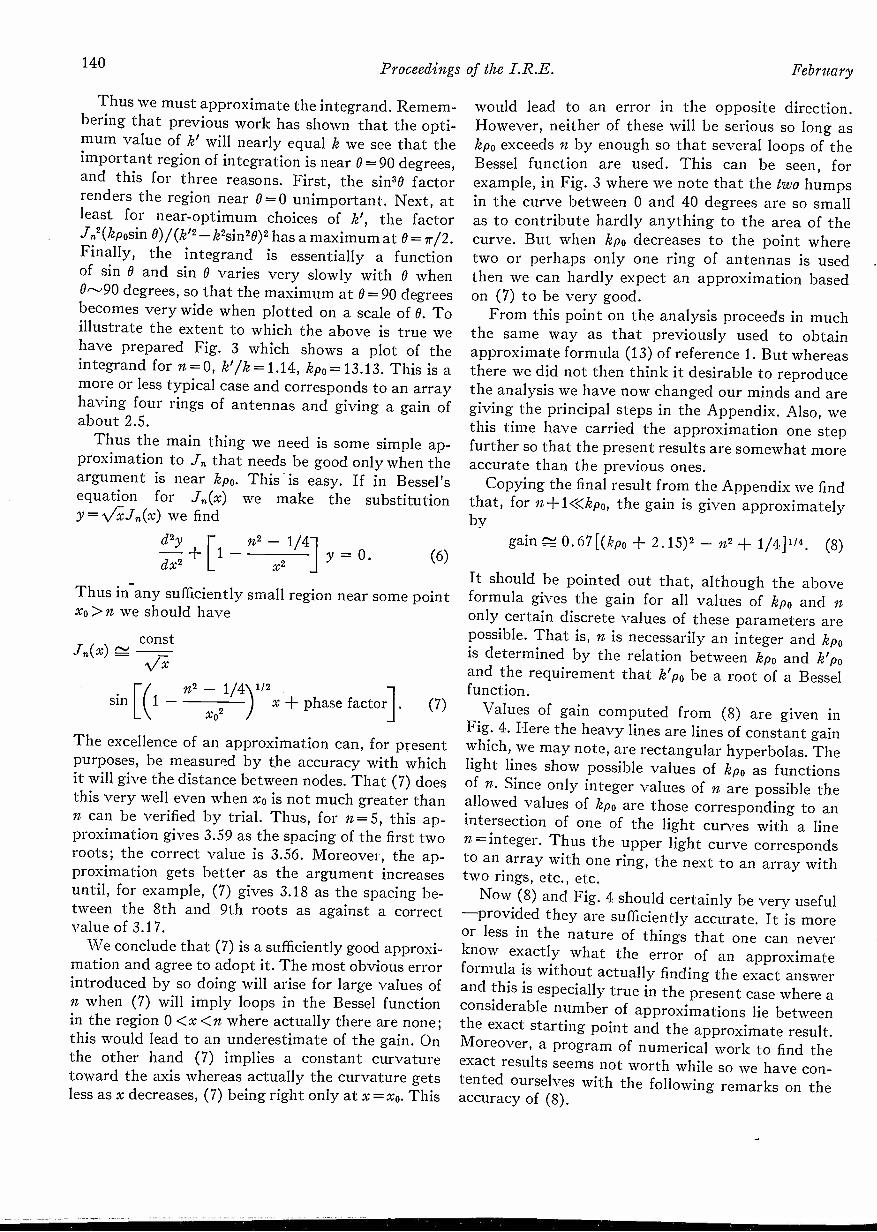
140 Proceedings of the I.R.E. February
Thus we must approximate the integrand. Remem-bering that previous work has shown that the opti-mum value of k' will nearly equal k we see that theimportant region of integration is near 0= 90 degrees,and this for three reasons. First, the sin30 factorrenders the region near 0=0 unimportant. Next, atleast for near -optimum choices of k', the factorJn2(kposin 0)/(k"- k2sin20)2 has a maximum at 0=r/2.Finally, the integrand is essentially a functionof sin 0 and sin 0 varies very slowly with 0 when0,-,90 degrees, so that the maximum at 0= 90 degreesbecomes very wide when plotted on a scale of 0. Toillustrate the extent to which the above is true wehave prepared Fig. 3 which shows a plot of theintegrand for n = 0, k7k =1.14, kpo = 13.13. This is amore or less typical case and corresponds to an arrayhaving four rings of antennas and giving a gain ofabout 2.5.
Thus the main thing we need is some simple ap-proximation to J,, that needs be good only when theargument is near kpo. This is easy. If in Bessel'sequation for J.(x) we make the substitutiony = A/x.1.(x) we find
d2y
dx2
n2 -
x2 Y 0. (6)
Thus in -any sufficiently small region near some pointxo >n we should have
const
-7/2
x02x -I- phase factor]. (7)
The excellence of an approximation can, for presentpurposes, be measured by the accuracy with whichit will give the distance between nodes. That (7) doesthis very well even when xo is not much greater thann can be verified by trial. Thus, for n = 5, this ap-proximation gives 3.59 as the spacing of the first tworoots; the correct value is 3.56. Moreover, the ap-proximation gets better as the argument increasesuntil, for example, (7) gives 3.18 as the spacing be-tween the 8th and 9th roots as against a correctvalue of 3.17.
We conclude that (7) is a sufficiently good approxi-mation and agree to adopt it. The most obvious errorintroduced by so doing will arise for large values ofn when (7) will imply loops in the Bessel functionin the region 0 <x <n where actually there are none;this would lead to an underestimate of the gain. Onthe other hand (7) implies a constant curvaturetoward the axis whereas actually the curvature getsless as x decreases, (7) being right only at x =xo. This
would lead to an error in the opposite direction.However, neither of these will be serious so long askpo exceeds n by enough so that several loops of theBessel function are used. This can be seen, forexample, in Fig. 3 where we note that the two humpsin the curve between 0 and 40 degrees are so smallas to contribute hardly anything to the area of thecurve. But when kpo decreases to the point wheretwo or perhaps only one ring of antennas is usedthen we can hardly expect an approximation basedon (7) to be very good.
From this point on the analysis proceeds in muchthe same way as that previously used to obtainapproximate formula (13) of reference 1. But whereasthere we did not then think it desirable to reproducethe analysis we have now changed our minds and aregiving the principal steps in the Appendix. Also, wethis time have carried the approximation one stepfurther so that the present results are somewhat moreaccurate than the previous ones.
Copying the final result from the Appendix we findthat, for n+1<<kpo, the gain is given approximatelyby
gain 0.67 [(kpo 2.15)2 _ n2 1/4p/4. (8)
It should be pointed out that, although the aboveformula gives the gain for all values of kpo and nonly certain discrete values of these parameters arepossible. That is, n is necessarily an integer and kpois determined by the relation between kpo and k'poand the requirement that k'po be a root of a Besselfunction.
Values of gain computed from (8) are given inFig. 4. Here the heavy lines are lines of constant gainwhich, we may note, are rectangular hyperbolas. Thelight lines show possible values of kpo as functionsof n. Since only integer values of n are possible theallowed values of kpo are those corresponding to anintersection of one of the light curves with a linen = integer. Thus the upper light curve correspondsto an array with one ring, the next to an array withtwo rings, etc., etc.
Now (8) and Fig. 4 should certainly be very useful-provided they are sufficiently accurate. It is moreor less in the nature of things that one can neverknow exactly what the error of an approximateformula is without actually finding the exact answerand this is especially true in the present case where aconsiderable number of approximations lie betweenthe exact starting point and the approximate result.Moreover, a program of numerical work to find theexact results seems not worth while so we have con-tented ourselves with the following remarks on theaccuracy of (8).

1939 Hansen and Hollingsworth: Design of "Flat -Shooting" Antenna Arrays 141
First, we have done some numerical work bearingon the accuracy of (8) when n = 0. We chose 12 =because, as will appear presently, this seems to in-clude all cases likely to be important practically butnot sufficiently covered in reference 1. To procurean over-all check we should compare the gain givenby (8) with that computed for a series of actual an-tennas. But this would be much more work thancomputing the gain from (4) which assumes a con-tinuous current distribution and in view of the ex-cellence of this approximation as exhibited for ex-ample in Fig. 1 we feel that such labor would be un-justified. We have therefore integrated (4) numeri-cally for a series of cases and will assume that thegain so obtained is correct. In doing this we need ineach case to know the ratio between k and k'. Wetook k'po to be 1.8 larger than hpo which gives, as wehave seen, the optimum value of k' when k'po>>n.Of course when kpo is small this will not give quitethe value of k' corresponding to maximum gain butit will be found that the resulting gain will differ fromthe maximum by very little indeed. This is true forthree reasons: first, in the region of optimum h' thegain varies only slowly with k' so that small errorsin k' make practically no change in the gain ; second,numerical trial in the case of the lowest possible valueof k'po gives k'po = 2.4, kpo = 0.6, gain = 0.995, whereasthe optimum values would be kpo = 0, gain =1.00;and third, besides being nearly the best when kpo->0the choice k'po-kpo=1.8 is known to be best whenkpo-> a). With the above assumptions, then, we corn -
10
0 5 10 15
kpo
Fig. 4-Heavy lines are lines of constant gain, as given by ap-proximate formula (8). Intersections of the light lines withthe lines n =integer correspond to possible values of /epo.
puted the gain for n = 0, k'po = 2.40, 5.52, 8.65, 11.79,14.93, these being the first five arrays of this type.The results are shown as points in Fig. 5, the fullcurve is computed from approximate formula (8). Itwill be seen that the agreement is good : we concludethat, at least for n =0, the approximations made inthe steps between (4) and (8) give a very satisfactoryresult.
As to the accuracy when kpo comes near to n itwill be noted that the lines of constant gain havebeen terminated on the line corresponding to a singlering of antennas with kpo=k'po - 1.8, J(k' po)= O.We have done this because, for two reasons, (8) canhardly be expected to be very good beyond this line,if indeed it is much good there. The reasons are as
k pa
Fig. 5-The full line is a plot of gain as given by the approximateformula (8) for n=0, 0 5kpo:515. The circles give the gainas computed numerically for the first five arrays of this typepossible.
follows. First, as kpo-->Vn2- 1/4 approximation (7)breaks down completely, and with it (8). Second,(8) is supposed to give the gain for the optimumrelation between k'po and kpo and is actually figuredfor k' po-kpo= 1.8 which, for two or more rings, isquite close, as explained above. But for a single ringthe gain is a maximum when k'/k = co so that (8)hardly means much in this case.3 On the other hand,numerical trial shows that, even if (8) does not inthis case give the best gain it does give a fair approxi-mation to the gain of a single -ring antenna with theassumed values of kpo.
One might fill the upper left-hand corner of Fig. 3by using an approximation like (7) but with the sinereplaced by an exponential and with the approxima-tion good when n>lepo. This leads to a formula likegain = 0.75[ (n +3/2)2 -(kpo)2-1/4P14. Using this, one
3 For any fixed number of rings, i.e., given n and k'po, thecurve of gain versus kpo has a number of maxima and minima, byfar the largest of which occur when kpo-40 and when kpo"-'k'po.We do not consider the first of these in general because it amountsto a multiple -ring antenna acting as a single ring and gives goodgain but very little radiation resistance. But as the number ofrings decreases the number of maxima in the gain curve betweenepo and 0 decreases until with a single ring the maximum atkpeqe'po disappears and the on1)., "best" value of kpo brings withit zero radiation resistance so one must choose kpo by some com-promise between gain and ground losses. This introduces newfactors, rather hard to put in formulas, so we have to treat thesingle -ring array on a somewhat different basis from the others.

142 Proceedings of the I.R.E. February
could plot lines of constant gain that would beginon the n axis of Fig. 4. We have not done this because,as explained above, in going from one ring to two ormore there is an essential change in the behaviorwhen trying to maximize the gain as a function ofkpo. Nevertheless it is worth noting that the aboveformula also gives constant gain lines of hyperbolicshape but with the roles of kpo and n interchanged.Thus, if we keep a constant n and start from kpo = 0the gain will at first decrease with increasing kpo inthe same way that, with fixed kpo, the gain also de-creases when 72 is increased from zero.
DISCUSSION AND CONCLUSION
We are now in a position to decide in any givencase which type of antenna will give the greatestgain with the smallest number of array elements.Suppose we enter Fig. 4 at n = 0 and some given kpo.Then as we increase n we see that the gain decreases.Looking at Fig. 2 we observe that the number ofarray elements starts by increasing, though it even-tually decreases again. Thus it is obvious that smallincreases of n away from zero are definitely bad forthey both decrease the gain and increase the numberof array elements. Moreover, more careful observa-tion, as for example by superposing Figs. 2 and 4,will show that this tendency persists for larger nvalues: the decreasing number of elements is out-weighed by a more rapidly decreasing gain. Thus weconclude: over all the region covered in Figs. 2 and4 the Jo -type array is the best.
This leaves the upper left-hand corner, which cor-responds to single -ring -In arrays, to be considered.As explained above we have not completed thecharts in this region but it is nevertheless easy to see,using the previous qualitative statements, that, forfixed n, increasing kpo from zero to the maximumvalue possible for a single -ring array both decreasesthe gain and increases the number of array elements.
Taken together, these two statements lead one tothe conclusion that, using a given number of arrayelements, the greatest gain will be obtained witheither a single -ring J array or a multiple -ring Jo.Which of these two is better depends principally onthe gain desired and somewhat on the uniformity ofhorizontal directivity and radiation resistance de-sired. Using (3) and (8) we find4 the transition pointto be between kpo= 6.65 and kpo = 9.99.
In the preceding paper, numerical examples were given onlyfor arrays of rather high gain, so the following numbers for smallerarrays may be of interest. Multiple -ring Jo arrays of 1, 2, 3, and 4rings (counting the central element as one ring) give gains of 1.00,1.54, 1.93, and 2.26, using (approximately) 1-, 4-, 10-, and 19 -array elements. These last numbers are in the nature of lowerlimits; 1, 5, 12, and 22 would certainly he sufficiently large.
Another point which might be the deciding factorbetween the single ring .In and the multiple ring Jo,is the fact that under some conditions it is very un-desirable to radiate an appreciable sky wave at fairlyhigh vertical angles due to fading caused by inter-ference between the reflected wave and ground wave.In this connection it should be noted that there areno minor lobes or "ears" on the vertical pattern ofthe single -ring J antenna unlike other antennasof comparable gain.
Thus our final conclusion is that the arrays exam-ined in this paper are inferior to those considered inthe first paper. That is, roughly speaking, a minimumlies between the two cases previously considered andnot the maximum one might have hoped for. It isunfortunate that so much analysis is needed to reachsuch a negative conclusion but the authors know ofno way of making the answer seem "obvious."
APPENDIX
To find a formula for the gain based on (5) andusing approximation (7) we proceed as follows. First,we adjust the phase factor in (7) so that one zeroof the Bessel function will fall at le' po, so writing
1J.(x) -'14--Z constant times sin K(140 - x) (9)
K = (1 722 - 1/4 "2
(kpo) 2(10)
Next put the above approximation into (5) andmake the following changes of variable
z =1
Kkpo
Kpo(k' - k)x = Kkpo(1 - sin 0)
when it will be found that (5) becomes
1 3 241+ uz/2) \ 2gain 2.\/2 sin it )
1/z
X(1 - xz)2
o ( -X2 1/2
1-2
1+-zit- x2
2
(12)
sin (22+x) 2 dx
u -1-x \rx
Now in principle we should minimize this withrespect to u; i.e., find the optimum value of k', foreach value of z. But in practice, as explained in more
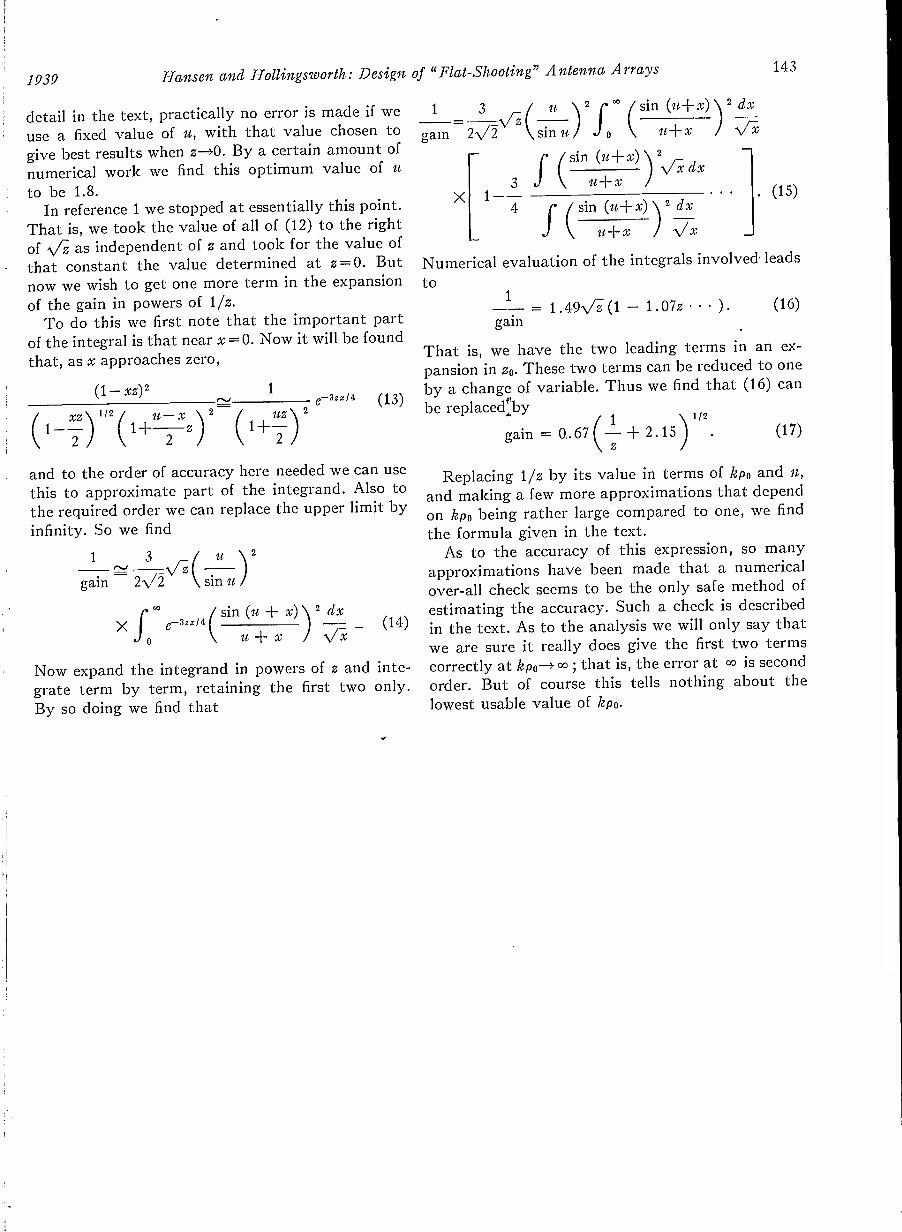
1939 Hansen and Hollingsworth: Design of "Flat -Shooting" Antenna Arrays
detail in the text, practically no error is made if weuse a fixed value of u, with that value chosen togive best results when z-->0. By a certain amount ofnumerical work we find this optimum value of uto be 1.8.
In reference 1 we stopped at essentially this point.That is, we took the value of all of (12) to the rightof V.Z as independent of z and took for the value ofthat constant the value determined at z =O. Butnow we wish to get one more term in the expansionof the gain in powers of 1/z.
To do this we first note that the important partof the integral is that near x=0. Now it will be foundthat, as x approaches zero,
(1- xz)2 1rsa e-3zx/4=-_
2/2 2XZ 112 it
2
2
1 - -2 1+x 1+-(13)
and to the order of accuracy here needed we can usethis to approximate part of the integrand. Also tothe required order we can replace the upper limit byinfinity. So we find
1 ti 3 \l( 11 )2gain 2-Y2 sin u
X c.° c-3zxl4o
sin (u + x) v2 dx11 + X )
(14)
Now expand the integrand in powers of z and inte-grate term by term, retaining the first two only.By so doing we find that
1 - 3 u \ 2 r /sin (u+x)
gain 2-V2 sin 'it 11+ X
X31--4
sin (u+x)u+x
x dx
sin (u+ x) 2 dx
it+ X 'N/ X
Numerical evaluation of the integrals involved leadsto
1= 1.49\ri (1 - 1.07z ). (16)
gain
That is, we have the two leading terms in an ex-pansion in zo. These two terms can be reduced to oneby a change of variable. Thus we find that (16) canbe replacedby
11/2
gain 0.67 (- + 2.15 (17)z
Replacing 1/z by its value in terms of kpo and n,and making a few more approximations that dependon hpo being rather large compared to one, we findthe formula given in the text.
As to the accuracy of this expression, so manyapproximations have been made that a numericalover-all check seems to be the only safe method ofestimatingin the text. As to the analysis we will only say thatwe are sure it really does give the first two termscorrectly at hpo--> co ; that is, the error at 00 is secondorder. But of course this tells nothing about thelowest usable value of kpo.

A Television Pickup Tube*HERBERT A. FINKEt, NONMEMBER, I.R.E.
Summary-A television pickup tube is described which com-bines in one device the principles of signal storage, as in the Icono-scope, and of signal multiplication by secondary -electron emission.Calculations indicate that for a given video frequency signal, thistube will generate a considerably greater electrical signal than anyother present pickup device.
AMONG electron optical television pickuptubes, the Iconoscope is characterized by itsability to store the total light received during
a picture period as the potential energy of charge ona condenser, and the Farnsworth image dissector and
TRANSPARENTPHOTOCATHODE
OSCILLATINGELECTRIC FIELD
DIAGRAM
DOUBLE -SIDEDMOSAIC
MAGNETICFIELD
Fig. 1.
SOURCE OFSCANNING BEAM
ELECTRIC YIELDSE3 ConstantE4 Saw -tooth
Ey Saw -tooth
multiplier ,by its ability to take the light of an ele-ment period and enormously amplify the subsequentelectron beam by secondary -electron multiplication.Both of these principles are highly desirable in anytelevision pickup tube. A satisfactory combinationof these two principles in a single device should yielda highly satisfactory video -frequency pickup system.
This combination of signal storage by a mosaicand of signal amplification by secondary-electronmultiplication may be effected by a fairly simpledesign illustrated by Fig. 1.
A double -sided mosaic is employed. Incoming lightwill fall upon a transparent photocathode suppliedwith an oscillating voltage. Photoemission from thecathode will be accelerated to the mosaic causingsecondary -electron emission of the globules. Timingis such that an electron's transit period from cathodeto mosaic will be one and one-half cycles of theoscillating voltage, so that at the instant of mosaicimpact the field will be reversing itself and will now
* Decimal classification: R330 X R583. Original manuscriptreceived by the Institute, June 1, 1938.
f Massachusetts Institute of Technology, Cambridge, Massa-chusetts. Admitted October, 1938, as a fourth-year student inelectrical engineering. This paper presents the results obtainedover the period 1936-1938, during which time the author was notconnected with any school or commercial engineering organiza-tion.
draw all the secondaries back to the cathode andhence an oscillatory motion will result, increasingthe original photoemission at every mosaic andphotocathode impact, and thereby causing the mo-saic globules to lose increasing amounts of electronsat every mosaic impact. The magnetic field per-pendicular to the plane of the mosaic, and runningthrough the device is used for focusing.
Scanning of the mosaic to produce the televisionsignal is accomplished from the other side by anelectron beam whose mosaic -impact velocity is closeto zero. The purpose of this low -velocity scanningbeam is to avoid the production of secondary elec-trons during mosaic globule discharge. The beamcoming from its source with an initial velocity di-rected perpendicularly to the mosaic will have itsvelocity cut down to a value close to zero on reachingthe mosaic. At the same time, the magnetic field, andthe horizontal and vertical electric fields will, byindependent deflections, scan the plane of the mosaic.In this device, unlike the present Iconoscope, themosaic globules are always positively charged.
Thedevice hasbeen outlined. Actually, the operationis rather complicated, and will now be considered indetail. As indicated in the outline, the tube may beconsidered in two parts, first, the pickup and ampli-fication of the signal, and, second, the electronscanning. The signal pickup and amplification willbe considered first.
The transparent photocathode is to be suppliedwith an oscillating voltage E1 sin cot, and the beamtransit -time is to be one and one-half cycles. Thephotoemitted electrons will not in general come offwhen the oscillating voltage is just beginning to in-crease from zero, but may come off at any time qbehind this voltage.
z
0
El sin cot
--> H
x
y
The equations of motion in this part of the devicewill be, taking the origin at the photocathode,
d2x Eieto - -- sin (cot + ci5)
dt2
144 Proceedings of the I.R.E.
(1)
d2 y dzni -= He- (2)d12 dt
February, 1939

Finke: Television Pickup Tube 145
d2z dy
dt= - He
di2
(3)
In these equations, d is the distance betweenphotocathode and mosaic. Also, let yo and to be theinitial velocities, neglecting o'co as small compared tothe accelerating velocity of the field.
The solution of these equations of motion usingthe boundary conditions that when t is zero, x, y,and z are zero, and
dx dy dz
at at at
Ele E1esin (wt + 0) + t cos 0.
w2md wind
E1esin 0
co2md
y = A cos ( He- t B)in He
He n40z= -A sin
I
BHe
is
with A and B being easily determinable by the aboveboundary conditions.
It is to be observed that the magnetic field willproduce a focusing action only for a constant time oftransit, that is, for I-Ie/m equals 27r. The questionbecomes how does transit time vary for differentvalues of 4), if for 4 equals zero, the transit -time isone and one-half voltage cycles, or t equals 37r/co.
When 0 equals zero, and cot equals 37r, x becomes(Eie/ co2md) 37r. Letting this be the distance betweenphotocathode and mosaic, then to determine thevariation of I with 0 for this distance, it is necessaryto plot the equation
371- = T cos 0 + sin 0 - sin (T
letting cot equal T.The half -cycle transit -time will also be plotted for
comparison purposes. For the half voltage cycletransit -time, the equation to be plotted would be
7r = T cos 0 + sin 0 - sin (T .
TABLE I
ONE AND ONE-HALPICYCL f.S
0 10 20 30 40 50 60 70 80 90
9.42 9.35 9.36 9.57 10.16 14.3 18.5 22 46.5
ONE-HALF CYCLE.
0 10 20 30 40 50 60 70 80 90
T 3.14 2.99 2.89 2.82 2.80 2.84 3.00 3.50 8.7 ti
The following facts are gleaned from a study ofthis graph:
1. Only particles less than 90 degrees behind thevoltage will reach the mosaic; others will be drivenback to the photocathode.
22
21
20
19
13
17
16
15
14
13
12
31
1.0
9
a
ONE MD 031-15ILFCYCLES
01E-EALFCYCLES
0 10 20 30 40 50 60 70 60
PHASE OF VOLTAGE AT EMISSION
Fig. 2-Variation of transit -time with phase.
2. For the half -cycle transit -time, t shows a con-stant and considerable variation with 4). For the oneand one-half cycle transit -time, however, and be-tween 4=0 and 23 degrees, electrons will reach themosaic in about the same time, the maximum differ-ence being about 0.7 per cent of the transit -time for0 = 0. Hence these particles will be accuratelyfocused. Also, these particles on each transit willtake slightly less time than the 0 =0 particles, andhence their phase angles will be constantly reducedas they are gaining on the voltage phase, and willshortly take on a zero value for 0 and continue tooscillate. '
3. Also, for the one and one-half cycle curve, be-tween 0=23 and 90 degrees, electrons will takevarying amounts of time from the zero phase timeto infinity. But these particles take longer than thein -phase time and are constantly falling behind thevoltage and their 0's are increasing at every transit,and hence these particles will not oscillate as thefirst group, but will shortly be captured by eitherthe mosaic or the photocathode.
This nonoscillating group, while acting to decreaseglobule charge, will, however be negligible in com-

146 Proceedings of the I .R.E. February
parison to the charge acquired by a globule clue tothe oscillating group.
This oscillating process has its period limited byspace -charge accumulation, and, hence, the multi-plying field must be periodically cleared of all spaceelectrons, after which the multiplying process isstarted anew.
No allowance has been made for initial velocity ofsecondary emission along x, but corrections could bemade for the average value of these velocities.
A typical set of values for this part of the devicewill be E =1200 volts, f = 70 megacycles, d =10centimeters,H= 18gausses, and t = 2.1 X 10⁻⁸ seconds,one-way transit -time.
The superiority of this device over present pickupsystems will obviously depend upon the number ofmultiplying stages possible before clearing the field,and this in turn will depend upon the space -chargelimitation.
The space -charge -limited current for plane parallelplate electrodes in amperes per square centimeter isgiven by
E312I = 2.336 X 10-B
d2
For the values given above, the maximum possiblecurrent will be 9.73 X10⁻⁴ amperes per square centi-meter.
If the illumination on the mosaic is taken as5 X10-3 lumens per square centimeter the photo-sensitivity of the photocathode as 10 microamperesper lumen, and the secondary emission ratio takenas 7 to 1, then three stages of multiplication at themosaic are possible before clearance of the field.
This' periodic clearance of the field after everythree stages of multiplication may be accomplishedby superimposing on every- ninth positive swing ofthe high -frequency electric field a greater negativevoltage, such that all the electrons in the field willbe driven back to the photocathode where they willremain as the field will continue to oppose their re -emission. With the field cleared the cycle can beginagain. The annulment of every ninth positive swingmay be accomplished by means of a vacuum tubeoperated below cutoff, such that plate current willflow during one ninth of a cycle. During this 40 -
degree interval of plate -current flow, the voltage pro-duced when superimposed on the high -frequency fieldwill act to drive all field electrons back to the photo-cathode.
Now, if it is assumed that n electrons per squarecentimeter are emitted during every full -voltagecycle, then in eight voltage cycles, which would be
This paragraph was added to the paper on January 4, 1939.
the time for three stages of multiplication at themosaic, the ordinary Iconoscope operating at 100per cent efficiency would pick up 8n electrons. Thisdevice, however, would pick up
23- n{75 + 4.73 + 7.7'} = 1167n.360
Hence, comparing ratios, this device will pick up forthe values given, 146 times the charge accumulatedby the present Iconoscope, and since the mosaicglobules are always positive in charge will probablyoperate at a higher efficiency.
It is to be observed that the term in 75 is by farthe most important term and for this value prac-tically all the electrons are in sharp focus.
The second part of the device has been outlined.Precisely what happens may be seen from a studyof the equations of motion that obtain in the scan-ning field.
II
E3
X 0
y
E2
With the fields as indicated, a particle will startfrom the source, represented by the origin in this co-ordinate system with an initial velocity along x equalto a centimeters per second.
The equations of motion will be
ntd2x E3e
dt2
ntd'y E4e dz= He -
dt2 dt
ind2z. E2e dz
dt- He -
2 di
In these equations, d represents the distance fromthe source to the mosaic.
The solution of these equations of motion is
x =
y=
z=
E3e t2+ at
mad 2
-A cos (.1-1--e t ± B) ± E 411t E2± - 1111 II2ed Rd
He E2nt E4A sin (- t + B) + -1.In H2ed Hd
1939 Finke: Television Pickup Tube 147
where
and
Hence, when
Eon
H2edA cos B = 0
Eon
H2ed+ A sin B = 0.
He- t = 27rm-
E2 2irmy=
z=
Hd HeE4 27rM
Hd He
It will then be seen that the y and z deflections areindependent of each other, and if the cycloid periodtime is made to equal the time to bring the electronto rest along x, then any type of area scanning maybe accomplished by the independent voltage de-
flections. The horizontal and vertical deflectionsmust be linear with time and saw -tooth voltage waveforms must be used.
It is to be pointed out that for initial velocitiesalong y and z, the final displacement at the end ofthe cycloid period will have the same value, althoughthe curve itself will be distorted.
A consideration of the motion from the source tothe mosaic will reveal that it is parabolic, and thatfor zero velocity at the mosaic, the vertex of theparabola will be at the mosaic, and hence grazingincidence will occur in scanning. To avoid this, theimpact velocity must be several volts.
By this method the mosaic will be accuratelyscanned by a low -velocity beam. The excess electronsin the beam will be drawn back from the mosaic bythe existing fields and collected uniformly with time.
Here again the mosaic globules remain positivethroughout the operation.
An approximate idea of the order of magnitude ofthe fields used here is given by 11=18 gausses,a = 9.4 X10⁸ centimeters per second, d =10 centi-meters, E3 =260 volts constant, E2 = 450 volts saw -tooth, and E4 =450 volts saw -tooth.

A Low -Frequency Alternator*E. B. KURTZf, NONMEMBER, I.R.E. AND M. J. LARSENt, NONMEMBER I.R.E.
Summary-An electrostatic alternator is described which isessentially a variable condenser whose capacitance is made to varysinusoidally. Sinusoidal wave form can be maintained at all frequen-cies from zero up to approximatly 50 cycles.
INTRODUCTION
FirHE electrostatic alternator described hereinwas designed especially for the end of the audio-
frequency band where other types have notbeen particularly suitable. Sinusoidal wave form canbe maintained at all frequencies from zero up toapproximately 50 cycles per second.
The alternator is essentially a variable condenserwhose capacitance is made to vary sinusoidally, thuscausing a charging and discharging current to flowthrough a suitable circuit in which the input resist-ance of an amplifier is included. The theoreticalaspects are treated in sufficient detail to indicate themost acceptable circuit parameters to be used con-sistent with good wave form.
The simplicity and reliability of this alternatorsuggest that it may have a variety of uses wherevera sinusoidal, low -frequency, low -power source isneeded. As an oscillator it can serve excellently atthe lower frequencies where vacuum -tube oscillatorsgenerally have poor wave form.
Fig. 1-Electrical circuit of the low -frequency alternator.
THEORY
The electrical circuit of the model described hereinis given in Fig. 1. The resistance R represents thegrid resistance of an amplifier tube; c is the variablecondenser capacitance; Co represents the fixed ca-pacitance existing between the grid sector of thevariable capacitance and ground, as well as thecapacitance of a shielded input lead to the grid resist-ance; and E is a constant potential source.
Since a sinusoidal voltage is desired across the grid
* Decimal classification: R381. Original manuscript receivedby the Institute April 23, 1938.
f Electrical Engineering Department, The State Universityof Iowa, Iowa City, Iowa.
Formerly Electrical Engineering Department, The StateUniversity of Iowa, Iowa City, Iowa. Now, Electrical EngineeringDepartment, Michigan College of Mining and Technology,Houghton, Michigan.
148
resistance, the current through R must then be givenby
it = I sin cot. (1)
The problem is to find the expression for c which willproduce the required current. The following condi-tions of equilibrium will exist
+ is - is = 0 ,
i3dt- iiR -E = 0,i2dt
Co
(2)
(3)
- i1R = 0. (4)
Solving these equations simultaneously for c yields
ICoRI sin cot - - cos cot M
0.)c=E - IR sin cot (5)
where M is the integration constant.An inspection of this expression shows that if cis
to have a sinusoidal variation, the IR sin cot term inthe denominator must be very small compared to E.This term may be kept small by keeping the valueof R low. If for purposes of preliminary analysis weshould let R be zero, the expression for c would reduceto
M Ic = - - - cos cot.E Eco
(6)
A plot of c showing its variation with time is shownin Fig. 2.
Expressed in terms of its minimum value -the ex-pression for c may be written
Proceedings of the I.R.E.
I ICmin - - COS cot
Ew Eco
February, 1939
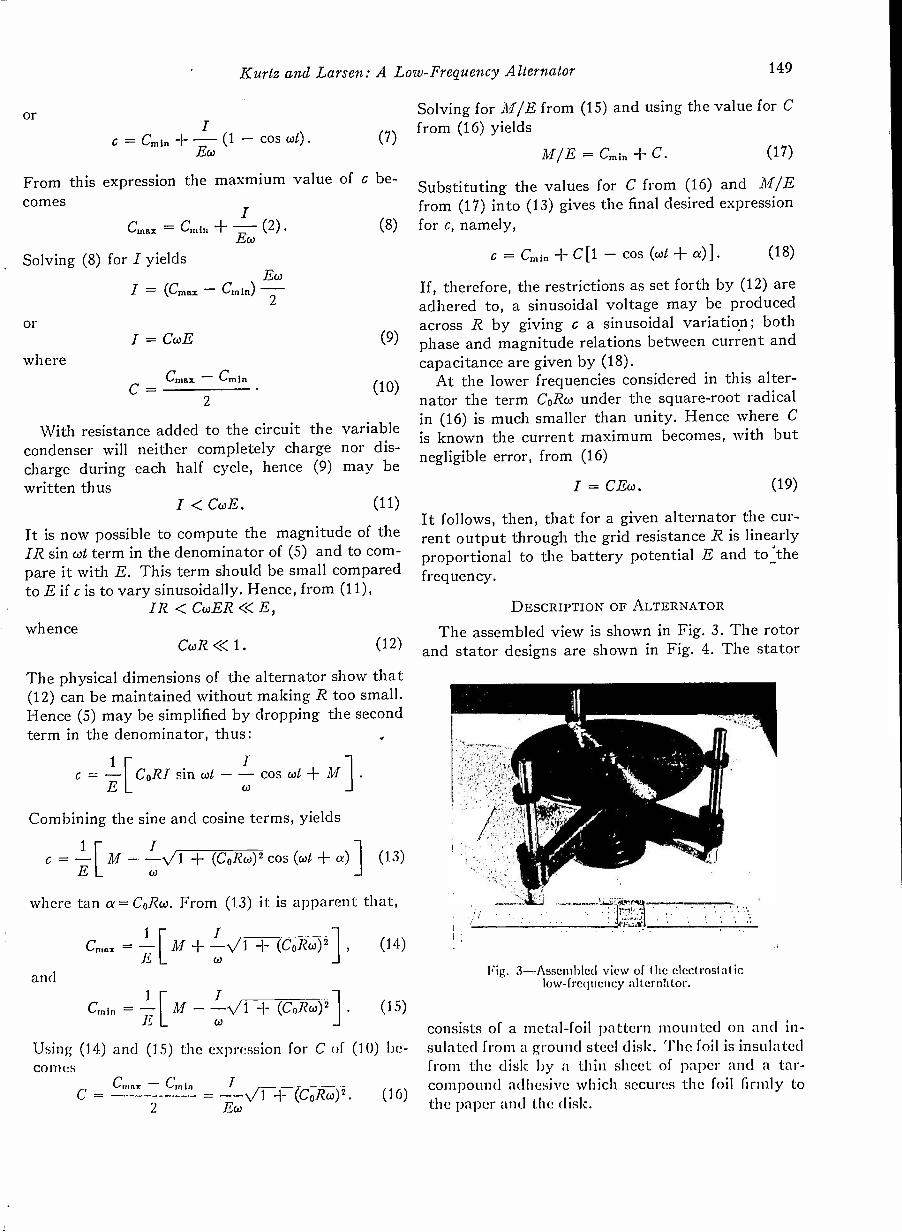
Kurtz and Larsen: A Low -Frequency Alternator 149
orI
c = Cmin + - (1 - cos cot).Eco
(7)
From this expression the maxmium value of c be-comes
(8)
/ = CcoE (9)
(10)
ICmax = Crain -
Eco(2) .
Solving (8) for I yieldsEco
I = (Cmax - Cmin)2
or
whereCmax - Cmin
C=2
With resistance added to the circuit thecondenser will neither completely chargecharge during each half cycle, hence (9)written thus
/ < CcoE.
variablenor dis-may be
(11)
It is now possible to compute the magnitude of theIR sin cot term in the denominator of (5) and to com-pare it with E. This term should be small comparedto E if c is to vary sinusoidally. Hence, from (11),
IR < CcoER << E,whence
Cad? << 1. (12)
The physical dimensions of the alternator show that(12) can be maintained without making R too small.Hence (5) may be simplified by dropping the secondterm in the denominator, thus:
c = -[CoR/ sin cot - - cos cot + M].co
Combining the sine and cosine terms, yields
1
c = -[M - + (CoRco)2 cos (cot + a)1 (13)co
where tan a = CoRco. From (13) it is apparent that,
1
Cmax = -[ M + + (Cokc.) , (14)Ts w
and
Cmin = -[ M - --V1 + (CoRco)2 . (15)co
Using (14) and (15) the expression for C of (10) be -co CS
Cmnx Cm InC= =2 Eco
± (CoRco)2. (16)
Solving for M/E from (15) and using the value for Cfrom (16) yields
M/E = Gar, + C. (17)
Substituting the values for C from (16) and M/Efrom (17) into (13) gives the final desired expressionfor c, namely,
c = Cmin + C[1 - cos (cot + a)]. (18)
If, therefore, the restrictions as set forth by (12) areadhered to, a sinusoidal voltage may be producedacross R by giving c a sinusoidal variatign; bothphase and magnitude relations between current andcapacitance are given by (18).
At the lower frequencies considered in this alter-nator the term CoRco under the square -root radicalin (16) is much smaller than unity. Hence where Cis known the current maximum becomes, with butnegligible error, from (16)
I = CEco. (19)
It follows, then, that for a given alternator the cur-rent output through the grid resistance R is linearlyproportional to the battery potential E and to 4the
frequency.
DESCRIPTION OF ALTERNATOR
The assembled view is shown in Fig. 3. The rotorand stator designs are shown in Fig. 4. The stator
Fig. 3-Assembled view of the electrostaticlow -frequency alternNtor.
consists of a metal -foil pattern mounted on and in-sulated from a ground steel disk. The foil is insulatedfrom the disk by a thin sheet of paper and a tar -compound adhesive which secures the foil firmly tothe paper and the disk.

150 'Proceedings of the I.R.E.
The ordinates of the pattern are measured fromthe inside of the ring radially toward the center of
Fig. 4-Rotor and stator designs of thelow -frequency alternator.
the disk and are plotted for a total of 180 degrees.The expression for plotting the ordinates is given by
y = R - \/R2 - (2RH - H2) sin 0, (20)
where y is the ordinate, R the radius from the centerof the disk to the inside circumference of the ring,H the maximum ordinate, 0=xS/R where x is arclength along the circumference having radius R, andS the number of sectors or patterns per disk; in thiscase S=1. The derivation of (20) was given by theauthors in a previous paper;' it is thus sufficient tostate here that the result gives a sinusoidal changein coincident area as the rotor sector passes over thestator pattern.
The rotor sector is mounted on a rotor disk in thesame manner as the stator pattern is mounted on thestator disk. The sector with its edges radially cut, asshown, occupies one half of the rotor area.
This type of mounting serves the dual purpose ofaffording complete shielding and directing the elec-trostatic flux lines in such a fashion that the capaci-tance is practically proportional to the coincidentarea of the rotor and stator sectors; thus the capaci-tance variation is sinusoidal in nature and the ex-pression as set forth by (18) is satisfied.
The stator -pattern ring extends beyond the rotorso as to permit connection to a grid -resistance leadwithout distorting the electrostatic field. The rotorsector is connected to a battery for potential supply
I E. B. Kurtz and M. J. Larsen, "An electrostatic generator,"Trans. A.I.E.E. (Elec. Eng.), vol. 54, pp. 950-955; September,(1935).
by means of a light brush, not shown, which rides onthe slip ring. All other parts of the model aregrounded.
The stator disk is supported by three hard -rubberrings, each of which has a hole bored off center andslides on a rod so that centering and separation dis-tance from the rotor are easily controlled. Thedimensions of the alternator may be estimated bycomparison with the foot -scale shown at the bottomof the assembled view. While this model was drivenby means of a pulley with belt drive, any drive issatisfactory which does not transmit excessive vibra-tion to the rotor.
CALIBRATION AND OPERATION
The circuit parameters for the alternator just de-scribed were approximately
C=50 micromicrofarads when rotor and statorwere relatively close,
Co = 200 micromicrofarads,R=0.5 megohm or less,co =300 or less, andE=0 to 300 volts.
These values satisfy the condition imposed by (12)and make CoRco so small that (16) may be writtenas (19). Thus the voltage across the grid resistor be-comes
Eg = IR = CERco. (21)
If facilities are available for measuring C accur-ately, no further calibration is necessary, assuming,of course, that E, R, and w are known. C, however,can be measured, using (21), by means of a vacuum -tube voltmeter. The alternator is run at a relativelyhigh speed so that a frequency of 40 or 50 cycles persecond is generated; at this frequency the voltmeter,across R, may be read, and knowing the other values,C may be computed. Once found, assuming C is of avalue that satisfies (12), it remains the same andmay be used in (21) at any frequency. Thus A, maybe controlled by the three remaining independentvariables, namely, E, R, and w.
The wave form will be equally good at all fre-quencies below the upper limit because the electro-static field between rotor and stator is purely a spacefunction. Hence frequencies of only fractional per-iodicity may be generated with assurance that theyare relatively pure sine waves.

Characteristics of the Ionosphere at Washington,D.C., December, 1938*
T. R. GILLILAND t, ASSOCIATE MEMBER, I. R. E., S. S. KIRBYt, ASSOCIATE MEMBER, I. R. E.,AND N. SMITHf, NONMEMBER, I. R. E.
DATA on the critical frequencies and virtualheights of the ionosphere layers during De-cember are given in Fig. 1. Fig. 2 gives the
monthly average values of the maximum frequencies500
x 400
5 300-J< Z 200
FiF
1-
100
F
015000
14000
13000
12000
16000
9000
8000
7000
6000
5000
4000
3000
2000
1000
00 2
DEC. 1038
f;
IW
- AVERAGE FORUNDISTURBED DAYS
f;
IfE
12 14 18
EST
Fig. 1 -Virtual heights and critical frequencies of the ionospherelayers, December, 1938.
4 6 8 ro 18 20 22 0
TABLE IIONOSPHERE STORMS (APPROXIMATELY IN ORDER OF SEVERITY)
Date andhour E.S.T.
hF beforesunrise
(km)
Mini-mum
a beforesunrise
(kc)
Noong.(kg)
Magneticcharacter' Iona -
spherechacter200-12
G.M.T.12-24
G.M.T.
Dec.10 (after 2100) - - - 0.5 1.1 0.311 (until 0600) 354 3600 - 0.4 0.3 0.3
20 (0000 to 0600) 324 3500 - 0.4 0.6 0.2
19 (0000 to 0600) 332 3800 - 0.8 0.7 0.2
2 (after 1800) - - - 0.2 0.8 0.23 (until 0600) 266 3800 - 0.9 1.0 0.2
For comparison:Average for un-
disturbed days 283 4480 - 0.2 0.2 0.0
1 American magnetic character figure, based on observations of sevenobservatories.
2 An estimate of the severity of the ionosphere storm at Washington on anarbitrary scale of 0 to 2, the character 2 representing the most severe disturbance.
* Decimal classification: R113.61. Original manuscript re-ceived by the Institute, January 10, 1939. These reports haveappeared monthly in the PROCEEDINGS starting in vol. 25, Sep-tember, (1937). See also vol. 25, pp. 823-840, July, (1937).Publication approved by the Director of the National Bureau ofStandards of the U. S. Department of Commerce.
t National Bureau of Standards, Washington, D. C.
which could be used for sky -wave radio communica-tion by way of the regular layers. Fig. 3 gives the
52
48
44
36
32
28
24
20
16
12
DEC. 1938
NUM UM NM 111111111111
NUM 111111111111111111111111111111111
DIMMOM
ION kSdrirE
lMU IN
Nummirir2000 km
1111111111111111110211111111111M111111111111111111111111111111111111r 1500 k m 11113 MINIMmumwriiirealmiNsum
1000 km
500 km01111111
0 k m
Milt% \L\kill
0 2 4 6 8 10 12 14 16 18 20 22 0
LOCAL TIME AT PLACE OF REFLECTION
Fig. 2 -Maximum usable frequencies for radio sky -wave trans-mission; averages for December, 1938, for undisturbed days,for dependable transmission by the regular F and F2 layers.
1.5
CC
> 1.4
CD 1.3tr
6 1.2z
1.1
0F- 1.0
o 0,9
0 0.8
0
DEC. 1938
-..._.-- DISTURBED HOURS
NIGHT
\t..
DAY ->'----s:1...AVERAGE...
***....
".
---__ -....
.. -. ......
.............
....."'
0'7010 20 30 40 50 60 70 80 90 100
PERCENTAGE OF TIME
Fig. 3 -Distribution of critical frequencies (and approximatelyof maximum usable frequencies) about monthly average.Abscissas show percentage of time for which the ratio offN or 1-1,2 to the undisturbed average exceeded the valuesgiven by the ordinates. The graphs give data as follows: solidline, 452 hours of observations on undisturbed nights between1800 and 0900 E.S.T.; dashed line, 32 hours between 1000and 1700 E.S.T. on Wednesdays, all undisturbed; dotted line,37 disturbed hours listed in Table I.
February, 1939 Proceedings of the I.R.E. 151

152 Proceedings of the I.R.E.
TABLE IISUDDEN IONOSPHERE DISTURBANCES
G.M.T.Relative
Begin-ning of
fade -outEnd
Date1938
Location oftransmitter
intensityat mini -mum'
Remarks
Dec.5 1420 1510 Ohio, Mass., D.C. 0.016 1618 1700 Ohio, Mass., D.C. 0.0 Terr. mag. pulse17 1813 1850 Ohio, Mass., D.C. 0.0 Terr. mag. pulse
1 Ratio of received field intensity during fade-out to average field intensitybefore and after; for station W8XAL, 6060 kilocycles, 650 kilometers distant.I Terrestrial magnetic pulse, observed on magnetograms from CheltenhamObservatory of the United States Coast and Geodetic Survey, simultaneouswith the radio fade-out.
distribution of the hourly values of F- and F2 -layercritical frequencies (and approximately of the maxi-
mum usable frequencies) about the average for themonth. The ionosphere storms and sudden ionospheredisturbances are listed in Tables I and II, respec-tively. The ionosphere storms in December were verymild and occurred during the night hours only.
As is usual in winter, sporadic -E reflections werenot very prevalent during December. A burst ofstrong sporadic -E reflections above 10 megacycleswas observed at vertical incidence around 1800E.S.T. December 4. Strong sporadic -E reflectionswere also observed up to 8 megacycles during thelate evening hours of December 14 and some of theearly morning hours of December 15.

Institute News and Radio Notes
Board of DirectorsThe annual meeting of the Institute
Board of Directors was held on January 4and those present were R. A. Heising,president; H. H. Beverage, Ralph Bown,F. W. Cunningham, Alfred N. Goldsmith,Virgil M. Graham, 0. B. Hanson, C. M.Jansky, Jr., F. B. Llewellyn, HaradenPratt, B. J. Thompson, and H. P. West -man, secretary.
Melville Eastham and H. P. Westmanwere appointed treasurer and secretary,respectively, to serve during 1939.
Alan Hazeltine, L. C. F. Horle, A. F.Murray, A. F. Van Dyck, and P. T. Weekswere appointed to serve as directors dur-ing 1939.
On approval of the Admissions Com-mittee, N. B. Fowler, A. R. Hodges, J. R.Poppele, N. C. Robertson, and D. P. Rowwere transferred to Member grade andL. S. Hall and Max Knoll were electeddirectly to that grade.
Twenty-six applicants for Associate,one for Junior, and twenty-two for Stu-dent membership were approved.
The personnel of committees to serveduring 1939 was approved.
It was agreed that during 1939 mem-bers dropped for nonpayment of dues dur-ing the past would be permitted to resumemembership without the payment of anew entrance fee.
A budget to govern the fiscal opera-tions of the Institute during 1939 wasadopted.
W. Noel Eldred, chairman of the SanFrancisco Section, was designated chair-man of the committee to arrange for anational convention to be held in SanFrancisco on June 27, 28, 29, and 30, 1939.This convention will be in addition to theannual convention to be held in New YorkCity late in September.
I.R.E.-U. R. S. I. Meeting
The annual joint meeting of the Insti-tute of Radio Engineers and the AmericanSection of the International ScientificRadio Union will he held in Washington,D. C., on April 28 and 29, 1939. This willbe a two-day meeting. Meetings of otherimportant scientific societies will be heldin Washington during the same week.Papers on the more fundamental andscientific aspects of radio will be pre-sented. The program will be published inthe April issue of the PROCEEDINGS. Thiswill necessitate the submission of titles tothe Committee not later than February21. It is desirable that abstracts of notover 200 words be submitted with the
February, 1939
titles. Correspondence should be addressedto S. S. Kirby, National Bureau of Stand-ards, Washington, D. C.
Committees
Annual ReviewThe following technical committees
met and completed their reports on de-velopments during 1938. These reports areto be given final consideration by theAnnual Review Committee prior to theirbeing submitted for publication in thePROCEEDINGS in March.
ElectroacousticsThe Technical Committee on Electro-
acoustics met on January 10 and thosepresent were H. P. Westman, acting chair-man and secretary; J. T. L. Brown, andH. F. Olson.
ElectronicsThe Technical Committee on Electron-
ics met on January 6. P. T. Weeks, chair-man; R. S. Burnap, H. P. Corwith, K. C.DeWalt, Ben Kievit, F. R. Lack, G. D.O'Neill, B. J. Thompson, and H. P.Westman, secretary, were present.
A rearrangement of executive personnel of theHazeltine Service Corporation names W. A.MacDonald as vice president in charge of en-gineering; Harold A. Wheeler, vice presidentand chief consulting engineer; and Daniel E.Harnett, chief engineer. The photographabove shows, left to right, Messrs. Harnett,MacDonald, and Wheeler standing in front ofthe new laboratory at Little Neck, LongIsland, N. Y. The laboratory planned forcompletion in the Spring will accommodate astaff of fifty employees and is about twice aslarge as the present I3ayside laboratory whichIt will replace.
Radio ReceiversD. E. Foster, chairman; C. R. Bar-
hydt, D. D. Israel, J. D. Parker (repre-senting E. K. Cohan), W. E. Reichle(representing H. B. Fischer), A. E. Thies-sen, Lincoln Walsh, and H. P. Westman,secretary, were present at a meeting of theTechnical Committee on Radio Receiverson December 14.
Television and FacsimileThe Technical Committee on Televi-
sion and Facsimile met on January 11 andthose present were E. K. Cohan, chair-man; Maurice Artzt (representing C. J.Young), H. S. Baird, J. C. Barnes, R. R.Batcher, J. L. Callahan, A. B. DuMont,W. G. H. Finch, D. E. Foster, C. W. Horn,A. G. Jensen, I. J. Kaar, H. M. Lewis,R. E. Shelby, and H. P. Westman, secre-tary.
Subcommittee on Facsimile. The Sub-committee on Facsimile operating underthe Technical Committee on Televisionand Facsimile met on December 13. Themeeting was attended by W. G. H. Finch,chairman; R. R. Batcher, F. R. Brick, Jr.,J. L. Callahan (representing C. J. Young),R. H. Marriott (guest), H. C. Ressler(representing J. V. L. Hogan), and H. P.Westman, secretary.
Subcommittee on Television. Twomeetings of the Subcommittee on Televi-sion operating under the Technical Com-mittee on Television and Facsimile wereheld in the preparation of its report.
The first meeting on December 12 wasattended by P. C. Goldmark, chairman;R. B. Dome (representing I. J. Kaar),G. F. Fernsler (representing P. T. Farns-worth), H. M. Lewis, R. E. Shelby (alsorepresenting E. W. Engstrom), and H. P.Westman, secretary.
The second meeting was on January 5and was attended by P. C. Goldmark,chairman; A. B. DuMont, E. W. Eng-strom, G. F. Fernsler (representing P. T.Farnsworth), I. J. Kaar, A. F. Murray,R. E. Shelby, J. C. Wilson (guest), J. D.Crawford, assistant secretary; and H. P.Westman, secretary.
Electronics ConferenceF. R. Lack, chairman; R. M. Bowie,
F. B. Llewellyn, G. A. Morton, B. J.Thompson, and H. P. Westman, secretary,attended a meeting of the committee hav-ing charge of arrangements for the elec-tronics conference. Final decisions weremade for the meeting to be held in NewYork City on January 13 and 14.
Proceedings of the LR.T. 153

154 Proceedings of the I.R.E. February
Sections
AtlantaJ. W. Hillegas, transmitter engineer
at WSB, presented a paper on "Terman'sHigh -Efficiency Grid -Modulated Ampli-fier." He reviewed briefly the various mod-ulation systems commonly used outliningtheir advantages and disadvantages. Hethen presented a detailed analysis of thetheory and practical circuit for a high -efficiency grid -modulated amplifier. A50 -watt -carrier transmitter in which thefinal amplifier was grid modulated andwhich operated into a dummy load wasdemonstrated. By use of plate- and grid -current meters and a cathode-ray oscillo-scope, the effect of tuning adjustments onmodulation and output was demonstrated.Inverse feedback was applied to show theremarkable decrease in audio-frequencydistortion which resulted.
The meeting was held at WSB andrefreshments were served through thecourtesy of the station.
November 17, 1938-C. F. Daugherty,chairman, presiding.
Buffalo -Niagara"The Road Ahead for Television," a
paper by I. J. ICaar of the General ElectricCompany, was read by R. E. Moe of thatorganization as the author was unable tobe present.
The paper covered past and currentactivities in the television field and pointedout trends and probable future develop-ments. It covered such subjects as trans-mission frequencies, channel band-widths,the number of lines per frame and framesper second, power, and propagation char-acteristics. It included both British andUnited States developments in stationaryand mobile transmission and reception.
December 15, 1938-H. C. Tittle,chairman, presiding.
Chicago"Site and Installation of the New WLS-
WENR Transmitter" was the subject ofa paper by H. B. Couchene, engineer ofthat station. It concerned the selection ofthe site, building layout, antenna andtransmission line considerations, and towerfacilities.
This was followed by an "EngineeringDescription of the RCA 50 -Kilowatt High -Fidelity Transmitter for WLS-WENR"which was presented by J. E. Young of thetransmitter engineering department of theRCA Manufacturing Company.
November 30, 1938-J. E. Brown,chairman, presiding.
E. H. Conklin, associate editor ofRadio, presented a "General Review ofCharacteristics of the Ionosphere." Thispaper was based chiefly on the contents ofthe paper by the same author appearing
in the January issue of the PROCEEDINGS.As this was the annual meeting of the
section, officers for the coming year wereelected. V. J. Andrew, consulting engineer,was named chairman; E. Kohler, Jr. ofthe Ken-Rad Tube and Lamp Corpora-tion, was elected vice chairman; and G. I.Martin of the RCA Institutes was desig-nated secretary -treasurer.
December 16, 1938-J. E. Brown,chairman, presiding.
CincinnatiG. F. Leydorf, transmission engineer
of WLW-WSAI-W8XAL, presented apaper on "Sky -Wave Propagation atBroadcast Frequencies." There was firstconsidered the effect of the height of thereceiving and transmitting antennas andof the earth's conductivity on the strengthof signals. It was pointed out that the re-flected wave from the earth affected thesky wave somewhat differently at thesending than at the receiving antenna. Itwas also stated that the coefficient of re-flection at the ionized layer does not varygreatly at nighttime because of changesin the angle of incidence, through a rangeof angles that are important, but that a lowcoefficient of reflection caused by a changein ion content, such as experienced in thedaytime, would result in an appreciablereduction of the sky wave. The paper wasdiscussed by Messrs. Osterbrock, Taylor,Wells and others.
December 13, 1938-R. C. Rockwell,chairman, presiding.
Connecticut ValleyA paper on "Frequency Stability" was
presented by Arnold Peterson of the Gen-eral Radio Company. It dealt chiefly withultra -high -frequency negative -grid triodeoscillators operating around 100 mega-cycles. Factors affecting stability weredivided into, those affecting the electricalcharacteristics and those involving themechanical characteristics of the tube andassociated circuit elements.
The necessity for a high capacitance -to -inductance ratio and high Q wasstressed in discussing the electrical char-acteristics. The need for special tank-cir-cuit construction was outlined in the con-sideration of the mechanical character-istics particularly with regard to oscilla-tors for laboratory standard use. The per-formance and constructional details of anumber of existing oscillators were illus-trated and included several for operationbetween 300 and 600 megacycles.
December 8, 1938-E. R. Sanders,chairman, presiding.
DetroitJames Casman of the Federal Tele-
graph Company, presented "An InformalDiscussion of Vacuum Tubes with Partic-ular Emphasis on Transmitting Tubes."It was pointed out that although a good
knowledge of theory is essential in thedevelopment and design of a vacuum tube,experience in that work plays an impor-tant part in the development of satisfac-tory designs.
The practical limits of power and fre-quency were explained and methods em-ployed by various manufacturers to extendthe range of tubes were summarized. Vari-ous circuits useful for obtaining operationat high frequencies were shown.
A one -kilowatt water-cooled tube withthe plate cut away to show the internalconstruction was used to show many of thepoints which were brought out regardingthe construction of these tubes.
November 18, 1938-E. H. Lee, chair-man, presiding.
Emporium"The Road Ahead for Television" was
presented by I. J. Kaar. A summary ofthis paper is given in the report on theBuffalo -Niagara Section in this issue.
As this was the annual meeting of thesection, new officers were elected. R. K.McClintock of the Hygrade Sylvania Cor-poration was named chairman; M. S.May of Spear Carbon Company, vicechairman; and D. R. Kiser, secretary -treasurer.
December 12, 1938-A. W. Keen,chairman, presiding.
Los Angeles"New NBC Facilities in Hollywood"
was the subject of a paper by R. F. Schutz,design engineer in charge of equipment in-stallation for the National BroadcastingCompany. It covered the new HollywoodRadio City installation which featuresfour auditorium -type stage studios eachseating 350 persons, four nonaudience-type studios for large productions, as wellas several small utility studios. The tech-nical problems in the design and construc-tion of these studios were described.
M. S. Adams, Hollywood field super-visor, then presented an "Exhibition andDescription of NBC Short -Wave FieldEquipment." He described various typesof short-wave equipment used for broad-cast pickups in the field. They included the"Beer -Mug" transmitter, a pack trans-mitter, and a 30 -watt utility transmitter,all operating on ultra -high frequencies.Another utility transmitter operating inthe high -frequency band was described.Various types of receivers to be used withthese transmitters were displayed.
Harry Saz, sound effects chief, pre-sented a "Sound Effects Demonstrationand Exhibition." Numerous methods ofproducing sound effects required in broad-casting were described and demonstrated.The meeting was closed with an inspectionof the new studios and equipment.
A. H. Saxton, western divison engineerfor the National Broadcasting Company,introduced the various speakers.

1939 Institute News and Radio Notes 155
November 22, 1938-R. 0. Brooke,chairman, presiding.
Montreal"Graphical Network Synthesis" was
the subject of a paper by E. A. Laport ofthe high -power broadcast -transmitter sec-tion of the RCA Manufacturing Company.He described simple graphical methods forobtaining directly and rapidly the requiredcircuit values for any given impedancetransformation with either specified orrandom phase shift. With ordinary care onthe drawing board accuracy equal to thatobtained with a ten -inch slide rule will re-sult. The graphical method is much morerapid and once a diagram has been con-structed, the result of any variation in theparameters may readily be seen. Themethod is particularly useful in calcula-tions of the type met with in the calibra-tion of radio ranges.
November 9, 1938-S. Sillitoe, chair-man, presiding.
New OrleansElmo Voegtlin, manager of the service
department of Walther Brothers, pre-sented a paper on the "Philco MysteryControl." The design and construction ofthe device was described and a dismantledunit was available for inspection. Thespeaker then presented a brief review ofthe design of a high -gain preamplifier toraise the output of a microphone from -80decibels to zero level.
November 22, 1938-G. H. Peirce,chairman, presiding.
Philadelphia"Some Contributions of Radio to Other
Sciences" was the subject of a paper byJ. H. Dellinger, chief of the radio sectionof the National Bureau of Standards. Theapplication of radio principles to meteor-ological investigations and weather fore-casting was treated in detail. It waspointed out that much improvement inthe collection of important data has comeabout through the use of automaticallyoperated radio equipment carried into thehigh atmosphere by small balloons for thepurpose of reporting to the ground themeteorological conditions encountered.
The conditions of the ionosphere arcbeing revealed also by the behavior ofradio waves and this has contributed muchnew knowledge of events which thoughtaking place on the sun affect the iono-sphere.
A description was given of radio waveswhich were reflected from some source farbeyond the earth's atmosphere. Pictureswere shown of unusually interesting erup-tions of the sun's gases together withcurves plotted to permit the study of theeffects of these disturbances on electricalcurrents in the earth.
This meeting was held jointly with theFranklin Institute in its auditorium.
December 8, 1938-R. S. Hayes, vice
chairman, presiding for the Institute, andMr. Weatherill for the Franklin Institute.
C. J. Young and Maurice Artzt of theRCA Manufacturing Company, presenteda paper on "Broadcast Facsimile." Mr.Artzt described the circuit arrangementsand the functions performed by the vari-ous parts of the equipment.
Mr. Young then considered the com-mercial prospects and difficulties en-countered in furnishing a facsimile service.Field tests now being conducted are prom-ising as half -tone pictures are being han-dled with fidelity superior to the averagenewspaper reproduction. The receivingpaper is VI inches wide and comes fromthe machine at a rate of 3 feet per hour.An 8i -inch by 12 -inch sheet may be pro-duced every twenty minutes. There are125 lines per inch in each reproduced rec-ord.
The transmitter and receiver are auto-matically synchronized when operated onthe same power system. Otherwise, a spe-cial synchronizing adjustment may be usedon the receiver.
Scanning is accomplished by collectingin a photoelectric tube the reflectionfrom the small spot of light directed at thecopy. The output of the photoelectrictube is amplified and its wave shapechanged to give a modulating signal pro-portional to the color of the spot scanned.The received signals actuate a carbon -paper recorder. The white recording paperand carbon paper are fed from rolls andpassed between a rotating helix and aprinter bar. The user is required to re-plenish the rolls of paper after about onehundred hours of operation.
Two receivers were operated duringthe meeting in the lecture hall located inthe business section of Philadelphia andsubject to a high local noise level. Thetransmitter, of one -kilowatt rating, waslocated in Camden. Operation was at 41megacycles and the transmitting antennawas approximately 130 feet above streetlevel.
January 5, 1939-H. J. Schrader,chairman, presiding.
PortlandA general discussion of the paper on
"A Direct -Reading Radio -Wave -Reflec-tion -Type Absolute Altimeter for Aero-nautics," was led by E. R. Meissner ofUnited Radio Supply, Inc. The secondpaper which was reviewed was "TheBridge -Stabilized Oscillator," by L. A.Meacham. This review was lead by L. M.Belleville. Both of these papers were pub-lished in the PROCEEDINGS.
This was the annual meeting and itwas voted that the temporary officers beelected to serve for 1939. These arc H. C.Singleton of KGW-KEX, as chairman;Marcus O'Day, associate professor ofphysics at Reed College, as vice-chairman;and E. R. Meissner of United RadioSupply, as secretary -treasurer.
December 28, 1938-11. C. Singleton,chairman, presiding.
San Francisco"High -Voltage High -Frequency Phe-
nomena," was the subject of a paper bySidney Pickles, an engineer for the MackayRadio and Telegraph Company. It coveredrecent studies of high -voltage phenomenaat a frequency of 13 megacycles. An in-vestigation of breakdown between needleand sphere gaps, and between parallelwires was discussed. It was pointed outthat the main notable difference betweenlow- and high -frequency breakdown wasthe absence of visible corona preceding theactual breakdown at high frequencies.Test data showed good agreement betweenthe high -frequency arc -over gradient andwhat has been termed the 60 -cycle "dis-ruptive critical gradient." The paper wasconcluded with a discussion of the im-provement in insulation of high -frequencycurrents that may be expected as a resultof these studies.
The election of officers was held as thiswas the annual meeting of the section.F. E. Terman, head of the electrical en-gineering department of Stanford Univer-sity, was named chairman; Carl Penther,of the Shell Development Company, wasdesignated vice-chairman; and LeonardBlack of the electrical engineering depart,ment of the University of California, waselected secretary -treasurer.
December 21, 1938-Noel Eldred,chairman, presiding.
SeattleR. 0. Bach, an engineer for the Pacific
Telephone and Telegraph Company, pre-sented a paper on "Multichannel CarrierTelephone Systems." It covered a newsystem in which the modulation and de-modulation are achieved by copper -oxideunits and the necessary selectivity ob-tained through the use of quartz -crystaloscillators. Each of the twelve incomingchannels is passed into a balanced modu-lator and one of the resultant side bands isselected by a crystal filter. These twelvesingle -side -band signals lie in adjacentbands from about 80 to 120 kilocycles. Theentire group is then passed through an-other balanced modulator and filter result-ing in a combined channel from abouttwenty to sixty kilocycles which is trans-mitted over the wire lines. This process isreversed at the receiving end. Separatewire lines are used for the two directions oftransmission to avoid the necessity of two-way repeaters and hybrid coils. Character-istics of the copper -oxide units and quartz -crystal filters were described.
In the election of officers for 1939,R. 0. Bach of the Pacific Telephone andTelegraph Company, was named chair-man; Robert Walker was elected vicechairman; and Karl Ellerbeck of thePacific Telephone and Telegraph Com-pany was made secretary -treasurer.

156 Proceedings of the I.R.E. February
December 22, 1938-A. R. Taylor.chairman, presiding.
WashingtonA series of papers on ultra -high fre
quencies was presented. The first, byHarry Diamond of the National Bureau ofStandards, covered "Applications of Ultra -High Frequencies to the Field of Meteor-ology." It covered the use of meteorologi-cal sounding balloons towing lightweighttransmitters and instruments into the up-per atmosphere. Radio pulses transmittedto the ground enable various conditions inthe upper atmosphere to be recorded auto-matically. Many upper -air phenomenasuch as cosmic -ray counts, ozone distribu-tion, potential gradients, and ultravioletlight are being studied.
P. J. Kibler of the Washington Insti-tute of Technology then discussed "Ultra -High -Frequency Aids to Flying IncludingInstrument Landing Systems." A 400 -watt ultra -high -frequency transmitterused in connection with a landing -beamsystem was described. Performance curvesand constructional details were given.
"Ultra -High -Frequency Receiver De-velopment," was treated by P. D. McKeelof the Civil Aeronautics Authority. Hedescribed a superheterodyne receiver foraircraft use. Tuned coaxial lines were usedfor the oscillator, radio -frequency am-plifier, and detector. A five -megacycleintermediate frequency gives stable per-formance and a sensitivity of about threemicrovolts in the range between 60 and120 megacycles was obtained. A model ofthe receiver was on display.
The symposium was closed with in-formal remarks on "Ultra -High -FrequencyWave Propagation" by 0. Norgorden ofthe Naval Research Laboratory, who re-viewed briefly all field -strength formulasfor application to ultra -high -frequencypropagation. It was pointed out that sim-plified versions could be used in manypractical cases. The laws of propagationwithin the optical range, just beyond it,and at somewhat greater distances werediscussed.
In the election of officers, G. C. Gross,of the Federal Communications Commis-sion staff, was designated chairman; L. C.Young, of the Naval Research Laboratory,was elected vice chairman; and M. H.Biser, of the Capitol Radio EngineeringInstitutes, was named secretary -treasurer.
December 12, 1938-E. H. Rietzke,chairman, presiding.
"A New Hard -Tube Relaxation Oscil-lator" was the subject of a paper by D. H.Black who is in charge of the valve labora-tory of Standard Telephones and Cables,Ltd., of London, England. In it, Dr. Blackdiscussed the development of a newdouble -grid tube and associated circuitsfor use as a relaxation oscillator for tele-vision applications. It was pointed outthat this oscillator has the advantage of amuch shorter retrace time and is not criti-
cal as to circuit constants. During the dis-cussion, a number of features of the present405 -line television transmissions in Eng-land were described. It was estimated that20,000 television receivers are in operationin London. It was stated that the fidelityof the received pictures was generallyacceptable.
January 9, 1939-G. C. Gross, chair-man, presiding.
MembershipThe following indicated admissions to
membership have been approved by theAdmissions Committee. Objections to anyof these should reach the Institute officeby not later than February 28, 1939.
Admission to Associate (A),Junior ( J), and Student (S).
Abajian, H. B., (S) 113 Lyon Ave., EastProvidence, R. I.
Aikman, J., (S) 66 Ormonde Ave., Glas-gow S.4, Scotland.
Aspin, J. J. E., (A) 14 Carthusian Rd.,Cheylesmore, Coventry, Eng-land.
Bennett, R. M., Jr., (A) 4541 SaratogaAve., Downers Grove, Ill.
Biosca, L. F., (A) 1 Bank St., New York,N. Y.
Boucher, A. E., (A) 20 Prospect St.,Nashua, N. H.
Brannin, R. S., Jr., (A) Geophysical Re-search Oiland Refining Company, Houston,Tex.
Brant, C. M., (A) Radio Station, New-foundland Airport, Newfound-land.
Carson, V. S., (S) 538 Williams St., PaloAlto, Calif.
Chew, T. W., (A) 120 East Ave. 26, LosAngeles, Calif.
Chorley, J. M., (A) 19 Russell Hill, Purley,Surrey, England.
Coleman, C. F., (S) 15 Ellery St., Cam-bridge, Mass.
Cork, B. B., (A) 262 N. Walnut St., EastOrange, N. J.
DeRyder, H., (A) RCA ManufacturingCompany, Inc., Harrison, N. J.
DiMarco, A., (A) Valle 1022, Buenos Aires,Argentina.
Easton, I. G., (S) 13 Pigeon Hill St.,Pigeon Cove, Mass.
Eldredge, D., (A) 156 W. Second NorthSt., Salt Lake City, Utah.
Ewing, L. M., (S) 2099 Neil Ave., Colum-bus, Ohio.
Fisher, S. T., (A) Northern Electric Com-pany, 1261 Shearer St., Mon-treal, Que., Canada.
Freundlich, H. F., (A) 20 Guessens Rd.,Welwyn Garden City, England.
Gaalaas, G. L., (A) Empire Sheet and TinPlate Company, Mansfield, Ohio.
Garman, R. L., (A) New York University,Washington Square East, NewYork, N. Y.
Harrison, C. W., (5) Electrical Engineer-ing Building, Lehigh University,Bethlehem, Pa.
Hogg, J. E., (S) 4339-11 Ave., N.E.,Seattle, Wash.
Holman, W. A., (S) 334 E. 15 St., Oak-land, Calif.
Holstrom, A., (A) 674-56 St., Brooklyn,N. Y.
Houston, W. M., (J) 2 Ascog St., Glasgow,S.2, Scotland.
Howe, R. H., (A) 745 S. Main St., Butte,Mont.
Hutchins, W. R., (S) 606 W. 113 St., NewYork, N. Y.
Koch, R. F., (S) Bard College, Annandale -on -Hudson, N. Y.
Law, H. B., (A) 59 Church ver., LondonN.W.9, England.
Mautner, R., (A) 2288 Mott Ave., FarRockaway, L. I., N. Y.
McMillin, W. R., (A) 8 Sheperd Ave.,Beechwood Heights, BoundBrook, N. J.
Morrow, C. T., (S) 72 Perkins Hall, Cam-bridge, Mass.
Nickelsen, J. C., (A) Stensgaten 25, Oslo,Norway.
Peterson, D. R., (S) 719 Warren St., Red-wood City, Calif.
Plummer, C. B., (A) 252 Concord St.,Portland, Maine.
Procter, E. N., (S) 1324 College Ave., PaloAlto, Calif.
Quarfoot, H. B., (A) 3838 N. LakewoodAve., Chicago, Ill.
Roxburgh, W. G., Jr., (S) 509 W. MaumeeSt., Angola, Ind.
Seely, S., (A) Electrical Engineering De-partment, College of the City ofNew York, 139 St. and Amster-dam Ave., New York, N. Y.
Smith, R. A., (S) 507 S. College St.,Angola, Ind.
Spence, A. E., (A) c/o Navy Office,Bombay, Indiana.
Summerford, D. C., (A) 3037 Wirth Ave.,Louisville, Ky.
Susskind, S. E. M., (A) 16 Dizengoff Rd.,Tel -Aviv, Palestine.
Taylor, H. L., (A) 72 Norfolk Ave., Galt,Ont., Canada.
Thomas, D. H., (A) University College,Nottingham, England.
Vangeen, A. I., (A) 138B Trafalgar Rd.,London S.E.10, England.
Wells, F. H., (A) 45 Frewin Rd., LondonS.W.18, England.
Wissenbach, J. M., (A) 1827 Clermont St.,Denver, Colo.
BooksElectrolytic Capacitors, by
Paul M. Deeley.Published 1938 by Cornell-Dubilier
Electric Corporation, South Plainfield, NewJersey. 286 pages, illustrated, cloth bind-ing. Price $3.00.

1939 Institute News and Radio Notes 157
The use of electrolytic condensers haspermitted a reduction in the size and costof not only radio receivers, but also manyother types of equipment. The object ofthis book is to take up the operating char-acteristics of these condensers, and to givea general outline of the chemical processesand the construction methods used withthese condensers. The book may serve toovercome the reluctance shown by manyengineers in using these condensers formany types of service. It should also showothers where not to use this type of capac-itor, as for instance in high -frequency by-pass applications.
All types seem to be taken up in de-tail, at least from the viewpoint of thosewho are not actively engaged in the manu-facture of condensers. The book is plenti-fully illustrated with photographs ofnumerous types and factory productionprocesses, and sketches of assembly de-tails.
R. R. BATCHERSt. Albans, Long Island, New York
"Eisenlose Drosselspulen,mit einem Anhang fiberHochfrequenz-Massekern-spulen" (Iron -Free InductiveCoils, with an Appendix onIron -Cored Coils for High Fre-quencies), by J. Hak, with anintroductory note by Pro-fessor Fritz Emde.Published by the K. F. Koehler Com-
pany, Leipzig, Germany. 316 pages with253 figures and 32 tables in the text.Price RM 28.
This treatise on inductive coils onc-siders the subject both from a theoreticaland a practical standpoint. The first eightchapters are devoted to the calculation ofself and mutual inductance of coils ofdifferent types. Something more than amere collection of formulas is attempted.Starting with derivations of the fundamen-tal Neumann formula and the Maxwellformula for the mutual inductance ofcoaxial circular filaments, the formulas forthe more complicated circuit elements arederived in such a way as to show their rela-tions to one another and the simpler basicformulas. A section on calculations forcircular coils is followed by one on coilswound on rectangular and polygonalforms. In another section, mutual induc-tance formulas are derived, both forcoaxial coils and for coils with parallel andinclined axes. In all cases, a survey is givenof the more important existing formulas,with references to their sources, and, forfacilitating numerical computations by theformulas, tables or graphs of functionsentering in the formulas are provided forcases where this is feasible.
Further chapters deal with the calcu-lation of the force exerted between coilscarrying current and for the forces actingon the turns of a coil due to currents in theother turns. Other sections give full treat-ment of the theory in such difficult casesas the calculation of skin effect and thecalculation of the self -capacitance of a coil.
The later portions of the book considerthe construction and design of coils to beused as current -limiting reactors and forprotective devices against voltage surges.A short chapter is devoted to a descriptionof methods for the measurement of the in-ductance, capacitance, and natural fre-
quency of coils.Strictly speaking, the subject of coils
with cores of magnetical materials lies out-side of the scope of the book as indicatedby its title. The author has, however, inview of the importance of this closely re-lated subject, included in an appendix asection on coils wound on cores composedof pulverized magnetic alloys, mixed witha binder, and compressed to form a highpermeability core. Such coils are muchused in audio -frequency circuits.
The book on the whole presents a verycomplete compendium of the essentials ofpresent-day knowledge of a subject con-cerning which information is for the mostpart to be obtained from articles scatteredthroughout the literature. A very valuablefeature of the book is the bibliography inwhich no less than 687 articles are listed inchronological order. Reference is made tothese by number in footnotes in the text.The figures and graphs of numerical datafor use in the 253 formulas are beautifullyexecuted and bound together at the backof the book. The caption of each figure isgiven in English as well as German. Fullindexes, one of authors and a German -English subject index are provided. Thesebilingual features should help to renderthe formulas of the book useful to English-speaking readers. This idea might havebeen still further developed if the im-portant formulas had been given captionsfor their ready identification by non -German readers.
The execution of the work throughoutgives evidence of no sparing of pains toproduce a useful reference book of hand-some appearance.
FREDERICK W. GROVERUnion College, Schenectady, New York

158 Proceedings of the I.R.E. February
Contributors
H. G. BOOKER
Henry George Booker was born onDecember 14, 1910, at Barking, Essex,England. In 1930 he received the B.A.(Hons.) degree from the University ofLondon, and was a scholar of Christ'sCollege, Cambridge, from 1930 to 1934,
CLEDO BRUNETTI
being Wrangler at the University of Cam-bridge in 1933. Mr. Booker was an AllenScholar at the University of Cambridgefrom 1934 to 1935, Smith's Prizeman in1935, and received the Ph.D. degree in1936. At the present time he is a Fellowof Christ's College and Faculty AssistantLecturer in Mathematics at the Universityof Cambridge. During his sabbatical year,1937-1938, he engaged in ionosphere re-search at the Department of TerrestrialMagnetism at the Carnegie Institution ofWashington. Mr. Booker is a Fellow of theCambridge Philosophical Society.
:Cledo Brunetti (A '37) was born April
1, 1910, at Virginia, Minnesota. He re-ceived the B.E.E. degree from the Univer-
sity of Minnesota in 1932 and the Ph.D.degree in 1937. From 1932 to 1936 he wasa Teaching Fellow in the department ofelectrical engineering at the University ofMinnesota and from 1936 to 1937, an in-structor. Since 1937 Dr. Brunetti has beenan instructor in electrical engineering at
H. A. CHINN
Lehigh University. He is a member of TauBeta Pi, Eta Kappa Nu, and Sigma Xi.
Howard A. Chinn (A '27-M '36) wasborn in New York City on January 5,
M. G. CROSBY
1906. He attended the Polytechnic Insti-tute of Brooklyn, later going to Massachu-setts Institute of Technology where hereceived the B.S. degree in 1927 and theM.S. degree in 1929. From 1927 to 1932he was a research assistant at Massachu-setts Institute of Technology. In 1932 Mr.Chinn became associated with the Colum-bia Broadcasting System where from 1932to 1933 he was research associate; from
1933 to 1934, radio engineer; 1934 to 1936,assistant to the Director of Engineering;and from 1936 to date, Engineer -in -Chargeof Audio Engineering.
Murray G. Crosby (A '25-M '38)was born at Elroy, Wisconsin, on Sep-tember 17, 1903. He attended the Uni-versity of Wisconsin from 1921 to 1925,and received the B.S. degree in electricalengineering in 1927. From 1925 to 1927 hewas with the Radio Corporation of Amer-ica, and from 1927 to date he has been withR.C.A. Communications, Inc.
H. A. FINKE
Herbert A. Finke was born October 28,1914. In 1934 he received the degree ofBachelor of Science in Physics. At thepresent time Mr. Finke is a fourth -year
0. H. GISH
student at the Massachusetts Institute ofTechnology.
Oliver H. Gish was born at Abilene,Kansas, on September 7, 1883. He received

1939 Institute News and Radio Notes 159
the B.S. degree from Kansas State Collegein 1908 and the A.M. degree from the Uni-versity of Nebraska in 1913. From 1911
to 1918 he was an instructor in mathe-matics and physics at the University ofNebraska. In 1918 he became researchengineer with the Westinghouse Electricand Manufacturing Company leavingthere in 1922 to go with the Departmentof Terrestrial Magnetism of the CarnegieInstitution of Washington where he isnow Assistant Director and Chief of Sec-tion of Terrestrial Electricity. Mr. Gishis a Member of the American Associationfor the Advancement of Science, AmericanGeophysical Union, Meteorological Soci-ety, Philosophical Society of Washington,
W. C. HAHN
Sigma Xi, and Washington Academy ofSciences. He is a Fellow of the AmericanPhysical Society.
W. W. HANSI?.N
W. C. I-Iahn (A '36) was born inCedarville, Illinois, in 1901. He receivedthe B.S. degree from Massachusetts Insti-tute of Technology in 1923. In 1922 and1923 he took the student engineeringcourse at the General Electric Company,
and in 1924 was sent to their Chicago officewhere he was in the transmission -line andrelay engineering department until 1932.Since 1933 Mr. Hahn has been in theirengineering general department at Schen-ectady.
William W, Hansen was born in 1909at Fresno, California. He received theA.B. degree in 1929 and the Ph.D. degree
L. M. HOLLINGSWORTH
in 1933 from Stanford University. Dr.Hansen was an instructor in physics atStanford University from 1930 to 1932;National Research Fellow from 1933 to1934; assistant professor of physics at
HARLEY IAMS
Stanford University from 1934 to 1937;and associate professor from 1937 to date.
Lowell M. Hollingsworth (A '37) wasborn at Portland, Oregon, on January 8,1907. He received the I3.S. degree in elec-trical engineering from Oregon State Col-lege in 1930 and the E.E. degree fromStanford University in 1935. From 1930
to 1932 Mr. Hollingsworth was with BellTelephone Laboratories. Since 1936 he hasbeen an instructor in engineering at SanFrancisco Junior College.
A. P. KING
Harley Jams (A '31-M '38) was bornon March 13, 1905, at Lorentz, WestVirginia. In 1927 he received the A.B. de-gree from Stanford University. Mr Jams
E. B. KURTZ
took the student course from 1927 to 1928,and from 1928 to 1930 was in the facsimileand television research department of theWestinghouse Electric and ManufacturingCompany. Since 1931 he has been doingtelevision research for the RCA Manu-facturing Company.
Archie P. King (A '30) was born inParis on May 4, 1901. He received the B.S.degree from California Institute of Tech-nology in 1927. From 1927 to 1930 he wasin the seismological research departmentof the Carnegie Institution of Washington,and from 1930 to date he has been withBell Telephone Laboratories. Mr. King isa Member of the American Institute ofElectrical Engineers.

160 Proceedings of the I.R.E.
E. B. Kurtz was born in 1894 at Cedar -burg, Wisconsin. He received the B.S. de-gree in electrical engineering in 1917 fromthe University of Wisconsin; the M.S. de-gree in 1919 from Union College; and thePh.D. degree in 1932 from Iowa StateCollege. From 1917 to 1919 he was withthe General Electric Company. Dr. Kurtzwas at the Iowa State College from 1919to 1925 and the Oklahoma Agriculturaland Mechanical College from 1925 to 1929.Since 1929 Dr. Kurtz has been Professor of
M. J. LARSEN
Electrical Engineering and Head of De-partment at the University of Iowa. He isa member of Tau Beta Pi, Sigma Xi, SigmaTau, and Phi Kappa Phi as well as being aFellow of the American Institute of Elec-trical Engineers and the American Asso-ciation for the Advancement of Science.
M. J. Larsen was born in 1909 atSpencer, Iowa. He received the B.S. degreein electrical engineering in 1933; the M.S.degree in 1934; and the Ph.D. degree in
1937 from the State University of Iowa.From 1928 to 1929 he was with the North-western Bell Telephone Company andspent the summer of 1937 in the researchdepartment of the Central CommercialCompany. Since 1937 he has been an in -
G. F. METCALF
structor in electrical engineering at theMichigan College of Mining and Tech-nology. He is a member of Sigma Xi, EtaKappa Nu, and the Society for Promotionof Engineering Education.
G. F. Metcalf (A '34-M '37) was bornon December 7, 1906, at Milwaukee, Wis-consin. He received the B.S. degree fromPurdue University in 1928, and that sameyear took the General Electric Company'sstudent engineering course. From 1929 to1931 Mr. Metcalf was in the researchlaboratory of that company and sincethen has been in their vacuum -tube engi-neering department.
George C. Southworth (M '26) wasborn at Little Cooley, Pennsylvania, onAugust 24, 1890. He received the B.S.degree in 1914 and the M.S. degree in 1916from Grove City College. In 1923 he wasawarded the Ph.D. degree from Yale Uni-versity. Dr. Southworth was assistantphysicist at the Bureau of Standards from1917 to 1918 and returned to Yale Univer-sity as an instructor from 1918 to 1923.He joined the research staff on radio com-munication of the American Telephone
G. C. SOUTHWORTH
and Telegraph Company in 1923 and wastransferred to Bell Telephone Laboratorieswhere he has been since 1935. In 1927 and1930 he was a De Forest (radio) lecturerat Yale University. He is a Member of theAmerican Physical Society and a Fellowfor the American Association for the Ad-vancement of Science.
For biographical sketches of T. R.Gilliland, S. S. Kirby, and Newbern Smith,see the PROCEEDINGS for January, 1939.
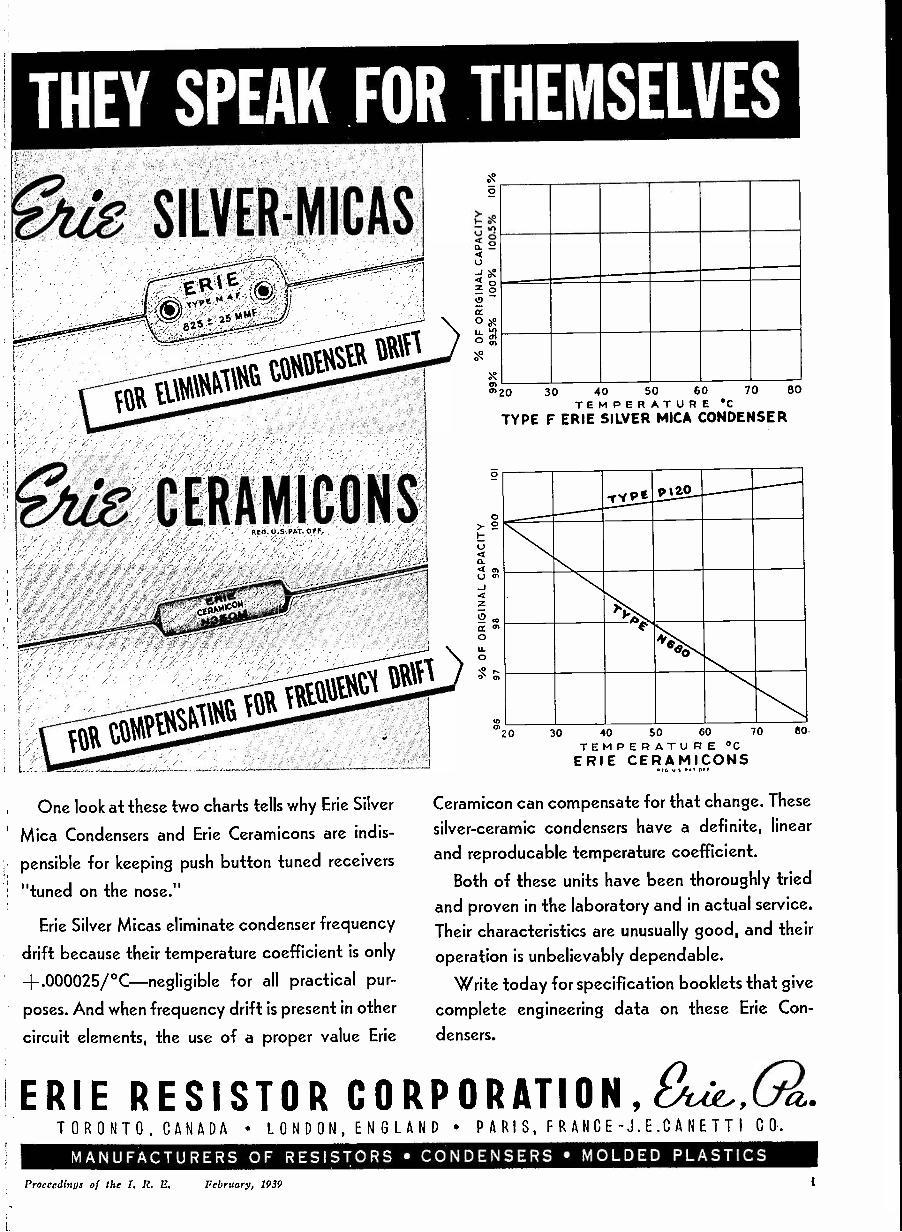
One look at these two charts tells why Erie Silver
Mica Condensers and Erie Ceramicons are indis-
pensible for keeping push button tuned receivers
"tuned on the nose."
Erie Silver Micas eliminate condenser frequency
drift because their temperature coefficient is only
+.000025/°C-negligible for all practical pur-
poses. And when frequency drift is present in other
circuit elements, the use of a proper value Erie
0O
o
0
0 gLa - a,
00
;,°'20
0°
U
CrU
Q
0LL
O
o
rn
30 40 50 60 70 80TEMPERATURE SC
TYPE F ERIE SILVER MICA CONDENSER
pe pi2.0
40
20 30 40 50 60 70 60.
TEMPERATURE °CERIE CERAMICONSat4 Y) A Of
Ceramicon can compensate for that change. These
silver -ceramic condensers have a definite, linear
and reproducable temperature coefficient.
Both of these units have been thoroughly tried
and proven in the laboratory and in actual service.Their characteristics are unusually good, and their
operation is unbelievably dependable.
Write today for specification booklets that givecomplete engineering data on these Erie Con-densers.
'ERIE RESISTOR CORPORATION,,TORONTO, CANADA LONDON, ENGLAND PARIS, FRANCE-J.E.CANETTI CO.
MANUFACTURERS OF RESISTORS CONDENSERS MOLDED PLASTICSProceedings of the I. R. E. February, 1939

Commercial Engineering DevelopmentsThese reports on engineering de-
velopments in the commercial fieldhave been prepared solely on thebasis of information received fromthe firms referred to in each item.
Sponsors of new developmentsare invited to submit descriptions onwhich future reports may be based.To be of greatest usefulness, theseshould summarize, with as muchdetail as is practical, the novel engi-neering features of the design. Ad-dress: Editor, Proceedings of theI.R.E., 330 West 42nd Street, NewYork, New York.
Noise and Field StrengthMeterA portable microvolter has been de-
veloped by Ferris* for measuring the fieldintensity of radio noise and useful signals.It is an amplifier -detector -type instrumentwith an indicating output meter and a self-contained calibrator for standardizing theover-all gain of the system. Signals may bepicked up by a 0.5 -meter rod or intro-duced, voltmeter fashion, at 2 input ter-minals.
Since noise levels may fluctuate rapidlyover wide ranges, the output meter has alogarithmic characteristic, obtained by theuse of a variable -mu tube. It covers the 3decades from 1 to 1000 microvolts or from100 to 100,000' microvolts, depending onthe setting of a multiplier switch.
By means of a panel switch, the char-acteristics of the rectifier-meter circuitsmay be changed from the "average -type"response required for carrier -voltage mea-surements to a quasi -peak type of responserequired to give readings that are approxi-mately proportional to the interferingeffectiveness of a noise wave. Theseweighted noise readings are stated interms of equivalent microvolts of carrier;that is, the noise reading in microvolts isthat value of carrier which would producethe same meter deflection.
The internal calibrator consists of avoltage generator that produces a uniform
*Ferris Instrument Corporation, Boonton NewJersey.
Ferris radio noise meter
ii
noise spectrum. No tuning of the instru-ment is required. The signal is derivedfrom the shot noise of a vacuum tubewhose space current has been limited bylowering the filament temperature.
The equipment is accurate to withinabout 3 decibels after standardizing withthe shot -noise calibrator. Measurementsgood to within about 1 decibel are possibleif an external calibrating unit is utilized.This is a small, battery -operated signalgenerator of conventional design.
Iron Cores for PowerOscillatorsBecause of voltage breakdown prob-
lems and heating in the material, efforts toapply powdered iron cores in high -fre-quency power oscillators have not been sosuccessful as in the radio -receiver field. Acore material and a core structure, an-nounced by Mallory* are said to haveovercome previous objections.
The material is composed of ferro-magnetic particles of extremely small size
Five sections of a powdered -ironsembled on a threaded rod of insulating
material
which are compressed in a binder of in-sulation material. Grain sizes are such thatcores made from it are recommended forgeneral use in high -Q circuits at frequen-cies up to 3 megacycles. The apparentpermeability is approximately 6, and aneffective permeability (ratio between in-ductance values with and without thecore) of about 3 can be realized in well-designed coils.
In the larger sizes the cores are madeup of a series of annular cylindrical sec-tions from 1 to 2 inches in axial length andfrom 21 and 8* inches in outside diame-ter. These are assembled on an insulatedshaft and insulated from each other bymica washers. Subdividing the core re-duces the losses due to circulating cur-rents and permits the use of relativelyclose -fitting coils in high -voltage trans-mitter circuits.
Numerous applications are suggestedfor design features in fixed and mobiletransmitters. These are based on thepossibility of reducing bulk and losses ininductors and of providing continuous ad-justment of circuit tuning over wide fre-quency ranges.
Another grade of the same core ma-terial is available for use at lower frequen-cies and for applications where losses areof minor importance, such as antennachokes, modulation transformers andchokes, etc. Its apparent permeability isapproximately 8.
* P. R. Mallory & Co., Inc., Indianapolis, Indiana.
Scaled -in resistors
Resistors Sealed in GlassPrecision -type resistors, hermetically
sealed in glass tubes, have been developedby Ohmite* for applications requiring pro-tection against the effects of humid orcorrosive atmospheres. They are availablein a variety of mounting styles.
The resistors are non inductivelywound on 2-, 4-, 6-, or 8 -section spools,adjacent pies having the direction of wind-ing reversed. After winding, the unit isbaked to drive off moisture and impreg-nated with a material that increases thedielectric strength and bonds the wire andcore together. The unit is then placed inthe tube which is then evacuated, filledwith a dried gas, and sealed by fusingthe end of the tube onto the terminalwires.
Units are rated at 1 watt and are sup-plied for resistance values in the range be-tween 0.1 ohm and 2 megohms. Althoughthey can be supplied with a closer toler-ance when required, they are ordinarilyadjusted to within 1 per cent.
* Ohmite Manufacturing Company, 4860 WestFlournoy Street, Chicago, Illinois.
Amplifier Gain Measuring SetA direct -reading "gain indicator" for
measuring the gain of audio -frequencypower amplifiers is being manufactured bythe Monarch Manufacturing Company.*
It consists of a 0- to 15 -volt rectifier-type alternating -current voltmeter and acalibrated, constant -impedance attenua-tion network having an internal inputimpedance of 500 ohms and an internaloutput impedance that varies between 200and 500 ohms, depending on the attenua-tor setting. The voltmeter can be con-nected across either the attenuator inputor the amplifier load by means of a switchon the panel.
The instrument is intended to be usedas follows: Power from an external sourceis supplied to the amplifier under testthrough the attenuation network, which isthen adjusted until the meter indicates thesame voltage for both positions of themeter switch. The power loss in the net-work is taken to be equal to the gain in theamplifier, and the result of the measure-ment in decibels is read directly from theattenuator scale. If the load and input im-
* Monarch Manufacturing Company, 3341 Bel-mont Avenue. Chicago, Illinois.
February, 1939 Proceedings of the I. R. E.

New speakers bring new sig ificance to the term:
ASK YOUR ENGINEERto check-up on these
NEW single unit loud speakers by BellTelephone Laboratories and Western
Electric-That give you high quality reproduction
at moderate power levels-That distribute sound over angles of 30°
to 45°-making them admirably suited formonitor or public address applications-
That reproduce so faithfully, that theartists are brought into the "presence" ofthe listener-
That add crystal clear "definition" thatenables monitor operators and productionmen to better evaluate program balance-
latest pace -setters!That employ an entirely new diaphragm
formation, new type permanent magnetand other new design features.
Ask your engineers about this suitablecompanion to the Western. Electric 94 typeamplifier. Or better yet-order one speaker,evaluate its reproduction quality and letyour monitor operators and productionmen tell you how much it helps them!Then you'll order more!
DISTRIBUTORSCraybar Electric Co., Crayber Building, New York, N. Y.In Conrad mut Newfoundland, Northern Electric Co., Ltd.
In other countries: International Standard Electric Corp.
HIGH QUALITY
DIRECTIVE BEAM
make the
750A and151A
ideal for
MONITORING
Western ElectricRA.D10 TELEPHONE BROADCASTING EQUIPMENT:,ReOcOediugs of the 1. R. E. February, 1939

BLILEYCRYSTALS
HOLDERSOVENS
rINLy carefully selected BrazilianQuartz is used in the manufacture of
Bliley General Communicationquency Crystals. As each individual crys-tal passes through its various processingoperations, many optical, mechanical andelectrical examinations are applied to in-sure the highest possible standards ofprecision and quality.
So that proper characteristics andfrequency accuracy can be guaranteed,each crystal is finally checked and cali-brated in the holder in which it will op-erate. Bliley crystal holders and ovenmountings are engineered particularlyfor dependable performance of BlileyCrystals from 20kc. to 30mc. Varioustypes are available to suit frequencyzontrol requirements throughout thecomplete crystal frequency range.
A competent engineering staff is main-tained for product research and develop-ment. Recommendations and quotationscovering quartz crystals for any stand-ard or special applications will gladly beextended without obligation. Write forcatalog G-10 describing Bliley GeneralCommunication Frequency Crystals.
BLILEY ELECTRIC CO.UNION STATION BUILDING ERIE, PA.
(Continued from page
pedances of the amplifier are not equal, aterm (20 log impedance ratio) is applied tocorrect for the difference in impedancelevel. A chart relating the impedance ratioand the correction is supplied with theinstrument.
Monarch gain indicator
The attenuator is made up of resistiveelements, non -inductively wound on thincards and individually adjusted. It has atotal range of 110 decibels: 10 steps of 10decibels and 10 steps of 1 decibel.
Standards for High -FrequencyImpedance MeasurementsIn an effort to extend the range of com-
mercially practicable impedance measure-ments to higher frequencies, the GeneralRadio Company* has developed a fixedresistor of the straight -wire type and im-proved the characteristics of one of itsprecision -type variable air condensers.
In condensers of conventional con-struction, current enters at one end of therotor and stator stacks. The system wasanalyzed on the assumption that the cur-rent decreases linearly along the rotorshaft and stator -support rods and that theinductance and metallic resistance are uni-formly distributed. It was found that byfeeding the current into the center of eachstack, both the resistance and inductancewould be reduced to about of their valuesin an end -fed system.
The method adopted for feeding cur-rent at the center is shown in the accom-panying photograph. A heavy strip con-nector feeds the stator stack, and a circu-lar brass disk with a wide brush contactorfeeds the rotor.
In the design of the straight -wire resis-tor, rnanganin wire as small as 0.0006 inchin diameter was selected in order to mini-mize temperature coefficient and thechange in effective resistance with fre-quency due to skin effect. While the smallvalues of inductance and capacitance thatare inherent in the straight -wire type ofconstruction were desirable, further stud-ies showed that reducing one reactanceparameter at the expense of the otherwould often materially raise the frequency
* General Radio Company Cambridge, Massa-chusetts.
.if."0.4
CREI Originated Training inPractical Radio Engineering
The manner in which the radio in-dustry has acknowledged CREI menas well -trained men is best exempli-fied by the fact that CREI studentsand graduates are now employed inmore than 275 U. S. broadcastingstations. Among our students are en-gineers in top positions and those"just breaking in" . . . it is thisdesire of most radiomen to acquiremore technical ability that forms thebackbone of a growing industry.
We, too, are keeping pace. Les-sons are under constant revision toembody latest developments and ad-vances in every branch of the field.The acquisition of our own well-equipped building is another stepin our constant effort to provide in-creased facilities for modern, prac-tical training.
You will find it worthwhile to readthis interesting booklet. It containscomplete details about our schooland courses. Write for your freecopy today.
E. H. RIETZKE, Pres.
Dept. PR -23224 SIXTEENTH ST., N.W.
WASHINGTON,D.C.
tosit.241e-1.4:
iv February, 1939 Proceedings of the 1. R. E.

utoa111111111111111111111111111111111111111111
ic\14#3* &Ali/
POLARIptIO VOLTAGE POWER {4001 SIGOCiEsEANGE
km WM g suut 1111111111111, '
In the best interests of ALL users of con-densers, AEROVOX engineers have devel-
oped this more critical checking means. Tests and
readings, more than any claims and superlatives,
best tell the true story of any and all condensers.,
Years of experience testing and checking condenserquality have been boiled down to provide this
simple, portable, moderately -priced instrument. A
handy manual supplied with each instrument (or500 separately) reviews the entire bridge art. Yousimply can't afford to be without this condenseryardstick.
Ask to See It . Your local AEROVOX jobber can show you
this unique instrument. Or if you prefer, writeus direct for descriptive literature.
Polarizing Voltage Control.Inner knob serves as trans-former tap switch. Outer knob
is vernier control indicating con-tinuously variable voltage 15 to 600volts in 3 steps. Voltmeter auto-matically switched to proper range0-60, 0-300, 0.600. Variable voltageavailable between terminals +X andGround for meter calibration, loadtests, amplifiers, etc,
3
4
.and what it doesMeter Rango Switch . . . the"brains" of the Aerovox Bridge.Provides external milliammeter
first three positions; external volt-meter next throe positions, rangingfrom 60 to 600 v. at 1000 ohms pervolt; "Bridge" indicates power onand balancing position. Also pro-vides vacuum -tube voltmeter and in-sulation resistance test at "VTV";leakage test through X terminals at"L 60 MA" and "L 6 MA" posi-tions; and polarizing voltage read-ings on proper meter range at "PV"position.
1
2
Power factor control and switchfor insulation resistance test.
Bridge Rango control . . . forreading capacity:
10 -100 mfd.1- 10 mfd..1- 1 mfd.
.01 - .1 mfd..001 - .01 mfd.
,0001-.001 mfd.Multiplying factor for both capacityand resistance indicated on face ofcontrol.
5
6
7
Zero Adjustment forvacuum -tube voltmeterand bridge detector.
Push Button for insu-lation resistance test.
Main Dial, linear cali-brated, for capacityand resistance read-
ings.
DEPRESSFOR
ii4MATIOBROMANCE
AEROVOX CORPORATIONNew Becelcoti,
Soles Offices in All Principal Cities
Proceedings of the I. R. E. February, 1939

An Outstanding PatentedCircuit Recommended Bythe Best Laboratories andTechnicians.i
SELF -CALIBRATING
VACUUM TUBE VOLTMETER
ModelI252
Only
$48'33NetPrice
The initial operation ofadjusting bridge cancelsout error independent ofthe tube emission valuesor when replacing tubes.
Model 1252 is furnished with the exclusiveTriplett tilting type twin instrument. Oneinstrument indicates when bridge is in bal-ance-the other is direct reading in peakvolts. Above, below and null point indi-cated by the exclusive feature of the cir-cuit. Tube on Cable . . , Particularly desir-able for high frequency work. . . . Ranges:3-15-75-300 Volts.
Furnished complete with all necessary acces-sories including 1-84, 1-6P5, 1-76. Case ismetal with black wrinkle finish, 77/% x x4% inches. Etched panel is silver and redon black.
Model 1251 same as 1252 but with tube locatedinside case . .. DEALER PRICE $47.67
Model 1250 same as 1251 except ranges are 2.5,10, 50 volts ... DEALER PRICE $36.67
The Triplett Electrical Instrument Co.212 Harmon Ave., Bluffton, OhioPlease send me more information on-
Model 1252; 0 Model 1251; Model 1250Name
Address
City State
vi
(Continued from page iv)
Center -fed condenser (with right-handstator stack removed to show the method of
making connections to the rotor)
limit below which the effective resistanceand reactance would remain within satis-factory limits. That is why the construc-tion shown in the following photographwas adopted.
The resistance wire is clamped downon a thin piece of mica, backed by two flatmetal plates which also serve as lugs forconnections. As a result, the inductance isdecreased below what it would be in freespace by virtue of the shielding effect ofthe current in the plates. The plates alsohelp to dissipate heat and improve thepower handling ability of the unit.
Resistors of this type are built in 7sizes between 1 and 100 ohms.
A 100 -ohm straight -wire resistor with theclamping plate removed to show the ele-
ment
Booklets, Catalogsand Pamphlets
The following commercial literature hasbeen received by the Institute.
ELIMINATORS Electro Products La-boratories, 549 West Randolph Street, Chi-cago, Illinois. Catalog 1138. 2 pages, 81X 11inches. Description of 3 low -hum -levelbattery eliminators.
I NSTRUMENTS Triplett Electrical In-strument Co., Buffton, Ohio. Price Sheets50-I and 50-T, 8 pages, 81 X11 inches. In-dicating instruments and tube- and ser-vice -test sets, prices and brief specifica-tions.INSTRUMENTS Roller -Smith r Com-pany, Bethlehem, Pennsylvania. Catalog48-a. 8 pages, 81X 11 inches. Descriptionand dimensions of 3- and 4 -inch, round andsquare panel instruments.MARINE RADIO TELEPHONE West-ern Electric Company, 195 Broadway, NewYork, New York. Bulletin T1570. 4 pages,
8X11 inches. 2 -way radio telepone equip-ment for inter -ship and ship -to -shore ser-vice on small boats.RADIO RANGE FILTER RCA Manu-facturing Company, Inc., Camden, NewJersey. Data Sheet No. 4. 2 pages, 81X11inches. A unit to separate voice and rangesignals in an aircraft radio receiver.RELAYS C P. Clare & Co., 4541Ravenswood Avenue, Chicago, Illinois.Catalog CC1. 10 pages + comr, 81 X11inches. Descriptions and specifications ondirect -current relays for low -power controlservice.MAGNETIC TELEPHONE WesternElectric Company, 195 Broadway, NewYork, New York. Bulletin T1543. 4 pages,8 X 11 inches. A sound -powered telephonefor intercommunication service on ship-board.TRANSFORMERS Robert M. HadleyCo., 266 So. Chapel Street, Newark, Dela-ware. Catalog T6. 16 pages, 81X11 inches.Power and amplifier -coupling transfor-mers.TUBE DATA (KEN-RAD) . . . Ken-RadTube & Lamp Corporation, Owensboro,Kentucky. Engineering Bulletin 38-21, 29pages, 81X11 inches. Considerations in-volved in the application of converter andmixer tubes.UBET DATA (KEN-RAD) . . . Ken-RadTube & Lamp Corporation, Owensboro,Kentucky, Bulletin, 8 pages, 81X11 inches."Essential Characteristics of Metal, 'G'Series, and Glass Radio Tubes" (tabulardata, base connections, and outline draw-ings.)TUBE DATA (RCA) RCA Manufac-turing Company, Harrison, New Jersey.Application Note No. 101. 9 pages, 81 X11inches. "On Input Loading of ReceivingTubes at Radio Frequencies."TUBE DATA (RAYTHEON) RaytheonProduction Corporation, Newton, Massa-chusetts. Data Sheets. 11 pages, 81X11inches. Description and characteristics of4 permatrons (magnetic -control gas -filledcontrol tubes).TUBE DATA (WESTINGHOUSE) West-inghouse Electric & Manufacturing Com-pany, Bloomfield, New Jersey. Bulletin No -17. 4 pages, 82X 11 inches. Description andbrief summary of characteristics of igni-trons.VACUUM CONDENSER . . . Eitel McCul-lough, Inc., San Bruno, California. Bulle-tin, 4 pages, 81 X 11 inches. Description andperformance data on a vacuum -sealed -in -glass condenser for tank -circuit applica-tions.CONDENSERS.. . Tobe Deutschmann Cor-poration, Canton, Massachusetts. Catalog,12 pages, 81X11 inches. Wet and dryelectrolytics and paper condensers, a list-ing of specifications.
February, 1939 Proceedings of the I. R. R.
IRE membership offers
many services
to the radio engineerProceedings-An outstanding pub-
lication in the radio engineering field.
Over a quarter of a century of service
to the world in publishing important
radio engineering discoveries and de-
velopments, the PROCEEDINGS presents
exhaustive engineering data of use to
the specialist and general engineer. A
list of its authors is a "Who's Who"
of the leaders in radio science, re-
search, and engineering.
Standards-Since 1914 our standards
reports have stabilized and clarified
engineering language, mathematics,
graphical presentations, and the test-
ing and rating of equipment. They are
always in the process of revision and
thus remain up to date.
Meetings-In twenty-two cities in the
United States and Canada, meetings of
the Institute and its sections are held
regularly. Scores of papers on prac-
tically every branch of the field are
presented and discussed. Several con-
vention meetings arc sponsored by the
Institute and add materially to its ef-
fectiveness in distributing data of
value to engineers.
The Institute of Radio EngineersIncorporated
330 West 42nd Street, New York, N.Y.
To the Board of DirectorsGentlemen :
I hereby make application for ASSOCIATE membership in the Instituteof Radio Engineers on the basis of my training and professional experiencegiven herewith, and refer to the members named below who are personallyfamiliar with my work.
I certify that the statements made in the record of my training and profes-sional experience are correct, and agree if elected, that I shall be governed by theConstitution of the Institute as long as I continue a member. Furthermore Iagree to promote the objects of the Institute so far as shall be in my power,and if my membership shall be discontinued shall return my membership badge.
(Sign with pen)
(Address for mail)
(City and State)
(Date)
SPONSORS(Signatures not required here)
Mr.
Address
City and State
Mr.
Address
City and State
Mr.
Address
City and State
ENTRANCE PEE SHOULD ACCOMPANY APPLICATION
Proceedings of the I. R. B. February, 1939 vii

ENGINEERINGDIRECTORY
Consultants, Patent Attorneys,Laboratory Services
CONSULTANTS ANDDESIGNERS
includingAmplifiers Antennas Transmitters
Receivers Laboratory EguipmentSpecial equipment designed
and constructedRADIO DEVELOPMENT &
RESEARCH CORP.145 West 45th Street, New York, N.Y.
Tel. BRyant 9-6898
BRUNSON S. McCUTCHEN andCHARLES B. AIKENConsulting Engineers
Technical cooperation with Attorneys inconnection with patent litigation-De-sign and Development work-Audio andradio frequency measurements-Equip-ment studies-Receiver and transmitterproblems-A well equipped laboratory.75 West Street TelephoneNew York City WHitehall 4-7275
ALFRED CROSSLEYConsulting Engineer
Radio -engineering problems involvingreceiver design, iron -core investigations,and A- and B -battery substitutes
549 West Randolph Street, Chicago,Illinois; Telephone STAte 7444
Use this directory . . .
when you need consulting serv-
ices
when you are asked to suggest
the name of a specialist on an en-
gineering or patent problem
Consulting Engineers, Patent Attor-neys, Laboratory Services ... Applica-tions for card space in the EngineeringDirectory are invited. Complete datawill be sent on request to
PROCEEDINGS of the I.R.E.
330 West 42nd Street New York, N.Y.
INDEX
COMMERCIAL ENGINEERINGDEVELOPMENTS ii
BOOKLETS, CATALOGS, & PAMPHLETS..vi
POSITIONS OPEN
ENGINEERING DIRECTORY
DISPLAY ADVERTISERS
A
Aerovox Corporation
American Telephone & TelegraphCo. xi
B
Bliley Electric Company iv
C
Capitol Radio Engineering Institute.iv
Cornell-Dubilier Electric Corp. ....xii
E
Erie Resistor Corporation
G
General Radio Company ....Cover IV
R
RCA Manufacturing Co., Inc.....Cover III
T
Triplett Electrical Instruments Co... vi
Western Electric Company iii
POSITIONSOPEN
The following positions of interestto I.R.E. members have been re-ported as open on January 27.Make your application in writingand address it to
Box No.
PROCEEDINGS of the I.R.E.330 West 42nd Street, New York, N.Y.
TELEVISION SERVICE
INSTALLATION AND SERV-ICE department of a television -receiver manufacturer wants engi-neers for educational, contact, andservice work among dealers in
the New York area. Applicantsshould be engineering graduatesfamiliar with radio equipmentthrough practical service or ama-teur experience. Give full detailsof education and experience. Pres-ent staff knows of these openings.Box No. 192.
AttentionEmployers . . .
Announcements for "PositionsOpen"are accepted without chargefrom employers offering salariedemployment of engineering gradeto I.R.E. members. Please supplycomplete information and indicatewhich details should be treated asconfidential. Address: "PosmoNsOPEN," Institute of Radio Engi-neers, 330 West 42nd Street, NewYork, N.Y.
The Institute reserves the right to refuse anyannouncement without giving a reason for
the refusal
February, 1939 Proceedings of the I. R. E.

eeThe minute he calls up I'm going to speakto him about Bobby. He's my cousin, andhe's just five weeks old. And they haven'tgot a telephone where he lives!
"One of these days his mother's goingto run out of his talcum. Or she'll want hisfather to stop at the drug store on the wayhome for oil. Or maybe she'll want to askthe doctor about that rash on his back -Bobby's back, I mean.
"Then suppose some week he gains sixounces. Don't they expect to tell theirfriends news like that?
"Well, how is Bobby's mother going todo all those things besides her marketing?
"I'm going to see if my Daddy can't fixit. He's always saying how good telephoneservice is - and how cheap."
BELL TELEPHONE SYSTEMYou are cordially invited to visit the Bell System exhibit at the Golden Gate International Exposition, San Francisco
Proceedings of the I. R. E. February, 1939
BillVIVO
xi

You'll find the same dependability
in CD CapacitorsEmphasis today is on comfort . . . luxury . . . style. ButON TIME is still the first consideration of the nation'srailroads. A capacitor, too, may have many fine quali-ties-each praiseworthy in itself. But unless these addup to DEPENDABILITY, your capacitor is not a goodinvestment. Cornell-Dubilier is proud of the fact that,in engineering circles today, the initials of C -D havecome to stand for capacitor dependability.
C -D engineers will be happy to cooperate with you onyour capacitor requirements. Catalog No. 160 listing theentire C -D line is available free of charge. Your in-quiries are invited.
ABOVE PHOTO COURTESY NEW YORK CENTRAL SYSTEM
DYKANOL FILTER CAPACITORS TYPE TJUCarefully designed, compact, light -weight, safely -rated,furnished with universal mounting clamps, well -insulatedterminals, fire -proof, these units are without a doubtthe most dependable capacitors offered the radio in-dustry. Type TJU Dykanol capacitors are being used bypractically every broadcast and government station inthe world. For complete description see Catalog No. 160.
Product of the world's largest manufacturer of capacitors.
MICA DYKANOL PAPER
WET AND DRY ELECTROLYTIC CAPACITORS
CORNELL -DUBILIERELECTRIC CORPORATION1012 Hamilton 'Boulevard, South Plainfield,: New Jersey
Cable Address: "CORDU"
xii February, 1939 Proceedings of the I. R. E.

There are 6 different types-all of them small-all offering advantages radio set manufacturers
will appreciate!
The special construction of the 6SA7 provides excellent os-cillator frequency stability. The magnitude of input capaci-tance of the oscillator grid is not appreciably affected by
signal -grid bias. Changes in cathode current and in oscil-lator transconductance with AVC voltage are small.
RCA 6SK7.,. this is, a new r -famplifier pentode offering thesame features as the 6SA7 plusmore stable amplifier operation...greater uniformity of amplifiergain...and higher gain per stage.This tube not only has the samegrid plate capacitance as tubeswearing grid caps, but also offerslower input and output capaci-tance values-- plus higher transconductance. Has remote cut-offcharacteristic and small waferoctal, 8 -pin base to fit standardoctal socket.RCA 6Si7...this is a new r -famplifier pentode with the samefeatures as the 6SK7 except thatthis tube has a sharp cut-off char-acteristic.RCA 6SF5 ... a new high -mutriode ... and the RCA 6SA7... a
new duplex -diode high -mu tri-ode, are audio type tubes. Theyemploy the same single -endedconstruction and have the samecharacteristic features and advan-tages as the r -f pentodes. Base -shielding reduces hum voltagepicked up by grid lead fromheater leads, permits operationwith satisfactory hum level.
RCA 6SC7...a new twin triodeamplifier designed primarily forphase inverter service. Hum volt-age picked up by the grid leadfrom the heater leads is greatlyreduced because of inter -leadshielding between grid and heaterwithin the base.This permits oper-ation with satisfactory hum level.RCA preeente the Magic Key every Sunday, 1 to 8
P.M., E.S.T., on the NBC Blue NetworkOver 325 million RCA radio tubes have beenpurchased by radio users...in tubes, as In radio
sets, It pays to go RCA All the Way.
For complete details about any of these tubes write to the address below
Here are some of the fine features of the RCA6SA7 -a new Pentagrid Converter
Self -shielded envelopeComplete wiring below set panelNo grid lead to connectCleaner, neater chassisNo loose or broken grid leadsNigher conversion gainSmall frequency shift at high frequenciesEconomySimplification of tube renewal
A SERVICE OF THERADIO CORPORATION
OF AMERICA
RCA MANUFACTURING COMPANY, INC, HARRISON, N. J.

Cl)
200
010
0
a.0
LOW RANGE- CYCLES x 10
10
HIGH RANGE -
100 FREQUENCY 1000 10000
FOR some time there has been need for a wide -range oscillator with substantially constant out-
put of moderate power, not only for general lab-oratory bridge measurements but also for takingselectivity curves over a very wide range of fre-quencies, for measuring transmission characteris-tics of filters and for testing wide -band systems suchas television amplifiers and coaxial cables.
The new General Radio Type 700-A Beat -Fre-quency Oscillator was designed for these applica-tions. Through unique circuit and mechanical de-sign and very careful mechanical construction it hasbeen possible to manufacture an oscillator of goodstability, output and waveform at an exceptionallylow price.
FEATURESWIDE RANGE-two ranges: 50 cycles to 40 kc and 10 kc
to 5 Mc.
NEW
WIDE -RANGE
BEAT - FREQUENCY
OSCILLATORACCURATE CALIBRATION-low range: ±2% ±5 cycles;
high range: -I:2% ±1000 cycles; incremental dial:7-1--5 cycles low range; :±500 cycles high range.
GOOD FREQUENCY STABILITY-adequate thermal dis-tribution and ventilation assure minimum frequency drift.Oscillator can be reset to zero beat to eliminate errorscaused by small drifts.
GROUNDED OUTPUT TERMINAL-output taken from1,500 ohm potentiometer.
CONSTANT OUTPUT VOLTAGE-open-circuit voltage re-mains constant between 10 and 15 volts within ±1.5 dbover entire frequency range.
GOOD WAVEFORM-totalharmonic content of open -circuit voltage is less than3% above 250 cycles onlow range and above 25 kcon high range.
DIRECT READING-scale on main dial approximately loga- A -C OPERATION-power-rithmic in frequency. Incremental frequency dial direct supply ripple less than 2%reading between -100 and +100 cycles on low range and of output voltage on either-10 and +10 kilocycles on high range. range.
Type 700-A Wide -Range Beat Frequency Oscillator . . .$555.00 Write For Bulletin 363 For Complete Information
GENERAL RADIO COMPANY, Cambridge, Mass. it"Zgle.
MANUFACTURERS OF PRECISION RADIO LABORATORY APPARATUS


![INDEX [worldradiohistory.com] · 5593 "Space Communications System Design Nomographs," H. R Mathwich, Trans. I.R.E. PGCS (Correspondence) (March) 1962 5594 "A Spectrophotometric Investigation](https://static.fdocuments.us/doc/165x107/5f8374324ddcba3bc907dfd3/index-5593-space-communications-system-design-nomographs-h-r-mathwich.jpg)