Precision Polarimetry of Polarized
22
Transcript of Precision Polarimetry of Polarized


Precision Polarimetry of Polarized 3He
Nick PenthornMentor Todd Averett
March 2014
Abstract
This work presents the progress of an experimental procedure designedto do precision polarimetry on polarized 3He targets used in electron scat-tering experiments. Targets are polarized via spin-exchange optical pump-ing (SEOP), a process that uses circularly polarized laser light to give aspin polarization to the 3He nuclei by way of spin transfer with a smallamount of atomically polarized alkali metal in the cell. With this pro-cess, the polarization of a 3He target that contains an alkali metal can beextracted via the frequency shift in the alkali metal’s electron paramag-netic resonance (EPR) line; κ0 is a constant that relates that frequencyshift to the cell’s polarization. Thus, the ultimate goal of this study is toreduce the uncertainty in κ0,Rb and κ0,K (the polarization constants as-sociated with rubidium and potassium, respectively). Using a cylindricalcell and taking EPR measurements in two orthogonal cell orientations inan external magnetic holding field allows for the isolation of κ0. The ex-perimental setup entailed fabrication of an EPR frequency generator coil,a photodiode to detect light from EPR-driven electron transitions, and anoven to keep a portion of the alkali metal in a vaporous state at 210C.Additionally, setup required optics to focus a polarizing laser tuned to therubidium D1 transition onto the cell for the purpose of SEOP. Relative cellpolarizations are measured using NMR signals from the helium nuclei, aprocess that required making NMR generation and pickup coils. Finally,measurements were taken at EPR frequencies associated with 41K, 39K,and 85Rb to determine the corresponding values of κ0 and their uncer-tainties. The current research is focused on determining the temperaturedependence of κ0.
1

Contents
1 Introduction 31.1 Studies on κ0 . . . . . . . . . . . . . . . . . . . . . . . . . . . . . 3
2 Experimental Setup 32.1 Cell Oven . . . . . . . . . . . . . . . . . . . . . . . . . . . . . . . 52.2 Polarizing Optics . . . . . . . . . . . . . . . . . . . . . . . . . . . 62.3 NMR . . . . . . . . . . . . . . . . . . . . . . . . . . . . . . . . . . 62.4 EPR . . . . . . . . . . . . . . . . . . . . . . . . . . . . . . . . . . 7
3 Methods 73.1 EPR . . . . . . . . . . . . . . . . . . . . . . . . . . . . . . . . . . 83.2 EPR-AFP . . . . . . . . . . . . . . . . . . . . . . . . . . . . . . . 83.3 Isolating κ0 . . . . . . . . . . . . . . . . . . . . . . . . . . . . . . 93.4 Flipping 3He Spins . . . . . . . . . . . . . . . . . . . . . . . . . . 113.5 NMR-AFP . . . . . . . . . . . . . . . . . . . . . . . . . . . . . . 123.6 Determining the Alkali Ratio . . . . . . . . . . . . . . . . . . . . 123.7 Finding Resonances for EPR . . . . . . . . . . . . . . . . . . . . 133.8 Tests on Cell “Symon” . . . . . . . . . . . . . . . . . . . . . . . . 14
4 Measurements for κ0 154.1 The Spin Flip Procedure . . . . . . . . . . . . . . . . . . . . . . . 154.2 Correcting for Polarization Loss . . . . . . . . . . . . . . . . . . . 15
5 Results 16
6 Ongoing Tests with Cell “Wurst” 18
7 Conclusions 19
2
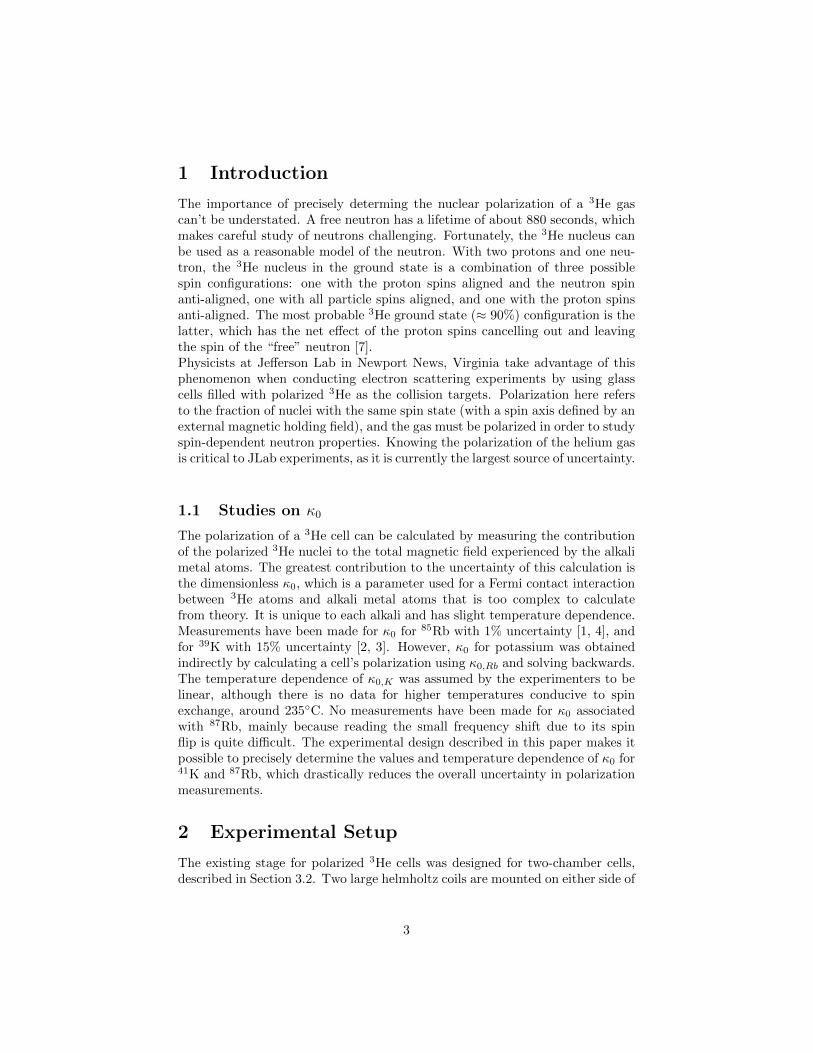
1 Introduction
The importance of precisely determing the nuclear polarization of a 3He gascan’t be understated. A free neutron has a lifetime of about 880 seconds, whichmakes careful study of neutrons challenging. Fortunately, the 3He nucleus canbe used as a reasonable model of the neutron. With two protons and one neu-tron, the 3He nucleus in the ground state is a combination of three possiblespin configurations: one with the proton spins aligned and the neutron spinanti-aligned, one with all particle spins aligned, and one with the proton spinsanti-aligned. The most probable 3He ground state (≈ 90%) configuration is thelatter, which has the net effect of the proton spins cancelling out and leavingthe spin of the “free” neutron [7].Physicists at Jefferson Lab in Newport News, Virginia take advantage of thisphenomenon when conducting electron scattering experiments by using glasscells filled with polarized 3He as the collision targets. Polarization here refersto the fraction of nuclei with the same spin state (with a spin axis defined by anexternal magnetic holding field), and the gas must be polarized in order to studyspin-dependent neutron properties. Knowing the polarization of the helium gasis critical to JLab experiments, as it is currently the largest source of uncertainty.
1.1 Studies on κ0
The polarization of a 3He cell can be calculated by measuring the contributionof the polarized 3He nuclei to the total magnetic field experienced by the alkalimetal atoms. The greatest contribution to the uncertainty of this calculation isthe dimensionless κ0, which is a parameter used for a Fermi contact interactionbetween 3He atoms and alkali metal atoms that is too complex to calculatefrom theory. It is unique to each alkali and has slight temperature dependence.Measurements have been made for κ0 for 85Rb with 1% uncertainty [1, 4], andfor 39K with 15% uncertainty [2, 3]. However, κ0 for potassium was obtainedindirectly by calculating a cell’s polarization using κ0,Rb and solving backwards.The temperature dependence of κ0,K was assumed by the experimenters to belinear, although there is no data for higher temperatures conducive to spinexchange, around 235C. No measurements have been made for κ0 associatedwith 87Rb, mainly because reading the small frequency shift due to its spinflip is quite difficult. The experimental design described in this paper makes itpossible to precisely determine the values and temperature dependence of κ0 for41K and 87Rb, which drastically reduces the overall uncertainty in polarizationmeasurements.
2 Experimental Setup
The existing stage for polarized 3He cells was designed for two-chamber cells,described in Section 3.2. Two large helmholtz coils are mounted on either side of
3

Figure 1: The original cell polarization setup, side view.
a rectangular oven to generate a magnetic holding field, and two smaller helmoltzcoils are mounted above and below the oven to generate a radiofrequency NMRfield. A polarizing laser beam is incident on one side of the oven, where thereis a small window for the light to reach the cell within (Figure 1).
For a given 3He cell, a number of tests must be performed to precisely de-termine its alkali ratio and locate resonances for EPR. Once the apparatus wasconstructed, it was necessary to run these tests and fine-tune the instrumen-tation to maximize signals. The procedure for testing the functionality of thesetup was to measure EPR frequency shift as will eventually be done to lockdown a κ0 value, by separating EPR measurements with cell rotations (describedabove).In order to do a full range of tests on a cylindrical cell using mostly mag-netic signals, it was important in constructing the experimental apparatus tominimize the use of ferromagnetic materials. Measurement tools and instru-ments that were close to or inside of the cell oven also needed to be able towithstand the high temperatures of the cell. For gluing components together,a high-temperature liquid gasket used in car engines, RTV, was used. Wiresand thermocouples were attached with high-temperature mylar tape and solidcomponents were fabricated from Torlon plastic.
4

Figure 2: Cell oven: side view cross-section
2.1 Cell Oven
To keep some fraction of the alkali in a vaporous state and to increase the numberof spin exchange interactions among nuclei, a 3He cell needs to be maintainedat an experimentally determined temperature between 185C and 220C. Thecell oven (Figure 2) was made from a 1-foot-long Pyrex tube with a 2” squarecross-section (inner dimension). The glass is 2.3 mm thick on the sides. Twosquare caps for sealing the ends of the oven were fabricated from 12.7 mm thickTorlon, each with a threaded hole for connection to a heated air line. The airtemperature inside the oven was maintained by a PI feedback circuit controlledby a thermocouple secured to the middle of the cell in the oven with mylar.Cells are mounted inside the oven with two small rectangular Torlon stands,each with grooves cut into the top that matches the diameter of the cell itsupports. The two stands are glued directly to the cell with RTV and the wholeassembly is then glued to the floor of the oven. Because cells need to be studiedin two different orientations, the end caps each have two plastic pegs protrudingfrom their bottom edges, which fit into holes drilled into the fiberglass platformon which the oven rests. There are two sets of holes, one for each oven position.
Thermocouples attached to the cell in various locations showed a distincttemperature gradient between the end closest to the air supply and the op-posite end. The close end was consistently measured as 220C, while the farend was consistently measured as 190C. This was accounted for by settingthe temperature control box to 210 C and having the feedback supplied by athermocouple taped to the middle of the cell, close to the EPR coil. It wasfound that the average temperature of the cell could be found by averaging thetemperatures of both ends, which matched the cell’s midpoint temperature towithin 0.5% uncertainty. This provided an average temperature of 210 C acrossthe cell, and specifically in the middle of the cell where the bulk of data wastaken.
5

Figure 3: Primary beam diagram
2.2 Polarizing Optics
Cells were polarized with two laser beams, both tuned to the rubidium D1
transition at 795 nm. The primary beam was aligned with the holding fieldand set to 25W output power. The probing beam, at 33W, was set at 45 tothe holding field. Both beams were directed through polarizing beam splitters(PBS) to 1
4λ plates to make them circularly polarized. In the case of the primarylaser, both beams emited from the PBS were directed to the cell (Figure 3). Bycontrast, the probing laser didn’t need as much intensity and thus only one beamfrom the PBS was needed (Figure 4). Cylindrical lenses were added to focusthe circular profile of the beams down to elliptical profiles with the purpose ofmaximizing the light incident on the cell. The probing beam and its optics weremounted on a non-ferromagnetic optical breadboard which was in turn mountedon a wooden platform. The distance from the probing laser to the center of thecell was 26”. The optics associated with the primary beam were mounted onan optical table sufficiently far away from the cell (163 cm) that it wouldn’tinterfere with the generated magnetic fields.
2.3 NMR
To generate the radiofrequency magnetic signal used for spin flips and AM/FMsweeps, the existing NMR generation coils weren’t used because of their positionin relation to the EPR coil. Two Helmholtz coils were constructed at right angles
6

Figure 4: Probing beam diagram
to the holding field. Each coil was 51 cm high and 56 cm wide with 8 turns ofcopper wire. They were mounted onto the oven platform with plastic bracketsat each of their four corners. When wired together, they were measured to havean inductance of 231.4 µH and a resistance of 593 mΩ. The corresponding RFpickup coils were each 100 turns of 34-gauge copper wire wound around a 1/2”diameter torlon disk and secured in place with a layer of RTV. Together, thecoils had an inductance of 369 µH and a resistance of 724 mΩ. Because theNMR signal quickly drops away the further it is measured from the cell, thepickup coils were mounted inside the oven, orthogonal to both the holding fieldand the RF field, using a thin torlon frame. The RF pickup coils had a smallamount of vertical adjustability (around 6 mm) to ensure that the coils were asclose as possible to the cell.
2.4 EPR
The EPR frequency signal was generated with a single coil of 22 gauge copperwire wound with 10 turns around a 4.5 cm diameter torlon disk. The coil wasmounted to the underside of the oven at the exact center with mylar tape. Itsinductance and resistance were measured to be 9.2 µH and 184 mΩ, respectively.A photodiode was mounted above the cell and in line with the EPR coil on afiberglass platform. Light from the cell reached the photodiode through a 5cm diameter hole in the platform and a focusing lens. The lens was 16 cmaway from the top surface of the oven and the photodiode was 20 cm away. Thephotodiode was equipped with D2 filters to detect fluorescence from EPR-drivenalkali electron transitions.
3 Methods
Target cells are polarized via spin-exchange optical pumping (SEOP), a multi-step process in which circularly polarized laser light transfers spin to the heliumnuclei. In the first step of this process, an alkali metal is added to the cellwhich has a high spin exchange rate. The alkali metal, usually rubidium, is
7

optically pumped and transfers spin to the helium through a contact interaction[8]. The lasers used for optical pumping are therefore tuned to the rubidiumD1 transition, 795 nm. The polarization can be further improved by addingpotassium, which has a slower spin relaxation rate than that of rubidium [3].With a mix of the two alkali metals, rubidium atoms will be directly polarizedby the D1 light and exchange their spins with potassium atoms, which thenexchange spins with helium atoms. With continuous optical pumping underoptimal conditions, the majority of helium atoms in a cell will have the samespin.
3.1 EPR
The addition of alkali metals to a 3He cell has the added benefit of measuringthe cell’s polarization indirectly with electron paramagnetic resonance (EPR).In the presence of a magnetic holding field, the alkali metal atom’s hyperfineenergy levels experience Zeeman splitting, with the energy difference betweenlevels proportional to the strength of the magnetic field. Each polarized 3Henucleus contributes to the local field strength, and so the alkali metal atoms’hyperfine levels will be spread apart due to both the external holding fieldand each of the 3He nuclei. Thus, the energy spacing between alkali hyperfinelevels is proportional to the 3He polarization. The alkali hyperfine levels can bedetermined by driving a particular hyperfine transition, using a magnetic fieldoscillating at an EPR frequency, and picking up the frequency of emitted lightat resonance with a photodiode. The EPR signal drives electrons up to a statethat allows them to absorb the polarizing laser’s D1 light, and alkali atoms canbe further excited through collisional mixing and eventually emit D1 and D2
light. A peak in D2 intensity at 780 nm indicates resonance, and consequentlythe photodiode has filters to block out D1 light from the laser.
3.2 EPR-AFP
To isolate the total 3He contribution to the field, the 3He spins can be flipped180 with respect to the holding field and the new hyperfine levels can be mea-sured. When the spins are flipped using the adiabatic fast passage (AFP) tech-nique (described in section II.A), their spins transition from being parallel tothe holding field to being antiparallel. It follows that the shift in alkali hyperfinelevels will reflect the 3He field contribution [1].Because the hyperfine levels shift due to the spin flip, so too does the EPR fre-quency required to drive electron hyperfine transitions. It is therefore necessaryto use a lock-in amplifier to adjust the EPR frequency as needed, with feedbackprovided by the photodiode. The quantity measured in AFP-EPR is actuallythe EPR frequency used by the system and it is the shift in EPR frequencythat is used to calculate the cell’s polarization. A typical target cell consists ofa spherical “pumping chamber” connected by a thin glass tube to a cylindrical“target chamber”. The pumping chamber is optically pumped during experi-ments and the electron beam is directed through the target chamber. For a cell
8

of this variety, the cell geometry is can be approximated as a perfect sphere andthe EPR frequency shift is related to the polarization by [1]
∆νEPR =8π
3κ0µHeµ0npPHe
dν
dB. (1)
In (1), µHe is the magnetic moment of helium, µ0 is the vacuum permeability, npis the density of 3He in the pumping chamber, PHe is the helium’s polarization,and dν
dB is the derivative of EPR frequency with respect to the holding field.From this expression, one can understand κ0 as a frequency shift enhancementfactor, the enhancement due to collisions between helium and alkali atoms.
3.3 Isolating κ0
For a non-spherical cell, the EPR frequency shift depends on the cell geometryand how it is aligned with the holding field. The polarization, however, remainsthe same regardless of the cell’s orientation within the holding field. An infinitelylong cylindrical cell is the idealized version of the cells used in this study. Whenthe cell axis is aligned with the holding field, the frequency shift is given by
∆νEPR‖ = µHenHeµ0PHedν
dB(8π
3κ0 + (4π − 8π
3)), (2)
whereas if the cell axis is perpendicular to the field then the expression becomes
∆νEPR⊥ = µHenHeµ0PHedν
dB(8π
3κ0 + (2π − 8π
3)). (3)
Armed with this information, it is possible to isolate the value of κ0 by takingEPR measurements in both orientations and dividing one expression by theother. The cell polarization, which isn’t known with high precision, cancels outin both the numerator and denominator and what’s left are known constantsand geometrical terms. In practice, it has been shown that a cylindrical cell witha length of 18 cm and a diameter of 1.2 cm has a magnetization that differs fromthat of an infinitely long cylinder by less than 0.6% [1]. The fact that opticalpumping is done with a laser aligned with the holding field direction impliesthat it is not practical to do continuous optical pumping on a cell when it is inits perpendicular orientation; a small fraction of the cell’s surface would receivedirect laser light, and thus the cell would sustain losses in polarization betweenmeasurements. The solution is to use two polarized lasers, a primary laser topolarize the cell before measurements and a probing laser to optically pump thecell during measurements. The primary beam is in the direction of the holdingfield, and the probing beam is set at 45 to the holding field (Figure 5). Theprobing laser’s position allows it to optically pump the cell in both orientationswith identical efficiency. Figure 6 shows the orientations of the cell and laserdirections with respect to the holding field and NMR RF field, each generatedby a set of Helmholtz coils.
9
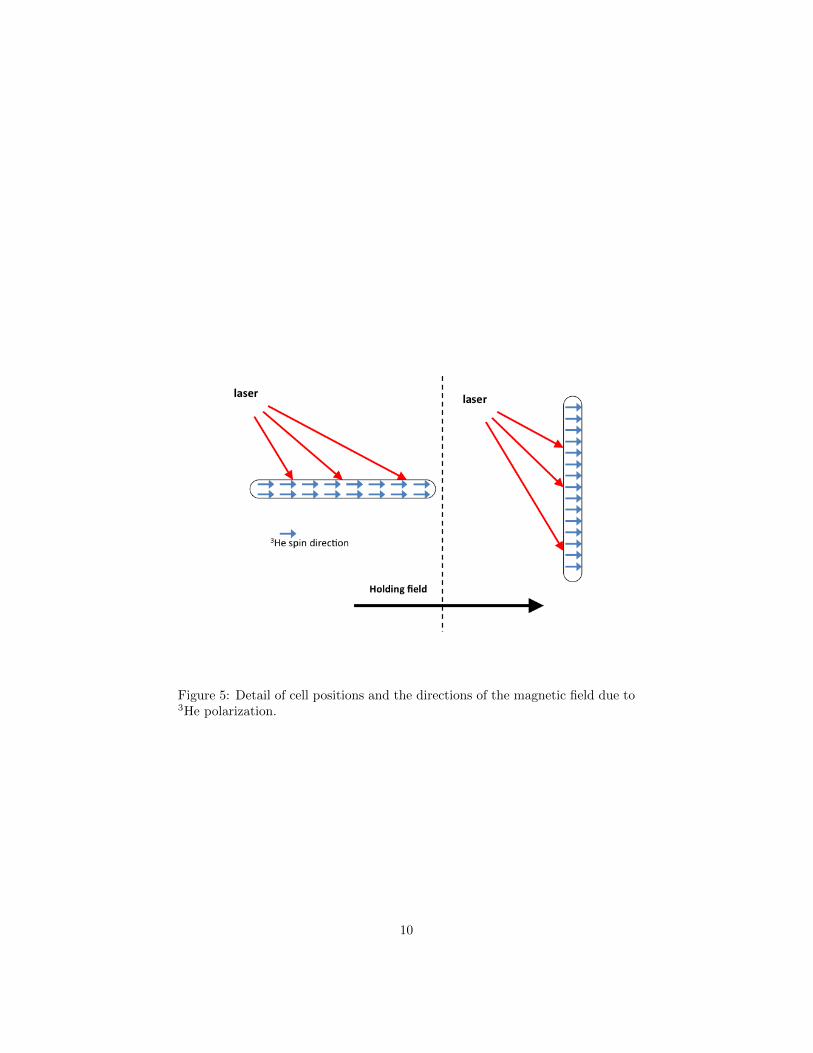
Figure 5: Detail of cell positions and the directions of the magnetic field due to3He polarization.
10

Figure 6: Cell orientations within RF and holding fields (viewed from above).
In practice, it was found that the probing laser was capable of polarizingcells with an efficiency at least equal to that of the pumping laser, given thespace constraints of the lab setup. Thus, the probing laser was used to initiallypolarize the cell and also to maintain polarization during measurements. Thepumping laser was omitted as a redundancy.
3.4 Flipping 3He Spins
To reverse the direction of 3He polarization, a radiofrequency field is appliedto the cell and the value of the holding field is swept through 3He nuclearresonance. In the absence of any RF field, the nuclear spin axes will precessabout the holding field at the Larmor frequency [5, 6]
ω0 = γH0. (4)
In (4), γ is helium’s gyromagnetic ratio and H0 is the holding field magnitude.In a reference frame rotating about an axis aligned with the holding field direc-tion at ωRF ,the effective magnetic field magnitude experienced by nuclei in thecell is
Heff = H0 −ωRFγ
. (5)
11

When the RF field is turned on, the magnitude of the new field is
Htot =√H2eff +H2
1 . (6)
In (6), H1 is the magnitude of the RF field.The initial value of H0 is set so that H0 <
ωRF
γ and it is gradually increased;when H0 = ωRF
γ , Heff = 0. At this point the nuclei are only acted on byH1 and the spins align themselves with the oscillating RF field. When H0 isincreased further, Heff becomes negative and the spins pick up a componentthat is antiparallel to the holding field. In this way the spin direction is flipped180. The adiabatic fast passage (AFP) conditions for a spin flip require that theholding field magnitude changes quickly enough so the spin doesn’t have timeto relax to its previous alignment, yet much slower than the Larmor frequencyso the spin can follow Heff as it rotates [5, 6].A side effect of the AFP technique is the slight loss in polarization that occurseach time it is applied to a 3He cell. This polarization loss is dependent on the“lifetime” of the cell (as determined by the time it takes for the cell polarizationto drop to 1
e of its original value once the pumping laser is turned off) and thenumber of spin reversals performed.
3.5 NMR-AFP
A method of measuring polarization loss, NMR measurements also implementspin flips in the AFP regime by ramping the holding field. As the helium nuclearspin axes rotate, they collectively induce a voltage in pickup coils mountedorthoganally to the holding field coils and RF coils. The maximum (absolutevalue) induced voltage occurs at the point when the spins are halfway throughtheir rotation, at 90 to the holding field. Because the holding field ramps upand then back down to its original value, a typical NMR signal has two peaksthat indicate where the spins have rotated through 90 (Figure 7). The peakheights are proportional to the 3He polarization, so the change in NMR peakheights over time is a good measure of how much polarization is lost duringmeasurements.
3.6 Determining the Alkali Ratio
When a cell is filled with 3He and alkali metals, the ratio of quantities of rubid-ium and potassium isn’t immediately known. Fortunately there is a procedureto retroactively determine the alkali ratio using EPR. During an amplitudemodulated (AM) sweep, the holding field is slowly increased from its startingvalue and the photodiode records the amount of light given off by alkali electrontransitions with a constant EPR frequency. At certain field values, resonancesoccur and the light intensity drops. The light intensity as a function of holdingfield strength becomes a series of negative peaks on an otherwise constant levelof background noise (Figure 8). Each peak represents one Zeeman transition
12

Figure 7: NMR signal as the holding field is swept up and back down withconstant NMR frequency.
Figure 8: AM sweep on cell “Symon”. Peaks from left to right are: 41K (mF =−1 ↔ −2), 39K (mF = −1 ↔ −2), 39K (mF = 0 ↔ −1), 87Rb (mF = −1 ↔−2), 87Rb (mF = 1↔ 0), and 87Rb (mF = 2↔ 1).
of a particular alkali metal, and the peaks can be used to determine the alkaliratio [3]:
D =
∑(39K) +
∑(41K)∑
(87Rb) +∑
(85Rb). (7)
In (7),∑
(39K) +∑41
K) is the sum of potassium peak areas and∑
(87Rb) +∑(85Rb) is the sum of rubidium peak areas.
In practice, the peaks of 85Rb are at a much higher holding field value than whatis generated (around 35 G). It is therefore a good approximation to substitute
the denominator of (7) with∑
(87Rb)0.2783 , where 0.2783 is the natural isotopic frac-
tion of 87Rb. The areas under the peaks are found by fitting each peak with aLorentzian profile [10]. The areas are calculated while decrementing the voltagesupply to the EPR RF frequency signal. The peak areas used in (7) are theextrapolated areas that would occur at VEPR = 0.
3.7 Finding Resonances for EPR
Before the lock-in amplifier can lock on a particular resonant frequency for EPR,all or most of the frequencies for rubidium and potassium must be located. Theprocess is similar to the one used to determine the alkali ratio. Instead ofsweeping the holding field, the RF frequency is increased with the holding field
13

Figure 9: An FM sweep used to locate the 39K (mF = −1 ↔ −2) resonance,shown here to be at around 9.48 MHz.
maintained at 13 G. The plot of photodiode signal as a function of RF frequencyis the derivative of the plot made by an AM sweep. The points where the signalcrosses the zero signal mark (AM sweep minima) represent points of resonance(Figure 9). Although both frequency modulated (FM) sweeps and AM sweepsshow where resonances are, the FM sweep is more useful in this regard becausethe lock-in amplifier locks onto a frequency, not a holding field value.
3.8 Tests on Cell “Symon”
To test and calibrate the system, a cylindrical cell 20 cm in length and 1.3 cmin outer diameter was filled with 3He gas and small quantity of a rubidium-potassium mixture. The cell inner volume was 12.88 mL and the 3He densitywas found to be 7.97 amg. The cell’s alkali ratio was determined with an AMsweep from 20 G to 27 G at an RF frequency of 17.5 MHz in Vrf increments of2V from 12V to 2V.The first test was to optically pump the cell at 185 C with the primary laserovernight, then do several AFP-NMR sweeps to determine if there was a highenough cell polarization to perform the necessary measurements. The NMR RFfrequency was set to 53.6 kHz at 0.5Vrms and the holding field was rampedfrom 13 G to 21 G at a rate of 3 G/s. Studying the NMR signal also gave anindication as to the cell’s polarization loss during spin flips.Next, the EPR coil was tested by locating resonances with an FM sweep from8.9 MHz to 9.7 MHz and locking onto them one at a time. The last functionalitytest was to perform a spin flip and adjust the lock-in to maximize the photodiodesignal. As a final test of the whole system, the lock-in was locked onto the 39K(mF = −1 ↔ −2) transition and the primary beam was turned off. An AFP-NMR measurement was taken, followed by an AFP-EPR spin flip, followed byanother AFP-NMR measurement in succession with the probing beam on. Thenthe cell was rotated 90 to its second position and measurements were repeatedfor a total of 7 measurements of alternating cell positions. Polarization lossesand EPR signals were recorded.
14
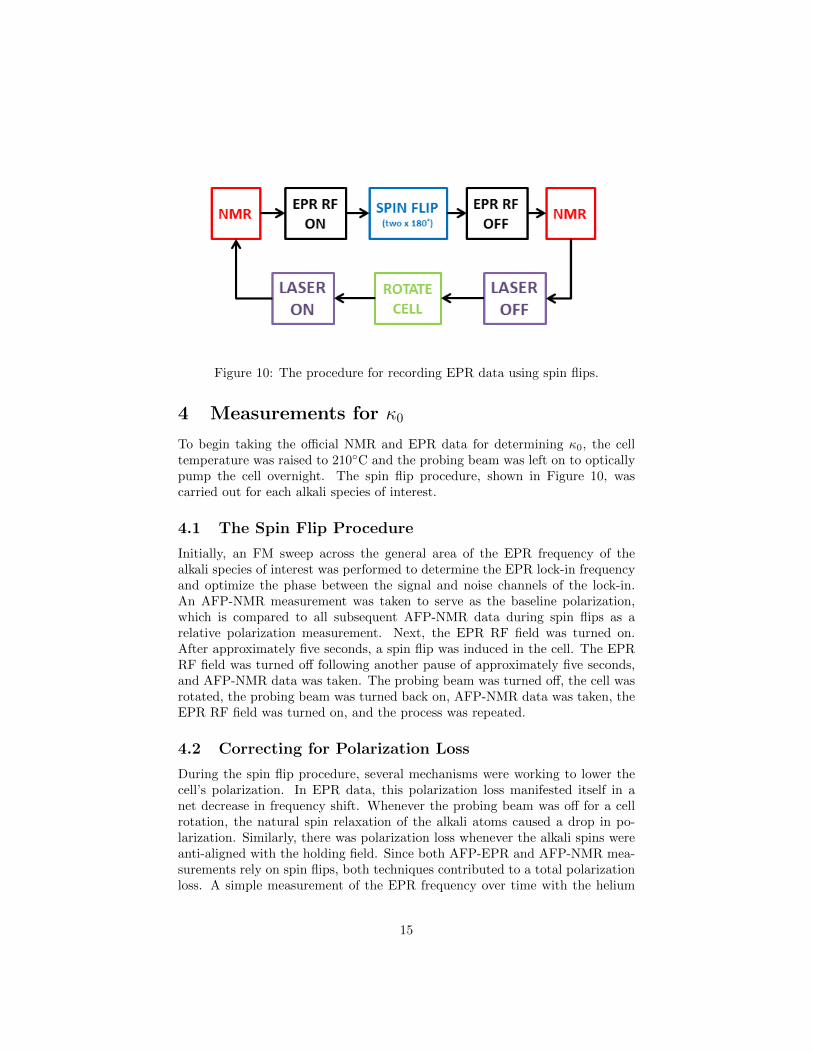
Figure 10: The procedure for recording EPR data using spin flips.
4 Measurements for κ0
To begin taking the official NMR and EPR data for determining κ0, the celltemperature was raised to 210C and the probing beam was left on to opticallypump the cell overnight. The spin flip procedure, shown in Figure 10, wascarried out for each alkali species of interest.
4.1 The Spin Flip Procedure
Initially, an FM sweep across the general area of the EPR frequency of thealkali species of interest was performed to determine the EPR lock-in frequencyand optimize the phase between the signal and noise channels of the lock-in.An AFP-NMR measurement was taken to serve as the baseline polarization,which is compared to all subsequent AFP-NMR data during spin flips as arelative polarization measurement. Next, the EPR RF field was turned on.After approximately five seconds, a spin flip was induced in the cell. The EPRRF field was turned off following another pause of approximately five seconds,and AFP-NMR data was taken. The probing beam was turned off, the cell wasrotated, the probing beam was turned back on, AFP-NMR data was taken, theEPR RF field was turned on, and the process was repeated.
4.2 Correcting for Polarization Loss
During the spin flip procedure, several mechanisms were working to lower thecell’s polarization. In EPR data, this polarization loss manifested itself in anet decrease in frequency shift. Whenever the probing beam was off for a cellrotation, the natural spin relaxation of the alkali atoms caused a drop in po-larization. Similarly, there was polarization loss whenever the alkali spins wereanti-aligned with the holding field. Since both AFP-EPR and AFP-NMR mea-surements rely on spin flips, both techniques contributed to a total polarizationloss. A simple measurement of the EPR frequency over time with the helium
15

Figure 11: The EPR frequency shift is shown to decrease with time due topolarization loss. Blue line: ∆νEPR‖ . Red line: ∆νEPR⊥ . One measurementon the x-axis is 0.6 seconds.
spins anti-aligned showed a loss rate of 0.013% per second, which corresponds to0.26% loss per spin flip. A third mechanism is the EPR RF field, which slowlydepolarizes the cell whenever it is on. EPR data taken while the EPR RF fieldwas on showed a negligible loss due to this effect. A final factor, which wasunforeseen during measurements, seems to have the biggest contribution to thecell’s polarization loss: the cell rotation. If the cell is rotated too quickly, thenthe AFP conditions for the helium nuclei to stay aligned with the holding fieldaren’t met.The relative polarization measurements provided by the frequent NMR data wasthought to be an excellent way to correct for any loss in polarization. The NMRpeak heights were to be graphed as a function of time and fitted linearly, withthe goal of using the slope of the fit line to modify the frequency shift values sothat they were approximately constant with time. However, the RF pickup coilsmounted inside the cell oven were not fixed at the exact center of the cell, norwere they exactly orthogonal to the NMR coils; therefore, NMR data showeddiscontinuities in polarization each time the cell was rotated. The NMR datawas useful in showing the polarization loss of the cell in one set orientation, butnot in showing the polarization loss as the cell was rotated. Fortunately, thevalues of ∆νEPR themselves could be used to determine the polarization lossas they were shown to decrease linearly with time (Figure 11, shown here us-ing 39K). Although this way of correcting the frequency shifts introduced moreuncertainty into the study, the uncertainties were small enough that it wouldsuffice.
5 Results
The AM sweep showed remarkably well-defined alkali peaks, most notably the87Rb (−1 ↔ −2) transition, which was previously unresolvable. The relatively
16

Figure 12: EPR-AFP data. The large discontinuities represent spin flips, andone measurement on the x-axis takes 0.6 seconds.
high amount of rubidium reflects the higher vaporization temperature of potas-sium: at the average cell temperature, there was more rubidium vapor present inthe cell. The cell alkali ratio (potassium to rubidium) was found to be D = 0.723at 185C.NMR-AFP tests showed that the usable signal detected by the RF pickup coilswas small when compared to the background noise. The huge amount of noisewas a result of imperfect alignment of the pickup coils within the larger RF andholding fields. The signal-to-noise ratio was made worse by the low initial celltemperature of 185C. At that temperature, a small amount of rubidium andalmost no potassium were in vapor form, which led to a low spin exchange rate.Therefore, the small signal size reflected a very low cell polarization rather thandefects in the instrumentation. Increasing the signal gain and adjusting thelock-in phase to put as much of the noise into the lock-in’s y channel produceda clean NMR signal with the characteristic twin peaks (Figure 7). During themeasurements for κ0, the cell temperature was at 210C and the NMR signalswere accordingly better defined. The steady decline of induced voltage in theRF pickup coils from the first measurement to the last was due to polarizationloss.An FM sweep from 8.5 MHz to 10 MHz at 14 V with a 13 G holding field showedseveral resonances, some of which were too close together to properly resolve.The three largest slopes, consistent with the AM sweep, were 41K (1 ↔ 0),39K (−1 ↔ −2), and 87Rb (−1 ↔ −2) at 8.8 MHz, 9.5 MHz, and 9.1 MHz,respectively.The 39K (−1 ↔ −2), 87Rb (−1 ↔ −2), and 41K (1 ↔ 0) transitions weresuccessfully locked on, and the EPR frequency shifts ∆νEPR⊥ and ∆νEPR‖
were measured over 7 spin flips for each alkali species. The results for 41K arepictured in Figure 12 and summarized in Table 1.
Similar data was taken for 39K (−1↔ −2) at 210C. The NMR data takenin between EPR measurements was inconclusive due to the errors created when
17

Table 1: EPR Frequency Shifts
Measurement Cell Orientation ∆νEPR (kHz)1 ⊥ 16.56 ± 0.0442 ‖ 18.480 ± 0.0443 ⊥ 15.80 ± 0.0564 ‖ 17.20 ± 0.0625 ⊥ 14.90 ± 0.0666 ‖ 16.36 ± 0.0817 ⊥ 14.10 ± 0.065
Table 2: κ0Alkali Species κ0(210 C)
87Rb 7.3 ± 0.3339K 8.8 ± 0.1541K 6.9 ± 0.19
rotating the cell.The value of ∆νEPR for each spin flip was computed using a weighted averageof the two shifts on either side of the flip. These averaged values were plottedas a function of EPR measurement number (one measurement = 0.6 seconds)and fitted linearly. The slope of the fit line was used to correct for polarizationloss, and then the corrected values were combined with a weighted average toobtain the final values of ∆νEPR⊥ and ∆νEPR‖ . The value of κ0 was obtaineddirectly from these two values. As corroboration for the apparently low polar-ization losses seen in the EPR measurements, the AFP polarization loss wasalso calculated by running ten NMR sweeps in rapid succession (0.01 minutesbetween sweeps). The average polarization loss per measurement was found tobe 0.74% for the up sweep and 0.76% for the down sweep.Finally, the EPR data and ∆νEPR values were sufficiently precise to calculatethe values of κ0 at 210 C (Table 2):
6 Ongoing Tests with Cell “Wurst”
In order to reach a higher level of precision than was possible with the ex-perimental setup used in the above sections, a new experimental apparatuswas constructed. Most notably, new NMR pickup coils were made to addressthe errors in NMR measurements mentioned in Section 5. Both of these coilswere constructed from 160 turns of 22-gauge copper wire, wrapped on fiberglassframes with cross-sectional area of 23 cm by 4 cm. Instead of being mountedinside the cell oven, these coils were externally mounted on a frame of threadedfiberglass rods. The new design allowed for a higher sensitivity to NMR signals,as well as improved adjustability to eliminate noise from the RF coils or holding
18
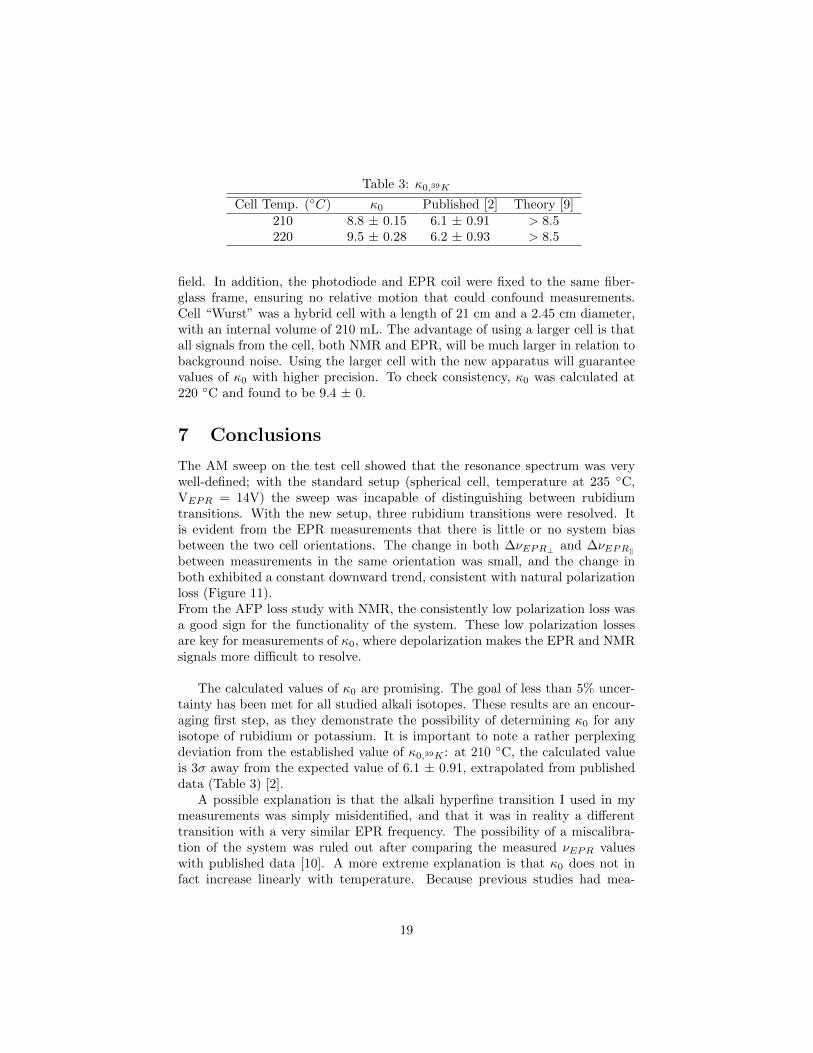
Table 3: κ0,39K
Cell Temp. (C) κ0 Published [2] Theory [9]210 8.8 ± 0.15 6.1 ± 0.91 > 8.5220 9.5 ± 0.28 6.2 ± 0.93 > 8.5
field. In addition, the photodiode and EPR coil were fixed to the same fiber-glass frame, ensuring no relative motion that could confound measurements.Cell “Wurst” was a hybrid cell with a length of 21 cm and a 2.45 cm diameter,with an internal volume of 210 mL. The advantage of using a larger cell is thatall signals from the cell, both NMR and EPR, will be much larger in relation tobackground noise. Using the larger cell with the new apparatus will guaranteevalues of κ0 with higher precision. To check consistency, κ0 was calculated at220 C and found to be 9.4 ± 0.
7 Conclusions
The AM sweep on the test cell showed that the resonance spectrum was verywell-defined; with the standard setup (spherical cell, temperature at 235 C,VEPR = 14V) the sweep was incapable of distinguishing between rubidiumtransitions. With the new setup, three rubidium transitions were resolved. Itis evident from the EPR measurements that there is little or no system biasbetween the two cell orientations. The change in both ∆νEPR⊥ and ∆νEPR‖
between measurements in the same orientation was small, and the change inboth exhibited a constant downward trend, consistent with natural polarizationloss (Figure 11).From the AFP loss study with NMR, the consistently low polarization loss wasa good sign for the functionality of the system. These low polarization lossesare key for measurements of κ0, where depolarization makes the EPR and NMRsignals more difficult to resolve.
The calculated values of κ0 are promising. The goal of less than 5% uncer-tainty has been met for all studied alkali isotopes. These results are an encour-aging first step, as they demonstrate the possibility of determining κ0 for anyisotope of rubidium or potassium. It is important to note a rather perplexingdeviation from the established value of κ0,39K : at 210 C, the calculated valueis 3σ away from the expected value of 6.1 ± 0.91, extrapolated from publisheddata (Table 3) [2].
A possible explanation is that the alkali hyperfine transition I used in mymeasurements was simply misidentified, and that it was in reality a differenttransition with a very similar EPR frequency. The possibility of a miscalibra-tion of the system was ruled out after comparing the measured νEPR valueswith published data [10]. A more extreme explanation is that κ0 does not infact increase linearly with temperature. Because previous studies had mea-
19

sured κ0 at temperatures between 70 and 170 C, it was only assumed thatthe linear relationship would continue for higher temperatures. It should benoted that my value corroborates well with the existing theory-based estimateof κ0,39K(100C) = 8.5 [9], which may indicate that my calculation isn’t faroff. Once the question of the κ0,39K is resolved, the next step in the processis to take measurements at lower temperatures to determine the temperaturedependence of κ0. Measurements of κ0 for 41K, 39K, and 87Rb with improvedprecision are underway.
20

References
[1] M. V. Romalis and G. D. Cates, Phys. Rev. A 58 (1998) 3004.
[2] E. Babcock et al, Phys. Rev. A 71 (2005) 013414.
[3] A. B. Baranga et al, Phys. Rev. Lett. 80 (1998) 2801.
[4] A. S. Barton et al, Phys. Rev. A 49 (1994) 2766.
[5] A. Abragam, Principles of Nuclear Magnetism (Oxford University Press,1990).
[6] M. J. Duer, Solid-State NMR Spectroscopy (Blackwell Publishing, 2004).
[7] J. Friar, B. Gibson et al, Phys. Rev C 42 (1990) 2310.
[8] T. Walker and W. Happer, Rev. Mod. Phys. 69 (1997) 629.
[9] T. Walker, Phys. Rev. A 40 (1989) 4959.
[10] J. Singh, Ph.D. thesis, University of Virginia (2010).
21