Power transactions and trends - Ernst & · PDF file · 2017-11-14... Power...
24
Power transactions and trends : Q3 2017
-
Upload
hoangquynh -
Category
Documents
-
view
214 -
download
1
Transcript of Power transactions and trends - Ernst & · PDF file · 2017-11-14... Power...
Power transactions and trends: Q3 2017
| Power transactions and trends: Q3 20172
Contents
On the web or on the move Power transactions and trends is also available online at ey.com/ptt.
EY Global Transaction Advisory Services (TAS) Power & Utilities (P&U) contactsMatt RennieEY Global TAS P&U Leader+61 7 3011 [email protected] @MattRennie_EY
Sara RichardsonEY Global TAS P&U Associate Director and Resident+61 7 3243 [email protected] @sararichardson2
Shikhar GuptaEY Global P&U Analyst+91 124 470 [email protected] @ShikharGupta_EY
Anjushi JoshiEY Global P&U Analyst+91 124 469 [email protected] @anjushi_joshi
3
3 Overview
6 Europe
11 Asia-Pacific
16 Americas
21 Africa and the Middle East
11
21
16
6
3Power transactions and trends: Q3 2017 |
Industry consolidation heats up as M&A reaches two-year high
Overview
Megadeals in networks, IPPs and integrated utilities drive deal value
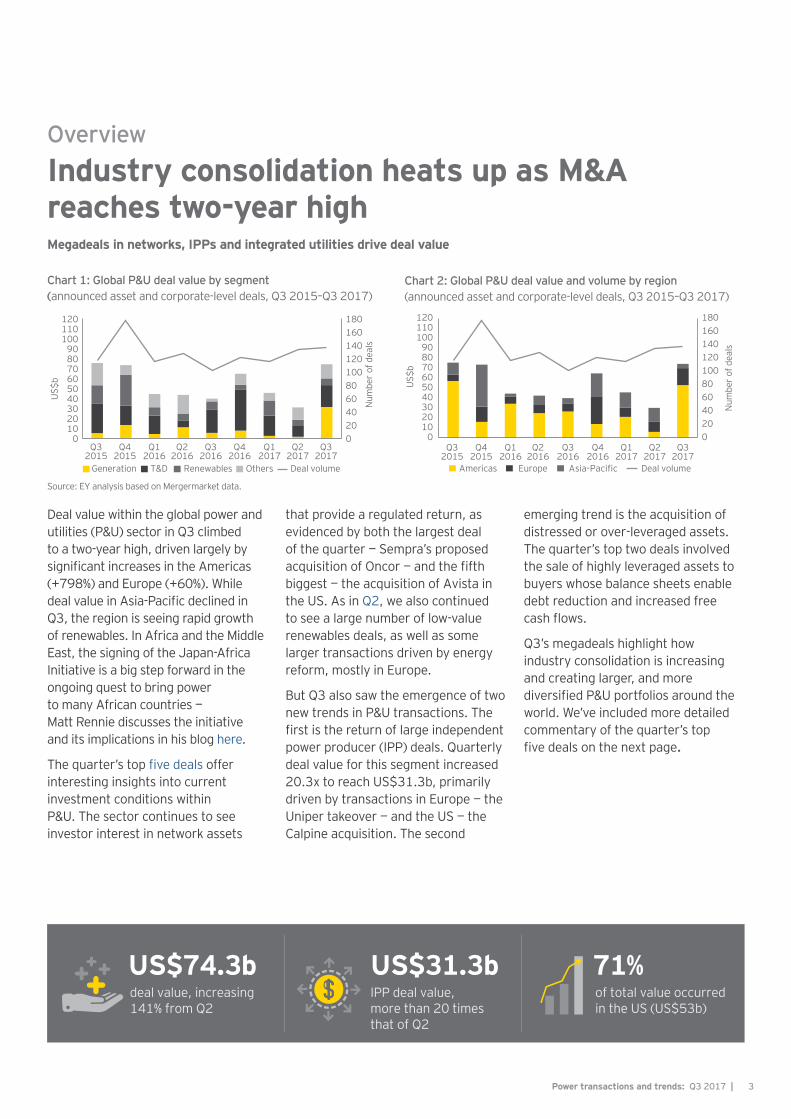
Chart 2: Global P&U deal value and volume by region (announced asset and corporate-level deals, Q3 2015–Q3 2017)
020406080100120140160180
0102030405060708090
100110120
Q32015
Q42015
Q12016
Q22016
Q32016
Q42016
Q12017
Q22017
Q32017
Num
ber
of d
eals
US$
b
Americas Europe Asia-Pacific Deal volume
Deal value within the global power and utilities (P&U) sector in Q3 climbed to a two-year high, driven largely by significant increases in the Americas (+798%) and Europe (+60%). While deal value in Asia-Pacific declined in Q3, the region is seeing rapid growth of renewables. In Africa and the Middle East, the signing of the Japan-Africa Initiative is a big step forward in the ongoing quest to bring power to many African countries — Matt Rennie discusses the initiative and its implications in his blog here.
The quarter’s top five deals offer interesting insights into current investment conditions within P&U. The sector continues to see investor interest in network assets
that provide a regulated return, as evidenced by both the largest deal of the quarter — Sempra’s proposed acquisition of Oncor — and the fifth biggest — the acquisition of Avista in the US. As in Q2, we also continued to see a large number of low-value renewables deals, as well as some larger transactions driven by energy reform, mostly in Europe.
But Q3 also saw the emergence of two new trends in P&U transactions. The first is the return of large independent power producer (IPP) deals. Quarterly deal value for this segment increased 20.3x to reach US$31.3b, primarily driven by transactions in Europe — the Uniper takeover — and the US — the Calpine acquisition. The second
emerging trend is the acquisition of distressed or over-leveraged assets. The quarter’s top two deals involved the sale of highly leveraged assets to buyers whose balance sheets enable debt reduction and increased free cash flows.
Q3’s megadeals highlight how industry consolidation is increasing and creating larger, and more diversified P&U portfolios around the world. We’ve included more detailed commentary of the quarter’s top five deals on the next page.
US$74.3b deal value, increasing 141% from Q2
US$31.3b IPP deal value, more than 20 times that of Q2
71%of total value occurred in the US (US$53b)
Chart 1: Global P&U deal value by segment (announced asset and corporate-level deals, Q3 2015–Q3 2017)
020406080100120140160180
0102030405060708090
100110120
Q32015
Q42015
Q12016
Q22016
Q32016
Q42016
Q12017
Q22017
Q32017
Num
ber
of d
eals
US$
b
Generation T&D Renewables Others Deal volume
Source: EY analysis based on Mergermarket data.

| Power transactions and trends: Q3 20174
Top five global deals, Q3 20171. Sempra’s acquisition of Oncor US$18.8b, US California-based utility Sempra Energy has tabled an offer to buy a 60% stake in Oncor Electric Delivery Company LLC from financially distressed utility Energy Future Holdings (EFH) for US$18.8b, including US$9.35b of debt. Sempra outbid Berkshire Hathaway’s US$9b offer, which was opposed by EFH’s largest creditor. Through this deal, Sempra will gain Oncor’s electricity distribution assets and add 10 million Texas-based customers to its base. Sempra’s existing portfolio is focused on growth in unregulated segments, including electricity retail, which is marked by flat to declining consumption. By acquiring Oncor’s regulated assets, Sempra aims to realign its risk allocation, maintain its credit rating and access a customer base that shows signs of growth. Sempra is paying EFC the equivalent of 23 times Oncor’s earnings and has also committed to invest US$1.5b per year, which will drive 6% annual growth in Oncor’s earnings through 2021. The transaction is expected to be completed in the first half of 2018 and is subject to closing conditions and other regulatory approvals.
2. Purchase of Calpine by a consortium led by Energy Capital Partners US$17b, US A consortium led by private equity firm Energy Capital Partners (ECP), and including Access Industries, Inc. and Canada Pension Plan Investment Board (CPPIB), agreed to buy US-based IPP Calpine Corporation in a deal valued at US$17b, including US$5.5b in cash
and US$11.5b in debt, after Calpine announced its intention to sell earlier this year. Calpine is one of the US’s few remaining highly levered, publicly listed power generators. Publicly owned IPPs are seeking to address high leverage ratios to a level of 4x to 5x net-debt-to-EBITDA as investors and credit agencies are becoming concerned about debt levels. The deal was concluded at a premium of 51% above Calpine’s unaffected stock price prior to the announcement. The transaction will strengthen the financial position of debt-burdened Calpine as ECP looks to reduce debt alongside a longer-term view to pivot Calpine’s strategy, a feat more easily achieved when the company is privately held. ECP is one of the most active private equity players in the US power sector and brings deep industry expertise and a long-term investment horizon. After the deal announcement, Calpine’s share price jumped 9.6% to US$14.80 on 18 August 2017 — the highest since July 2016. The transaction was unanimously approved by Calpine’s Board, although finalization of the transaction requires shareholder approval and other necessary regulatory filings.
3. Fortum’s takeover of Uniper US$11.5b, Germany Finnish clean energy utility Fortum has launched a takeover for a minority stake (46.65%) in Uniper SE, the conventional generation spin-off of German utility E.ON, for US$11.5b. The offer represents about a 4.5% premium to Uniper’s closing price on the offer date. The transaction has taken Uniper by surprise and left some analysts questioning the rationale behind the bid. Despite Fortum stating it will be a long-term strategic
investor, there are suggestions that the company is targeting Uniper’s European hydropower and nuclear assets with an eye to furthering its clean energy vision. Some say that Fortum will sell Uniper’s thermal generation plants upon completion of the transaction. The deal is expected to be completed in mid-2018, subject to competition of final approvals and other customary closing conditions.
4. Westar Energy and Great Plains Energy merger US$8.2b, US The all-share merger of US vertically integrated utilities Westar Energy and Great Plains Energy for a transaction value of US$8.2b creates a new company, Monarch Energy Holding, Inc, with a combined equity value of US$14b, 13,000 MW of generation capacity, almost 10,000 miles of transmission lines and more than 51,000 miles of distribution lines. Great Plains had made a previous attempt to buy Westar, but the move was blocked by state regulators after a year of consolidation discussions. This transaction allows both entities to benefit from complementary operations, adjacent territories, shared generation assets and an expanded footprint. The combined company is expected to have a strong balance sheet and improved free cash flows, and is expected to create cost savings and net synergies of US$35m to US$45m in 2018 and US$140m to US$170m by 2021 respectively. The deal is pending approvals from shareholders of both companies and other regulators, including the Federal Energy Regulatory Commission and the Nuclear Regulatory Commission.

5Power transactions and trends: Q3 2017 |
USInvestment value US$50.9b (69%)
UKInvestment value US$0.9b (1%)
CanadaInvestment value US$6.3b (25%)
SingaporeInvestment value US$0.9b (4%)
ChinaInvestment value US$1.6b (6%)
Investment value US$2.2b (8%)
SpainInvestment value US$1.8b (3%)
FinlandInvestment value US$11.5b (45%)
Rest of the worldInvestment value $5.1b (7%)
*Note: numbers may not add to total due to rounding.
Investment value US$2.9b (11%)
Top investment destinations Top outbound investing countries
PeruInvestment value US$1.4b (2%)
TotalInvestment value US$74.3b Investment value US$25.3b
GermanyInvestment value US$12.9b (17%)
PhilippinesInvestment value US$1.3b (2%)
Image 1: Global investment activity by country, (Q3 2017)*
5. Hydro One’s acquisition of Avista US$5.2b, US The acquisition by Canadian network company Hydro One Limited of US-based integrated utility Avista Corporation will create a combined entity with assets worth US$25.4b and more than two million customers across North America, including
Ontario, Washington, Oregon, Idaho, Montana and Alaska. The purchase price is about 11.2x Avista’s EBIDTA, a premium compared to an average of 9.3x for comparable deals. The acquisition allows Hydro One to diversify into the US, a market that is seen as providing higher regulated rates of return than those in Canada.
Hydro One expects the deal to be accretive to its earnings per share in the first full year of operations and is targeting scale efficiencies, shared IT systems and increased purchasing power.

| Power transactions and trends: Q3 20176
EuropeMegadeals behind big increase in deal value
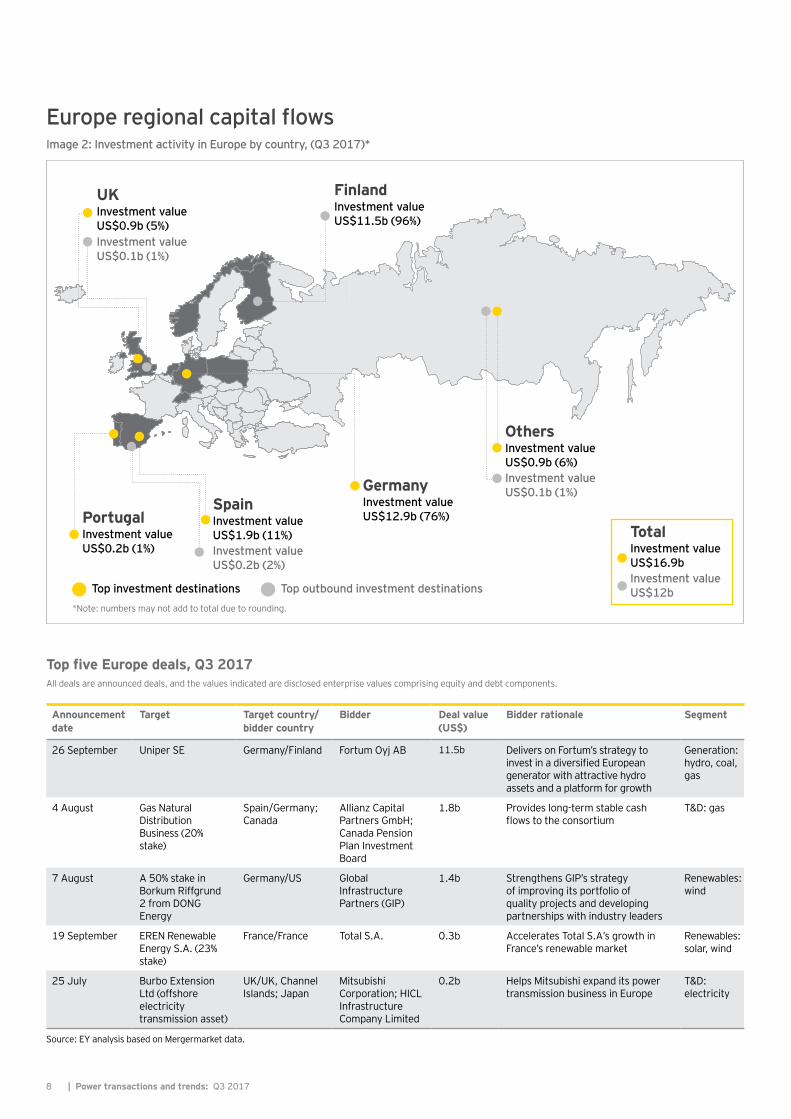
In Q3, deal value in Europe’s power and utilities (P&U) sector increased to US$16.9b, up 60% from US$10.6b in Q2. Almost all (87%) of deal value was contributed by just three billion-dollar-plus deals, involving the sale of generation assets, a distribution business and wind assets. As seen in the Americas, independent power producer (IPP) transactions are making headlines — the implications of Fortum’s takeover of Uniper, the fossil fuel and trading business spin-off of E.ON, continue to unfold.
Besides the Fortum deal, Europe’s baseline deal flow continues to be driven by a large number of low-value renewables transactions, as well as asset privatizations. In Q3, 35 clean energy deals totaled US$3.2b. The renewables sector is increasing collaboration with financial investors, as seen in the US$1.4b sale by Denmark’s state-owned DONG Energy of its wind farm Borkum Riffgrund 2 (50% stake) to Global Infrastructure Partners.
The DONG Energy transaction also highlights how asset privatizations are driving much of the European sector’s deal value. During Q3, the Turkish Government sold
38 MW of hydro generation assets to Kilic Enerji Uretim, a Turkey-based power company, for US$37m, while, in France, the Government sold 4.5% of its holdings in gas utility Engie. The French deal kicks off a larger, strategic privatization program aimed at redeploying state funds into innovative energy start-up companies.
US$16.9b deal value, an increase of 60% quarter-on-quarter
35deals in renewable energy, more than 60% of the region’stotal deal volume
Power transactions and trends Q3 2017
Chart 3: Europe deal value and volume, by segment(announced asset and corporate-level deals, Q3 2015–Q3 2017)
–5
5
15
25
35
45
55
65
0
5
10
15
20
25
30
35
40
Q32015
Q42015
Q12016
Q22016
Q32016
Q42016
Q12017
Q22017
Q32017
Num
ber
of d
eals
US$
b
Generation T&D Renewables Others Deal volume
Source: EY analysis based on Mergermarket data.

7Power transactions and trends: Q3 2017 |
Q3 2017 transactional highlights• Biggest deal of the quarter in
generation: Europe’s top deal in Q3 — contributing 68% of total deal value — is the US$11.5b acquisition of a 46.7% stake in Germany’s Uniper SE by Fortum, an integrated assets company based in Finland. Fortum’s unsolicited takeover appears to be targeting Uniper’s hydropower assets, with concerns that Uniper may be broken up at the deal’s conclusion.
• Corporate investors target larger deals: corporate investors conducted 42 deals with an average deal size of US$617m, a 157% increase from their Q2 average deal size of US$239m. Financial investors conducted
16 transmission and distribution (T&D) and renewables deals with an average size of US$306m, a 20% decrease in size from Q2.
• Decreasing investment in networks: despite more European network deals — 10 in Q3 compared with 8 in Q2 — the value of these transactions halved from US$4.3b last quarter to US$2.1b in Q3.
• Germany was the deal hotspot: Germany hosted nine deals totaling US$12.9b — 76% of the region’s overall deal value.
• More investment in wind energy: deals in wind energy assets are outpacing those in solar, as margins decrease in the latter.
Q3 saw 15 wind deals (including one combined wind-solar deal), compared with 13 in solar, with transactions in wind energy contributing US$2.8b or 85% of all renewables deal value.
• High number of low-value renewables deals: as seen in Q2, deal volume continues to be driven by low-value renewables deals. While the region’s third- and fourth-biggest deals were in renewables this quarter, the remaining 33 clean energy deals averaged just US$71m.
| Power transactions and trends: Q3 20178
UKInvestment value US$0.9b (5%)
SpainInvestment value US$1.9b (11%)
*Note: numbers may not add to total due to rounding.
PortugalInvestment value US$0.2b (1%)
OthersInvestment value US$0.9b (6%)Investment value US$0.1b (1%)
FinlandInvestment value US$11.5b (96%)
GermanyInvestment value US$12.9b (76%)
TotalInvestment value US$16.9bInvestment value US$12bTop investment destinations Top outbound investment destinations
Investment value US$0.1b (1%)
Investment value US$0.2b (2%)
Image 2: Investment activity in Europe by country, (Q3 2017)*
Source: EY analysis based on Mergermarket data.
Top five Europe deals, Q3 2017All deals are announced deals, and the values indicated are disclosed enterprise values comprising equity and debt components.
Announcement date
Target Target country/bidder country
Bidder Deal value (US$)
Bidder rationale Segment
26 September Uniper SE Germany/Finland Fortum Oyj AB 11.5b Delivers on Fortum’s strategy to invest in a diversified European generator with attractive hydro assets and a platform for growth
Generation: hydro, coal, gas
4 August Gas Natural Distribution Business (20% stake)
Spain/Germany; Canada
Allianz Capital Partners GmbH; Canada Pension Plan Investment Board
1.8b Provides long-term stable cash flows to the consortium
T&D: gas
7 August A 50% stake in Borkum Riffgrund 2 from DONG Energy
Germany/US Global Infrastructure Partners (GIP)
1.4b Strengthens GIP’s strategy of improving its portfolio of quality projects and developing partnerships with industry leaders
Renewables: wind
19 September EREN Renewable Energy S.A. (23% stake)
France/France Total S.A. 0.3b Accelerates Total S.A’s growth in France’s renewable market
Renewables: solar, wind
25 July Burbo Extension Ltd (offshore electricity transmission asset)
UK/UK, Channel Islands; Japan
Mitsubishi Corporation; HICL Infrastructure Company Limited
0.2b Helps Mitsubishi expand its power transmission business in Europe
T&D: electricity
Europe regional capital flows

9Power transactions and trends: Q3 2017 |
Valuations snapshotIn Q3, the European energy sector traded at a two-year forward EV/EBITDA (enterprise value by earnings before interest, tax, depreciation and amortization) ratio of 8.3x, a premium of 6% above the long-term average of 7.8x, driven by continued increases in T&D valuations. The sector is trading at a two-year forward price-to-earnings (P/E) multiple of 15.8x, a premium of 18% above the long-term forward multiple of 13.4x.
During Q3, T&D assets traded at a two-year forward EV/EBITDA ratio of 10.9x, decreasing 6.7% from Q2, but still representing a premium of 11% compared with the long-term 10-year average of 9.6x. The two-year forward P/E ratio dropped 4.3% from Q2 to 14.2x, but still traded at a 5% premium compared with the long-term average of 13.5x. The continued appeal of these assets is highlighted by the US$1.8b acquisition by Allianz Capital Partners GmbH and Canada Pension Plan Investment Board of a 20% stake in the Gas Natural Fenosa’s business in Spain, which represented 15.7x EV/EBITDA.
Integrated utilities remained at a two-year forward EV/EBITDA ratio of 7.1x in Q3 compared with a long-term 10-year average of 6.8x. The two-year forward P/E ratio for the segment traded at 13.6x, a premium of 18% compared with the long-term average of 11.6x. With no large transactions in
this sector, valuations continue to hold.
During Q3, the two-year forward EV/EBITDA ratio for renewable energy assets continued to trade at 7x, in line with the long-term average. The two-year P/E multiple decreased 2% to 19.6x, a premium of 30% compared with the long-term average P/E multiple of 15.1x.
Investors continue to struggle to attach a premium to IPP assets in the region. This can be evidenced by Fortum’s takeover bid of US$22 per share for Uniper — just a 5% premium to Uniper’s share price. Despite initial increases, Fortum’s shares fell 3.5% after the takeover was announced.
Chart 4: Average EV/EBITDA trading multiples for select utilities (on FY2 consensus earnings-per-share estimates, 2011–Q3 2017)
0
2x
4x
6x
8x
10x
12x
14x
Sep2011
Sep2012
Sep2013
Sep2014
Sep2015
Sep2016
Sep2017
T&D Integrated Renewables
Chart 5: Average P/E trading multiples for select utilities (on FY2 consensus earnings-per-share estimates, 2011–Q3 2017)
0
5x
10x
15x
20x
25x
Sep2011
Sep2012
Sep2013
Sep2014
Sep2015
Sep2016
Sep2017
T&D Integrated Renewables
Note: the valuations analysis only contains pure-play publicly listed companies in each relevant market segment. Sources: Bloomberg and EY analysis.

| Power transactions and trends: Q3 201710
M&A capital outlook and investment hotspots• Investment in wind assets to
continue: investors will continue to target European wind assets. Germany is setting up 1 GW of onshore wind capacity through a competitive bidding process. Scottish Power Renewables has been granted approval to develop 1 GW offshore wind capacity off the UK’s Norfolk coast.
• Increased interest in electric vehicles (EVs) and battery technology: ChargePoint and Engie have announced a partnership to build a pan-European network of high-voltage, fast-charging stations that aim to recharge EVs in 30 minutes. The UK has launched a US$320m fund to boost the development and manufacturing of battery storage.
• More sector convergence: French oil and gas company Total S.A. acquired a 23% stake in renewable energy company EREN. Norway’s multinational oil and gas company Statoil has won a license to develop a wind farm in New York, highlighting an increasing push to diversify horizontally.
• Spain continues to attract investors: Enel Green Power España has been awarded a US$318m tender by the Spanish Government to develop 339 MW of solar capacity by 2019. The project aims to help Spain meet its 2020 target to source 20% of its energy from renewables.
• UK’s Clean Growth Strategy to boost renewables: in October, the UK Government announced the launch of its Clean Growth Strategy, which will invest more than £2.5b (approximately US$3.3b) in renewables and new energy technologies through 2020. The Government says the strategy puts clean growth at the heart of its plans to boost the economy while meeting the UK’s climate change goals.
EY Europe Transaction Advisory Services P&U contacts
Matt RennieGlobal TAS P&U LeaderBrisbane, Australia+61 7 3011 [email protected]
Arnaud De GiovanniHead of TAS P&U, EMEIAParis, France+33 1 55 61 04 [email protected]
Remigiusz ChlewickiCentral & Southern EuropeTAS P&U LeaderWarsaw, Poland+48 22 557 [email protected]
Edgars RagelsCommonwealth of Independent States TAS P&U Leader Moscow, Russia+7 495 755 [email protected]
Umberto NobileMediterranean TAS P&U LeaderMilan, Italy+39 02 8066 [email protected]
Martin SelterGermany, Switzerland and Austria TAS P&U LeaderBerlin, Germany+49 30 25471 [email protected]
Stéphane KraftWestern Europe and Maghreb TAS P&U Leader Paris, France+33 1 55 61 09 [email protected]
Michael BruhnNordics TAS P&U LeaderCopenhagen, Denmark+45 2529 [email protected]
John CurtinUK & Ireland TAS P&U LeaderLondon, UK+44 20 7951 [email protected]

11Power transactions and trends: Q3 2017 |
Asia-PacificDeal value decreases as renewables dominate
US$4.3b total deal value, a decrease of 68% quarter-on-quarter
77%of deal value (US$3.3b) contributed by renewables
Power transactions and trends Q3 2017
In Q3, the Asia-Pacific power and utilities (P&U) sector saw more deals but a significant decline in deal value as activity is increasingly dominated by renewables.
Renewable energy is no longer an emerging subsector in the region but a primary focus for investors who are targeting acquisitions, partnerships and greenfield projects. Most deals are still small but we are starting to see larger transactions — four of the region’s top five deals of the quarter were in clean energy.
The growth in renewable energy investment is not limited to developed markets. More investors are exploring deals in developing countries as demand grows for new energy technologies. The quarter’s largest deal was in the Philippines — the US$1.3b acquisition of a 31.5% stake in the country’s largest geothermal energy producer, Energy Development Corporation. In India, Engie SA and Dubai-based private equity firm Abraaj Group have formed a joint venture to invest more than US$1b in 1,000 MW of wind power. While conventional generation remains
an important part of the energy mix in some developing Asia-Pacific countries (the quarter saw conventional generation deals in China and South Korea), it’s clear that renewables are on the rise.
Chart 6: Asia-Pacific deal value and volume, by segment(announced asset and corporate-level deals, Q3 2015–Q3 2017)
5
15
25
35
45
55
65
5
15
25
35
45
55
Q32015
Q42015
Q12016
Q22016
Q32016
Q42016
Q12017
Q22017
Q32017
Num
ber
of d
eals
US$
b
Generation T&D Renewables Others Deal volume
Source: EY analysis based on Mergermarket data.

| Power transactions and trends: Q3 201712
Q3 2017 transactional highlights• Decline in value from network
and “others” deals: Q3 saw a big decrease in Asia-Pacific M&A in networks and “other” asset classes, with value from network deals dropping from US$6.5b in Q2 to US$0.02b and value from “others” declining from US$4.7b to US$0.4b in Q3.
• Renewables deal mix changes: M&A in geothermal energy contributed 39% of renewables deal value with two deals totaling US$1.3b. Nine solar and four wind deals contributed US$1.4b of deal value.
• China dominated thermal generation M&A: three of the region’s four generation deals were corporate domestic deals in China, with a total deal value of US$0.6b. One South Korean thermal deal contributed US$25m.
• Water and wastewater deal value increases: water and wastewater deal value increased from US$167m in Q2 to US$297m in Q3. Five of these six transactions were domestic corporate deals in China.
Image 3: Investment activity in Asia-Pacific by country, (Q3 2017)*
Top investment destinations Top outbound investment destinations
AustraliaInvestment value US$0.6b (16%)
TotalInvestment value US$4.3b
China
Investment value US$1.4b (33%)Investment value US$1.6b (39%)
JapanInvestment value US$0.7b (17%)
PhilippinesInvestment value US$1.3b (29%)
IndiaInvestment value US$0.6b (13%)
Investment value US$0.9b (22%)
OthersInvestment value US$0.4b (8%)
SingaporeInvestment value US$0.9b (23%)
*Note: numbers may not add to total due to rounding.
(mainland)
Investment value US$4.0b
Asia-Pacific regional capital flows

13Power transactions and trends: Q3 2017 |
Announcement date
Target Target country/bidder country
Bidder Deal value (US$)
Bidder rationale Segment
3 August Energy Development Corporation (EDC) (31.5% stake)
Philippines/ Australia, Singapore
Macquarie Infrastructure and Real Assets (MIRA) and GIC
1.3b Enables EDC to reduce debt and support growth initiatives
Renewables: geothermal
13 September Confidential Japanese developer of a 230 MW solar power plant
Japan/South Korea
Lantern Advisory & Investments
0.7b Provides buyer with stable returns Renewables: solar
29 July Inner Mongolia HMHJ Aluminum Electricity Co., Ltd. (51% stake); Tongliao Shengfa Thermal Power Co., Ltd. (90% stake)
China/China Huolinhe Opencut Coal Industry Corporation Limited of Inner Mongolia
0.4b Drives synergies and improves returns
Generation: thermal
5 August Zhangjiakou Yiyuan New Energy Development Co., Ltd.; Inner Mongolia Yili Kubuqi Ecological Energy Co., Ltd. (70% stake); Zhangjiakou Jingzhang Yinbin Langdao Ecological Energy Co., Ltd. (60% stake); Erdos Zhengli New Energy Power Co., Ltd. (49% stake); Shanghai Yiding Investment Center (land, property and equipment)
China/China Elion Clean Energy Company Limited
0.4b Helps Elion further diversify and grow its portfolio in solar and thermal energy
Renewables: solar
31 July First Solar, Inc. (seven solar power assets with total capacity of 190 MW)
India/India Infrastructure Development Finance Company (IDFC) Alternatives Limited
0.3b Helps IDFC achieve its target of aggregate operating renewable assets of 400 to 450 MW by the end of 2017
Renewables: solar
Top five Asia-Pacific deals, Q3 2017All deals are announced deals, and the values indicated are disclosed enterprise values comprising equity and debt components.
Source: EY analysis based on Mergermarket data.
| Power transactions and trends: Q3 201714
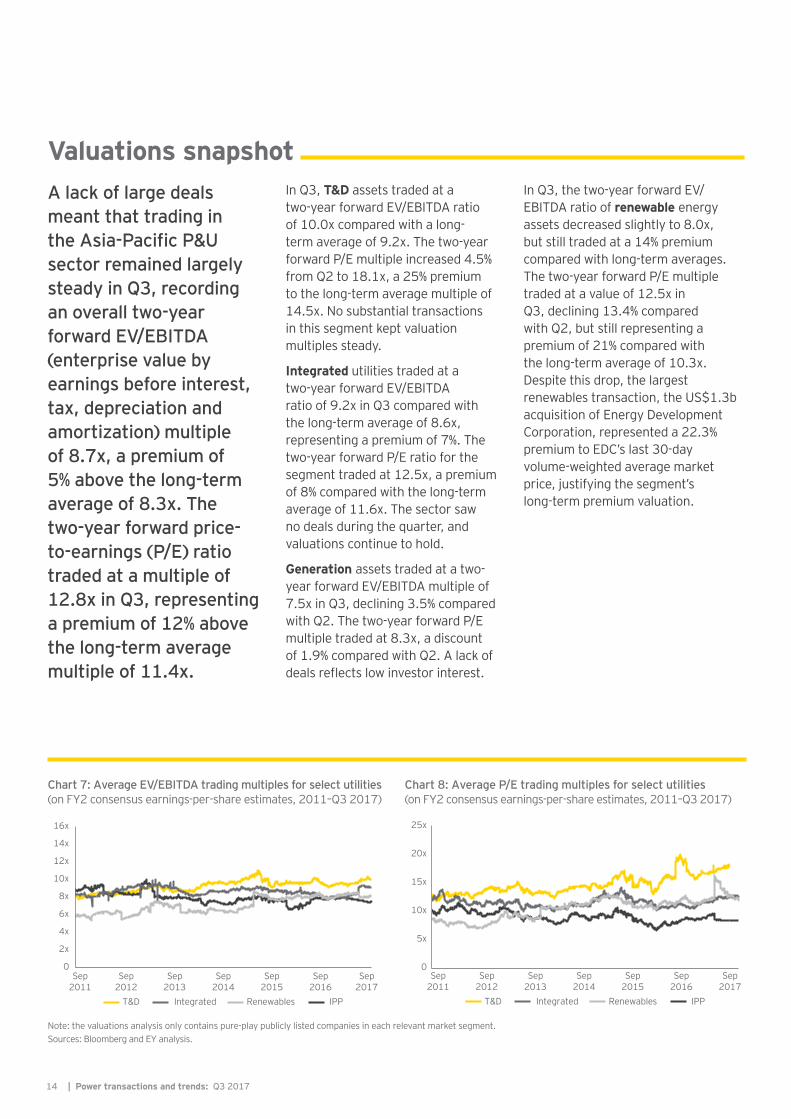
Valuations snapshot A lack of large deals meant that trading in the Asia-Pacific P&U sector remained largely steady in Q3, recording an overall two-year forward EV/EBITDA (enterprise value by earnings before interest, tax, depreciation and amortization) multiple of 8.7x, a premium of 5% above the long-term average of 8.3x. The two-year forward price-to-earnings (P/E) ratio traded at a multiple of 12.8x in Q3, representing a premium of 12% above the long-term average multiple of 11.4x.
Chart 7: Average EV/EBITDA trading multiples for select utilities (on FY2 consensus earnings-per-share estimates, 2011–Q3 2017)
0
2x
4x
6x
8x
10x
12x
14x
16x
Sep2011
Sep2012
Sep2013
Sep2014
Sep2015
Sep2016
Sep2017
T&D IPPIntegrated Renewables
Chart 8: Average P/E trading multiples for select utilities (on FY2 consensus earnings-per-share estimates, 2011–Q3 2017)
0
5x
10x
15x
20x
25x
Sep2011
Sep2012
Sep2013
Sep2014
Sep2015
Sep2016
Sep2017
T&D IPPIntegrated Renewables
In Q3, T&D assets traded at a two-year forward EV/EBITDA ratio of 10.0x compared with a long-term average of 9.2x. The two-year forward P/E multiple increased 4.5% from Q2 to 18.1x, a 25% premium to the long-term average multiple of 14.5x. No substantial transactions in this segment kept valuation multiples steady.
Integrated utilities traded at a two-year forward EV/EBITDA ratio of 9.2x in Q3 compared with the long-term average of 8.6x, representing a premium of 7%. The two-year forward P/E ratio for the segment traded at 12.5x, a premium of 8% compared with the long-term average of 11.6x. The sector saw no deals during the quarter, and valuations continue to hold.
Generation assets traded at a two-year forward EV/EBITDA multiple of 7.5x in Q3, declining 3.5% compared with Q2. The two-year forward P/E multiple traded at 8.3x, a discount of 1.9% compared with Q2. A lack of deals reflects low investor interest.
In Q3, the two-year forward EV/EBITDA ratio of renewable energy assets decreased slightly to 8.0x, but still traded at a 14% premium compared with long-term averages. The two-year forward P/E multiple traded at a value of 12.5x in Q3, declining 13.4% compared with Q2, but still representing a premium of 21% compared with the long-term average of 10.3x. Despite this drop, the largest renewables transaction, the US$1.3b acquisition of Energy Development Corporation, represented a 22.3% premium to EDC’s last 30-day volume-weighted average market price, justifying the segment’s long-term premium valuation.
Note: the valuations analysis only contains pure-play publicly listed companies in each relevant market segment.Sources: Bloomberg and EY analysis.
15Power transactions and trends: Q3 2017 |
M&A capital outlook and investment hotspots• China increases renewables
investment: China Three Gorges New Energy plans to raise approximately US$1.5b to develop its wind power business. China also aims to build 54.5 GW of large-scale solar projects and power 20 cities by geothermal energy by 2020. Qingdao Beihai has agreed to set up a 200 MW solar power plant in Kazakhstan.
• Renewables and new energy investment in India to heat up: Reliance Industries, a diversified company, and BP plan to invest in energy storage systems in India. French energy company Engie is planning to expand its presence in the Indian renewable energy space through its subsidiary Solairedirect
by setting up a 2 GW capacity by 2019. Finland’s Taaleri plans to buy solar power projects in India and has established the Taaleri Solar Wind fund to invest in overseas green energy assets.
• More developing countries adopt clean energy: Banpu, Thailand’s biggest coal company, has agreed to double its generation capacity by 2030 by investing in renewable energy projects across Cambodia, Laos, Vietnam and Myanmar.
• Nuclear consolidation in China: China has approved the integration of its two state nuclear developers into a single nuclear reactor brand that will expedite construction and increase competitiveness in
overseas markets. China plans to increase total nuclear capacity to as much as 200 GW by 2030.
• Outbound investment will increase: outbound investment increased from US$2.1b in Q2 to US$4.0b in Q3, and is set to rise further as Chinese utilities make overseas acquisitions. China Energy Engineering Corp. plans to invest US$1.2b in a coal power project in Bosnia. According to recent Reuters reports, State Grid Corp. and China Southern Power Grid have shown interest in acquiring British electricity company, UK Power Reserve, and Finland’s second-biggest electricity distributor, Elenia Oy.
EY Asia-Pacific Transaction Advisory Services P&U contacts
Matt RennieGlobal TAS P&U LeaderBrisbane, Australia+61 7 3011 [email protected]
Nick CardnoOceania TAS P&U LeaderSydney, Australia+61 2 9248 [email protected]
Gilles PascualASEAN TAS P&U LeaderSingapore+65 6309 [email protected]
Alex ZhuGreater China TAS P&U LeaderBeijing, China+86 10 5815 [email protected]
Somesh KumarIndia TAS P&U LeaderNew Delhi, India+91 11 6671 [email protected]
Peter WespJapan TAS P&U LeaderTokyo, Japan+81 3 4582 [email protected]
Bum Choong KimKorea TAS P&U LeaderSeoul, Korea+82 2 3787 [email protected]

| Power transactions and trends: Q3 201716
AmericasDistressed asset sales push deal value to two-year high
Q3 deal value in the Americas power and utilities (P&U) sector was nine times that of Q2, and the highest value since Q3 2015. The result was largely driven by five megadeals that contributed 96% of the region’s total deal value.
The US hosted several deals involving distressed assets, including the region’s top two deals. This activity highlights sustained market fundamentals, including flat demand, more renewables, cheap natural gas, low wholesale prices and changing customer expectations.
These factors are driving industry consolidation as margins are squeezed and losses accrue for independent power producers (IPPs) and integrated utilities. In Q2, Calpine Corporation reported a US$219m loss, NRG reported losses of US$642m and Dynegy posted a US$300m loss. It’s clear that the old model of highly leveraged, publicly listed utilities riding the cycle is no longer feasible in the face of sustained low wholesale prices driven by cheap shale gas. As the sell side focuses on divesting these distressed assets, buyers are motivated by reducing the target companies’ operating costs, reducing debt, realizing synergies or using the ability to refocus the target business in a new strategic direction, as seen with the Calpine acquisition.
Industry consolidation is increasing against a backdrop of regulatory scrutiny focused on governance, ring-fencing
provisions and the independence of directors. The Great Plains/Westar merger is awaiting approval after regulators ruled against the original deal. Regulatory considerations have also played a large part in the Sempra deal — earlier bids by NextEra Energy and Hunt Consolidated Inc. to buy Oncor were ruled out in the best interests of consumers and, at publication of this report, the current deal awaits final sign-off from the Texas regulator.
Despite this regulatory involvement causing some friction, transactional activity in the Americas P&U sector is heating up.
US$53bdeal value for Q3, nine times that of Q2
96%of value contributed by five megadeals worth US$50.7b
Power transactions and trends Q3 2017
Chart 9: Americas deal value and volume, by segment(announced asset and corporate-level deals, Q3 2015–Q3 2017)
0
10
20
30
40
50
0
10
20
30
40
50
60
70
80
Q32015
Q42015
Q12016
Q22016
Q32016
Q42016
Q12017
Q22017
Q32017
Num
ber
of d
eals
US$
b
Generation T&D Renewables Others Deal volume
Source: EY analysis based on Mergermarket data.

17Power transactions and trends: Q3 2017 |
Q3 2017 transactional highlights• Megadeals boost average deal
size: deal volume sustained, but average deal size climbed to US$2.4b in Q3 from US$269m in Q2, driven by a significant increase in overall deal value from US$5.9b in Q2 to US$53b.
• Most value contributed by transmission and distribution (T&D) and generation: US deals involving these assets contributed 74% of total regional deal value and made up three of the region’s top five deals.
• “Others” deal value increases: deals in “other” asset classes, primarily integrated utilities, increased from US$2.5b in Q2 to US$13.8b in Q3 and included the US$8.2b merger of Great Plains Energy Inc. with Westar Energy Inc.
• Investment in renewables drops: renewables attracted US$180m, a 94% decrease from Q2, with most deals conducted by corporate investors.
• Outbound investment recovers: Canadian investment of US$6.3b pushed regional outbound investment to US$9.4b, up from US$1.1b in Q2.

| Power transactions and trends: Q3 201718
Sources: EY analysis based on Mergermarket data.
Source: EY analysis based on Mergermarket data.
Image 4: Investment activity in Americas by country, (Q3 2017)*
Top investment destinations Top outbound investment destinations
TotalInvestment value US$53bInvestment value US$9.4b
USInvestment value US$50.9b (96%)Investment value US$2.2b (23%)
OthersInvestment value US$0.1b (0.2%)Investment value US$0.9b (10%)
BrazilInvestment value US$0.6b (1%)
CanadaInvestment value US$6.3b (67%)
PeruInvestment value US$1.45b (3%)
*Note: numbers may not add to total due to rounding.
Announcement date (2017)
Target Target country/bidder country
Bidder Deal value (US$)
Bidder rationale Segment
21 August Energy Future Holdings Corporation
US/US Sempra Energy 18.8b De-risks Sempra’s portfolio through the acquisition of Oncor’s regulated network assets and adds 10 million customers to its base
T&D: electricity
18 August Calpine Corporation
US/US A consortium led by Energy Capital Partners; Access Industries, Inc.; Canada Pension Plan Investment Board (CPPIB)
17.0b Enables bidders to realize synergies and expand portfolio of geothermal, natural gas and renewable assets
Generation
10 July Great Plains Energy Inc.
US/US Westar Energy Inc. 8.2b Allows both companies to use synergies to improve balance sheets and cash flows, with the merged utility expected to cut operating expenses by up to US$45m in 2018
Others: integrated
19 July Avista Corporation
US/Canada Hydro One Limited 5.2b Helps Hydro One enhance customer service at a reduced cost
Others: integrated
25 August Empresa de Generacion Huallaga S.A.
Peru/Cayman Islands, China, Hong Kong (China)
China Three Gorges Corporation; Hubei Energy Group Co., Ltd.; CNIC Corporation Limited; ACE Investment Fund II LP
1.4b Helps the seller increase cash flow and pay debt
Generation: hydro
Top five Americas deals (Q3 2017)All deals are announced deals, and the values indicated are disclosed enterprise values comprising equity and debt components.
Americas regional capital flows
19Power transactions and trends: Q3 2017 |
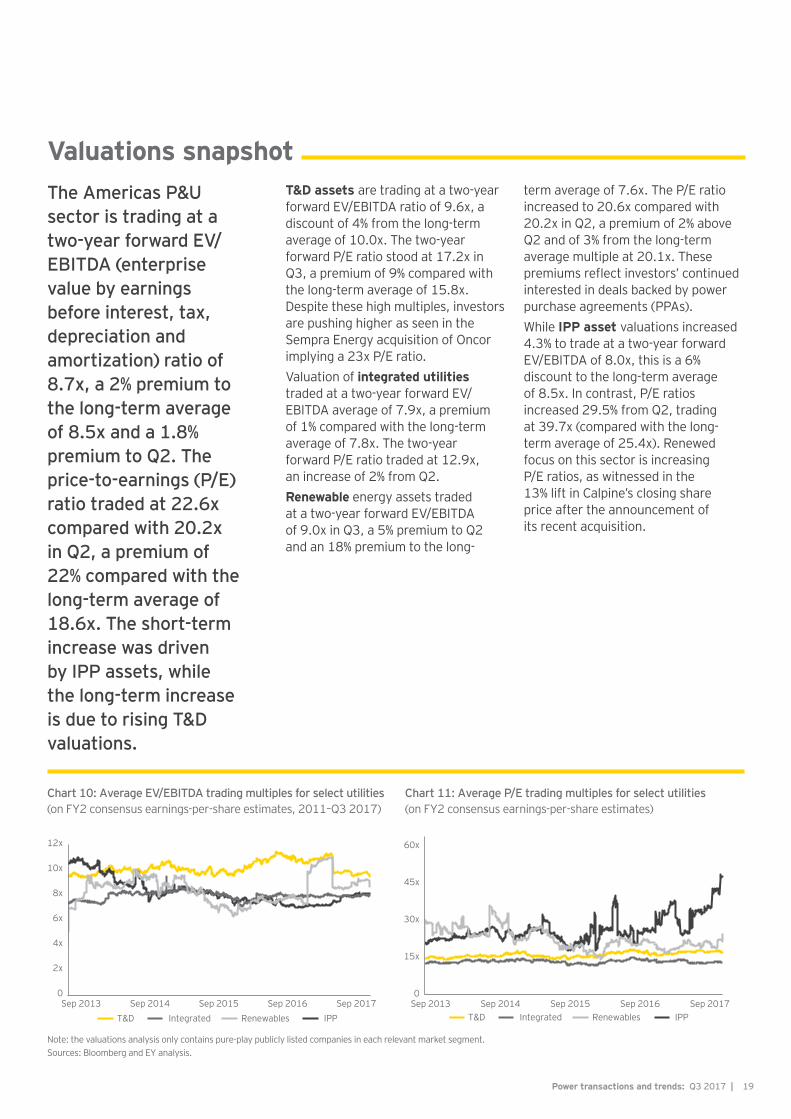
Valuations snapshotThe Americas P&U sector is trading at a two-year forward EV/EBITDA (enterprise value by earnings before interest, tax, depreciation and amortization) ratio of 8.7x, a 2% premium to the long-term average of 8.5x and a 1.8% premium to Q2. The price-to-earnings (P/E) ratio traded at 22.6x compared with 20.2x in Q2, a premium of 22% compared with the long-term average of 18.6x. The short-term increase was driven by IPP assets, while the long-term increase is due to rising T&D valuations.
T&D assets are trading at a two-year forward EV/EBITDA ratio of 9.6x, a discount of 4% from the long-term average of 10.0x. The two-year forward P/E ratio stood at 17.2x in Q3, a premium of 9% compared with the long-term average of 15.8x. Despite these high multiples, investors are pushing higher as seen in the Sempra Energy acquisition of Oncor implying a 23x P/E ratio. Valuation of integrated utilities traded at a two-year forward EV/EBITDA average of 7.9x, a premium of 1% compared with the long-term average of 7.8x. The two-year forward P/E ratio traded at 12.9x, an increase of 2% from Q2.Renewable energy assets traded at a two-year forward EV/EBITDA of 9.0x in Q3, a 5% premium to Q2 and an 18% premium to the long-
term average of 7.6x. The P/E ratio increased to 20.6x compared with 20.2x in Q2, a premium of 2% above Q2 and of 3% from the long-term average multiple at 20.1x. These premiums reflect investors’ continued interested in deals backed by power purchase agreements (PPAs). While IPP asset valuations increased 4.3% to trade at a two-year forward EV/EBITDA of 8.0x, this is a 6% discount to the long-term average of 8.5x. In contrast, P/E ratios increased 29.5% from Q2, trading at 39.7x (compared with the long-term average of 25.4x). Renewed focus on this sector is increasing P/E ratios, as witnessed in the 13% lift in Calpine’s closing share price after the announcement of its recent acquisition.
0
2x
4x
6x
8x
10x
12x
Sep 2013 Sep 2014 Sep 2015 Sep 2016 Sep 2017T&D IPPIntegrated Renewables
Chart 10: Average EV/EBITDA trading multiples for select utilities (on FY2 consensus earnings-per-share estimates, 2011–Q3 2017)
Chart 11: Average P/E trading multiples for select utilities (on FY2 consensus earnings-per-share estimates)
0
15x
30x
45x
60x
Sep 2013 Sep 2014 Sep 2015 Sep 2016 Sep 2017T&D IPPIntegrated Renewables
Note: the valuations analysis only contains pure-play publicly listed companies in each relevant market segment. Sources: Bloomberg and EY analysis.

| Power transactions and trends: Q3 201720
M&A capital outlook and investment hotspots• More greenfield investment in
renewables: US renewables company Invenergy and General Electric are planning the US’s biggest wind farm in Oklahoma as part of a US$4.5b project to provide electricity to 1.1 million customers by 2020. Duke Energy Carolinas has invited bids to set up 500 MW capacity of wind energy in the region by 2022. Ameren Corp., a US-based utility, is also planning to build 700 MW of wind power by 2020 by investing US$1b in Missouri.
• Increasing interest in batteries: US-based AES Corporation, the world’s leading grid battery installer, and Germany’s Siemens AG are
forming a joint venture to accelerate the global adoption of battery technology. Duke Energy Florida will invest US$6b over the next four years in solar, smart meters, grid modernization and batteries.
• Argentina emerges as renewables hotspot: the second round of Argentina’s renewable energy program is inviting tenders for 1.2 GW of capacity, totaling US$1.2b investment by mid-2019. New regulations that allow large power consumers to sign supply contracts to meet their renewable energy obligations are expected to spur US$6b of investment in clean energy over the next three years.
• Foreign investors seek Brazilian assets: the Brazilian Government’s plans to privatize the country’s biggest power utility, Eletrobras, and invest US$943m in the development of 480 MW of small hydro projects are attracting foreign interest. China’s State Power Investment Corp. has indicated that it will participate in the upcoming auction of four of the country’s hydroelectric dams.
EY Americas Transaction Advisory Services P&U contacts
Matt RennieGlobal TAS P&U LeaderBrisbane, Australia+61 7 3011 [email protected]
Stephanie ChesnickUS TAS P&U LeaderHouston, Texas, US+1 713 750 [email protected]
Mitch FaneUS Southwest TAS P&U LeaderHouston, Texas, US+1 713 750 [email protected]
Miles HuqUS Northeast TAS P&U LeaderBaltimore, Maryland, US+1 410 783 [email protected]
Robert LeonardUS Southeast TAS P&U LeaderCharlotte, North Carolina, US+1 704 335 [email protected]
Robert A JozwiakUS Central TAS P&U LeaderChicago, Illinois, US+1 312 879 [email protected]
Gerard McInnisCanada TAS P&U Leader Calgary, Alberta, Canada+1 403 206 [email protected]
Lucio TeixeiraLatin America South TAS P&U LeaderSao Paulo, Brazil+55 11 2573 [email protected]
Rafael Aguirre SosaLatin America North TAS P&U LeaderMéxico, D.F., Mexico+52 55 5283 [email protected]

21Power transactions and trends: Q3 2017 |
the Middle EastAfrica and
Greenfield investment continues, but M&A drops
Although the power and utilities (P&U) sector in Africa and the Middle East saw decreased M&A activity during Q3, international investors remain attracted to greenfield investment in the region, particularly in renewables where installed capacity is forecast to accelerate.
Africa and the Middle East is an energy market that appeals to those investors prepared to take additional risks in expectation of higher returns. Greenfield projects supported by grants or de-risked credit from institutions such as the World Bank, the European Investment
Chart 13: Africa and the Middle East installed renewable energy capacity historic and forecast growth to 2018
0
10
20
30
40
50
70
60
2014 2015 2016 2017 2018
MW
67 GW renewable energy projects in development in the Middle East
5.5 GW residential PV forecast to be installed in the region by 2019 (2.5 times current capacity)
Power transactions and trends Q3 2017
Chart 12: Africa and the Middle East deal value (2010–Q3 2017)
US$
m
0
1000
2000
3000
4000
5000
6000
2011 2012 2013 2014 2015 2016 YTD 2017
Source: EY analysis based on Bloomberg New Energy Finance data.

| Power transactions and trends: Q3 201722
Q3 2017 transactional highlights• Greenfield investment in solar
continues: in September, the Dubai Electricity and Water Authority awarded a US$3.9b contract to build and operate a 700 MW solar power plant to a consortium comprising Shanghai Electric and Saudi Arabia’s ACWA Power. The first stage of the project is due to be commissioned in late 2020. European renewable energy investor Quercus plans to invest more than US$600m in a 600 MW solar power project in Iran, with construction to start in the first half of 2018. Ethiopian Electric Power has issued a request for prequalification for two 125 MW solar photovoltaic (PV)
projects in the country as part of the World Bank Group’s Scaling Solar program.
• Japan is active in the region: Japan’s Government and the African Development Bank have signed a letter of intent for the launch of the Japan-Africa initiative, which will see Japan provide US$6b to support universal power access in Africa by 2025. Matt Rennie discusses the initiative in his blog here. In a separate deal, the Jordanian and Japanese Governments signed a grant agreement worth US$12.6m to finance the renovation of the water network in Balqa.
• European investors continue to diversify: SN Power Invest, a Norway-based hydropower developer, acquired a 49.75% stake in Ugandan utility Bujagali Energy for an undisclosed value. The Nordic Development Fund (NDF) and Norfund, a private equity fund established by the Norwegian Government, approved a total of US$22m of equity investments to develop renewable energy projects in sub-Saharan African countries.
Bank and African Development Bank, are particularly attractive. In one recent example, in September, the World Bank awarded the Mozambique Government a grant of US$150m to upgrade its electricity network.
Across the Middle East, governments are pushing hard for more private investment, particularly in renewables that are supported by policy. Saudi Arabia’s Government has set a target to generate 9.5 GW of energy annually from renewable sources, but has said it aims to exceed this goal.
23Power transactions and trends: Q3 2017 |
M&A capital outlook and investment hotspots • Investment in greenfield renewable
energy continues: Kuwait is expected to issue a tender in the first quarter of 2018 to construct a US$1.2b solar power plant. Zimbabwe Power Company plans to invest US$570m in building solar plants with a total capacity of 300 MW in the country’s Gwanda and Matobo provinces by 2019. Dangote Industries, a Nigeria-based diversified company, and Black Rhino Group, a US-based investment company, have agreed to build a 100 MW solar plant in Nigeria for an investment of US$150m by early 2018.
• Kuwait to increase generation capacity: in addition to the planned solar tender outlined above, the Kuwaiti Government is working
toward a target to increase Kuwait’s power generation capacity from current levels of 15 GW to 32 GW by 2030.
• Investment in microgrids to emerge: analysts estimate that the market for microgrids in Kenya will be worth US$1.5b through 2022. The World Bank, Ministry of Energy, Kenya Power and Lighting Company and Rural Electrification Authority are investing US$150m to build microgrids to give Kenyan households without electricity access to solar power. In Nigeria, the Government has launched a new feed-in tariff and net-metering system in a bid to encourage investment in microgrids.
• Kenya targets electrification: the Kenyan Government has set a target to provide electricity access to its entire population by 2020. With this in mind, the state-owned transmission and distribution (T&D) utility, Kenya Power, is investing US$77,632 to reduce losses and improve the system’s efficiency. KenGen, the state-owned power generation utility, is investing US$95m to construct a 61 MW geothermal power plant.
EY Africa and the Middle East Transaction Advisory Services P&U contacts
Matt RennieGlobal TAS P&U LeaderBrisbane, Australia+61 7 3011 [email protected]
Bruce HarveyAfrica TAS P&U LeaderJohannesburg, South Africa+27 11 772 [email protected]
David LloydMiddle East TAS P&U LeaderRiyadh, Saudi Arabia+966 11 215 [email protected]
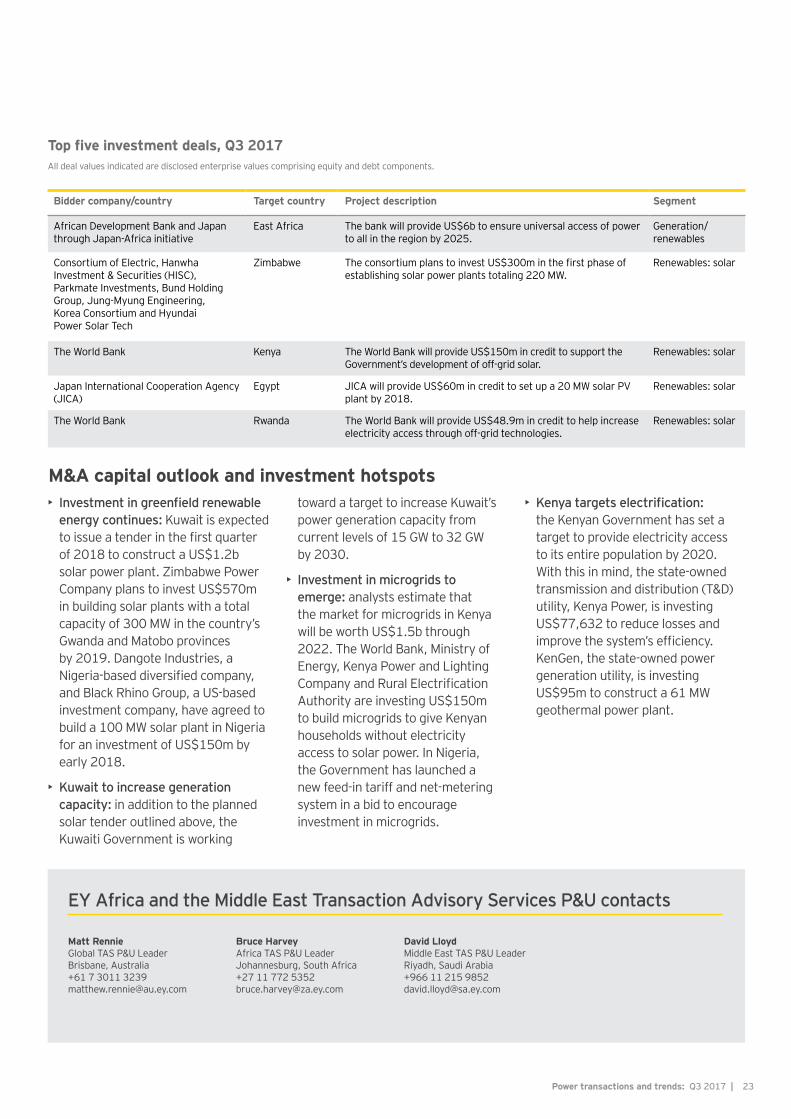
Top five investment deals, Q3 2017
Bidder company/country Target country Project description Segment
African Development Bank and Japan through Japan-Africa initiative
East Africa The bank will provide US$6b to ensure universal access of power to all in the region by 2025.
Generation/renewables
Consortium of Electric, Hanwha Investment & Securities (HISC), Parkmate Investments, Bund Holding Group, Jung-Myung Engineering, Korea Consortium and Hyundai Power Solar Tech
Zimbabwe The consortium plans to invest US$300m in the first phase of establishing solar power plants totaling 220 MW.
Renewables: solar
The World Bank Kenya The World Bank will provide US$150m in credit to support the Government’s development of off-grid solar.
Renewables: solar
Japan International Cooperation Agency (JICA)
Egypt JICA will provide US$60m in credit to set up a 20 MW solar PV plant by 2018.
Renewables: solar
The World Bank Rwanda The World Bank will provide US$48.9m in credit to help increase electricity access through off-grid technologies.
Renewables: solar
All deal values indicated are disclosed enterprise values comprising equity and debt components.
About EYEY is a global leader in assurance, tax, transaction and advisory services. The insights and quality services we deliver help build trust and confidence in the capital markets and in economies the world over. We develop outstanding leaders who team to deliver on our promises to all of our stakeholders. In so doing, we play a critical role in building a better working world for our people, for our clients and for our communities.
EY refers to the global organization, and may refer to one or more, of the member firms of Ernst & Young Global Limited, each of which is a separate legal entity. Ernst & Young Global Limited, a UK company limited by guarantee, does not provide services to clients. For more information about our organization, please visit ey.com.
About EY’s Global Power & Utilities Sector In a world of uncertainty, changing regulatory frameworks and environmental challenges, utility companies need to maintain a secure and reliable supply, while anticipating change and reacting to it quickly. EY’s Global Power & Utilities Sector brings together a worldwide team of professionals to help you succeed — a team with deep technical experience in providing assurance, tax, transaction and advisory services. The Sector team works to anticipate market trends, identify their implications and develop points of view on relevant sector issues. Ultimately, this team enables us to help you meet your goals and compete more effectively.
© 2017 EYGM Limited. All Rights Reserved.
EYG no. 06375-174Gbl
BMC Agency GA 1006130
ED 0818
In line with EY’s commitment to minimize its impact on the environment, this document has been printed on paper with a high recycled content.
This material has been prepared for general informational purposes only and is not intended to be relied upon as accounting, tax or other professional advice. Please refer to your advisors for specific advice.
ey.com
EY | Assurance | Tax | Transactions | Advisory
Data source and industry scopeThe EY analysis and perspectives within Power transactions and trends are based on global financial releases and Mergermarket data, as well as global engagements conducted by EY member firms over the period 2012 to 2017. They provide an up-to-date assessment of outcomes and trends in the global utilities industry. For more information on the methodology employed in the preparation of this report, please contact:
Sara Richardson EY Global TAS P&U Associate Director and Resident [email protected]