Power transactions and trends - EY · Power transactions and trends: Q1 2017 | 3 Large transmission...
24
Power transactions and trends : Q1 2017
Transcript of Power transactions and trends - EY · Power transactions and trends: Q1 2017 | 3 Large transmission...
Power transactions and trends: Q1 2017
| Power transactions and trends: Q1 20172
Contents
On the web or on the move Power transactions and trends is also available online at ey.com/ptt
EY Global Transaction Advisory Services (TAS) Power & Utilities (P&U) contactsMatt RennieEY Global TAS P&U Leader+61 7 3011 [email protected] @MattRennie_EY
Sara RichardsonEY Global TAS P&U Associate Director+61 7 3243 [email protected] @sararichardson2
Shikhar GuptaEY Global P&U Analyst+91 124 470 [email protected] @ShikharGupta_EY
Anjushi JoshiEY Global P&U Analyst+91 124 469 [email protected] @anjushi_joshi
3
3 Overview
5 Europe
10 Asia-Pacific
15 Americas
20 Africa and the Middle East
10
20
15
5
3Power transactions and trends: Q1 2017 |
Large transmission and distribution (T&D) transactions continue to drive deal value, while renewables boost volume.
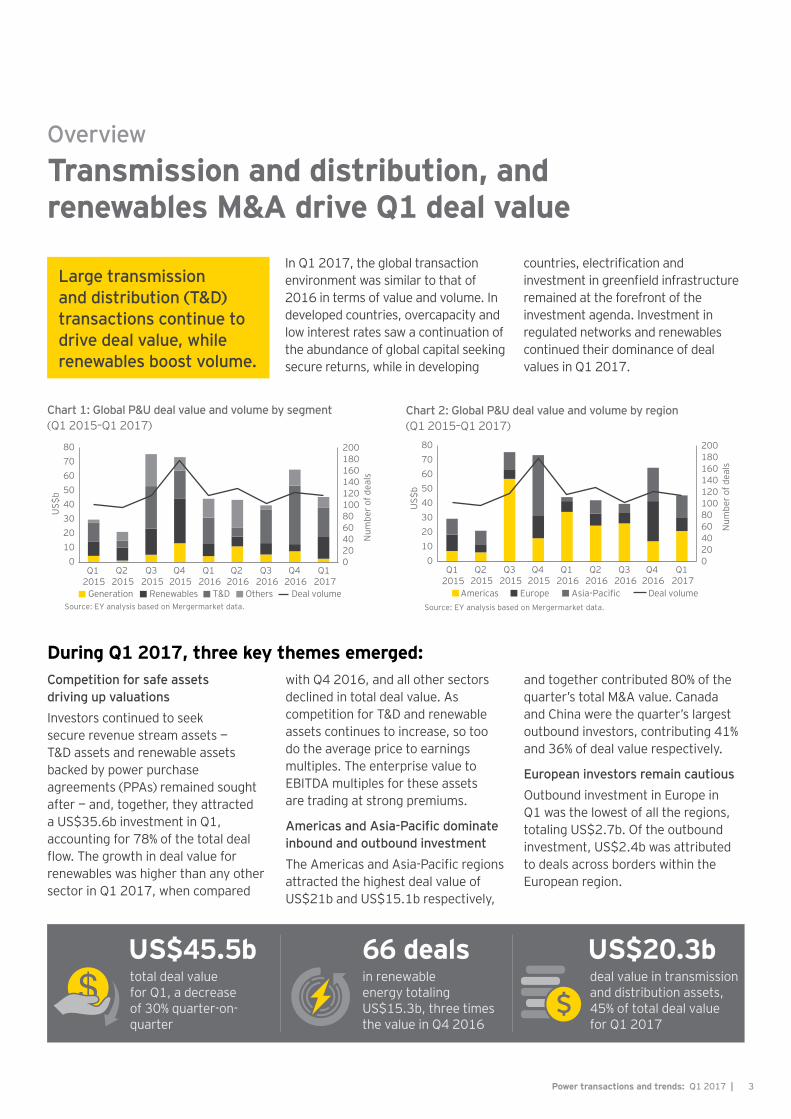
Transmission and distribution, and renewables M&A drive Q1 deal value
Overview
In Q1 2017, the global transaction environment was similar to that of 2016 in terms of value and volume. In developed countries, overcapacity and low interest rates saw a continuation of the abundance of global capital seeking secure returns, while in developing
countries, electrification and investment in greenfield infrastructure remained at the forefront of the investment agenda. Investment in regulated networks and renewables continued their dominance of deal values in Q1 2017.
Chart 2: Global P&U deal value and volume by region (Q1 2015–Q1 2017)
020406080100120140160180200
01020304050607080
Americas Europe Asia-Pacific Deal volumeSource: EY analysis based on Mergermarket data.
Q1 2015
Q2 2015
Q3 2015
Q4 2015
Q1 2016
Q2 2016
Q3 2016
Q4 2016
Q1 2017
US$
b
Num
ber o
f dea
ls
Chart 1: Global P&U deal value and volume by segment (Q1 2015–Q1 2017)
020406080100120140160180200
01020304050607080
Q1 2015
Q2 2015
Q3 2015
Q4 2015
Q1 2016
Q2 2016
Q3 2016
Q4 2016
Q1 2017
Generation Renewables T&D Others Deal volumeSource: EY analysis based on Mergermarket data.
US$
b
Num
ber o
f dea
ls
During Q1 2017, three key themes emerged: Competition for safe assets driving up valuationsInvestors continued to seek secure revenue stream assets — T&D assets and renewable assets backed by power purchase agreements (PPAs) remained sought after — and, together, they attracted a US$35.6b investment in Q1, accounting for 78% of the total deal flow. The growth in deal value for renewables was higher than any other sector in Q1 2017, when compared
with Q4 2016, and all other sectors declined in total deal value. As competition for T&D and renewable assets continues to increase, so too do the average price to earnings multiples. The enterprise value to EBITDA multiples for these assets are trading at strong premiums.
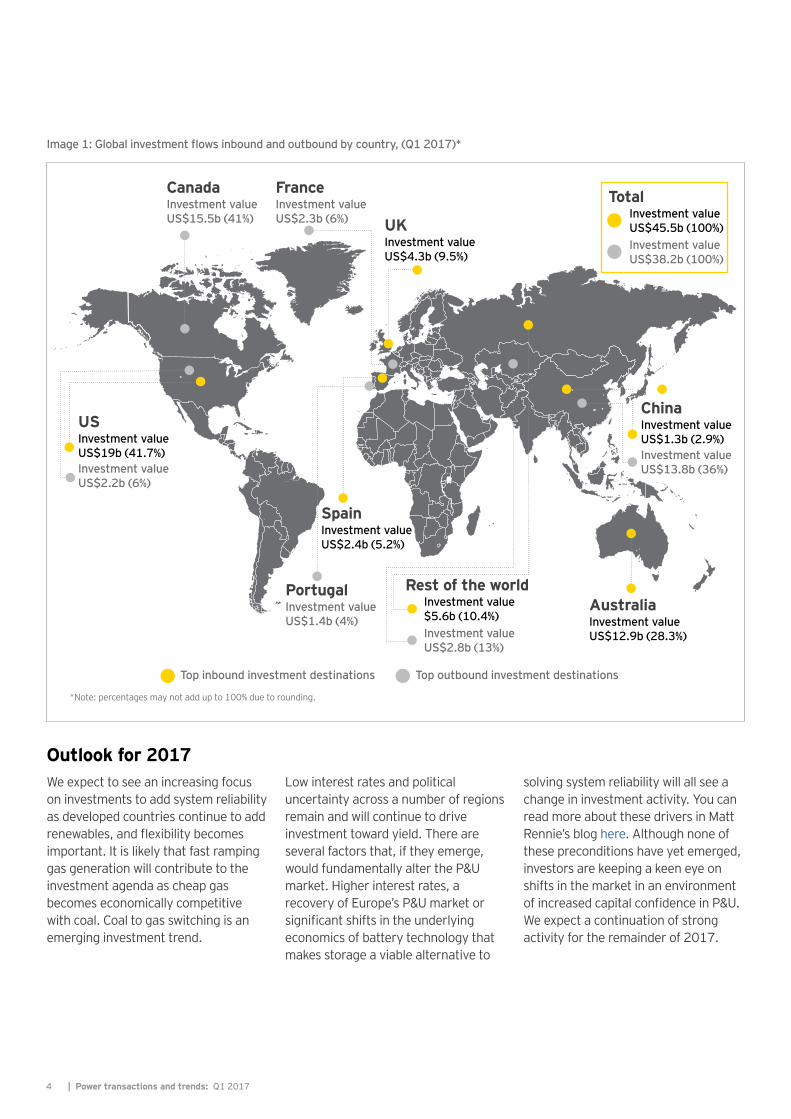
Americas and Asia-Pacific dominate inbound and outbound investmentThe Americas and Asia-Pacific regions attracted the highest deal value of US$21b and US$15.1b respectively,
and together contributed 80% of the quarter’s total M&A value. Canada and China were the quarter’s largest outbound investors, contributing 41% and 36% of deal value respectively.
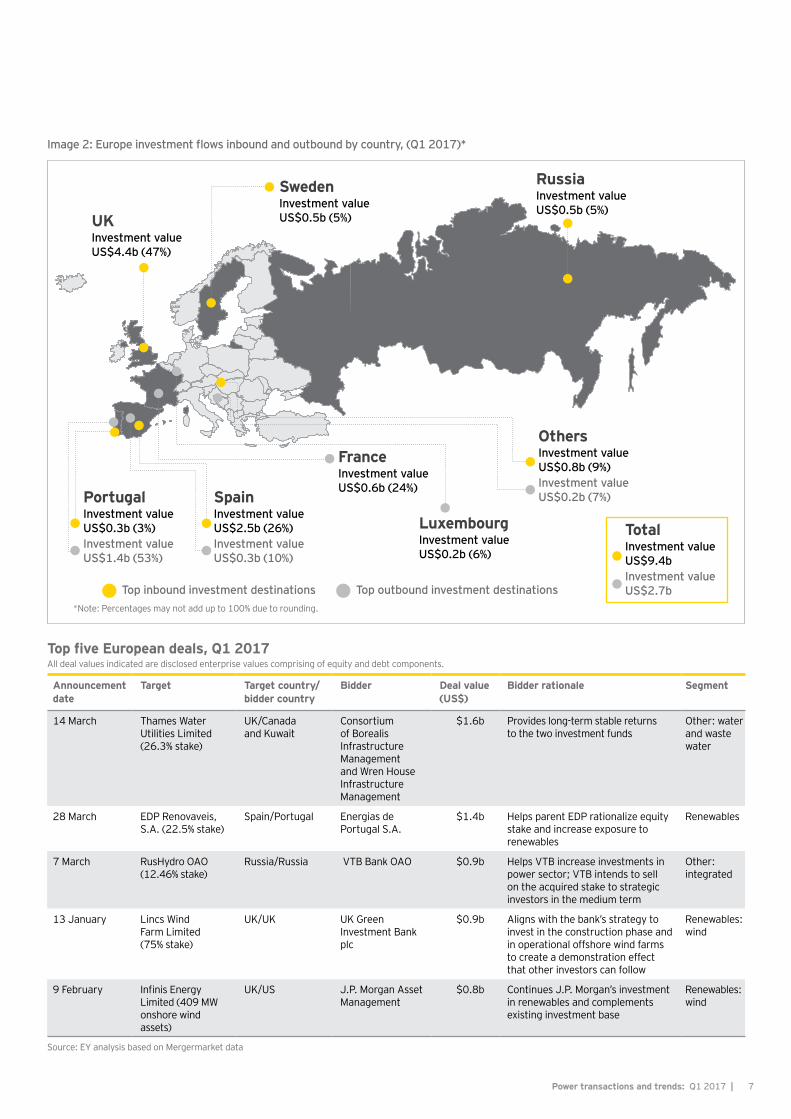
European investors remain cautiousOutbound investment in Europe in Q1 was the lowest of all the regions, totaling US$2.7b. Of the outbound investment, US$2.4b was attributed to deals across borders within the European region.
US$45.5btotal deal value for Q1, a decrease of 30% quarter-on-quarter
66 dealsin renewable energy totaling US$15.3b, three times the value in Q4 2016
US$20.3b deal value in transmission and distribution assets, 45% of total deal value for Q1 2017
| Power transactions and trends: Q1 20174
Outlook for 2017We expect to see an increasing focus on investments to add system reliability as developed countries continue to add renewables, and flexibility becomes important. It is likely that fast ramping gas generation will contribute to the investment agenda as cheap gas becomes economically competitive with coal. Coal to gas switching is an emerging investment trend.
Low interest rates and political uncertainty across a number of regions remain and will continue to drive investment toward yield. There are several factors that, if they emerge, would fundamentally alter the P&U market. Higher interest rates, a recovery of Europe’s P&U market or significant shifts in the underlying economics of battery technology that makes storage a viable alternative to
solving system reliability will all see a change in investment activity. You can read more about these drivers in Matt Rennie’s blog here. Although none of these preconditions have yet emerged, investors are keeping a keen eye on shifts in the market in an environment of increased capital confidence in P&U. We expect a continuation of strong activity for the remainder of 2017.
USInvestment value US$19b (41.7%)
UKInvestment value US$4.3b (9.5%)
CanadaInvestment value US$15.5b (41%)
FranceInvestment value US$2.3b (6%)
AustraliaInvestment value US$12.9b (28.3%)
ChinaInvestment value US$1.3b (2.9%)Investment value US$13.8b (36%)Investment value
US$2.2b (6%)
SpainInvestment value US$2.4b (5.2%)
PortugalInvestment value US$1.4b (4%)
Rest of the worldInvestment value $5.6b (10.4%)
Top inbound investment destinations
*Note: percentages may not add up to 100% due to rounding.
Top outbound investment destinations
Investment value US$2.8b (13%)
TotalInvestment value US$45.5b (100%)Investment value US$38.2b (100%)
Image 1: Global investment flows inbound and outbound by country, (Q1 2017)*
5Power transactions and trends: Q1 2017 |
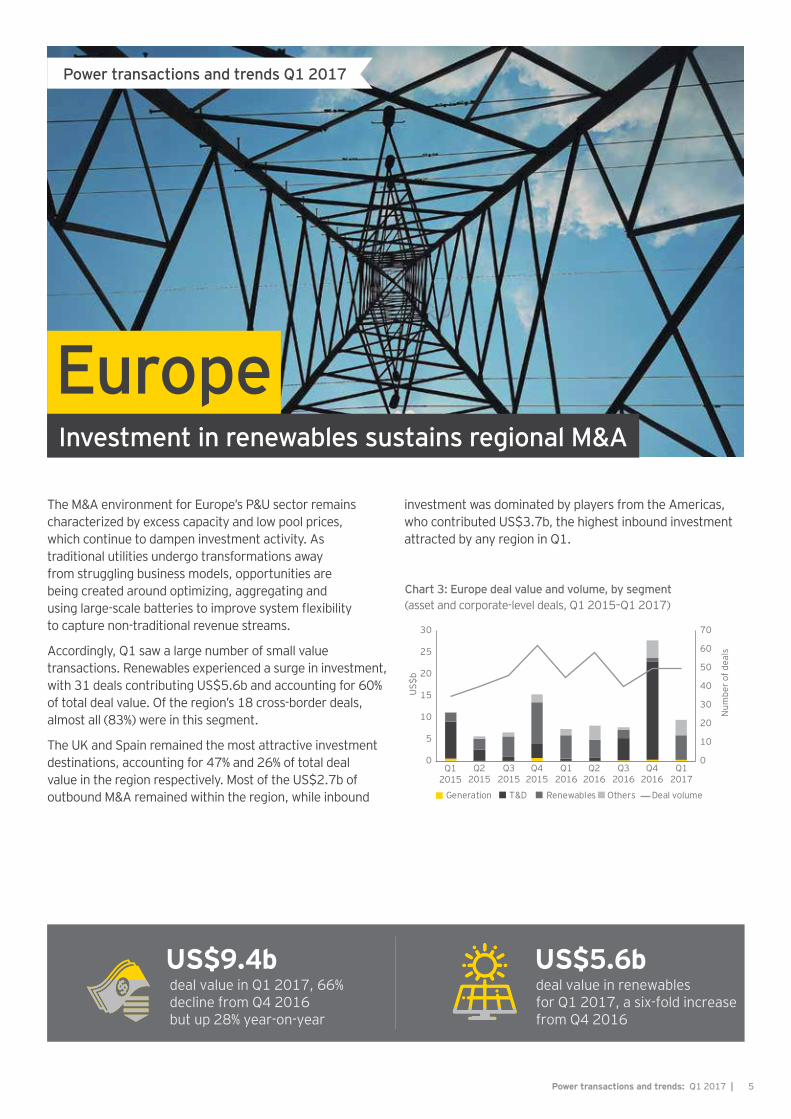
EuropeInvestment in renewables sustains regional M&A
The M&A environment for Europe’s P&U sector remains characterized by excess capacity and low pool prices, which continue to dampen investment activity. As traditional utilities undergo transformations away from struggling business models, opportunities are being created around optimizing, aggregating and using large-scale batteries to improve system flexibility to capture non-traditional revenue streams.
Accordingly, Q1 saw a large number of small value transactions. Renewables experienced a surge in investment, with 31 deals contributing US$5.6b and accounting for 60% of total deal value. Of the region’s 18 cross-border deals, almost all (83%) were in this segment.
The UK and Spain remained the most attractive investment destinations, accounting for 47% and 26% of total deal value in the region respectively. Most of the US$2.7b of outbound M&A remained within the region, while inbound
investment was dominated by players from the Americas, who contributed US$3.7b, the highest inbound investment attracted by any region in Q1.
Chart 3: Europe deal value and volume, by segment(asset and corporate-level deals, Q1 2015–Q1 2017)
0
10
20
30
40
50
60
70
0
5
10
15
20
25
30
Generation T&D Renewables Others Deal volume
Q12015
Q22015
Q32015
Q42015
Q12016
Q22016
Q32016
Q42016
Q12017
US$
b
Num
ber o
f dea
ls
US$9.4b deal value in Q1 2017, 66% decline from Q4 2016 but up 28% year-on-year
US$5.6bdeal value in renewables for Q1 2017, a six-fold increase from Q4 2016
Power transactions and trends Q1 2017
| Power transactions and trends: Q1 20176
Q1 2017 transactional highlights• Renewables drive deal value and
volume: of Europe’s 50 P&U deals in Q1, 31 were in renewables, which accounted for 60% of total deal value.
• Financial investors dominate: financial investors contributed 71% of Q1 deal value. Some of these investors (mostly private equity funds with medium-term investment goals), at the end of their investment cycle, sold assets worth US$4.2b, most of which were bought by other financial investors, including pension and infrastructure funds with longer-term investment horizon profiles.
• Water and waste water deal the largest of the quarter: the largest deal of the quarter was the acquisition of a 23.6% stake in Thames Water Utilities for
US$1.6b by a consortium of Borealis Infrastructure Management and Wren House Infrastructure Management funds.
• IPPs continue to retire: in Germany, Steag GmbH closed two plants totaling 2.2 GW and plans to close an additional 2.2 GW of generation during 2017. In February, DONG Energy, a Denmark-based utility, announced plans to phase out its remaining nine coal-fired generators by 2023.
• North American investors target Europe: financial investors in North America contributed US$3.4b, or 36% of deal value, to the region in Q1. Eight deals were in solar and wind assets, worth US$3.4b and 36% of total regional deal value.
• Increased interest in wind energy: Q1 saw US$2.2b invested in 1.4 GW of European wind assets, up from US$295m in Q4 2016.
• Low outbound investment directed toward regions outside of Europe: corporate and financial investors conducted only four deals, worth just US$276m, outside of Europe. All of these transactions were in Latin American renewables and T&D assets.
7Power transactions and trends: Q1 2017 |
UKInvestment value US$4.4b (47%)
SwedenInvestment value US$0.5b (5%)
RussiaInvestment value US$0.5b (5%)
SpainInvestment value US$2.5b (26%)Investment value US$0.3b (10%)
*Note: Percentages may not add up to 100% due to rounding.
PortugalInvestment value US$0.3b (3%)Investment value US$1.4b (53%)
OthersInvestment value US$0.8b (9%)Investment value US$0.2b (7%)
FranceInvestment value US$0.6b (24%)
LuxembourgInvestment value US$0.2b (6%)
TotalInvestment value US$9.4bInvestment value US$2.7bTop inbound investment destinations Top outbound investment destinations
Image 2: Europe investment flows inbound and outbound by country, (Q1 2017)*
Top five European deals, Q1 2017All deal values indicated are disclosed enterprise values comprising of equity and debt components.
Source: EY analysis based on Mergermarket data
Announcement date
Target Target country/bidder country
Bidder Deal value (US$)
Bidder rationale Segment
14 March Thames Water Utilities Limited (26.3% stake)
UK/Canada and Kuwait
Consortium of Borealis Infrastructure Management and Wren House Infrastructure Management
$1.6b Provides long-term stable returns to the two investment funds
Other: water and waste water
28 March EDP Renovaveis, S.A. (22.5% stake)
Spain/Portugal Energias de Portugal S.A.
$1.4b Helps parent EDP rationalize equity stake and increase exposure to renewables
Renewables
7 March RusHydro OAO (12.46% stake)
Russia/Russia VTB Bank OAO $0.9b Helps VTB increase investments in power sector; VTB intends to sell on the acquired stake to strategic investors in the medium term
Other: integrated
13 January Lincs Wind Farm Limited (75% stake)
UK/UK UK Green Investment Bank plc
$0.9b Aligns with the bank’s strategy to invest in the construction phase and in operational offshore wind farms to create a demonstration effect that other investors can follow
Renewables: wind
9 February Infinis Energy Limited (409 MW onshore wind assets)
UK/US J.P. Morgan Asset Management
$0.8b Continues J.P. Morgan’s investment in renewables and complements existing investment base
Renewables: wind
| Power transactions and trends: Q1 20178
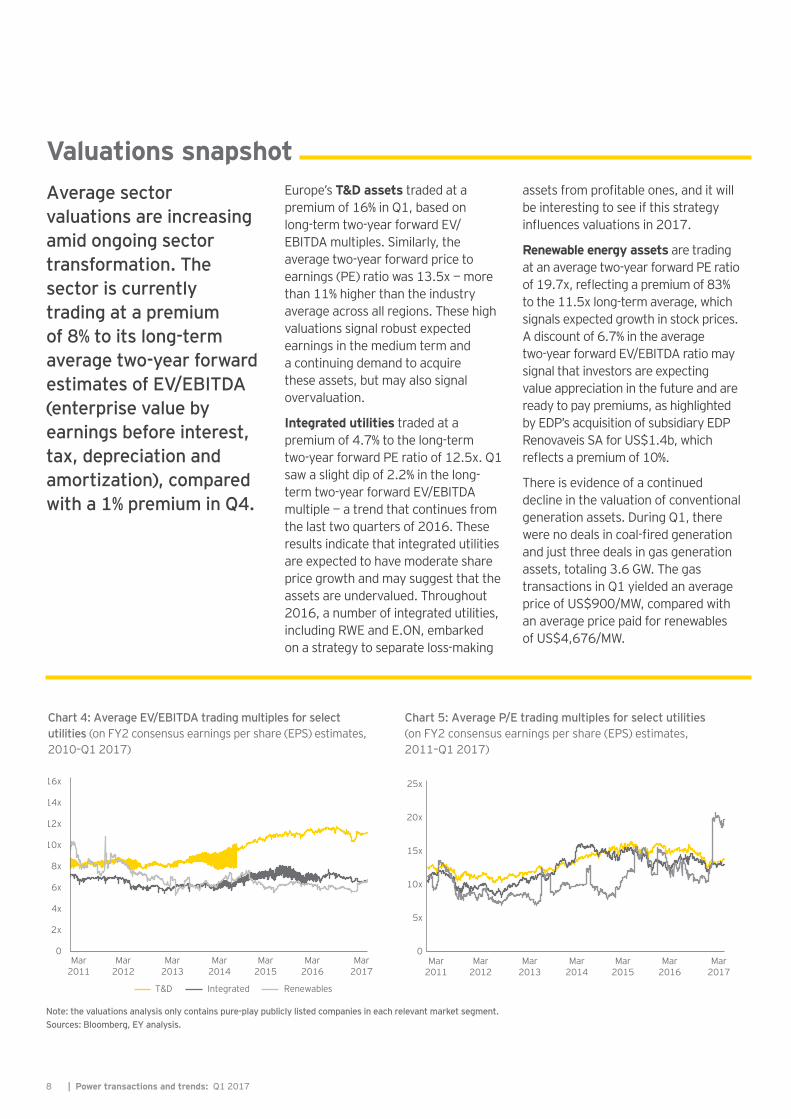
Valuations snapshotAverage sector valuations are increasing amid ongoing sector transformation. The sector is currently trading at a premium of 8% to its long-term average two-year forward estimates of EV/EBITDA (enterprise value by earnings before interest, tax, depreciation and amortization), compared with a 1% premium in Q4.
Europe’s T&D assets traded at a premium of 16% in Q1, based on long-term two-year forward EV/EBITDA multiples. Similarly, the average two-year forward price to earnings (PE) ratio was 13.5x — more than 11% higher than the industry average across all regions. These high valuations signal robust expected earnings in the medium term and a continuing demand to acquire these assets, but may also signal overvaluation.
Integrated utilities traded at a premium of 4.7% to the long-term two-year forward PE ratio of 12.5x. Q1 saw a slight dip of 2.2% in the long-term two-year forward EV/EBITDA multiple — a trend that continues from the last two quarters of 2016. These results indicate that integrated utilities are expected to have moderate share price growth and may suggest that the assets are undervalued. Throughout 2016, a number of integrated utilities, including RWE and E.ON, embarked on a strategy to separate loss-making
assets from profitable ones, and it will be interesting to see if this strategy influences valuations in 2017.
Renewable energy assets are trading at an average two-year forward PE ratio of 19.7x, reflecting a premium of 83% to the 11.5x long-term average, which signals expected growth in stock prices. A discount of 6.7% in the average two-year forward EV/EBITDA ratio may signal that investors are expecting value appreciation in the future and are ready to pay premiums, as highlighted by EDP’s acquisition of subsidiary EDP Renovaveis SA for US$1.4b, which reflects a premium of 10%.
There is evidence of a continued decline in the valuation of conventional generation assets. During Q1, there were no deals in coal-fired generation and just three deals in gas generation assets, totaling 3.6 GW. The gas transactions in Q1 yielded an average price of US$900/MW, compared with an average price paid for renewables of US$4,676/MW.
Chart 4: Average EV/EBITDA trading multiples for select utilities (on FY2 consensus earnings per share (EPS) estimates, 2010–Q1 2017)
0
2x
4x
6x
8x
10x
12x
14x
16x
T&D Integrated Renewables
Mar2011
Mar2012
Mar2013
Mar2014
Mar2015
Mar2016
Mar2017
Chart 5: Average P/E trading multiples for select utilities (on FY2 consensus earnings per share (EPS) estimates, 2011–Q1 2017)
0
5x
10x
15x
20x
25x
Mar2011
Mar2012
Mar2013
Mar2014
Mar2015
Mar2016
Mar2017
Note: the valuations analysis only contains pure-play publicly listed companies in each relevant market segment. Sources: Bloomberg, EY analysis.
9Power transactions and trends: Q1 2017 |
M&A capital outlook and investment hotspots • More investment in offshore wind
expected: there are significant upcoming opportunities through auctions in Europe. Germany is expected to auction 1.55 GW of offshore wind in March 2017, while the UK is expected to auction between 1 GW and 2 GW. In the Netherlands, a third 700 MW tender is scheduled during the second half of 2017. France is also planning to launch tenders to construct 3 GW of offshore wind power. Vattenfall plans to invest around US$1.9b in onshore and offshore wind power during 2017–2018.
• Utilities testing new technologies: European utilities are increasingly investing in and exploring new technologies. Enel, RWE and other European utilities recently participated in a workshop with Ponton, an IT company working in blockchain, to understand its potential for trading and generating revenue, while Engie announced plans to acquire Amsterdam-based EV-Box, Europe’s biggest player in electric vehicle charging infrastructure.
• France emerges as an investment hotspot: as well as the planned tenders for offshore wind power, French transmission company, Réseau de Transport d’Électricité (RTE), has announced that it will focus research and development on integrating energy storage solutions into virtual power lines.
• Spain focuses on renewables and infrastructure: Spain is expected to open tenders to develop 3 GW of renewable energy in the first half of 2017. The Spanish electricity transmission company, Red Eléctrica de España, plans investments to strengthen its intra-region grid and build an undersea connection.
EY Global Transaction Advisory Services (TAS) P&U contacts
Matt RennieGlobal TAS Power & Utilities LeaderBrisbane, Australia+61 7 3011 [email protected]
Arnaud De GiovanniHead of TAS Power & Utilities, EMEIAParis, France+33 1 55 61 04 [email protected]
Remigiusz ChlewickiCentral & Southern Europe TASPower & Utilities LeaderWarsaw, Poland+48 22 557 [email protected]
René CoenradieBeNe TAS Power & Utilities LeaderRotterdam, Netherlands+31 88 407 [email protected]
Edgars RagelsCIS TAS Power & Utilities LeaderMoscow, Russia+7 495 755 9724 [email protected]
Umberto Nobile Mediterranean TAS Power & Utilities LeaderMilan, Italy+39 0280 6693 [email protected]
Martin SelterGSA TAS Power & Utilities LeaderBerlin, Germany+49 30 25471 [email protected]
Stéphane KraftFraMaLux TAS Power & Utilities LeaderParis, France+33 1 55 61 09 [email protected]
Michael BruhnNordics TAS Power & Utilities LeaderCopenhagen, Denmark+45 2529 [email protected]
John CurtinUKI TAS Power & Utilities LeaderLondon, UK+44 20 7951 [email protected]
| Power transactions and trends: Q1 201710
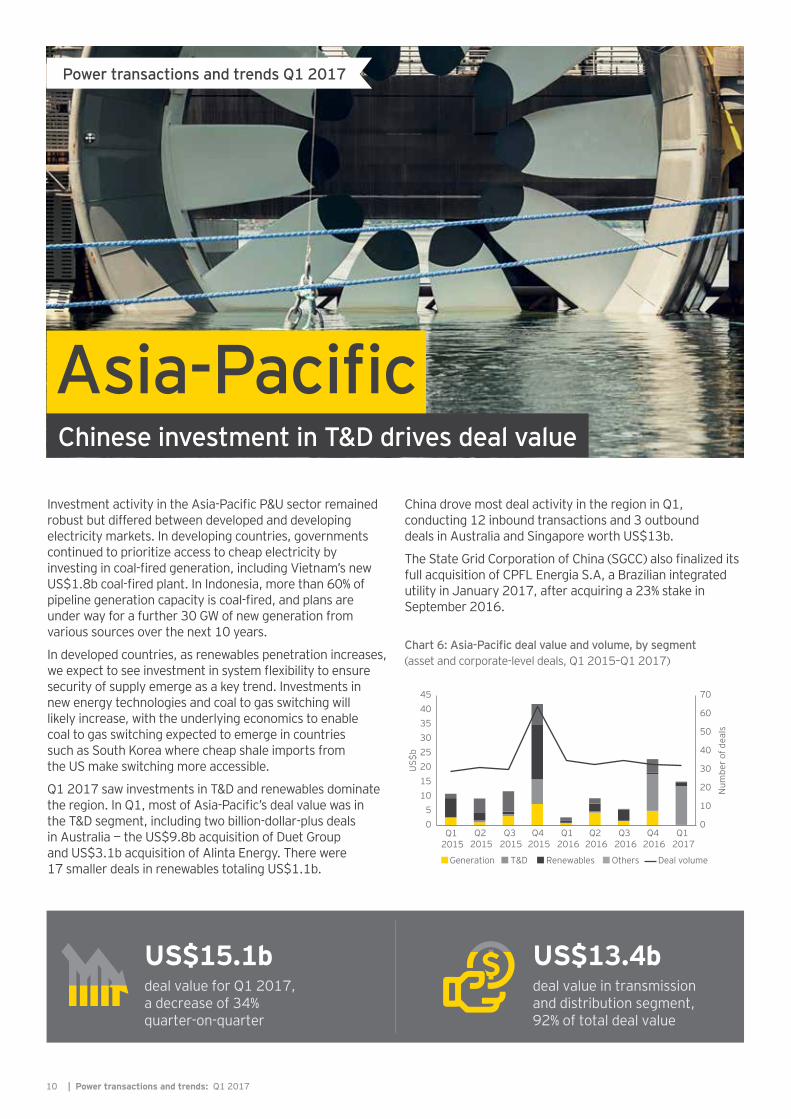
Asia-PacificChinese investment in T&D drives deal value
Investment activity in the Asia-Pacific P&U sector remained robust but differed between developed and developing electricity markets. In developing countries, governments continued to prioritize access to cheap electricity by investing in coal-fired generation, including Vietnam’s new US$1.8b coal-fired plant. In Indonesia, more than 60% of pipeline generation capacity is coal-fired, and plans are under way for a further 30 GW of new generation from various sources over the next 10 years.
In developed countries, as renewables penetration increases, we expect to see investment in system flexibility to ensure security of supply emerge as a key trend. Investments in new energy technologies and coal to gas switching will likely increase, with the underlying economics to enable coal to gas switching expected to emerge in countries such as South Korea where cheap shale imports from the US make switching more accessible.
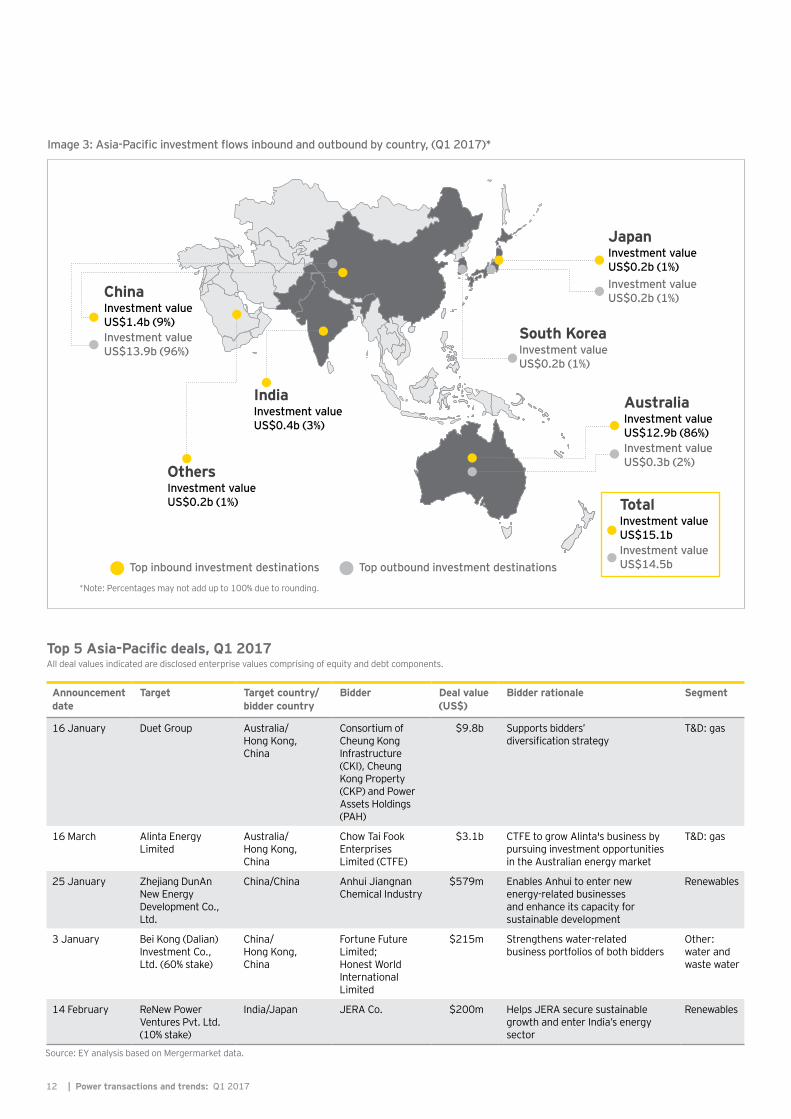
Q1 2017 saw investments in T&D and renewables dominate the region. In Q1, most of Asia-Pacific’s deal value was in the T&D segment, including two billion-dollar-plus deals in Australia — the US$9.8b acquisition of Duet Group and US$3.1b acquisition of Alinta Energy. There were 17 smaller deals in renewables totaling US$1.1b.
China drove most deal activity in the region in Q1, conducting 12 inbound transactions and 3 outbound deals in Australia and Singapore worth US$13b.
The State Grid Corporation of China (SGCC) also finalized its full acquisition of CPFL Energia S.A, a Brazilian integrated utility in January 2017, after acquiring a 23% stake in September 2016.
Chart 6: Asia-Pacific deal value and volume, by segment(asset and corporate-level deals, Q1 2015–Q1 2017)
0
10
20
30
40
50
60
70
05
1015202530354045
Generation T&D Renewables Others Deal volume
Q1 2015
Q2 2015
Q3 2015
Q4 2015
Q1 2016
Q2 2016
Q3 2016
Q4 2016
Q1 2017
US$
b
Num
ber o
f dea
ls
US$15.1bdeal value for Q1 2017, a decrease of 34% quarter-on-quarter
US$13.4b deal value in transmissionand distribution segment, 92% of total deal value
Power transactions and trends Q1 2017
11Power transactions and trends: Q1 2017 |
Q1 2017 transactional highlights• Chinese firms target Australian
T&D: Chinese firms conducted in cross-border deals worth US$13b (86% of total deal value), mostly in Australia’s T&D sector. The largest P&U deal of Q1 across all regions was the US$9.8b acquisition of Australia’s Duet Group by a consortium of Cheung Kong Infrastructure (CKI), Cheung Kong Property (CKP) and Power Assets Holdings (PAH).
• Non-utility corporate investors drive M&A: these investors conducted US$14b of deals, contributing 93% of total regional deal value.
• Investors look across borders: 91% of Asia-Pacific deals were cross-border transactions.
• Australia the most sought-after destination: 86% of total deal value of the region took place in Australia, followed by China, which hosted 10% of deal value.
• Large number of low value deals in renewables: deal value in renewable energy increased 83%, from US$600m in Q4 2016 to US$1.1b in Q1 2017. China and India attracted most of this investment, hosting deals worth US$1b.
• Investment in conventional generation IPPs decline: deal value in generation declined 96% to US$196m in Q1, from US$5b in Q4 2016. Only two IPP deals occurred in Q1 — 1.5 GW of coal-fired generation capacity in India and Japan.
| Power transactions and trends: Q1 201712
Image 3: Asia-Pacific investment flows inbound and outbound by country, (Q1 2017)*
Announcement date
Target Target country/bidder country
Bidder Deal value (US$)
Bidder rationale Segment
16 January Duet Group Australia/Hong Kong, China
Consortium of Cheung Kong Infrastructure (CKI), Cheung Kong Property (CKP) and Power Assets Holdings (PAH)
$9.8b Supports bidders’ diversification strategy
T&D: gas
16 March Alinta Energy Limited
Australia/Hong Kong, China
Chow Tai Fook Enterprises Limited (CTFE)
$3.1b CTFE to grow Alinta's business by pursuing investment opportunities in the Australian energy market
T&D: gas
25 January Zhejiang DunAn New Energy Development Co., Ltd.
China/China Anhui Jiangnan Chemical Industry
$579m Enables Anhui to enter new energy-related businesses and enhance its capacity for sustainable development
Renewables
3 January Bei Kong (Dalian) Investment Co., Ltd. (60% stake)
China/Hong Kong, China
Fortune Future Limited; Honest World International Limited
$215m Strengthens water-related business portfolios of both bidders
Other: water and waste water
14 February ReNew Power Ventures Pvt. Ltd. (10% stake)
India/Japan JERA Co. $200m Helps JERA secure sustainable growth and enter India’s energy sector
Renewables
Source: EY analysis based on Mergermarket data.
Top inbound investment destinations Top outbound investment destinations
AustraliaInvestment value US$12.9b (86%)Investment value US$0.3b (2%)
TotalInvestment value US$15.1bInvestment value US$14.5b
ChinaInvestment value US$1.4b (9%)Investment value US$13.9b (96%)
JapanInvestment value US$0.2b (1%)Investment value US$0.2b (1%)
South KoreaInvestment value US$0.2b (1%)
IndiaInvestment value US$0.4b (3%)
OthersInvestment value US$0.2b (1%)
*Note: Percentages may not add up to 100% due to rounding.
Top 5 Asia-Pacific deals, Q1 2017All deal values indicated are disclosed enterprise values comprising of equity and debt components.
13Power transactions and trends: Q1 2017 |
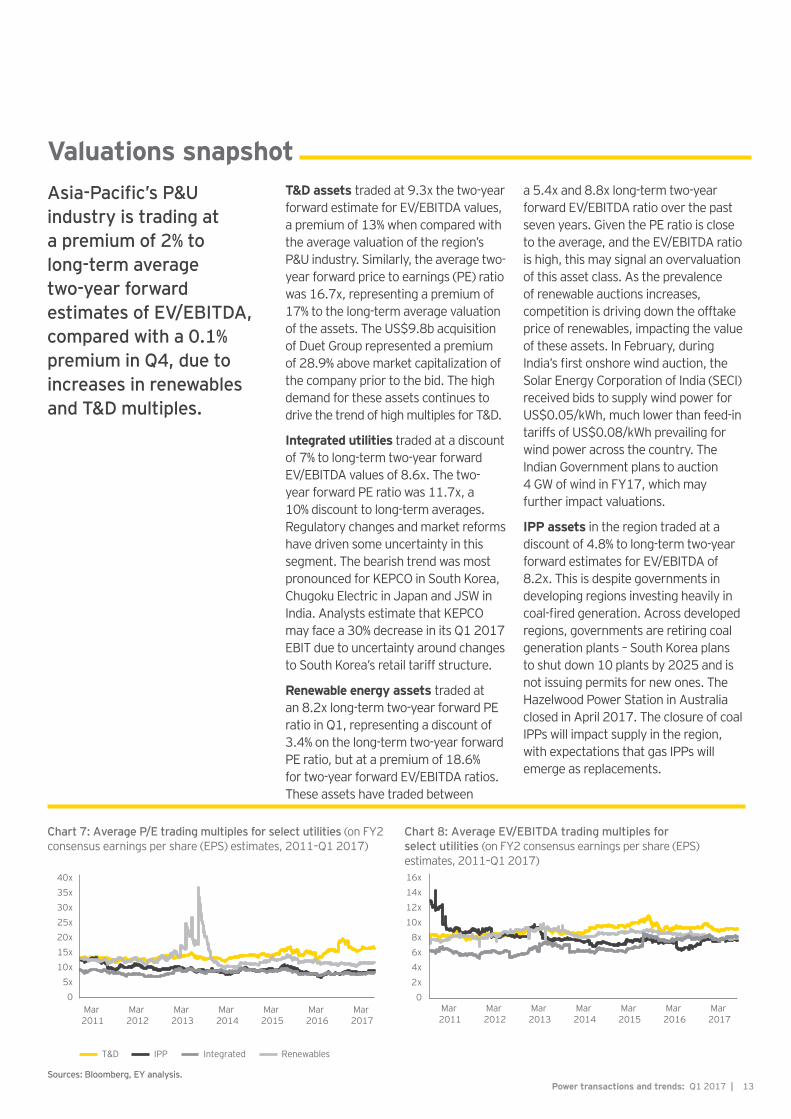
Valuations snapshotAsia-Pacific’s P&U industry is trading at a premium of 2% to long-term average two-year forward estimates of EV/EBITDA, compared with a 0.1% premium in Q4, due to increases in renewables and T&D multiples.
Chart 7: Average P/E trading multiples for select utilities (on FY2 consensus earnings per share (EPS) estimates, 2011–Q1 2017)
Chart 8: Average EV/EBITDA trading multiples for select utilities (on FY2 consensus earnings per share (EPS) estimates, 2011–Q1 2017)
05x
10x15x20x25x30x35x40x
Mar 2011
Mar 2012
Mar 2013
Mar 2014
Mar 2015
Mar 2016
Mar 2017
T&D IPP Integrated Renewables
02x4x6x8x
10x12x14x16x
Mar 2011
Mar 2012
Mar 2013
Mar 2014
Mar 2015
Mar 2016
Mar 2017
T&D assets traded at 9.3x the two-year forward estimate for EV/EBITDA values, a premium of 13% when compared with the average valuation of the region’s P&U industry. Similarly, the average two-year forward price to earnings (PE) ratio was 16.7x, representing a premium of 17% to the long-term average valuation of the assets. The US$9.8b acquisition of Duet Group represented a premium of 28.9% above market capitalization of the company prior to the bid. The high demand for these assets continues to drive the trend of high multiples for T&D.
Integrated utilities traded at a discount of 7% to long-term two-year forward EV/EBITDA values of 8.6x. The two-year forward PE ratio was 11.7x, a 10% discount to long-term averages. Regulatory changes and market reforms have driven some uncertainty in this segment. The bearish trend was most pronounced for KEPCO in South Korea, Chugoku Electric in Japan and JSW in India. Analysts estimate that KEPCO may face a 30% decrease in its Q1 2017 EBIT due to uncertainty around changes to South Korea’s retail tariff structure.
Renewable energy assets traded at an 8.2x long-term two-year forward PE ratio in Q1, representing a discount of 3.4% on the long-term two-year forward PE ratio, but at a premium of 18.6% for two-year forward EV/EBITDA ratios. These assets have traded between
a 5.4x and 8.8x long-term two-year forward EV/EBITDA ratio over the past seven years. Given the PE ratio is close to the average, and the EV/EBITDA ratio is high, this may signal an overvaluation of this asset class. As the prevalence of renewable auctions increases, competition is driving down the offtake price of renewables, impacting the value of these assets. In February, during India’s first onshore wind auction, the Solar Energy Corporation of India (SECI) received bids to supply wind power for US$0.05/kWh, much lower than feed-in tariffs of US$0.08/kWh prevailing for wind power across the country. The Indian Government plans to auction 4 GW of wind in FY17, which may further impact valuations.
IPP assets in the region traded at a discount of 4.8% to long-term two-year forward estimates for EV/EBITDA of 8.2x. This is despite governments in developing regions investing heavily in coal-fired generation. Across developed regions, governments are retiring coal generation plants – South Korea plans to shut down 10 plants by 2025 and is not issuing permits for new ones. The Hazelwood Power Station in Australia closed in April 2017. The closure of coal IPPs will impact supply in the region, with expectations that gas IPPs will emerge as replacements.
Sources: Bloomberg, EY analysis.
| Power transactions and trends: Q1 201714
M&A capital outlook and investment hotspots • Increased investments to
ensure security of supply: as the penetration of renewable energy increases, the focus is shifting to investment in ensuring security of supply. In early 2017, the Australian state of South Australia experienced significant load shedding, prompting the state government to announce plans to invest US$550m in grid connected battery storage and 250 MW of gas-fired power to increase system flexibility and combat future reliability issues.
• Japan and Australia emerge as attractive markets for energy storage: In 2019, Japan’s program to buy excess power from rooftop solar at above-market rates will end, opening opportunities for battery
makers, such as Panasonic and Tesla, to offer battery storage solutions to households. In Australia, South Australia is a focus for battery developers after the government issued a request for expressions of interest to install 100 MW of battery capacity — it has already received more than 90 responses from companies all over the world.
• Greenfield investment in renewables continues: Indian Railways plans to develop 1 GW of solar and 200 MW of wind power by 2022. ReneSola, a solar equipment maker, plans to develop 393 MW of solar projects in China in 2017. China Everbright Greentech, a waste to energy producer, plans to raise as much as US$425m through an IPO. Canadian
Solar, a leading photovoltaic (PV) manufacturer, plans to build 80 MW of solar projects in India by the end of 2017. Renova Inc., a Japanese renewable energy developer, plans to build an offshore wind farm with capacity of 560 MW.
• Electric vehicle (EV) infrastructure investment to increase: As governments recognize the potential of EVs to meet the twin goals of reducing pollution and reversing the decline in electricity demand, more are investing in infrastructure to support their greater adoption. The South Korean Government plans to provide a subsidy of US$4,500 per EV charging point in a push to install 9,500 EV charging stations.
EY Global Transaction Advisory Services (TAS) P&U contacts
Matt RennieGlobal TAS P&U LeaderBrisbane, Australia+61 7 3011 [email protected]
Nick CardnoOceania TAS P&U LeaderSydney, Australia+61 2 9248 [email protected]
Gilles PascualASEAN TAS P&U LeaderSingapore+65 6309 [email protected]
Alex ZhuGreater China TAS P&U LeaderBeijing, China+86 10 5815 [email protected]
Somesh KumarIndia TAS P&U LeaderNew Delhi, India+91 11 6671 [email protected]
Peter WespJapan TAS P&U LeaderTokyo, Japan+81 3 4582 [email protected]
Bum Choong KimKorea TAS P&U LeaderSeoul, Korea+82 2 3787 [email protected]
15Power transactions and trends: Q1 2017 |
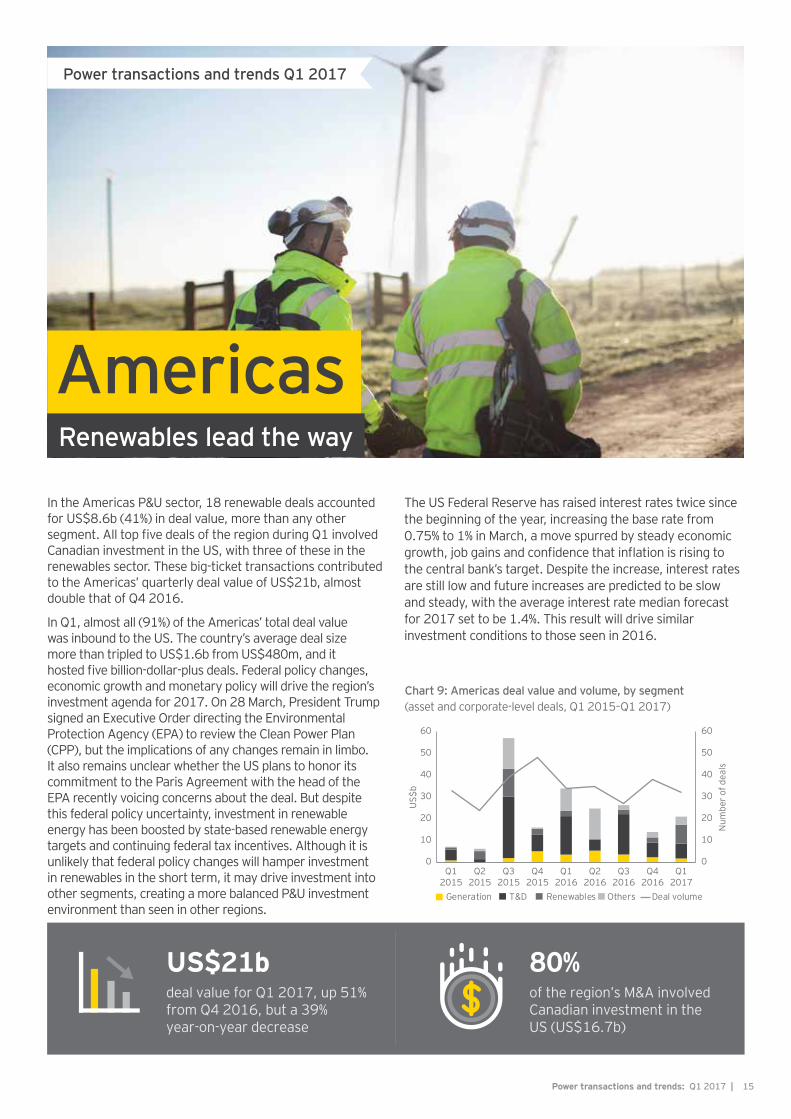
AmericasRenewables lead the way
In the Americas P&U sector, 18 renewable deals accounted for US$8.6b (41%) in deal value, more than any other segment. All top five deals of the region during Q1 involved Canadian investment in the US, with three of these in the renewables sector. These big-ticket transactions contributed to the Americas’ quarterly deal value of US$21b, almost double that of Q4 2016.
In Q1, almost all (91%) of the Americas’ total deal value was inbound to the US. The country’s average deal size more than tripled to US$1.6b from US$480m, and it hosted five billion-dollar-plus deals. Federal policy changes, economic growth and monetary policy will drive the region’s investment agenda for 2017. On 28 March, President Trump signed an Executive Order directing the Environmental Protection Agency (EPA) to review the Clean Power Plan (CPP), but the implications of any changes remain in limbo. It also remains unclear whether the US plans to honor its commitment to the Paris Agreement with the head of the EPA recently voicing concerns about the deal. But despite this federal policy uncertainty, investment in renewable energy has been boosted by state-based renewable energy targets and continuing federal tax incentives. Although it is unlikely that federal policy changes will hamper investment in renewables in the short term, it may drive investment into other segments, creating a more balanced P&U investment environment than seen in other regions.
The US Federal Reserve has raised interest rates twice since the beginning of the year, increasing the base rate from 0.75% to 1% in March, a move spurred by steady economic growth, job gains and confidence that inflation is rising to the central bank’s target. Despite the increase, interest rates are still low and future increases are predicted to be slow and steady, with the average interest rate median forecast for 2017 set to be 1.4%. This result will drive similar investment conditions to those seen in 2016.
Chart 9: Americas deal value and volume, by segment(asset and corporate-level deals, Q1 2015–Q1 2017)
Generation T&D Renewables Others Deal volume
0
10
20
30
40
50
60
0
10
20
30
40
50
60
Q12015
Q22015
Q32015
Q42015
Q12016
Q22016
Q32016
Q42016
Q12017
US$
b
Num
ber o
f dea
ls
US$21bdeal value for Q1 2017, up 51% from Q4 2016, but a 39% year-on-year decrease
80%of the region’s M&A involved Canadian investment in theUS (US$16.7b)
Power transactions and trends Q1 2017
| Power transactions and trends: Q1 201716
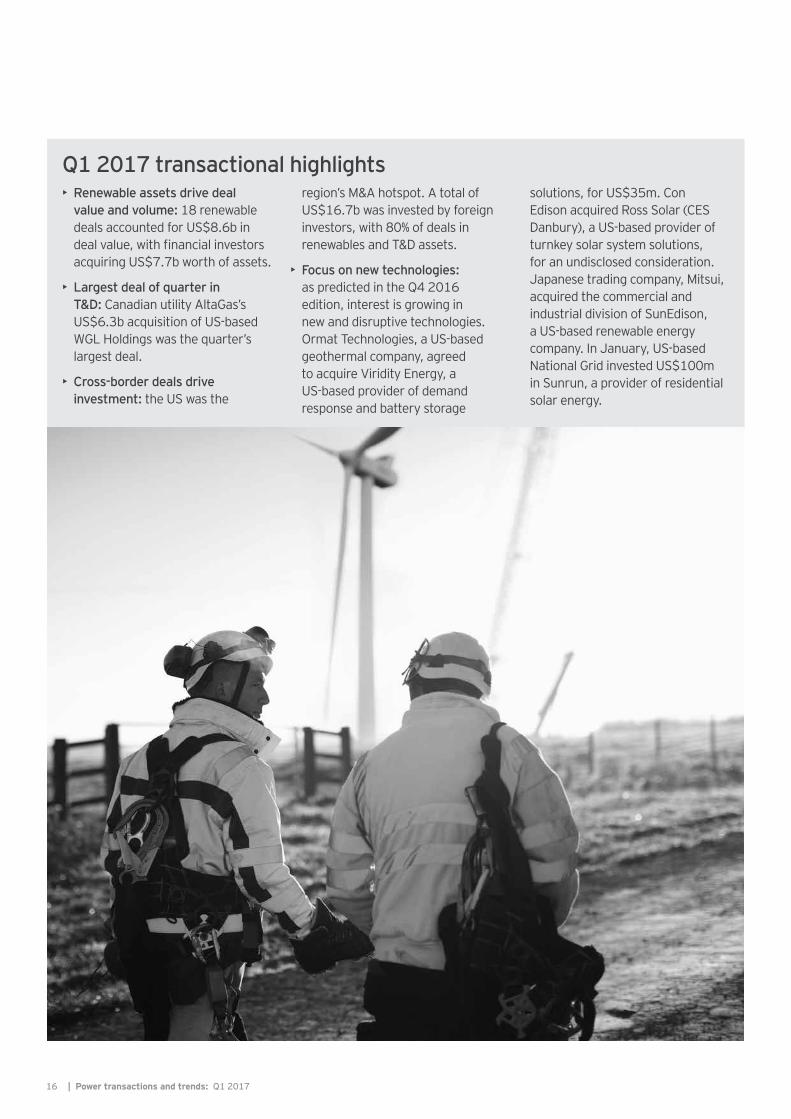
Q1 2017 transactional highlights• Renewable assets drive deal
value and volume: 18 renewable deals accounted for US$8.6b in deal value, with financial investors acquiring US$7.7b worth of assets.
• Largest deal of quarter in T&D: Canadian utility AltaGas’s US$6.3b acquisition of US-based WGL Holdings was the quarter’s largest deal.
• Cross-border deals drive investment: the US was the
region’s M&A hotspot. A total of US$16.7b was invested by foreign investors, with 80% of deals in renewables and T&D assets.
• Focus on new technologies: as predicted in the Q4 2016 edition, interest is growing in new and disruptive technologies. Ormat Technologies, a US-based geothermal company, agreed to acquire Viridity Energy, a US-based provider of demand response and battery storage
solutions, for US$35m. Con Edison acquired Ross Solar (CES Danbury), a US-based provider of turnkey solar system solutions, for an undisclosed consideration. Japanese trading company, Mitsui, acquired the commercial and industrial division of SunEdison, a US-based renewable energy company. In January, US-based National Grid invested US$100m in Sunrun, a provider of residential solar energy.
17Power transactions and trends: Q1 2017 |
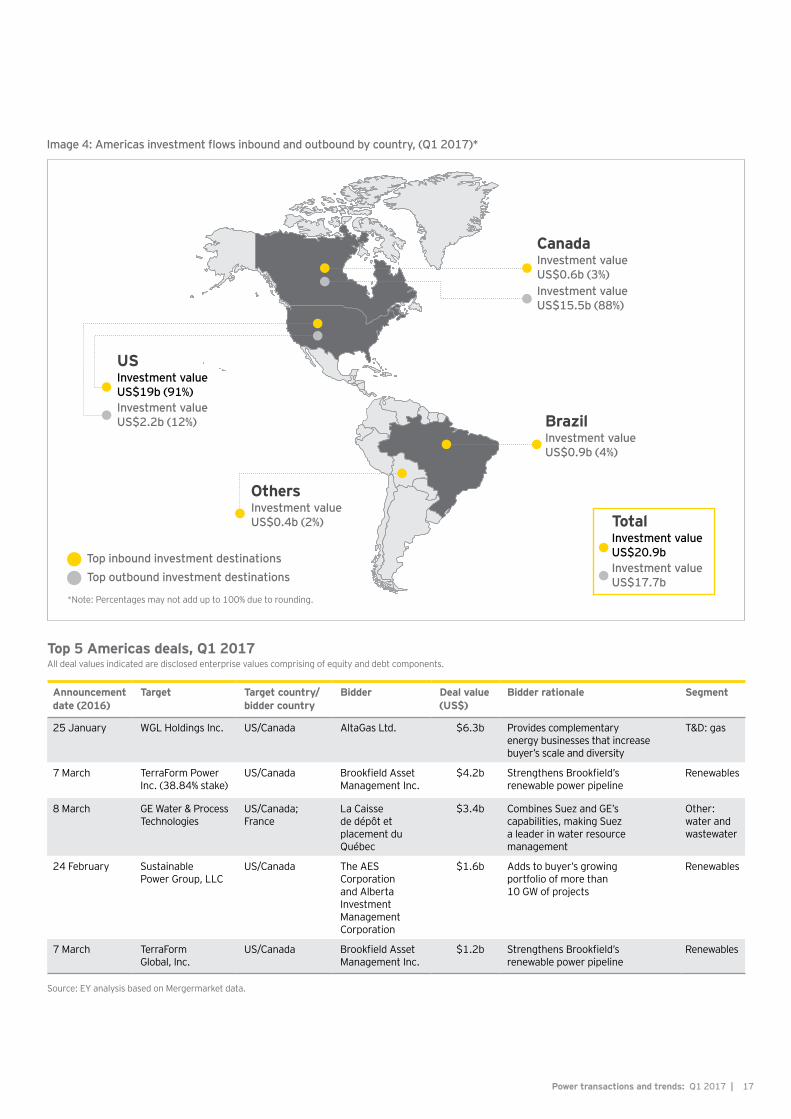
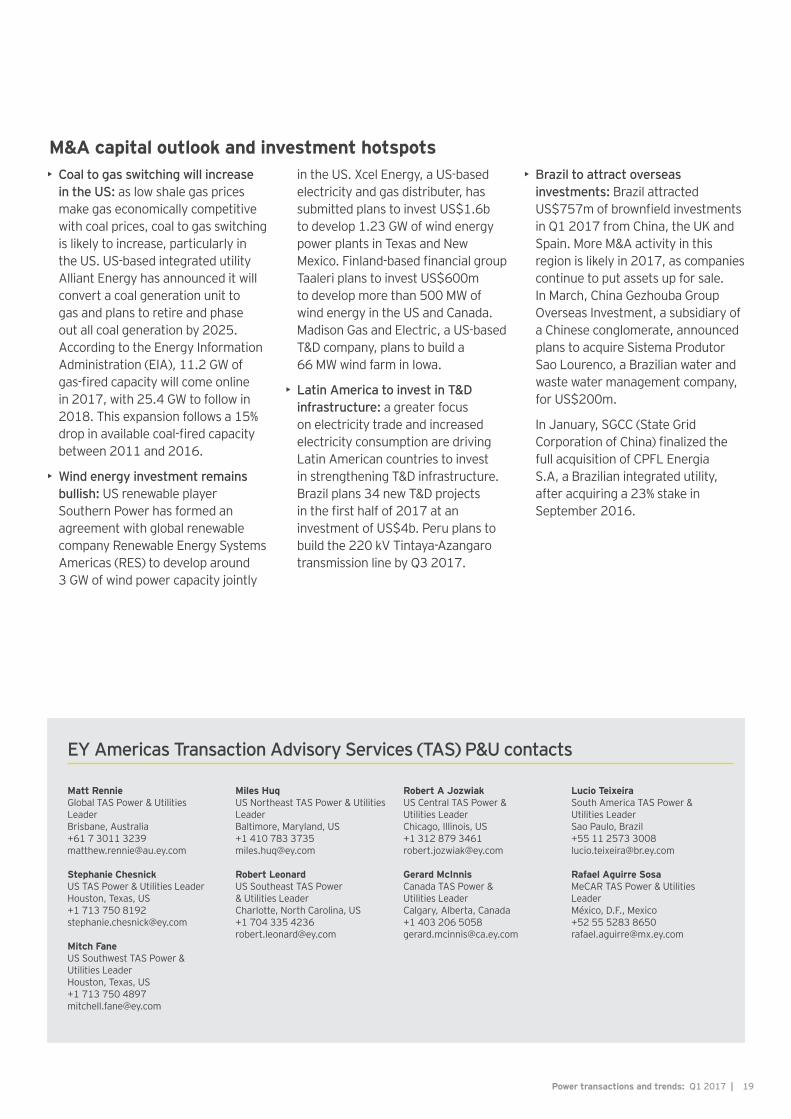
Image 4: Americas investment flows inbound and outbound by country, (Q1 2017)*
Announcement date (2016)
Target Target country/bidder country
Bidder Deal value (US$)
Bidder rationale Segment
25 January WGL Holdings Inc. US/Canada AltaGas Ltd. $6.3b Provides complementary energy businesses that increase buyer’s scale and diversity
T&D: gas
7 March TerraForm Power Inc. (38.84% stake)
US/Canada Brookfield Asset Management Inc.
$4.2b Strengthens Brookfield’s renewable power pipeline
Renewables
8 March GE Water & Process Technologies
US/Canada; France
La Caisse de dépôt et placement du Québec
$3.4b Combines Suez and GE’s capabilities, making Suez a leader in water resource management
Other: water and wastewater
24 February Sustainable Power Group, LLC
US/Canada The AES Corporation and Alberta Investment Management Corporation
$1.6b Adds to buyer’s growing portfolio of more than 10 GW of projects
Renewables
7 March TerraForm Global, Inc.
US/Canada Brookfield Asset Management Inc.
$1.2b Strengthens Brookfield’s renewable power pipeline
Renewables
Source: EY analysis based on Mergermarket data.
Top inbound investment destinationsTop outbound investment destinations
TotalInvestment value US$20.9bInvestment value US$17.7b
USInvestment value US$19b (91%)Investment value US$2.2b (12%) Brazil
Investment value US$0.9b (4%)
CanadaInvestment value US$0.6b (3%)Investment value US$15.5b (88%)
OthersInvestment value US$0.4b (2%)
*Note: Percentages may not add up to 100% due to rounding.
Top 5 Americas deals, Q1 2017All deal values indicated are disclosed enterprise values comprising of equity and debt components.
| Power transactions and trends: Q1 201718
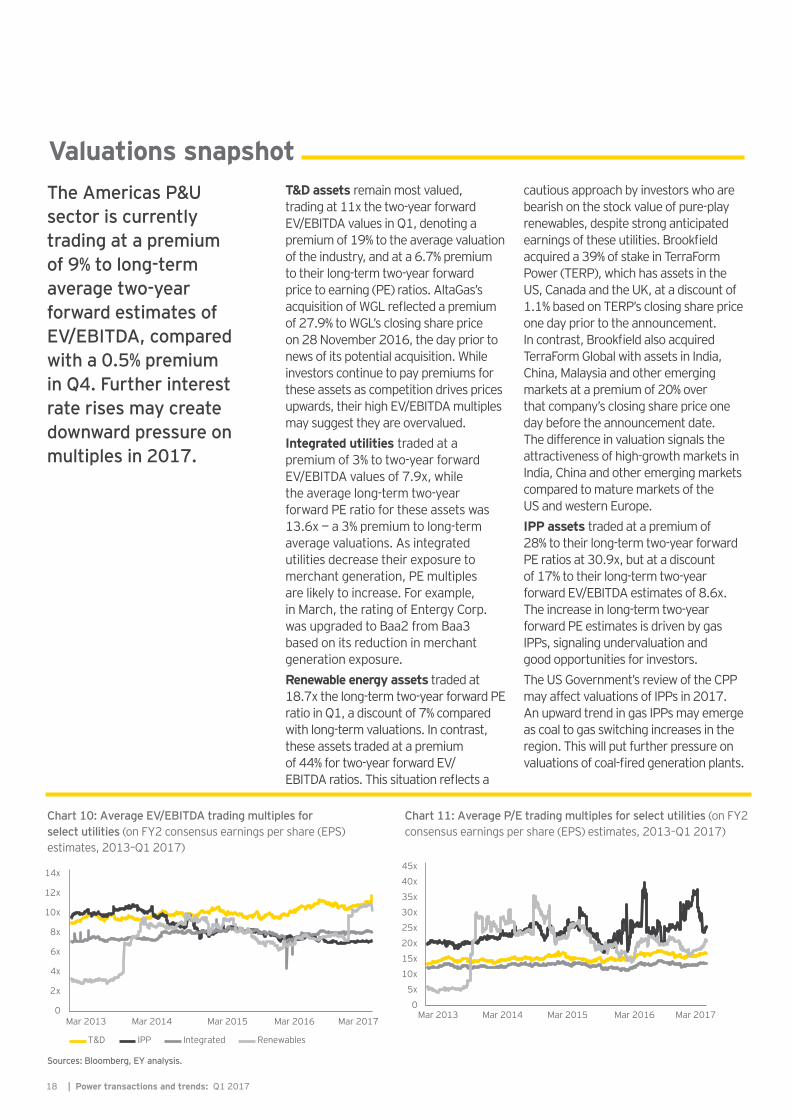
Valuations snapshotThe Americas P&U sector is currently trading at a premium of 9% to long-term average two-year forward estimates of EV/EBITDA, compared with a 0.5% premium in Q4. Further interest rate rises may create downward pressure on multiples in 2017.
T&D assets remain most valued, trading at 11x the two-year forward EV/EBITDA values in Q1, denoting a premium of 19% to the average valuation of the industry, and at a 6.7% premium to their long-term two-year forward price to earning (PE) ratios. AltaGas’s acquisition of WGL reflected a premium of 27.9% to WGL’s closing share price on 28 November 2016, the day prior to news of its potential acquisition. While investors continue to pay premiums for these assets as competition drives prices upwards, their high EV/EBITDA multiples may suggest they are overvalued.Integrated utilities traded at a premium of 3% to two-year forward EV/EBITDA values of 7.9x, while the average long-term two-year forward PE ratio for these assets was 13.6x — a 3% premium to long-term average valuations. As integrated utilities decrease their exposure to merchant generation, PE multiples are likely to increase. For example, in March, the rating of Entergy Corp. was upgraded to Baa2 from Baa3 based on its reduction in merchant generation exposure.Renewable energy assets traded at 18.7x the long-term two-year forward PE ratio in Q1, a discount of 7% compared with long-term valuations. In contrast, these assets traded at a premium of 44% for two-year forward EV/EBITDA ratios. This situation reflects a
cautious approach by investors who are bearish on the stock value of pure-play renewables, despite strong anticipated earnings of these utilities. Brookfield acquired a 39% of stake in TerraForm Power (TERP), which has assets in the US, Canada and the UK, at a discount of 1.1% based on TERP’s closing share price one day prior to the announcement. In contrast, Brookfield also acquired TerraForm Global with assets in India, China, Malaysia and other emerging markets at a premium of 20% over that company’s closing share price one day before the announcement date. The difference in valuation signals the attractiveness of high-growth markets in India, China and other emerging markets compared to mature markets of the US and western Europe.IPP assets traded at a premium of 28% to their long-term two-year forward PE ratios at 30.9x, but at a discount of 17% to their long-term two-year forward EV/EBITDA estimates of 8.6x. The increase in long-term two-year forward PE estimates is driven by gas IPPs, signaling undervaluation and good opportunities for investors.The US Government’s review of the CPP may affect valuations of IPPs in 2017. An upward trend in gas IPPs may emerge as coal to gas switching increases in the region. This will put further pressure on valuations of coal-fired generation plants.
Sources: Bloomberg, EY analysis.
T&D IPP Integrated Renewables
0
2x
4x
6x
8x
10x
12x
14x
Mar 2013 Mar 2014 Mar 2015 Mar 2016 Mar 2017
Chart 11: Average P/E trading multiples for select utilities (on FY2 consensus earnings per share (EPS) estimates, 2013–Q1 2017)
Chart 10: Average EV/EBITDA trading multiples for select utilities (on FY2 consensus earnings per share (EPS) estimates, 2013–Q1 2017)
0
5x
10x
15x
20x
25x
30x
35x
40x
45x
Mar 2013 Mar 2014 Mar 2015 Mar 2016 Mar 2017
19Power transactions and trends: Q1 2017 |
M&A capital outlook and investment hotspots • Coal to gas switching will increase
in the US: as low shale gas prices make gas economically competitive with coal prices, coal to gas switching is likely to increase, particularly in the US. US-based integrated utility Alliant Energy has announced it will convert a coal generation unit to gas and plans to retire and phase out all coal generation by 2025. According to the Energy Information Administration (EIA), 11.2 GW of gas-fired capacity will come online in 2017, with 25.4 GW to follow in 2018. This expansion follows a 15% drop in available coal-fired capacity between 2011 and 2016.
• Wind energy investment remains bullish: US renewable player Southern Power has formed an agreement with global renewable company Renewable Energy Systems Americas (RES) to develop around 3 GW of wind power capacity jointly
in the US. Xcel Energy, a US-based electricity and gas distributer, has submitted plans to invest US$1.6b to develop 1.23 GW of wind energy power plants in Texas and New Mexico. Finland-based financial group Taaleri plans to invest US$600m to develop more than 500 MW of wind energy in the US and Canada. Madison Gas and Electric, a US-based T&D company, plans to build a 66 MW wind farm in Iowa.
• Latin America to invest in T&D infrastructure: a greater focus on electricity trade and increased electricity consumption are driving Latin American countries to invest in strengthening T&D infrastructure. Brazil plans 34 new T&D projects in the first half of 2017 at an investment of US$4b. Peru plans to build the 220 kV Tintaya-Azangaro transmission line by Q3 2017.
• Brazil to attract overseas investments: Brazil attracted US$757m of brownfield investments in Q1 2017 from China, the UK and Spain. More M&A activity in this region is likely in 2017, as companies continue to put assets up for sale. In March, China Gezhouba Group Overseas Investment, a subsidiary of a Chinese conglomerate, announced plans to acquire Sistema Produtor Sao Lourenco, a Brazilian water and waste water management company, for US$200m.
In January, SGCC (State Grid Corporation of China) finalized the full acquisition of CPFL Energia S.A, a Brazilian integrated utility, after acquiring a 23% stake in September 2016.
EY Americas Transaction Advisory Services (TAS) P&U contacts
Matt RennieGlobal TAS Power & Utilities LeaderBrisbane, Australia+61 7 3011 [email protected]
Stephanie ChesnickUS TAS Power & Utilities LeaderHouston, Texas, US+1 713 750 [email protected]
Mitch FaneUS Southwest TAS Power & Utilities LeaderHouston, Texas, US+1 713 750 [email protected]
Miles HuqUS Northeast TAS Power & Utilities LeaderBaltimore, Maryland, US+1 410 783 [email protected]
Robert LeonardUS Southeast TAS Power & Utilities LeaderCharlotte, North Carolina, US+1 704 335 [email protected]
Robert A JozwiakUS Central TAS Power & Utilities LeaderChicago, Illinois, US+1 312 879 [email protected]
Gerard McInnisCanada TAS Power & Utilities LeaderCalgary, Alberta, Canada+1 403 206 [email protected]
Lucio TeixeiraSouth America TAS Power & Utilities LeaderSao Paulo, Brazil+55 11 2573 [email protected]
Rafael Aguirre SosaMeCAR TAS Power & Utilities LeaderMéxico, D.F., Mexico+52 55 5283 [email protected]
| Power transactions and trends: Q1 201720
the Middle EastAfrica and
Greenfield investment still dominates
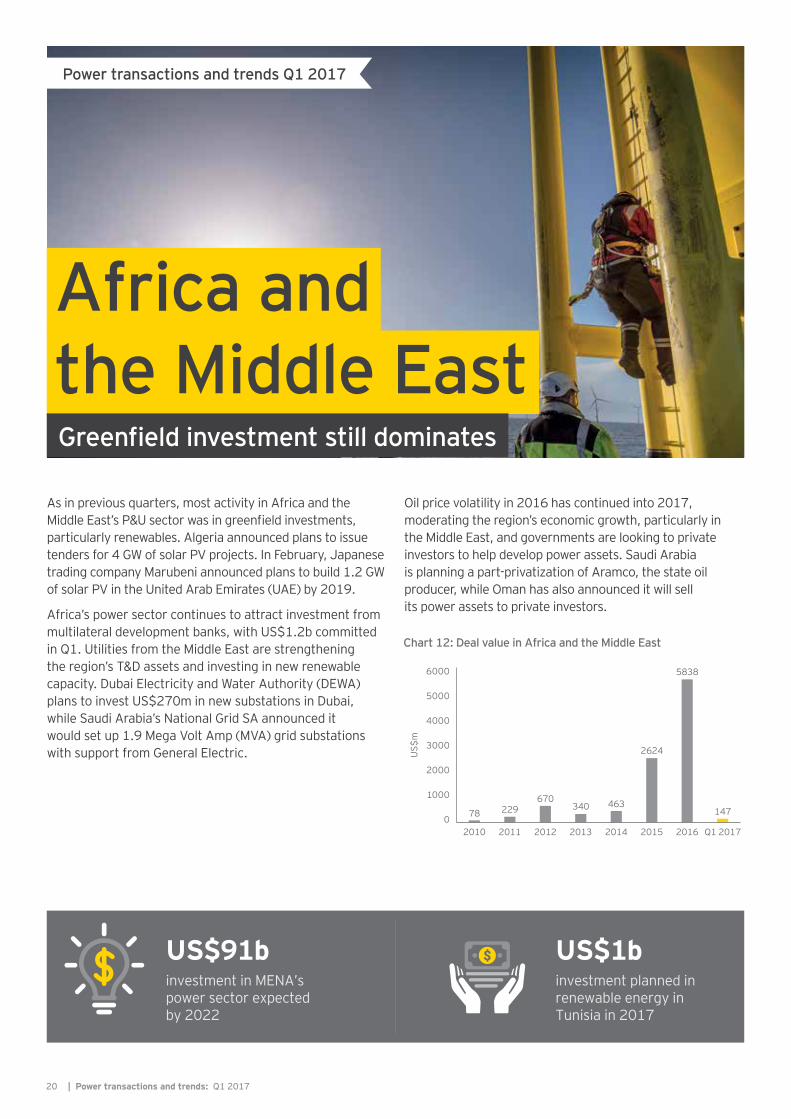
As in previous quarters, most activity in Africa and the Middle East’s P&U sector was in greenfield investments, particularly renewables. Algeria announced plans to issue tenders for 4 GW of solar PV projects. In February, Japanese trading company Marubeni announced plans to build 1.2 GW of solar PV in the United Arab Emirates (UAE) by 2019.
Africa’s power sector continues to attract investment from multilateral development banks, with US$1.2b committed in Q1. Utilities from the Middle East are strengthening the region’s T&D assets and investing in new renewable capacity. Dubai Electricity and Water Authority (DEWA) plans to invest US$270m in new substations in Dubai, while Saudi Arabia’s National Grid SA announced it would set up 1.9 Mega Volt Amp (MVA) grid substations with support from General Electric.
Oil price volatility in 2016 has continued into 2017, moderating the region’s economic growth, particularly in the Middle East, and governments are looking to private investors to help develop power assets. Saudi Arabia is planning a part-privatization of Aramco, the state oil producer, while Oman has also announced it will sell its power assets to private investors.
Chart 12: Deal value in Africa and the Middle East
78 229670
340 463
2624
5838
147
20100
1000
2000
3000
4000
5000
6000
2011 2012 2013 2014 2015 2016 Q1 2017
US$
m
US$91binvestment in MENA’s power sector expected by 2022
US$1binvestment planned inrenewable energy inTunisia in 2017
Power transactions and trends Q1 2017
21Power transactions and trends: Q1 2017 |
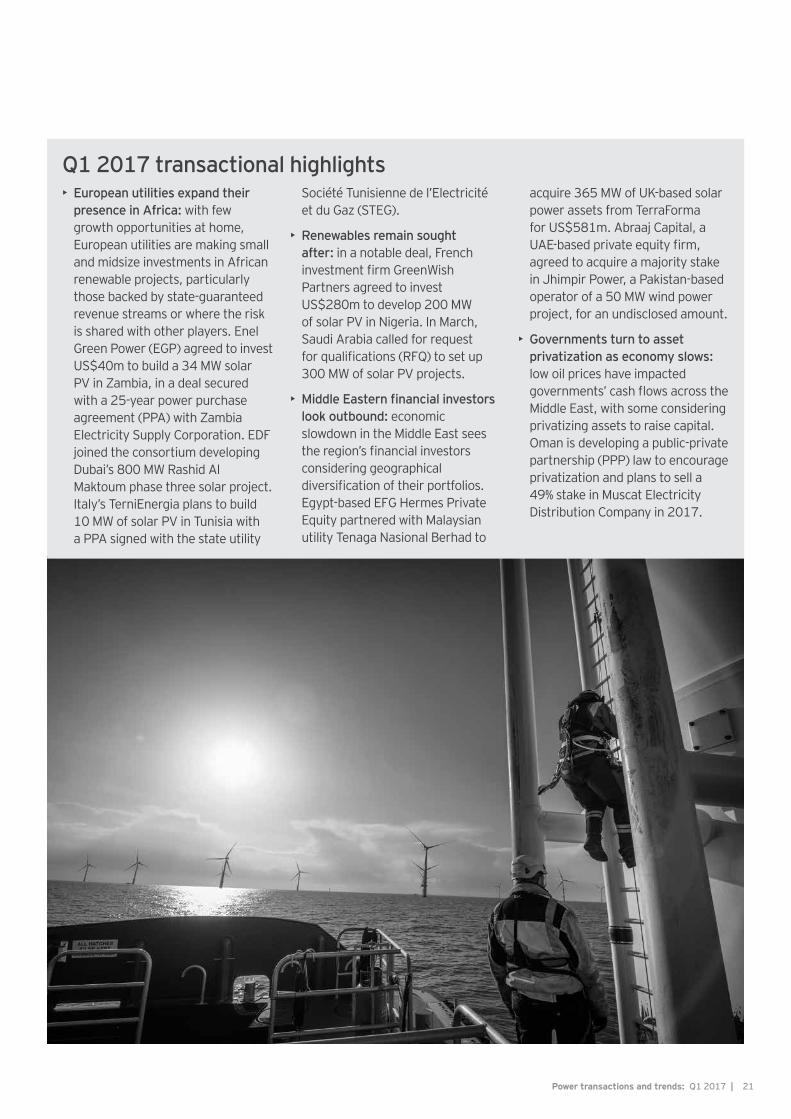
Q1 2017 transactional highlights• European utilities expand their
presence in Africa: with few growth opportunities at home, European utilities are making small and midsize investments in African renewable projects, particularly those backed by state-guaranteed revenue streams or where the risk is shared with other players. Enel Green Power (EGP) agreed to invest US$40m to build a 34 MW solar PV in Zambia, in a deal secured with a 25-year power purchase agreement (PPA) with Zambia Electricity Supply Corporation. EDF joined the consortium developing Dubai’s 800 MW Rashid Al Maktoum phase three solar project. Italy’s TerniEnergia plans to build 10 MW of solar PV in Tunisia with a PPA signed with the state utility
Société Tunisienne de l’Electricité et du Gaz (STEG).
• Renewables remain sought after: in a notable deal, French investment firm GreenWish Partners agreed to invest US$280m to develop 200 MW of solar PV in Nigeria. In March, Saudi Arabia called for request for qualifications (RFQ) to set up 300 MW of solar PV projects.
• Middle Eastern financial investors look outbound: economic slowdown in the Middle East sees the region’s financial investors considering geographical diversification of their portfolios. Egypt-based EFG Hermes Private Equity partnered with Malaysian utility Tenaga Nasional Berhad to
acquire 365 MW of UK-based solar power assets from TerraForma for US$581m. Abraaj Capital, a UAE-based private equity firm, agreed to acquire a majority stake in Jhimpir Power, a Pakistan-based operator of a 50 MW wind power project, for an undisclosed amount.
• Governments turn to asset privatization as economy slows: low oil prices have impacted governments’ cash flows across the Middle East, with some considering privatizing assets to raise capital. Oman is developing a public-private partnership (PPP) law to encourage privatization and plans to sell a 49% stake in Muscat Electricity Distribution Company in 2017.
| Power transactions and trends: Q1 201722
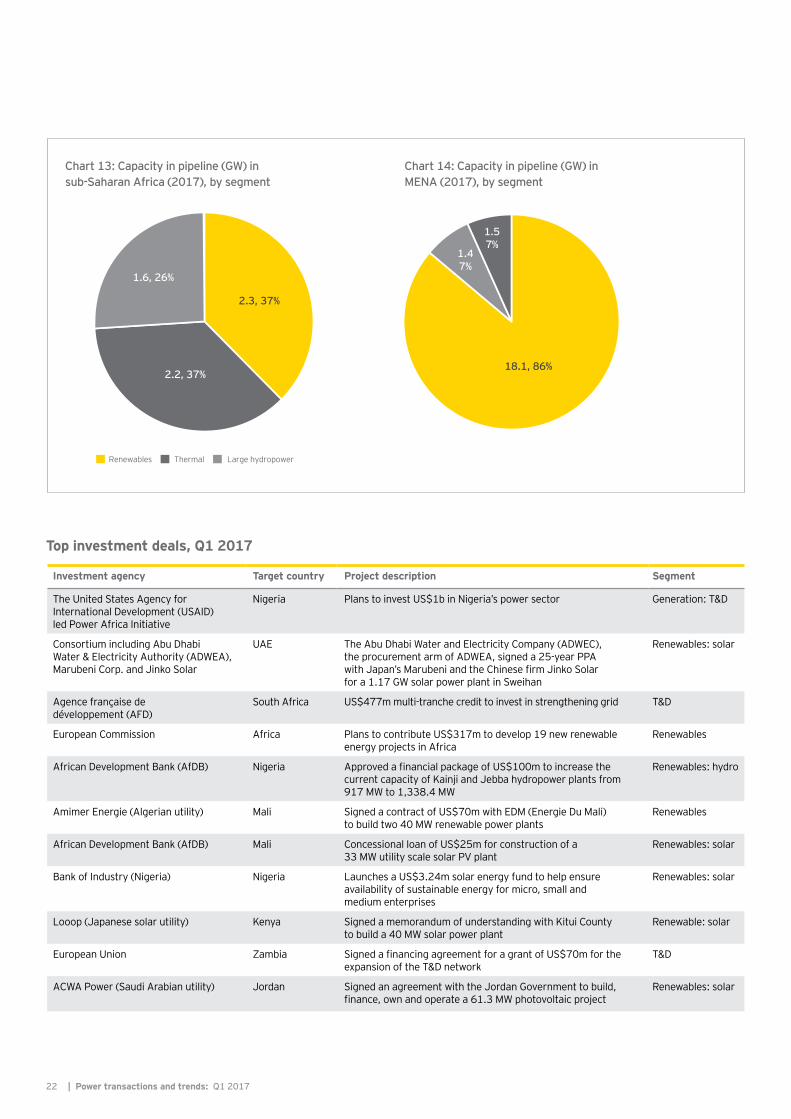
Chart 13: Capacity in pipeline (GW) in sub-Saharan Africa (2017), by segment
Chart 14: Capacity in pipeline (GW) in MENA (2017), by segment
Top investment deals, Q1 2017
Investment agency Target country Project description Segment
The United States Agency for International Development (USAID) led Power Africa Initiative
Nigeria Plans to invest US$1b in Nigeria’s power sector Generation: T&D
Consortium including Abu Dhabi Water & Electricity Authority (ADWEA), Marubeni Corp. and Jinko Solar
UAE The Abu Dhabi Water and Electricity Company (ADWEC), the procurement arm of ADWEA, signed a 25-year PPA with Japan’s Marubeni and the Chinese firm Jinko Solar for a 1.17 GW solar power plant in Sweihan
Renewables: solar
Agence française de développement (AFD)
South Africa US$477m multi-tranche credit to invest in strengthening grid T&D
European Commission Africa Plans to contribute US$317m to develop 19 new renewable energy projects in Africa
Renewables
African Development Bank (AfDB) Nigeria Approved a financial package of US$100m to increase the current capacity of Kainji and Jebba hydropower plants from 917 MW to 1,338.4 MW
Renewables: hydro
Amimer Energie (Algerian utility) Mali Signed a contract of US$70m with EDM (Energie Du Mali) to build two 40 MW renewable power plants
Renewables
African Development Bank (AfDB) Mali Concessional loan of US$25m for construction of a 33 MW utility scale solar PV plant
Renewables: solar
Bank of Industry (Nigeria) Nigeria Launches a US$3.24m solar energy fund to help ensure availability of sustainable energy for micro, small and medium enterprises
Renewables: solar
Looop (Japanese solar utility) Kenya Signed a memorandum of understanding with Kitui County to build a 40 MW solar power plant
Renewable: solar
European Union Zambia Signed a financing agreement for a grant of US$70m for the expansion of the T&D network
T&D
ACWA Power (Saudi Arabian utility) Jordan Signed an agreement with the Jordan Government to build, finance, own and operate a 61.3 MW photovoltaic project
Renewables: solar
2.3, 37%
2.2, 37%
1.6, 26%
Renewables Thermal Large hydropower
18.1, 86%
1.57%
1.47%
23Power transactions and trends: Q1 2017 |
M&A capital outlook and investment hotspots • Foreign investors key to developing
Africa’s P&U sector: as governments across much of Africa lack the macroeconomic and political capacity to attract investor confidence, the continent will continue to depend upon foreign supporters — both multilateral development banks and foreign governments — for growth. In March, the World Bank gave indemnities and partial risk guarantees for the construction of two large solar plants in Nigeria with a cumulative capacity of 110 MW. In total, 14 solar projects worth US$2.3b have been approved by the Nigerian Government and are due to receive further guarantees by the World Bank. In March, the European Investment Bank agreed to provide approximately US$126m for the development of a 200 MW wind farm in Egypt.
• European utilities expand their presence in Africa: European utilities are diversifying into the African market. Scatec Solar, a Norwegian independent solar developer, will set up six solar plants in Egypt with a total capacity of 400 MW. Eni, an Italian power generator, is planning to develop a 10 MW solar power plant in Algeria, along with the state utility Sonatrach, for an undisclosed amount.
• Opportunities for private players to enter MENA: the economic slowdown has encouraged many governments across MENA to open their power sector to private players. In its Vision 2030 blueprint, Saudi Arabia has emphasized the active role of private investment in its economic growth, including the P&U sector. The UAE, Oman, Morocco and Tunisia present attractive opportunities for investment with their relatively stable political environment compared with the rest of the region.
• Morocco to remain attractive investment destination: Morocco is perhaps the biggest target in MENA, due to comparably stable political and economic conditions. The Moroccan Government has set a target to achieve 2 GW of solar capacity by 2020. The second and third phase of the NOOR CSP project will add 510 MW capacity by 2018. In January, Saudi Arabian utility ACWA Power announced plans to develop 170 MW of solar PV at US$44.6/MWh.
• Investment in renewables to increase: Governments across the region are increasing investments in renewables. In the Middle East, countries are investing in renewables to cut their dependence on oil. Saudi Arabia will release a request for proposal (RfP) for 400 MW of wind power in the first half of 2017.
EY Global Transaction Advisory Services (TAS) P&U contacts
Matt RennieGlobal TAS Power & UtilitiesLeaderBrisbane, Australia+61 7 3011 [email protected]
Bruce HarveyAfrica TAS Power & UtilitiesLeaderJohannesburg, South Africa+27 11 772 [email protected]
David LloydMiddle East TAS Power & UtilitiesLeaderRiyadh, Saudi Arabia+966 11 215 [email protected]
About EYEY is a global leader in assurance, tax, transaction and advisory services. The insights and quality services we deliver help build trust and confidence in the capital markets and in economies the world over. We develop outstanding leaders who team to deliver on our promises to all of our stakeholders. In so doing, we play a critical role in building a better working world for our people, for our clients and for our communities.
EY refers to the global organization, and may refer to one or more, of the member firms of Ernst & Young Global Limited, each of which is a separate legal entity. Ernst & Young Global Limited, a UK company limited by guarantee, does not provide services to clients. For more information about our organization, please visit ey.com.
About EY’s Global Power & Utilities Sector In a world of uncertainty, changing regulatory frameworks and environmental challenges, utility companies need to maintain a secure and reliable supply, while anticipating change and reacting to it quickly. EY’s Global Power & Utilities Sector brings together a worldwide team of professionals to help you succeed — a team with deep technical experience in providing assurance, tax, transaction and advisory services. The Sector team works to anticipate market trends, identify their implications and develop points of view on relevant sector issues. Ultimately, this team enables us to help you meet your goals and compete more effectively.
© 2017 EYGM Limited. All Rights Reserved.
EYG no. 03362-174Gbl
BMC Agency GA 1004975
ED None
In line with EY’s commitment to minimize its impact on the environment, this document has been printed on paper with a high recycled content.
This material has been prepared for general informational purposes only and is not intended to be relied upon as accounting, tax or other professional advice. Please refer to your advisors for specific advice.
ey.com
EY | Assurance | Tax | Transactions | Advisory
Data source and industry scopeThe EY analysis and perspectives within Power transactions and trends are based on global financial releases and Mergermarket data, as well as global engagements conducted by EY member firms over the period 2012 to 2017. They provide an up-to-date assessment of outcomes and trends in the global utilities industry. For more information on the methodology employed in the preparation of this report, please contact:
Sara Richardson EY Global TAS P&U Resident [email protected]