Power Sector in - Asian Development Bank · ASIAN DEVELOPMENT BANK AsiAn Development BAnk 6 ADB...
37
ASIAN DEVELOPMENT BANK POWER SECTOR IN DEVELOPING ASIA: CURRENT STATUS AND POLICY ISSUES Jong Ho Hong, Changhun Kim, and Heeyoung Shin ADB ECONOMICS WORKING PAPER SERIES NO. 405 September 2014
Transcript of Power Sector in - Asian Development Bank · ASIAN DEVELOPMENT BANK AsiAn Development BAnk 6 ADB...

ASIAN DEVELOPMENT BANK
AsiAn Development BAnk6 ADB Avenue, Mandaluyong City1550 Metro Manila, Philippineswww.adb.org
Power Sector in Developing AsiaCurrent Status and Policy Issues
The paper examines the current status and future prospects of the electricity sectors and key policy issues in the People’s Republic of China (PRC), India, Japan, and the Republic of Korea. In the PRC, the fuel mix and energy efficiency are key concerns, while raising efficiency of power plants and reducing transmission losses are main issues in India. In Japan, amid reductions in nuclear output, there are aims to diversify generation portfolio by expanding renewables. In the Republic of Korea, average electricity prices are below production costs, leading to overconsumption.
About the Asian Development Bank
ADB’s vision is an Asia and Pacific region free of poverty. Its mission is to help its developing member countries reduce poverty and improve the quality of life of their people. Despite the region’s many successes, it remains home to approximately two-thirds of the world’s poor: 1.6 billion people who live on less than $2 a day, with 733 million struggling on less than $1.25 a day. ADB is committed to reducing poverty through inclusive economic growth, environmentally sustainable growth, and regional integration.
Based in Manila, ADB is owned by 67 members, including 48 from the region. Its main instruments for helping its developing member countries are policy dialogue, loans, equity investments, guarantees, grants, and technical assistance.
Power Sector in DeveloPing ASiA: current StAtuS AnD Policy iSSueSJong Ho Hong, Changhun Kim, and Heeyoung Shin
adb economicsworking paper series
no. 405
september 2014
ADB Ec
PoweCurre Jong Ho HHeeyoun
No. 405
ASIAN
conomics W
r Sectorent Statu
Hong, Changg Shin
| 2014
N DEVELO
Working P
r in Deveus and P
ghun Kim, an
OPMENT B
Paper Serie
eloping APolicy Iss
d
BANK
es
Asia: sues
Hong, JoEnvironmInstitute(AIEES),AssociatResearchHeeyounDevelop
ong Ho is a Profemental Studies, e for Energy, Env, Seoul Nationate Research Fellh Group, Korea ng Shin is a Rese
pment Institute.
essor in the Graand Acting Dire
vironment and Sl University. Chow, Climate ChEnergy Econom
earch Associate
aduate School ofector of the AsiaSustainability hanghun Kim is a
ange Policy mics Institute. e, Korea
f an
an

Asian Deve
6 ADB Ave1550 Metrowww.adb.or © 2014 by ASeptember ISSN 2313-Publication The views eDevelopme ADB does consequenc By making adocument, Note: In thi The ADB Eon ongoingBank (ADdevelopmeanalytical, and measuchallengessubregionadevelopme
The ADB Ecould subsThe series
Printed on
elopment Bank
nue, Mandaluyoo Manila, Philipprg
Asian Developm2014 6537 (Print), 23 Stock No. WPS
expressed in thient Bank (ADB)
not guarantee ce of their use.
any designationADB does not i
s publication, “$
Economics Wog and recentlyB) staff, consuent problems, or methodolo
urement. The ss; strengthen aal and countryent indicators
Economics Wosequently be re is maintained
n recycled paper
ong City pines
ment Bank
313-6545 (e-ISSS 146762
is paper are thoor its Board of G
the accuracy
n of or referencentend to make a
$” refers to US d
orking Paper Sy completed reultants, or reso
particularly thogical issues reseries aims to
analytical rigor y operations; an
for monitoring
orking Paper Sevised for pub by the Econo
SN)
ose of the authoGovernors or th
of the data in
e to a particularany judgments a
dollars.
Series is a forumsearch and pource persons.
hose facing thelating to projeenhance the kand quality of nd improve thg developmen
Series is a quickblication as arti
mics and Rese
or and do not nee governments
cluded in this
r territory or geoas to the legal or
m for stimulatiolicy studies un
The series deae Asia and Pacct/program ec
knowledge on AADB’s countr
e quality and at effectiveness
k-disseminatinicles in professearch Departm
ecessarily reflecthey represent.
publication an
ographic area, or other status of
ing discussionndertaken by tals with key ecific region; as w
conomic analysAsia’s developry partnership availability of ss.
ng, informal pusional journals
ment.
ct the views and
nd accepts no
or by using the f any territory or
and eliciting fthe Asian Deveconomic and well as concepsis, and statist
pment and polstrategies, and
statistical data
ublication whos or chapters in
d policies of the
responsibility f
term “country”r area.
feedback elopment
ptual, ical data icy d its
a and
ose titles n books.
e Asian
for any
in this

CONTENTS LIST OF TABLES AND FIGURES iv ABSTRACT v I. INTRODUCTION 1 II. CURRENT STATUS AND FUTURE PROSPECTS FOR ELECTRICITY SUPPLY
AND DEMAND 2
A. Overview 2 B. The People’s Republic of China 6 C. India 7 D. Japan 9 E. The Republic of Korea 11
III. KEY POLICY ISSUES BY COUNTRY 13
A. The People’s Republic of China 13 B. India 15 C. Japan 18 D The Republic of Korea 20
IV. COMPARISONS AND POLICY RECOMMENDATIONS 22
A. Improving Electricity Consumption per Gross Domestic Product 22 B. Reducing Nuclear Power 22 C. Promoting Renewable Portfolio Standards or Feed-In-Tariffs 24
V. CONCLUSION 25 REFERENCES 27

LIST OF TABLES AND FIGURES TABLES 1 Cost of Generating Electricity by Fuel Source in Japan, 2004–2030 19 2 Power Sector Comparisons 23 FIGURES 1 Primary World and Asian Energy Demand 2 2 World and Asian Electricity Generation 3 3 Estimations of Greenhouse Gas Emissions from Thermal Power Generation 4 4 Electricity Consumption per Capita 5 5 Electricity Consumption by Gross Domestic Product 5 6 Final Energy Demand of the People’s Republic of China by Energy Source 6 7 Projections of Fuel Mix in Electricity Generation of the People’s Republic of China 7 8 India’s Final Energy Demand by Energy Source 8 9 India’s Projections of Fuel Mix in Electricity Generation 8 10 Japan’s Final Energy Demand by Energy Source 9 11 Japan’s Projections of Fuel Mix in Electricity Generation 10 12 Japan’s Power Generation Mix after the Fukushima Nuclear Accident 11 13 The Republic of Korea’s Final Energy Demand by Energy Source 12 14 Projections of Fuel Mix in Electricity Generation (Business-as-Usual Scenario) 12 15 Supply Shortage at Peak Times in India 15 16 Coal Thermal Efficiency 16 17 Electricity Distribution Losses 17

ABSTRACT We examine the current status and future prospects of the electricity sectors and key policy issues in the People’s Republic of China (PRC), India, Japan, and the Republic of Korea. Fuel mix and energy efficiency are key to providing stable, affordable power, while curtailing future emissions in the PRC. In India, power plants cannot operate efficiently because of problems in the coal industry; transmission losses also need to be immediately addressed. In Japan, nuclear accounted for 27% of output in 2009 which fell to 18% following the Fukushima Daiichi accident. Currently, only two reactors are in operation. Japan aims to diversify its generation portfolio by expanding renewables. In the Republic of Korea, the average electricity price does not recover production costs which may have led to overconsumption. The budget for renewables should increase two-fold in the next 2 to 3 years but has instead decreased by 15% compared to 2012. The PRC, India, and the Republic of Korea plan to build more nuclear power plants. The cost of the entire life cycles of those plants needs to be analyzed, and the impacts of nuclear power on current and future generations must be considered in full. Keywords: power sector, government policy, energy efficiency, nuclear, renewables JEL Classification: Q40, Q48

I. INTRODUCTION World electricity demand is rising rapidly driven mainly by growth in Asia. It is projected to increase over 70% between 2010 and 2035 with over half expected to come from the People’s Republic of China (PRC) (38%) and India (13%), while Asia overall is expected to account for 64% (IEA 2012). With electricity demand in the PRC expected to grow 140% from 3,668 terawatt-hours (TWh) in 2010 to 8,810 TWh in 2035 and in India by 255% from 693 TWh in 2010 to 2,463 TWh in 2035, Asia’s portion of world electricity demand is projected to grow from 29% in 2010 to 43% in 2035 (IEA 2012). In 2010, the PRC and India accounted for 20% and 4% of the world total, respectively; this is projected to grow to 28% and 8%, respectively (IEA 2012). Asia’s importance in the power sector is therefore evident, especially the contributions of the PRC and India.
The growth in electricity demand is potentially destructive as greenhouse gas emissions from
the sector are a direct cause of climate change. According to a scenario by the International Energy Agency (IEA), assuming current policies on climate change are maintained, global primary energy demand is projected to rise by one-third up to 2035, which results in a 50% probability of limiting the long-term average global temperature increase to 3.6 degrees Celsius relative to pre-industrial levels (IEA 2012). From 2000 to 2010, carbon dioxide (CO2) emissions from Asia increased by 76%, most of which came from developing Asia, which showed a near twofold increase from 5,923 million tons of CO2 to 11,666 million tons (ADB 2013). Emissions from electricity generation are projected to increase annually by 2% from 2010 to 2020, an increase of 21% overall in Asia (ADB 2013). With electricity and heat generation accounting for 41% of energy-related CO2 emissions, reviewing short- and long-term policies for Asian power sectors is critical at this juncture (IEA 2012).
It is also, however, important for the power sectors to provide for the growing electricity
demands of their economies. As the increase in power consumption indicates, Asia’s presence in the world economy will continue to grow with the PRC and India leading the way. The economy in the PRC is likely to surpass that of the United States (US) in the next 2 decades, and India’s growth rate is forecast to pick up rapidly after 2030 becoming the next economic power house (Government of the US, NIC 2012).
In this chapter, we examine the power sector of four Asian countries representing economic
growth at different stages: the PRC, India, Japan, and the Republic of Korea. The PRC and India will be the center of development in the coming years while Japan is at the opposite end of the spectrum in terms of economic and power sector development. Despite a decrease in electricity consumption, Japan was still the third largest producer of electricity in 2010 (World Bank 2013). The Republic of Korea is at yet another juncture. By providing electricity below the cost of generation, it faces continued growth in demand that does not reflect the social cost of electricity.
In the first section of this paper, the current status and future prospects of the electricity
sector are addressed. Next, key policy issues are discussed by country, focusing on the area that is currently most critical. Lastly, policy recommendations are made that balance economic growth and sustainability goals.

2 | ADB Economics Working Paper Series No. 405
II. CURRENT STATUS AND FUTURE PROSPECTS FOR ELECTRICITY SUPPLY AND DEMAND
A. Overview
1. Growing Energy and Electricity Demand in Asia According to the IEA World Energy Outlook 2012 New Policies Scenario, the share of world primary energy demand in Asia is expected to increase from 38% in 2010 to 45% in 2035, as seen in Figure 1. The increase is greater for electricity as the report forecasts Asia‘s share in the world electricity market will surge from 38% to 51% in the same period (Figure 2). Managing the energy and electricity sectors in Asia will be critical to continuing economic growth and to achieving sustainability goals for the world at large.
Figure 1: Primary World and Asian Energy Demand
Mtoe = million tons of oil equivalent. Source: International Energy Agency (IEA). 2012. World Energy Outlook 2012. Paris.
0
10
20
30
40
50
0
4,000
8,000
12,000
16,000
20,000
1990 2000 2010 2015 2020 2030 2035
%
Mto
e
Asia and Oceania World Share of Asia region (%)

Power Sector in Developing Asia: Current Status and Policy Issues | 3
Figure 2: World and Asian Electricity Generation
TWh = terawatt-hour. Source: International Energy Agency (IEA). 2012. World Energy Outlook 2012. Paris.
2. Greenhouse Gas Emissions from Power Generation
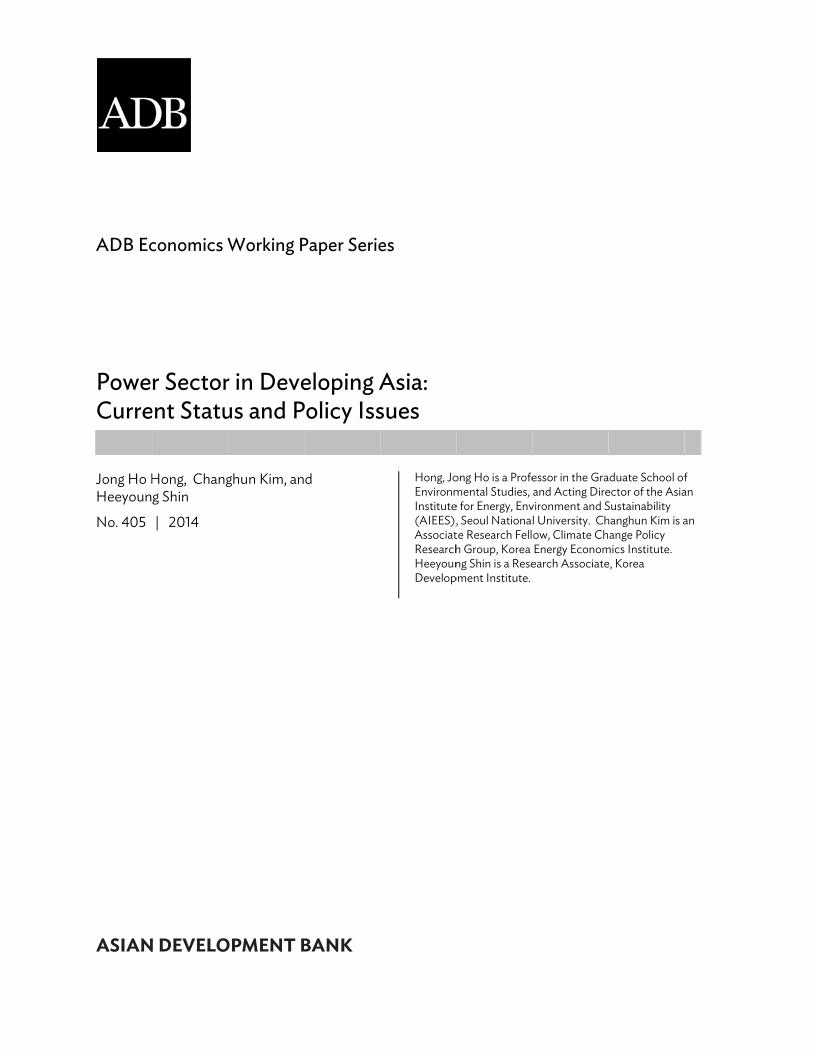
Reducing greenhouse gas (GHG) emissions is an important item on the global agenda to mitigate climate change. Figure 3 shows the estimated GHG emissions from the electric power sector for each country. The absolute amounts of GHG emissions and rates of increase in the PRC and India are large compared to the other countries because they both use coal as the main power source, and coal has a relatively large emission factor. According to climatologists, to meet the goal of limiting the global increase in average temperatures to 2 degrees Celsius in the long term compared to pre-industrial levels, GHG concentrations in the atmosphere have to be limited to 450 parts per million of CO2 equivalent (CO2e) (European Union Climate Change Expert Group Science 2008). This will be impossible without future reductions in the PRC and India.
0
20
40
60
80
0
10,000
20,000
30,000
40,000
1990 2010 2015 2020 2025 2030 2035
%
TWh
Asia and Oceania World Share of Asia region (%)
4 | ADB Economics Working Paper Series No. 405
Figure 3: Estimations of Greenhouse Gas Emissions from Thermal Power Generation
KOR = Republic of Korea, Mt CO2e = million tons of carbon dioxide equivalent, PRC = People’s Republic of China. Source: ADB. 2013. Asian Development Outlook 2013: Asia’s Energy Challenge. Manila.
3. Electric Power Consumption
The PRC and India constitute 62% of Asia’s power consumption, but in terms of power consumption per capita they consume much less than Japan or the Republic of Korea. Figure 4 shows consumption per capita rising slowly and steadily in both the PRC and India though much faster in the former. While India is the fifth largest producer of electricity, its per capita consumption is one of the lowest. Over one-third of the nation does not have access to electricity, and the supply is intermittent and unreliable for those that do. On the other hand, per capita consumption in the Republic of Korea rose at an alarming rate surpassing that of Japan, signaling overuse. Per capita figures in Japan have decreased due to demand management and to improved efficiency. Electricity consumption per gross domestic product (GDP) at purchasing power parity shows improved efficiency in all countries except the Republic of Korea (Figure 5).
0
1,000
2,000
3,000
4,000
PRC India Japan KOR
Mt
CO
2e
1990 2000 2009

Power Sector in Developing Asia: Current Status and Policy Issues | 5
Figure 4: Electricity Consumption per Capita
KOR = Republic of Korea, kWh = kilowatt-hour, PRC = People’s Republic of China. Source: World Bank. 2013. World Development Indicators. http://data.worldbank.org/data-catalog/world-development-indicators (accessed 31 January 2013).
Figure 5: Electricity Consumption by Gross Domestic Product (kWh per GDP at PPP)
KOR = Republic of Korea, kWh = kilowatt-hour, PPP = purchasing power parity, PRC = People’s Republic of China, $ = US dollar. Source: World Bank. 2013. World Development Indicators. http://data.worldbank.org/data-catalog/world-development -indicators (accessed 31 January 2013).
0
2,000
4,000
6,000
8,000
10,000
1980 1982 1984 1986 1988 1990 1992 1994 1996 1998 2000 2002 2004 2006 2008
kWh
per c
apita
PRC India Japan KOR
0.0
0.2
0.4
0.6
0.8
1.0
1.2
1980 1982 1984 1986 1988 1990 1992 1994 1996 1998 2000 2002 2004 2006 2008 2010
kWh/
$
PRC India Japan KOR
6 | ADB Economics Working Paper Series No. 405
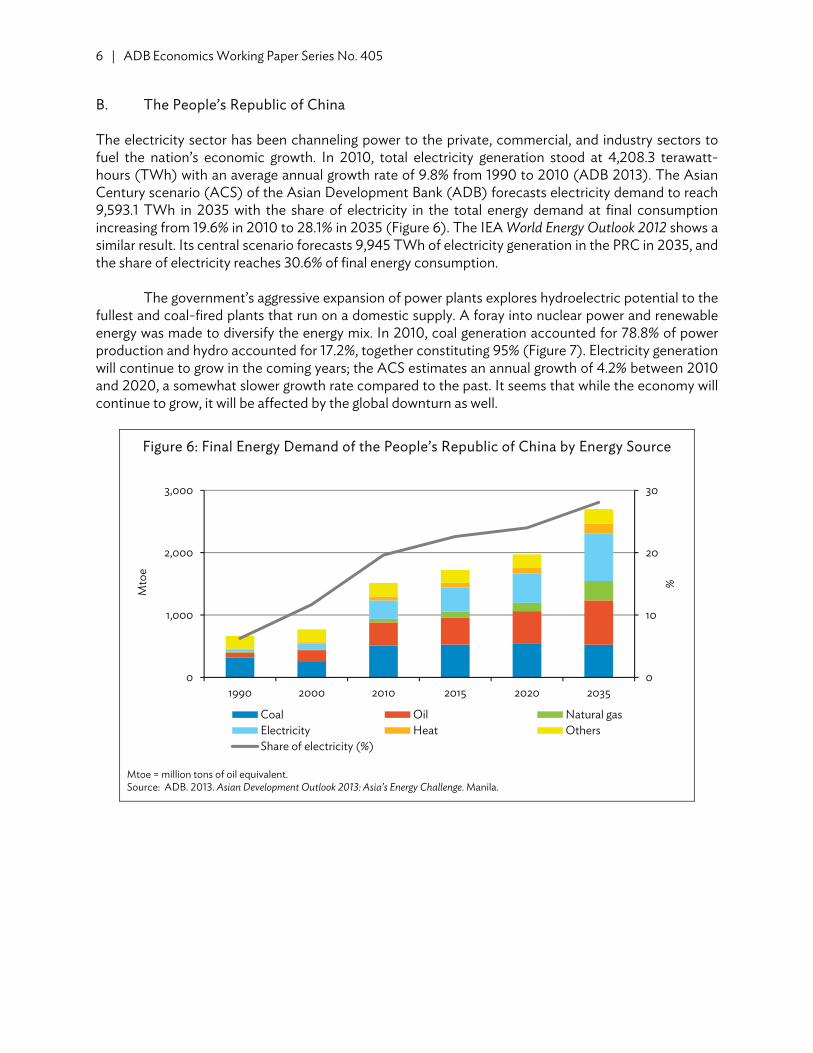
B. The People’s Republic of China The electricity sector has been channeling power to the private, commercial, and industry sectors to fuel the nation’s economic growth. In 2010, total electricity generation stood at 4,208.3 terawatt-hours (TWh) with an average annual growth rate of 9.8% from 1990 to 2010 (ADB 2013). The Asian Century scenario (ACS) of the Asian Development Bank (ADB) forecasts electricity demand to reach 9,593.1 TWh in 2035 with the share of electricity in the total energy demand at final consumption increasing from 19.6% in 2010 to 28.1% in 2035 (Figure 6). The IEA World Energy Outlook 2012 shows a similar result. Its central scenario forecasts 9,945 TWh of electricity generation in the PRC in 2035, and the share of electricity reaches 30.6% of final energy consumption.
The government’s aggressive expansion of power plants explores hydroelectric potential to the
fullest and coal-fired plants that run on a domestic supply. A foray into nuclear power and renewable energy was made to diversify the energy mix. In 2010, coal generation accounted for 78.8% of power production and hydro accounted for 17.2%, together constituting 95% (Figure 7). Electricity generation will continue to grow in the coming years; the ACS estimates an annual growth of 4.2% between 2010 and 2020, a somewhat slower growth rate compared to the past. It seems that while the economy will continue to grow, it will be affected by the global downturn as well.
Figure 6: Final Energy Demand of the People’s Republic of China by Energy Source
Mtoe = million tons of oil equivalent. Source: ADB. 2013. Asian Development Outlook 2013: Asia’s Energy Challenge. Manila.
0
10
20
30
0
1,000
2,000
3,000
1990 2000 2010 2015 2020 2035
%Mto
e
Coal Oil Natural gasElectricity Heat OthersShare of electricity (%)

Power Sector in Developing Asia: Current Status and Policy Issues | 7
Figure 7: Projections of Fuel Mix in Electricity Generation of the People’s Republic of China
(Business-as-Usual Scenario)
Source: ADB. 2013. Asian Development Outlook 2013: Asia’s Energy Challenge. Manila.
C. India The per capita energy and electricity consumption in India is one of the lowest in the world at 455 kilograms of oil equivalent per person of primary energy in 2004 which was around 26% of the world average of 1,750 kilograms (Government of India, Planning Commission 2008). Energy and electricity demand will grow, however, along with the economy.
India’s total power generation output was 960 TWh in 2010; ACS projects this will reach 1,832
TWh in 2020. The average annual growth rate from 2010 to 2020 is 6.7% and 7.6% from 2020 to 2030. As Figure 8 shows, electricity demand is expected to increase dramatically after 2020, though projections differ by organization. The World Energy Outlook 2012 proposes a 5.1% compound average annual growth rate from 2010 to 2035 in its main scenario and 4.3%–5.4% of growth in other scenarios. The US Energy Information Administration (EIA) projects an average annual growth of 3.9% from 2008 to 2035 in its International Energy Outlook 2011.
0
20
40
60
80
100
1990 2000 2010 2015 2020 2035
Pow
er g
ener
atio
n by
sour
ce (%
)
Coal Oil Natural gas Nuclear Hydro Others

8 | ADB Economics Working Paper Series No. 405
Figure 8: India’s Final Energy Demand by Energy Source
Mtoe = million tons of oil equivalent. Source: ADB. 2013. Asian Development Outlook 2013: Asia’s Energy Challenge. Manila.
In terms of energy mix, coal generation is the major source of electricity at 68% of power
generation output; natural gas and hydro come next at 12.3% and 11.9%, respectively (Figure 9). Coal will most likely provide the majority of power generation, but continued growth is unlikely and undesirable due to high emission factors. The shares of nuclear and renewable energy are projected to increase with nuclear growing from 2.7% in 2010 to 6% in 2020. Renewable sources excluding hydropower were 2.3% of total power generation output in 2010 and will grow to 4.3% in 2020 according to ADB projections (ADB 2013).
Figure 9: India’s Projections of Fuel Mix in Electricity Generation (Business-as-Usual Scenario)
Source: ADB. 2013. Asian Development Outlook 2013: Asia’s Energy Challenge. Manila.
0
5
10
15
20
25
30
35
0
200
400
600
800
1,000
1,200
1,400
1990 2000 2010 2015 2020 2035
%
Mto
e
Coal Oil Natural gasElectricity Heat OthersShare of electricity (%)
0
20
40
60
80
100
1990 2000 2010 2015 2020 2035
Pow
er g
ener
atio
n by
sour
ce (%
)
Coal Oil Natural gas Nuclear Hydro Others

Power Sector in Developing Asia: Current Status and Policy Issues | 9
D. Japan Power production in Japan was 1,041 TWh in 2009; it increased by an average of 1.2% annually between 1990 and 2009 (ADB 2013). Production is expected to remain stagnant from 2009 to 2020 at an average annual growth rate of 0.3% (Figure 10). The IEA projects 0.3% average annual growth from 2010 to 2035 in its main scenario while EIA’s International Energy Outlook 2011 predicts a slightly higher rate of 0.8% from 2008 to 2035.
Figure 10: Japan’s Final Energy Demand by Energy Source
Mtoe = million tons of oil equivalent. Source: ADB. 2013. Asian Development Outlook 2013: Asia’s Energy Challenge. Manila.
0
10
20
30
40
0
100
200
300
400
1990 2000 2009 2015 2020 2035
%
Mto
e
Coal Oil Natural gasElectricity Heat OthersShare of electricity (%)

10 | ADB Economics Working Paper Series No. 405
Figure 11: Japan’s Projections of Fuel Mix in Electricity Generation (Business-as-Usual Alternative Scenario)
Source: ADB. 2013. Asian Development Outlook 2013: Asia’s Energy Challenge. Manila.
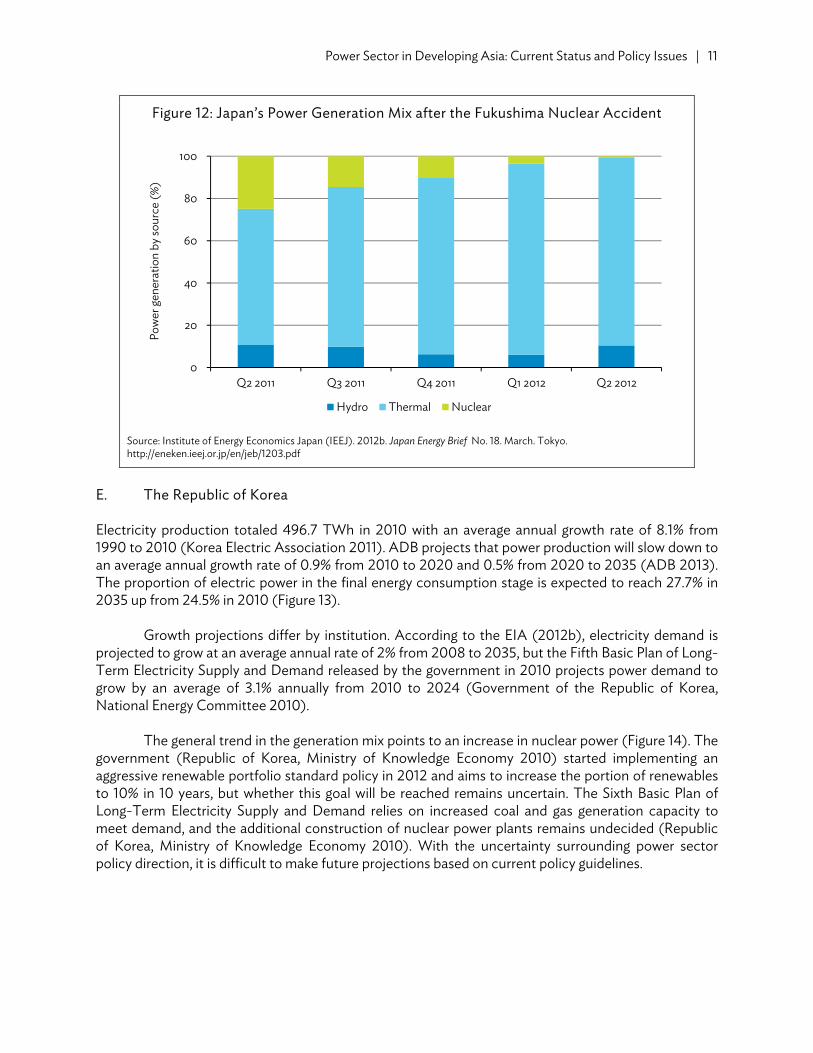
Japan has a diverse fuel mix with no one source dominating; however, recent trends show a
dramatic reduction in oil use and an increase in coal. In 1990, oil accounted for 14% of electricity generation while in 2009 it increased to 26.8% (Figure 11). In 2009, natural gas constituted 27.4% and nuclear 26.9%, but the Fukushima Daiichi accident in 2011 forced the government to reduce the nuclear portion drastically to 0.5% in the second quarter of 2012 (Figure 12). Renewable sources fueled 2.9% of total electricity generation in 2009. Japan has implemented a feed-in tariff to boost investment in renewables, but whether this policy directive will continue remains to be seen as the high price of renewables is a burden on the economy (Government of Japan Renewable Energy Policy Platform 2010).
0
20
40
60
80
100
1990 2000 2009 2015 2020 2035
Pow
er ge
nera
tion
by so
urce
(%)
Coal Oil Natural gas Nuclear Hydro Others
Power Sector in Developing Asia: Current Status and Policy Issues | 11
Figure 12: Japan’s Power Generation Mix after the Fukushima Nuclear Accident
Source: Institute of Energy Economics Japan (IEEJ). 2012b. Japan Energy Brief No. 18. March. Tokyo. http://eneken.ieej.or.jp/en/jeb/1203.pdf
E. The Republic of Korea
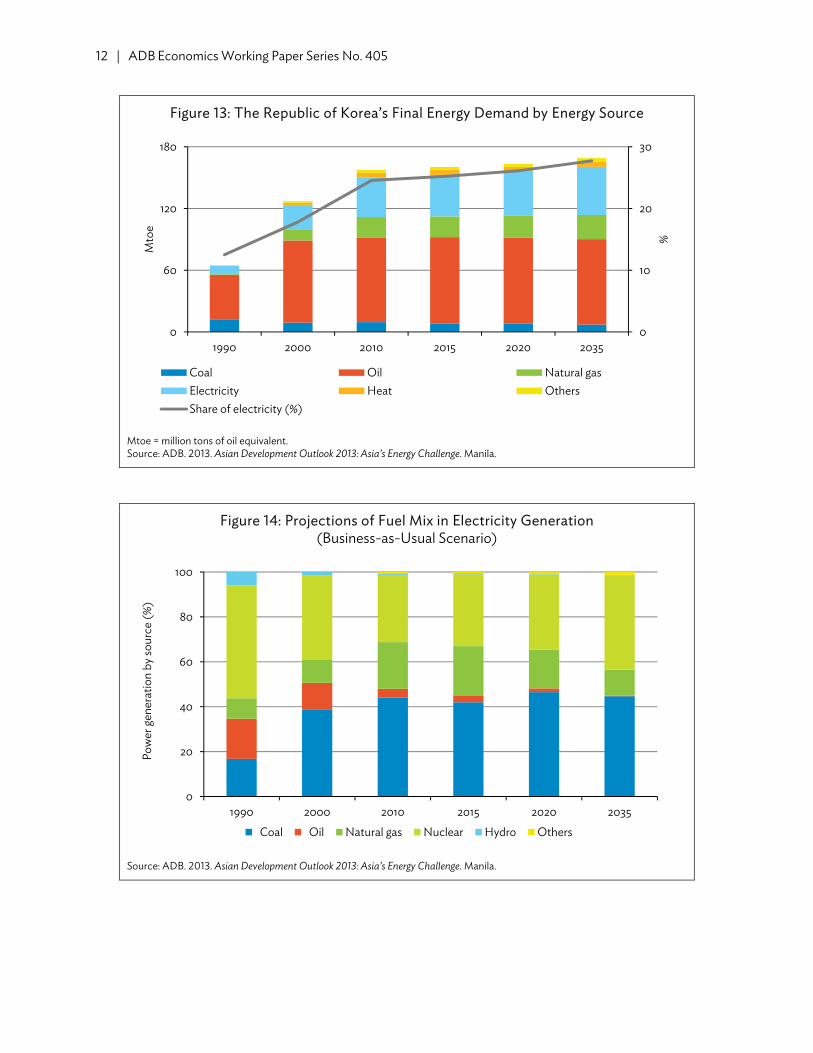
Electricity production totaled 496.7 TWh in 2010 with an average annual growth rate of 8.1% from 1990 to 2010 (Korea Electric Association 2011). ADB projects that power production will slow down to an average annual growth rate of 0.9% from 2010 to 2020 and 0.5% from 2020 to 2035 (ADB 2013). The proportion of electric power in the final energy consumption stage is expected to reach 27.7% in 2035 up from 24.5% in 2010 (Figure 13).
Growth projections differ by institution. According to the EIA (2012b), electricity demand is
projected to grow at an average annual rate of 2% from 2008 to 2035, but the Fifth Basic Plan of Long-Term Electricity Supply and Demand released by the government in 2010 projects power demand to grow by an average of 3.1% annually from 2010 to 2024 (Government of the Republic of Korea, National Energy Committee 2010).
The general trend in the generation mix points to an increase in nuclear power (Figure 14). The
government (Republic of Korea, Ministry of Knowledge Economy 2010) started implementing an aggressive renewable portfolio standard policy in 2012 and aims to increase the portion of renewables to 10% in 10 years, but whether this goal will be reached remains uncertain. The Sixth Basic Plan of Long-Term Electricity Supply and Demand relies on increased coal and gas generation capacity to meet demand, and the additional construction of nuclear power plants remains undecided (Republic of Korea, Ministry of Knowledge Economy 2010). With the uncertainty surrounding power sector policy direction, it is difficult to make future projections based on current policy guidelines.
0
20
40
60
80
100
Q2 2011 Q3 2011 Q4 2011 Q1 2012 Q2 2012
Pow
er g
ener
atio
n by
sour
ce (%
)
Hydro Thermal Nuclear
12 | ADB Economics Working Paper Series No. 405
Figure 13: The Republic of Korea’s Final Energy Demand by Energy Source
Mtoe = million tons of oil equivalent. Source: ADB. 2013. Asian Development Outlook 2013: Asia’s Energy Challenge. Manila.
Figure 14: Projections of Fuel Mix in Electricity Generation (Business-as-Usual Scenario)
Source: ADB. 2013. Asian Development Outlook 2013: Asia’s Energy Challenge. Manila.
0
10
20
30
0
60
120
180
1990 2000 2010 2015 2020 2035
%
Mto
e
Coal Oil Natural gasElectricity Heat OthersShare of electricity (%)
0
20
40
60
80
100
1990 2000 2010 2015 2020 2035
Pow
er g
ener
atio
n by
sour
ce (%
)
Coal Oil Natural gas Nuclear Hydro Others

Power Sector in Developing Asia: Current Status and Policy Issues | 13
III. KEY POLICY ISSUES BY COUNTRY
A. The People’s Republic of China The combination of a growing industry sector, spreading electricity to rural areas, and adopting a modern lifestyle requiring more energy will continue to increase power consumption. The government has plans to build additional generation facilities and transmission infrastructure to meet growing demand. The energy mix and the efficiency of generation, transmission, distribution, and consumption will be the key to providing a stable and affordable power supply while at the same time curtailing future carbon dioxide (CO2) emissions to create a greener economy.
1. Additional Transmission Infrastructure
The government’s energy plan has been very effective in providing for the country’s electricity needs; however, the PRC suffers regional, seasonal, and intermittent shortages during the peak electricity months in summer and winter (Wu and Fu 2005). Improving inter-provincial transmission can reduce the risk of shortages and at the same time allow power plants to be built near coal mines. A total of 54% of coal power plants are located in the east while 19% are located in the coal-rich regions in the west (Zeng et al. 2012). The transfer of coal from the mines to the power stations requires energy; it would be more efficient to locate power plants closer to the mines and transmit electricity to the industrial centers. Hydro, wind, and solar resources are at various locations, and because their intermittency requires them to be coupled with other sources, transmission will be crucial to renewable energy development. The country is in the process of expanding 750-kilovolt lines that will improve transmission efficiency over long distances.
2. Privatizing the Electricity Sector and Higher Prices
The electricity sector has been undergoing a careful process of unbundling and incorporating, and of applying market mechanisms to electricity distribution. In 1997, part of the Ministry of Power was transformed into the State Power Company, and from 1999 to 2000, six experimental electricity markets were established in cities and provinces. In 2002, generation was regrouped into five companies incorporating independent power producers and publicly listed companies. While the five companies were allotted similar assets, none has more than a 20% market share. Around 10%–20% of the generating capacity is owned by the grid companies to ensure reliable operation, frequency modulation, and peak load following; and 80% of the demand is traded on the electricity market based on long-term contracts while the rest is traded in the Electricity Dispatch and Trading Center (Wu and Fu 2005).
In 2004, a scheme was introduced that links electricity prices with the price of coal. If during a
cycle of 6 months the coal price rises 5% or more, the electricity price is likewise raised. However, while coal prices continue to rise, power producers are forced to limit what they charge as the National Development and Reform Commission, the country’s top economic planning body, regulates power prices while coal prices are governed by the market. The power companies are left to shoulder the losses as the price to consumers is lower than production costs (Chung 2011). According to the State Electricity Regulatory Commission, the top five state-owned power companies lost approximately CNY60 billion ($10 billion) in thermal power generation from 2008 to 2011. They have been able to shoulder the losses through profits from other sources such as hydropower, but opportunities for greater efficiency could be realized through unbundling and flexible pricing schemes.

14 | ADB Economics Working Paper Series No. 405
3. Promoting Renewable Energy
The PRC ranked first in the world for installed renewable capacity and third in terms of non-hydroelectric renewable capacity in 2010 (Government of the United States, EIA 2013). Hydroelectric resources were explored to the fullest with two large recent additions of the Three Gorges and Yellow River dams with 18.2 gigawatts of electricity (GWe) and 15.8 GWe capacities, respectively. An IEA report indicates the PRC will account for 40% of the additional 710 gigawatts (GW) of global renewable energy capacity by 2017 (IEA 2012). The PRC also ranked first in the Ernst & Young Renewable Energy Country Attractiveness Index in August 2012 and ranked first in terms of renewable energy investment in 2011, investing a total of $52 billion. The 12th Five Year Plan stated that clean energy was one of the three key investment areas and set a target of a 17% reduction in CO2 emissions per unit of GDP (KPMG Advisory China Limited 2011). The Electricity Council projects wind generation capacity will reach 150 GW in 2020 compared to 30 GW in 2010; projections for solar are 24 GW in 2020 compared to 0.26 GW in 2010 (Zeng et al. 2012).
In the second quarter of 2012, the National Energy Bureau proposed a quota system for the
renewable energy sector (Wu 2012). Under the quota, power companies generating more than 5 GW are required to attribute 11% of installed capacity to renewable energy, and 6.5% of gross power generation will have to come from renewables. It also places a requirement on the grid companies to buy a specified amount of renewable energy by 2015 that ranges from 3.2% to 15%. Also, each province will be given specific quotas to consume renewable energy. The provinces are categorized into four tiers based on renewable energy sources, economic aggregates, total electric power consumption, and electric power transmission capacity. A subsidy is given to grid companies providing connections to renewable sources as well; the amounts are between CNY0.01 ($0.002) per kilowatt-hour (kWh) and CNY0.03 ($0.006)/kWh depending on the length of the transmission line.
There are also feed-in tariffs for solar and wind power. The nationwide policy for solar power
started in 2011 guaranteeing a price of approximately $0.15/kWh to generators (Liu 2011). A feed-in tariff for wind power has been in place since 2009 in four categories based on wind power potential and tariffs ranging from CNY0.51 ($0.08)/kWh to CNY0.62 ($0.10)/kWh (IRENA and GWEC 2012).
4. Increasing Nuclear Power
The government sees nuclear power as a way to reduce greenhouse gas (GHG) emissions and has 28 plants under construction and more in the planning stage. Nuclear power was 1.8% of power generation output in 2010 with 17 nuclear power plants in operation (EIA 2012b, World Nuclear Association 2013a). The target for 2020 was as high as 70 GWe–80 GWe, but following the Fukushima Daiichi accident, the State Council suspended approvals for new nuclear power stations, including those under construction, until safety checks were conducted. In October 2012, construction recommenced. Now the nuclear target for 2020 is 58 GWe (World Nuclear Association 2013a).
According to a January 2011 report by the State Council Research Office, which provides
independent policy recommendations to the government, two major concerns were the type of reactors for future construction and the nuclear power workforce. With the focus on developing domestic nuclear power capabilities, Generation-II CPR-1000 units are under construction on order instead of Generation-III AP-1000 reactors. While nuclear reactors may be built rapidly, developing a safety culture at the operational level takes time, and the council advised a slow rollout. The council also recommended that the National Nuclear Safety Administration be placed directly under the State

Power Sector in Developing Asia: Current Status and Policy Issues | 15
Council Bureau as currently it is under the China Atomic Energy Authority (World Nuclear Association 2013a).
Whether nuclear power should be part of a sustainable energy mix is a highly debated
question. It is green in terms of lower emissions, but safety and spent fuel storage concerns remain. The PRC should consider investing alternative options while cautiously expanding nuclear capacity.
B. India
The power sector has developed slowly compared to the economy. The blackout in July 2012 affected more than 600 million people raising concerns about energy infrastructure and the government’s ability to manage the grid (Koyama 2012). The Central Electricity Agency continues to report power shortages while over one-third of the population does not have access to electricity (Government of India Planning Commission 2008). Securing a reliable source of generation to meet growing consumption is the top priority.
1. Insufficient Capacity
In 2010, the base-load requirement was 861,591 gigawatt-hours but only 788,355 were available (accounting for transmission loss), an 8.5% deficit (Government of India, Central Electricity Authority 2011). During peak loads, the demand was 122 GW while availability was 110 GW, a 9.8% shortfall (Figure 15). India’s main source for generating electricity is coal; however, the thermal efficiency of its coal generation is 27.9% which is less than the 35.4% in the PRC and the ADB average of 35.5% as indicated in Figure 16. Coal thermal efficiency in India has much room for improvement compared to the PRC, Japan, and the Republic of Korea. Increased efficiency will cut costs, reduce GHG emissions, and increase total generation output, thereby reducing the need for additional power plants.
Figure 15: Supply Shortage at Peak Times in India
Source: Government of India, Ministry of Power, Central Electricity Authority. 2011. Load Generation Balance Report 2011–2012. http://www.cea.nic.in/reports/yearly/lgbr_report.pdf (accessed February 2014).
–18
–12
–6
0
2003 2004 2005 2006 2007 2008 2009 2010
%

16 | ADB Economics Working Paper Series No. 405
Figure 16: Coal Thermal Efficiency
KOR = Republic of Korea, PRC = People’s Republic of China. Source: ADB. 2013. Asian Development Outlook 2013: Asia’s Energy Challenge. Manila.
2. Reforming the Coal Industry
India relied on coal for 68% of its electricity in 2010 (ADB 2013). While the abundant coal reserves within its borders make coal generation an inexpensive option, the plants cannot operate at full efficiency because of problems in the industry. The Coal Ministry verified over 285 billion tons of coal reserves as of 2011, of which 55 billion are considered extractable (Government of India, Ministry of Coal 2013, Kulkarni 2011). This should last over 100 years at current production rates of 550 million tons, yet coal production falls short of its demand, and India imports more than 70 million tons of coal each year. Mining operations are crude, and coal transport is grossly inefficient as well (Arun 2012). While coal generation has a high emission factor and emits environmentally hazardous pollutants into the atmosphere, securing a stable domestic supply for preexisting plants so that they may operate at full efficiency is the first step toward meeting growing electricity demand.
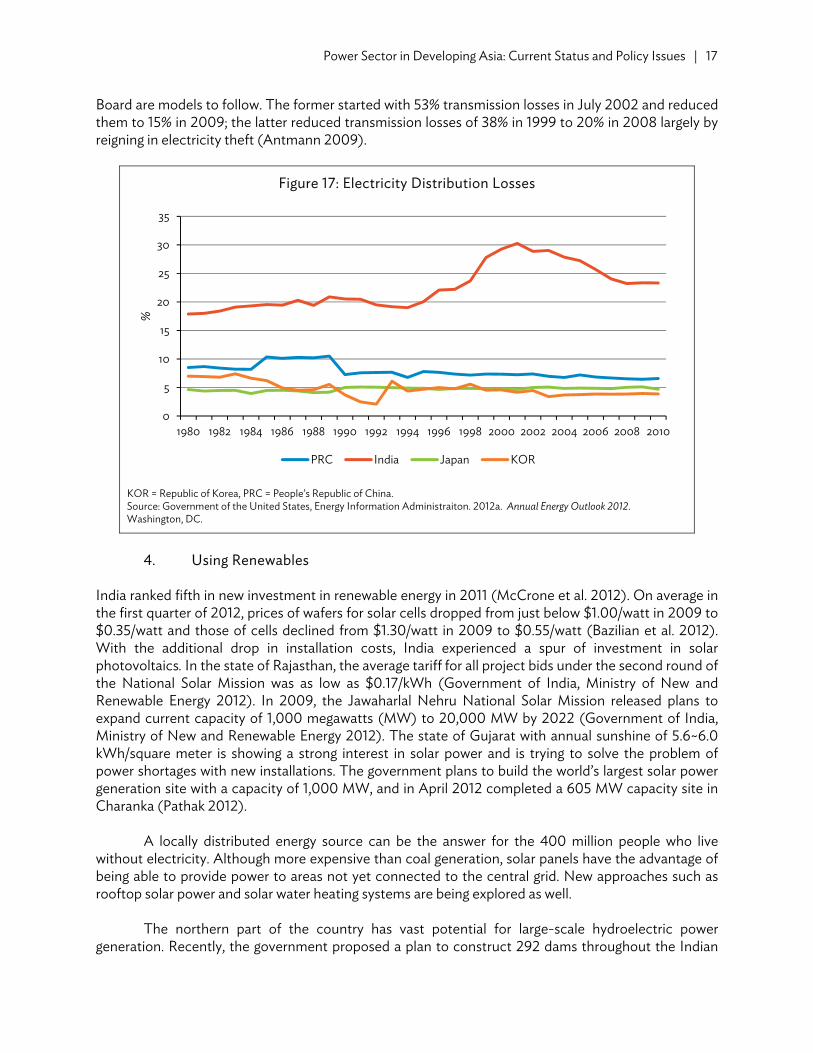
3. Transmission Losses Transmission losses need to be immediately addressed by state authorities and electricity suppliers. Nontechnical losses consist primarily of theft, nonpayment by customers, and errors in accounting and record keeping (Antmann 2009). While nonpayment in poor areas is common and taken for granted in many parts of India, electricity theft by large residential, commercial, and industrial users may account for a significant portion of the losses (Antmann 2009). As seen in Figure 17, India’s transmission losses exceed levels observed in other countries. The distribution of electricity is carried out by utility companies owned by state governments. Their aggregate technical and commercial losses stood at 27.15% in 2009 and 2010 (Government of India, Central Electricity Authority 2011). A KPMG report in 2009 stated the losses were worth $6 billion–$8 billion per year. Attempts to privatize distribution companies and unbundle the electricity sector to improve the situation have been effective: the privatization of North Delhi Power Limited and the restructuring of Andhra Pradesh State Electricity
20
30
40
50
1990 2000 2010 2015 2020
%
PRC India Japan KOR
Power Sector in Developing Asia: Current Status and Policy Issues | 17
Board are models to follow. The former started with 53% transmission losses in July 2002 and reduced them to 15% in 2009; the latter reduced transmission losses of 38% in 1999 to 20% in 2008 largely by reigning in electricity theft (Antmann 2009).
Figure 17: Electricity Distribution Losses
KOR = Republic of Korea, PRC = People’s Republic of China. Source: Government of the United States, Energy Information Administraiton. 2012a. Annual Energy Outlook 2012. Washington, DC.
4. Using Renewables
India ranked fifth in new investment in renewable energy in 2011 (McCrone et al. 2012). On average in the first quarter of 2012, prices of wafers for solar cells dropped from just below $1.00/watt in 2009 to $0.35/watt and those of cells declined from $1.30/watt in 2009 to $0.55/watt (Bazilian et al. 2012). With the additional drop in installation costs, India experienced a spur of investment in solar photovoltaics. In the state of Rajasthan, the average tariff for all project bids under the second round of the National Solar Mission was as low as $0.17/kWh (Government of India, Ministry of New and Renewable Energy 2012). In 2009, the Jawaharlal Nehru National Solar Mission released plans to expand current capacity of 1,000 megawatts (MW) to 20,000 MW by 2022 (Government of India, Ministry of New and Renewable Energy 2012). The state of Gujarat with annual sunshine of 5.6~6.0 kWh/square meter is showing a strong interest in solar power and is trying to solve the problem of power shortages with new installations. The government plans to build the world’s largest solar power generation site with a capacity of 1,000 MW, and in April 2012 completed a 605 MW capacity site in Charanka (Pathak 2012).
A locally distributed energy source can be the answer for the 400 million people who live
without electricity. Although more expensive than coal generation, solar panels have the advantage of being able to provide power to areas not yet connected to the central grid. New approaches such as rooftop solar power and solar water heating systems are being explored as well.
The northern part of the country has vast potential for large-scale hydroelectric power
generation. Recently, the government proposed a plan to construct 292 dams throughout the Indian
0
5
10
15
20
25
30
35
1980 1982 1984 1986 1988 1990 1992 1994 1996 1998 2000 2002 2004 2006 2008 2010
%
PRC India Japan KOR

18 | ADB Economics Working Paper Series No. 405
Himalayas. Each dam would have a capacity of 7,000 to 11,000 MW and if completed, the country’s hydropower capacity will be doubled accounting for about 6% of energy demand in 2030 (Nuwer 2013).
5. Increasing Nuclear Capacity
India has developed a largely indigenous nuclear power industry and has the goal of having 14.6 GWe of nuclear capacity installed by 2020 (World Nuclear Association 2013b). There are currently 20 operating nuclear power reactors with an installed capacity of 4,780 MW; six nuclear power reactors with an aggregate capacity of 4,800 MW are in various stages of construction (Nuclear Power Corporation of India Limited 2011). The target for additional capacity in the 12th Five Year Plan has been fixed at 88,538 MW with a nuclear target of 5,300 MW or 6% of the total (Government of India Planning Commission 2008). The Department of Atomic Energy plans to commission two 1,000 MW units at Kudankulkam, one 500 MW prototype fast breeder reactor at Kalpakkam, and two 700 MW indigenously developed pressurized heavy water reactors each at Kakrapar and Rawat Bhata (Arun 2012). Including the present 4,780 MW reactors, total nuclear capacity will be 10,080 MW when these reactors are constructed. There is a plan to install a total of 700 GWe by 2032 to meet 7%–9% GDP growth, with nuclear targets as high as 63 GWe (World Nuclear Association 2013b). In the 12th Five Year Plan, the target share of GWe for nuclear power in 2030 is set at 12% (Government of India Planning Commission 2008).
People living near proposed plant sites are, however, protesting. Mass demonstrations were
carried out against the French-backed 9,900 MW Jaitapur Nuclear Power Project in Maharashtra and the 2,000 MW Koodankulam Nuclear Power Plant in Tamil Nadu. At the Jaitapur site, protests have continued since 2009, and in January 2013, thousands of villagers launched a protest against the project (Deshpande 2013). Local residents and anti-nuclear activists oppose the construction because given the lack of transparency in the state-controlled nuclear energy industry, there is no way to ensure safety. A major objection to the Koodankulam project is that, “More than 1 million people live within a 30-kilometer radius which far exceeds Atomic Energy Regulatory Board stipulations. It is quite impossible to evacuate this many people quickly and efficiently in case of a nuclear disaster at Koodankulam” (Udayakumar 2011). Despite these public protests, India continues to develop its indigenous nuclear power sector and is pursuing the possibility of thorium nuclear reactors (World Nuclear Association 2013b).
C. Japan
1. Nuclear Power Policy after the Fukushima Daiichi Accident Mr. Nobuo Tanaka, Global Associate of the Institute of Energy Economics, Japan (IEEJ), stated in an interview in 2011 “.... abundant and cheap energy is a thing of a past” (IEEJ 2012b). Indeed this seems to be the case for Japan, and perhaps the world will unwillingly follow in this direction. Japan has 50 main nuclear reactors with a total capacity of 44,215 MW (IAEA 2013). While nuclear accounted for 28% of power generation output in 2009, this fell to 17% in 2011 following the accident as all nuclear reactors were shut down to undergo inspection and remained dormant afterwards (IEEJ 2012b).
In the Basic Energy Plan announced in 2010 (Government of Japan, Ministry of Economy,
Trade, and Industry 2010), nuclear power was to make up 50% of electricity production by 2030; however, after the accident at Fukushima, the Revolutionary Energy and Environment Strategy announced in 2012, it planned to reduce nuclear and phase it out in the 2030s (World Nuclear News

Power Sector in Developing Asia: Current Status and Policy Issues | 19
2012). These measures were not, however, formally adopted. The future of nuclear thus remains uncertain.
Although the government and industries plan to invest in renewables to displace nuclear,
future prices for wind, geothermal, and photovoltaics have a wide range of uncertainty as indicated in Table 1. Though listed as ¥8.9+ /kWh, the cost of nuclear is estimated at ¥10.2 /kWh and damages are calculated at ¥20,000 billion. (In the table, they are calculated at ¥5,800 billion per model plant, exclusive of undefined costs.)
Table 1: Cost of Generating Electricity by Fuel Source in Japan, 2004–2030
2004 (¥/kWh)
2010(¥/kWh)
2030(¥/kWh)
Operation(%)
Duration (years) Note
Nuclear 5.9 8.9+ 8.9+ 70 40 Coal 5.7 9.5 10.3 80 40 1. With CO2 TreatmentLiquefied natural gas 6.2 10.7 10.9 80 40 Oil 16.6 22.1 25.1 50 40 operating at 50% load
factor (30% for 2004) 36 38.9 10 40 operating at 10% load
factor Wind (Onshore) 9.9~17.3 8.8~17.3 20 20 Wind (Offshore) 9.4~23.1 8.6~23.1 30 20 Geothermal 9.2~11.6 9.2~11.6 80 40 Photovoltaic (Residential) 33.4~38.3 9.9~20.0 12 35 20 years for 2010
estimates Co-generation Gas 10.6 (19.7) 11.5 (20.1) 70 30 1. After (or before) heat
value deduction 2. No transmission loss
Oil 17.1 (22.6) 19.6 (26.0) 50 30Fuel cell 102.2~102.4
(109.7~110.0) 11.5~1.8
(18.7~19.3) na 10~15
CO2 = carbon dioxide, kWh = kilowatt-hour, ¥ = yen. Source: Institute of Energy Economics, Japan. 2012a. Japan Energy Brief No. 17. January. Tokyo. http://eneken.ieej.or.jp/en/jeb/1201.pdf
Following the Fukushima Daiichi accident, 80% of the Japanese public wanted to discontinue
nuclear power despite the economic burden of generating power from fossil fuels or renewables. The Democratic Party was set on finding a way to replace current nuclear generation capacities; however, the Liberal Democratic Party’s House of Councilors pledge for the elections in July 2013 included resuming the operation of nuclear power reactors. Currently, the only nuclear power generated is by reactors 3 and 4 at the Ohi plant.
2. Feed-in Tariffs to Promote Renewables
Japan is aiming to diversify its generation portfolio by expanding renewable energy capacity and introduced a renewable portfolio standard in 2003. Electric power supplied by renewable energy more than doubled from approximately 4 billion kWh in fiscal year (FY) 2003 to 10 billion kWh in FY2010. The expansion of renewable energy has, however, been slow compared to countries like Germany and Spain. In 2009, Japan introduced the surplus electricity purchase system. This led to an increase in residential photovoltaic power generation, but the scheme was limited to the sale of surplus power generated by solar photovoltaics. The portion of renewables, excluding hydropower, was limited to approximately 1% in FY2009 (Government of Japan, Ministry of Economy, Trade, and Industry 2012).
20 | ADB Economics Working Paper Series No. 405
After the Fukushima accident, a feed-in tariff was passed with immense public support on 31 August 2011 and went into effect on 1 July 2012. The result was higher than expected installation rates of renewable energy technologies during 6 months of implementation. The internal rate of return forecast by the government was 6% for solar photovoltaic facilities with 10 kW or greater installed capacity and 8% for wind power with 20 kW or greater installed capacity. A total of 2,079 MW of renewable energy facilities began operating in FY2012 (Government of Japan, Ministry of Economy, Trade, and Industry 2013). Solar photovoltaics dominate accounting for more than 75% of capacity. This is more than $2 billion of investments. The government expects investments of $640 billion in the renewable energy sector by 2030 with the feed-in tariff in place (Maeda 2012).
Critics point out that such tariffs impose high costs on electricity providers who are required to
pay. The Agency for Natural Resources and Energy (2012) predicts the cost increase from the feed-in tariff to be from ¥0.2 to ¥0.4 ($0.02–$0.04) per kWh, which means average households consuming 300 kWh per month would have to pay an additional ¥70–¥100 ($0.78–$1.11) per month (Johnston 2012). When the feed-in tariff took effect in July 2012, consumers started paying an additional ¥0.22 ($0.024) per kWh to utilities to cover the cost of the tariffs for FY2012 (Government of Japan, Ministry of Economy, Trade, and Industry 2012a).
As the installed capacity increases dramatically and the market matures, feed-in tariffs are
ordinarily adjusted to reflect changes in the cost of production. Currently Japan’s rate is more than twice that of France or Germany (Johnston 2012). Germany added 80 TWh of renewable energy from 2000 to 2010 from wind, solar, and biomass, then during the first half of 2012 reduced its feed-in tariff on solar by half and stopped it altogether for large-scale power plants as the market matured.
Some criticize Japan’s feed-in tariff for providing no guarantees for access to grid connections,
a disadvantage for small-scale providers. Also, the segments accommodated within each technology are simple which limits variety. In Germany, onshore and offshore wind power sources are differentiated, and to promote small-scale installations wind power is categorized into five segments according to installed capacity. Japan’s feed-in tariff, however, has the specific goal of large-scale renewable energy development over the first 3 years; progress to date indicates the policy has been very successful. D. The Republic of Korea
1. Rising Demand due to Low Prices There is a great deal of room for improvement in terms of demand management. The electricity price is the lowest among Organisation for Economic Co-operation and Development members and has stayed low despite the rise in fuel prices (IEA 2012). The cost of electricity for industries remains especially low; hence, demand has increased steadily over the years. Figure 4 (on Section II-A) shows consumption per capita increasing steadily and surpassing that of Japan. The average electricity price to consumers is below production costs which may lead to rising consumption. Due to this, peak-time demand comes dangerously close to installed capacity, and there is a possibility of a blackout during summer and winter peak seasons.
In February 2013, the Ministry of Knowledge Economy announced the Sixth Basic Plan of Long-Term Electricity Demand and Supply, an outline of an electricity policy from 2013 to 2028. In the plan, GHG emissions increase over 10% compared to the business-as-usual scenario announced in 2011. This contradicts the goals announced in 2009 of reducing GHG emissions by 30%. According to
Power Sector in Developing Asia: Current Status and Policy Issues | 21
the plan, heat generation will increase by 15.3 GW by 2027 out of 29.570 GW of total increased capacity. Demand management goals are set at 115,702 GWh, 37,154 of which come from increased efficiency, and 78,548 from changes in the electricity price and the installation of smart grids. The growth in electricity demand is projected at an annual average of 3.4% from 2013 to 2027 compared to the 3.1% annual growth from 2010 to 2024 assumed in the fifth plan. The new plan assumes electricity demand will reach 771,000 GWh by 2027.
2. Prospects for Nuclear Power
The Republic of Korea has continued on its nuclear expansion path despite the accident at Fukushima in neighboring Japan. Nuclear constituted 33% of power generation output in 2009, and the government planned to increase this to 41% by 2030 (Government of the Republic of Korea, National Energy Committee 2008). The economics of nuclear power remain highly debated with factors such as the cost of decommissioning, spent fuel storage, and insurance influencing levelized cost estimates. Anti-nuclear proponents argue that the costs related to nuclear power generation are grossly underestimated and that if the hidden costs are accounted for, nuclear power would not be economically viable. Nuclear power plant safety is also a major concern. Lapses in safety have led to unscheduled shut downs, and investigations revealed that unapproved parts were used in the plants. Government reports, however, view nuclear power as a green technology based on its low CO2 emission rates. In the Fifth Basic Plan, building nuclear power plants is seen as a part of an environmentally friendly electricity portfolio.
3. Renewable Energy Policy Renewable energy currently accounts for less than 1% of total electricity generation and has been slow to develop. The government implemented a feed-in tariff from 2002 to 2011 that boosted the development of solar photovoltaics, but the cost deterred it from continuing the policy (Lee and Yoon 2010). After much discussion, a renewable portfolio standard replaced the feed-in tariff and went into effect from 2012.
While the feed-in tariff was in place from 2002 to 2011, solar photovoltaic capacity increased
exponentially from 200 kW in 2004 to 347 MW in 2009. Likewise, government spending rose from W7.8 billion ($7.4 million) in 2005 to W262.6 billion ($249 million) in 2009 with more than 90% directed to solar (Electric Power Public Tasks Evaluation and Planning Center 2013). Eventually a cap was introduced as renewable energy installations increased at a faster rate than the government had anticipated. The rate of installation dropped from 257 MW in 2008 to 72 MW in 2009 (Shim 2012).
The renewable portfolio standard ambitiously aims to increase renewable energy by 10% in 10
years; however, results from 2012 show that the benefits of the policy may not materialize due to design flaws in the regulations as companies may choose the option of paying the fine instead of trying to meet the target (Shim 2012). The fine is up to 150% of the annualized average price of the renewable energy credit multiplied by the unfulfilled amount. The law leaves a loophole in that the structure of renewable energy credit markets makes them a buyer’s market for the 13 electricity suppliers. Companies were given 30% room to put off meeting their targets for the first 3 years of the policy giving them the option of withholding purchase until the price of the credit drops.
At present the policy on the renewable portfolio standard needs to be readjusted to provide a
realistic target for generators and to allow for fair trading in the renewable energy credit market. The scheme also needs to place more emphasis on small-scale projects. Additional measures that would

22 | ADB Economics Working Paper Series No. 405
make grid connection the responsibility of power providers and not small-scale suppliers would encourage such developments.
Using feed-in tariffs to promote renewable energy is recommended along with changes in the
portfolio standard policy. To do so, the first step would be increasing the budget allocated to promoting renewables twofold in the next 2–3 years, but in 2013, contrary to plans for green growth, the budget for renewable energy decreased by 15% compared to 2012. Under these circumstances the renewable energy sector will lose its competitive edge compared with that in other economies that are investing heavily.
IV. COMPARISONS AND POLICY RECOMMENDATIONS A. Improving Electricity Consumption per Gross Domestic Product Referring back to Figure 5 (Section II-A), electricity consumption per GDP for the PRC, Japan, and India show clear signs of decreasing while in the Republic of Korea it continues to rise. The PRC and Japan have concrete goals in place to improve efficiency. The PRC made provisions for a 16% reduction in energy intensity by 2015, and Japan has plans to achieve a 10% reduction in electricity demand by 2030 (Ni 2012, Murakami and Naoki 2012). Energy efficiency investments often pay for themselves in terms of reduced fuel costs and generation capacity. The Republic of Korea and India should review such policies in the near future.
Demand management and increased efficiency in consumption are essential for reducing GHG emissions. Price controls, technological improvements, and using the most efficient source of energy will all play an important role. In the Republic of Korea, part of the problem is that government electricity demand projections assume continuous growth. The premises of such an assumption need to be reviewed.
B. Reducing Nuclear Power In the search for cleaner and more reliable energy, nuclear was seen as an alternative to fossil fuel generation. However, Fukushima Daiichi showed that accidents do occur. Many countries have officially changed their nuclear power policies declaring eventual phaseouts or retractions of previous expansion schemes, but the PRC, India, and the Republic of Korea have plans to build additional nuclear power plants. For reasons of cost, safety, and sustainability, these countries should rethink their strategies for nuclear power.
The report released by Japan’s Cost Verification Committee comparing generation cost by energy source yielded much higher costs per kWH for nuclear power. Once damage from nuclear accidents and subsidies to residents living near nuclear power plants are taken into account, nuclear is no longer an attractive option. Government authorities in these three countries need to make the information on calculating the cost of electricity by generation source public. When analyzing levelized costs of electricity, the cost of decommissioning and the unsolved problem of spent nuclear fuel storage must be considered.
Although the nuclear power target in the PRC was reduced following the Fukushima Daiichi
accident, in October 2012, construction of new power plants resumed. The India government has had high hopes for its indigenous nuclear power program developing its own thorium cycle; however, public

Power Sector in Developing Asia: Current Status and Policy Issues | 23
protests near reactor sites have been strong in their distrust of nuclear power safety. The nuclear targets in the Republic of Korea are extreme given what similar investments in energy efficiency could produce instead. Japan currently does not have a clear nuclear policy. Plans prior to 2011 need to be changed, and a sustainable energy mix concentrating on renewable energy should be devised. An official announcement outlining a gradual reduction in nuclear power is in order.
Table 2 summarizes the features of the power sector indicators in the PRC, India, Japan, and
the Republic of Korea.
Table 2: Power Sector Comparisons
PRC India Japan Republic of KoreaElectric power consumption per capitaa(kWh)
• 2,944 kWh • Growing rapidly—
196% increase from 2000 to 2010
• 616 kWh • Low compared to
other developing countries
• 66% of population have access to electricity (in 2009)
• 8,394 kWh • High electricity
prices and policy measures lead to reduced consumption per capita
• 9,744 kWh • Exceeded Japanese
levels in 2008 and continues to increase
• Demand management needed
Unit of electricity consumption (kWh) per GDP ($ PPP)a
• 0.42 kWh/$ • 0.23 kWh/$ • Lowest due to low
consumption
• 0.26 kWh/$ • 0.35 kWh/$ • Low electricity
price; Demand management needed
Unit of energy use (kgoe) per GDP ($ PPP)a
• 0.24 kgoe/$ • 0.17 kgoe/$ • 0.11 kgoe/$ • Lowest energy use
• 0.18 kgoe /$
CO2 emission (gram) per kWh from electricity generationb
• 766 grams of CO2/kWh
• High percentage of coal generation
• 912 grams of CO2/kWh
• High percentage of coal generation: inefficient plants
• 416 grams of CO2/kWh
• High percentage nuclear power (in 2010)
• 533 grams of CO2/kWh
• High percentage nuclear power
Energy mix —Fossil fuelc
• 80% of total • Efficiency: 35.4% • 98% of combustion
comes from coal • Replacing coal with
natural gas in the short term will reduce greenhouse gas emissions and air pollution
• 83% of total • Efficiency: 28.7% • 84% of combustion
comes from coal • Coal sector reform is
vital to increase production efficiency and to secure a stable supply of electricity
• 63% of total • Efficiency: 44.5% • No domestic
production; cost burden rises as the amount of fossil fuel generation increases
• 69% of total • Efficiency: 39.2% • No domestic
production • Plans to increase
fossil fuel generation despite green growth goals
Energy mix —Nuclear powerc
• 2% of total • Capacity: 11 GW • Plans to increase to
58 GW by 2020, 130 GW by 2030
• Indigenous reactor design: thorium cycle under research
• 3% of total • Capacity: 5 GW • Plans to increase to
14.6 GW by 2020 • Indigenous reactor
design: thorium cycle under research
• 27% of total • Capacity: 44 GW • Plans on nuclear
power unclear
• 30% of total • Capacity: 21 GW • Plans to increase to
27.3 GW by 2020, 43 GW by 2030
• Indigenous reactor design: plans to export technology
continued on next page

24 | ADB Economics Working Paper Series No. 405
Table 2 continued
PRC India Japan Republic of KoreaRenewable energy • Renewable
portfolio standard and feed-in tariff in place
• Strong government initiative and control of the power sector allows for rapid deployment
• Grid connection and transmission infrastructure needed
• No nationwide policy measure: state level measures and investments
• Ideal conditions for solar photovoltaics; rapid deployment possible
• Opportunity to provide electricity to regions without grid connection
• Renewable portfolio standard and feed-in tariff in place
• Strong government initiative to expand renewables as an option to replace nuclear power
• Effect of the cost burden on the economy unclear
• Renewable portfolio standard in place
• Weak government initiative to expand renewables: successful feed-in tariff was replaced with renewable portfolio standard
• Domestic technology and production for renewables will weaken
Transmission • Nontechnical losses exceeds 30% in some regions
• Power sector needs to show initiative to reign in electricity theft and nonpayment
• Long-hall transmission may be improved through additional construction of high voltage lines
• Inter-provincial transmission needed
• Highly efficient • Highly efficient
GDP = gross domestic product, GW = gigawatt, kgoe = kilogram of oil equivalent, kW = kilowatt, kWh = kilowatt-hour, PPP = purchasing power parity, PRC = People’s Republic of China, $ = US dollar. Notes: a Figures for 2010. Source: World Bank. 2013. 2013. World Development Indicators. http://data.worldbank.org/data-catalog/world-
development-indicators (accessed 31 January 2013). b Figures for 2010. Source: International Energy Agency. 2012. World Energy Outlook 2012. Paris. c Figures for 2010. Source: ADB. 2013. Asian Development Outlook 2013: Asia’s Energy Challenge. Manila. C. Promoting Renewable Portfolio Standards or Feed-In-Tariffs
In terms of market policies that stimulate the deployment of renewable energy technologies in the electricity sector, policy schematics can be broadly categorized into a price system in the form of feed-in tariffs and a quota system such as renewable portfolio standards. These two major policy directions are currently in place around the world with feed-in tariffs showing strong success in Germany and renewable portfolio standards in place in the US.
Feed-in tariffs guarantee a set price for renewable energy producers for a set period of time
thus eliminating the uncertainty associated with selling electricity generated from renewable technologies to power companies; however, they do not guarantee a set percentage of renewables in the energy mix. Renewable portfolio standards set a minimum requirement for power generated from renewable technologies in the power generator’s portfolios. They guarantee the goals set out by policy makers, and they encourage competition between technologies based on renewable energy credits.
Feed-in tariffs have been applied in 23 of the 28 European Union members, and Germany’s
Act on Granting Priority to Renewable Sources reframed in 2000 has proven to be a most effective framework for promoting renewable technologies. Rapid increases in installed capacity from technological advancements tend to accelerate the pace of achieving grid parity, and economies of

Power Sector in Developing Asia: Current Status and Policy Issues | 25
scale are made possible by the increase in demand. Overall, in terms of policy effectiveness, feed-in tariffs have proven to be an effective policy instrument in increasing the rate of diffusion of new technologies such as wind turbines and solar cells (Jacobsson and Lauber 2006).
In the renewable portfolio standard scheme, development may be slow compared to feed-in
tariffs because the financial guarantee for the renewable energy providers is nonexistent. However, renewable portfolio standards have the advantage of giving clear signals to electricity generating companies thus providing certainty for future planning. The drawback of feed-in tariffs is the cost of implementation. In the Republic of Korea, they placed a financial burden on the government as the portion of renewable energy grew at a rate faster than expected. In fact, a survey of the 48 countries implementing feed-in tariffs suggests the policy tool is likely to be more suitable for advanced economies as many are located in Europe, e.g., Denmark, Germany, and Spain (Davies 2011).
V. CONCLUSION
Securing an affordable and reliable source of energy is vital for any economy. Electricity is increasingly becoming the preferred energy source, but managing the sector remains a difficult task. Balancing supply and demand while dealing with issues such as energy security and sustainability, policy makers face tough decisions concerning sector reform and energy mix. Improving energy efficiency should be a top priority everywhere; coal generation in developing economies can be improved, transmission losses can be reduced, and efficient consumption can be encouraged through demand management and appropriate price signals. In many cases, governments have expanded power generation capacity before investing in efficient generation and distribution.
Government policies promoting growth in renewable energy are a must in all stages of
economic development. The economics of solar photovoltaics, wind, and other renewables are improving at a fast pace, and in some areas renewables are already at grid parity. Nevertheless, currently they remain expensive compared to fossil fuel thermal generation. With the full support of renewable energy industries, governments should also explore the option of replacing coal in thermal power plants with natural gas. The shale boom in the US will lead to lower natural gas prices in Asia; governments should maximize its potential by encouraging small-scale generation facilities. Together with distributed, small-scale, renewable energy generators, peak load demand on centralized facilities can be reduced.
In developed economies, governments should work toward implementing a market
mechanism in the power sector. Electricity is often seen as a public good that must be available to all, but setting electricity prices below production costs leaves growing demand unchecked. The electricity sector currently is and will remain highly regulated by governments, but some flexibility needs to be introduced. By allowing market mechanisms to balance supply and demand through shifting electricity prices, efficiency on both ends can be improved.
As for nuclear power in Asia, governments must realize that recent developments require a
review of preexisting policies. The safety and economics of nuclear power should be reexamined. Public discourse on the subject must precede any policy decisions, and the costs associated with the entire life cycle of nuclear power plants must be analyzed. The impacts of nuclear power on current and future generations must be considered in full.
REFERENCES∗ Antmann, P. 2009. Reducing Technical and Non-Technical Losses in the Power Sector. Background
paper for the World Bank Group Energy Sector Strategy. Washington, DC. Arun, T.K. 2012. Despite Having One of the World’s Largest Reserves of Coal, India is Unable to Dig It
Up Fast Enough. The Economic Times. 14 June. Asian Development Bank (ADB). 2013. Asian Development Outlook 2013: Asia’s Energy Challenge.
Manila. Bazilian, M. et al. 2012. Re-considering the Economics of Photovoltaic Power. White Paper. Bloomberg
New Energy Finance. Chung, Ol. 2011. Power Rationing Strikes China. Asia Times. 20 May. http://www.atimes.com/
atimes/China_Business/ME20Cb01.html Davies, L. 2011. Incentivizing Renewable Energy Deployment: Renewable Portfolio Standards and
Feed-In Tariffs. KLRI Journal of Law and Legislation. 1 (1). pp. 39–91. Deshpande, A. 2013. Villagers Court Arrest against Jaitapur Nuclear P. The Hindu. 3 January.
http://www.thehindu.com/news/national/villagers-court-arrest-against-jaitapur-nuclear-plant/article4266213.ece
Electric Power Public Tasks Evaluation and Planning Center. 2013. Overview of Tasks and Funds (in
Korean). January. Seoul: Korea Electric Power Corporation. http://www.etep.or.kr/ home/busi_info/result/pResultView.jsp
Ernst and Young. 2011. Renewable Energy Country Attractiveness Indices. Issue29, May. ———. 2012. Renewable Energy Country Attractiveness Indices. Issue 34, August. European Union Climate Change Expert Group Science. 2008. The 2°C Target: Background on
Impacts, Emission Pathways, Mitigation Options and Cost. Information Reference Document. http://www.climateemergencyinstitute.com/uploads/2C_EU.pdf
Government of India, Ministry of Coal. 2013. Inventory of Coal Resources of India. http://www.coal
.nic.in/reserve2.htm ———, Ministry of New and Renewable Energy. 2012. Jawaharlal Nehru National Solar Mission Phase
II Policy Document. Working draft. New Delhi. http://mnre.gov.in/file-manager/UserFiles/ draft-jnnsmpd-2.pdf
———, Ministry of Power, Central Electricity Authority. 2011. Load Generation Balance Report 2011
–2012. http://www.cea.nic.in/reports/yearly/lgbr_report.pdf (accessed 1 June 2012). ∗ ADB recognizes China as the People’s Republic of China.

———, ———, ———. 2012. Annual Report 2011–2012. New Delhi. ———, Planning Commission. 2008. Eleventh Five Year Plan 2007–2012. New Delhi: Oxford University
Press. http://planningcommission.nic.in/plans/planrel/fiveyr/welcome.html Government of Japan. Agency for Natural Resources and Energy. 2012. Feed-In Tariff Scheme in
Japan. http://www.meti.go.jp/english/policy/energy_environment/renewable/pdf/summary 201207.pdf (accessed February 2014).
———. Japan Renewable Energy Policy Platform. 2010. Renewables Japan Status Report 2010.
http://www.re-policy.jp/jrepp/JSR2010SMR20100427E.pdf (accessed February 2014). ———. Ministry of Economy, Trade, and Industry. 2012a. Settlement of the Details of the Feed-in
Tariff Scheme for Renewable Energy, Including Purchase Price and Surcharge Rates. http://www.meti.go.jp/english/press/2012/0618_01.html Policy Issues in Asia’s Power Sector 321.
———. ———. 2012b. The Strategic Energy Plan of Japan (Summary). http://www.meti.go.jp/english/
press/data/pdf/20100618_08a.pdf (accessed February 2014). ———. ———. 2013. Announcement Regarding the Present Status of Introduction of Facilities
Generating Renewable Energy as of May 31. http://www.meti.go.jp/english/press/2013/ 0820_01.html (accessed February 2014).
Government of the Republic of Korea, Ministry of Knowledge Economy. 2010. Renewable Portfolio
Standards Implementation Decided for 2012 (in Korean). Seoul. http://www.motie.go.kr/ motie/ne/rt/press/bbs/bbsView.do?bbs_seq_n=59508&bbs_cd_n=16
———, National Energy Committee. 2008. First Master Plan for National Energy 2008–2030 (in
Korean). Seoul. http://17naenc.pa.go.kr/include/download.asp?fname=%5B18%5D%B1%B9%B 0%A1%BF%A1%B3%CA%C1%F6%B1%E2%BA%BB%B0%E8%C8%B9(2008-2030).pdf
———, ———. 2010. 5th Basic Plan of Long-Term Electricity Supply and Demand (in Korean). Seoul. Government of the United States, Energy Information Administration (EIA). 2011. International Energy
Outlook 2011. Washington, DC. ———, ———. 2012a. Annual Energy Outlook 2012. Washington, DC. ———, ———. 2012b. Country Analysis Briefs. http://www.eia.gov/countries/ ———, ———. 2013. International Energy Statistics. http://www.eia.gov/cfapps/ipdbproject ———, National Intelligence Council (NIC). 2012. Global Trends 2030: Alternative Worlds.
Washington, DC. http://globaltrends2030.files.wordpress.com/2012/11/global-trends-2030 -november2012.pdf
Institute of Energy Economics Japan (IEEJ). 2012a. Japan Energy Brief No. 17. January. Tokyo.
http://eneken.ieej.or.jp/en/jeb/1201.pdf
———. 2012b. Japan Energy Brief No. 18. March. Tokyo. http://eneken.ieej.or.jp/en/jeb/1203.pdf International Atomic Energy Agency (IAEA). 2013. Nuclear Share of Electricity Generation in 2012.
http://www.iaea.org/pris/WorldStatistics/NuclearShareofElectricityGeneration.aspx (accessed February 2014).
International Energy Agency (IEA). 2012. World Energy Outlook 2012. Paris. International Renewable Energy Agency (IRENA) and Global Wind Energy Council (GWEC). 2012.
30 Years of Policies for Wind Energy: Lessons from 12 Wind Energy Markets. Abu Dhabi, United Arab Emirates. http://www.irena.org/DocumentDownloads/Publications/IRENA_GWEC _WindReport_Full.pdf
Jacobsson, S. and V. Lauber. 2006. The Politics and Policy of Energy System Transformation Explaining
the German Diffusion of Renewable Energy Technology. Energy Policy. 34 (3). pp. 256–276. Johnston, E. 2012. A Guide to Japan’s New Feed-in Tariff. Fresh Currents.
http://www.freshcurrents.org/ blog/2012/08/23/a-guide-to-japans-new-feed-in-tariff/ (accessed February 2014).
Korea Electric Association. 2011. Electricity Almanac 2011. Seoul. Koyama, K. 2012. Background and Impacts of World’s Largest Blackout in India. Special Bulletin. Tokyo:
IEEJ. KPMG. 2009. Think BRIC! Key Considerations for Investors Targeting the Power Sectors of the World’s
Largest Economies—India. KPMG International. http://www.kpmginstitutes.com/global -energy-institute/insights/2010/pdf/think-bric-india.pdf
KPMG Advisory China Limited. 2011. China 12th Five-Year Plan: Overview. Hong Kong, China.
http://www.kpmg.com/cn/en/IssuesAndInsights/ArticlesPublications/Documents/China-12th -Five-Year-Plan-Overview-201104.pdf
Kulkarni, V. 2011. The Truth about India’s Coal. The Hindu Business Line. 7 March. http://www.the
hindubusinessline.com/opinion/article1514900.ece?homepage=true Lee, H.-J. and S.-W. Yoon. 2010. Renewable Energy Policy in Germany and Its Implications for Korea.
Regional Study Series 10-04. Seoul: Korea Institute for International Economic Policy. Liu, C. 2011. China Uses Feed-In Tariff to Build Domestic Solar Market. The New York Times.
14 September. http://www.nytimes.com/cwire/2011/09/14/14climatewire-china-uses-feed-in -tariff-to-build-domestic-25559.html?pagewanted=1
Maeda, R. 2012. Japan Sun Subsidy Fires Electric Spending Rush. Reuters. 12 September.
http://in.reuters.com/article/2012/09/12/japan-energy-renewables-idINL3E8KB20G20120912

McCrone, A. et al. 2012. Global Trends in Renewable Energy Investment 2012. Frankfurt: Frankfurt School of Finance & Management.
Murakami, T. and N. Naoki. 2012. Examining Japan’s Energy Choices. Nippon.com. 10 September.
http://www.nippon.com/en/in-depth/a01202/ Ni, V. 2012. China Sets New Greenhouse Gas Emission Reduction Goals. China Briefing. 18 January.
http://www.china-briefing.com/news/2012/01/18/china-sets-new-greenhouse-gas-emission-reduction-goals.html
Nuclear Power Corporation of India Limited. 2011? 25th Annual Report 2011–2012. Mumbai.
http://www.npcil.nic.in/main/AnnualReportDisplay.aspx Nuwer, R. 2013. Hobbled on Energy, India Ponders a Multitude of Dams. The New York Times.
7 January. http://green.blogs.nytimes.com/2013/01/07/hobbled-on-energy-india-ponders-a -multitude-of-dams/?_r=0&pagewanted=print
Pathak, M. 2012. Solar Boom Faces Challenges. Live Mint and The Wall Street Journal. 24 April.
http://www.livemint.com/Politics/feKnOVKKTR3D4xUBAANYUL/Solar-boom-faces-challenges.html
Shim, S. 2012. Renewable Portfolio Standard (RPS) in Korea: How to Make It Work. Paper presented
at the Construction, Building, and Real Estate Research Conference of the Royal Institution of Chartered Surveyors, in Las Vegas on 11–13 September. http://www.rics.org/Global/ COBRA2012_Renewable_Portfolio_Korea_200912_dwl_aj.pdf
Udayakumar, S.P. 2011. Thirteen Reasons Why We Do Not Want the Koodankulam Nuclear Power
Project. TRANSCEND Media Service. 29 August. https://www.transcend.org/tms/?p=14126 ———. 2013. World Development Indicators. http://data.worldbank.org/data-catalog/world
-development-indicators (accessed 31 January 2013). World Nuclear Association. 2013a. Country Profiles: Nuclear Power in [the People’s Republic of]
China. London. http://www.world-nuclear.org/info/Country-Profiles/Countries-A-F/China --Nuclear-Power/#.UjKou8ano40 (accessed February 2014).
———. 2013b. Country Profiles: Nuclear Power in India. London. http://world-nuclear
.org/info/Country-Profiles/Countries-G-N/India/#.UjMLp8ano40 (accessed February 2014). World Nuclear News. 2012. Innovative Strategy to End Japanese Nuclear. 14 September. London:
World Nuclear Association. http://www.world-nuclearnews.org/NP_Innovative_strategy _to_end_Japanese_nuclear_1409121.html
Wu, F. and S. Fu. 2005. China’s Future in Electric Energy. IEEE Power and Energy Magazine. 3 (4).
pp. 32–38.

Wu, Q. 2012. China Targets Grid-access Bottleneck with Quota System. Wind Power Monthly. 1 June. http://www.windpowermonthly.com/article/1133694/china-targets-grid-access-bottleneck -quota-system
Zeng, M. et al. 2012. China 12th Five-Year Plan Pushes Power Industry in New Directions. Power
Magazine. 1 January. http://www.powermag.com/gas/Chinas-12th-Five-Year-Plan-Pushes -Power-Industry-in-New-Directions_4257.html

ASIAN DEVELOPMENT BANK
AsiAn Development BAnk6 ADB Avenue, Mandaluyong City1550 Metro Manila, Philippineswww.adb.org
Power Sector in Developing AsiaCurrent Status and Policy Issues
The paper examines the current status and future prospects of the electricity sectors and key policy issues in the People’s Republic of China (PRC), India, Japan, and the Republic of Korea. In the PRC, the fuel mix and energy efficiency are key concerns, while raising efficiency of power plants and reducing transmission losses are main issues in India. In Japan, amid reductions in nuclear output, there are aims to diversify generation portfolio by expanding renewables. In the Republic of Korea, average electricity prices are below production costs, leading to overconsumption.
About the Asian Development Bank
ADB’s vision is an Asia and Pacific region free of poverty. Its mission is to help its developing member countries reduce poverty and improve the quality of life of their people. Despite the region’s many successes, it remains home to approximately two-thirds of the world’s poor: 1.6 billion people who live on less than $2 a day, with 733 million struggling on less than $1.25 a day. ADB is committed to reducing poverty through inclusive economic growth, environmentally sustainable growth, and regional integration.
Based in Manila, ADB is owned by 67 members, including 48 from the region. Its main instruments for helping its developing member countries are policy dialogue, loans, equity investments, guarantees, grants, and technical assistance.
Power Sector in DeveloPing ASiA: current StAtuS AnD Policy iSSueSJong Ho Hong, Changhun Kim, and Heeyoung Shin
adb economicsworking paper series
no. 405
september 2014