04.2012, REPORT, Asian Development Outlook, Asian Development Bank
298
Outlook Confronting Rising Inequality in Asia ASIAN DEVELOPMENT 2012
-
Upload
the-business-council-of-mongolia -
Category
Business
-
view
120 -
download
4
Transcript of 04.2012, REPORT, Asian Development Outlook, Asian Development Bank

OutlookConfronting Rising Inequality in Asia
ASIAN DEVELOPMENT
2012
Outlook
Asian Development Bank
Confronting Rising Inequality in Asia
ASIAN DEVELOPMENT
2012
© 2012 Asian Development Bank
All rights reserved. Published 2012. Printed in the Philippines.
ISBN 978-92-9092-606-1 (Print), 978-92-9092-607-8 (PDF) ISSN 0117-0481Publication Stock No. FLS124471
Cataloging-in-Publication Data
Asian Development Bank.Asian development outlook 2012. Confronting rising inequality in Asia.
Mandaluyong City, Philippines: Asian Development Bank, 2012.
1. Economics. 2. Finance. 3. Asia. I. Asian Development Bank.
The annual Asian Development Outlook provides a comprehensive economic analysis of 45 economies in developing Asia and the Pacific.
The views expressed in this book are those of the authors and do not necessarily reflect the views and policies of the Asian Development Bank (ADB) or its Board of Governors or the governments they represent.
ADB does not guarantee the accuracy of the data included in this publication and accepts no responsibility for any consequence of their use.
By making any designation of or reference to a particular territory or geographic area, or by using the term “country” in this document, ADB does not intend to make any judgments as to the legal or other status of any territory or area.
ADB encourages printing or copying information exclusively for personal and noncommercial use with proper acknowledgment of ADB. Users are restricted from reselling, redistributing, or creating derivative works for commercial purposes without the express, written consent of ADB.
6 ADB Avenue, Mandaluyong City 1550 Metro Manila, Philippines Tel +63 2 632 4444 Fax +63 2 636 2444 www.adb.org
For orders, please contact: Department of External Relations Fax +63 2 636 2648 [email protected]
Printed on recycled paper.

Contents
Foreword v
ADO 2012—Highlights ix
Part 1: Maintaining growth in an uncertain world 1Steady growth amid global weakness 4Eurozone uncertainties and developing Asia 14Macro-policy directions for developing Asia 24Annex The external environment 30
Part 2: Confronting rising inequality in Asia 37Rising inequality concerns in Asia 38Income inequality in Asia 45Inequality of opportunity 53What drives inequality in developing Asia? 62Confronting rising inequality: Policy options 74
Part 3: Economic trends and prospects in developing Asia 97
Central Asia 98Armenia 99Azerbaijan 103Georgia 107Kazakhstan 111Kyrgyz Republic 116Tajikistan 120Turkmenistan 124Uzbekistan 126
East Asia 130People’s Republic of China 131Hong Kong, China 137Republic of Korea 141Mongolia 146Taipei,China 150

iv Asian Development Outlook 2012
South Asia 154Afghanistan 155Bangladesh 158Bhutan 163India 166Maldives 171Nepal 173Pakistan 177Sri Lanka 182
Southeast Asia 186Brunei Darussalam 187Cambodia 189Indonesia 193Lao People’s Democratic Republic 199Malaysia 202Myanmar 206Philippines 209Singapore 214Thailand 218Viet Nam 223
The Pacific 228Fiji 229Papua New Guinea 232Timor-Leste 236Small Pacific countries 239
Statistical appendix 250

Foreword
The economies of developing Asia are maintaining their impressive growth trajectories. Yet the global backdrop in 2012 is one of uncertainty: the eurozone is grappling with its sovereign debt crisis; and more generally, stagnation in the major industrial economies of the United States, Europe, and Japan—developing Asia’s main trading partners—is stunting demand for Asia’s products. For these reasons, the Asian Development Outlook 2012 forecasts that growth in developing Asia will ease to 6.9% in 2012 (from 7.2% in 2011) before coming back to 7.3% in 2013.
Developing Asia will have to adjust to lower export demand from the advanced economies for some time to come. These economies are expected to expand by just 1.1% in 2012 and 1.7% in 2013, as austerity measures, fiscal consolidation, and weak private domestic demand stall their growth for the next 2 years—at least. Increased local demand in Asia has offset some of this lost trade, but it will need to take up more of the slack.
Fortunately, the commodity price pressures that built up in early 2011 are subsiding. Inflation in the region is expected to slow to 4.7% in 2012 and 4.4% in 2013. Political instability in the Middle East, however, could lead to sudden cuts in oil supplies, resulting in temporary spikes in the price of this critical commodity and reviving inflation in developing Asia.
The greatest risk to Asia’s enviable growth rates in the near term is the sovereign debt crisis in the eurozone. Although a second international bailout of Greece in March 2012 prevented a disorderly default and diminished the risk of a liquidity crunch in the short run, the crisis is far from over—and the eurozone is teetering on the brink of recession. Europe’s problems are having global repercussions, but Asia is fairly well placed to weather the storm.
Developing Asia’s policy makers cannot, however, be complacent. They need to be ready to respond if the eurozone deteriorates, particularly as global value chains—Asia’s growth-generating cross-border production networks—and sudden reductions in trade finance can magnify an external shock.
Even if a major external risk to the forecasts materializes, developing Asia has some scope for macroeconomic policy responses. Since the last global crisis eased, budget deficits have been narrowed, policy interest rates have been raised, and regional and global safety nets for liquidity support have been strengthened.
The eurozone crisis highlights the need for developing Asia to rebalance its economies toward domestic and regional demand and from dependence on exports destined for advanced countries. It also provides added urgency to efforts to broaden and deepen regional cooperation, reduce trade barriers, and promote intraregional trade.

vi Asian Development Outlook 2012
Of perhaps greater threat to developing Asia’s long-term growth and stability is the widening disparity in the region between the “haves” and “have nots”—an issue of growing concern explored in this year’s theme chapter. Despite the region’s rapid growth, the last two decades have witnessed widening income disparities. Most people in the region—about four-fifths of them—live in countries that are becoming more unequal.
Inequitable access to new technology, education, infrastructure, and investment are fueling the divide, particularly between rural and urban areas and between coastal and inland provinces. Bridging this growing gap is essential to promote inclusive growth, and to make growth sustainable. The social and political consequences of an Asia left to divide itself by wealth can no longer be ignored.
It is time for governments in Asia to focus on policies that share the benefits of development fairly, and that maintain healthy growth rates. These policies include fiscal policy enhancements such as increases in spending on education and health, conditional cash transfers for the poor, and more equitable revenue mobilization; more investment in infrastructure to reduce imbalances between developed and lagging areas; and employment-friendly measures to encourage the creation of high-quality jobs.
Haruhiko KurodaPresidentAsian Development Bank

Acknowledgments
The Asian Development Outlook 2012 was prepared by the staff of the Asian Development Bank (ADB) from the Central and West Asia Department, East Asia Department, Pacific Department, South Asia Department, Southeast Asia Department, Economics and Research Department, as well as resident missions. Representatives from these departments and the Office of Regional Economic Integration constituted a Regional Economic Outlook Task Force, which met regularly and coordinated closely to develop consistent forecasts for the region.
The authors who contributed the sections are bylined in each chapter. The subregional coordinators were Tatsuji Hayakawa for Central and West Asia; Jörn Brömmelhörster for East Asia; Mahfuzuddin Ahmed and Yoko Niimi for South Asia; Joven Balbosa for Southeast Asia; and Christopher Edmonds for the Pacific.
A team of economists from the Economics and Research Department, led by Joseph E. Zveglich, Jr., Assistant Chief Economist, Macroeconomics and Finance Research Division, assisted by Edith Laviña, coordinated the overall production of the publication. Technical and research support was provided by Arnelyn May Abdon, Shiela Camingue, Cindy Castillejos-Petalcorin, Gemma Esther Estrada, Anneli Lagman-Martin, Nedelyn Magtibay-Ramos, Pilipinas Quising, Aleli Rosario, and Lea Sumulong. Robert Boumphrey, Joshua Greene, David Husband, Richard Niebuhr, and Anthony Patrick as the editorial economic advisors made substantive contributions to the country chapters and regional outlook.
Deputy Chief Economist Juzhong Zhuang and external advisor Ravi Kanbur led the preparation of the theme chapter “Confronting rising inequality in Asia.” The chapter draws on a series of background papers prepared by ADB and external authors, which are listed in the chapter’s references. David Jay Green provided editorial advice.
Jonathan Aspin did the style and manuscript editing. Elizabeth E. Leuterio was responsible for typesetting and data linking, as well as graphics generation in which she was assisted by Maria Susan Torres. Art direction of the cover design was by Anthony Victoria, with artwork from Design Muscle. Fermirelyn Cruz, Elenita Pura, and Rhia Bautista provided administrative and secretarial support. The publication would not have been possible without the cooperation of the Publishing and Dissemination Unit of the Department of External Relations and the Logistics Management Unit of the Office of Administrative Services.
Ann Quon, Omana Nair, and Sean Crowley of the Department of External Relations planned and coordinated the dissemination of the publication.
Changyong RheeChief EconomistEconomics and Research Department

Acronyms and abbreviations
ADB Asian Development BankASEAN Association of Southeast Asian NationsCPI consumer price indexEFSF European Financial Stability FacilityEU European UnionFDI foreign direct investmentFY fiscal yearGDP gross domestic productIMF International Monetary FundOECD Organisation for Economic Co-operation and DevelopmentOPEC Organization of the Petroleum Exporting CountriesPRC People’s Republic of ChinaUNCTAD United Nations Conference on Trade and DevelopmentUS United StatesVAT value-added taxWTO World Trade Organization
Definitions
The economies discussed in the Asian Development Outlook 2012 (ADO 2012) are classified by major analytic or geographic groupings. For purposes of ADO 2012, the following apply:
Association of Southeast Asian Nations (ASEAN) comprises Brunei Darussalam, Cambodia, Indonesia, the Lao People’s Democratic Republic, Malaysia, Myanmar, the Philippines, Singapore, Thailand, and Viet Nam.Developing Asia refers to the 44 developing member countries of the Asian Development Bank and Brunei Darussalam, an unclassified regional member. Central Asia comprises Armenia, Azerbaijan, Georgia, Kazakhstan, the Kyrgyz Republic, Tajikistan, Turkmenistan, and Uzbekistan. East Asia comprises the People’s Republic of China; Hong Kong, China; the Republic of Korea; Mongolia; and Taipei,China.South Asia comprises Afghanistan, Bangladesh, Bhutan, India, the Maldives, Nepal, Pakistan, and Sri Lanka. Southeast Asia comprises Brunei Darussalam, Cambodia, Indonesia, the Lao People’s Democratic Republic, Malaysia, Myanmar, the Philippines, Singapore, Thailand, and Viet Nam.The Pacific comprises the Cook Islands, Fiji, Kiribati, the Marshall Islands, the Federated States of Micronesia, Nauru, Papua New Guinea, Palau, Samoa, Solomon Islands, Timor-Leste, Tonga, Tuvalu, and Vanuatu.
ADO 2012 is generally based on data available up to 16 March 2012.

ADO 2012—Highlights
Developing Asia will largely maintain its growth momentum in the next couple of years despite weak global demand. From a moderate 7.2% in 2011, growth in the region will ease to 6.9% in 2012 before picking up to 7.3% in 2013.
Inflation for most regional economies subsided in the second half of 2011 as international commodity price rises slackened, but threats of oil supply disruptions risk further price spikes. Volatile foreign capital flows remain a concern as investors shift their risk perceptions in response to the changing global environment.
The greatest risk to the outlook is uncertainty surrounding the resolution of sovereign debt problems in the eurozone. But in the absence of any sudden shocks, developing Asia can manage the effects on its financial markets and trade flows. There is no clear case for policy makers in the region to pursue short-term fiscal or monetary stimulus measures.
Developing Asia has made great strides in raising living standards and reducing poverty, but swelling income disparities threaten to undermine that success. Regional policy makers need to ensure that the benefits of growth are widely shared.

x Highlights—Asian Development Outlook 2012
Key messages
Despite the weak global environment, developing Asia’s growth momentum continues. The region’s gross domestic product (GDP) growth will cool somewhat to 6.9% in 2012, from 7.2% in 2011, and then edge back up to 7.3% in 2013. The region is generally adjusting toward a more sustainable long-run growth path.
Strong domestic demand provided necessary support in 2011, and this will need to continue in light of the soft export demand expected from the major industrial economies of the United States (US), eurozone, and Japan. Collectively, they are expected to expand by only 1.1% in 2012 and 1.7% in 2013.
The greatest risk to the outlook is the continued uncertainty over resolving the sovereign debt problems in the eurozone. The “orderly default” on Greece’s debt in March 2012 diminished the risk of a liquidity crunch in the short run, but calls for fiscal austerity across the eurozone will act as a drag on growth.
The effects on developing Asia’s financial stability and trade flows can be managed if there are no future shocks, but policy makers need to be ready to respond if the eurozone situation worsens. Global value chains—the cross-border production networks of developing Asia—and sudden reductions in trade finance tend to magnify external shocks.
Even if a major external risk to the forecasts materializes, developing Asia has some scope for a macroeconomic policy response. Although the policy stimulus that it adopted in response to the global economic crisis has used up some of its policy space, the region has since regained some of that space. Budget deficits have come down, policy interest rates have been raised, and regional and global safety nets for liquidity support have been strengthened.
In the absence of further global shocks, there is no clear case for developing Asia to make short-term countercyclical macroeconomic policy responses. The gap between potential production and the actual level of output in most developing Asian economies—unlike the advanced economies—is not large enough to warrant aggressive stimulus measures. Instead, policy makers may need to focus on maintaining price stability while sustaining the growth momentum.
Inflation is not an immediate threat for most regional economies—decelerating international commodity price rises from late 2011 have eased some of the pressures. Consumer prices in developing Asia are forecast to rise by 4.6% in 2012 and 4.4% in 2013, down from 5.9% in 2011. However, the unstable geopolitical situation in the Middle East could trigger further oil price spikes, reviving inflation in developing Asia.

Highlights—Asian Development Outlook 2012 xi
Many economies had been normalizing their accommodative monetary policy in early 2011, but they stopped or even reversed the process in the second half, as uncertainties in the major industrial countries damped global demand, and as pressures from international commodity price rises eased. If inflationary pressures build again and capital inflows resume, there may be a need to readjust monetary policy to maintain price stability.
Volatile capital flows remain a concern. Widely shifting risk perceptions among foreign investors in 2011 affected capital flows to developing Asia as funds flowed out toward risk-free assets. If changing investor sentiment causes large swings in capital flows again—building up inflationary pressures or making exchange rates more volatile—policy makers have various measures of capital flow management at their disposal, but such measures need regional coordination to be effective. Greater exchange rate flexibility may also damp speculative capital movements.
Fiscal policy must balance the pursuit of long-term macroeconomic stability and support for growth. Debt-to-GDP ratios spiked in the region after the massive fiscal responses to the global crisis, but they are now trending downward, although lower growth or higher interest rates could quickly undermine this position. Moreover, the region faces additional sources of fiscal strain in the years ahead, such as adjusting to aging populations and building adequate social safety nets.
Developing Asia’s economies need to push through growth-supportive expenditure policies without undermining their fiscal positions. They can do this by adjusting the composition of government expenditure toward education, health, and social safety nets and by expanding expenditure alongside revenue enhancements. Such shifts in fiscal policy will be increasingly important as the region confronts rising income inequality while fostering continued economic expansion.
In the last two decades, income disparities widened in the 11 economies that account for more than four-fifths of the region’s population. Rising inequality can damp the poverty impact of economic growth, and even undermine the basis of growth itself.
The forces of technological progress, globalization, and market-oriented reform—the primary drivers of the region’s rapid growth—are putting a wedge between the incomes of the rich and poor. These factors tend to favor owners of capital over labor, high-skilled over low-skilled workers, and urban and coastal centers over rural and inland areas.
Policy makers must meet the challenge of rising inequality without hindering future growth. They can do this through policies that put in place efficient fiscal measures, that promote regional balance, and that make growth more employment friendly.
xii Highlights—Asian Development Outlook 2012
Maintaining growth in an uncertain world
Developing Asia’s outlook
Developing Asia’s growth is feeling the effects of weak global demand.
Expansion in the region’s GDP moderated to 7.2% in 2011 from 2010’s post–global crisis rebound of 9.1%. Growth in developing Asia is expected to ease further to 6.9% in 2012 before coming back to 7.3% in 2013. These growth projections are still strong compared with other regions of the world, and are part of the adjustment toward a more sustainable long-run growth path in the more advanced regional economies.
Developing Asia’s main trading partners have yet to return to their
precrisis growth rates. Growth in the major industrial countries of the US, eurozone, and Japan was subdued in 2011, with GDP growing collectively by a disappointing 1.2%. Their prospects are also uninspiring, with growth set to stall at 1.1% in 2012 before gaining some lift to 1.7% in 2013. Fiscal consolidation efforts and insipid private domestic demand growth will stay a drag on these economies, and the slipstream from the eurozone’s sovereign debt crisis is buffeting that bloc back into recession. Developing Asia should expect relatively weak demand for its exports from these three economies in the near term.
That is why domestic demand, which is providing increasing support for
the region’s producers, is welcome. Private consumption continues to be a major factor in the region’s growth. Yet investment weakened appreciably toward end-2011, weighing on the outlook for the coming quarters, particularly for export-led economies such as the People’s Republic of China (PRC); Hong Kong, China; the Republic of Korea; Malaysia; and Taipei,China.
The shift toward domestic demand is apparent in further declines in
developing Asia’s current account surplus. The surplus continued to narrow to 2.6% of GDP in 2011 from 4.0% in 2010, reflecting moderating demand for exports, solid domestic demand pushing imports upward, and higher prices for imported oil and commodities. Steady, real exchange rate appreciation in many regional economies has supported this shift. The current account surplus is forecast to be trimmed further in 2012 to 1.9% of GDP, given continued growth in import demand in most economies while exports face soft global demand.
Inflation is set to recede, but volatile commodity prices are a potential
threat. Higher food and fuel prices drove up inflation in developing Asia to 5.9% in 2011 from 4.4% in 2010. With relatively stable (but elevated) oil prices, some respite offered by easing food prices, and lower demand for the region’s exports, inflation in the region is forecast to slow to 4.6% in 2012 and 4.4% in 2013. However, continued instability in the Middle East, including threats of oil supply disruptions, could lead to another round of temporary price spikes, in turn fanning the embers of inflation in developing Asia.

Highlights—Asian Development Outlook 2012 xiii
Volatile capital flows remain a concern. Net capital inflows to developing Asia increased from the second half of 2010 and into the first half of 2011. The PRC was the main beneficiary of the influx, much in the form of foreign direct investment. At the onset of the eurozone turmoil and the ratings downgrade of US long-term sovereign credit in the second half of 2011, global investors sharply curtailed their risk appetite. Consequently, regional capital inflows slowed, even switching to outflows for some countries. Major industrial countries are likely to maintain accommodative monetary policies over the forecast period, and so policy makers in developing Asia will need to be prepared for potentially large swings in capital flows based on fluctuations in global investors’ risk appetites.
Eurozone uncertainties and developing Asia
Continued uncertainties in the eurozone present the greatest risk
to the global outlook. Despite recent progress easing the eurozone’s sovereign debt problems somewhat, the weaker growth momentum in Europe poses risks. The voluntary private sector participation agreement reached in March 2012 helped restructure Greece’s government debt, thus removing the immediate risk of a disorderly default that could have sparked a global liquidity crisis. As the nature of the primary risk to developing Asia has shifted from financial contagion to slower export growth, developing Asia’s policy makers need to prepare for the possibility of an extended period of low European demand for exports.
In the absence of any sudden shocks, the effects on developing Asia’s
financial stability and trade flows can be managed. The region’s direct exposure to eurozone banks is relatively small, and reserves are sufficient to cover short-term external debt repayments, helping shield the region from financial contagion. The region is more vulnerable to the risk of a trade shock, the main channel through which Asia was affected by the global financial crisis. Europe is a key export market for Asia, and will remain so in the near future despite its declining share in recent years. But as long as the slowdown is confined to the eurozone—as opposed to a synchronized advanced-country recession—developing Asia should be able to absorb the impact of lower export demand.
If the situation in the eurozone worsens to the extent of undermining
global recovery, developing Asia’s policy makers need to be prepared
to act quickly. Recent history shows that two areas in particular—global value chains and trade finance—interact with an external trade shock to intensify its impact.
» Global value chains—the production model behind East and
Southeast Asia’s export success—amplify external shocks. The 2008–2009 global trade collapse highlighted this vulnerability, as external demand for final goods dried up and the impact rippled through the region’s supply chains. Asia’s export production structure

xiv Highlights—Asian Development Outlook 2012
and demand sources have changed little since then, and a steep drop in final goods demand from the major industrial countries would still strongly compress aggregate demand for exports throughout the region. This vulnerability underscores the need to diversify the destinations for the region’s final goods and to accelerate the shift to more reliance on domestic demand.
» Trade finance shortages exacerbate the impact of an export demand
shock that is accompanied by a credit squeeze. Trade finance is generally short term and low risk, and in noncrisis periods mainly takes the form of credits between firms. But during a severe crisis, these interfirm credits may dry up, raising firms’ need for bank lending. However, the deleveraging of European banks, which are traditionally active in supporting trade in Asia, could cut into the supply of trade finance. In addition, Basel III regulations could skew bank incentives away from trade finance. Policy makers may need to pay special attention to trade finance when credit is squeezed, especially for small and medium-sized enterprises.
Responding to the unsettled global environment
Developing Asia has some scope for a macroeconomic policy response if a
major downside risk to the outlook materializes. The stimulus measures adopted in response to the global crisis were a departure from the prudent fiscal and monetary policy that regional authorities had generally pursued. Budget deficits, though not back to precrisis levels, have narrowed and policy interest rates have been raised, providing room for a new policy response if needed. Further, regional and global safety nets for liquidity support have been strengthened.
However, there is no clear case for a short-term countercyclical policy
response to the current global economic environment. Although the slowdown in Europe is putting a brake on the region’s growth, the impact is manageable. Output gaps of most Asian economies, unlike the advanced economies’, are not large enough to warrant aggressive countercyclical support.
The region can fine-tune monetary policy to support growth while
keeping a focus on stabilizing inflationary expectations. In the face of inflationary pressures, the relatively accommodative monetary policy that began in late 2008 was tightened until mid-2011. However, in the second half of the year, many countries stopped—and in some cases reversed—the course of monetary tightening as uncertainties in the major industrial countries damped global demand and pressures from international commodity price rises eased. If inflationary pressures build again and capital inflows resume, there may be a need to readjust monetary policy to maintain price stability.
Highlights—Asian Development Outlook 2012 xv
Foreign capital flows will need to be managed to mitigate the impact of
their fluctuations. Investors’ assessments of global market risks swung widely after the onset of the global crisis in 2008, and the continued global economic uncertainty suggests that moves may be similarly volatile in the forecast period. If large swings of capital flows to the region reoccur, various measures of capital flow management may be deployed, but they require regional coordination to be effective. Greater exchange rate flexibility may also help deter speculative capital flows.
Fiscal policy must balance the pursuit of long-term macroeconomic
stability with support to growth momentum. Debt-to-GDP ratios in the region spiked due to the fiscal response to the global crisis, but they are now generally on a downward path. However, governments have no room for complacency, since sustained falling debt ratios depend on continued favorable growth and interest rates, which are subject to sudden reversal in the case of a renewed global economic downturn or a financial crisis. Moreover, the region faces additional sources of fiscal strain in the years ahead, such as adjusting to aging populations and building adequate social safety nets.
Growth-supportive expenditure policies can be achieved without
undermining fiscal positions. This can be done with budget-neutral measures that shift the composition of government spending to education, health, and social safety nets, and by expanding expenditure alongside revenue enhancements. Such shifts in fiscal policy will be increasingly important as the region confronts rising income inequality while fostering continued economic expansion—an issue analyzed in the theme chapter of Asian Development Outlook 2012.

xvi Highlights—Asian Development Outlook 2012
Outlook by subregion
Global factors have given way to country-specific issues in developing
Asia’s outlook. In the aftermath of the collapse of Lehman Brothers in the third quarter of 2008, most regional economies were affected by the sharp drop in global demand and subsequent recovery. But as the global environment has become less volatile—although growth is still slower than before the global crisis—country- or subregion-specific shocks are playing a bigger role, leading to wider variation among economic trends at those levels. Factors include natural disasters, the availability of resources, and the strength of domestic demand.
East Asia’s growth will moderate to 7.4% in 2012 but will still lead the
other subregions. Growth has decelerated markedly since the 9.8% rebound in 2010, dropping to 8.0% in 2011 as the deteriorating global outlook in the second half of 2011 affected directly the contribution to growth of net exports and indirectly investment and consumption. An uptick to 7.7% is forecast for 2013. Growth for the PRC is forecast to moderate to 8.5% and 8.7% in the next 2 years (though this still exceeds the growth envisaged in the 12th Five-Year Plan). East Asia’s inflation is forecast to slow to 3.7% in the next 2 years. The exception is Mongolia, where double-digit rates will prevail as surging government spending boosts domestic demand.
South Asia will see growth improve a shade in 2012 to 6.6%. Growth in 2011 fell sharply to 6.4%, mainly reflecting India’s marked monetary tightening in the face of persistent inflation and slumping investment. Growth in Pakistan declined because of disastrous flooding, although Bangladesh and Sri Lanka did well on brisk exports. The pace of India’s growth is projected to edge up to 7.0% in 2012 and 7.5% in 2013, providing most of the lift for subregional growth to reach 7.1% in 2013. Pakistan’s growth will advance only slightly in both years because electricity will remain a bottleneck on the supply side. South Asia’s inflation is expected to fall from 9.4% last year to 7.7% in 2012 and further to 6.9% in 2013. Some cutbacks in the heavy fuel and electricity subsidies in most countries are expected, and will set a floor to how far inflation can fall.
Growth in Southeast Asia for 2012 is seen picking up to 5.2%. Overall GDP growth decelerated to 4.6% in 2011, as Southeast Asia was hard hit by weakened export markets, domestic policy tightening, and natural disasters that disrupted trade and production—only partly redeemed by strong growth in the subregion’s largest economy, Indonesia. The pickup in growth in 2012 largely reflects recovery in Thailand from major flooding as its growth rate rebounds from 0.1% in 2011 to 5.5% in 2012. Subregional growth is forecast to climb to 5.7% in 2013. Indonesia will continue its solid growth performance, expanding by 6.4% in 2012 and 6.7% in 2013. Higher food and fuel prices drove up aggregate inflation to 5.5% in 2011, but assumed relatively steady global oil prices and easing food prices in 2012 seem likely to slow inflation to 4.4% over the next 2 years.
Highlights—Asian Development Outlook 2012 xvii
Central Asia should just about keep up the momentum at 6.1% in
2012 and 6.2% in 2013. This year’s outturn reflects the combination of a weak eurozone and slower growth in the Russian Federation, offset by a bounceback in growth in Azerbaijan. In 2011, strong demand for petroleum boosted growth in Kazakhstan and Turkmenistan, but Azerbaijan’s minimal growth, due to temporary closure of some oil production facilities, dragged down the subregional rate. Inflation accelerated in 2011 to 9.0%, mainly on rapid increases in world fuel and food prices. More moderate food price inflation and expected stable oil prices are seen helping slow inflation to 7.2% in 2012 and 7.3% in 2013.
The Pacific economies are relatively insulated from developments in
the eurozone. Robust expansion in the resource-exporting economies of Papua New Guinea (which accounts for roughly 60% of Pacific GDP), Timor-Leste, and Solomon Islands, and strong growth in the tourism-oriented economies of the Cook Islands, Fiji, Palau, and Vanuatu, lifted subregional growth to 7.0% in 2011—making this the only subregion to post faster growth in 2011 than 2010. Yet the Pacific is forecast to slow to 6.0% and 4.1% over the next 2 years due to lower resource export revenue, the winding down of infrastructure projects that stimulated growth in 2011 (Papua New Guinea, the Marshall Islands, and Vanuatu), lower international agricultural prices, and flooding impacts (Fiji). Inflation is expected to fall to 6.6% in 2012 from 8.6% in 2011.
xviii Highlights—Asian Development Outlook 2012
Special theme: Confronting rising inequality in Asia
Asia’s rising inequality
Developing Asia’s impressive growth continues, but is paced by a new
challenge—inequality on the rise. Over the last few decades, the region has lifted people out of poverty at an unprecedented rate. But more recent experience contrasts with the “growth with equity” story that characterized the transformation of the newly industrialized economies in the 1960s and 1970s. In the 11 economies that account for more than four-fifths of the region’s population, income disparities expanded during the last two decades—despite the region’s world-beating performance in raising average incomes and reducing poverty.
» Inequality widened in 11 of the 25 economies with comparable data, including the three most populous countries and drivers of the region’s rapid growth—the PRC, India, and Indonesia. From the early 1990s to the late 2000s, the Gini coefficient—a common measure of inequality—worsened from 32 to 43 in the PRC, from 33 to 37 in India, and from 29 to 39 in Indonesia. Treating developing Asia as a single unit, its Gini coefficient went from 39 to 46 in that period.
» Although Asia’s inequality levels are generally below those in other developing regions—the average Gini coefficient across developing Asian economies was 38 compared with an average of 52 for Latin American economies—incomes are becoming more equitable elsewhere.
Inequality of opportunity is also prevalent in developing Asia. Disparities in the means to raise one’s living standards—such as physical assets (e.g., capital and land), human capital (e.g., education and health), and market access (e.g., labor and finance)—are common. Unequal access to public services, especially education and health, is central to generating inequality of opportunity. National household surveys conducted in the mid- to late 2000s revealed many facets of diverging opportunities:
» School-age children from households in the poorest income quintile were three to five times as likely to be out of primary and secondary school as their peers in the richest quintile in some countries. The situation was even more dire for tertiary education where poorer college-age individuals were 10–20 times more likely not to attend college than their better-off peers.
» Infant mortality rates among the poorest households in some countries were double or treble the rates among the richest households. In the most extreme examples, the chance of a poor infant dying at birth was more than 10 times higher than for an infant born to a rich family.
» With few exceptions, the region’s economies have made significant progress toward gender parity in primary and secondary education. Yet high gender disparities in tertiary education remain in South Asia and the Pacific.

Highlights—Asian Development Outlook 2012 xix
Inequality of opportunity is a crucial factor in widening income inequality
in developing Asia. Moreover, these two forms of inequality can lead to a vicious circle as unequal opportunities create income disparities, which in turn lead to differences in future opportunities for individuals and households.
Why inequality matters
Rising inequality can damp the poverty impact of economic growth. If inequality had remained stable in the Asian economies where it increased, the same growth in 1990–2010 would have taken about 240 million more people out of poverty—equivalent to 6.5% of developing Asia’s population in 2010 and 8.0% of those countries with rising inequality.
Inequality can weaken the basis of growth itself. High and rising inequality can curb medium-term growth by reducing social cohesion, undermining the quality of governance, and increasing pressure for inefficient populist policies.
Asian policy makers are becoming more concerned about inequality. In an informal, web-based survey of Asian policy makers in January–February 2012, over 65% of respondents agreed that income inequality in their countries was high or very high. Almost all felt that incomes in their countries were becoming more unequal. Moreover, a majority believed that success in reducing poverty was insufficient to justify widening inequality. This concern is increasingly being addressed through development plans across the region, as they include explicit goals to make growth more inclusive.
Drivers of inequality
Technological progress, globalization, and market-oriented reform—the
primary drivers of the region’s growth—are the key forces behind the
rise in inequality. These forces combined have opened new opportunities for economies to prosper, but have not benefited all people equally. Together, these drivers explain not only the increase in overall inequality, but also the sharply rising incomes of the very rich in some countries.
These forces affect income differences through three channels: capital,
skill, and spatial bias. The bias toward physical capital reduces labor’s share of national income while increasing the income share of the owners of capital. Similarly, the heightened demand for better skilled workers raises the premium on their earnings. And spatial disparities are becoming more acute: locations with superior infrastructure, market access, and scale economies—such as urban centers and coastal areas—are better able to benefit from changing circumstances.
» Labor’s share of total income is falling in many economies in the region. Between the mid-1990s and the mid-2000s, labor income as a share of manufacturing output in the formal sector fell from 48% to 42% in the PRC and from 37% to 22% in India. The employment intensity of growth in Asia is lower than the global average and has declined in recent decades.

xx Highlights—Asian Development Outlook 2012
» Differences in educational attainment can explain 25%–35% of inequality between households in many regional economies, and the earnings premium for skills and tertiary education has increased in recent years.
» The combined contribution of rural–urban and interprovincial differences to total inequality ranges from 13% in Sri Lanka to 54% in the PRC. The gaps between urban and rural incomes in developing Asia have increased, as have those between prosperous and lagging areas.
Policy priorities for confronting rising inequality
Because the forces behind rising inequality are also the engines of
productivity and income growth, policy makers should not hinder
their progress. A distinction needs to be made between the income differences that arise as economies take advantage of the new opportunities of technology, trade, and efficiency-enhancing reforms; and those that are generated by unequal access to market opportunities and public services. This latter source of inequality requires a policy response since it gets magnified by the forces, leads to inefficiency, and undermines the sustainability of growth.
Governments can address rising inequalities through several policy
channels, three of which are highlighted in the theme chapter:
» Efficient fiscal policies. These include:
◆ spending more on education and health, especially for poorer households;
◆ developing and spending more on better targeted social protection schemes, including conditional cash transfers that target income to the poorest but also incentivize the buildup of human capital;
◆ reducing or eliminating general price subsidies (such as on fuel) and compensating the impact on the poor by targeted transfers; and
◆ broadening the tax base and strengthening tax administration for greater and more equitable revenue mobilization.
» Interventions to improve regional balance. These include:
◆ improving transport and communications networks between developed and poor regions;
◆ creating growth poles in lagging areas; ◆ using fiscal transfers to poorer areas in order to accelerate investment
in human capital and improve access to public services there; and ◆ removing barriers to within-country migration.
» Policies to make growth more employment friendly. These include:
◆ encouraging structural transformation to create a greater number of productive jobs, and maintaining a balanced sectoral composition of growth between manufacturing, services, and agriculture;
◆ supporting development of small and medium-sized enterprises; ◆ removing factor market distortions that favor capital over labor; ◆ establishing or strengthening labor market institutions; and ◆ introducing public employment schemes as a temporary bridge to
address pockets of unemployment and underemployment.

Highlights—Asian Development Outlook 2012 xxi
Developing Asia must turn back the tide of rising inequality. The region has enjoyed a remarkable period of growth and poverty reduction, but the new global realities of technological progress, more globally integrated markets, and greater market orientation are magnifying the effects of inequalities in physical and human capital. Asian policy makers need to redouble their efforts to equalize opportunities in employment, education, and health to make growth more inclusive. Without such policies of job creation and efficient redistribution to enhance growth, Asia may be pulled into inefficient populist policies, which would help neither growth nor equity.

xxii Highlights—Asian Development Outlook 2012
Table 1 Growth rate of GDP (% per year)
Subregion/Economy 2009 2010 2011 2012 2013
Central Asia 3.2 6.6 6.2 6.1 6.2
Azerbaijan 9.3 5.0 0.1 4.1 3.5Kazakhstan 1.2 7.0 7.5 6.0 6.5
East Asia 6.7 9.8 8.0 7.4 7.7
China, People’s Rep. of 9.2 10.4 9.2 8.5 8.7Hong Kong, China -2.6 7.0 5.0 3.0 4.5Korea, Rep. of 0.3 6.2 3.6 3.4 4.0Taipei,China -1.8 10.7 4.0 3.4 4.6
South Asia 7.5 7.8 6.4 6.6 7.1
Bangladesh 5.7 6.1 6.7 6.2 6.0India 8.4 8.4 6.9 7.0 7.5Pakistan 1.7 3.8 2.4 3.6 4.0Sri Lanka 3.5 8.0 8.3 7.0 8.0
Southeast Asia 1.4 7.9 4.6 5.2 5.7
Indonesia 4.6 6.2 6.5 6.4 6.7Malaysia -1.6 7.2 5.1 4.0 5.0Philippines 1.1 7.6 3.7 4.8 5.0Singapore -1.0 14.8 4.9 2.8 4.5Thailand -2.3 7.8 0.1 5.5 5.5Viet Nam 5.3 6.8 5.9 5.7 6.2
The Pacific 4.2 5.5 7.0 6.0 4.1
Fiji -1.3 -0.2 2.1 1.0 1.2Papua New Guinea 6.0 7.4 8.9 7.5 4.5
Developing Asia 6.0 9.1 7.2 6.9 7.3
Notes: Developing Asia refers to 44 developing member countries of the Asian Development Bank and Brunei Darussalam, an unclassified regional member; East Asia comprises the People’s Republic of China; Hong Kong, China; the Republic of Korea; Mongolia; and Taipei,China; Southeast Asia comprises Brunei Darussalam, Cambodia, Indonesia, the Lao People’s Democratic Republic, Malaysia, Myanmar, the Philippines, Singapore, Thailand, and Viet Nam; South Asia comprises Islamic Republic of Afghanistan, Bangladesh, Bhutan, India, Maldives, Nepal, Pakistan, and Sri Lanka; (continued on the next page)

Highlights—Asian Development Outlook 2012 xxiii
Table 2 Inflation (% per year)
Subregion/Economy 2009 2010 2011 2012 2013
Central Asia 5.9 7.0 9.0 7.2 7.3
Azerbaijan 1.5 5.7 7.9 9.0 8.5Kazakhstan 7.3 7.1 8.3 6.5 6.8
East Asia -0.1 3.1 5.0 3.7 3.7
China, People’s Rep. of -0.7 3.3 5.4 4.0 4.0Hong Kong, China 0.6 2.3 5.3 3.8 3.3Korea, Rep. of 2.8 3.0 4.0 3.0 3.0Taipei,China -0.9 1.0 1.4 1.5 1.6
South Asia 5.2 9.4 9.4 7.7 6.9
Bangladesh 6.7 7.3 8.8 11.0 8.5India 3.8 9.6 9.0 7.0 6.5Pakistan 17.0 10.1 13.7 12.0 10.0Sri Lanka 3.5 6.2 6.7 8.0 7.0
Southeast Asia 2.7 4.1 5.5 4.4 4.4
Indonesia 4.8 5.1 5.4 5.5 5.0Malaysia 0.6 1.7 3.2 2.4 2.8Philippines 4.2 3.8 4.8 3.7 4.1Singapore 0.6 2.8 5.2 3.0 2.5Thailand -0.9 3.3 3.8 3.4 3.3Viet Nam 6.9 9.2 18.6 9.5 11.5
The Pacific 5.3 5.5 8.6 6.6 5.4
Fiji 3.7 7.8 8.7 5.1 3.0Papua New Guinea 6.9 6.0 8.7 7.0 6.0
Developing Asia 1.4 4.4 5.9 4.6 4.4
(continued from the previous page)Central Asia comprises Armenia, Azerbaijan, Georgia, Kazakhstan, the Kyrgyz Republic, Tajikistan, Turkmenistan, and Uzbekistan; and The Pacific comprises the Cook Islands, Fiji, Kiribati, Republic of the Marshall Islands, the Federated States of Micronesia, Nauru, Papua New Guinea, Republic of Palau, Samoa, Solomon Islands, Democratic Republic of Timor-Leste, Tonga, Tuvalu, and Vanuatu.
Data for Bangladesh, India, and Pakistan are recorded on a fiscal-year basis. For India, the fiscal year spans the current year’s April through the next year’s March. For Bangladesh and Pakistan, the fiscal year spans the previous year’s July through the current year’s June.


Maintaining
growth in an
uncertain world
1


Maintaining growth in an uncertain world
This chapter was written by Arief Ramayandi, Martin Bodenstein, Benno Ferrarini,
Shikha Jha, Minsoo Lee, Donghyun Park, Pilipinas Quising, Changyong Rhee, Lea
Sumulong, Akiko Terada-Hagiwara, and Joseph E. Zveglich, Jr. of the Economics
and Research Department, ADB, Manila. Background materials from Steven Beck are
gratefully acknowledged.
In 2011, the world’s recovery from the 2008–2009 global financial crisis proceeded in fits and starts. The cautious optimism expressed by pundits in the early part of the year gave way to warnings of a “double dip” by midyear.
First, March’s earthquake and nuclear disaster in Japan devastated its already faltering economy. Then the sovereign debt crisis in the eurozone periphery erupted, generating inadequate responses that were unable to convince financial markets that the situation would not get out of hand. Finally, partisan brinksmanship in the United States (US) over the national debt ceiling led to the first-ever loss of the triple-A rating on its long-term sovereign credit.
In the early months of 2012, caution rather than optimism is the more dominant sentiment for global prospects. The workout of Greece’s sovereign debt in March 2012 did not convince investors that the crisis was fully resolved, as evidenced by continued elevated credit default spreads for other eurozone countries (Figure 1.1.1).
Developing Asia is feeling the weight of these weaknesses among the major industrial countries. Yet it has managed to grow, steadily. The worst of the global crisis may be past, but as 2011 demonstrated, policy makers need to be prepared for any eventuality. But the appropriate policy response is less clear than in the financial crisis years, given the current uncertain environment.
1.1.1 Ten-year US dollar-denominated credit default swaps
0
300
600
900
1,200
IrelandItaly Portugal Spain
GermanyFrance
Jan12
JulJan11JulJan10
JulJan2009
Basis points
Source: Bloomberg (accessed 28 March 2012).

4 Asian Development Outlook 2012
Steady growth amid global weakness
With sustained impulse from the major industrial economies unlikely for some time to come, economic growth in developing Asia will depend on its capacity to strengthen domestic demand and deepen trade ties with other fast-growing economies. Policy makers will need to navigate risks of commodity price spikes and volatile capital flows. But more importantly, they need to follow the only half-resolved eurozone debt problems closely, and be ready to act.
Major industrial economies: Erratic recoveryThe disappointing growth performance of the major industrial countries in 2011, when growth of gross domestic product (GDP) fell to 1.2%, is expected to extend further into 2012 and even 2013 (Table 1.1.1). Fiscal consolidation efforts and weak private domestic demand growth will remain a drag on them. Japan’s recovery from the March disaster has been uninspiring and developments overseas have also slowed the economy. In Europe, woes from the eurozone’s sovereign debt crisis have given rise to a
1.1.1 Baseline assumptions for the international economy
2010Actual
2011Actual
2012ADO 2012
projection
2013ADO 2012
projection
GDP growth (%)Major industrial economies a 2.8 1.2 1.1 1.7
United States 3.0 1.7 2.0 2.3Eurozone 1.9 1.4 -0.5 1.0Japan 4.4 -0.7 1.9 1.5
World trade (% change)Merchandise exports 14.5 5.8 3.8 5.4
Prices and inflationBrent crude spot prices (average, US$ per barrel) 79.6 110.9 111.0 106.0Energy price index (2005=100, % change) 26.4 29.9 3.1 -3.1Food index (2005=100, % change) 8.9 23.9 -9.0 5.0CPI inflation (major industrial economy
average, %)1.2 2.4 1.6 1.8
Interest ratesUnited States Federal funds rate (average, %) 0.2 0.1 0.1 0.1European Union refinancing rate (average, %) 1.0 1.2 1.0 1.0Japan interest rate (average, %) 0.1 0.1 0.1 0.1US$ Libor b (%) 0.3 0.2 0.3 0.3
CPI = consumer price index.a Average growth rates are weighted by gross national income, Atlas method (current US dollars). b Average interbank quotations on 1-month loans.
Sources: US Department of Commerce, Bureau of Economic Analysis, http://www.bea.gov; Eurostat, http://epp.eurostat.ec.europa.eu; Economic and Social Research Institute of Japan, http://www.esri.cao.go.jp; World Trade Organization, http://www.wto.org; Consensus Forecasts; Bloomberg; International Monetary Fund, Primary Commodity Prices, http://www.imf.org; World Bank, Global Commodity Markets, http://www.worldbank.org; ADB estimates.
Maintaining growth in an uncertain world 5
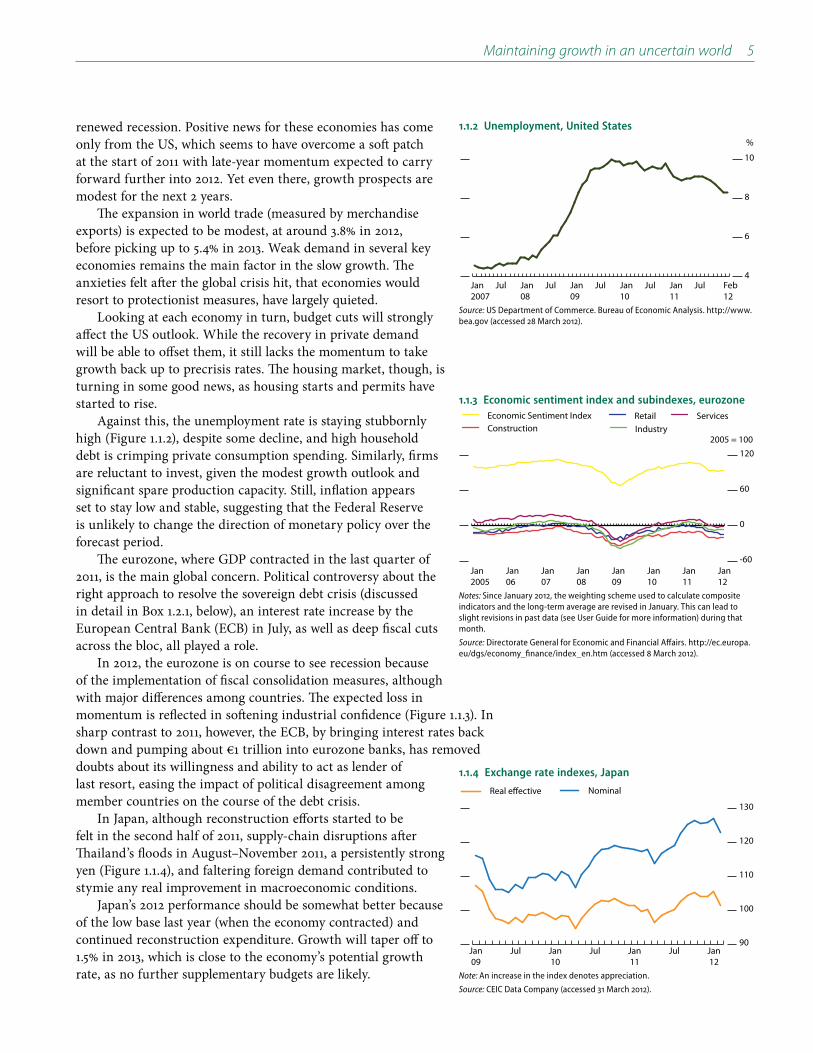
renewed recession. Positive news for these economies has come only from the US, which seems to have overcome a soft patch at the start of 2011 with late-year momentum expected to carry forward further into 2012. Yet even there, growth prospects are modest for the next 2 years.
The expansion in world trade (measured by merchandise exports) is expected to be modest, at around 3.8% in 2012, before picking up to 5.4% in 2013. Weak demand in several key economies remains the main factor in the slow growth. The anxieties felt after the global crisis hit, that economies would resort to protectionist measures, have largely quieted.
Looking at each economy in turn, budget cuts will strongly affect the US outlook. While the recovery in private demand will be able to offset them, it still lacks the momentum to take growth back up to precrisis rates. The housing market, though, is turning in some good news, as housing starts and permits have started to rise.
Against this, the unemployment rate is staying stubbornly high (Figure 1.1.2), despite some decline, and high household debt is crimping private consumption spending. Similarly, firms are reluctant to invest, given the modest growth outlook and significant spare production capacity. Still, inflation appears set to stay low and stable, suggesting that the Federal Reserve is unlikely to change the direction of monetary policy over the forecast period.
The eurozone, where GDP contracted in the last quarter of 2011, is the main global concern. Political controversy about the right approach to resolve the sovereign debt crisis (discussed in detail in Box 1.2.1, below), an interest rate increase by the European Central Bank (ECB) in July, as well as deep fiscal cuts across the bloc, all played a role.
In 2012, the eurozone is on course to see recession because of the implementation of fiscal consolidation measures, although with major differences among countries. The expected loss in momentum is reflected in softening industrial confidence (Figure 1.1.3). In sharp contrast to 2011, however, the ECB, by bringing interest rates back down and pumping about €1 trillion into eurozone banks, has removed doubts about its willingness and ability to act as lender of last resort, easing the impact of political disagreement among member countries on the course of the debt crisis.
In Japan, although reconstruction efforts started to be felt in the second half of 2011, supply-chain disruptions after Thailand’s floods in August–November 2011, a persistently strong yen (Figure 1.1.4), and faltering foreign demand contributed to stymie any real improvement in macroeconomic conditions.
Japan’s 2012 performance should be somewhat better because of the low base last year (when the economy contracted) and continued reconstruction expenditure. Growth will taper off to 1.5% in 2013, which is close to the economy’s potential growth rate, as no further supplementary budgets are likely.
1.1.2 Unemployment, United States
4
6
8
10
Feb12
JulJan11
JulJan10
JulJan09
JulJan08
JulJan2007
%
Source: US Department of Commerce. Bureau of Economic Analysis. http://www.bea.gov (accessed 28 March 2012).
1.1.3 Economic sentiment index and subindexes, eurozone
-60
0
60
120
Economic Sentiment Index RetailConstruction
ServicesIndustry
Jan12
Jan11
Jan10
Jan09
Jan08
Jan07
Jan06
Jan2005
2005 = 100
Notes: Since January 2012, the weighting scheme used to calculate composite indicators and the long-term average are revised in January. This can lead to slight revisions in past data (see User Guide for more information) during that month.
Source: Directorate General for Economic and Financial Affairs. http://ec.europa.eu/dgs/economy_finance/index_en.htm (accessed 8 March 2012).
1.1.4 Exchange rate indexes, Japan
90
100
110
120
130
NominalReal effective
Jan12
JulJan11
JulJan10
JulJan09
Note: An increase in the index denotes appreciation.
Source: CEIC Data Company (accessed 31 March 2012).

6 Asian Development Outlook 2012
Growth in developing Asia: Moderating, but persistent
Developing Asia started to feel the impact of the most recent global slowdown late in 2011. Its growth moderated to 7.2% for the full year—down from the post–global financial crisis rebound of 9.1%. This was partly the effect of the higher base after the strong growth in 2010, but also the impact of normalizing fiscal and monetary policy. This moderating trend is expected to continue into the near future, taking regional growth to 6.9% in 2012, before it picks up to 7.3% in 2013 (Figure 1.1.5). Domestic private demand is driving growth, helping narrow current account surpluses, while inflation pressures are currently in check.
Importance of private domestic demandAs the global recovery seemed to be taking hold in late 2010 and early 2011, authorities in developing Asia began to normalize monetary and fiscal policy. Consequently, the effects of the policy stimulus—launched to cushion the global crisis impacts—dissipated, and the role of domestic private demand became more important in driving developing Asia.
However, the slowdown in the major industrial countries in mid-2011 (especially the heightened uncertainty emanating from the eurozone) and the deteriorating terms of trade from elevated oil prices helped slow the region’s growth. As a result, the engines of growth in 2011 were not as uniform and robust as those in 2010. Among 10 leading economies, which account for 93% of the region’s output, investment’s contribution to growth dropped sharply in seven (Figure 1.1.6).
Investment weakened sharply toward end-2011, weighing on the outlook for the coming quarters, particularly in open economies such as Hong Kong, China; the Republic of Korea; Malaysia; Taipei,China; and Thailand. The fading contribution of investments in 2011 is characterized by inventory destocking in four out of six economies (Figure 1.1.7), a trend that resembles the path in the immediate postcrisis year.
Assuming that the global economy gradually picks up toward end-2012, private investment and restocking of inventories are expected to drive capital formation this year, though moderately. (In Thailand, it will be public investment, to support post-flood reconstruction.) The PRC economy is set to make a soft landing after growth averaged above 10% in the 5 years 2007–2011—steadily declining credit growth suggests investment will likely moderate—unless the authorities push through a further stimulus to mitigate the effects of the decline in trade.
Backed by the steady improvement in labor markets, however, private consumption appeared to hold up well in 2011, albeit to a lesser degree. Unlike the previous year, it became the one common growth driver in 2011.
Up-to-date unemployment data are sparse, but among nine
1.1.5 GDP growth, developing Asia
0
3
6
9
12
1312111009082007Forecast
%
5-year moving average
Source: Asian Development Outlook database.
1.1.6 GDP growth, developing Asia
-5
0
5
10
15
20
A B A B A B A B A B A B A B A B A B A B
PRC HKG IND INO KOR MAL PHI SIN TAP THA
Percentage points
Government consumptionPrivate consumptionGDP
Statistical discrepancyNet exportsInvestment
Note: 10 countries with available data on GDP by expenditure. A = 2010; B = 2011.
Source: CEIC Data Company (accessed 15 March 2012).
1.1.7 Contribution to growth in investments
-10
0
10
20
30
40
2010 2011 2010 2011 2010 2011 20102011 2010 2011 2010 2011
HKG TAP THA KOR MAL SIN
Percentage pointsChange in stocksGross fixed capital formationTotal investment
GFCF—private GFCF—public
Note: Economies for which data are available.
Source: CEIC Data Company (accessed 15 March 2012).

Maintaining growth in an uncertain world 7
East and Southeast Asian economies, unemployment has declined to closer to pre–global crisis rates, if not below (Figure 1.1.8). While rising real wages in some countries may continue lifting consumer sentiment a little, the chances appear slim.
Indeed, retail sales—showing signs of deceleration in four economies in East Asia that account for around two-thirds of developing Asia’s GDP—suggest that private consumption may slow this year (Figure 1.1.9). Of the nine economies, relatively bright spots for retail sales are in Southeast Asia: Indonesia and Viet Nam are forecast to maintain growth this year and to accelerate further next year. Thailand showed a sharp deterioration in retail sales after the devastating flooding, but is expected to join the relatively resilient economies of the subregion this year in recovery. Other more open economies in Southeast Asia, however—Malaysia and Singapore—may follow the East Asian economies.
Varying growth drivers across subregionsFrom the collapse of Lehman Brothers in September 2008 through the initial stages of the global recovery in 2010, external factors generally dominated developing Asia’s outlook such that countries and subregions largely moved in sync. In contrast, 2011 has seen general factors give way to country-specific factors driving the outlook.
As external demand has swung less widely—although it is still softer than before the global crisis—country- or subregion-specific shocks are playing an important role, leading to variation among economic trends at those levels. Factors include natural disasters, the availability of resources, and the strength of domestic demand.
The deteriorating global outlook in the second half of 2011 affected directly the contribution to growth of net exports and indirectly investment and consumption. The deteriorating terms of trade from elevated oil prices also contributed (Figure 1.1.10). East Asia’s vulnerability to slowing external demand—especially from major industrialized countries—is well illustrated by the Republic of Korea’s slump. That country’s growth rate in 2011 fell by a full percentage point below what had been forecast but consistent with altered expectations concerning the eurozone, the US, and Japanese economies. Investment was flat, as businesses and investors became much more cautious. Despite the uncertain global context, exports increased by 20% and accounted for more than 50% of GDP growth.
This is generally the storyline for all five countries in East Asia. In some cases negative net exports (e.g., the PRC) or a narrowing of a positive net export position (Hong Kong, China) are seen. In Taipei,China, a sharp drop in the growth of exports was more than offset by an even bigger drop in import growth. East Asia’s exports of goods and services, or the buildup for a surge in exports, as with Mongolia’s mining sector, were—and remain—the dominant factor in growth. East Asia’s growth projections for 2012 and 2013 rest importantly on the outlook for external demand.
1.1.8 Unemployment
0
2
4
6
8
10
%
People’s Republic of China Republic of Korea PhilippinesSingapore Hong Kong, China MalaysiaTaipei,China Thailand Indonesia
Q12008
Q3 Q109
Q3 Q110
Q3 Q111
Q3
Source: CEIC Data Company (accessed 15 March 2012).
1.1.9 Retail sales
0
10
20
30
Taipei,ChinaRepublic of KoreaHong Kong, ChinaPeople's Republic of China
Oct Jul Apr Jan11
Oct Jul Apr Jan2010
year-on-year % change, 3-month moving average
East Asia
-15
0
15
30
45
Jan2010
Apr Jul Oct Jan11
Apr Jul Oct
year on year % change, 3-month moving average
Southeast Asia
Malaysia Thailand Singapore
Indonesia Viet Nam
Source: CEIC Data Company (accessed 15 March 2012).

8 Asian Development Outlook 2012
1.1.10 Terms of trade, East and Southeast Asia
0.00 0.04 0.08 0.12 0.16
Korea, Rep. of
Malaysia
Singapore
Taipei,China
Thailand
Hong Kong, China
% changeNote: Terms of trade is computed as ln(2010 peak/2011 trough).
Source: CEIC Data Company (accessed 2 April 2012).
1.1.11 GDP growth, by region
0
3
6
9
201320122011
Developing Asia
The Pacific Southeast Asia
South Asia East Asia Central Asia
%
Source: Asian Development Outlook database.
East Asia’s growth will moderate to 7.4% in 2012 but will still lead the other subregions (Figure 1.1.11). An uptick to 7.7% is forecast for 2013. Growth for the PRC is forecast to moderate to 8.5% and 8.7% in the next 2 years (though this still exceeds the growth envisaged in the 12th Five-Year Plan). Hong Kong, China; the Republic of Korea; and Taipei,China are all expected to experience continued growth below their potential growth, which for these countries is in the range of 4–5%.
In Southeast Asia, GDP growth decelerated to 4.6% in 2011, hard hit by weakened export markets (as in East Asia), domestic policy tightening, and natural disasters disrupting trade and production—only partly redeemed by strong growth in the largest economy, Indonesia. Rising inflation in the first half of 2011 prompted monetary policy tightening in most countries. Furthermore, fiscal stimulus instituted during the global recession continued to be withdrawn in several countries. In particular, government outlays fell steeply in the Philippines, in part because an introduction of governance reforms delayed decisions and disbursements, hurting GDP growth.
Growth in Southeast Asia is seen picking up to 5.2% for 2012 and to 5.7% in 2013. The pickup in 2012 largely reflects recovery in Thailand from major flooding as growth rebounds from 0.1% in 2011 to 5.5% in 2012. The Philippines will also contribute by picking up from bouts of weakness last year in electronics and government investment. Indonesia will continue its solid performance, expanding by 6.4% in 2012 and 6.7% in 2013.
Economies in Southeast Asia would generally benefit for much of 2012 from space for easing monetary policies, and fiscal stimulus if global trade and financial conditions deteriorate further. Still, slowing world trade and international financial uncertainties will damp economic activity, notably in trade-dependent Malaysia and Singapore, where growth is set to slow this year.
For South Asia, growth in 2011 fell sharply to 6.4% from 7.8% in 2010. The fall was largely determined by the marked slowdown in India where growth fell to 6.9% from 8.4% in 2010, mainly reflecting its marked monetary tightening in the face of persistent inflation and slumping investment. Growth in Pakistan declined in 2011 because of disastrous flooding, although Bangladesh and Sri Lanka did well on brisk exports.
South Asia will see growth improve a shade in 2012 to 6.6%. The pace of India’s growth is projected to edge up to 7.0% in 2012 and 7.5% in 2013, providing most of the lift for subregional growth to reach 7.1% in 2013. Despite recovery from flooding, Pakistan’s growth will advance only slightly in both years as electricity will remain a bottleneck on the supply side. Growth in Bangladesh is expected to be limited to about 6%, well below the government’s objective, as policies will need to contain inflation and a deterioration in the balance of payments.
In Central Asia, growth declined in 2011 to 6.2% from 6.6% in 2010, as a drop in oil production led to virtually zero growth in Azerbaijan, where closure of one of its three oil platforms for safety reasons caused a drop in oil output. Yet six of the eight countries saw higher growth, on continued economic recovery in the Russian Federation and the US, plus stronger eurozone demand for commodities. For Kazakhstan, the economy
Maintaining growth in an uncertain world 9
expanded by 7.5% as a steep rise in natural gas exports offset a decline in oil production, and good weather more than doubled its grain output.
Central Asia should just about keep up the momentum at 6.1% in 2012 and 6.2% in 2013. This year’s outturn reflects the combination of a weak eurozone and slower growth in the Russian Federation, offset by a bounceback in growth in Azerbaijan. In 2013, a more favorable outlook for the global economy, including the Russian Federation, is expected to raise growth rates in four countries, balanced by declining growth in three.
Pacific countries are quite insulated from events in the eurozone. Robust expansion in the resource-exporting economies of Papua New Guinea (accounting for roughly half of Pacific GDP), Timor-Leste, and Solomon Islands, and strong growth in the tourism-oriented economies of Cook Islands, Fiji, Palau, and Vanuatu, lifted subregional growth to 7.0% in 2011—making this the only subregion to post faster growth in 2011 than 2010.
Yet the Pacific is forecast to slow to 6.0% and 4.1% over the next 2 years due to lower resource export revenue, the winding down of infrastructure projects that stimulated growth in 2011 (Papua New Guinea, the Marshall Islands, and Vanuatu), lower international agricultural prices, and flooding impacts (Fiji). While tourism is expected to continue to support growth, remittances are not expected to recover in the near future in view of the weak economic outlook.
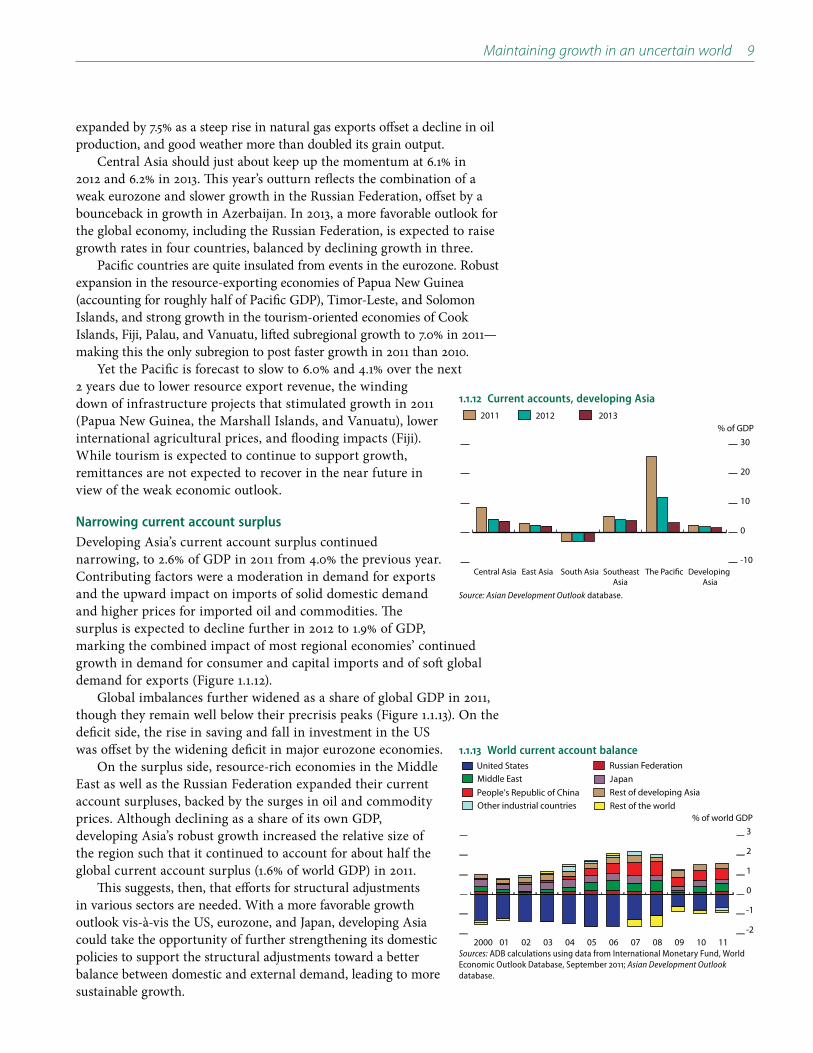
Narrowing current account surplusDeveloping Asia’s current account surplus continued narrowing, to 2.6% of GDP in 2011 from 4.0% the previous year. Contributing factors were a moderation in demand for exports and the upward impact on imports of solid domestic demand and higher prices for imported oil and commodities. The surplus is expected to decline further in 2012 to 1.9% of GDP, marking the combined impact of most regional economies’ continued growth in demand for consumer and capital imports and of soft global demand for exports (Figure 1.1.12).
Global imbalances further widened as a share of global GDP in 2011, though they remain well below their precrisis peaks (Figure 1.1.13). On the deficit side, the rise in saving and fall in investment in the US was offset by the widening deficit in major eurozone economies.
On the surplus side, resource-rich economies in the Middle East as well as the Russian Federation expanded their current account surpluses, backed by the surges in oil and commodity prices. Although declining as a share of its own GDP, developing Asia’s robust growth increased the relative size of the region such that it continued to account for about half the global current account surplus (1.6% of world GDP) in 2011.
This suggests, then, that efforts for structural adjustments in various sectors are needed. With a more favorable growth outlook vis-à-vis the US, eurozone, and Japan, developing Asia could take the opportunity of further strengthening its domestic policies to support the structural adjustments toward a better balance between domestic and external demand, leading to more sustainable growth.
1.1.12 Current accounts, developing Asia
-10
0
10
20
30
201320122011
Developing Asia
The Pacific Southeast Asia
South Asia East Asia Central Asia
% of GDP
Source: Asian Development Outlook database.
1.1.13 World current account balance
-2
-1
0
1
2
3
2000 01 02 03 04 05 06 07 08 09 10 11
% of world GDP
Middle EastUnited States
JapanRussian Federation
Other industrial countriesPeople’s Republic of China
Rest of the worldRest of developing Asia
Sources: ADB calculations using data from International Monetary Fund, World Economic Outlook Database, September 2011; Asian Development Outlook database.

10 Asian Development Outlook 2012
Inflation subdued—but oil could give a nasty shockThe recent rising trend in global commodity prices is expected to pause, tempering inflationary pressures (Box 1.1.1). Despite the recent surge in crude oil prices driven by Middle East political instability, the average
Continued slow recovery in industrial countries and decelerating economic growth in emerging economies will damp growth in oil demand.
Although staying high, food prices are projected to decline in 2012 and 2013 from their 2011 peak, reflecting improved supply prospects and weak demand growth.
Across subregions, higher food and fuel prices drove up inflation in developing Asia to 5.9% in 2011 from 4.4% in 2010 (Figure 1.1.14). In Central Asia, South Asia, and the Pacific, average inflation rates reached around 9% in 2011 while it was more moderate in East and Southeast Asia, where inflation continued to be contained at around 5%. Among the five subregions, though still at a relatively higher level at 9.4%, South Asia was the only subregion that managed to avoid the hike last year. This was due to India’s sustained monetary tightening (at a cost to economic growth) to combat persistent high inflation, which damped inflation from 9.6% in 2010 to 9% 2011 and managed to offset the climb in Maldives and Pakistan.
In Central Asia during 2011, average inflation increased from 7.0% in 2010 to 9.0%. Prices climbed faster in every country except Armenia, where monetary tightening and an improved harvest restrained them. The increases were especially sharp in the Kyrgyz Republic and Tajikistan, where spikes in food prices during the first half of the year caused average inflation rates roughly to double. For the Pacific, the rise in inflation in Papua New Guinea and Timor-Leste drove up the subregional average from 5.5% to 8.6% in 2011.
For East Asia as a whole, inflation was 5% in 2011, up from 3.1% in 2010. The rebound of growth in East Asia in 2010, tying over into the early part of 2011, alongside rising food, oil, and other commodity prices, sparked the inflation resurgence. Highly accommodative monetary policies and the residue of fiscal stimulus were other factors. Likewise in Southeast Asia, higher food and fuel prices drove up inflation to 5.5% from 4.1%. Average inflation exceeded 5% in half the 10 countries.
Inflation in developing Asia is set to recede as economic activity softens. Assuming relatively steady global oil prices and easing food prices in 2012, regional average inflation is forecast to slow to 4.6%. Besides the external price developments, domestic policies may play a role in, for example, South Asia, where some reduction in heavy fuel and power subsidies are expected, and will set a floor for any reduction in inflation. For 2013, further deceleration is expected in South Asia and the Pacific, while other subregions are seen continuing flat, taking the regional average down to 4.4% (Figure 1.1.15).
Still, policy makers cannot take this favorable trend in inflation for granted, and among the three main risks to the outlook, the risk of a spike in inflation looms.
1.1.15 Inflation by subregion
0
2
4
6
8
10
201320122011
Developing Asia
The Pacific Southeast Asia
South Asia East Asia Central Asia
%
Source: Asian Development Outlook database.
1.1.14 Inflation, developing Asia
0
2
4
6
8
1312111009082007
Forecast
%
5-year moving average
Source: Asian Development Outlook database.

Maintaining growth in an uncertain world 11
Risks to the outlook
Commodity price spikesDespite the nominal heights discussed above, commodity prices are well below their 1970s’ real terms levels—even the 2007–2008 price spike failed to take them back. Recent price volatility, though, as measured by the standard deviation of price movements, is higher. Indeed, commodity prices are becoming more volatile and, as such, disruptive, heavily affecting poor households (too many subsidies are mistargeted or are slow to come into play), as well as low-income countries that are heavy food and fuel importers.
Commodity price spikes by themselves will not produce sustained inflation, but they can hinder economic growth by raising macroeconomic vulnerability, eroding producer profits, or hitting household incomes. With non-OPEC oil supply providing little cushion to total supply (and the ever-present possibility of unplanned outages), the relatively benign view of near-term oil price movements could switch overnight if geopolitical tensions blow up. For food, market sentiment is affected not so much by low production prospects but more by uncertainty on the sufficiency of supply to meet ever-increasing demand under extreme weather disturbances.
Food price spikes as well are a key risk to the inflation outlook, given the weight of food in the region’s consumer price indexes. In addition to the knock-on effects of oil price movements, natural disasters—the frequency of which has multiplied 10-fold between 1960 and 2010—play havoc on food price expectations. With greater uncertainty about the sufficiency of supply to meet ever-increasing demand under extreme weather disturbances, market sentiments can shift abruptly.
Volatile capital flowsInvestor uncertainty over the advanced economies’ recovery prospects intensified capital-flow volatility—capital tends to flee the region when global risk aversion intensifies, and to return when it eases. Inflows to Asia rebounded strongly after their huge drop during the last global economic downturn (Figure 1.1.16), but the movements are erratic.
The trend slowed in the first 3 quarters of 2010, then surged again through the first half of 2011. This pickup was driven by huge increase in net inflows of currency and deposits (Figure 1.1.17), as regional policy makers raised interest rates to deal with inflationary pressures. But the worsening debt crisis in Europe and the downgrade by Standard and Poor’s of US long-term sovereign credit rating in the third quarter of 2011 caused investor sentiment to swing. As investors became much more risk averse, net capital inflows to the region plunged (though just stayed positive).
Trends vary among the countries of developing Asia. Flows to the PRC—with its high inflows of FDI—tend to dominate regional figures. Although trends in the components contributing to the net inflows are similar, the spike in the
1.1.16 Semiannual capital flows, emerging Asia
-300
-150
0
150
300
H12006
H2 H107
H2 H108
H2 H109
H2 H110
H2 H111
$ billionFDI Portfolio Other investmentsNet
Notes: 1. Emerging Asia consists of People’s Republic of China; Hong Kong, China; India; Indonesia; Republic of Korea; Malaysia; Philippines; Singapore; Taipei,China; and Thailand. 2. Other investments comprise trade credits, loans, currencies and deposits and others.
Source: ADB estimates based on data from CEIC Data Company (accessed 15 March 2012).
1.1.17 Quarterly capital flows, emerging Asia
-60
0
60
120
180
Q12010
Q2 Q3 Q4 Q111
Q2 Q3
$ billionFDI Portfolio Other investmentsNet
Notes: See previous figure.
Source: ADB estimates based on data from CEIC Data Company (accessed 15 March 2012).

12 Asian Development Outlook 2012
Recent oil price movementsWide gyrations characterized the oil price path in 2011. The promise of a firming global recovery in the early part of the year led to an initial spike, but prices fell back as the optimism faded. Political instability in the Middle East clouded oil supply expectations, adding further volatility to prices. The spot-market price of Brent crude ended the year 14% higher than it began it, averaging $111 a barrel for the year. The annual average price far exceeded the previous record of $98 set in 2008—the year of the inflating and bursting of the oil price bubble.
The first quarter of 2012 has seen another spike in prices, of more than 15% (Box figure 1). Oil futures prices have been as volatile as spot prices, amid heightened political and economic tensions.
Supply factors drive oil price volatilitySupply-side constraints are the primary factors behind the recent upsurge in oil prices. Supply interruptions have surfaced in South Sudan, Yemen, Syria, and Libya. Conflict has exacerbated the existing tight supply conditions by creating geopolitical nervousness. Moreover, the output of Iran, the world’s third-largest crude oil exporter, has fallen
to a 10-year low, crippled by US sanctions against financial institutions that deal with Iran. It may fall further as the EU embargo on Iranian oil imports takes full effect by mid-2012.
Spare capacity is quite tight. According to the International Energy Agency, Saudi Arabia’s was only 1.9 million barrels per day (mb/d) in February 2012, against 11.9 mb/d of declared capacity. More widely, OPEC’s spare oil production capacity declined to an average of 2.8 mb/d in the first 2 months of 2012 from an average of 4.5 million for the same period a year earlier.
In mid-March, the agency lowered its full-year 2012 non-OPEC production forecast from 0.9 mb/d to 0.73 mb/d. Strategic petroleum reserves have not been used to mitigate supply constraints as countries such as France, Germany, and the US are trying to boost (or maintain) their reserves. Moreover, output of the petroleum substitute, ethanol, is on the decline.
Despite this, supply conditions are expected to improve in 2012. Global oil supply is projected to rise by about 2 mb/d, more from OPEC than non-OPEC countries. Saudi Arabia has increased its production to counter the reduction from other countries, and its output is at a 30-year high, though this comes at the expense of further squeezes on spare capacity. Libyan output is rapidly recovering to prewar levels. Output is also expected to rise in Angola, Iraq, and Nigeria, as tensions ease there. Many producing countries are adopting modern technology to extract more oil from the fields. These changes should counter shortages arising from Iran.
Demand factors dominate the oil price outlookOil demand had been picking up in 2010 as the world economy bounced back from the trough of the global economic crisis, but slowed sharply in 2011 to only 0.8% growth. Soft demand in advanced economies affected commodity demand directly and indirectly by tempering the growth of emerging markets (and hence their energy demand).
1.1.1 Key commodity price trends and prospects
1 Price of Brent crude
90
100
110
120
130
MarJan12
OctJulAprJan2011
$/barrel
Source: Source: Bloomberg (accessed 30 March 2012).
total net capital inflows was not observed elsewhere in Asia (Figure 1.1.18). Further, driven by massive portfolio outflows, net capital inflows to developing Asia (excluding the PRC) dived deep into a negative territory in the third quarter of 2011 as global risk aversion intensified. Some slowing indication in the strength of the net capital inflows was also apparent for the PRC, particularly due to much slower inflows of portfolio and other investments (the more volatile part of capital inflows).
Given the likely prolonged period of loose monetary policy in the major industrial countries, an easing of global risk aversion could cause another round of strong capital flows to developing Asia. This could complicate regional policy makers’ efforts by once again stoking inflation and pressuring exchange rate appreciation. Yet the risk of sudden and massive outflows also remains if global risk aversion becomes acute. Such an
1.1.18 Net capital flows, PRC and other emerging Asia
-80
-40
0
40
80
120
Other emerging AsiaPRC
Q3Q2Q111
Q4Q3Q2Q12010
$ billion
Notes: Other emerging Asia consists of Hong Kong, China; India; Indonesia; Republic of Korea; Malaysia; Philippines; Singapore; Taipei,China; and Thailand.
Source: ADB estimates based on data from CEIC Data Company (accessed 15 March 2012).

Maintaining growth in an uncertain world 13
So while prices are expected to remain elevated above $100 per barrel in 2012 and 2013 because of the relatively tight supply conditions, soft demand will suppress oil price growth.
The oil price is expected to remain around its 2011 level in 2012 (about $111 per barrel), slipping to $106 in 2013, as continued soft demand growth in the major industrial countries and some increase in supply eases market conditions a little (Table 1.1.1 above).
Recent food price developmentsFood is usually the main contributor to agricultural price movements (Box figure 2). Generally flat after the collapse in 2008, prices surged in 2011 to average 24% more than a year earlier. Although slowing by year-end, the benchmark food price index of the World Bank lingered at levels seen in the 2008 peak, especially after the pickup in early 2012.
Grain prices (including corn, rice, and wheat) led other food prices. From the third quarter of 2011 corn and wheat prices retreated, reflecting improved supply from better weather. Rice prices, however, gained strength, mainly due to policy changes in Thailand, the world’s top exporter. Rice prices rose in July as Thai farmers withheld rice from the export market following a government pledge to pay farmers above the market rate. International prices then stayed firm as the government implemented the policy in early October.
This, coupled with the harmful effects of floods in several countries in Southeast Asia (including Thailand itself and Viet Nam) supported rice prices. On the other hand, India relaxed export restrictions, which helped check price increases.
Food price prospectsThe food price pickup in early 2012 stemmed from worries about poor weather in South America and Europe, renewing concerns about food security: March 2012’s food price index was barely 6% below its February 2011 peak. Notwithstanding elevated and volatile prices in the short term, the full-year projection for 2012 shows a more comfortable picture.
According to the February 2012 World Agricultural Supply and Demand Estimates of the US Department of Agriculture, global production and stocks are generally stronger as harvests of major cereals are at record levels. Increased production of wheat is expected from major exporters (Australia, Canada, and EU-27), as well as from smaller producers. Corn production is also projected to increase. India, Pakistan, the PRC, and Egypt are expected to produce more rice, developing Asia’s major staple crop.
Taken together, food prices in 2012 are projected to decline by 9% from 2011’s levels on improved supply prospects and weak demand growth resulting from slowdowns in emerging and advanced economies. But a pickup in demand in 2013 should lead prices to rebound somewhat.
1.1.1 (continued)
2 Agriculture and food prices
-30
0
30
60
Jan2008
Jul Jan09
Jul Jan10
Jul Jan11
Jul Mar12
Percentage points
Raw materialsFood BeveragesAgriculture
100
200
300
Other foodGrainsFats and oilsFood
Mar12
JulJan11
JulJan10
JulJan09
JulJan2008
2005 = 100
Source: World Bank. Commodity Price Data (Pink Sheet). http://www.worldbank.org (accessed 5 April 2012).
event could squeeze international capital markets and local financial systems, sharply undercutting economic activity.
The biggest shadow: How will the eurozone debt crisis play out?Even with developing Asia’s growing weight in the world economy, the global crisis offered a vivid reminder of the region’s vulnerability to the major industrial economies’ downturns. And just a few years after that crisis, developing Asia now faces another major external threat to its growth—this time from Europe. The sovereign debt crisis afflicting Greece and other eurozone economies is the single biggest downside risk to the current global outlook. If the worst case materializes, is developing Asia in a position to counteract the effects?
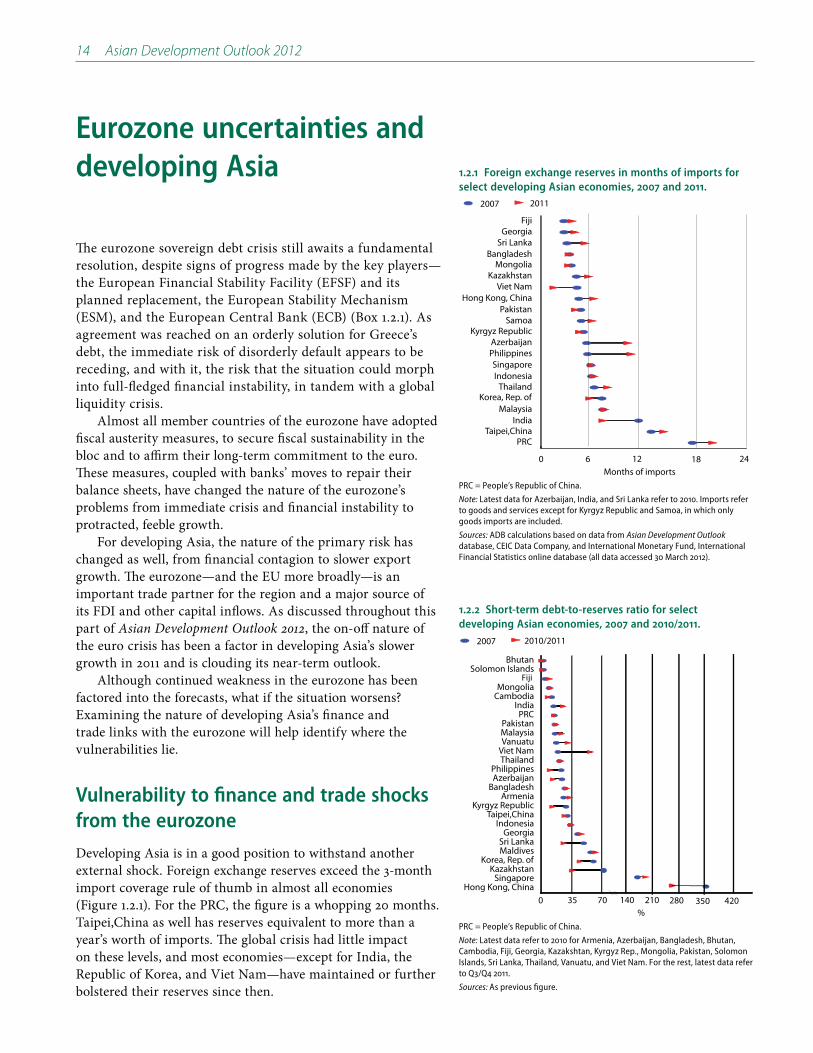
14 Asian Development Outlook 2012
Eurozone uncertainties and developing Asia
The eurozone sovereign debt crisis still awaits a fundamental resolution, despite signs of progress made by the key players—the European Financial Stability Facility (EFSF) and its planned replacement, the European Stability Mechanism (ESM), and the European Central Bank (ECB) (Box 1.2.1). As agreement was reached on an orderly solution for Greece’s debt, the immediate risk of disorderly default appears to be receding, and with it, the risk that the situation could morph into full-fledged financial instability, in tandem with a global liquidity crisis.
Almost all member countries of the eurozone have adopted fiscal austerity measures, to secure fiscal sustainability in the bloc and to affirm their long-term commitment to the euro. These measures, coupled with banks’ moves to repair their balance sheets, have changed the nature of the eurozone’s problems from immediate crisis and financial instability to protracted, feeble growth.
For developing Asia, the nature of the primary risk has changed as well, from financial contagion to slower export growth. The eurozone—and the EU more broadly—is an important trade partner for the region and a major source of its FDI and other capital inflows. As discussed throughout this part of Asian Development Outlook 2012, the on-off nature of the euro crisis has been a factor in developing Asia’s slower growth in 2011 and is clouding its near-term outlook.
Although continued weakness in the eurozone has been factored into the forecasts, what if the situation worsens? Examining the nature of developing Asia’s finance and trade links with the eurozone will help identify where the vulnerabilities lie.
Vulnerability to finance and trade shocks from the eurozone
Developing Asia is in a good position to withstand another external shock. Foreign exchange reserves exceed the 3-month import coverage rule of thumb in almost all economies (Figure 1.2.1). For the PRC, the figure is a whopping 20 months. Taipei,China as well has reserves equivalent to more than a year’s worth of imports. The global crisis had little impact on these levels, and most economies—except for India, the Republic of Korea, and Viet Nam—have maintained or further bolstered their reserves since then.
1.2.1 Foreign exchange reserves in months of imports for select developing Asian economies, 2007 and 2011.
0 6 12 18 24
FijiGeorgia
Sri LankaBangladesh
MongoliaKazakhstan
Viet NamHong Kong, China
PakistanSamoa
Kyrgyz RepublicAzerbaijanPhilippinesSingaporeIndonesia
ThailandKorea, Rep. of
MalaysiaIndia
Taipei,ChinaPRC
Months of imports
2007 2011
PRC = People’s Republic of China.
Note: Latest data for Azerbaijan, India, and Sri Lanka refer to 2010. Imports refer to goods and services except for Kyrgyz Republic and Samoa, in which only goods imports are included.
Sources: ADB calculations based on data from Asian Development Outlook database, CEIC Data Company, and International Monetary Fund, International Financial Statistics online database (all data accessed 3o March 2012).
1.2.2 Short-term debt-to-reserves ratio for select developing Asian economies, 2007 and 2010/2011.
0 35 70
BhutanSolomon Islands
FijiMongolia
CambodiaIndia
PRCPakistanMalaysiaVanuatu
Viet NamThailand
PhilippinesAzerbaijan
BangladeshArmenia
Kyrgyz RepublicTaipei,China
IndonesiaGeorgia
Sri LankaMaldives
Korea, Rep. ofKazakhstan
SingaporeHong Kong, China
%140 210 280 350 420
2007 2010/2011
PRC = People’s Republic of China.
Note: Latest data refer to 2010 for Armenia, Azerbaijan, Bangladesh, Bhutan, Cambodia, Fiji, Georgia, Kazakshtan, Kyrgyz Rep., Mongolia, Pakistan, Solomon Islands, Sri Lanka, Thailand, Vanuatu, and Viet Nam. For the rest, latest data refer to Q3/Q4 2011.
Sources: As previous figure.

Maintaining growth in an uncertain world 15
External debt indicators in developing Asia are also quite low (Figure 1.2.2). For most economies, short-term debt is less than 30% of foreign exchange reserves, and as low as 11% in the Philippines and 16% in the PRC. The exceptions are Hong Kong, China (250%) and Singapore (200%)—the region’s global financial hubs—as well as the Republic of Korea (46%) and Viet Nam (58%). Similarly, other than the two financial centers, external debt is low as a share of GDP (Figure 1.2.3). Further, the ratios of both short-term external debt to reserves and of external debt to GDP have fallen in several countries from their precrisis levels in 2007. The low external debt exposure—particularly short-term debt—shows that the region is well placed to see out a temporary credit crunch.
Looking at some standard indicators of banking soundness, developing Asia’s commercial banks—the largest component of its finance sector—are generally strong. Risk-weighted capital-adequacy ratios ranged from 11.8% in PRC to 20.4% in Armenia (Figure 1.2.4) (versus an average of 15.5% in the US and 17–18% in Brazil and the Russian Federation). The region’s banks also generally have low rates of nonperforming loans. In Hong Kong, China and Taipei,China, less than 1% of loans are nonperforming (Figure 1.2.5). The average for the region is about 4%, similar to levels in the US.
Yet the 2008–2009 global crisis demonstrated that a strong enough shock emanating from the major industrial countries can still have heavy consequences for developing Asia’s stability.
1.2.3 External debt-to-GDP ratio for select developing Asian economies, 2007 and 2011
0 35 70
TurkmenistanFiji
AzerbaijanPRC
IndiaArmenia
PNGGeorgia
AfghanistanTaipei,China
FSMSolomon Islands
PakistanBangladesh
CambodiaThailandMalaysia
Korea, Rep. ofNepal
TajikistanPalau
SamoaIndonesia
PhilippinesTuvalu
Kyrgyz RepublicLao PDR
SingaporeHong Kong, China
%140 210 280 350 420
2007 2011
PRC = People’s Republic of China; FSM = Federated States of Micronesia; PNG = Papua New Guinea.
Source: Asian Development Outlook database.
1.2.4 Risk-weighted capital adequacy ratio for select developing Asian economies, 2011
0 7 14 21Japan
GermanyCanada
United KingdomUnited States
France
BrazilRussian Federation
MexicoEgypt
South Africa
ArmeniaKazakhstan
SingaporeIndonesia
PhilippinesGeorgia
MalaysiaHong Kong, China
ThailandKorea, Rep. of
PakistanIndia
BhutanPRC
%
Developing Asia
Other developing countries
Industrial countries
PRC = People’s Republic of China.
Note: Latest data for France, Egypt, India, Japan, and United Kingdom refer to 2010 (various months).
Source: International Monetary Fund, Financial Soundness Indicators, September 2011.
1.2.5 Bank nonperforming loans to total loans for select developing Asian economies, 2011
0 4 8 12 16United States
FranceUnited Kingdom
JapanCanada
EgyptRussian Federation
South AfricaBrazil
Mexico
PakistanGeorgiaBhutan
ArmeniaPhilippines
ThailandMalaysia
IndonesiaIndia
Korea, Rep. ofSingapore
PRCHong Kong, China
Taipei,China
%
Developing Asia
Other developing countries
Industrial countries
PRC = People’s Republic of China.
Note: Latest data for Egypt, France, India, Japan, Rep. of Korea, Philippines, Singapore, and United Kingdom refer to 2010 (various months).
Sources: CEIC Data Company (accessed 20 March 2012); International Monetary Fund, Financial Soundness Indicators, September 2011.

16 Asian Development Outlook 2012
The eurozone sovereign debt crisis was a constant theme in 2011, keeping global financial markets on edge. High-level meetings among European policy makers, and with their US counterparts and IMF representatives, were all too frequent, but the markets usually felt the outcomes were inadequate, as reflected in rising bond yield spreads (Box figure 1). Whenever fears about a Greek default or a contagion to Spain or Italy intensified, European policy makers were forced to embrace increasingly bold measures.
By the beginning of 2012, Greek government debt had been restructured successfully and the European banking system granted enough liquidity to weather additional market turmoil and to satisfy the refinancing needs of the large and vulnerable Spanish and Italian economies.
In addition, the European Financial Stability Facility (EFSF) has been strengthened, and fiscal austerity measures are to be implemented to help guarantee the euro’s long-term sustainability. Starting mid-2012, the EFSF will be replaced
1.2.1 Palliatives not permanence for the eurozone crisis
If, in this instance, the eurozone crisis were to worsen, with a consequent tightening in global credit conditions, there could be knock-on effects to the region’s banking system, but the impact may be moderate. As has already occurred to some extent, eurozone banks would further cut bank lending abroad to repair balance sheets back home. This could affect developing Asia because eurozone is an important source of its foreign bank loans: its borrowings from
equivalent to 14% of the region’s total foreign bank financing, though the impact would also depend on how much an economy relies on external borrowing (Table 1.2.1).
East Asia, South Asia, and Southeast Asia get about 12–17% of their total foreign bank borrowings from eurozone banks, Central Asia and the Pacific around 50%. Just five economies—the PRC; Hong Kong, China;
Bond yield spreads and key events in the eurozone crisis
0
5
10
15
20
0
10
20
30
40
SpainPortugalItaly Greece
MarJan12
OctJulAprJan2011
Eurozone finance ministers set up a permanent bailout fund, ESM
ECB and IMF approve €78bn bailout for Portugal
EU approves latest tranche of Greek loan, worth €12bn
ECB announces it will buyItalian and Spanishgovernment bonds
First 3-year LTRO allotted €489bn to 523 bidders
"Fiscal pact" agreed by EU in December signed
Government secures private sector involvement in debt writedown
ECB = European Central Bank; EFSF = European Financial Stability Facility; ESM = European Stability Mechanism; EU = European Union; IMF = International Monetary Fund; LTRO = long-term refinancing operation.
Note: Government bond spread is the difference between the government bond yield and that of Germany.
Source: Bloomberg (accessed 2 April 2012); BBC News. http://www.bbc.co.uk (accessed 31 March 2012); The Institute of International Finance, Inc. 2012. Euro Briefing. January and February; Athens News. http://www.athensnews.gr/portal/1/53964 (accessed 3 April 2012).
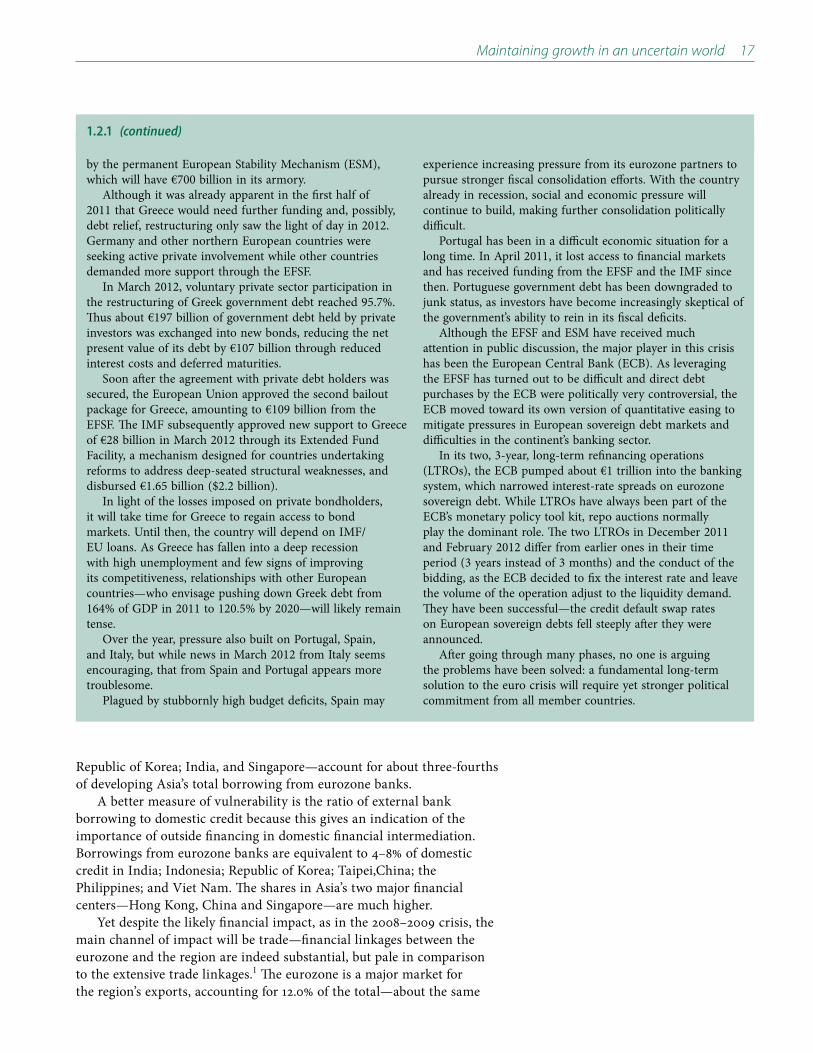
Maintaining growth in an uncertain world 17
by the permanent European Stability Mechanism (ESM), which will have €700 billion in its armory.
Although it was already apparent in the first half of 2011 that Greece would need further funding and, possibly, debt relief, restructuring only saw the light of day in 2012. Germany and other northern European countries were seeking active private involvement while other countries demanded more support through the EFSF.
In March 2012, voluntary private sector participation in the restructuring of Greek government debt reached 95.7%. Thus about €197 billion of government debt held by private investors was exchanged into new bonds, reducing the net present value of its debt by €107 billion through reduced interest costs and deferred maturities.
Soon after the agreement with private debt holders was secured, the European Union approved the second bailout package for Greece, amounting to €109 billion from the EFSF. The IMF subsequently approved new support to Greece of €28 billion in March 2012 through its Extended Fund Facility, a mechanism designed for countries undertaking reforms to address deep-seated structural weaknesses, and disbursed €1.65 billion ($2.2 billion).
In light of the losses imposed on private bondholders, it will take time for Greece to regain access to bond markets. Until then, the country will depend on IMF/EU loans. As Greece has fallen into a deep recession with high unemployment and few signs of improving its competitiveness, relationships with other European countries—who envisage pushing down Greek debt from 164% of GDP in 2011 to 120.5% by 2020—will likely remain tense.
Over the year, pressure also built on Portugal, Spain, and Italy, but while news in March 2012 from Italy seems encouraging, that from Spain and Portugal appears more troublesome.
Plagued by stubbornly high budget deficits, Spain may
experience increasing pressure from its eurozone partners to pursue stronger fiscal consolidation efforts. With the country already in recession, social and economic pressure will continue to build, making further consolidation politically difficult.
Portugal has been in a difficult economic situation for a long time. In April 2011, it lost access to financial markets and has received funding from the EFSF and the IMF since then. Portuguese government debt has been downgraded to junk status, as investors have become increasingly skeptical of the government’s ability to rein in its fiscal deficits.
Although the EFSF and ESM have received much attention in public discussion, the major player in this crisis has been the European Central Bank (ECB). As leveraging the EFSF has turned out to be difficult and direct debt purchases by the ECB were politically very controversial, the ECB moved toward its own version of quantitative easing to mitigate pressures in European sovereign debt markets and difficulties in the continent’s banking sector.
In its two, 3-year, long-term refinancing operations (LTROs), the ECB pumped about €1 trillion into the banking system, which narrowed interest-rate spreads on eurozone sovereign debt. While LTROs have always been part of the ECB’s monetary policy tool kit, repo auctions normally play the dominant role. The two LTROs in December 2011 and February 2012 differ from earlier ones in their time period (3 years instead of 3 months) and the conduct of the bidding, as the ECB decided to fix the interest rate and leave the volume of the operation adjust to the liquidity demand. They have been successful—the credit default swap rates on European sovereign debts fell steeply after they were announced.
After going through many phases, no one is arguing the problems have been solved: a fundamental long-term solution to the euro crisis will require yet stronger political commitment from all member countries.
1.2.1 (continued)
Republic of Korea; India, and Singapore—account for about three-fourths of developing Asia’s total borrowing from eurozone banks.
A better measure of vulnerability is the ratio of external bank borrowing to domestic credit because this gives an indication of the importance of outside financing in domestic financial intermediation. Borrowings from eurozone banks are equivalent to 4–8% of domestic credit in India; Indonesia; Republic of Korea; Taipei,China; the Philippines; and Viet Nam. The shares in Asia’s two major financial centers—Hong Kong, China and Singapore—are much higher.
Yet despite the likely financial impact, as in the 2008–2009 crisis, the main channel of impact will be trade—financial linkages between the eurozone and the region are indeed substantial, but pale in comparison to the extensive trade linkages.1 The eurozone is a major market for the region’s exports, accounting for 12.0% of the total—about the same

18 Asian Development Outlook 2012
share as the US (12.5%). During the global downturn, the synchronized recession of the advanced economies had a pronounced effect on developing Asia’s exports (Figure 1.2.6), pulling back growth (Figure 1.2.7).
Yes, the region is shifting its exports from the major industrial economies: since 2005, developing Asia’s exports to the eurozone and US have declined from about 30% of the total to about 24% in 2011 (up to September). And it is strengthening trade ties with Latin America and Africa—but even combined they still only account for 7.1% of total exports. The contribution of regional demand to export growth, too, has increased, with intraregional trade rising from 39.5% to 42.1% between 2005 and 2011, but a good portion of this is still a reflection of the cross-border production networks rather than final goods. So while there has been a shift toward greater diversification in export destinations, the eurozone is still large enough to do damage to developing Asia.
The ratio of exports to the eurozone to GDP is another marker of developing Asia’s exposure to a recession in the eurozone. The ratio varies greatly across subregions (Figure 1.2.8). Exposure is higher for East and Southeast Asia than it is for the other subregions, reflecting those two subregions’ role as major exporters of manufactured goods. Export exposure to the eurozone (and the US) declined in 2005–2010, pointing to its diminishing vulnerability to a eurozone slowdown.
The industrial composition of exports is another important factor. For example, the exports of East and Southeast Asia, Asia’s traditional manufacturing hubs, are heavily skewed
1.2.1 Developing Asia’s borrowings from eurozone banks, September 2011
Region/Economy Amount ($ billion) Share by each region/economy (%)
Share of borrowings from eurozone in total foreign bank borrowings
Borrowings from eurozone banks as share of domestic credit
Central Asia 13.3 3.0 49.2 -East Asia 228.9 51.9 12.4 -People’s Rep. of China 96.4 21.9 14.1 0.9Hong Kong, China 63.8 14.5 9.8 12.4Korea, Rep. of 44.0 10.0 13.0 4.1Taipei,China 24.7 5.6 14.2 4.1South Asia 60.4 13.7 17.2 -India 57.5 13.0 17.9 4.4Southeast Asia 114.8 26.0 14.3 -Indonesia 18.8 4.3 16.2 6.6Malaysia 10.2 2.3 7.0 3.0Philippines 8.2 1.9 20.7 7.7Singapore 63.6 14.4 16.9 27.4Thailand 7.1 1.6 7.5 1.5Viet Nam 6.4 1.5 26.2 4.6The Pacific 23.5 5.3 49.8 -
Developing Asia 440.9 100.0 14.3 2.9
- = data not available.
Note: Data cover nine eurozone countries (Austria, Belgium, France, Germany, Greece, Italy, Netherlands, Portugal, and Spain) with individual country data on developing Asia. Data for developing Asia in column 5 are based on the 11 economies with data.
Source: ADB calculations based on Table 9b (Consolidated foreign claims, immediate borrower basis), Bank for International Settlements and CEIC Data Company (both accessed 26 March 2012).
1.2.6 Growth of exports of developing Asia
-40
-20
0
20
40
60
WorldUnited StatesJapanEurozoneDeveloping Asia
Q3 Q111
Q3 Q110
Q3 Q109
Q3 Q108
Q3 Q12007
%
Source: ADB calculations based on International Monetary Fund, Direction of Trade Statistics online database (accessed 15 march 2012).
1.2.7 GDP growth, selected developing Asian countries
-10
0
10
20
Thailand
Malaysia
Taipei,ChinaSingapore
Korea, Rep. of Hong Kong, China
Q3Q111
Q3Q110
Q3Q109
Q3Q108
Q3Q12007
%
Source: CEIC Data Company (accessed 15 March 2012).

Maintaining growth in an uncertain world 19
toward manufactured goods (97% and 82%, respectively) and hence more vulnerable to a eurozone recession (Figure 1.2.9). During the global crisis, highly open exporters of manufactured goods—such as the four newly industrialized economies, as well as Malaysia and Thailand—were hit harder than other groups of countries.
The above data show that the eurozone is a key export market for Asia, and will remain so for the near future despite its declining share in recent years. But they also suggest that, as long as the slowdown is confined to the eurozone—and does not become a synchronized advanced-country recession—developing Asia should be able to absorb the impact of lower export demand.
The risk, though, is that the current armistice in the eurozone sovereign debt crisis may be short-lived. If the shock to the eurozone periphery were to spread more broadly through financial markets there and push the eurozone further into recession, the global impacts would be much larger than the Asian Development Outlook’s global baseline assumptions. And if matters in the eurozone worsen to the extent of undermining global recovery, developing Asia’s policy makers will need to be ready to act quickly. Recent history shows that two areas in particular—global value chains and trade finance—interact with an external trade shock to intensify its impact.
Factors intensifying external shocks
Global value chainsThe integration of emerging East and Southeast Asian economies and Japan in global value chains (GVCs)—the division of production processes among multiple firms and countries—helps explain the region’s vulnerability to external demand shocks (Box 1.2.2).2 Under this type of production framework, which predominate the global manufacture of durable goods such as electronics and automobiles, the volume of exports is magnified as components move multiple times across national boundaries before becoming final goods.
Because the import content of durable goods is larger than for nondurable goods and services, the rise of GVCs gives durable goods greater weight as a share of trade than their weight in GDP.3 One estimate shows that durable goods before the 2008–2009 global crisis had grown to almost 40% of trade, but amounted to only 10% of final demand.4 Since consumers tend to first cutback purchases of durables in a recession, the transmission of demand shocks along GVCs can induce a disproportionate drop in trade relative to GDP.
Trade financeTrade finance, broadly speaking, includes various forms of short-term funding to facilitate international trade transactions. The majority of such finance involves transactions between
1.2.8 Export exposure to the eurozone ( of GDP)
0
4
8
12
16
Indirect Direct
102005102005102005102005102005102005
% of GDP
Central Asia The PacificSoutheast Asia
South AsiaEast Asia Developing Asia
Notes: 1. Regional averages are simple averages. Total exposure includes potential reexports—e.g. Malaysia exports parts and components to the PRC, which reexports to the eurozone and US after assembling them. 2. Export exposure is the sum of direct and indirect export exposure of a country to the eurozone. Direct trade exposure is the country’s exports to the eurozone as a share of GDP. Indirect trade exposure comprises the country’s indirect export routes to the eurozone through trade between the eurozone and its trading partners.
Source: ADB calculations based on International Monetary Fund, Direction of Trade Statistics online database (accessed 15 march 2012).
1.2.9 Share of primary and manufactured exports to the eurozone
0
20
40
60
80
100
Primary Manufactured%
Central Asia East Asia South Asia Southeast Asia The PacificSource: ADB calculations based on UN Comtrade online database (accessed 15 march 2012).
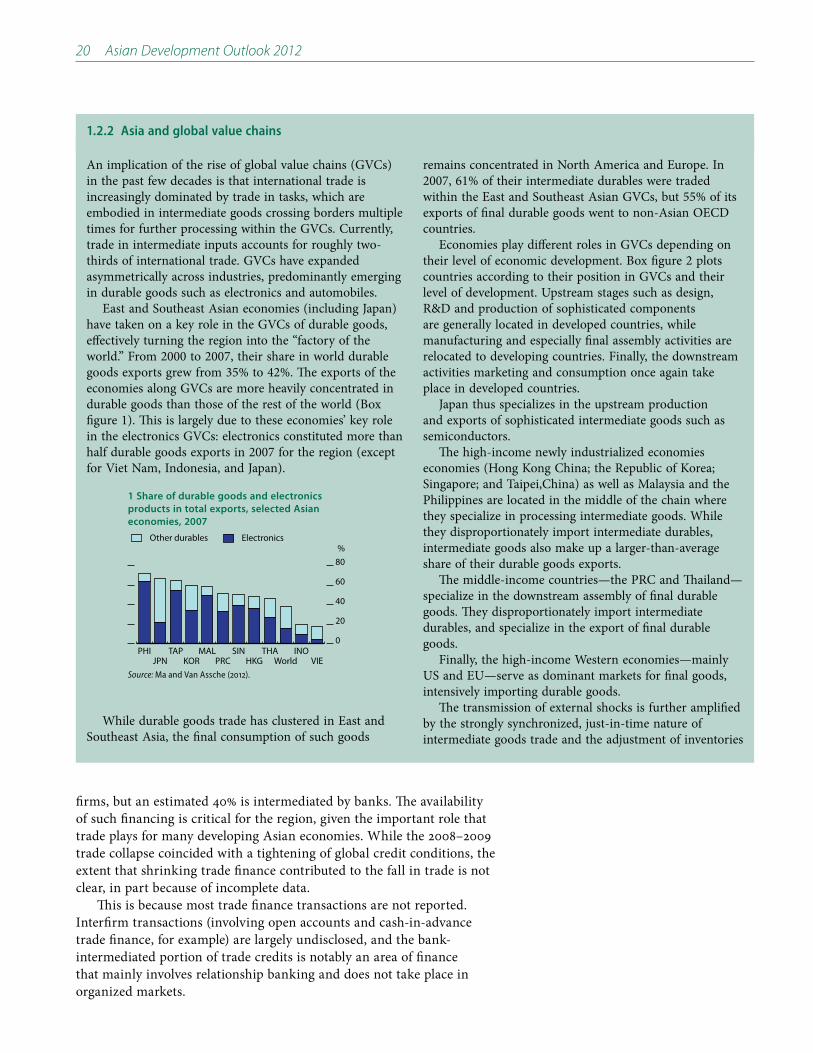
20 Asian Development Outlook 2012
An implication of the rise of global value chains (GVCs) in the past few decades is that international trade is increasingly dominated by trade in tasks, which are embodied in intermediate goods crossing borders multiple times for further processing within the GVCs. Currently, trade in intermediate inputs accounts for roughly two-thirds of international trade. GVCs have expanded asymmetrically across industries, predominantly emerging in durable goods such as electronics and automobiles.
East and Southeast Asian economies (including Japan) have taken on a key role in the GVCs of durable goods, effectively turning the region into the “factory of the world.” From 2000 to 2007, their share in world durable goods exports grew from 35% to 42%. The exports of the economies along GVCs are more heavily concentrated in durable goods than those of the rest of the world (Box figure 1). This is largely due to these economies’ key role in the electronics GVCs: electronics constituted more than half durable goods exports in 2007 for the region (except for Viet Nam, Indonesia, and Japan).
While durable goods trade has clustered in East and Southeast Asia, the final consumption of such goods
remains concentrated in North America and Europe. In 2007, 61% of their intermediate durables were traded within the East and Southeast Asian GVCs, but 55% of its exports of final durable goods went to non-Asian OECD countries.
Economies play different roles in GVCs depending on their level of economic development. Box figure 2 plots countries according to their position in GVCs and their level of development. Upstream stages such as design, R&D and production of sophisticated components are generally located in developed countries, while manufacturing and especially final assembly activities are relocated to developing countries. Finally, the downstream activities marketing and consumption once again take place in developed countries.
Japan thus specializes in the upstream production and exports of sophisticated intermediate goods such as semiconductors.
The high-income newly industrialized economies economies (Hong Kong China; the Republic of Korea; Singapore; and Taipei,China) as well as Malaysia and the Philippines are located in the middle of the chain where they specialize in processing intermediate goods. While they disproportionately import intermediate durables, intermediate goods also make up a larger-than-average share of their durable goods exports.
The middle-income countries—the PRC and Thailand—specialize in the downstream assembly of final durable goods. They disproportionately import intermediate durables, and specialize in the export of final durable goods.
Finally, the high-income Western economies—mainly US and EU—serve as dominant markets for final goods, intensively importing durable goods.
The transmission of external shocks is further amplified by the strongly synchronized, just-in-time nature of intermediate goods trade and the adjustment of inventories
1.2.2 Asia and global value chains
1 Share of durable goods and electronics
products in total exports, selected Asian
economies, 2007
0
20
40
60
80
Other durables Electronics
VIEINO
WorldTHA
HKGSIN
PRCMAL
KORTAP
JPNPHI
%
Source: Ma and Van Assche (2012).
firms, but an estimated 40% is intermediated by banks. The availability of such financing is critical for the region, given the important role that trade plays for many developing Asian economies. While the 2008–2009 trade collapse coincided with a tightening of global credit conditions, the extent that shrinking trade finance contributed to the fall in trade is not clear, in part because of incomplete data.
This is because most trade finance transactions are not reported. Interfirm transactions (involving open accounts and cash-in-advance trade finance, for example) are largely undisclosed, and the bank-intermediated portion of trade credits is notably an area of finance that mainly involves relationship banking and does not take place in organized markets.
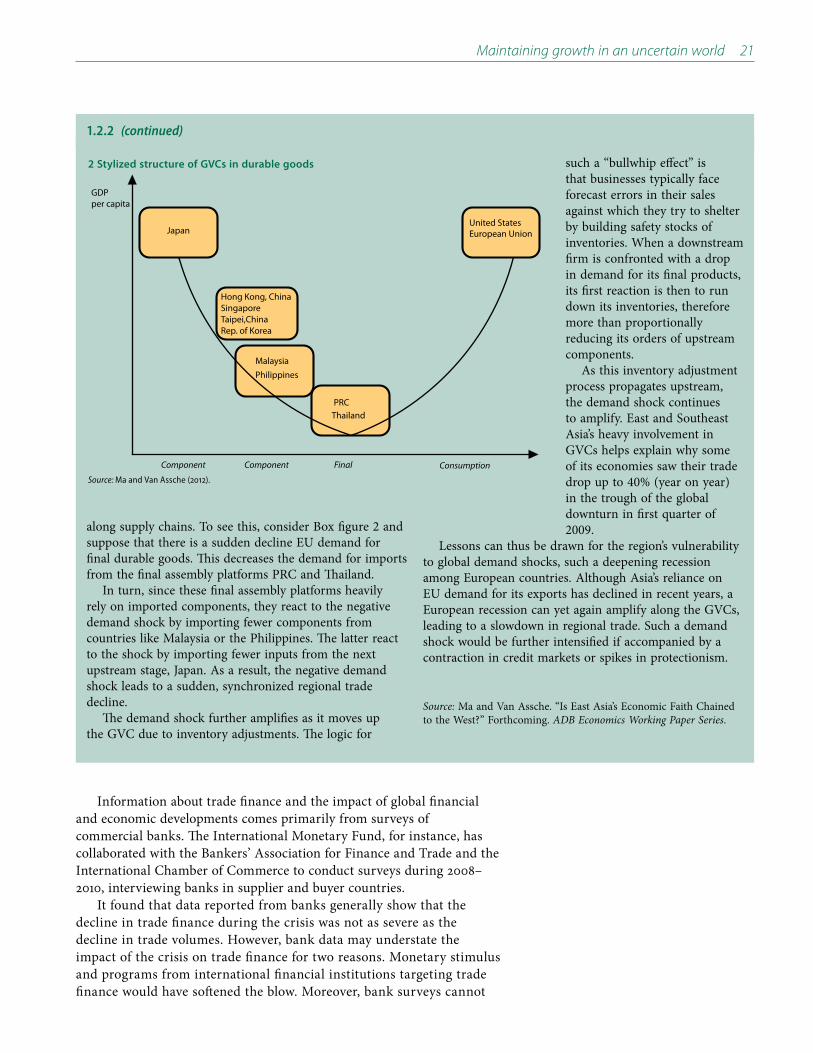
Maintaining growth in an uncertain world 21
along supply chains. To see this, consider Box figure 2 and suppose that there is a sudden decline EU demand for final durable goods. This decreases the demand for imports from the final assembly platforms PRC and Thailand.
In turn, since these final assembly platforms heavily rely on imported components, they react to the negative demand shock by importing fewer components from countries like Malaysia or the Philippines. The latter react to the shock by importing fewer inputs from the next upstream stage, Japan. As a result, the negative demand shock leads to a sudden, synchronized regional trade decline.
The demand shock further amplifies as it moves up the GVC due to inventory adjustments. The logic for
such a “bullwhip effect” is that businesses typically face forecast errors in their sales against which they try to shelter by building safety stocks of inventories. When a downstream firm is confronted with a drop in demand for its final products, its first reaction is then to run down its inventories, therefore more than proportionally reducing its orders of upstream components.
As this inventory adjustment process propagates upstream, the demand shock continues to amplify. East and Southeast Asia’s heavy involvement in GVCs helps explain why some of its economies saw their trade drop up to 40% (year on year) in the trough of the global downturn in first quarter of 2009.
Lessons can thus be drawn for the region’s vulnerability to global demand shocks, such a deepening recession among European countries. Although Asia’s reliance on EU demand for its exports has declined in recent years, a European recession can yet again amplify along the GVCs, leading to a slowdown in regional trade. Such a demand shock would be further intensified if accompanied by a contraction in credit markets or spikes in protectionism.
Source: Ma and Van Assche. “Is East Asia’s Economic Faith Chained to the West?” Forthcoming. ADB Economics Working Paper Series.
1.2.2 (continued)
2 Stylized structure of GVCs in durable goods
GDP per capita
Component d
Component Final bl
Consumption
Japan
Hong Kong, ChinaSingaporeTaipei,ChinaRep. of Korea
MalaysiaPhilippines
PRCThailand
United StatesEuropean Union
Source: Ma and Van Assche (2012).
Information about trade finance and the impact of global financial and economic developments comes primarily from surveys of commercial banks. The International Monetary Fund, for instance, has collaborated with the Bankers’ Association for Finance and Trade and the International Chamber of Commerce to conduct surveys during 2008–2010, interviewing banks in supplier and buyer countries.
It found that data reported from banks generally show that the decline in trade finance during the crisis was not as severe as the decline in trade volumes. However, bank data may understate the impact of the crisis on trade finance for two reasons. Monetary stimulus and programs from international financial institutions targeting trade finance would have softened the blow. Moreover, bank surveys cannot

22 Asian Development Outlook 2012
show the impact on interfirm trade finance transactions since they do not cover this segment.
Other data on the importance of trade finance come from surveys of businesses, such as two World Bank surveys, also carried out in 2008–2010, in 14 developing countries (two in Asia). The surveys focused on firms’ perceptions.
Firm perception survey results, in contrast to bank survey results, do suggest some important connections. Those interviewed felt that the driving factor behind lower trade levels was the drop in demand during the 2008–2009 global recession rather than an inability to secure financing. But there was an important shift from inter-firm transactions to bank intermediated trade finance as firms tried to shift counter-party risk during that period of heightened uncertainty. Banks themselves adopted stricter risk management and greater client differentiation, raising both collateral requirements and margins. Those firms that were able to get bank financing faced higher pricing margins. This hampered trade by raising transaction costs.
The effect of this squeeze was most pronounced in developing countries. The World Bank surveys found that developing countries’ firms did suffer from constrained trade finance. Firms relying chiefly on inter-firm or self-financed trade credit were most strongly affected by the global drop in trade, the compression of export revenues, the cancellation of orders, as well as payment delays. Firms relying mainly on the banking sector for trade credit were affected by banks’ risk aversion and discrimination. For example, in the Philippines, firms still felt as late of April 2010—when the second of the two surveys was conducted—that eligibility criteria imposed by banks continued to be overly stringent.
Small and medium-sized enterprises were affected more strongly than large ones by the strains to trade finance. These firms faced larger increases in the price of trade finance, due to their weaker capital base to stem against revenues compression, and their disadvantage in bargaining with the larger corporations and banks in the global markets.
Looking ahead, there are several factors that may tighten trade finance conditions in developing Asia. First is the ongoing bank deleveraging in advanced economies. The sharpening of the eurozone crisis in 2011 added pressure on banks to increase their capital, reducing capacity in the market. Consequently, many European banks, traditionally active in supporting trade in Asia, have retrenched, leaving a larger gap for trade finance. The potential impact of reduced lending by eurozone banks is significant, since they are estimated to provide about 30% of total trade finance in the region.
Second, the Basel III accord—as important as it is to help place the global financial system on a more sound footing—has unintended consequences. By treating the cost of capital the same for a high-risk high-margin activity, compared with a relatively low-risk lower-margin activity such as trade finance, Basel III encourages financial institutions toward higher return (and higher risk) lending away from trade finance. This is despite the strong evidence showing that trade finance carries a relatively low probability of default and loss because it is highly collateralized.

Maintaining growth in an uncertain world 23
Finally, for developing economies, trade finance is not just about access to credit, but rather access to international liquidity. Advanced economies can use expansionary monetary policy to provide liquidity to markets in currencies accepted in international transactions. The analogy for developing Asian economies would be to draw down foreign reserves with central banks supplying dollars to local banks through repurchasing agreements, but this could put the exchange rate at risk. Here, the importance of international financial safety nets comes to the fore.
The confluence of these factors may squeeze trade finance availability—especially if the situation in the eurozone were to worsen. Policy makers need to closely monitor trade finance availability, especially for small and medium-sized enterprises.
They need to be ready to act—on a wider field than trade finance—and have the capacity to do so.

24 Asian Development Outlook 2012
1.3.1 What is policy space?
Policy space refers to the scope for using fiscal and monetary policy to counter the effects of shocks to the economic environment. For example, relatively low public debt to GDP ratios allow governments to increase spending and cut taxes without triggering adverse reactions from financial markets about fiscal sustainability.
Likewise, a history of anti-inflationary policies builds credibility and expands the scope for interest rate cuts. Further, the presence of a clearly defined lender of last resort strengthens the effectiveness of monetary policy during a crisis.
1.3.1 Benchmark policy rates, selected Asian economies
0
2
4
6
8
10
PhilippinesMalaysiaIndonesia
Korea, Rep. ofIndiaPRC
Feb12
JulJan11
JulJan10
JulJan09
JulJan2008
%
PRC = People’s Republic of China.
Source: CEIC Data Company (accessed 15 March 2012).
Macro-policy directions for developing Asia
Enough policy space for a major external shockResponding to the global economic downturn in 2008–2009, countries in developing Asia adopted policy stimulus measures, which though effective, absorbed some of the region’s monetary and fiscal policy space (Box 1.3.1) that was earned through earlier prudent macroeconomic management. Many countries reduced their benchmark policy interest rates to record lows and saw their ratio of public debt to GDP spike as they expanded government spending substantially.
As countries started to unwind the stimulus measures in 2010, they began to claw back some of this hard-earned policy space. But, given the global outlook, can developing Asia pursue another round of such measures if the downside risks materialize?
In an attempt to answer this question, it is useful to look in more detail at the earlier measures. Since the crisis eased, regional central banks have tightened their monetary policy stance to stem rising inflationary pressures, most of them due to food price increases. Benchmark policy rates in the region rose in the 2 years to around mid-2011 (Figure 1.3.1), as the crisis in the eurozone slowed global economic activity and inflation pressures moderated in developing Asia. Unlike the advanced economies (with near zero rates), developing Asia now has room to cut rates, although benchmark rates in most economies are still lower than before the downturn, suggesting less room to tighten.
Regional inflation—reflecting normalizing monetary policy and stabilizing global commodity prices—has come down since the last quarter of 2011 (Figure 1.3.2). As discussed much earlier, the risk of such prices, especially for oil, picking up again remains high, however, making possible a reversal of the recent downward trend in headline inflation in developing Asia.

Maintaining growth in an uncertain world 25
The CMIM is an evolution of the framework for providing liquidity support for the ASEAN+3 countries (the 10 ASEAN member countries plus the PRC, Japan, and the Republic of Korea) conceived through the Chiang Mai initiative in 2000. CMIM, which took effect in March 2010, is a US$120 billion multilateral currency swap facility designed to address short-term liquidity difficulties in the region and supplement international financial arrangements.
As a reserve pooling arrangement, CMIM members committed their contribution to the facility but continue to manage their own reserves. Each member is eligible to
access the facility up to a certain approved multiple of its contribution. When a member’s request for a swap facility is approved, each of the contributing members extends its contribution prorated to its commitment.
To support CMIM operations, the ASEAN+3 Macroeconomic Research Office (AMRO) was established in April 2011 to act as the regional surveillance unit of CMIM. AMRO monitors and analyzes regional economies. It also contributes to early detection of risks and swift implementation of remedial actions to ensure for an effective decision-making of the CMIM.
1.3.2 Chiang Mai Initiative Multilateralization
1.3.2 Inflation, selected Asian economies
-5
0
5
10
15
20
Q4Q111
Q3Q110
Q3Q109
Q3Q12008
%PhilippinesMalaysiaIndonesia
Korea, Rep. ofIndiaPRC
PRC = People’s Republic of China.
Source: CEIC Data Company (accessed 15 March 2012).
1.3.3 Fiscal balances, selected Asian economies
%-10 -5 0
5
201120102008−2009
IndiaPakistanMalaysia
Viet NamBangladeshTaipei,China
PhilippinesIndonesia
PRCThailand
SingaporeKorea, Rep. of
Hong Kong, China
PRC = People’s Republic of China.
Source: Asian Development Outlook database.
The region’s monetary authorities have maintained enough foreign exchange reserves to overcome shortages of international liquidity if a major financial shock hits. This is costly as reserves are typically invested in low-interest assets at the same time as governments pay higher rates on their outstanding debt, but uncertainties in Europe and the lack of global financial safety nets have prompted most Asian economies to follow this practice, which also allows for exchange rate management.
Common management of pooled reserves under a regional coordination mechanism would be the best way to use these reserves in combating international liquidity shortages. Thus strengthening the Chiang Mai Initiative Multeralization (CMIM) mechanism as a regional platform—with support from the newly established AMRO for ASEAN+3 for harnessing regional macro and exchange rate policy coordination—could offer substantial returns (Box 1.3.2).
Developing Asia also has enough fiscal space for short-term stimulus if it is hit by a shock. Although fiscal deficits are still fairly high in, for example, India, Malaysia, and Pakistan, fiscal balances of many regional countries remain healthy as they are not likely to lead to increases in public debt to GDP ratios. In the PRC, India, the Republic of Korea, Philippines and Viet Nam, fiscal positions have also improved in 2011 from the previous 3 years as the stimulus put through during the global crisis was unwound (Figure 1.3.3). Public debt-to-GDP ratios are fairly low internationally and are projected to decline even further in the medium term (Box 1.3.3).
No clear case for short-term countercyclical policy
The agreements reached on an orderly workout of Greece’s debt removed the immediate risk of a disorderly default that could lead to a new global liquidity crisis. As a result, investors’ risk appetite and confidence toward the region has generally improved. Since escalating in October 2011 sovereign spreads have declined. This
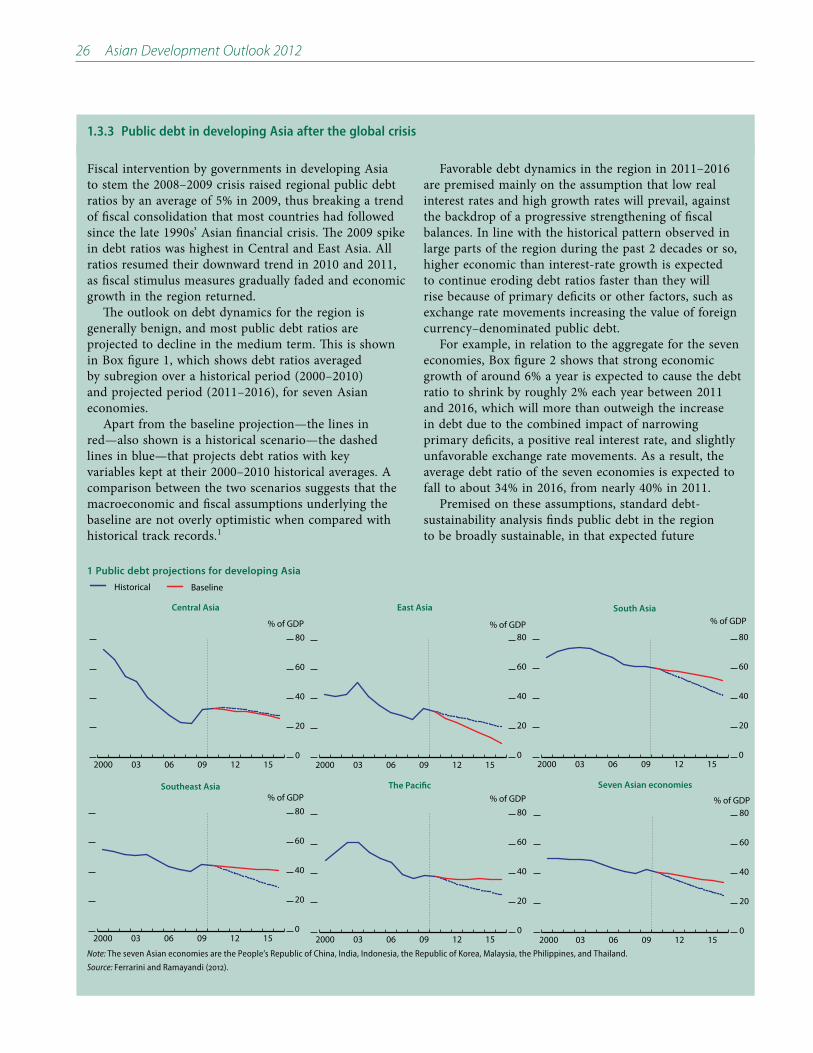
26 Asian Development Outlook 2012
Fiscal intervention by governments in developing Asia to stem the 2008–2009 crisis raised regional public debt ratios by an average of 5% in 2009, thus breaking a trend of fiscal consolidation that most countries had followed since the late 1990s’ Asian financial crisis. The 2009 spike in debt ratios was highest in Central and East Asia. All ratios resumed their downward trend in 2010 and 2011, as fiscal stimulus measures gradually faded and economic growth in the region returned.
The outlook on debt dynamics for the region is generally benign, and most public debt ratios are projected to decline in the medium term. This is shown in Box figure 1, which shows debt ratios averaged by subregion over a historical period (2000–2010) and projected period (2011–2016), for seven Asian economies.
Apart from the baseline projection—the lines in red—also shown is a historical scenario—the dashed lines in blue—that projects debt ratios with key variables kept at their 2000–2010 historical averages. A comparison between the two scenarios suggests that the macroeconomic and fiscal assumptions underlying the baseline are not overly optimistic when compared with historical track records.1
Favorable debt dynamics in the region in 2011–2016 are premised mainly on the assumption that low real interest rates and high growth rates will prevail, against the backdrop of a progressive strengthening of fiscal balances. In line with the historical pattern observed in large parts of the region during the past 2 decades or so, higher economic than interest-rate growth is expected to continue eroding debt ratios faster than they will rise because of primary deficits or other factors, such as exchange rate movements increasing the value of foreign currency–denominated public debt.
For example, in relation to the aggregate for the seven economies, Box figure 2 shows that strong economic growth of around 6% a year is expected to cause the debt ratio to shrink by roughly 2% each year between 2011 and 2016, which will more than outweigh the increase in debt due to the combined impact of narrowing primary deficits, a positive real interest rate, and slightly unfavorable exchange rate movements. As a result, the average debt ratio of the seven economies is expected to fall to about 34% in 2016, from nearly 40% in 2011.
Premised on these assumptions, standard debt-sustainability analysis finds public debt in the region to be broadly sustainable, in that expected future
1.3.3 Public debt in developing Asia after the global crisis
1 Public debt projections for developing Asia
Historical Baseline
0
20
40
60
80
15 12 09 06 03 2000
Central Asia
% of GDP
0
20
40
60
80
15 12 09 06 03 2000
East Asia
% of GDP
0
20
40
60
80
15 12 09 06 03 2000
South Asia
% of GDP
0
20
40
60
80
15 12 09 06 03 2000
Southeast Asia
% of GDP
0
20
40
60
80
15 12 09 06 03 2000
The Pacific
% of GDP
0
20
40
60
80
15 12 09 06 03 2000
Seven Asian economies
% of GDP
Note: The seven Asian economies are the People’s Republic of China, India, Indonesia, the Republic of Korea, Malaysia, the Philippines, and Thailand.
Source: Ferrarini and Ramayandi (2012).
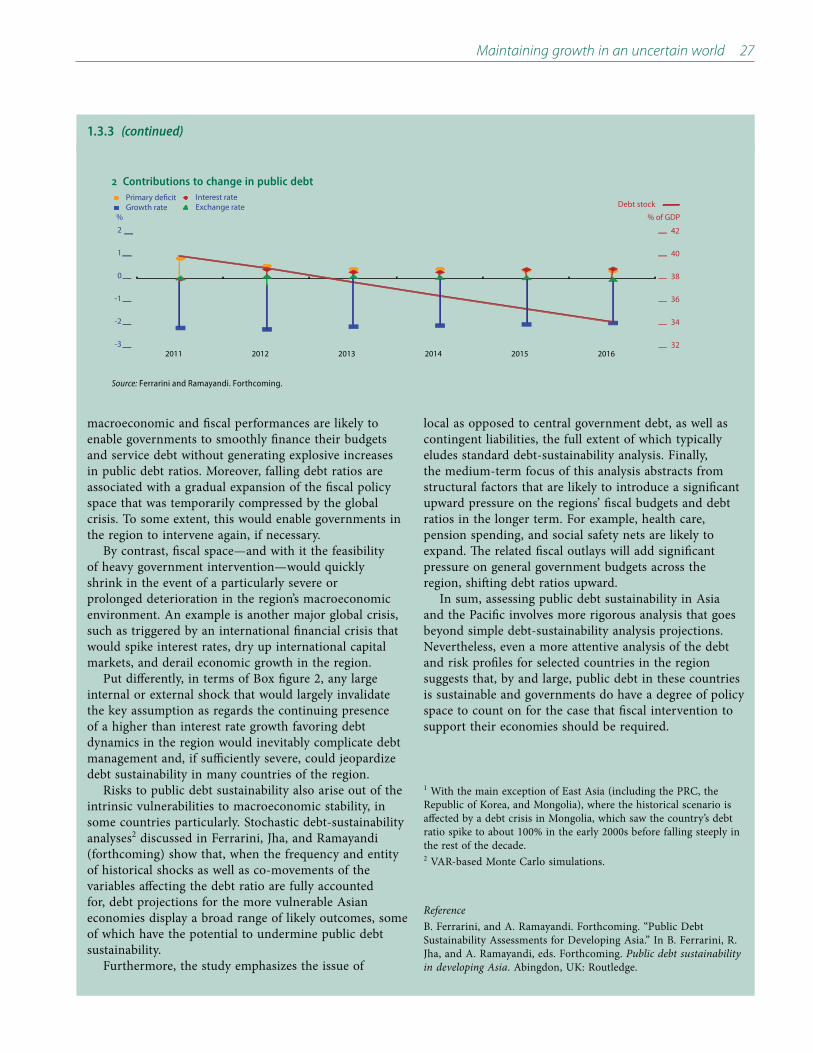
Maintaining growth in an uncertain world 27
macroeconomic and fiscal performances are likely to enable governments to smoothly finance their budgets and service debt without generating explosive increases in public debt ratios. Moreover, falling debt ratios are associated with a gradual expansion of the fiscal policy space that was temporarily compressed by the global crisis. To some extent, this would enable governments in the region to intervene again, if necessary.
By contrast, fiscal space—and with it the feasibility of heavy government intervention—would quickly shrink in the event of a particularly severe or prolonged deterioration in the region’s macroeconomic environment. An example is another major global crisis, such as triggered by an international financial crisis that would spike interest rates, dry up international capital markets, and derail economic growth in the region.
Put differently, in terms of Box figure 2, any large internal or external shock that would largely invalidate the key assumption as regards the continuing presence of a higher than interest rate growth favoring debt dynamics in the region would inevitably complicate debt management and, if sufficiently severe, could jeopardize debt sustainability in many countries of the region.
Risks to public debt sustainability also arise out of the intrinsic vulnerabilities to macroeconomic stability, in some countries particularly. Stochastic debt-sustainability analyses2 discussed in Ferrarini, Jha, and Ramayandi (forthcoming) show that, when the frequency and entity of historical shocks as well as co-movements of the variables affecting the debt ratio are fully accounted for, debt projections for the more vulnerable Asian economies display a broad range of likely outcomes, some of which have the potential to undermine public debt sustainability.
Furthermore, the study emphasizes the issue of
local as opposed to central government debt, as well as contingent liabilities, the full extent of which typically eludes standard debt-sustainability analysis. Finally, the medium-term focus of this analysis abstracts from structural factors that are likely to introduce a significant upward pressure on the regions’ fiscal budgets and debt ratios in the longer term. For example, health care, pension spending, and social safety nets are likely to expand. The related fiscal outlays will add significant pressure on general government budgets across the region, shifting debt ratios upward.
In sum, assessing public debt sustainability in Asia and the Pacific involves more rigorous analysis that goes beyond simple debt-sustainability analysis projections. Nevertheless, even a more attentive analysis of the debt and risk profiles for selected countries in the region suggests that, by and large, public debt in these countries is sustainable and governments do have a degree of policy space to count on for the case that fiscal intervention to support their economies should be required.
1 With the main exception of East Asia (including the PRC, the Republic of Korea, and Mongolia), where the historical scenario is affected by a debt crisis in Mongolia, which saw the country’s debt ratio spike to about 100% in the early 2000s before falling steeply in the rest of the decade.2 VAR-based Monte Carlo simulations.
ReferenceB. Ferrarini, and A. Ramayandi. Forthcoming. “Public Debt Sustainability Assessments for Developing Asia.” In B. Ferrarini, R. Jha, and A. Ramayandi, eds. Forthcoming. Public debt sustainability in developing Asia. Abingdon, UK: Routledge.
1.3.3 (continued)
2 Contributions to change in public debt
32
34
36
38
40
42
-3
-2
-1
0
1
2
2011 2012 2013 2014 2015 2016
% of GDP%
Primary deficit Interest rate Growth rate Exchange rate Debt stock
Source: Ferrarini and Ramayandi. Forthcoming.

28 Asian Development Outlook 2012
1.3.4 Output gap, selected Asian economies
-4
-2
0
2
4
13121110090807062005
%
Forecast
PhilippinesMalaysiaIndonesia
Korea, Rep. ofIndiaPRC
Source: Staff estimates
1.3.5 Output gap, major industrial economies
-6
-3
0
3
6
United StatesEurozoneJapan
13121110090807062005Forecast
%
Source: OECD Economic Outlook November 2011.
1.3.6 Real interest rates, selected Asian economies
-14
-7
0
7
Viet NamMalaysiaIndonesia
Korea, Rep. ofIndiaPRC
Q4Q111
Q3Q110
Q3Q109
Q3Q12008
%
Source: Staff estimates
improvement in investor sentiment could soon be followed by another stream of volatile capital inflows to the region, which was one of the factors behind the rise in inflation during the recovery, as it flooded the region with additional liquidity.
While the slowdown in Europe is putting a brake on economic growth in Asian economies, the extent seems to be manageable. Except for Thailand, which is still recovering after the floods late last year, actual output levels in the region do not appear to be substantially below trend (Figure 1.3.4). This suggests that the region’s economies are still operating around their potential output levels and are expected to continue doing so in the medium run—unlike the major industrial economies (Figure 1.3.5).
Although there is no clear case for developing Asia to deploy aggressive countercyclical policy, there may still be a need for policy intervention. The region accounts for a large and growing share of the world’s economic activity, thus such intervention may help to ensure the continuation of strong domestic demand, which in turn will also contribute positively to the global economic recovery.
The role of monetary policy for maintaining the growth momentum seems to be more limited than that of fiscal policy. The overall stance of monetary policy in the region is still fairly accommodative. Real interest rates are still very low—slightly below zero in most cases or even highly negative (Viet Nam) (Figure 1.3.6). The slowdown in food price inflation has helped cool the headline rate, but core inflation has not slowed as much, suggesting that price pressures remain. Finally, credit in the region, although moderating slightly, continues to grow strongly, at a two-digit rate in most cases.
Looking to the longer termThe smaller GDP gaps, relatively low real interest rates and high credit expansion, as well as persistent core inflation in Asia suggest that pressures for inflation originating from aggregate demand are still persistent. Recent improvement in the investor sentiment also entails the potential for another stream of capital inflows to the region, which in turn adds pressure for aggregate demand to increase. In tandem with the risk of elevating price of oil in the international markets, and the absence of further shock to the global environment, there may be resumption for inflationary pressures to the region.
If inflationary pressures build again and capital inflows resume, there may be a need to readjust monetary policy to maintain price stability. But until that happens (if indeed it does), the region’s monetary authorities should fine tune their policy stance while keeping focused on stabilizing inflation expectations.
To shield against the highly volatile nature of capital flows, Asia needs to be ready with measures to fend off large and rapid fluctuations
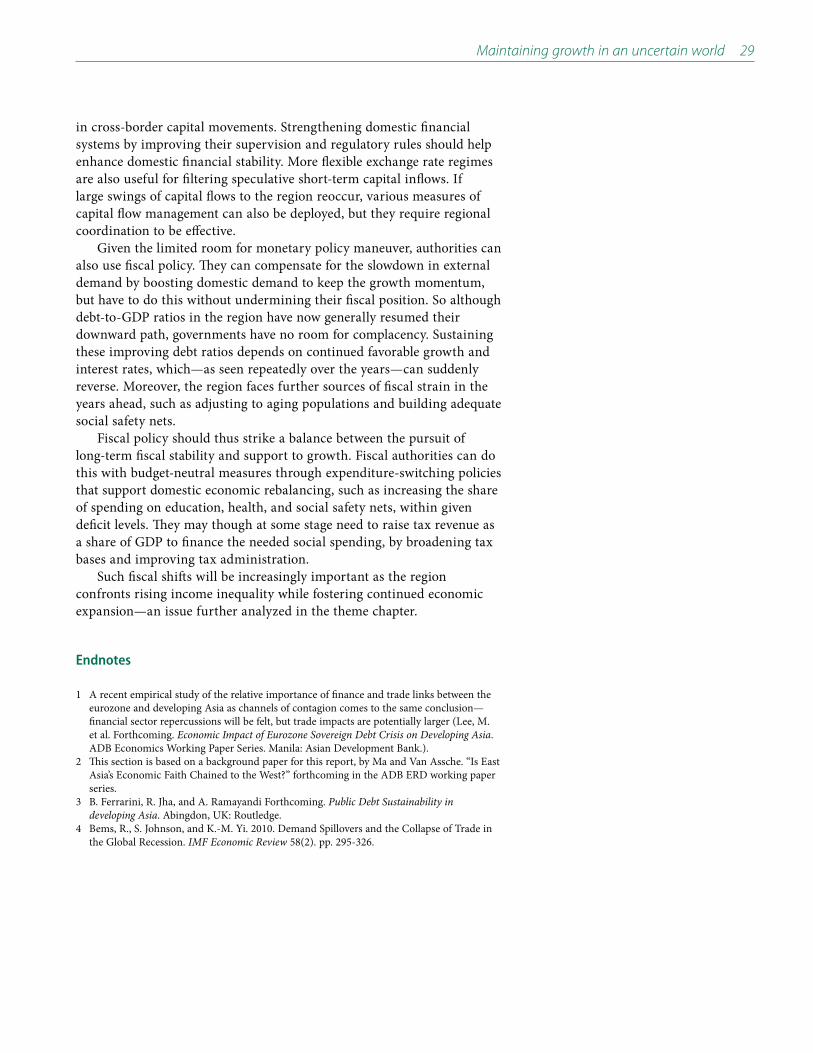
Maintaining growth in an uncertain world 29
in cross-border capital movements. Strengthening domestic financial systems by improving their supervision and regulatory rules should help enhance domestic financial stability. More flexible exchange rate regimes are also useful for filtering speculative short-term capital inflows. If large swings of capital flows to the region reoccur, various measures of capital flow management can also be deployed, but they require regional coordination to be effective.
Given the limited room for monetary policy maneuver, authorities can also use fiscal policy. They can compensate for the slowdown in external demand by boosting domestic demand to keep the growth momentum, but have to do this without undermining their fiscal position. So although debt-to-GDP ratios in the region have now generally resumed their downward path, governments have no room for complacency. Sustaining these improving debt ratios depends on continued favorable growth and interest rates, which—as seen repeatedly over the years—can suddenly reverse. Moreover, the region faces further sources of fiscal strain in the years ahead, such as adjusting to aging populations and building adequate social safety nets.
Fiscal policy should thus strike a balance between the pursuit of long-term fiscal stability and support to growth. Fiscal authorities can do this with budget-neutral measures through expenditure-switching policies that support domestic economic rebalancing, such as increasing the share of spending on education, health, and social safety nets, within given deficit levels. They may though at some stage need to raise tax revenue as a share of GDP to finance the needed social spending, by broadening tax bases and improving tax administration.
Such fiscal shifts will be increasingly important as the region confronts rising income inequality while fostering continued economic expansion—an issue further analyzed in the theme chapter.
Endnotes
1 A recent empirical study of the relative importance of finance and trade links between the eurozone and developing Asia as channels of contagion comes to the same conclusion—financial sector repercussions will be felt, but trade impacts are potentially larger (Lee, M. et al. Forthcoming. Economic Impact of Eurozone Sovereign Debt Crisis on Developing Asia. ADB Economics Working Paper Series. Manila: Asian Development Bank.).
2 This section is based on a background paper for this report, by Ma and Van Assche. “Is East Asia’s Economic Faith Chained to the West?” forthcoming in the ADB ERD working paper series.
3 B. Ferrarini, R. Jha, and A. Ramayandi Forthcoming. Public Debt Sustainability in developing Asia. Abingdon, UK: Routledge.
4 Bems, R., S. Johnson, and K.-M. Yi. 2010. Demand Spillovers and the Collapse of Trade in the Global Recession. IMF Economic Review 58(2). pp. 295-326.

30 Asian Development Outlook 2012
A1.1.1 Business activities and consumer confidence indicators, United States
20
50
80
110
Consumer confidence index Retail sales Industrial production
Feb12
Jul Jan11
JulJan10
JulJan09
JulJan08
JulJan2007
Index, 2007 = 100
Source: CEIC Data Company (accessed 27 March 2012).
A1.1.2 Contributions to GDP growth, United States
-10
-5
0
5
10
Q12009
Q2 Q3 Q4 Q110
Q2 Q3 Q4 Q111
Q2 Q3 Q4
Percentage points, seasonally adjusted annualized rate
Personal consumption GDPGovernment consumption Gross fixed capital formationNet exports Change in stocks
Source: US Department of Commerce. Bureau of Economic Analysis. http://www.bea.gov (accessed 28 March 2012).
Annex: The external environment
Continuing the pattern of 2011, developments in the major industrial economies of the United States (US), eurozone, and Japan will hold back global economic activity over the next 2 years. In particular, the eurozone is expected to see renewed recession in 2012. Under the baseline assumptions, growth of the industrial economies is expected to edge even lower from its already slow 2011 rate of 1.2% to 1.1% in 2012 before picking up a shade to 1.7% in 2013. Against this dim global economic backdrop, world merchandise export growth is expected to slow to 3.8% in 2012 before recovering in 2013 (see Table 1.1.1 at the start of the main text).
Recent developments in major industrial countries
United States
Data for the first half of 2011 disappointed and spurred speculation about a double-dip recession and additional policy stimulus. Uncertainty about the course of the economy reached its climax in August when long-term US sovereign credit was downgraded by a major rating agency. In part owing to the situation in the eurozone, however, yields on US treasuries fell and the dollar appreciated.
GDP growth—at a quarter-on-quarter, seasonally adjusted annualized rate (qoq saar)—was barely positive in the first quarter of 2011, but picked up in the second half with a strong performance in the last quarter when growth reached 3.0% qoq saar, taking it to 1.7% for the year. Industrial production and retail sales rose only gradually (Figure A1.1.1) from the trough in May 2009.
The unsteady climb in consumer confidence ended in March 2011, but has recovered since December last year. The values of the PMI compiled by the Institute for Supply Management lie above 50 for the first 2 months of 2012, 54.1 for January and 52.4 for February. Values above 50 indicate that the manufacturing economy is generally expanding.
Moderate gains in private consumption and fixed investment accompanied the GDP growth pickup in 2011 (Figure A1.1.2). Cuts in government consumption have slowed the recovery and are expected to continue doing so, such that in 2012 and 2013 the economy will extend its recovery, but at a moderate pace only. Absent large negative spillovers from Europe and with an accommodative monetary policy, growth is likely to reach 2.0% in 2012 and 2.3% in 2013.

Maintaining growth in an uncertain world 31
A1.1.3 Inflation, United States
-3
0
3
6
Feb12
Jul Jan11
JulJan10
JulJan09
JulJan08
JulJan2007
%, year on year
Core
Overall
Source: CEIC Data Company (accessed 27 March 2012).
As with consumption, recent data for private investment and inventories suggest that businesses are still hesitant to expand production facilities and that the economy is far from reaching capacity constraints. Fixed investment has been growing over the last 6 quarters (to Q4 2011), but without conviction. Inventories are still adjusting after a large decline toward end-2010. External demand for US goods continued expanding through 2011. Facilitated by a weaker dollar, net exports made a modest positive contribution to GDP growth in 2011.
Beyond the uncertainty originating from outside the country, the state of public finances and the high unemployment rate pose major challenges. But whether immediate progress can be made on these policy fronts is questionable as the country enters another presidential election season. When and how policymakers will move on improving future fiscal space by deciding on medium- and long-term fiscal reform also affects the forecast for 2012 and 2013. Postponing fiscal consolidation until the economy has stabilized appears to be desirable, but may not turn out to be politically feasible.
Inflation remains well under control (Figure A1.1.3). As the global economy recovers slowly, slow-moving food and energy prices are expected to buttress the recovery. Given low and stable price inflation (not exceeding 2.0% over the forecast horizon), monetary policy is also expected to continue supporting the recovery, with the target for the Federal Funds rates unchanged within 0–0.25% at least until mid-2013, and slowly tightened after that.
Policy efforts are still very much geared to easing the impact of the previous downturn. In February 2012, the US Congress voted to extend the payroll tax cut of 2011 and unemployment insurance benefits through the whole year of 2012.
EurozoneThe core eurozone countries had a strong beginning to 2011—despite tensions in segments of the sovereign debt market—feeding hopes that the eurozone could escape a second recession after the first recession in 2009. Over the course of the year, however, a raft of new policy measures failed to prevent the sovereign debt crisis from engulfing Spanish and Italian government debt. Market players often viewed the timing of these measures as too late and kept testing the commitment of all member countries to the common currency. By year-end, growth for 2011 is estimated to have reached 1.4% year on year, with a negative outlook.
This negative trend is expected to carry over into 2012, and most forecasters see the eurozone falling back into recession for the year of 0.5%, heavily reflecting the impact of fiscal austerity measures. The year 2013 may bring better news with GDP growth reaching 1% year on year.
However, developments across countries differ substantially. Germany and many other core members of the eurozone are expected to grow slowly in 2012, whereas those countries directly affected by the European debt crisis will experience
A1.1.4 Contributions to GDP growth, eurozone
-2
-1
0
1
2
3
Q12010
Q2 Q3 Q4 Q111
Q2 Q3 Q4
Percentage points, seasonally adjusted annualized rate
Gross fixed capital formationGovernment consumptionPrivate consumption
GDP
Change in stocksNet exportsStatistical discrepancy
Source: Eurostat. http://epp.eurostat.ec.europa.eu (accessed 4 March 2012).
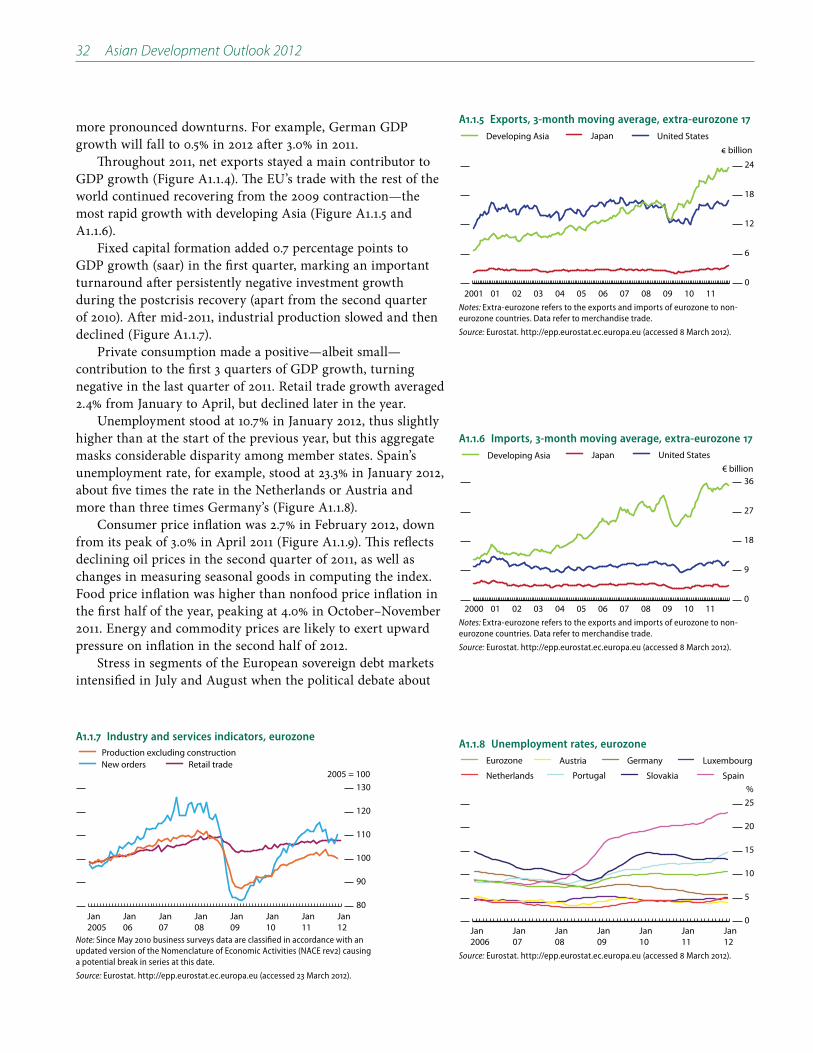
32 Asian Development Outlook 2012
A1.1.5 Exports, 3-month moving average, extra-eurozone 17
0
6
12
18
24
United StatesJapanDeveloping Asia
11100908070605040302012001
€ billion
Notes: Extra-eurozone refers to the exports and imports of eurozone to non-eurozone countries. Data refer to merchandise trade.
Source: Eurostat. http://epp.eurostat.ec.europa.eu (accessed 8 March 2012).
A1.1.6 Imports, 3-month moving average, extra-eurozone 17
0
9
18
27
36
United StatesJapanDeveloping Asia
11100908070605040302012000
€ billion
Notes: Extra-eurozone refers to the exports and imports of eurozone to non-eurozone countries. Data refer to merchandise trade.
Source: Eurostat. http://epp.eurostat.ec.europa.eu (accessed 8 March 2012).
A1.1.7 Industry and services indicators, eurozone
80
90
100
110
120
130
Retail tradeNew ordersProduction excluding construction
Jan12
Jan11
Jan10
Jan09
Jan08
Jan07
Jan06
Jan2005
2005 = 100
Note: Since May 2010 business surveys data are classified in accordance with an updated version of the Nomenclature of Economic Activities (NACE rev2) causing a potential break in series at this date.
Source: Eurostat. http://epp.eurostat.ec.europa.eu (accessed 23 March 2012).
A1.1.8 Unemployment rates, eurozone
0
5
10
15
20
25
Germany
Portugal
Luxembourg
Slovakia
Austria
Netherlands Spain
Eurozone
Jan12
Jan11
Jan10
Jan09
Jan08
Jan07
Jan2006
%
Source: Eurostat. http://epp.eurostat.ec.europa.eu (accessed 8 March 2012).
more pronounced downturns. For example, German GDP growth will fall to 0.5% in 2012 after 3.0% in 2011.
Throughout 2011, net exports stayed a main contributor to GDP growth (Figure A1.1.4). The EU’s trade with the rest of the world continued recovering from the 2009 contraction—the most rapid growth with developing Asia (Figure A1.1.5 and A1.1.6).
Fixed capital formation added 0.7 percentage points to GDP growth (saar) in the first quarter, marking an important turnaround after persistently negative investment growth during the postcrisis recovery (apart from the second quarter of 2010). After mid-2011, industrial production slowed and then declined (Figure A1.1.7).
Private consumption made a positive—albeit small—contribution to the first 3 quarters of GDP growth, turning negative in the last quarter of 2011. Retail trade growth averaged 2.4% from January to April, but declined later in the year.
Unemployment stood at 10.7% in January 2012, thus slightly higher than at the start of the previous year, but this aggregate masks considerable disparity among member states. Spain’s unemployment rate, for example, stood at 23.3% in January 2012, about five times the rate in the Netherlands or Austria and more than three times Germany’s (Figure A1.1.8).
Consumer price inflation was 2.7% in February 2012, down from its peak of 3.0% in April 2011 (Figure A1.1.9). This reflects declining oil prices in the second quarter of 2011, as well as changes in measuring seasonal goods in computing the index. Food price inflation was higher than nonfood price inflation in the first half of the year, peaking at 4.0% in October–November 2011. Energy and commodity prices are likely to exert upward pressure on inflation in the second half of 2012.
Stress in segments of the European sovereign debt markets intensified in July and August when the political debate about

Maintaining growth in an uncertain world 33
A1.1.9 Harmonized indexes of consumer prices, eurozone
-2
0
2
4
6
8
NonfoodFoodOverall
Jan12
JulJan11
JulJan10
JulJan09
JulJan2008
%
Note: Starting January 2011, a new methodology defines how seasonal products are to be treated in HICP affecting all-items index in the euroarea by a reduction of 0.1 percentage points for January 2011.
Source: Eurostat. http://epp.eurostat.ec.europa.eu (accessed 5 March 2012).
a second rescue package for Greece confirmed again deep disagreement among eurozone members on how to resolve the crisis. Although a disorderly Greek default was prevented and additional measures to prevent further spreading of the crisis were agreed in March, July, and October 2011, sovereign interest rate spreads relative to German interest rates rose sharply in vulnerable economies, most importantly Spain and Italy. Tensions eased only as the European Central Bank (ECB) intervened in secondary sovereign debt markets.
During the October 2011 fall, the crisis intensified and new measures were taken to calm the situation. Although public attention is often directed to the European Financial Stability Facility (EFSF) as the prime mechanism to resolve the Greek debt crisis, the ECB has played a key role in stabilizing financial markets. After carefully extending its mandate beyond guaranteeing price stability to allow for direct purchases of government debt, it has emerged as a true lender of last resort.
In two longer-term refinancing operations in November 2011 and February 2012 offering three year loans at historically low interest rates, the ECB allocated about 1 trillion euros to the European banking sector. With the ECB turning to quantitative easing, sufficient liquidity is in the system to allow for smooth debt roll-over of most European economies.
JapanGDP contracted in the first half of 2011 by 2.9% (qoq saar) (Figure A1.1.10), although the 1.2% second-quarter GDP decline was smaller than expected given the earthquake in March, and may be a sign of recovery from the disaster. The contraction mostly occurred in exports of automobiles and electronic parts and stemmed from supply chain disruptions and weak private demand. Equally important was continued deflationary pressure.
Although reconstruction efforts started to be felt in the second half of 2011 (annualized quarterly GDP rose by 7.1% in the third quarter), supply-chain disruptions after the flooding in Thailand during August–November 2011, a persistently strong yen, and faltering foreign demand caused the GDP to contract by 0.7% in the last quarter of 2011 (qoq saar). GDP fell by 0.7% over the whole of 2011.
The recovery is expected to regain momentum in 2012, touching 1.9% GDP growth before receding to 1.5% in 2013, reflecting the dynamics of expected government expenditure: a sharp increase in 2012 will wear off and slow in 2013. Reconstruction will be driven by higher government spending and private residential investment; private consumption growth, by contrast, will remain weak.
The March disaster boosted imports in 2011, and will continue to do so this year, such that net exports will not contribute to GDP growth either this year or next. Consumer sentiment and business confidence have suffered amid fears relating to the nuclear crisis and deteriorating external environment. Sluggish wage growth and public expectations of a rise in the
A1.1.10 Contributions to GDP growth, Japan
-10
-5
0
5
10
Q12010
Q2 Q3 Q4 Q111
Q2 Q3 Q4
Percentage points, seasonally adjusted annualized rate
Private investmentGovernment consumptionPrivate consumption
GDP
Net exportsPublic investmentResidual
Source: Economics and Social Research Institute, Cabinet Office, Government of Japan. http://www.esri.cao.go.jp/en (accessed 23 March 2012).
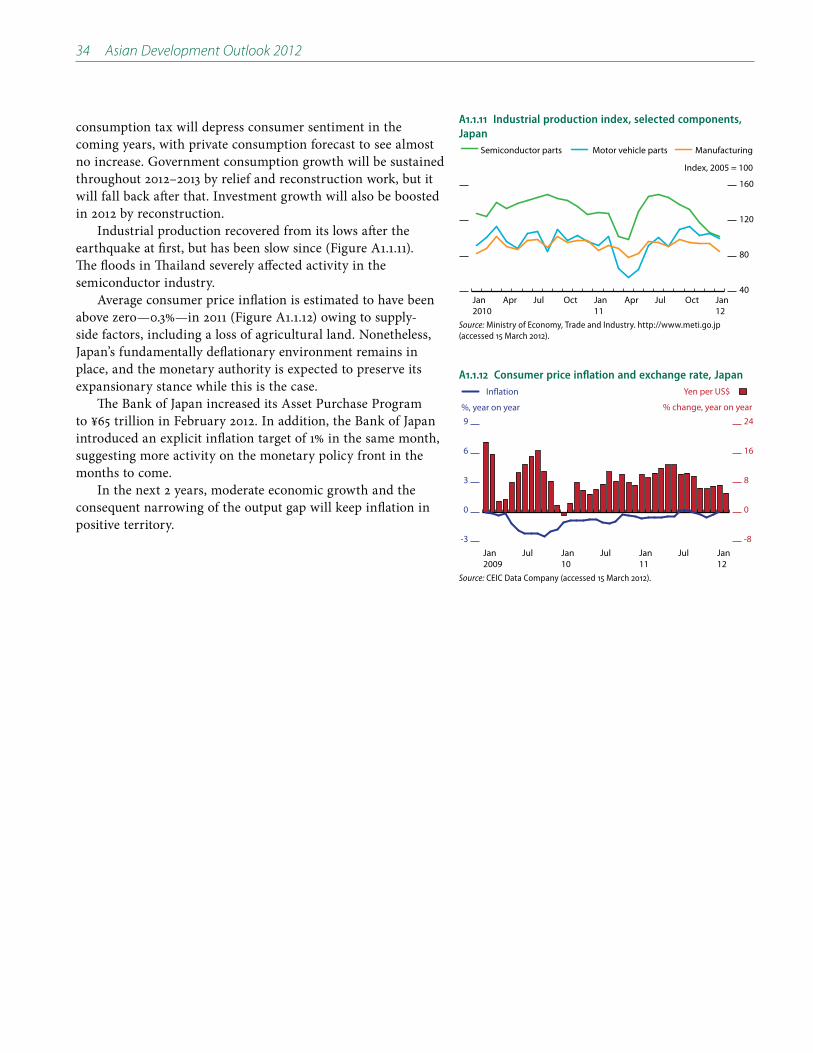
34 Asian Development Outlook 2012
A1.1.12 Consumer price inflation and exchange rate, Japan
-3
0
3
6
9
-8
0
8
16
24
Yen per US$Inflation
Jan12
JulJan11
JulJan10
JulJan2009
%, year on year % change, year on year
Source: CEIC Data Company (accessed 15 March 2012).
A1.1.11 Industrial production index, selected components, Japan
40
80
120
160
Semiconductor parts Motor vehicle parts Manufacturing
Jan12
OctJulAprJan11
OctJulAprJan2010
Index, 2005 = 100
Source: Ministry of Economy, Trade and Industry. http://www.meti.go.jp (accessed 15 March 2012).
consumption tax will depress consumer sentiment in the coming years, with private consumption forecast to see almost no increase. Government consumption growth will be sustained throughout 2012–2013 by relief and reconstruction work, but it will fall back after that. Investment growth will also be boosted in 2012 by reconstruction.
Industrial production recovered from its lows after the earthquake at first, but has been slow since (Figure A1.1.11). The floods in Thailand severely affected activity in the semiconductor industry.
Average consumer price inflation is estimated to have been above zero—0.3%—in 2011 (Figure A1.1.12) owing to supply-side factors, including a loss of agricultural land. Nonetheless, Japan’s fundamentally deflationary environment remains in place, and the monetary authority is expected to preserve its expansionary stance while this is the case.
The Bank of Japan increased its Asset Purchase Program to ¥65 trillion in February 2012. In addition, the Bank of Japan introduced an explicit inflation target of 1% in the same month, suggesting more activity on the monetary policy front in the months to come.
In the next 2 years, moderate economic growth and the consequent narrowing of the output gap will keep inflation in positive territory.

Confronting rising
inequality in Asia
2


Confronting rising inequality in Asia
This chapter was written by Juzhong Zhuang of the Economics and Research
Department (ERD) and Ravi Kanbur, external advisor; with Hyun Son, Jesus Felipe,
Dalisay Maligalig, Iris Claus, Guanghua Wan, Donghyun Park, and Shikha Jha of ERD. It
draws on the background papers listed at the end of the chapter. Changyong Rhee,
Chief Economist, provided inputs at various stages.
Over the past 2 decades, developing Asia has reduced poverty faster than any other region of the world, at any time in history. But the bulk of developing Asia’s population lives in countries with rising inequality. This is in contrast both to the “growth with equity” story that marked the transformation of the newly industrialized economies in the 1960s and 1970s, and to recent trends in other parts of the developing world, in particular Latin America, where income inequality has been narrowing since the 1990s.
This theme chapter presents an analysis of inequality in Asia, and develops a range of policy options to confront the rising inequality. A key message emerging from the analysis is that technological change, globalization, and market-oriented reform—the main drivers of Asia’s rapid growth—are the basic forces behind rising inequality in the region. These forces tend to favor owners of capital over labor, high-skilled over low-skilled workers, and urban and coastal areas over rural and inland regions.
The impacts of these forces have been compounded by various forms of unequal access to opportunity—to earn income from labor and to build human capital—caused by institutional weaknesses, market distortions, and social exclusion. Working together, these have led to a falling share of labor income in total national income, rising premiums on human capital, and growing spatial inequality.
Yet these three forces should not be obstructed, because they are the engines of productivity and income growth. Policy makers should confront rising inequality through efficient interventions that equalize opportunity and reduce inequality, in three areas: efficient fiscal measures that reduce inequality in human capital, policies that work toward more and high-quality jobs, and interventions that narrow spatial inequality.
The analysis and policy options in this theme chapter provide a broad road map for policy makers to chart their own, country-specific, path to addressing inequality—which, if unchecked, could undermine the momentum for economic growth and for a better quality of life for all Asians.

38 Asian Development Outlook 2012
Rising inequality concerns in Asia
Remarkable growth—but widening inequality
Remarkable growth…Many countries in Asia and the Pacific have seen remarkable achievements in growth and poverty reduction in the last 2 decades. From 1990 to 2010, the average annual growth rate of gross domestic product (GDP) for developing Asia reached 7.0% in 2005 purchasing power parity (PPP) terms, more than double the 3.4% for Latin America and the Caribbean (Figure 2.1.1). Much of the growth was driven by the People’s Republic of China (PRC) and India—the world’s two most populous countries—with annual GDP growth of 9.9% and 6.4%, respectively.
The rapid growth has dramatically improved living standards and greatly reduced poverty. During 1990−2010, the region’s average per capita GDP in 2005 PPP terms increased
to 20.8% around 2008, as 714 million people were lifted out of poverty. Seventeen countries reduced poverty by more than 15 percentage points in the period.
… but widening inequalityThis performance in growth and poverty reduction has, however, been accompanied by rising inequality in many countries. Of the 28 countries that have comparative data between the 1990s and 2000s, 11—accounting for about 82% of developing Asia’s population in 2010—experienced rising inequality of per capita expenditure or income, as measured by the Gini coefficient (Figure 2.1.2).1
Developing Asia has historically been a region with relatively low levels of inequality, especially compared with other regions such as Latin America. Unlike developing Asia, though, most Latin American countries have seen narrowing inequality in the last 2 decades—even if average inequality there is still much wider than in developing Asia.
Concepts of inequality
Inequality of outcome and of opportunityIn discussing inequality, it is useful to distinguish two concepts: inequality of outcome and inequality of opportunity. A principal building block of economics is the idea of human welfare—a broad sense of an individual’s “well-being.” Individuals will use the resources that they have
2.1.1 GDP growth (1990–2010) and poverty reduction (1990s–2000s)
0
10
20
30
40
50
0
2
4
6
8
10
Poverty reduction at $1.25 a day (2005 PPP$) GDP growth
SSALACMENADAEACASEAPACSA
Cumulative poverty reduction, %
Annualized GDP growth rate, %
CA =Central Asia; DA = Developing Asia; EA =East Asia; LAC = Latin America and Carribean; MENA = Middle East and North Africa; PAC = The Pacific; SA = South Asia; SEA = Southeast Asia; SSA = Sub-Saharan Africa.
Note: Cumulative poverty reduction is estimated as the difference in the percentage of poor people between the latest year in the 2000s and the earliest year in the 1990s for which data are available, at the 1.25-a-day poverty line based on 2005 purchasing power parity. Weighted by 2010 population, the figures pertain to those countries where comparable data are available. For Asia and the Pacific these include Armenia, Azerbaijan, Georgia, Kazakhstan, Kyrgyz Republic, Pakistan, Tajikistan, and Uzbekistan (Central and West Asia); People’s Republic of China (East Asia); Fiji and Timor-Leste (Pacific); Bangladesh, Bhutan, India, Maldives, Nepal, and Sri Lanka (South Asia); and Cambodia, Indonesia, Lao People’s Democratic Republic, Malaysia, Philippines, Thailand, and Viet Nam (Southeast Asia).
Source: ADB estimates using data from PovcalNet (accessed 9 March 2012) and World Development Indicators online database (accessed 7 February 2012).

Confronting rising inequality in Asia 39
2.1.2 Annualized change in inequality of expenditure or income, developing Asia, 1990s and 2000s
-10 -8 -6 -4 -2 0 2PRC
IndonesiaLao PDR
Sri LankaRepublic of Korea
GeorgiaBangladesh
MongoliaIndia
TajikistanTaipei,China
Viet NamCambodia
PhilippinesMalaysia
AzerbaijanNepal
PakistanThailand
SamoaFiji
KazakhstanArmenia
Kyrgyz Rep.Timor-LesteUzbekistan
BhutanMaldives
%Lao PDR = Lao People’s Democratic Republic; PRC = People’s Republic of China.
Note: The annualized growth of the Gini coefficient refers to growth between the earliest available figure in the 1990s and the latest available figure in the 2000s. The Gini coefficient is based on per capita income for Malaysia and Taipei,China, and per capita consumption expenditures for all other economies.
Source: PovcalNet (accessed 9 March 2012), supplemented by household survey data (most Pacific countries and India), and publications of official statistics offices (Republic of Korea and Taipei,China).
available, to maximize their well-being, subject to factors that may constrain their options. In the study of inequality, income or expenditure are commonly used to proxy the outcome of this process.
Focusing solely on income or expenditure can, though, be limiting. Non-income dimensions like education and health have come to the fore in recent years offering a multidimensional perspective on inequality and poverty. Good health, for example, confers on individuals benefits that are not fully captured by the increment it provides to incomes. Inequality in education and health may manifest themselves as differences in access and coverage among population groups defined by their income, gender, ethnic origin, or birth location.
While the concept of inequality of outcome suggests the endpoint of a process, one can usefully think of how to distinguish between the resources that one has available and the level of effort applied. Inequality of opportunity is the portion of the inequality of outcome that can be attributed to differences in “individual circumstances” (Roemer 1998). By circumstances we mean those features that are outside the control of an individual, such as gender, race, ethnicity, or place of birth. The same is true of a child’s parental characteristics, for example, father’s education or income.
On the other hand, given an individual’s circumstances, what individuals choose for effort in the labor market or in education—“individual effort”—will also influence their outcomes.
Applying the conceptsThe distinction between inequality of opportunity and inequality of outcome can be particularly useful in guiding public policy. Equality of opportunity is not only intrinsically important, but also a critical condition for a prosperous society. Public policy must be put in place to reduce or eliminate inequality of opportunity. As we will argue later, equality of opportunity is at the heart of the inclusive growth concept. In this chapter our focus will be on equality of opportunity, on assuring that everybody has equal opportunity to participate in the growth process and benefit from its fruits, equitably. To the extent that inequality of parents’ income leads to inequality of opportunity for children, this inequality needs to be overcome by interventions to assure equal access to public services and to markets for all in society.
In the real world, a clean distinction between inequality of outcome and of opportunity is not straightforward. There could also be differences in opinion on what constitute circumstances and what constitute efforts in a society (Roemer 1998, Paes de Barros et al. 2009). Even with these difficulties, in many low-income countries, it is relatively easy to observe extreme circumstances that severely limit opportunities for a large segment of the population.
These circumstances include the lack of, or unequal access to, the high-quality jobs and public services to which every citizen is meant to

40 Asian Development Outlook 2012
have equal access irrespective of circumstance—variations in this access reflect inequality of opportunity. For children, variations in access to education and health are indicators of inequality of opportunity, as these are outside children’s control.
This distinction is something of which Asian policy makers are aware (Box 2.1.1). Beyond the intrinsic value of equality—the idea of fairness, for which most humans are hard wired—does inequality make any difference for a country’s development?
How do Asians view the distinction between inequality of opportunity and inequality of income? Box figure 1 presents results for Asia and OECD countries from the World Values Survey of 2005.
This survey asked representative samples of people in 69 countries to locate their views on a scale of 1 to 10, with 1 meaning “incomes should be made more equal,” and 10 meaning “we need larger income differences as incentives.”
The Asian responses are more skewed toward 10—about 63% of the responses are in the 6-10 range—but there is still nevertheless significant weight in the lower value responses. The OECD responses are spread more evenly over the 10 categories.
This interpretation seems to be consistent with the results coming from ADB’s web-based survey of Asian policy makers (Box figure 2; see Box 2.1.3 below for survey details). About 60% of the respondents agree or strongly agree with the statement that it is more important to reduce inequality of opportunity (such as access to education, health, and employment services) than to reduce inequality of income; and 84% of the respondents agree or strongly agree with the statement that income inequality is acceptable if it is due to differences in individual efforts and an outcome of fair competition.
2 Inequality of outcomes and inequality of opportunity—informal policy maker survey
Strongly disagree
Disagree
The two are equally importantAgree
Strongly agree
28.3%
1.2%
5.1%
36.2%
29.2%
A. Would you agree that it is more important to reduce inequality of
opportunity (such as access to education, health, and employment
services) than to reduce inequality of income?
Don't know
Strongly disagree
Disagree
Agree
Strongly agree
22.0%
2.9%0.7%
12.2%
62.2%
B. Would you agree with the statement that income inequality is
acceptable if it is due to differences in individual efforts and
an outcome of fair competition?
Source: Web-based survey by ADB from January to February 2012.
2.1.1 Opportunity vs. outcome—Perceptions from Asia
1 World Values Survey 2005—More or less income inequality?
0
4
8
12
16
Developing Asia
10987654321
Responses
Frequency, %
0
4
8
12
16
OECD
10987654321
Responses
Frequency, %
Note: “1” means “incomes should be made more equal; “10” means “ we need larger income differences as incentives.” The survey received 13,160 responses from 10 Asian economies, including People’s Republic of China; Georgia; Hong Kong, China; India; Indonesia; Republic of Korea; Malaysia, Taipei,China, Thailand, and Viet Nam; and 23,032 responses from 19 OECD member countries.
Source: World Values Survey, 2005. http://www.wvsevsdb.com/wvs/WVSData.jsp
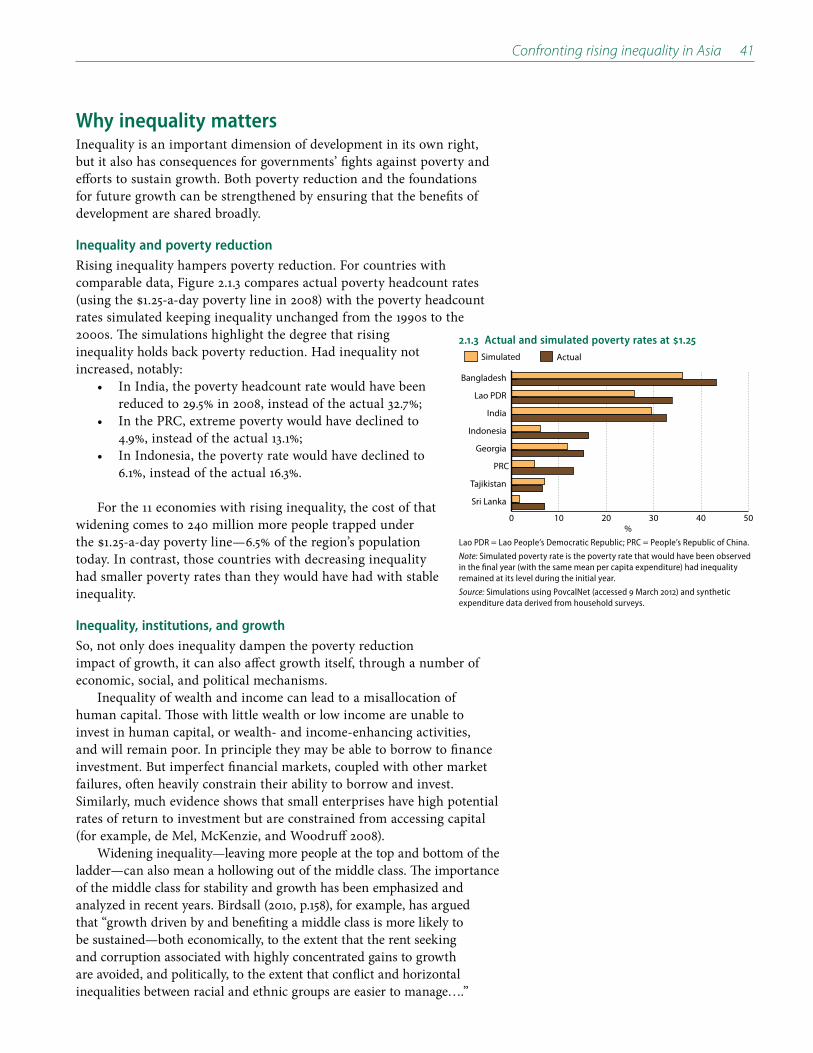
Confronting rising inequality in Asia 41
Why inequality mattersInequality is an important dimension of development in its own right, but it also has consequences for governments’ fights against poverty and efforts to sustain growth. Both poverty reduction and the foundations for future growth can be strengthened by ensuring that the benefits of development are shared broadly.
Inequality and poverty reductionRising inequality hampers poverty reduction. For countries with comparable data, Figure 2.1.3 compares actual poverty headcount rates
rates simulated keeping inequality unchanged from the 1990s to the 2000s. The simulations highlight the degree that rising inequality holds back poverty reduction. Had inequality not increased, notably:
In India, the poverty headcount rate would have been reduced to 29.5% in 2008, instead of the actual 32.7%;In the PRC, extreme poverty would have declined to 4.9%, instead of the actual 13.1%;In Indonesia, the poverty rate would have declined to 6.1%, instead of the actual 16.3%.
For the 11 economies with rising inequality, the cost of that widening comes to 240 million more people trapped under
today. In contrast, those countries with decreasing inequality had smaller poverty rates than they would have had with stable inequality.
Inequality, institutions, and growthSo, not only does inequality dampen the poverty reduction impact of growth, it can also affect growth itself, through a number of economic, social, and political mechanisms.
Inequality of wealth and income can lead to a misallocation of human capital. Those with little wealth or low income are unable to invest in human capital, or wealth- and income-enhancing activities, and will remain poor. In principle they may be able to borrow to finance investment. But imperfect financial markets, coupled with other market failures, often heavily constrain their ability to borrow and invest. Similarly, much evidence shows that small enterprises have high potential rates of return to investment but are constrained from accessing capital (for example, de Mel, McKenzie, and Woodruff 2008).
Widening inequality—leaving more people at the top and bottom of the ladder—can also mean a hollowing out of the middle class. The importance of the middle class for stability and growth has been emphasized and analyzed in recent years. Birdsall (2010, p.158), for example, has argued that “growth driven by and benefiting a middle class is more likely to be sustained—both economically, to the extent that the rent seeking and corruption associated with highly concentrated gains to growth are avoided, and politically, to the extent that conflict and horizontal inequalities between racial and ethnic groups are easier to manage….”
2.1.3 Actual and simulated poverty rates at 1.25
0 10 20 30 40 50
Actual Simulated
Sri Lanka
Tajikistan
PRC
Georgia
Indonesia
India
Lao PDR
Bangladesh
%Lao PDR = Lao People’s Democratic Republic; PRC = People’s Republic of China.
Note: Simulated poverty rate is the poverty rate that would have been observed in the final year (with the same mean per capita expenditure) had inequality remained at its level during the initial year.
Source: Simulations using PovcalNet (accessed 9 March 2012) and synthetic expenditure data derived from household surveys.

42 Asian Development Outlook 2012
In fact, there is a broad consensus among analysts on the link between inequality and the quality of institutions. Along several dimensions, ranging from political stability, through institutional stability, to property rights, the negative impact of inequality on institutional quality seems to be well established, although the two-way causality is also widely recognized (Zhuang et al. 2010 and Nye forthcoming). At the same time, there is also a literature on the effect of inequality on crime and violence and, through that, on the investment climate (for example, Fajnzylber, Lederman, and Loayza 2002; Özler and Demombynes 2002).
Finally, greater inequality may lead to a political backlash, in which pressure for governments to enact populist policy measures grows. In response to the rising demands, the political process may favor policies which, in the short term, would benefit the lower end of the income distribution, but which in the long run could hold back efficiency and growth (Alesina and Rodrik 1994). Under such conditions, the interests of the political system diverge from the interests of the economy as a whole. This is a widespread concern in developing and developed countries alike.
Empirically establishing the linkage between inequality and growth is not easy, because numerous factors are at work, and economic analysis is often subject to data and methodological limitations. Unsurprisingly, the empirical evidence is itself mixed (for example, Kanbur and Lustig 2000; Barro 2008).
Recent studies by Berg and Ostry (2011a, 2011b), however, provide convincing evidence on the inequality–growth relationship. The study makes a key distinction between growth over the short run and growth over the long run (Box 2.1.2). This corresponds to the different issues involved in “igniting” growth versus sustaining it over the long run. Many countries can ignite growth in the short run, but far fewer can sustain it (Hausmann, Pritchett, and Rodrik 2005). The econometric analysis of Berg and Ostry confirms that inequality is a key variable explaining long-run growth. Thus not only does rising inequality dent the poverty impact of a given growth rate, it can also affect the sustainability of a growth path.
Inequality on the policy agendaGovernments are not blind to the problem. Indeed, in recent years more of them have embraced the concept of inclusive growth to make income distribution more equitable:
In the PRC, where the Gini coefficient of per capita expenditure worsened from about 32.4 in 1990 to 43.4 in 2008, the government set about building a harmonious society as the development goal in its Eleventh Five-Year Plan (2006−2010). This goal has been reaffirmed in the Twelfth Five-Year Plan (2011−2015), with greater emphasis on the quality—not just the rate—of growth, and making growth inclusive.In India, where the Gini coefficient deteriorated from 32.5 in 1993 to 37 in 2010, the government made an explicit commitment to inclusive growth in its Eleventh Five-Year Plan (2007−2012). The central vision of the plan is “…not just faster growth but also inclusive growth, that is, a growth process which yields broad-based benefits and ensures equality of opportunity for all.”

Confronting rising inequality in Asia 43
In analyzing the determinants of growth, one needs to make an important distinction between short-term and long-term growth. The course of economic growth does not run smooth. Growth over a long period is made up of “growth spells,” where growth accelerates to a higher rate then falls again. Some of this is purely cyclical, but a recent literature focuses on finding policy and structural determinants of the frequency and length of these spells.
This literature suggests that accelerating growth in the short run may be easier than sustaining it over the longer term—and at the very least the determinants of these two types of growth can be very different. The former can be achieved by a set of conventional reforms that lead to a burst of investment and output—liberalization of trade or finance, for example. But sustaining this growth requires longer-term institutional underpinnings (Rodrik 2005).
Further, economies are subject to shocks, even more so in an era of globalization. How policy makers respond to these shocks will determine the speed and sustainability of the rebound and the subsequent growth path. But because any policy response will invariably have distributional consequences, the ability of policy makers to push through efficient responses to shocks depends on their ability to manage the distributional consequences of these responses (Rodrik 1999).
Inability to manage these shocks, and more generally the distributional consequences of efficient reforms, will mean that growth accelerations will peter out sooner than
if these shocks are managed well, and growth spells will be shorter. Long-run growth will therefore be lower.
Berg and Ostry (2011b) argue that inequality can influence the duration of growth spells through several channels:
With credit market imperfections, inequality inhibits private investment in human capital.If the distribution of political power follows the distribution of income, this may lead, on the one hand, to pressure for populist policies from the bottom end, and, on the other, to efforts by elites to resist this pressure through corruption—both of which are inefficient and detrimental to growth.Inequality may increase the risk of political instability.
Berg, Ostry and Zettelmeyer (forthcoming) test for the effect of inequality on growth, focusing on its impact on the duration of growth spells. The empirical results show that income distribution survives as one of the most robust and important factors associated with growth duration. A 10-percentile decrease in inequality increases the expected length of a growth spell by 50%. They conclude that inequality is a more robust predictor of growth duration than many variables widely understood to be central to growth.
Source: Berg and Ostry (2011b); Berg, Ostry and Zettelmeyer (forthcoming); Rodrik (1999, 2005).
2.1.2 Inequality and sustained growth
The 2010−2014 development plan for Indonesia, which saw its Gini coefficient worsen from 29 in 1990 to 39 in 2011, offers a vision of a society supported by five national development agendas, among them inclusive and just development.Malaysia’s 2011–2015 Development Plan is based on the “1Malaysia: People First, Performance Now” concept, and adopts an inclusive development approach to ensure equitable access to economic participation among all Malaysians, particularly aiming at improving livelihood of the poorer 40% of households.In the Philippines, the vision of the 2011–2016 medium-term development plan is to achieve inclusive growth, create employment opportunities, and reduce poverty.Thailand’s 2012–2016 Development Strategy is based on the “sufficiency economy” philosophy and people-centered development, with a vision of equity, fairness, and resilience.
To gauge the extent of the rising concerns over inequality among Asian policy makers, in early 2012 ADB carried out a web-based survey (Box 2.1.3). Over 65% of respondents agreed that income inequality in

44 Asian Development Outlook 2012
their countries was high or very high. Almost all felt that incomes in their countries were becoming more unequal. Importantly, for a region with considerable success in lifting its citizens out of poverty, a majority of the respondents felt that widening inequality was not acceptable even with these declines in the poverty rate.
To better understand the views of regional policy makers, the Asian Development Bank (ADB) used an informal survey covering different aspects of the inequality problem. ADB targeted officials of ministries of finance, planning authorities, and other government agencies in developing Asia.
The survey was administered online from 11 January to 29 February 2012. In some cases, the questionnaire was translated into local languages. From key government agencies in 25 of ADB’s developing member countries, 504 respondents registered their opinions. The results confirm that policy makers consider rising inequality an increasingly serious problem (Box figure). In particular:
About two-thirds of the respondents indicated that the level of income inequality is high or very high and that it has increased from 10 years ago;44% of the respondents indicated that the level of concern over inequality among policy makers is high or very high and 70% indicated that the concern has increased;95% of the respondents think that it is important or very important to have policies in place to prevent rises in inequality in order to maintain stability and sustain growth;More than 52% disagree or strongly disagree with the statement that higher income inequality is acceptable so long as poverty is declining.
A simple analysis of the survey results shows that respondents from countries with rising inequality have a higher level of concern over inequality and a sense of urgency for addressing it than those from countries with declining inequality.
2.1.3 How important is inequality to developing Asia’s policy makers?
Concerns about inclusiveness of growth and rising inequaity—Policy maker survey
Very low
Low
Not high
High
Very high
29.9%
16.9%
0.2%
5.2%
47.7%
A. Would you say that the level of income inequality in your country is
Decreased a lot
Decreased
Stayed about the same
Increased
Increased a lot
11.5%
14.1%
55.7%
17.9%
0.7%
B. Would you say that compared to ten years ago,
income inequality in your country has
Very low
Low
Medium
High
Very high
15.5%
8.5%
3.6%
36.7%
35.7%
C. What is the level of concern among policy makers
in your country about income inequality?
Decreased a lot
Decreased
Stayed the same
Increased
Increased a lot
13.0%
26.3%
57.1%
0.7%2.9%
D. Has the concern over income inequality
increased in the last ten years?
Don't know
Not important at all
Not important
Important
Very important
2.4%
38.1%57.0%
1.9%0.5%
E. How important do you think it is to have policies in place to
prevent rises in inequality in order to maintain stability and
sustain growth in your country?
Don't know
Strongly disagree
Disagree
Agree
Strongly agree
6.2%
46.3%
5.5%4.8%
37.2%
F. Would you agree with the statement that higher income inequality
is acceptable so long as poverty is declining?
Source: Web-based survey by ADB from January to February 2012.

Confronting rising inequality in Asia 45
Income inequality in Asia
This chapter draws on data from several sources. The first is the World Bank’s PovcalNet, which provides Gini coefficients for most of the countries covered in the study. The PovcalNet also provides grouped per capita income or expenditure data (by decile), from which the quintile ratios and growth incidence by quintile can be computed. The grouped expenditure data (together with rural and urban populations) were also used to estimate the national Gini coefficients for the PRC and Indonesia for more recent years as they are not available in PovcalNet. The second is unit level household survey data, which are used for estimating growth incidence curves, the top 5% and 1% income (or expenditure) shares, and GE(0) indices (in decomposition analysis) for a selection of countries. Unit level survey data are also used to estimate Gini coefficients and quintile ratios when PovcalNet does not provide sufficient data, mostly for Pacific countries. Inequality measures for India are all calculated from unit level household survey data. The third source is official statistical publications or databases for all OECD countries, the Republic of Korea, and Taipei,China.
Inequality can be estimated for per capita income or per capita expenditure. The two measures usually give different results, with income inequality normally higher than expenditure inequality. For example, the income measure of the Gini was 47 in the Philippines in 2009 while the expenditure measure was 43. Viet Nam provides a more stark example: the income measure was 46 in 2008 while the expenditure measure was 37. For most developing Asian countries, this study estimates inequality measures from expenditure data, with the exception of those for Malaysia and Taipei,China that are based on income data. Estimates for Sub-Saharan African countries are also based on expenditure data, while those for Latin American and OECD countries are based on income data. These are largely determined by data availability.
Standard measures of inequality are discussed in Box 2.2.1.
Recent trends of income inequality estimates in developing Asia
Higher growth and rising inequality
Of the 36 economies with available data in 2000s (Table 2.2.1),2 13 had a Gini coefficient at or greater than 40, widely considered the threshold for “high inequality.”3 The average Gini for the 36 economies is 37.4 Eleven of the 28 economies with data in both the 1990s and 2000s show an increase (worsening) in the coefficient in the last 2 decades. These 11 cover 82% of the region’s population. On an annual basis, the increase in inequality was most pronounced in the PRC: the Gini there worsened from 32.4 to 43.4 in 1990–2008 (1.6% a year). Indonesia’s increased from 29.2 in 1990 to 38.9 in 2011 (1.4% a year).

46 Asian Development Outlook 2012
The Gini coefficient is one measure of dispersion of a frequency distribution, for example, of how income or consumption expenditures are distributed across households. For an income distribution, the Gini is computed as follows:
∑=
++−
=n
ii
xx
ni
nn
Gini12
2)1(μ
where xi is the income of individual i, μx is the average income of the population, and n is the total number of individuals in the population. The Gini will range from 0 if all individuals have the same income (perfect equality) to 1 if income is held by only one person in the population (perfect inequality). For convenience, this report cites the Gini multiplied by 100.
The quintile income ratio is the ratio of the total income earned by the top (richest) 20% of the population to that of the bottom (poorest) 20%.
Generalized entropy GE(0) is one member of a family of measures derived from the notion of entropy in
information theory. It is also known as Theil’s second measure and can be computed as follows:
∑=
=n
i i
xxlnnGE(0)
1
1 μ )(A major attraction of this index is that it is
decomposable: the total inequality can be decomposed into a component measuring inequality between-groups and components measuring inequality within-groups.
Income (or expenditure) shares of the top 1% and 5% of the households in the distribution focus on income (or expenditure) shares of the richest households.
The growth incidence curve plots per capita income (or expenditure) growth at each point of an income distribution between two periods, which can provide more detailed insight into what is driving changes in the distribution over time than any summary measure of inequality.
2.2.1 Methods for measuring inequality
2.2.1 GDP growth and change in the Gini coefficient
ARM
AZE
BAN
BHU
CAMFIJ
GEOIND
INO
KAZ
KOR
KGZ
LAO
MAL
MLD
MON
NEPPAK
PHI
PRCSRI
TAJ
THATIMUZB
VIE
y = 0.668x - 4.328 R² = 0.047
-30
-20
-10
0
10
20
-2 0 2 4 6 8 10 12
Change in Gini coefficient, 1990s−2000s
Annualized GDP growth, 1990−2010 (%)
SAM
ARM = Armenia (1998–2008); AZE = Azerbaijan (1995–2008); BAN = Bangladesh (1991–2010); BHU = Bhutan (2003–2007); CAM = Cambodia (1994–2008); FIJ = Fiji (2002–2008); GEO = Georgia (1996–2008); IND = India (1993–2010); INO = Indonesia (1990–2011); KAZ =Kazakhstan (1993–2009); KOR = Rep. of Korea (1997–2010); KGZ = Kyrgyz Republic (1993–2009); LAO = Lao People’s Dem. Rep. (1992–2008); MAL = Malaysia (1992–2009); MLD = Maldives (1998–2004); MON = Mongolia (1995–2007); NEP = Nepal (1995–2010); PAK = Pakistan (1990–2007); PHI = Philippines (1991–2009); PRC = People’s Rep. of China (1990–2008); SAM = Samoa (2002–2008); SRI = Sri Lanka (1990–2006); TAJ = Tajikistan (1999–2009); THA = Thailand (1990–2009); TIM = Timor-Leste (2001–2007); UZB = Uzbekistan (1998–2003); VIE = Viet Nam (1992–2008).
Source: PovcalNet (accessed 9 March 2012); World Development Indicators online database (accessed 9 February 2012).
There appears to be a positive and statistically significant relationship between the increase in the Gini (rising inequality) and GDP growth (Figure 2.2.1).
The trend of rising inequality is widespread in the region. Yet 14 economies with data in the 2 decades recorded an improvement in the Gini, five from Central Asia. Part of the former Soviet Union, these five underwent dramatic economic and social transformation from the late 1980s, when the Gini surged, but the coefficient declined in more recent years as their economies became more stable. In the Kyrgyz Republic, for example, the Gini worsened from 26 in 1988 to 53.7 in 1993, then declined to 36.2 in 2009.
Most of the other countries that saw an improving Gini coefficient (sometimes sharply) have a small economy: Bhutan, Fiji, Maldives, Nepal, Timor-Leste, Tuvalu, and Samoa. Some of them are vulnerable to shocks. Maldives, for instance, experienced a devastating tsunami in 2004 and Timor-Leste went through civil conflicts. These are likely to have impacted on incomes of different classes and on income distribution.
To gain more insight into the pattern of inequality and its change over time, we look at the Gini coefficient of urban and rural subpopulations within a country, focusing on the PRC, India and Indonesia, the region’s three most populous countries.
In the PRC, rural and urban inequalities increased in 1990–2008—urban from 25.6 to 35.2 and rural from 30.6 to 39.4

Confronting rising inequality in Asia 47
2.2.1 Trends in inequality in developing Asia
Gini coefficients Top 20% / Bottom 20%
Developing member country Initial year
Final year
1990s 2000s Annualized growth
rates (%)
1990s 2000s Annualized growth
rates (%)
Central Asia
Armenia 1998 2008 36.0 30.9 -1.5 5.8 4.5 -2.5
Azerbaijan 1995 2008 35.0 33.7 -0.3 6.1 5.3 -1.1
Georgia 1996 2008 37.1 41.3 0.9 7.1 8.9 1.9
Kazakhstan 1996 2009 35.3 29.0 -1.5 6.2 4.2 -3.0
Kyrgyz Republic 1993 2009 53.7 36.2 -2.5 22.7 6.4 -8.0
Tajikistan 1999 2009 29.0 30.8 0.6 4.5 4.8 0.6
Uzbekistan 1998 2003 45.3 36.7 -4.2 - - -
East Asia
China, People's Rep. of 1990 2008 32.4 43.4 1.6 5.1 9.6 3.6
Korea, Rep. of 1992 2010 24.5 28.9 0.9 - - -
Mongolia 1995 2007 33.2 36.5 0.8 - - -
Taipei,China 1990 2010 31.2 34.2 0.5 5.2 6.2 0.9
South Asia
Afghanistan 2007 - 27.8 - - - -
Bangladesh 1991 2010 27.6 32.1 0.8 3.9 4.7 0.9
Bhutan 2003 2007 46.8 38.1 -5.2 9.9 6.8 -9.4
India 1993 2010 32.5 37.0 0.7 4.8 5.7 1.1
Maldives 1998 2004 62.7 37.4 -8.6 46.6 6.8 -32.1
Nepal 1995 2010 35.2 32.8 -0.5 5.5 5.0 -0.7
Pakistan 1990 2007 33.2 30.0 -0.6 5.2 4.2 -1.3
Sri Lanka 1990 2006 32.5 40.3 1.3 4.8 6.9 2.3
Southeast Asia
Cambodia 1994 2008 38.3 37.9 -0.1 5.8 6.1 0.3
Indonesia 1990 2011 29.2 38.9 1.4 4.1 6.6 2.2
Lao People's Dem. Rep. 1992 2008 30.4 36.7 1.2 4.3 5.9 1.9
Malaysia 1992 2009 47.7 46.2 -0.2 11.4 11.3 0.0
Philippines 1991 2009 43.8 43.0 -0.1 8.6 8.3 -0.2
Thailand 1990 2009 45.3 40.0 -0.6 8.8 7.1 -1.2
Viet Nam 1992 2008 35.7 35.6 0.0 5.6 5.9 0.2
The Pacific
Fiji 2002 2008 46.8 42.8 -1.5 12.6 8.0 -7.5
Kiribati 2006 40.0 - - 7.8 -
Micronesia, Fed. States of 1998 45.0 - 10.3 - -
Nauru 2006 - 48.0 - - 16.2 -
Palau 2006 - 42.0 - - 7.6 -
Papua New Guinea 1996 50.9 - 12.5 - -
Samoa 2002 2008 45.0 43.0 -0.8 9.2 7.9 -2.5
Solomon Islands 2006 - 46.0 - - 10.3 -
Timor-Leste 2001 2007 39.5 31.9 -3.6 7.0 4.6 -6.9
Tonga 2001 - 34.0 - - 6.0 -
Tuvalu 1994 2004 45.0 37.0 -2.0 8.9 6.2 -3.6
Vanuatu 2006 - 46.0 - - 10.4 -
- = not available.
Note: Gini coefficients and quintile ratios are mainly from earliest available data in the 1990s and latest available data, based on per capita expenditures, except for those of Malaysia and Taipei,China which are income-based. Estimates for the PRC and Indonesia combine the separate urban and rural distributions, weighted by share of urban/rural to total population.
Source: PovcalNet data (accessed 9 March 2012), supplemented by household survey data mostly from Pacific countries and from India, and publications of official statistics offices (Republic of Korea and Taipei,China).
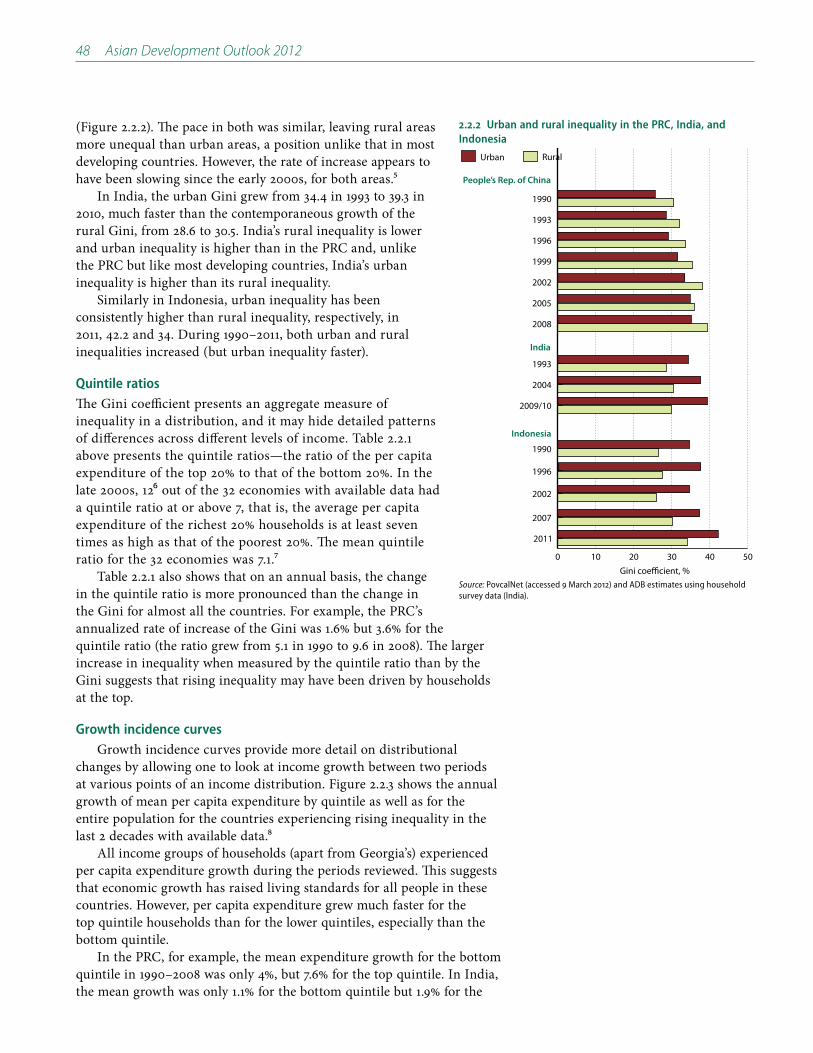
48 Asian Development Outlook 2012
(Figure 2.2.2). The pace in both was similar, leaving rural areas more unequal than urban areas, a position unlike that in most developing countries. However, the rate of increase appears to have been slowing since the early 2000s, for both areas.5
In India, the urban Gini grew from 34.4 in 1993 to 39.3 in 2010, much faster than the contemporaneous growth of the rural Gini, from 28.6 to 30.5. India’s rural inequality is lower and urban inequality is higher than in the PRC and, unlike the PRC but like most developing countries, India’s urban inequality is higher than its rural inequality.
Similarly in Indonesia, urban inequality has been consistently higher than rural inequality, respectively, in 2011, 42.2 and 34. During 1990–2011, both urban and rural inequalities increased (but urban inequality faster).
Quintile ratiosThe Gini coefficient presents an aggregate measure of inequality in a distribution, and it may hide detailed patterns of differences across different levels of income. Table 2.2.1 above presents the quintile ratios—the ratio of the per capita expenditure of the top 20% to that of the bottom 20%. In the late 2000s, 126 out of the 32 economies with available data had a quintile ratio at or above 7, that is, the average per capita expenditure of the richest 20% households is at least seven times as high as that of the poorest 20%. The mean quintile ratio for the 32 economies was 7.1.7
Table 2.2.1 also shows that on an annual basis, the change in the quintile ratio is more pronounced than the change in the Gini for almost all the countries. For example, the PRC’s annualized rate of increase of the Gini was 1.6% but 3.6% for the quintile ratio (the ratio grew from 5.1 in 1990 to 9.6 in 2008). The larger increase in inequality when measured by the quintile ratio than by the Gini suggests that rising inequality may have been driven by households at the top.
Growth incidence curvesGrowth incidence curves provide more detail on distributional
changes by allowing one to look at income growth between two periods at various points of an income distribution. Figure 2.2.3 shows the annual growth of mean per capita expenditure by quintile as well as for the entire population for the countries experiencing rising inequality in the last 2 decades with available data.8
All income groups of households (apart from Georgia’s) experienced per capita expenditure growth during the periods reviewed. This suggests that economic growth has raised living standards for all people in these countries. However, per capita expenditure grew much faster for the top quintile households than for the lower quintiles, especially than the bottom quintile.
In the PRC, for example, the mean expenditure growth for the bottom quintile in 1990–2008 was only 4%, but 7.6% for the top quintile. In India, the mean growth was only 1.1% for the bottom quintile but 1.9% for the
2.2.2 Urban and rural inequality in the PRC, India, and Indonesia
0 10 20 30 40 50
RuralUrban
2011
2007
2002
1996
1990
2009/10
2004
1993
2008
2005
2002
1999
1996
1993
1990
Gini coefficient, %
People’s Rep. of China
India
Indonesia
Source: PovcalNet (accessed 9 March 2012) and ADB estimates using household survey data (India).

Confronting rising inequality in Asia 49
top quintile. (In Georgia, income fell for all quintile groups in 1996–2008, though as the decline was more significant for the bottom quintile than for the top quintile, inequality widened).
Figure 2.2.3 also compares mean growth of each quintile with that of the population. It shows that in all the countries (but the PRC and Tajikistan), rising inequality involves a shift of income from the bottom 80% of the population to the top 20%, as indicated by lower mean expenditure growth for quintiles 1 to 4 than that for the whole population. In the PRC and Tajikistan, with mean expenditure growth for quintiles 1 to 3 lower than and for quintile 4 close to that of the top quintile, rising inequality involves a shift of income from the bottom 60% to the top 20% of population.
Figure 2.2.4 shows growth incidence curves for India and Indonesia using unit level survey data. The results largely confirm the findings from mean expenditure growth by quintile. The growth incidence curve cuts across the line of growth of population mean per capita expenditure at close to the 80th percentile, suggesting that rising inequality in the two countries has been driven by income redistribution to the top 20%, at a cost to the bottom 80%. The growth incidence curve increases monotonically for Indonesia. But for India, expenditure growth at the lowest few percentiles was higher than growth of population mean per capita expenditure.
Figure 2.2.5 goes further up the income distribution, focusing on the very top. In terms of the levels, there are large variations in the expenditure shares of the top 5% and 1%. Except for the Pacific countries, in the late 2000s the shares of the richest households are relatively close across the countries, in the range of 17−22% for the top 5% and 6−9% for the top 1%. For the Pacific countries, the shares of the top 5% and 1% are higher with wider variation: 15−28% for the top 5% and 5−16% for the top 1%.
Consistent with the changes in the Gini and quintile ratios, most of the countries in Figure 2.2.5 show that the expenditure shares of the top 1% and 5% increased during the review periods. In the PRC, for example, in 1995–2008 the share of
2.2.3 Growth incidence by quintile, countries with rising inequality
-6
-3
0
3
6
9
Population meanQuintile 5Quintile 4 Quintile 3Quintile 2Quintile 1
Tajikistan (1999−2009)
Sri Lanka (1990−2006)
PRC (1990−2008)
Lao PDR (1992−2008)
Indonesia (1990−2011)
India (1993−2010)
Georgia (1996−2008)
Bangladesh (1991−2010)
%
Lao PDR = Lao People’s Democratic Republic; PRC = People’s Rep. of China.
Source: ADB estimates using PovcalNet (accessed 9 March 2012) and household survey data (India).
2.2.4 Growth incidence curves, Indonesia and India, 1990–2010
3.2
3.5
3.8
4.1
4.4
4.7
Growth rate in meanGrowth incidence curve
100806040200
Expenditure percentiles
Annual growth rate, %
Indonesia (1990−2010)
0
1
2
3
4
Growth rate in meanGrowth incidence curve
100806040200
Expenditure percentiles
Annual growth rate, %
India (1993−2009)
Source: ADB estimates using household survey data.

50 Asian Development Outlook 2012
the top 5% rose from 17% to 20.5%, and that of the top 1% from 4.6% to 6.4%. In India, the shares of the top 5% and 1% increased from 17.7% and 6.5% in 1993 to 21.3% and 9%, respectively, in 2010. These results back up the earlier point that rising inequality in developing Asia is closely associated with very rapid increases in the very top income groups—that is, the rich are getting richer much faster.
Within- and between-country inequalityAlthough the focus of this chapter is on inequality within each country, it is useful both to look at Asia-wide inequality that considers developing Asian countries as one entity and to ask how important within-country inequality is, compared with between-country inequality.
The Asia-wide Gini coefficient increased from 39 in the mid-1990s to 46 in the late 2000s, or 1.4% a year. Both within-country and between-country inequality as measured by the GE(0) index (Box 2.2.1 above) widened (Figure 2.2.6). However, between-country inequality grew faster, as its contribution to Asia-wide inequality rose from about 22.6% in the mid-1990s to 29.6% in the late 2000s, while the contribution of within-country inequality to Asia-wide inequality declined from 77.4% to 70.4% in the same period. The between-country income differences can be largely explained by much faster growth in the PRC than in the rest of the region.
Asia’s inequality in a global contextBefore we go into a detailed comparison of Asia’s inequality vis-à-vis other groupings, a word of caution. Inequality measures are by and large based on per capita incomes for OECD and Latin American countries, while they are based on per capita expenditure in most developing Asian countries (as well as Sub-Saharan Africa). As noted earlier, income-based inequality measures tend to run higher than expenditure-based ones.9
Despite recent increases, Gini coefficients in developing Asia are still on average lower than in other regions of the developing world (Figure 2.2.7). Developing Asia’s range of Gini coefficients of 28−51 is tighter than that of Sub-Saharan Africa’s 30−66, and lower than that of Latin America and the Caribbean’s 45−60. This conclusion is likely to hold even if we consider the differences between income-based and expenditure-based inequalities.
Yet developing Asia compares less favorably when one looks at changes in inequality. During the last decade, most Sub-Saharan African countries and more than half of Latin American and Caribbean countries experienced declines in Gini. In developing Asia, 11 out of the 25 economies with comparable data, covering 82% of the region’s population, experienced increases in inequality (Figure 2.2.8 below).
For Latin America, recent studies have identified several contributing factors to the declining inequality, including policies
2.2.5 Expenditure shares of the top 5 and 1
Bhutan
PRC
India
Indonesia
Pakistan
Philippines
FSM
Nauru
Kiribati
Tuvalu
Tonga
Sri Lanka
Timor-Leste
Palau
Vanuatu
Solomon
Samoa
Fiji
0 10 20 30
Asia
2001
2006
2006
2006
2008
2002
1998
2006
2006
2004
2001
2009
1990/91
2009
1991
2007/08
1990/91
2011
1990
2010
1993
2008
1995
2007
2003
Top 1%Top 5%
Expenditure share of top income classes, %
The Pacific
Source: ADB estimates using household survey data.
2.2.6 Decomposition of Asia-wide inequality
0
20
40
60
80
100
Within-country inequality Between-country inequality
20081996
GE(0) = 0.241GE(0) = 0.187
GE(0) = 0.055 GE(0) = 0.101
Share = 77.4% Share = 70.4%
Share = 22.6%Share = 29.6%
%
GE() = See Box 2.2.1.
Note: Asia-wide inequality pertains to 23 countries where comparative data are available for 1996 and 2008 or closest available.
Source: ADB estimates using grouped expenditure data from PovcalNet (accessed 9 March 2012).

Confronting rising inequality in Asia 51
that enhanced employment prospects (including encouraging trade); targeted inequality of human capital through strengthened provision of education and health services; and promoted conditional cash transfers that help build human capital. Large, conditional cash transfer programs, such as Bolsa Familia in Brazil and Progresa/Oportunidades in Mexico, have played a central role in the turnaround (Esquivel, Lustig, and Scott 2010).
Compared with OECD countries, however, developing Asia’s level of income equality is much higher overall. Of the 34 OECD countries with comparative data, most countries had a Gini in the range of 25−35. High taxes and transfers are key reasons for their low income inequality. Twenty OECD countries had a Gini coefficient before taxes and transfers greater than 40 in the mid-2000s (Figure 2.2.9).
Yet even in OECD countries, as in developing Asia, inequality is on the rise: 17 OECD countries saw increases in the Gini coefficient from the mid-1990s to mid-2000s (Figure 2.2.9).10 A study by OECD (2011a) reports that in many OECD countries household incomes increased much faster at the top income ranges from the mid-1990s to the late 2000s, similar to the experiences of many developing Asian countries. On average, income growth for households in the top decile was 1.5 times as high as that for the bottom decile from the mid-1980s to late-2000s for 27 OECD countries. The difference in income growth between the top and bottom deciles was particularly significant in Germany, Sweden, the US, and the Netherlands, in the range of three to 15 times as high.
The OECD study identified various factors contributing to rising inequality, such as increased financial integration and technological change; increased imports from low-income countries, reducing employment prospects for less skilled workers; changes in labor market policies that tended to reduce income and benefits for less skilled workers; increasing prevalence of part-time work; greater numbers of single-headed households; increasing income shares for capital, benefiting rich households; increased incomes from self-employment, which reward the more highly skilled workers; and declining effectiveness of redistribution through taxes and transfers.
2.2.7 Gini coefficient, latest year
0
20
40
60
80%
OECD Latin America and the CaribbeanMiddle East and North Africa Sub-Saharan AfricaDeveloping Asia
Economies
Note: Markers indicate individual country observations for each region ranked by the value of the Gini coefficient. Gini coefficients for Latin America and the Caribbean and for OECD are estimated from per capita income. For developing Asia (except Malaysia and Taipei,China); Sub-Saharan Africa; Middle East and North Africa, coefficients are estimated from per capita consumption expenditure.
Sources: PovcalNet (accessed 9 March February 2012), supplemented by household survey data (most Pacific countries and India) and publications of official statistics offices (Republic of Korea and Taipei,China), OECDstat database (accessed 9 February 2012).
2.2.9 Gini coefficient of inequality in OECD countries
0 10 20 30 40 50 60
Gini disposable incomeGini market income
Slovenia
Denmark
Slovakia
Czech Republic
Norway
Belgium
Finland
Sweden
Austria
Hungary
Ireland
Switzerland
Luxembourg
France
Netherlands
Korea, Rep. of
Germany
Iceland
Estonia
Greece
Poland
Spain
New Zealand
Japan
Australia
Canada
Italy
United Kingdom
Portugal
Israel
United States
Turkey
Mexico
Chile
OECD Average
%Source: OECD Stat database (accessed 24 February 2012).

52 Asian Development Outlook 2012
2.2.8 Annualized change in Gini coefficient: Developing Asia and other regions
-9 -6 -3 0 3
Developing Asia
MaldivesBhutan
Uzbekistan
Timor-LesteKyrgyz Republic
ArmeniaKazakhstan
Fiji
SamoaThailandPakistan
Nepal
AzerbaijanMalaysia
Philippines
CambodiaViet Nam
Taipei,China
TajikistanIndia
MongoliaBangladesh
Georgia
Korea, Rep. ofSri Lanka
Lao PDR
IndonesiaPRC
%
-4 -2 0 2 4 6 8
Other developing regions
PeruNicaragua
MexicoEl Salvador
EcuadorPanama
BrazilDominican Rep.
ChileHonduras
GuatemalaUruguay
VenezuelaColombia
Costa RicaParaguay
Bolivia
MalawiGuinea-Bissau
EthiopiaMali
SenegalNiger
Burkina FasoKenya
MauritaniaGambiaLesotho
SwazilandGuinea
Central African Rep.Cameroon
MadagascarRwandaBurundiUganda
MozambiqueZambia
South AfricaNigeria
TanzaniaCôte d'Ivoire
GhanaSeychelles
JordanIran, Islamic Rep.Egypt, Arab Rep.
TunisiaMorocco
Yemen, Rep.
%
Middle East and
North Africa
Sub-Saharan Africa
Latin America and
the Caribbean
-2 -1 0 1 2
OECD members
TurkeyIrelandMexico
BelgiumHungary
ChileGreece
ItalyNew Zealand
Republic of KoreaNetherlands
Czech RepublicJapan
PortugalUnited Kingdom
FranceUnited States
AustraliaNorway
IsraelLuxembourg
CanadaAustria
GermanySpain
FinlandDenmark
Sweden
%Lao PDR = Lao People’s Democratic Republic; PRC = People’s Republic of China.
Source: ADB estimates based on PovcalNet (accessed 9 March 2012), supplemented by household survey data for mostly Pacific countries, and publications of official statistics offices (Republic of Korea and Taipei,China).
Confronting rising inequality in Asia 53
Inequality of opportunity
What is opportunity?An important development in the recent discourse on inequality is the focus on opportunity. Whether the opportunity is used well must be conceptually separated from whether it exists in the first place. The policy implications vary greatly depending upon whether the outcome was the result of differences in education and health available to an individual—opportunity—or differences in effort. A few examples will illustrate this point.
First, consider two low-income individuals. One, despite having been provided with a good education and health care, wastes this opportunity by not exerting enough effort and enterprise, and ends up with a low income. The other had poor education so that, despite being willing to work hard, ends up with low income. The first individual suffers due to lack of effort, while the second one is limited by his or her circumstances. The distinction here is that the first person could have applied more effort, while the second was constrained by a lack of opportunity.
But how do differences in opportunities arise in the first place? Consider two individuals with different levels of education and health because one did not have access to schools or health services. This could be because of discrimination in access for social reasons, or because of the services are not provided in certain geographic areas. Preventing individuals from enhancing their human capital to augment their earning potential—through discrimination or incomplete service coverage—creates inequality of opportunity.
Unfortunately, that is not the only way that unequal opportunities arise. Consider now two individuals with the same level of education and health, and the same level of effort and enterprise, but one of whom is simply not allowed to exercise that effort and enterprise to earn income. This exclusion could stem from discrimination in the labor or credit market, or from gender or racial bias. Such social exclusion creates inequality of opportunity as well.
Differences in opportunity can therefore arise because of differences in access to public services that lead to differences in human capital formation (education and health), or because of difference in access to income earning opportunities. However, the final outcome, in this case income actually earned, depends also on the effort and enterprise applied by the individual. Inequality of opportunity is thus a determinant of inequality of outcome, but not the sole factor.
Inequalities due to circumstances are ethically unacceptable because it is attributable to factors over which the individual has no control. In contrast, inequalities due to effort may be ethically acceptable, and may even be desirable to reward enterprise and thereby spur productivity and growth. Thus inequality of opportunity is the more important for policy action.

54 Asian Development Outlook 2012
Of course, in practice it is not easy to separate effort from opportunity, especially in an intergenerational context (Kanbur 2010). Thus parental income, which may be the result of their effort, nevertheless determines the opportunity of their children. Inequality of income, even if it is not of direct concern in this framework, will still be important as a determinant of inequality of opportunity.
This connection between inequality of income and of opportunity makes it important to study both, and for policy makers to address both dimensions of inequality. If drivers of inequality are such that any given inequality of opportunity is transformed into ever greater divergences in income, and this income inequality translates into inequality of opportunity in the next generation, policy makers will need to redouble their efforts to break the link between parental income and educational opportunity for their children.
Inequalities of education and health in AsiaAsia has made significant strides in improving average achievements in education and health. However, considerable inequalities remain, as now discussed.
EducationSignificant inequality in education persists in developing Asia, discussed here along three dimensions: wealth, location, and gender.11
Inequality by wealth quintile. Inequality in the proportion of out-of-school children between rich and poor households was, in the late 1990s to mid-2000s, very wide in developing Asia (UNESCO 2005). For example, in Bangladesh, India, Mongolia, Myanmar, and the Philippines, where the average proportion of out-of-school primary school-age children was about 20% in 1999–2003, children from the poorest quintile were three times as likely as those from the richest quintile to be out of school. In Cambodia and the Lao PDR, with an average proportion of about 35%, the children from the poorest quintile were four or five times as likely as those from the richest quintile to be out of school.
Results from more recent household survey data for Bhutan, Pakistan, and the Philippines show that inequality in education indicators persists (Figure 2.3.1). In Bhutan in 2007, the net attendance rate for primary schooling for the top-quintile households (based on per capita household expenditure) was more than two times as high as that for the bottom quintile. The ratio was even greater for secondary schooling at close to five
2.3.1 Gaps in school participation rates between top and bottom quintiles, 2000s
0
6
12
18
24
30
Final yearInitial year
PhilippinesPakistanBhutanPhilippinesPakistanBhutanPhilippinesPakistanBhutan
Quintile ratio
Net attendance rate (primary) Net attendance rate (post secondary)Net attendance rate (secondary)
Note: Net attendance rate refers to the percentage of children of primary (or secondary or post-secondary) school age attending primary (or secondary or post-secondary) school. Initial year refers to 2003 for Bhutan and 2002 for Pakistan and the Philippines; final year refers to 2007 for Bhutan, 2008 for Pakistan, and 2010 for the Philippines.
Source: ADB estimates using household survey data.
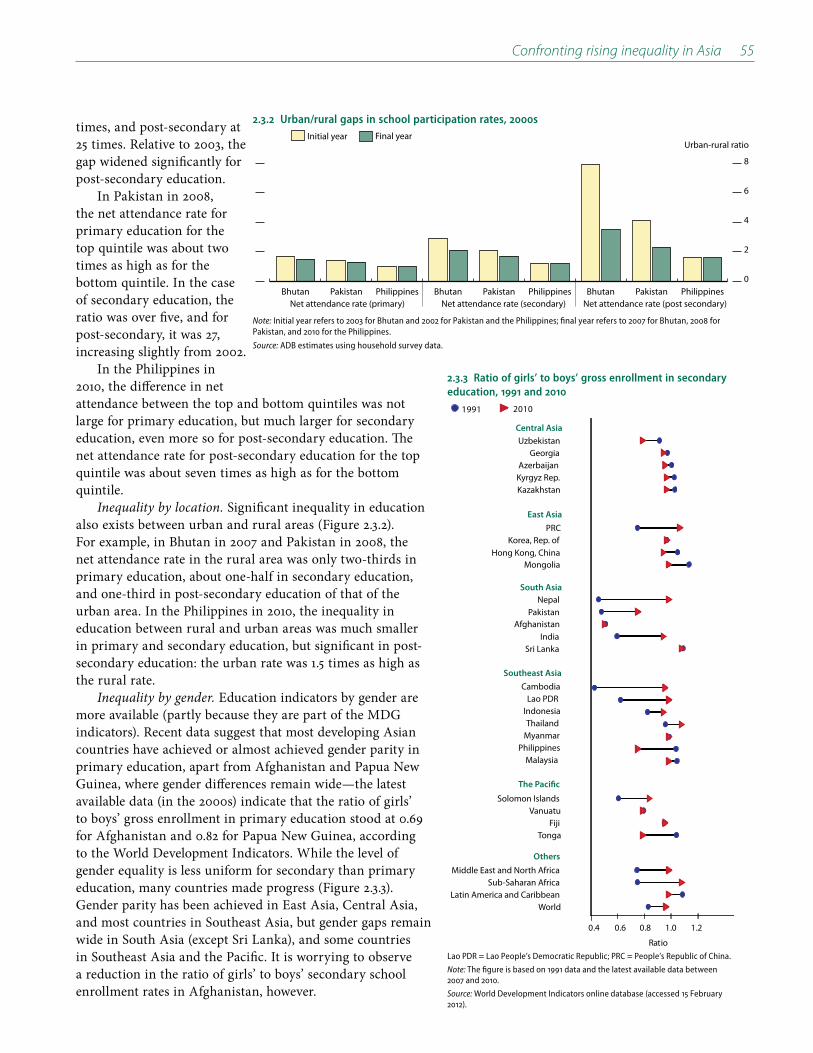
Confronting rising inequality in Asia 55
times, and post-secondary at 25 times. Relative to 2003, the gap widened significantly for post-secondary education.
In Pakistan in 2008, the net attendance rate for primary education for the top quintile was about two times as high as for the bottom quintile. In the case of secondary education, the ratio was over five, and for post-secondary, it was 27, increasing slightly from 2002.
In the Philippines in 2010, the difference in net attendance between the top and bottom quintiles was not large for primary education, but much larger for secondary education, even more so for post-secondary education. The net attendance rate for post-secondary education for the top quintile was about seven times as high as for the bottom quintile.
Inequality by location. Significant inequality in education also exists between urban and rural areas (Figure 2.3.2). For example, in Bhutan in 2007 and Pakistan in 2008, the net attendance rate in the rural area was only two-thirds in primary education, about one-half in secondary education, and one-third in post-secondary education of that of the urban area. In the Philippines in 2010, the inequality in education between rural and urban areas was much smaller in primary and secondary education, but significant in post-secondary education: the urban rate was 1.5 times as high as the rural rate.
Inequality by gender. Education indicators by gender are more available (partly because they are part of the MDG indicators). Recent data suggest that most developing Asian countries have achieved or almost achieved gender parity in primary education, apart from Afghanistan and Papua New Guinea, where gender differences remain wide—the latest available data (in the 2000s) indicate that the ratio of girls’ to boys’ gross enrollment in primary education stood at 0.69 for Afghanistan and 0.82 for Papua New Guinea, according to the World Development Indicators. While the level of gender equality is less uniform for secondary than primary education, many countries made progress (Figure 2.3.3). Gender parity has been achieved in East Asia, Central Asia, and most countries in Southeast Asia, but gender gaps remain wide in South Asia (except Sri Lanka), and some countries in Southeast Asia and the Pacific. It is worrying to observe a reduction in the ratio of girls’ to boys’ secondary school enrollment rates in Afghanistan, however.
2.3.2 Urban/rural gaps in school participation rates, 2000s
0
2
4
6
8
Final yearInitial year
PhilippinesPakistanBhutanPhilippinesPakistanBhutanPhilippinesPakistanBhutan
Urban-rural ratio
Net attendance rate (primary) Net attendance rate (post secondary)Net attendance rate (secondary)
Note: Initial year refers to 2003 for Bhutan and 2002 for Pakistan and the Philippines; final year refers to 2007 for Bhutan, 2008 for Pakistan, and 2010 for the Philippines.
Source: ADB estimates using household survey data.
2.3.3 Ratio of girls’ to boys’ gross enrollment in secondary education, 1991 and 2010
0.4 0.6 0.8 1.0 1.2
UzbekistanGeorgia
AzerbaijanKyrgyz Rep.Kazakhstan
PRCKorea, Rep. of
Hong Kong, ChinaMongolia
NepalPakistan
AfghanistanIndia
Sri Lanka
CambodiaLao PDR
IndonesiaThailand
MyanmarPhilippines
Malaysia
Solomon IslandsVanuatu
FijiTonga
Middle East and North AfricaSub-Saharan Africa
Latin America and CaribbeanWorld
Central Asia
East Asia
South Asia
Southeast Asia
The Pacific
Others
Ratio
1991 2010
Lao PDR = Lao People’s Democratic Republic; PRC = People’s Republic of China.
Note: The figure is based on 1991 data and the latest available data between 2007 and 2010.
Source: World Development Indicators online database (accessed 15 February 2012).
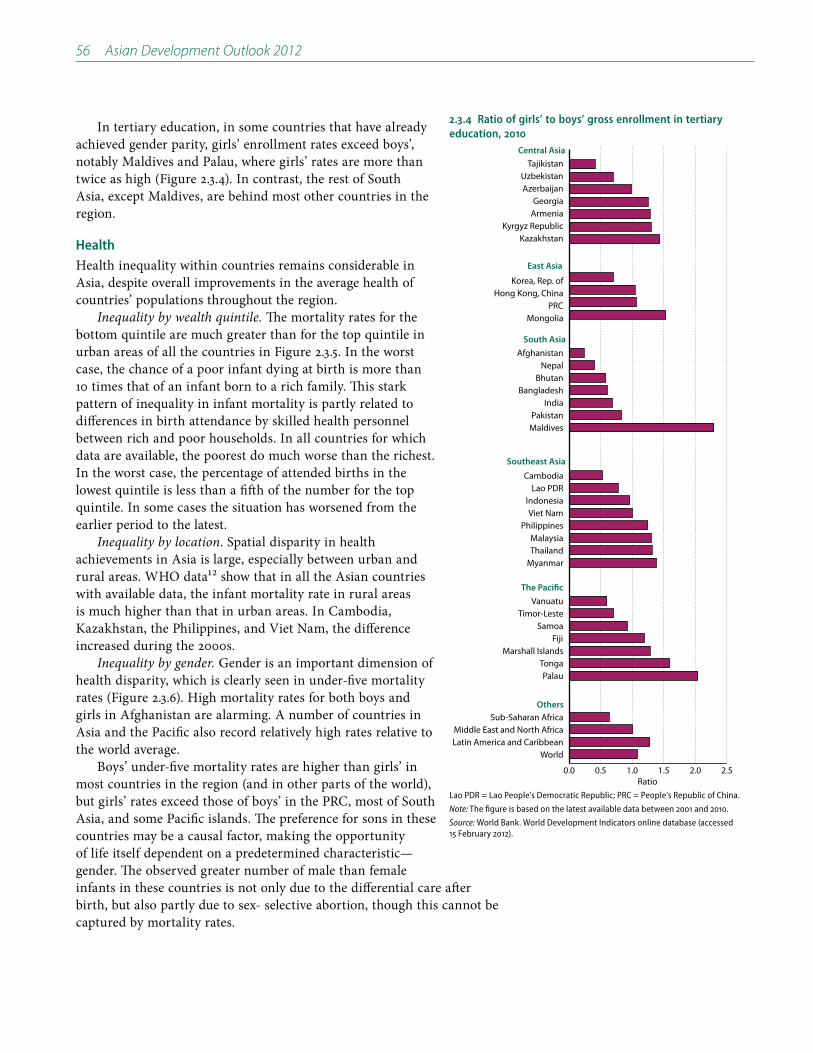
56 Asian Development Outlook 2012
2.3.4 Ratio of girls’ to boys’ gross enrollment in tertiary education, 2010
0.0 0.5 1.0 1.5 2.0 2.5
WorldLatin America and CaribbeanMiddle East and North Africa
Sub-Saharan Africa
PalauTonga
Marshall IslandsFiji
SamoaTimor-Leste
Vanuatu
MyanmarThailandMalaysia
PhilippinesViet Nam
IndonesiaLao PDR
Cambodia
MaldivesPakistan
IndiaBangladesh
BhutanNepal
Afghanistan
MongoliaPRC
Hong Kong, ChinaKorea, Rep. of
KazakhstanKyrgyz Republic
ArmeniaGeorgia
AzerbaijanUzbekistan
Tajikistan
Ratio
Central Asia
Others
The Pacific
Southeast Asia
South Asia
East Asia
Lao PDR = Lao People’s Democratic Republic; PRC = People’s Republic of China.
Note: The figure is based on the latest available data between 2001 and 2010.
Source: World Bank. World Development Indicators online database (accessed 15 February 2012).
In tertiary education, in some countries that have already achieved gender parity, girls’ enrollment rates exceed boys’, notably Maldives and Palau, where girls’ rates are more than twice as high (Figure 2.3.4). In contrast, the rest of South Asia, except Maldives, are behind most other countries in the region.
HealthHealth inequality within countries remains considerable in Asia, despite overall improvements in the average health of countries’ populations throughout the region.
Inequality by wealth quintile. The mortality rates for the bottom quintile are much greater than for the top quintile in urban areas of all the countries in Figure 2.3.5. In the worst case, the chance of a poor infant dying at birth is more than 10 times that of an infant born to a rich family. This stark pattern of inequality in infant mortality is partly related to differences in birth attendance by skilled health personnel between rich and poor households. In all countries for which data are available, the poorest do much worse than the richest. In the worst case, the percentage of attended births in the lowest quintile is less than a fifth of the number for the top quintile. In some cases the situation has worsened from the earlier period to the latest.
Inequality by location. Spatial disparity in health achievements in Asia is large, especially between urban and rural areas. WHO data12 show that in all the Asian countries with available data, the infant mortality rate in rural areas is much higher than that in urban areas. In Cambodia, Kazakhstan, the Philippines, and Viet Nam, the difference increased during the 2000s.
Inequality by gender. Gender is an important dimension of health disparity, which is clearly seen in under-five mortality rates (Figure 2.3.6). High mortality rates for both boys and girls in Afghanistan are alarming. A number of countries in Asia and the Pacific also record relatively high rates relative to the world average.
Boys’ under-five mortality rates are higher than girls’ in most countries in the region (and in other parts of the world), but girls’ rates exceed those of boys’ in the PRC, most of South Asia, and some Pacific islands. The preference for sons in these countries may be a causal factor, making the opportunity of life itself dependent on a predetermined characteristic—gender. The observed greater number of male than female infants in these countries is not only due to the differential care after birth, but also partly due to sex- selective abortion, though this cannot be captured by mortality rates.

Confronting rising inequality in Asia 57
2.3.5 Inequality in infant mortality rate, urban
0 5 10 15
Latest yearInitial year
NigeriaUgandaNamibia
CameroonChad
MozambiqueGuinea
MaliMalawi
KenyaNiger
RwandaSenegal
BeninGhana
Burkina FasoTanzania
MadagascarZambia
MoroccoEgypt
Jordan
PeruBolivia
NicaraguaHaiti
ColombiaDominican Rep.
Kyrgyz RepublicCambodia
NepalBangladesh
ArmeniaIndia
PhilippinesPakistan
UzbekistanKazakhstan
IndonesiaViet Nam
Low/high ratio
Developing Asia
Sub-Saharan Africa
Middle East
and North Africa
Latin America
and Caribbean
Note: The low/high ratio shows the ratio of infant mortality rates for those in the bottom quintile of wealth versus those in the top quintile. Initial year refers to earliest year in the 1990s (except for Armenia and Cambodia in 2000) and latest year in the 2000s for which data are available.
Source: WHO, Global Health Observatory Data Repository (accessed 17 February 2012).
2.3.6 Under-five mortality rate for girls and boys (deaths per 1,000 births), 2005−2010
0 70 140 210
BoysGirls
WorldSub-Saharan Africa
Northern AfricaLatin America and Carribean
Timor-LestePapua New Guinea
Solomon IslandsFSM
VanuatuTonga
SamoaFiji
CambodiaMyanmar
Lao PDRIndonesia
PhilippinesViet NamThailandMalaysia
Singapore
AfghanistanPakistan
IndiaBangladesh
BhutanNepal
MaldivesSri Lanka
MongoliaPRC
Korea, Rep. ofHong Kong, China
TajikistanTurkmenistan
UzbekistanAzerbaijan
Kyrgyz RepublicGeorgia
KazakhstanArmenia
Central Asia
Others
The Pacific
Southeast Asia
South Asia
East Asia
Deaths per 1,000 birthsFSM = Federated States of Micronesia; Lao PDR = Lao People’s Democratic Republic; PNG = Papua New Guinea; PRC = People’s Republic of China.
Source: World Development Indicators online database (accessed 15 February 2012).
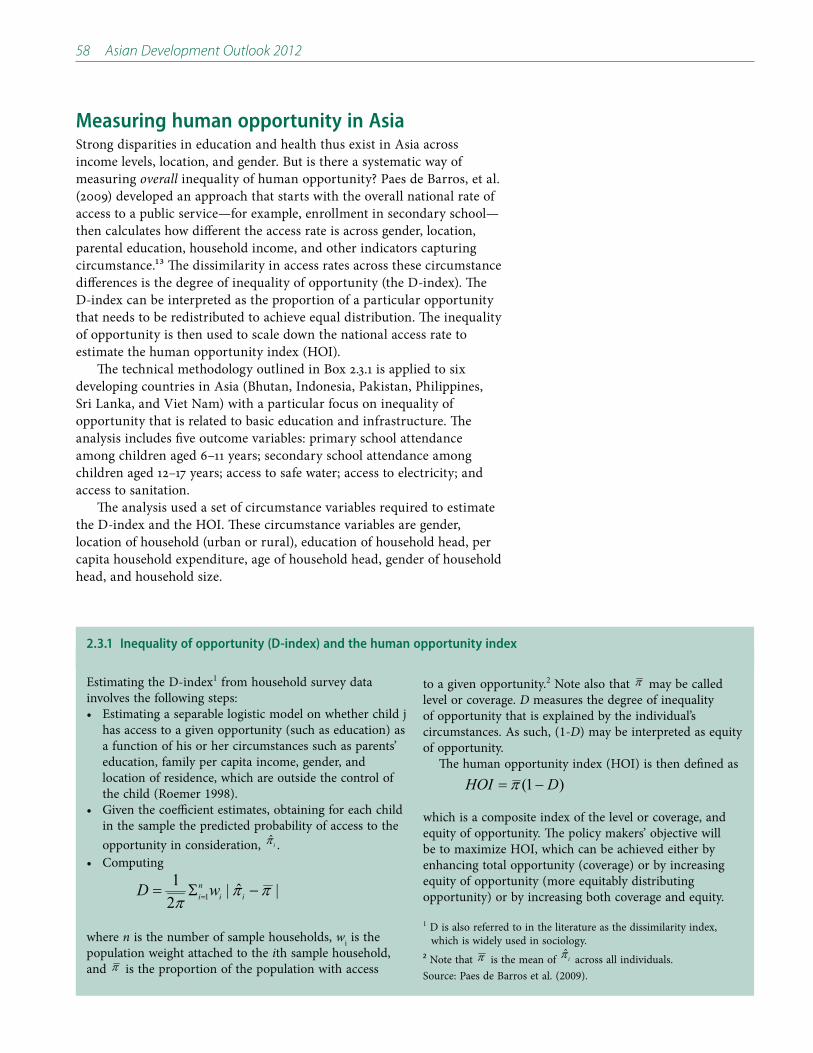
58 Asian Development Outlook 2012
Measuring human opportunity in AsiaStrong disparities in education and health thus exist in Asia across income levels, location, and gender. But is there a systematic way of measuring overall inequality of human opportunity? Paes de Barros, et al. (2009) developed an approach that starts with the overall national rate of access to a public service—for example, enrollment in secondary school—then calculates how different the access rate is across gender, location, parental education, household income, and other indicators capturing circumstance.13 The dissimilarity in access rates across these circumstance differences is the degree of inequality of opportunity (the D-index). The D-index can be interpreted as the proportion of a particular opportunity that needs to be redistributed to achieve equal distribution. The inequality of opportunity is then used to scale down the national access rate to estimate the human opportunity index (HOI).
The technical methodology outlined in Box 2.3.1 is applied to six developing countries in Asia (Bhutan, Indonesia, Pakistan, Philippines, Sri Lanka, and Viet Nam) with a particular focus on inequality of opportunity that is related to basic education and infrastructure. The analysis includes five outcome variables: primary school attendance among children aged 6–11 years; secondary school attendance among children aged 12–17 years; access to safe water; access to electricity; and access to sanitation.
The analysis used a set of circumstance variables required to estimate the D-index and the HOI. These circumstance variables are gender, location of household (urban or rural), education of household head, per capita household expenditure, age of household head, gender of household head, and household size.
Estimating the D-index1 from household survey data involves the following steps:
Estimating a separable logistic model on whether child j has access to a given opportunity (such as education) as a function of his or her circumstances such as parents’ education, family per capita income, gender, and location of residence, which are outside the control of the child (Roemer 1998).Given the coefficient estimates, obtaining for each child in the sample the predicted probability of access to the opportunity in consideration, i�̂ .Computing
|ˆ|21
1 ���
��� � iini wD
where n is the number of sample households, wi is the population weight attached to the ith sample household, and � is the proportion of the population with access
to a given opportunity.2 Note also that � may be called level or coverage. D measures the degree of inequality of opportunity that is explained by the individual’s circumstances. As such, (1-D) may be interpreted as equity of opportunity.
The human opportunity index (HOI) is then defined as)1( DHOI �� �
which is a composite index of the level or coverage, and equity of opportunity. The policy makers’ objective will be to maximize HOI, which can be achieved either by enhancing total opportunity (coverage) or by increasing equity of opportunity (more equitably distributing opportunity) or by increasing both coverage and equity.
1 D is also referred to in the literature as the dissimilarity index, which is widely used in sociology.
2 Note that � is the mean of i�̂ across all individuals.Source: Paes de Barros et al. (2009).
2.3.1 Inequality of opportunity (D-index) and the human opportunity index

Confronting rising inequality in Asia 59
Table 2.3.1 Inequality of opportunity in education (%)
Primary education, 6–11 years Secondary education, 12–17 years
Country Survey year Average opportunity
D-index Human opportunity
index
Average opportunity
D-index Human opportunity
index
Bangladesh 2000 75.6 3.5 72.9 58.3 8.1 53.5
Bhutan 2007 83.1 5.0 78.9 72.0 5.8 67.9
Indonesia 2009 94.3 0.9 93.4 80.6 3.7 77.6
Pakistan 2007-08 74.6 8.7 68.1 56.2 15.2 47.6
Philippines 2002 93.9 1.8 92.2 83.1 4.0 79.7
Sri Lanka 2009-10 99.4 0.1 99.3 86.4 2.2 84.5
Viet Nam 2008 96.3 1.3 95.1 82.0 4.4 78.3
Source: ADB estimates using household survey data.
Inequality of opportunity in basic education
The average coverage rate—or average opportunity—for primary education in various years in the 2000s was the highest for Sri Lanka (Table 2.3.1). It also had the lowest D-index—inequality of opportunity at close to zero, leading to a HOI of 99.3%. The three countries of Southeast Asia were moving toward universal access of basic primary education. For these countries, the estimated HOIs, higher than 90%, suggest that more than 90% of primary education services required for universal coverage are available and distributed equitably. Pakistan not only had the lowest average opportunity, its D-index was also the highest, leading to the lowest HOI among the six countries. For Pakistan and Bhutan, the relatively low HOI was due to both lower average opportunity and higher inequality of opportunity.
The HOIs for secondary schools (12–17 years old) are much lower among the six countries, suggesting that these countries face greater challenges in ensuring equal access to schools for children aged 12–17. The low HOIs are due to both lower average opportunity and higher inequality of opportunity than for primary education. This is expected because the opportunity costs of sending children to schools are higher at the secondary than the primary level. This also implies that financial incentives such as conditional cash transfer programs could be more effective in targeting older children if the main objective is to improve school enrollment.
Inequality of opportunity in basic infrastructure services for healthBasic services, such as safe water and sanitation (e.g., flushing toilets) have a direct impact on health status and overall well-being. Access to services such as electricity helps households increase their productivity for income generation. Studies show that a household’s access to basic infrastructure services is highly and significantly correlated with a lower probability of being poor (for example, Balisacan 2003; Fan, Zhang, and Zhang 2002).
Developing Asia faces a more serious challenge in providing basic infrastructure services than basic education services. The HOIs for access to basic infrastructure services such as safe water, electricity, and sanitation show lower values for all countries and higher dispersion across countries than those for access to basic education services,

60 Asian Development Outlook 2012
Table 2.3.2 Inequality of opportunity in access to basic infrastructure services (%)
Access to safe water Access to electricity Access to sanitation
Country Survey year Average opportunity
D-index Human opportunity
index
Average opportunity
D-index Human opportunity
index
Average opportunity
D-index Human opportunity
index
Bhutan 2007 89.9 3.4 86.9 70.1 13.3 60.8 26.5 43.5 15.0
Indonesia 2009 26.8 21.3 21.1 89.5 3.2 86.6 55.2 10.6 49.3
Pakistan 2007-08 34.2 24.1 25.9 90.2 4.7 86.0 66.0 17.7 54.3
Philippines 2002 61.5 12.1 54.1 78.5 12.5 68.6 85.6 6.4 80.2
Sri Lanka 2009-10 40.5 16.3 33.9 93.8 2.1 91.9 94.2 2.2 92.1
Viet Nam 2008 26.4 42.7 15.1 97.2 1.5 95.8 40.2 31.0 27.8
Source: ADB estimates using household survey data.
Table 2.3.3 Contribution of circumstance variables to inequality of opportunity for secondary education, 12–17 years (%)
Country Survey year Gender of children
Area of residence
(urban/rural)
Per capita household
expenditure
Age of household
head
Gender of household
head
Education level of
household head
Household size
Bhutan 2007 3.4* 42.4* 54.7* 4.1* 1.4* -4.5* -1.6
Indonesia 2009 0.2* 11.6* 69.1* 0.4* 1.5* 17.2* 0.1
Pakistan 2007-08 9.5* 5.2* 61.0* 0.2 1.2* 24.0* -1.1*
Philippines 2002 6.4* 2.4* 90.7* 0.3* -0.5* 0 0.6
Sri Lanka 2009-10 1.3* 0.8* 96.0* 0.6 0.7 0 0.6
Viet Nam 2008 4.0* 6.6* 65.7* 1.2 -0.4 11.0* 12.0*
Note: * indicates that the estimated coefficient was found to be statistically significant at 5 level in the logit regression model of the probability of school attendance among the secondary-school-age children, 12-17 years.
Source: ADB estimates based on household surveys.
Table 2.3.4 Contribution of circumstance variables to inequality of opportunity for access to sanitation (%)
Country Survey year Area of residence
(urban/rural)
Per capita household
expenditure
Age of household
head
Gender of household
head
Education level of
household head
Household size
Bhutan 2007 43.7* 33.7* 1.7* 1.4* 21.0* -1.6*
Indonesia 2009 79.6* 17.0* 0.6* 0.1* 2.7* 0.1*
Pakistan 2007-08 38.7* 50.6* 0.6* 0.8* 10.1* -0.8*
Philippines 2002 2.5* 97.2* 1.1* 0.1* 0.7* -1.5*
Sri Lanka 2009-10 -0.3* 98.9* 2.4* 0 0.0* -0.9*
Viet Nam 2008 29.0* 67.0* 0.8* 1.5* 2.3* -0.6*
Note: * indicates that the estimated coefficient was found to be statistically significant at 5 level in the logit regression model of the probability of having access to sanitation.
Source: ADB estimates using household survey data.
highlighting the uneven rates of progress in expanding opportunities for basic infrastructure services in the region (Tables 2.3.2–2.3.4).
The lower HOIs in access to basic infrastructure services compared to those in access to education are due to lower levels of average opportunity and higher levels of inequality of opportunity in some countries, especially for access to safe water and to sanitation. In Viet Nam, for instance, a low HOI in access to safe water, at 15.1%, is due to a low
Confronting rising inequality in Asia 61
average opportunity at 26.4% and high inequality of opportunity at 42.7%. In Bhutan, a low HOI in access to sanitation, at 15%, is due to both a low average opportunity at 26.5% and high inequality of opportunity at 43.5%.
Determinants of inequality of opportunityThe estimation of the D-index is based on seven circumstance variables, including gender of children, area of residence, per capita household expenditure, gender, age and education attainment of household head, and household size. The Paes de Barros et al. (2009) decomposition is used to show the importance of each of these variables in contributing to the inequality of opportunity. The following discussion focuses only on secondary education and access to sanitation.
Per capita household expenditure is the most important contributing factor to inequality of opportunity in access to secondary education (Table 2.3.3). For example, it explains 54.5% of the variation in Bhutan and 96% in Sri Lanka. Location of residence (urban and rural) of children is also important (for Bhutan and Indonesia). Education attainment of the household head also has a significant influence for Indonesia, Pakistan and Viet Nam. Another important factor is gender of children. Variables including household size, and age and gender of household head, are not important contributing factors.
In the case of access to safe water, sanitation, and electricity, per capita household expenditure is a major driver of inequality of opportunity, and so is residence location (Table 2.3.4), especially in the Philippines, Sri Lanka, Viet Nam, and Pakistan. In Indonesia and Bhutan, the largest contributing factor is location of residence. Education attainment of household head is also an important contributing factor in Bhutan and Pakistan. Other circumstance variables play insignificant roles.
It is well known that access to safe water and sanitation is generally lower in rural than urban areas. This is due to the relatively higher cost of building water and sanitation infrastructure as well as lower income levels in rural than urban areas. Rural areas often lack an enabling environment that encourages public or private investment in water services, leading to low provision of those services. This is a particular problem in South Asia where there is low overall public or private investment in the infrastructure particularly in Bangladesh, India, and Pakistan (WaterAid 2011). Moreover, even if investments are made, poor maintenance is an additional constraint.
SummaryMuch needs to be done to improve the distribution of opportunities, as measured by disparities in access to basic services, in developing countries in Asia. Sri Lanka’s achievements in equitably providing basic education opportunities demonstrate the importance and possible effectiveness of public policy in achieving equity of opportunity, particularly in education. The need for action is urgent because, without it, inequality of opportunity will be magnified into greater and greater inequality of outcome, which will then continue the cycle of inequality of opportunity and outcome for the next generation.
62 Asian Development Outlook 2012
What drives inequality in developing Asia?
Drivers and channels of inequalityTechnological progress, globalization, and market-oriented reform have been the key drivers of developing Asia’s rapid growth in the last 2 decades—but they also had huge distributional consequences. Together, they have favored skilled rather than unskilled labor, capital rather than labor, and urban and coastal areas rather than rural and inland regions. These changes can explain many of the movements in inequality in many regional countries.
Technological change can impact on the distribution of income among different factors of production. If it favors skilled labor (more educated or more experienced) over unskilled labor by increasing its relative productivity, we could expect the skill premium—the ratio of skilled to unskilled wages—to go up, which would most likely increase income inequality. Technological change could also affect the distribution of income between labor and capital. If it is biased in favor of capital, it could also increase inequality since capital incomes, in general, are less equally distributed and accrue to the rich more than to the poor.
In a similar fashion, globalization can affect income distribution. Trade integration, for example, could change relative demand for and hence relative wages of skilled and unskilled workers. It could also affect income distribution between capital and labor because capital and skills often work together due to their complementarity. Financial integration could broaden access to finance by the poor—but could also increase the risk of financial crises and hurt the poor more than the rich. Globalization can magnify the distributional impact of technological progress.
A large literature has emerged in recent years attempting to understand the impacts of trade integration, financial integration, and technological change on income distribution (Box 2.4.1), though it has yet to provide a clear-cut answer. One complication is that there are several, closely linked, confounding factors.14
Market-oriented reform is an important driver of growth, but can also have significant distributional consequences. Trade policy reform is often part of the driving forces of globalization. Labor market reforms can change the bargaining position of labor vis-à-vis capital owners, impacting on wage rates and income distribution between labor and capital. Economic transition from a command to a market economy can improve efficiency and make returns to assets more closely reflective of resource scarcity, which can affect income distribution among different productive assets in a significant way.
Moreover, the impacts of the three drivers of growth—technological progress, globalization, and market-oriented reform—can be

Confronting rising inequality in Asia 63
There is general consensus among researchers and policy makers that Asia’s stellar growth performance could not have been achieved without its embrace of globalization. All countries in Asia are committed to greater integration with the global economy in coming decades. How does greater openness of an economy influence income inequality? Economic analysis does not provide a clear answer.
The simplest trade theory predicts that for countries with abundant unskilled labor, opening the economy should raise the wages of unskilled labor and depress the wages for skilled workers and returns to capital, as the country specializes in low-skill production, increasing equality (Stolper and Samuelson 1941). The historical
evidence on “growth with equity” from the Republic of Korea; Singapore; and Taipei,China seems to support this thesis (Wood 1999).
The recent evidence on trade, openness, and inequality, however, is mixed, especially for economies that are not readily characterized as being abundant in unskilled labor, are resource rich, or have production structures not easily captured by the simple model. The channels between market opening and inequality are complex, and the quest for clarity in results remains elusive (box table).
Empirically, a number of variables that affect inequality can confound the effect of trade openness on inequality, most notably financial integration, and skill-biased technological change and rising skill premiums.
2.4.1 Globalization and inequality
Channels between market opening and inequality
Mechanism and result Sample or data Literature
Net effect on inequality: Decrease
Financial integration can spur growth and benefit the poor Meta-survey Demirguc-Kunt and Levine (2007)
Net effect on inequality: No effect
Trade liberalization Survey of results for Mexico, Colombia, Brazil, Chile (1990s)
Goldberg and Pavcnik (2007)
Net effect on inequality: Inconclusive or varying
Trade liberalization may decrease or increase wage differentials Survey for Latin America and East Asia (1960−1970s, 1980s−1990s)
Wood (1999)
Financial integration may increase the poor’s access to finance, but gains may be captured by elite: Inequality increases at low income levels; decreases as income rises
Meta-survey Claessens and Perotti (2007)
Trade openness benefits the rich more than the poor in very poor countries; it benefits the poor and middle class more as income rises.
Household surveys, World Income Distribution (WYD) database (1988, 1993, 1998)
Milanovic (2005)
Financial globalization increases Gini coefficient by about 0.04; trade globalization decreases Gini coefficient by about 0.05.
Global dataset (1980s−2000s) IMF (2007)
Net effect on inequality: Increase
FDI increases demand for high-skilled workers 119 countries (1993−2004) from World Development Indicators 2004
Choi (2006)
FDI increases demand for skilled workers, explains 11% of wage inequality
101 manufacturing industries in UK (1983 −1992)
Taylor and Driffield (2005)
FDI increases demand for high-skilled workers, and thus explains 50% of the increase in share of skilled labor
Data on foreign assembly plants in Mexico (1975−1988)
Feenstra and Hanson (1997)
Trade induces skill-intensification in the traded manufacturing sector, resulting in a 0.10 percentage change in wage premium
Micro-level data from approximately 1 million workers in Mexico (1987 −1993)
Cragg and Epelbaum (1996)
Trade index explains 10–12% of wage gap between workers with different schooling; financial index explains 12–33% of the gap; capital account index explains 25–30%.
Household surveys from 18 Latin American countries (1977−1998)
Behrman, Birdsall, and Székely (2003)
Financial integration may lead to crises which hurt poor; Poverty incidence increased from 1997 to 1998 in Indonesia, 11–19.9%; Republic of Korea, 2.6–7.3%; Malaysia, 8.2–10.4%; Thailand, 9.8–12.9%
Indonesia, Republic of Korea, Malaysia, Thailand, and some Latin American countries (Asian financial crisis period)
Fallon and Lucas (2002)
Financial integration may lead to crises that hurt poor; macroeconomic volatility increases poverty index by about 0.35 to 0.40.
Macroeconomic data on various countries (World Bank Live Database) (1980s−1990s)
Agenor (2002)
Source: ADB staff compilation.

64 Asian Development Outlook 2012
geographically uneven, leading to a further channel of changing income distribution: spatial inequality. This is because new economic opportunities, released by these drivers, are often most easily seized by locations closer to the existing trade routes—coastal areas, for example, not inland ones—and areas with better public infrastructure—such as urban locations, not rural areas. This leads to shifts in income distribution among different geographic locations.
Complicating the analysis is that the impacts of the three drivers are intertwined. Although they can be disentangled conceptually, it is difficult to do so empirically. In the next three sections, therefore, instead of trying to isolate their impacts, we will look at three channels through which the three drivers affect income inequality: shifts in income distribution between skilled and unskilled labor, by examining returns to human capital and the skill premium; between labor and capital, by analyzing labor and capital income shares; and between different locations, by estimating spatial inequality. This approach also facilitates discussions of policy responses.
Yet those individuals and groups excluded from the market because of individual circumstances beyond their control or discrimination would certainly not benefit from these opportunities—inequality of opportunity magnifies the distributional consequences of the three drivers. One such group is women—discussed in the final section.
Increasing skill premiumsInequality of education is a major contributor to inequality of income. There is significant global evidence that the rates of return to progressively higher levels of education have been trending upward in recent years. In OECD countries, for instance, those who do not complete an upper secondary education could earn an average of 23% less than their counterparts who do complete that level of education. A person with a tertiary education can expect to earn over 50% more than a person with an upper secondary or postsecondary non-tertiary education (OECD 2011b).
In Asia, empirical studies find that the returns to education increase with education attainment and that the relationship has been getting steeper over time. An ADB study (2007b) finds that from the mid-1990s to mid-2000s, real wage grew much faster for wage earners with tertiary or higher education than for those with lower educational attainments in India and the Philippines, leading to wider wage differentials. The same study also finds that education is the single most important factor among those variables that were included in analyzing wage inequality. In the case of India, the Gini coefficient of wages increased from 40.5 in 1993 to 47.2 in 2004. Half of the increase can be explained by individual characteristics. Of this explained increase, about 50% is accounted for by education.
Many other studies have provided direct or indirect evidence of rising skill/education premiums in developing Asia. Son (2010) finds that, in the Philippines, education increases individuals’ employability. In 2003, the probability of being employed was 57% for individuals with tertiary education, while it was 34% for those with primary education only. This

Confronting rising inequality in Asia 65
difference in employability increased from 1997 to 2003. Further, the difference in employability due to differences in education attainment was more pronounced among poorer households.
A study on India, the Philippines, and Thailand finds that the rate of return to college education has risen relative to those to secondary education between the mid-1990s and mid-2000s (Mehta et al. 2011). It is found that this rise was related to the expansion of high-skill services jobs: employing only 7–11% of the labor force, they contributed 40–70% of the rate of return to college education.
A more recent study (World Bank 2012a) reports that the tertiary education premium15 stood at 90% for Cambodia (2007), 60% for PRC (2005), 84% for Indonesia (2007), 70% for Mongolia (2007), 70% for the Philippines (2006), 120% for Thailand (2004) and 55% for Viet Nam (2006). In Cambodia, PRC, Mongolia, and Viet Nam the premium increased in recent years across sectors. In Indonesia, the tertiary education premium increased in the manufacturing sector, and in the Philippines, it increased in the services sector.
Household survey data help reveal patterns of income inequality due to educational attainment (in this case, of the household head) (Figure 2.4.1). First, education inequality almost always accounts for more than 20% of the total income inequality. Second, the share of total income inequality explained by education inequality has by and large been on the increase. The share of inequality accounted for by differences in education attainment increased in all the countries during the periods looked at, with the increase most significant in PRC, from 8.1% in 1995 to 26.5% in 2007.
As in the rest of the world, developing Asia is facing strong upward pressure on the wage gap between skilled and unskilled labor. Is this because of skill-biased technological progress? There are empirical difficulties in isolating this factor because the wage premium depends on both demand and supply side factors. Unsurprisingly, analysts have come down on both sides of the explanation.16 To the extent that skill-biased technological change happens, its impact can be transmitted through globalization. It is unlikely that policy makers can reverse this trend, nor should they want to, since technological progress is delivering higher levels of productivity and growth in the economy. The answer, rather, is to address inequality in human capital itself (further discussed in the final section).
Declining share of labor incomeData show that in the last 2 decades the income share of labor has been on the decline and that of capital on the rise in many OECD countries. In the US, for example, the labor income share in the industry sector declined from 65% in 1992 to 52.4% in 2009 (Figure 2.4.2). For the entire US economy, the labor income share declined from 68.7% to 64.2% during the same period. Similarly, in Germany, the labor income share of the industry sector
2.4.1 Income inequality decomposition by educational attainment of household head
0 10 20 30 40 502008
20051995
20091994
20082002
20101990
2009/101993
20071995
20072003Bhutan
Viet Nam
Thailand
Philippines
Pakistan
Indonesia
India
PRC
Share of between-group inequality, %PRC = People’s Republic of China.
Note: Estimates are based on per capita expenditure in nominal terms, except for the PRC which is based on income. The decomposition is based on GE().
Source: ADB estimates using household survey data and data from the Chinese Household Income Project.
2.4.2 Labor income share of industry, major OECD countries, 1980–2011
50
60
70
80
United StatesUnited KingdomJapanItalyGermanyFrance
100520009590851980
%
Note: Annual labor income share is calculated as total labor costs in nominal terms divided by nominal output.
Source: OECD Stat database (accessed 1 March 2012)

66 Asian Development Outlook 2012
peaked at 79.5% in 1993 from the rise that started in mid-1980s, and it was on decline since.
Declining labor income share means that the growth of wage rates lags behind growth of labor productivity. A number of contributing factors have been identified to explain this. The first is that technological change, especially connected with improvements in information and communication technologies, has raised the productivity of and return to capital relative to labor. The second is the decrease in the bargaining power of labor, due to changing labor market policies and declining union membership in these countries. The third is increased globalization and trade openness, that led to migration of relatively more labor intensive sectors from advanced economies to emerging economies—with the sectors remaining in the advanced economies being relatively less labor-intensive and having a lower average share of labor income (Jacobson and Occhino 2012; Arpaia, Perez, and Pichelmann 2009). It has also been noted that globalization and trade openness increase the elasticity of labor demand, which also weakens labor’s bargaining position (Rodrik 1997; Harrison 2002).
Empirical evidence suggests that Asia is following this trend—all the economies in Figure 2.4.3 saw declines in labor income shares during the mid-1990s to mid-2000s.
What are the causes of the decline in labor income in developing Asia? Technological progress in the region appears to have been labor-saving and capital-using. Partly, this can be explained by a high level of capital accumulation in many Asian countries (Felipe 2009, ADB forthcoming). As a result, the wage employment elasticity of growth17 has been on decline in many countries in recent years (Figure 2.4.4)—in the PRC from 0.44 in 1991–2001 to 0.28 in 2001–2011 and in India from 0.53 to 0.41, for example. This decline means that each percentage of employment growth now requires a higher percentage of output growth than in the past—a phenomenon sometimes referred to as “jobless growth.”
A declining employment elasticity of growth implies increases in labor productivity. Annual growth of manufacturing labor productivity in 2000–2008 reached 6.7% in PRC, 5.5% on Malaysia, and was in the range of 3-4% in Indonesia, Pakistan, Thailand, Viet Nam, and Philippines (APO 2011).
That labor productivity is increasing but the labor income share is declining implies that real wage growth has lagged behind labor productivity growth, partly because of the presence of a large pool of rural surplus labor in many countries associated with their dual-economy structure.18 The pool of surplus labor weakens the bargaining power of labor and depresses wages in the non-agricultural sectors, contributing to declines in the labor income share when globalization and market-oriented reform led to rapid growth. In India, for instance, the average annual growth rate of labor productivity was 7.4% during 1990–2007, while average annual real wage growth rate was only 2% (Box 2.4.2). In the case of PRC, Zhuang (1996)
2.4.3 Share of labor income to industrial/manufacturing value added, selected Asian countries
0
20
40
60
Mid-2000sEarly 2000sMid-1990sEarly 1990s
BANHKGINDMALSININOTAPPRCKORJPN
%
BAN = Bangladesh; PRC = People’s Republic of China; HKG = Hong Kong, China; IND = India; INO = Indonesia; JPN = Japan; KOR = Republic of Korea; MAL = Malaysia; SIN = Singapore; TAP = Taipei,China.
Note: Early 1990s (1990-1992), mid-1990s (1994-1996), early 2000s (2000-2002), mid-2000s (2004-2006) for PRC; India; Singapore; Malaysia; India; Hong Kong, China; and Bangladesh.
Source: OECD Stat database for Japan; Republic of Korea; Taipei,China; and Indonesia (accessed 1 March 2012); Felipe and Sipin (2004) for Singapore; Malaysia; Hong Kong, China; Bangladesh; Bai and Qian (2009) for PRC; and Felipe and Kumar (2010) for India’s organized manufacturing sector.
2.4.4 Wage employment elasticity of growth in selected Asian countries, 1991–2001 and 2001–2011
0.0 0.2 0.4 0.6 0.8 1.0 1.2
2001−20111991−2001
Developing Asia
World
Viet Nam
Pakistan
Cambodia
Philippines
Bangladesh
Indonesia
India
Thailand
Malaysia
PRC
Sri Lanka
ElasticityPRC = People’s Republic of China.
Note: Simple average for world and developing Asia.
Source: International Labour Organization. 2011. Trends Econometric Models. October 2011.

Confronting rising inequality in Asia 67
shows that if the labor market had been fully liberalized and controls over labor transfer from rural to urban areas fully relaxed in the early 1980s, urban wage rates would have fallen and the labor income share of the urban sector decrease by half.
A lower share of income going to labor and higher share of income going to capital tends to increase inequality, because capital income is more unequally distributed (due to asset inequality) than income from basic wage labor.
Figure 2.4.5 shows the Gini coefficients for wealth for Asian countries and a selection of comparator countries—it is seen that they are much higher than income inequality.
The declining employment elasticity in Asia is of concern because the poor and middle class rely heavily on labor for their income. Figure 2.4.6 shows a higher wage employment elasticity is associated with a smaller increase in inequality. The policy implications of the close relationship between employment and inequality are significant. They suggest a search for policies that promote employment (discussed in the final section).
Spatial inequality—up to half the totalAs the distribution of economic activity is structured geographically—high concentrations and incomes in some locations, and low on both counts in others—so do the distribution of income and its evolution. Some locations have natural advantages—like fertile soil for agriculture,
The figure shows that over the period 1990-2007, labor productivity in India’s organized manufacturing sector grew much faster than the real wage rate. While the latter did not even double during the period, labor productivity increased three-fold, from about 80,000 to about 250,000 rupees. This implies that gains in productivity were not passed on to wages and, consequently, the labor share of India’s organized manufacturing sector declined significantly.
2.4.2 India’s formal sector: Real wage rate and labor productivity growth
Growth of real wage rate and labor productivity in India’s formal sector, 1990–2007
-20
-10
0
10
20
30
Labor productivity Real wage rate
070520029996931990
Growth rate, %
Note: Growth rates are based on wage rate and labor productivity in constant 1993-94 rupees.
Source: Kumar and Felipe (2011).
2.4.5 Inequality in wealth distribution, selected economies
0 20 40 60 80 100
Nigeria
Argentina
Brazil
Japan
Spain
Italy
Australia
Netherlands
Germany
Canada
United Kingdom
Russian Federation
Turkey
Mexico
France
United States
Switzerland
PRC
Republic of Korea
Taipei,China
Bangladesh
India
Viet Nam
Pakistan
Thailand
Indonesia
World
Gini coefficient, %
Developing Asia
OECD
Others
PRC = People’s Republic of China; OECD = Organisation for Economic Co-operation and Development.
Note: Gini coefficient pertains to inequality in wealth distribution, where wealth refers to net worth or the value of physical and financial assets less liabilities. The data are for around the year 2000.
Source: Davies et al. (2008).
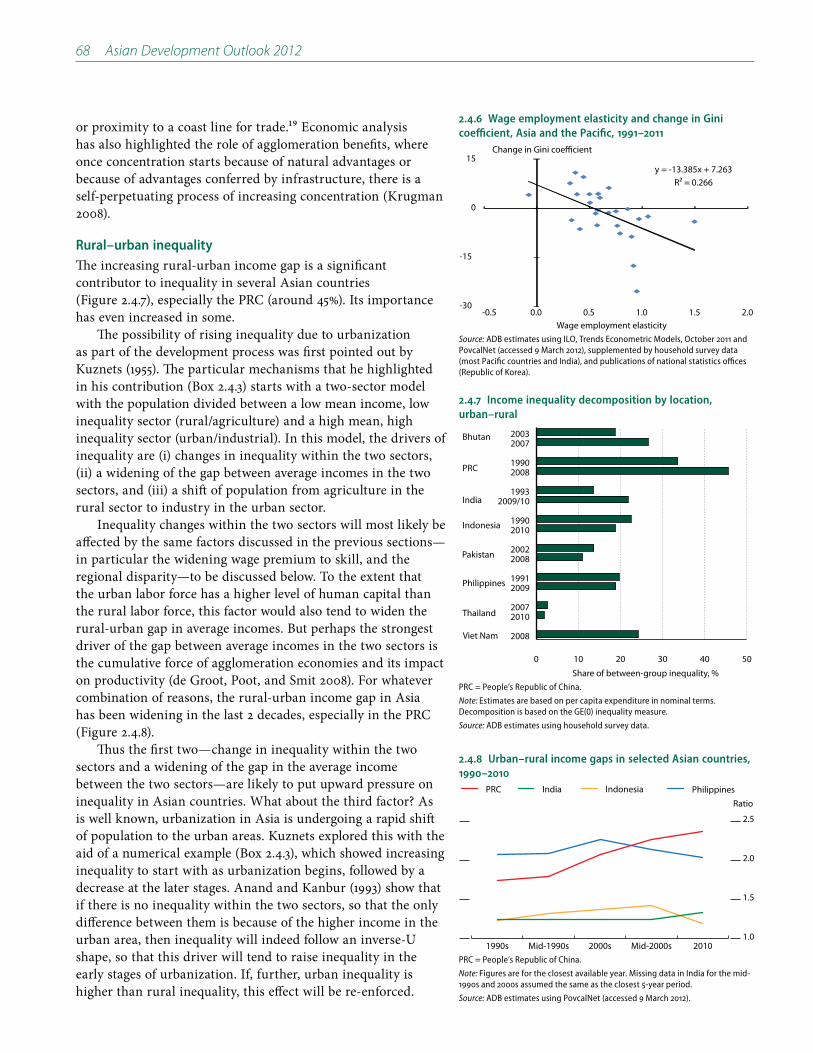
68 Asian Development Outlook 2012
or proximity to a coast line for trade.19 Economic analysis has also highlighted the role of agglomeration benefits, where once concentration starts because of natural advantages or because of advantages conferred by infrastructure, there is a self-perpetuating process of increasing concentration (Krugman 2008).
Rural–urban inequalityThe increasing rural-urban income gap is a significant contributor to inequality in several Asian countries (Figure 2.4.7), especially the PRC (around 45%). Its importance has even increased in some.
The possibility of rising inequality due to urbanization as part of the development process was first pointed out by Kuznets (1955). The particular mechanisms that he highlighted in his contribution (Box 2.4.3) starts with a two-sector model with the population divided between a low mean income, low inequality sector (rural/agriculture) and a high mean, high inequality sector (urban/industrial). In this model, the drivers of inequality are (i) changes in inequality within the two sectors, (ii) a widening of the gap between average incomes in the two sectors, and (iii) a shift of population from agriculture in the rural sector to industry in the urban sector.
Inequality changes within the two sectors will most likely be affected by the same factors discussed in the previous sections—in particular the widening wage premium to skill, and the regional disparity—to be discussed below. To the extent that the urban labor force has a higher level of human capital than the rural labor force, this factor would also tend to widen the rural-urban gap in average incomes. But perhaps the strongest driver of the gap between average incomes in the two sectors is the cumulative force of agglomeration economies and its impact on productivity (de Groot, Poot, and Smit 2008). For whatever combination of reasons, the rural-urban income gap in Asia has been widening in the last 2 decades, especially in the PRC (Figure 2.4.8).
Thus the first two—change in inequality within the two sectors and a widening of the gap in the average income between the two sectors—are likely to put upward pressure on inequality in Asian countries. What about the third factor? As is well known, urbanization in Asia is undergoing a rapid shift of population to the urban areas. Kuznets explored this with the aid of a numerical example (Box 2.4.3), which showed increasing inequality to start with as urbanization begins, followed by a decrease at the later stages. Anand and Kanbur (1993) show that if there is no inequality within the two sectors, so that the only difference between them is because of the higher income in the urban area, then inequality will indeed follow an inverse-U shape, so that this driver will tend to raise inequality in the early stages of urbanization. If, further, urban inequality is higher than rural inequality, this effect will be re-enforced.
2.4.6 Wage employment elasticity and change in Gini coefficient, Asia and the Pacific, 1991–2011
y = -13.385x + 7.263R² = 0.266
-30
-15
0
15
-0.5 0.0 0.5 1.0 1.5 2.0
Change in Gini coefficient
Wage employment elasticitySource: ADB estimates using ILO, Trends Econometric Models, October 2011 and PovcalNet (accessed 9 March 2012), supplemented by household survey data (most Pacific countries and India), and publications of national statistics offices (Republic of Korea).
2.4.7 Income inequality decomposition by location, urban–rural
0 10 20 30 40 50
2008
20102007
20091991
20082002
20101990
2009/101993
20081990
20072003Bhutan
Viet Nam
Thailand
Philippines
Pakistan
Indonesia
India
PRC
Share of between-group inequality, %PRC = People’s Republic of China.
Note: Estimates are based on per capita expenditure in nominal terms. Decomposition is based on the GE() inequality measure.
Source: ADB estimates using household survey data.
2.4.8 Urban–rural income gaps in selected Asian countries, 1990–2010
1.0
1.5
2.0
2.5
PhilippinesIndonesiaIndiaPRC
2010Mid-2000s2000sMid-1990s1990s
Ratio
PRC = People’s Republic of China.
Note: Figures are for the closest available year. Missing data in India for the mid-1990s and 2000s assumed the same as the closest 5-year period.
Source: ADB estimates using PovcalNet (accessed 9 March 2012).
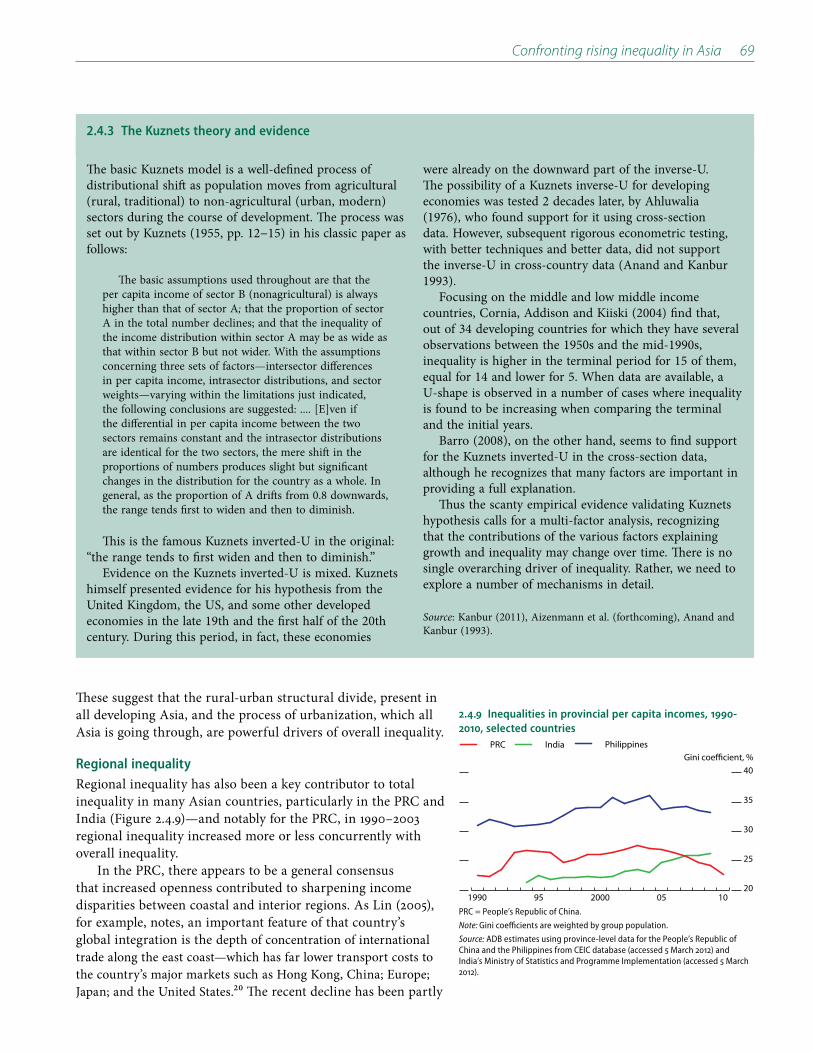
Confronting rising inequality in Asia 69
The basic Kuznets model is a well-defined process of distributional shift as population moves from agricultural (rural, traditional) to non-agricultural (urban, modern) sectors during the course of development. The process was set out by Kuznets (1955, pp. 12−15) in his classic paper as follows:
The basic assumptions used throughout are that the per capita income of sector B (nonagricultural) is always higher than that of sector A; that the proportion of sector A in the total number declines; and that the inequality of the income distribution within sector A may be as wide as that within sector B but not wider. With the assumptions concerning three sets of factors—intersector differences in per capita income, intrasector distributions, and sector weights—varying within the limitations just indicated, the following conclusions are suggested: .... [E]ven if the differential in per capita income between the two sectors remains constant and the intrasector distributions are identical for the two sectors, the mere shift in the proportions of numbers produces slight but significant changes in the distribution for the country as a whole. In general, as the proportion of A drifts from 0.8 downwards, the range tends first to widen and then to diminish.
This is the famous Kuznets inverted-U in the original: “the range tends to first widen and then to diminish.”
Evidence on the Kuznets inverted-U is mixed. Kuznets himself presented evidence for his hypothesis from the United Kingdom, the US, and some other developed economies in the late 19th and the first half of the 20th century. During this period, in fact, these economies
were already on the downward part of the inverse-U. The possibility of a Kuznets inverse-U for developing economies was tested 2 decades later, by Ahluwalia (1976), who found support for it using cross-section data. However, subsequent rigorous econometric testing, with better techniques and better data, did not support the inverse-U in cross-country data (Anand and Kanbur 1993).
Focusing on the middle and low middle income countries, Cornia, Addison and Kiiski (2004) find that, out of 34 developing countries for which they have several observations between the 1950s and the mid-1990s, inequality is higher in the terminal period for 15 of them, equal for 14 and lower for 5. When data are available, a U-shape is observed in a number of cases where inequality is found to be increasing when comparing the terminal and the initial years.
Barro (2008), on the other hand, seems to find support for the Kuznets inverted-U in the cross-section data, although he recognizes that many factors are important in providing a full explanation.
Thus the scanty empirical evidence validating Kuznets hypothesis calls for a multi-factor analysis, recognizing that the contributions of the various factors explaining growth and inequality may change over time. There is no single overarching driver of inequality. Rather, we need to explore a number of mechanisms in detail.
Source: Kanbur (2011), Aizenmann et al. (forthcoming), Anand and Kanbur (1993).
2.4.3 The Kuznets theory and evidence
These suggest that the rural-urban structural divide, present in all developing Asia, and the process of urbanization, which all Asia is going through, are powerful drivers of overall inequality.
Regional inequalityRegional inequality has also been a key contributor to total inequality in many Asian countries, particularly in the PRC and India (Figure 2.4.9)—and notably for the PRC, in 1990–2003 regional inequality increased more or less concurrently with overall inequality.
In the PRC, there appears to be a general consensus that increased openness contributed to sharpening income disparities between coastal and interior regions. As Lin (2005), for example, notes, an important feature of that country’s global integration is the depth of concentration of international trade along the east coast—which has far lower transport costs to the country’s major markets such as Hong Kong, China; Europe; Japan; and the United States.20 The recent decline has been partly
2.4.9 Inequalities in provincial per capita incomes, 1990-2010, selected countries
20
25
30
35
40
PhilippinesIndiaPRC
10052000951990
Gini coefficient, %
PRC = People’s Republic of China.
Note: Gini coefficients are weighted by group population.
Source: ADB estimates using province-level data for the People’s Republic of China and the Philippines from CEIC database (accessed 5 March 2012) and India’s Ministry of Statistics and Programme Implementation (accessed 5 March 2012).

70 Asian Development Outlook 2012
attributed to the government’s great western development strategy (Fan, Kanbur, and Zhang 2011).
In India, coastal states have also fared better than inland states, although here a set of compounding factors such as initial level of human capital and public infrastructure is also important (Kanbur, Gajwani, and Zhang 2007). New private-sector industrial investments typically take place in existing industrial and coastal districts to reduce costs, and overall investments have become more concentrated.
More generally, the interplay between market-oriented reforms and economies of agglomeration appear to have given certain regions within countries an edge when it comes to economic growth. Indeed, this interplay has been linked to increasing inequality in Southeast Asia and East Asia’s middle-income economies (Gill and Kharas 2007). Figure 2.4.10 provides decomposition results for regional inequality in selected Asian countries. In the late 2000s, between-region inequality can explain 20–30% of the national inequality in Bhutan, Philippines, and Viet Nam, and 10–15% in PRC, Indonesia, India, and Sri Lanka.
Spatial inequality: The combined contributionCombining the two components of the spatial inequality and calculating the fraction of total inequality explained by rural-urban and inter-region (provinces or states) divides, we see a share of more than half for the PRC (Figure 2.4.11).
In sum, the widening gaps between provinces and states, on the one hand, and between urban and rural areas on the other, provides and will provide the geographic driver of inequality in Asia. These divides are important in themselves, and because they account for a significant proportion of observed inequality in Asian countries. The driver of inequality in the spatial dimension is the interaction between new opportunities through trade, technology, and market-oriented reform, interacting with the structure of geography and infrastructure.
2.4.1o Income inequality decomposition, province/region
0 5 10 15 20 25 30 352008
20102007
20091991
20082002
20101990
2009/101993
20081990
20072003Bhutan
Viet Nam
Thailand
Philippines
Pakistan
Indonesia
India
PRC
Share of between-group inequality, %PRC = People’s Republic of China.
Note: Estimates are based on per capita expenditure in nominal terms. Decomposition is based on the GE() inequality measure.
Source: ADB estimates using household survey data.
2.4.11 Combined contribution of spatial inequality to overall inequality, selected Asian countries
0
20
40
60
PRC (2007)
Bhutan (2007)
Viet Nam (2008)
India (2008)
Indonesia (2009)
Pakistan (2008)
Philippines (2009)
Sri Lanka (2009)
%
PRC = People’s Republic of China.
Note: Spatial inequality covers both between-region and urban-rural inequality. The estimation involves dividing all sample households into groups classified by both region and urban/rural. For example, if a country has 20 provinces, the total groups will be 40 (20 urban and 20 rural). The between-group inequality is the combined spatial inequality.
Source: ADB estimates using household survey data.

Confronting rising inequality in Asia 71
The rise in spatial inequality is not a reason to reverse openness and technological progress, or stop the reform process, but rather to reorient infrastructure investment to lagging regions, and to remove barriers to migration to the fast-growing regions.
Similarly, the process of urbanization cannot be reversed—nor should it, because it brings with it higher national productivity and growth. But it raises the question of policy responses to the rise in inequality that it can also bring with it.
Gender inequalityIf some individuals are partially or wholly excluded from access to education and health, or from participating in markets, this blocks a source of income and becomes a driver of inequality in society. Social exclusion therefore magnifies the distributional impact of globalization, technological progress, and market-oriented reform. In this section, we consider the issue of gender inequality.
Economic growth and gender inequalityThe effect of economic growth on gender inequality in labor markets is ambiguous. Economic growth can narrow gender inequality through a number of channels, including the demise of traditional structures that reinforce human capital differences between men and women, the rising opportunity cost of women’s time outside of the labor force, the strengthening of women’s economic and property rights, technological progress, and the introduction of labor-saving consumer durables.
Yet economic growth does not necessarily mean inequality will decline, especially if unpaid work burdens, biased laws, differential access to resources, and social norms continue to constrain women in their ability to take advantage of new, well-paid jobs. A growing number of empirical studies have indicated that economic growth may improve or worsen gender inequality depending on the gendered indicator under consideration.
Increased openness to trade and FDI often brings increased access to employment for women in export-oriented labor-intensive manufacturing. At issue is the extent to which women have actually benefited from international trade and foreign investment through new paid employment opportunities. Some argue that gains in women’s employment have been accompanied by precarious working conditions and an expansion of informal-sector jobs that lack basic legal and social protections and are not subject to formal economic regulations. As firms face pressure in international markets to keep production costs low, the jobs they offer become increasingly insecure; employment is often temporary, casual, flexible, and characterized by poor working conditions (Benería 2007).
Another concern is low wages for women. Economic growth generated through export promotion may put downward pressure on the wages of workers in the export sector and, to the extent that women workers account for a high proportion of employment, contribute to wider gender wage gaps. Supporting this argument, Berik, Rodgers, and Zveglich (2004) used data for Taipei,China and the Republic of Korea and found that increasing competition from international trade is associated

72 Asian Development Outlook 2012
with larger wage gaps between men and women. Because the analysis controlled for gender differences in productivity characteristics, the widening wage gap was interpreted as a sign of increased wage discrimination.
Yet others have argued that jobs in the export sector offer better pay compared to the alternatives for women workers, and the evaluation of wages in the export sector ought to consider wages in alternative jobs, wages expressed in hourly terms, and non-wage working conditions (Kabeer 2004).
Technological change can also affect gender inequality. Several studies have shown that in middle- and higher-income economies, technological improvements have led to displacement of women from low-paying jobs in import-competing sectors. In particular, Anker (1998) provided evidence that women in middle- and higher-income economies tend to cluster in manufacturing industries that have begun to upgrade their technologies, reduce the size of their workforce, and move production to lower-wage countries.
In the case of Taipei,China, technological upgrading and rising capital intensity of export-oriented manufacturing after 1980 was linked to a relative decline in employment opportunities for women (Berik 2000). Women in lower-income countries can also experience job displacement when technological change makes traditional female jobs redundant and when women face barriers to training for new jobs (Jhabvala and Sinha 2002).
Women’s labor force participationA specific dimension of opportunity is participation in the labor market. This generates income through the use of what is often poor women’s only asset, their labor. Labor force participation is much lower for women than for men in most Asia-Pacific countries, averaging around 0.7 (Figure 2.4.12), with wide variations (Afghanistan the lowest, the Lao PDR the highest).
What are the determinants of women’s labor force participation? At a macro level, a stylized fact is that economic development and women’s participation in the formal labor market exhibit a fairly predictable and well-documented relationship. When countries begin to industrialize, female labor force participation falls as the household farm model becomes less common and more women engage exclusively in non-market activities such as child care and housework. In more advanced economies, female participation rates begin to rise again as growing numbers of women engage in market-based economic activity, often in combination with raising children. This trend generates a U-shaped function that fits time-series and cross-sectional data for a number of countries at different stages of development (Goldin 1994, Mammen and Paxson 2000, and Tam 2011). The pattern across Asia-Pacific countries is consistent with this U-shaped relationship (Figure 2.4.13).
The micro evidence can uncover various forces behind women’s engagement in the labor market. An empirical study, based on
2.4.12 Women’s labor force participation rate, 2010
0.0 0.2 0.4 0.6 0.8 1.0Vanuatu
Solomon IslandsSamoa
Timor-LesteFiji
Lao PDRCambodiaMyanmarViet NamThailand
SingaporeBrunei Darussalam
PhilippinesIndonesia
Malaysia
NepalBhutan
MaldivesBangladesh
Sri LankaIndia
PakistanAfghanistan
PRCMongolia
Hong Kong, ChinaRepublic of Korea
AzerbaijanKazakhstan
TajikistanGeorgia
Kyrgyz RepublicArmenia
UzbekistanTurkmenistan
Central Asia
East Asia
South Asia
Southeast Asia
The Pacific
%Lao PDR = Lao People’s Democratic Republic; PRC = People’s Republic of China; OECD = Organisation for Economic Co-operation and Development.
Note: Labor force participation rate refers to age groups 15 and over.
Source: International Labour Organization. Key Indicators of the Labor Market (accessed 22 March 2012).

Confronting rising inequality in Asia 73
2.4.13 Women’s labor force participation rates and per capita GDP in Asia, 2010
ARM
AUSAZEBAN
BHU
BRU
CAM
PRC
FIJ
GEO
HKG
IND
INO JPN
KAZ
KOR
KGZ
LAO
MAL
MLDMON
NEP
NZL
PAK
PNG
PHISAM
SIN
SOL
SRI
TAJTHA
TIM
TKMUZB
VAN
VIE
20
40
60
80
Female labor force participation (%
)
7.0 8.0 9.0 10.0 11.0Ln GDP per capita
ARM = Armenia; AUS = Australia; AZE = Azerbaijan; BAN = Bangladesh; BHU = Bhutan; BRU = Brunei Darussalam; CAM = Cambodia; PRC = People’s Republic of China; FIJ= Fiji; GEO = Georgia; HKG = Hong Kong, China; IND = India; INO = Indonesia; JPN = Japan; KAZ = Kazakhstan; KOR = Republic of Korea; KGZ = Kyrgyz Republic; LAO = Lao People’s Democratic Republic; MAL = Malaysia; MLD = Maldives; MON = Mongolia; NEP = Nepal; NZL = New Zealand; PAK = Pakistan; PHI = Philippines; PNG = Papua New Guinea; SAM = Samoa; SIN = Singapore; SOL = Solomon Islands; SRI = Sri Lanka; TAJ = Tajikistan; THA = Thailand; TIM = Timor-Leste; TKM = Turkmenistan; UZB = Uzbekistan; VAN = Vanuatu; VIE = Viet Nam.
Note: All data are for 2010 or the closest year available. GDP per capita is adjusted by PPP indexes, in constant 2005 international .
Sources: International Labour Organization. Key Indicators of the Labour Market. http://kilm.ilo.org/kilmnet; World Bank. World Development Indicators online database (both accessed 19 March 2012).
Demographic and Health Survey data from nine Asian countries spanning the 2005–2009 period, estimated the likelihood of a woman engaging in employment, conditional on the full set of personal and household characteristics (Rodgers and Zveglich forthcoming).
The results show that household wealth, in particular, can have different effects in different countries, and the results also point to important interactions between women’s role as caregivers to young children and their employment decisions—in every country, married women are less likely to be employed as compared to their single counterparts, and this relationship is statistically significant and fairly large in seven of the nine economies. Overall, these results point to the importance of policy actions that support women’s roles as caregivers of young children at the same time that they are employed in market-based activities.
SummaryThis section argues that technological progress, globalization, and market-oriented reform—the key drivers of Asia’s rapid growth—are the basic forces behind the rising inequality in many Asian countries in the last 2 decades, and these forces have changed income distribution through three channels: capital, skill, and spatial bias. The bias toward physical capital reduces labor’s share of national income while increasing the income share of the owners of capital. Similarly, the heightened demand for better skilled workers raises the premium on their earnings. And spatial disparities are becoming more acute: locations with superior infrastructure, market access, and scale economies—such as urban centers and coastal areas—are better able to benefit from changing circumstances. Empirical evidences are provided to support these arguments. Empirical evidence is consistent with these arguments. Finally, inequality of opportunity magnifies the distributional consequences of these driving factors.

74 Asian Development Outlook 2012
Confronting rising inequality: Policy options
Summary of key findingsDeveloping Asia’s rapid growth in recent decades has led to a significant reduction in extreme poverty, but it has also been accompanied by rising inequality in many countries. Income inequality has increased in 11 out of the 28 countries with comparable data, the 11 accounting for 82% of the total population. In many countries, income inequality coexists with non-income inequality in the form of unequal access to education, health, and basic services among different population groups classified by gender, location, and income. Asia’s rising inequality contrasts with the “growth with equity” story that characterized the transformation of the newly industrialized economies in the 1960s and 1970s, and with recent trends in other parts of the developing world, in particular Latin America, where income inequality has been on decline since the 1990s.
Technological change, globalization, and market-oriented reform—the main drivers of Asia’s rapid economic growth—are the basic driving forces behind the rising inequality in Asia. Working together, these have significantly impacted on inequality through a number of channels, in particular:
Increasing skill premiums and returns to human capital. The emergence of vast new economic opportunities, unleashed by trade and financial integration, technological progress, and market-oriented reform, has increased returns to human capital and the skill premium, with individuals having higher education and skill attainments able to benefit more from the new opportunities. Our analysis shows that in many countries as high as 25–35% of the total income inequality can be explained by inter-person differences in human capital and skill endowments.Falling labor income shares. As in many countries in other parts of the world, technological progress appears to have favored capital over labor. The abundance of labor relative to capital, which depresses wage rates, is also a contributing factor to the declining labor income share in developing Asia. Since capital is less equally distributed, this has contributed to rising inequality.Increasing spatial inequality. Some regions, especially urban and coastal areas, are better able to respond to the new opportunities because of their advantages in infrastructure and market access, as well as agglomeration economies from a self-perpetuating process of increasing concentration. The process of urbanization reinforces the inequality effects of agglomeration. Our analysis shows that in many Asian countries about 30-50% of income inequality is accounted for by spatial inequality due to uneven growth.

Confronting rising inequality in Asia 75
The impact of the basic driving forces of inequality has been compounded by various forms of unequal access to opportunity—to earn income from labor and to build human capital—caused by institutional weaknesses, market distortions and failures, and social exclusion.
The basic driving forces of inequality cannot—and should not—be reversed. They generate productivity growth, which underpins Asia’s poverty reduction, betterment of quality of life, and prosperity. However, high inequality could undermine social cohesion, political stability, and sustainability of growth, and a divided and highly unequal nation cannot be prosperous, as shown by international experience. Rising inequality could also lead to demands for populist measures that would be detrimental to efficiency and growth.
How should Asian governments respond to the rising inequality? Via three sets of policy measures. These approaches cannot eliminate inequality, but will go a long way toward reducing it and, at the same time, not endanger development and hurt growth.
Efficient fiscal policy. Measures include increasing spending on education and health, especially for the poorer; developing better targeted social protection schemes, including conditional cash transfers that target income to the poorest but also incentivize the building of human capital; and greater revenue mobilization through broadening the tax base and improving tax administration, and switching spending from inefficient general subsidies to targeted transfers.Interventions to address lagging regions. Measures include improving regional connectivity; developing new growth poles in lagging regions; strengthening fiscal transfers for greater investment in human capital and better access to public services in lagging regions; and removing barriers to migration from poor to more prosperous areas.More employment-friendly growth. Policies include facilitating structural transformation and maintaining a balanced sectoral composition of growth between manufacturing, services, and agriculture; supporting the development of small and medium-sized enterprises; removing factor market distortions that favor capital over labor; strengthening labor market institutions; and introducing public employment schemes as a temporary bridge to address pockets of unemployment and underemployment.
Efficient fiscal policyFiscal policy is a key part of the policy responses to rising inequality
in Asia. Both government spending and taxation can affect inequality. Asian governments have ample room to maneuver in using their fiscal policy to address the challenge of rising inequality, depending on individual country circumstances. This could involve increasing human capital investment and social protection provision—financing the increased spending on these through greater and more equitable revenue mobilization—and switching spending on inefficient general price subsidies (as for fuel) to targeted transfers.

76 Asian Development Outlook 2012
Fiscal spending
A large part of inequality in developing Asia is explained by differences in individual attainments in education and human capital. Returns to human capital are largely driven by the market, and it may not be efficient and or even desirable for governments to try to alter them. However, it is efficient and desirable for governments to reduce inequality in the distribution of human capital in the population, by making public investments in education and health and by ensuring that all members of society have equal access to these basic services, regardless of their individual circumstances. A recent study shows that government spending on education and health help reduce income inequality (Box 2.5.1). It has also been well documented that a key contributing factor to the recent decline in income inequality in many Latin American countries is improved access to education by the poor (Esquivel, Lustig, and Scott 2010, for example).
Increasing spending on education and health. Figures 2.5.1 and 2.5.2 show wide variations in spending on education and health as a share of GDP among developing Asian countries. In 2010, in 15 out of the 33 Asian countries where comparative data are available, government spending on education as a share of GDP was less than 4%, including the PRC, India, Indonesia, Pakistan, and the Philippines, compared with an OECD average of 5.2%. In 2009, in 20 out of the 41 Asian countries with comparable data, government spending on health as a share of GDP was less than 5%, including most economies in East Asia, South Asia, and
Both taxation (particularly personal income taxes) and public spending reduce inequality, but public spending has a larger impact on the distribution of income, according to a study of 150 countries with data for 1970–2009.
The results in the box table suggest that government expenditures on health and education reduce income inequality in Asia and the rest of the world. But expenditure on social protection and housing appears to increase income inequality in Asia, whereas it lowers it in the rest of the world.
Asia has made substantial progress toward achieving the Millennium Development Goals and targets on education and health. These achievements are consistent with the finding that education and health expenditures reduce inequality. However, social protection policies generally remain limited in Asia, and in countries where they exist, they tend to have a narrow coverage, extended mainly to urban population and the formal sector. This could explain the paradoxical finding of social protection spending increasing inequality in Asia. The finding suggests that universal social protection that covers the entire population would help reduce inequality.
For taxation, the results provide evidence that personal income taxes reduce inequality, with a greater
effect in Asia than in the rest of the world, possibly because of a larger number of people not paying income tax. Although taxes by themselves are less effective in redistributing income, taxation is crucial to raise financing for government expenditure to achieve distributional objectives.
2.5.1 Estimating the impact of fiscal policies on income inequality
Estimated marginal impact of government spending on the Gini coefficient (percentage points)
Asia Rest of the world
Social protection 0.490 -0.276
Education -0.486 -0.034
Health -0.241 -0.330
Housing 2.162 -0.614
Note: A negative sign means that an increase in government spending reduces the Gini coefficient. The numbers show the percentage point change in income inequality (measured by the Gini coefficient) associated with a 1 percentage point increase in the government expenditure variable.
Source: Claus, Martinez-Vazquez, and Vulovic. Forthcoming.
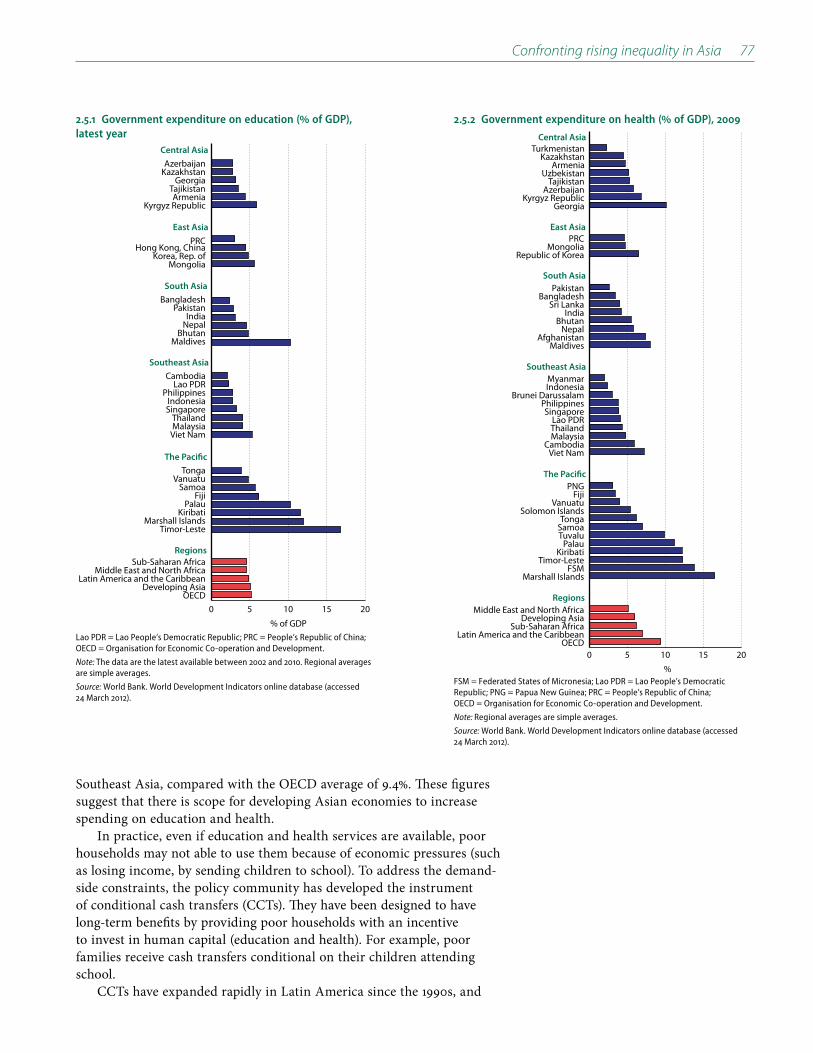
Confronting rising inequality in Asia 77
Southeast Asia, compared with the OECD average of 9.4%. These figures suggest that there is scope for developing Asian economies to increase spending on education and health.
In practice, even if education and health services are available, poor households may not able to use them because of economic pressures (such as losing income, by sending children to school). To address the demand-side constraints, the policy community has developed the instrument of conditional cash transfers (CCTs). They have been designed to have long-term benefits by providing poor households with an incentive to invest in human capital (education and health). For example, poor families receive cash transfers conditional on their children attending school.
CCTs have expanded rapidly in Latin America since the 1990s, and
2.5.1 Government expenditure on education ( of GDP), latest year
0 5 10 15 20OECD
Developing AsiaLatin America and the Caribbean
Middle East and North AfricaSub-Saharan Africa
Timor-LesteMarshall Islands
KiribatiPalau
FijiSamoa
VanuatuTonga
Viet NamMalaysiaThailand
SingaporeIndonesia
PhilippinesLao PDR
Cambodia
MaldivesBhutan
NepalIndia
PakistanBangladesh
MongoliaKorea, Rep. of
Hong Kong, ChinaPRC
Kyrgyz RepublicArmenia
TajikistanGeorgia
KazakhstanAzerbaijan
% of GDP
Central Asia
East Asia
South Asia
Southeast Asia
The Pacific
Regions
Lao PDR = Lao People’s Democratic Republic; PRC = People’s Republic of China; OECD = Organisation for Economic Co-operation and Development.
Note: The data are the latest available between 2002 and 2010. Regional averages are simple averages.
Source: World Bank. World Development Indicators online database (accessed 24 March 2012).
2.5.2 Government expenditure on health ( of GDP), 2009
0 5 10 15 20OECD
Latin America and the CaribbeanSub-Saharan Africa
Developing AsiaMiddle East and North Africa
Marshall IslandsFSM
Timor-LesteKiribati
PalauTuvaluSamoaTonga
Solomon IslandsVanuatu
FijiPNG
Viet NamCambodia
MalaysiaThailandLao PDR
SingaporePhilippines
Brunei DarussalamIndonesiaMyanmar
MaldivesAfghanistan
NepalBhutan
IndiaSri Lanka
BangladeshPakistan
Republic of KoreaMongolia
PRC
GeorgiaKyrgyz Republic
AzerbaijanTajikistan
UzbekistanArmenia
KazakhstanTurkmenistan
%
Central Asia
East Asia
South Asia
Southeast Asia
The Pacific
Regions
FSM = Federated States of Micronesia; Lao PDR = Lao People’s Democratic Republic; PNG = Papua New Guinea; PRC = People’s Republic of China; OECD = Organisation for Economic Co-operation and Development.
Note: Regional averages are simple averages.
Source: World Bank. World Development Indicators online database (accessed 24 March 2012).

78 Asian Development Outlook 2012
The Pantawid Pamilyang Pilipino Program (4Ps) has run since January 2008. It aims to provide cash grants to extremely poor households and allow them to meet certain human development goals—health, nutrition, and education of children below 15 years—set by the government. Around 3 million households nationwide are targeted under 4Ps in 2012, out of a 18.5 million households in 2009.
The targeting involves a number of steps, including selecting the poorest municipalities and cities within each selected province based on poverty incidence, and identifying poor households in the selected municipalities and cities using a proxy means testing that assesses household socioeconomic characteristics such as ownership of assets, type of housing units, educational attainment of household head, family livelihood, and access to water and sanitation facilities.
To be eligible for 4Ps, a household must have an income equal to or below the provincial poverty threshold; have children 0–14 years old and/or a pregnant woman at the time of assessment; and agree to meet the program conditions. The conditions have both health and education
components. In particular, pregnant women must avail of pre- and post-natal care and childbirth must be attended by a health professional. Parents are required to attend “family development sessions” conducted by local governments. Children aged 0–5 must get regular preventive health check-ups and vaccines, and those aged 6–14 must receive deworming pills twice a year. Children 3–14 years old must attend classes at least 85% of the time. Schools are required to report the attendance rate of program beneficiaries to their municipal governments.
The program benefits include P500 (around $12) a month per household for health and nutrition expenses, and P300 a month per child attending school for 10 months, up to a maximum of three children per household. Transfers are generally handed to the most responsible adult in the household, and are credited to the “cash card facility” of the government-owned Land Bank of the Philippines.
Source: DSWD 2012, Pantawid Pamilyang Pilipino Program. http://pantawid.dswd.gov.ph/ (accessed 28 March 2012).
2.5.2 Conditional cash transfers in the Philippines: The Pantawid Pamilyang Pilipino Program
have been found to be effective in improving education and health indicators for poor households in many countries (Schultz 2004; Schady and Araujo 2006). In Asia, CCTs have been implemented in Bangladesh, Cambodia, Pakistan and, more recently, Indonesia and the Philippines (Box 2.5.2). CCT programs, which are financially sustainable and combined with complementary programs to improve the delivery of health care and education services, could play an important role to reduce poverty and inequality in Asia.
Increasing social protection spending. Social protection also has an important role in reducing inequality. Social safety nets mitigate the risks of external and transitory livelihood shocks, as well as meeting the minimum needs of the chronically poor. Exposure to such shocks can have a profound and long-lasting impact not only on economic well-being, but also on accumulation of human capital, such as education and health. Social safety nets act as a coping mechanism for poor and vulnerable people and help improve well-being by investing in human capital in the long run, which, in turn, can enhance accessibility of those with limited assets and capabilities to opportunities (Ali and Zhuang 2007).
Despite the increasing recognition of the importance of social safety nets in the region, their provision remains limited. ADB (2008) shows that very few developing Asian have adequate social safety nets, compared with Japan or the Republic of Korea. One reason is the limited resources allocated to social protection (Figure 2.5.3).
Countries often face many challenges in increasing social protection provision, including:

Confronting rising inequality in Asia 79
2.5.3 Social protection expenditure ( of GDP), 2008
0 5 10 15 20Developing Asia
Japan
Marshall IslandsTuvaluNauru
Cook IslandsFiji
TongaVanuatu
PNG
Viet NamMalaysia
PhilippinesIndonesiaCambodia
Lao PDR
Sri LankaBangladesh
IndiaNepal
PakistanMaldives
Bhutan
MongoliaRepublic of Korea
PRC
UzbekistanKyrgyz Republic
AzerbaijanKazakhstan
ArmeniaTajikistan
% of GDP
Central Asia
East Asia
South Asia
Southeast Asia
The Pacific
Others
Lao PDR = Lao People’s Democratic Republic; PNG = Papua New Guinea; PRC = People’s Republic of China.
Note: Social protection expenditure covers labor market programs, social insurance, social assistance, micro- and area-wide programs (including microcredit), and child protection. The 4.4 figure for developing Asia is a simple average.
Source: ADB (2008).
2.5.4 Share of the poor receiving social protection (), 2008
0 20 40 60 80 100Developing Asia
Japan
Cook IslandsNauruTuvalu
FijiTonga
VanuatuMarshall Islands
PNG
Viet NamIndonesia
MalaysiaCambodia
Lao PDRPhilippines
IndiaSri LankaMaldives
BangladeshNepal
BhutanPakistan
Republic of KoreaMongolia
PRC
KazakhstanKyrgyz Republic
AzerbaijanTajikistan
UzbekistanArmenia
%
Central Asia
East Asia
South Asia
Southeast Asia
The Pacific
Others
Lao PDR = Lao People’s Democratic Republic; PNG = Papua New Guinea; PRC = People’s Republic of China.
Note: The figure for developing Asia is a simple average.
Source: ADB (2008).
Affordability. While this is often raised as an issue, studies have shown that the costs of basic universal social protection are not beyond the reach of most developing countries (for example, Ortiz and Yablonski 2010). ILO (2008) shows that virtually all countries can afford basic social security.21
Targeting. Poor beneficiaries of social protection programs account for, on average, only about 54.8% of the poor population in developing Asia, pointing to a clear case for improving targeting (Figure 2.5.4).
Institutional and administrative capacity. Examples include better accounting, rigorous financial controls, human resource development, computerization, and greater disclosure to stakeholders.
Switching general price subsidies to targeted transfers. Increased spending on education, health, and social protection can be partly financed by reducing some other spending items. In most Asian countries, infrastructure investment is inadequate and should not be the target for spending reduction through switching. But switching

80 Asian Development Outlook 2012
government spending from general subsidies to human capital investment and social protection provision could be an effective means to reduce inequality in human capital and in income.
Many countries allocate large sums to general price subsidies, which entail significant fiscal costs, but benefit the non-poor more than the poor. A typical example is fuel subsidies (Figure 2.5.5). In Indonesia, for example, in 2011 fuel and electricity subsidies amounted to 3.4% of GDP, which was larger than government spending on infrastructure that year. It is estimated that the richest 10% of households consumed 40% of the total subsidized gasoline, and the top half of households used almost 84% of it (Ginting and Aji 2012).
Encouragingly, the Indonesian government is taking some action to tackle this issue. In March 2012, the government proposed a revised 2012 budget bill to reduce untargeted fuel subsidies and to use the saved budget resources for infrastructure investment, promotion of green growth, and transfers to poor regions and households.22 Although what was passed by the Parliament was far short of what the government originally proposed, it is still welcome.
Greater and more equitable revenue mobilizationGiven the large need for more human capital investment and social protection provision in many developing Asian countries, governments will inevitably have to mobilize more revenue. The share of government revenue in GDP is low in many Asian countries. For example, in 2011, the share of central government revenue in GDP was about 12–14% in Bangladesh, Pakistan, Myanmar, Cambodia, and Philippines compared with the world average of close to 25% (Figure 2.5.6). The majority of government revenues are from taxation. In many Asian countries, more tax revenues can be mobilized by broadening tax bases and improving tax administration.
Broadening the tax base. The tax base can be broadened by reducing various exemptions, deductions, and incentives. Despite tax rates comparable to the world average (though lower than the OECD average), personal income tax collection is low in Asia (Figure 2.5.7). This is partly because of relatively high tax free (minimum exempt) thresholds and a relatively high threshold of income above which the top marginal personal income tax rate applies (Figure 2.5.8).
Also contributing to the lower tax collection are tax concessions. In the PRC, for example, only 11 types of personal income are liable to tax, and others not. Some of these categories are taxed at progressive rates (wages and salaries), while others are taxed at a flat rate (such as incomes of personal services, royalties, and rental and lease incomes). Tax reform is a key policy measure to improve income distribution in PRC’s 12th Five Year Plan (State Council of China 2011).
Corporate income taxes are also low in some Asian countries partly because of tax incentives to attract investment
2.5.5 Fossil-fuel consumption subsidy ( of current GDP), 2010
0 1 2 3 4 5 6PRC
PhilippinesSri Lanka
IndiaIndonesia
MalaysiaThailandViet Nam
Brunei DarussalamPakistan
Bangladesh
% of GDPPRC = People’s Republic of China.
Source: ADB estimates using IEA database on fossil fuel subsidies (http://www.oecd.org/document/32/0,3746,en_21571361_48776931_48783776_1_1_1_1,00.htmldata) and World Development Indicators online database (accessed 30 March 2012).
2.5.6 Central government revenue in selected Asian economies ( of GDP), 2011
0 10 20 30 40 50 60WorldOECD
Brunei DarussalamViet NamMalaysiaLao PDR
SingaporeThailand
IndonesiaPhilippinesCambodiaMyanmar
BhutanMaldives
AfghanistanIndia
NepalSri LankaPakistan
Bangladesh
MongoliaHong Kong, China
PRCKorea, Rep. of
Taipei,China
Kyrgyz RepublicUzbekistanAzerbaijan
GeorgiaTajikistanArmenia
KazakhstanTurkmenistan
% of GDP
Central Asia
East Asia
South Asia
Southeast Asia
Lao PDR = Lao People’s Democratic Republic; OECD = Organisation for Economic Co-operation and Development.
Note: Data are for 2011, except for Brunei Darussalam (2010); and OECD and World (2009). For Cambodia, PRC, India, Kazakhstan, Kyrgyz Republic, Mongolia, and Tajikistan, transactions are those reported by the general government. For detailed explanation, please see the Statistical notes of this report. OECD (2009) and World averages refer to revenues, excluding grants.
Sources: Asian Development Outlook database; World Bank. World Development Indicators online (accessed 25 March 2012).

Confronting rising inequality in Asia 81
2.5.7 Personal income tax ( of GDP) and top personal marginal income tax rate, 2009 or latest available year
0 10 20 30 40 50
Highest rate of personal income tax rate (%)Personal tax revenue (% of GDP)
Viet Nam
PRC
Bangladesh
India
Thailand
Philippines
Malaysia
Developing countries excluding Asia
a
Hong Kong , China
Korea, Rep. of
Indonesia
All countriesa
Japan
OECDa
% of GDP
PRC = People’s Republic of China; OECD = Organisation for Economic Co-operation and Development. a Simple averages.
Sources: IMF Global Financial Statistics Database; OECD Revenue Statistics; CEPAL; KPMG (2011).
2.5.8 Ratio of top personal income tax threshold to gross national income per capita
0 10 20 30 40 50 60Pakistan
Viet NamLao PDR
BangladeshPRC
ThailandIndonesia
IndiaBhutan
Sri LankaNepal
SingaporePhilippines
JapanKorea, Rep. of
CambodiaOECD
MalaysiaHong Kong, China
RatioLao PDR = Lao People’s Democratic Republic; PRC = People’s Republic of China; OECD = Organisation for Economic Co-operation and Development.
Note: For OECD countries, data refer to 2008 or 2009 and the figure is simple average (excluding Turkey). For Asian countries, data are for 2012. It is assumed that per capita gross national income of these countries in 2012 grow at the average rate of 2000- 2010.
Sources: ADB estimates using IBFD database (accessed 31 January 2012); ADB (2011a); OECD tax database.
and for activities seen as having social or economic merit. However, tax incentives can reduce the progressivity of income taxation if resources are captured by high-income interest groups lobbying for concessions. Moreover, they are often inefficient because they simply subsidize activities that firms would have undertaken anyway. Tax collection could thus also be increased by broadening the corporate tax base.
Value added tax (VAT) receipts are also low as a share of GDP in many Asian countries and is a potential source of additional government revenue. It is true that VAT is regressive and it is not an effective tool for reducing income inequality, but it is less distortionary than income and sales taxes, and is easier to collect.
VAT does not exist in, for example, Bhutan, Malaysia, Maldives, and Myanmar. For those countries where VAT exists, its collection can be increased by broadening its base. VAT exemptions or reduced tax rates for necessities are often used to address its potential regressivity. However, these two mechanisms are costly and not well targeted at the poor. A more effective policy would be direct transfer payments to those in need. In countries where the VAT tax rate is low, it could be raised.
Improving tax administration. Government revenue can be increased by improving tax administration. In the Philippines, for example, poor tax administration has been identified as a critical constraint to increasing government revenue (ADB 2009a). Complicated tax systems with many tax rates, exemptions, deductions, and concessions increase tax administration and compliance costs as well as the opportunity for tax planning and tax avoidance. They are also often seen as unfair because higher income taxpayers generally have greater scope and

82 Asian Development Outlook 2012
resources to shift income to avoid higher tax rates. Unfair tax systems can reduce people’s and businesses’ willingness to pay taxes. Strengthening governance and institutions is also a key to improving tax collection.
Reducing regional inequalitySpatial inequalities account for a large part of Asia’s inequality. Reducing spatial inequality should therefore be a key element of the policy responses. A key component of such inequality is that between provinces or states. Four policy options for reducing regional inequality are now discussed below.
Improving regional connectivity. Poor connectivity due to lack of adequate transport and communication infrastructure is often a major constraint for interior states or provinces in engaging in global trade and attracting investment. The proportion of paved roads in total roads was close to 100% in Thailand (as of 2000), while it was only 6.3% in Cambodia (as of 2004), 9.9% in the Philippines (as of 2003), 11.9% in Myanmar (as of 2005), 13.5% in Lao PDR (as of 2008), 47.6% in Viet Nam (as of 2007), and 49.3% in India (as of 2008) (Figure 2.5.9). Several ADB studies have found that the lack of adequate infrastructure including transport is a critical constraint to private investment in the Philippines, Indonesia, and Nepal (ADB 2009b, 2010, and 2011). Improving infrastructure therefore should be one of the key policy measures to reduce regional inequality.
Developing growth poles in lagging region. To a large extent, inter-regional inequality is due to coastal areas’ proximity to overseas markets. This is an exogenous factor and no one can change it. However, developments in economic theory have also emphasized the importance of agglomeration economies, increasing returns, and clustering in shaping regional development (Krugman 2008). This means that countries can identify areas of potential growth poles and use policy tools and public investment to trigger growth. Countries could develop strategies for generating growth in lagging regions for equity as well as efficiency considerations. The PRC’s Greater Western Development Strategy presents a good example (Box 2.5.3).
Fiscal transfers for greater investment in human capital and better access to public services in poor regions. Fiscal transfers from richer regions to poorer regions also have an important part to play in reducing regional inequality. However, such transfers are likely to encounter political resistance from the richer regions, all the more so as even better-off regions in developing countries face a raft of pressing fiscal demands. Further, high levels of fiscal transfers may be seen as penalizing successful regions and rewarding unsuccessful ones, hence affecting incentives. Fiscal transfers should, therefore, be carefully designed and linked to targets and performance in improving development outcomes in recipient regions, and should aim to build poor regions’ own capacity for
2.5.9 Proportion of paved roads in Asian economies
0 20 40 60 80 100Fiji
Tonga
FSMSamoa
PNGSolomon Islands
SingaporeThailandMalaysia
Brunei DarussalamIndonesiaViet NamLao PDR
MyanmarPhilippinesCambodia
MaldivesSri LankaPakistan
BhutanNepalIndia
AfghanistanBangladesh
Hong Kong, ChinaKorea, Rep. of
PRCMongolia
Kyrgyz RepublicArmenia
KazakhstanUzbekistan
TurkmenistanAzerbaijan
Vanuatu
%
Central Asia
East Asia
South Asia
Southeast Asia
The Pacific
FSM =Federated States of Micronesia; PNG = Papua New Guinea; PRC = People’s Republic of China.
Note: The figure is based on the latest available data between 2000 and 2008.
Source: World Development Indicators online database (accessed 21 March 2012).

Confronting rising inequality in Asia 83
This strategy was adopted in 2000 to boost its less developed western region. It covers 11 provinces (Gansu, Guizhou, Qinghai, Shaanxi, Sichuan, Yunnan, Guangxi, Inner Mongolia, Ningxia, Tibet, and Xinjiang) and one municipality (Chongqing). This region covers nearly three-fourths of the area of the country, but only one-fourth of its population and one-fifth of its total economic output (as of 2010).
The main components of the strategy include the development of infrastructure (transport, hydropower plants, energy, telecommunications, and urban development), attraction of foreign investment, increased efforts on ecological protection (such as reforestation), promotion of education, and retention of talent flowing to richer provinces.
During 2000-2009, total state investment in major projects in the western region reached CNY2.2 trillion (about US$349 billion); fiscal transfers from the central government reached more than CNY3 trillion; the region’s volume of imports and exports grew by nearly one-fourth each year on average, with its share in the national total increasing from 3.8% to 4.2%; and annual average regional
GDP growth reached 11.9%, higher than the national average, with the region’s share in national GDP increasing from 17.1% to 18.5%.
What has been the overall impact of the Western strategy on regional inequality? This is of course difficult to estimate because the counterfactual is difficult to specify. However, Fan, Kanbur, and Zhang (2011) argue that regional inequality in the PRC has begun to stabilize and perhaps even turn down since the mid-2000s, partly as the result of this strategy.
Based on primary survey data in two poor provinces—Guizhou and Gansu—Zhang, Yang, and Wang (2011) show that real wages have risen rapidly since 2003. Finally, Khan and Riskin (2005) have argued that overall inequality has begun to level off, and have identified the Western Strategy as a key factor.
Sources: Zhang, Yang, and Wang (2011); Khan and Riskin (2005); http://www.chinawest.gov.cn/web/NewsInfo.asp?NewsId=55943.
2.5.3 The PRC’s Great Western Development Strategy
self-sustaining regional development, such as staving off extreme poverty, investing in human capital, and improving public services.
Reducing barriers to within-country migration. Migration from poor to prosperous areas is one of the major means for reducing regional inequality. Migration and labour mobility often come up against significant barriers. One comes from the bureaucratic and administrative obstacles to moving from one part of the country to another. For example, in the PRC, the hukou (registration) system constrains rural–urban migration by limiting rural migrants’ access to basic public services such as education, health care, and social protection in urban areas. Lack of necessary skills and suitable job opportunities in prosperous areas is another barrier. Absence of portability of pension benefits also discourages individuals from seeking better opportunities elsewhere. Improving connectivity, as mentioned, will facilitate not only the movement of goods but also of people.
Making growth more employment friendlySince the declining share of labor income is associated with rising inequality, a key issue is how to maintain and even raise this share during the growth process. This requires shifting the labor demand curve in the productive sectors of the economy as output increases. If demand outstrips supply, wages will rise, increasing the labor income share and containing inequality. Therefore, making growth more employment friendly so as to create productive and well-paid jobs for a much wider

84 Asian Development Outlook 2012
section of population is one of the keys to confronting rising inequality in developing Asia. Various policies stand out.
Facilitating structural transformationAgriculture is still the largest (or at least substantial) employer in most Asian developing countries, and its dominance in providing jobs is closely associated with the high proportion of vulnerable employment, which contributes to inequality (Figure 2.5.10). A key challenge for most developing Asian countries is therefore to facilitate the process of structural transformation to transfer large amounts of rural, agriculture surplus labor to urban, manufacturing and services sectors, where most of the future’s productive jobs will be generated.23 These include making the business environment more conducive to investment, improving infrastructure, reducing regulatory burdens on enterprises, promoting innovation, and upgrading industry.
Sectoral composition of growth has received some attention on development experiences in Asia (ADB 2007a). In 2010, India’s share of manufacturing in GDP was close to the average of low-income countries, but much lower than the average of both lower- and upper middle-income countries (Figure 2.5.11).24 In the PRC, on the other hand, the share of services in GDP was much lower than the averages of low-, lower-middle and upper middle-income countries.25
A country’s sectoral composition is determined by its comparative advantages and other factors, but development policy often plays a role. For instance, India is making greater efforts to develop manufacturing, while the PRC is aiming to increase the share of services as a source of growth and job creation. International experiences suggest that both manufacturing and services are important for growth and job creation, and the two often support each other during economic development.
Structural transformation also involves maintaining a high pace of agricultural productivity growth. This requires governments to implement agricultural policies to produce more output per hectare. Improving the access of the rural poor to irrigation, electricity, transport services, new technology and improved seeds, agricultural extension services, and financial services are all vital for raising farm productivity. If ownership or access to land is highly skewed, implementing mechanisms that improve the access of the poor to land is also essential. In the PRC, rural non-agricultural village and township enterprises have played an important role in lifting income levels of the rural population and reducing rural poverty. Such enterprises could be promoted by other Asian countries.
Supporting the development of small and medium-sized enterprisesSMEs provide most jobs, in developing and developed countries alike. But SMEs often face constraints, especially in accessing finance, human capital, and markets. Three ADB studies found that
2.5.10 Vulnerable employment in Asia, latest year
0
20
40
60
80
Vulnerable employment rate (latest year)Employment rate (2009)
Sub-Saharan Africa
Latin America and
the Caribbean
Eastern Europe
OECDMiddle Eastand
North Africa
Developing Asia
%
OECD = Organisation for Economic Co-operation and Development.
Note: Vulnerable employment refers to unpaid family workers and own-account workers as a percentage of total employment. Employment rate refers to the ratio of employment to population aged 15+. Weighted averages are based on 2009 population.
Source: World Development Indicators online database (accessed 21 March 2012) and ADB estimate using China Statistical Yearbook 2011.
2.5.11 Share of manufacturing and services in GDP ()
0 20 40 60 80High income
Upper middle incomeLower middle income
Low incomePhilippines
IndiaMalaysia
PRCThailand
Indonesia
High incomeUpper middle incomeLower middle income
Low incomeThailand
PRCMalaysia
IndonesiaPhilippines
India
%
Manufacturing
Services
PRC = People’s Republic of China.
Source: World Development Indicators online database (accessed 24 March 2012).

Confronting rising inequality in Asia 85
access to finance was ranked among the top constraints to business growth by SMEs in the Philippines, Indonesia and Nepal (ADB 2009b, 2010, and 2011b). In the PRC, access to finance and human capital is also considered among major constraints by SMEs, many of which are in rural areas.
Governments should support SME development by facilitating their creation, removing unnecessary and cumbersome restrictions on their development, and addressing market failures in their access to finance. Governments can also help SMEs adopt new technologies and access new markets (ADB 2009a).
On access to finance, recent international experience suggests that one of the most important ways governments can increase access to finance is to improve the institutional underpinnings of financial transactions by strengthening creditor rights, defining property rights so property can be used as collateral for credit, and enhancing credit registries and systems to screen borrowers. They can also improve the informational infrastructure that underlies the working of financial markets.
To help SMEs adopt technologies and enter new markets, governments can provide information on improved production methods, products, and markets, technical support services, and vocational training. They can also foster links between SMEs and large enterprises and encourage cluster-based development by exploiting the fact that many enterprises that make and sell related or complementary products are grouped close together, often with their suppliers and buyers.
Removing factor market distortionsOne of the reasons why developing countries with relatively abundant labor prefer labor-saving and capital-intensive techniques could be distortions in factor markets: market prices of factors of production fail to reflect relative abundance, due to causes such as underdevelopment of the financial sector or financial repression. In the PRC, for instance, factor market reform has lagged behind product market reform, and interest rate control has kept borrowing costs low, especially for state-owned enterprises. During 1990–2010, PRC’s real lending rate was one of the lowest among 50 middle- and high-income countries (ADB forthcoming). The low cost of capital has been put forward as one of the causes of the imbalances of growth sources in the PRC (Huang 2010; World Bank 2012b).
In India, the financial repression, as evidenced by persistently negative real savings deposit rates, could also be a contributing factor to the low cost of capital relative to labor in the formal sector (RBI 2011). It has also been suggested that some of the earlier policies of industrialization, which was intended to promote labor-intensive industries and adoption of labor-intensive techniques, had some unintended consequences of encouraging the use of capital intensive technology (Kochhar et al. 2006; and Felipe, Kumar, and Abdon forthcoming).
Reducing factor market distortions could, therefore, promote job creation. A key policy measure is to reduce or eliminate financial repression by further developing the financial sector. This include reducing and eliminating distortions in the cost of capital by gradually adopting market-determined interest rates; allowing greater competition

86 Asian Development Outlook 2012
and private sector participation in the financial sector; further strengthening regulatory framework and governance of financial institutions; carefully managing the liberalization of the capital account; and making the exchange rate more flexible. India liberalized deposit interest rate in November 2011 (RBI 2011).
Labor market institutionsEmployment generation also needs to be supported by effective labor market institutions. On the one hand, labor market institutions should help improve the employability of labor through providing skill training and assistance with job search (such as employment services), and provide necessary protection of worker rights. On the other hand, they should not impose excessive costs on enterprises and hurt job creation.
There are significant disagreements on effects of labor market interventions on job creation. Some believe that interventions such as employment protection legislation, minimum wages, and collective bargaining are important to protect the rights of workers, while others think that these interventions will raise labor costs, only protect those who have already been employed (or “insiders”), but make employers reluctant to hire new workers, or find ways to bypass these (for example, by replacing regular, formal jobs with contract labor that offers less protection, lower wages and little social security), hence hurting job creation. Empirical evidence on these is mixed (Felipe and Hasan 2006).
In some countries, there has been an implicit or explicit move to a “flexicurity system,” which involves giving employers greater flexibility in adjusting the workforce based on their needs as determined by market fluctuations, while the security of workers is “socialized” through policies and programs administrated by or through the state, such as re-training or unemployment insurance (Auer 2007). This approach reduces the retrenchment burden on firms (making it more likely that they will hire and provides better security for workers in the event of employment loss). In Asia, some countries have moved in this direction, including the Republic of Korea and the PRC, while others have found it hard to restructure labor market institutions (Vandenberg 2010).
In sum, while there is large room for many Asian countries to build effective labor market institutions, the exact form and approach to follow will have to be decided by each country on the basis of their specific circumstances. For countries that have transited from a planned economy to a market economy and basic labor market institutions are yet to be established, there is a case for moving toward establishing or strengthening formal arrangements. For countries where labor market regulations have been seen as too restrictive and a major constraint to growth and job creation in the formal sector, there is a need to examine the specific elements that are likely to be constraints and ensure that they are appropriately addressed.
Public employment schemesGovernments can also introduce public employment schemes (PES) to act as a buffer stock or mechanism for employment: when the private sector downsizes in recessions, workers who lose their job can find work in

Confronting rising inequality in Asia 87
such a scheme. The government pledges to hire anyone satisfying certain criteria and willing to work on projects such as small infrastructure (e.g., clean water and sewage projects, roads) at a basic public sector living salary. Many developing countries, including Bangladesh, Cambodia, Indonesia, the Republic of Korea, and Sri Lanka, in Asia, and Argentina, Brazil, Chile, Peru, and Mexico in Latin America, and developed countries, including Australia and France, have PES programs, many of which are temporary (Felipe 2009).
Some countries have implemented such programs to counter the major problems associated with persistent unemployment. In Asia, a well-known case is India’s National Rural Employment Guarantee Scheme (Box 2.5.4).
Toward inclusive growth in AsiaDriven by globalization, technological progress, and market-oriented reform, developing Asia has had a remarkable period of growth and poverty reduction. However, the drivers of growth are also magnifying the effects of inequalities in physical and human capital, leading to rising income inequality. These forces require Asian policy makers to redouble their efforts to generate more productive jobs, equalize opportunities in employment, education and health, and address spatial inequality. Without such policies, which will enhance growth further, Asia may be pulled into inefficient populist policies, which will benefit neither growth nor equity.
The policy options outlined constitute key elements of a strategy for inclusive growth. Broadly, inclusive growth can be defined as “growth coupled with equality of opportunity,” and it needs three policy pillars: sustained growth to create productive jobs for a wide section of the population; social inclusion to equalize access to opportunity; and social safety nets to mitigate vulnerability and risks and prevent
The Mahatma Gandhi National Rural Employment Guarantee Scheme (MGNREGS) was launched in 2006 in the 200 most backward districts of India (of 640 districts in all). It is a program that explicitly recognizes the “right to a job.” Under the program, every rural adult willing to be engaged in unskilled manual labor has the right to demand work from the state government for up to 100 days per household annually. The core funding for program is provided by the central government, and state governments make additional contributions.
The program has been extended and now covers the entire country (apart from 100% urban districts). The number of households who were provided employment increased from 21 million in 2006/07 to 38 million in 2010/11, which amounted to more than 1,200 million person-days of work. A notable aspect of the scheme is the
large number of women who have sought work—female participation increased from 41% to 49% in this period.
The program has several achievements, including lifting rural wages; reducing distress migration; creating community assets; promoting empowerment and making politicians more responsive to the demands of the poor; reducing unemployment and underemployment; encouraging growth of agricultural production; reducing discrimination; and reducing malnutrition.
It has also drawn criticism, however, including allegations of corruption, weakening work incentives, undermining fiscal sustainability, distorting the labor market, and causing wage inflation.
Sources: Bonner et al. (2012), Jagannathan (2011), Sjoblom and Farrington (2008).
2.5.4 India’s National Rural Employment Guarantee Scheme

88 Asian Development Outlook 2012
extreme poverty (Zhuang and Ali 2010). Such a strategy would ensure that all members of society can participate in the development process productively and benefit equitably from the opportunities generated by economic growth.
It is encouraging that more and more developing Asian countries are embracing the concept of inclusive growth, with an increasing number of countries—including the PRC, India, and many Southeast Asian countries—placing inclusive growth at the heart of their development policy, as reflected in their recent medium-term development plans. Indeed, the entire development community is embracing the concept of inclusive growth. These developments will go a long way toward reducing poverty and inequality and making the world a more equitable place.
Endnotes1 A common measure of inequality, ranging from zero indicating perfect equality and 1 (or
100) indicating perfect inequality. See Box 2.2.1 for technical details.2 Of these countries, 28 have data for both the 1990s and 2000s3 The 13 include one in East Asia (PRC), three in Southeast Asia (Malaysia, the Philippines,
and Thailand), one in South Asia (Sri Lanka), one in Central Asia (Georgia), and seven in the Pacific (Nauru, Solomon Islands, Vanuatu, Fiji, Kiribati, Palau, and Samoa). The Gini of the rest of the economies ranged from 27.8% for Afghanistan to 38.9% for Indonesia.
4 37.9 if two countries with data only in 1990s are included.5 We say “appears” because the rural Gini had a sharp fall in 2002–2005 but a steep rise in
2005–2008. It is unclear whether this switch is reflects data problems or changes in income distribution.
6 The PRC, Fiji, Georgia, Kiribati, Malaysia, Nauru, Palau, Philippines, Samoa, Solomon Islands, Thailand, and Vanuatu.
7 This is a simple arithmetic average.8 Data are not available for the Republic of Korea; Mongolia; or Taipei,China.9 The difference between the two measures was 4.4 percentage points for the Philippines in
2009 and 8.9 percentage points for Viet Nam in 2008.10 The increases were more pronounced in Canada, Denmark, Finland, Germany, Spain, and
Sweden. 11 A caveat: inequality in education is difficult to measure, as the quality dimension of
education, in particular, is hard to capture through survey and census instruments. 12 Global Health Observatory Repository Data (accessed 18 February 2012).13 Circumstances, as used here, are personal or family socioeconomic and demographic
characteristics over which an individual has no direct control.14 A cross-country study by IMF (2007) finds that global trade integration helps to reduce
inequality as measured by the Gini coefficient, global financial integration increases it, and technological progress is the most important contributor to rising inequality globally in the last 2 decades. The study also finds that these impacts are particularly pronounced in developing Asia.
15 Tertiary education premium refers to the wage premium for workers with at least tertiary education compared with workers with a lower level of education.
16 Acemoglu (2002) notes that for the late 20th century, there has been a rise in returns to education and decrease in low-skill wages despite an increase in the supply of college graduates, which suggest that supply has not kept up with demand for high-skilled labor. Studies have also argued for evidence of skill-biased technological change (SBTC) in developing countries (Goldberg and Pavcnik 2007; and Robbins 1996; Sanchez-Paramo and Schady 2003; and Attanasio, Goldberg, and Pavcnik 2004 for Latin America; Hsieh and Woo 2005 for Hong Kong, China; and Kijima 2006 for India). However, Card and DiNardo (2002) point out that wage inequality stabilized in the US despite the continuing developments in computer technology. They also argue that SBTC does not fully explain

Confronting rising inequality in Asia 89
wage gaps across genders, and racial and demographic structures. The debate between competing explanations for the US is still ongoing (see Autor, Katz, and Kearney 2008; Marquis, Trehan, and Tantivong 2011).
17 Wage employment refers to wage-earning employment, mostly in the formal sector. Wage employment elasticity is the ratio of employment growth to GDP growth between two periods. It thus measures the amount of employment growth required to generate each percentage point of GDP growth.
18 A dual economy consists of two sectors, one being a low income, rural, subsistence sector with surplus population and the other being an expanding urban modern (manufacturing and services) sector. The urban economy absorbed labor from rural areas, which holds down urban wages until the rural surplus labor is exhausted. See Lewis (1954).
19 Several decades ago, Arthur Lewis—a Nobel Prize winner—pointed out the tendency of the development process to be inegalitarian: “Development must be inegalitarian because it does not start in every part of the economy at the same time…There may be one such enclave in an economy, or several; but at the start, development enclaves include only a small minority of the population” (Lewis 1976)
20 See also the long-run analysis of regional inequality in PRC by Fan, Kanbur, and Zhang (2011).
21 According to the UN (2007), the cost of a universal social pension scheme designed to keep the elderly out of poverty (at the $1-a-day poverty line) is estimated to be 0.25% of GDP for Malaysia and about 0.5% of GDP for Philippines and Thailand in 2005.
22 The revised 2012 Budget Law gives mandate to the government to increase fuel price if the average Indonesian Crude Oil Price (ICP) in the last 6-month period increases to $120.8 (15% above the budget assumption of $105).
23 ADB (2007a) provides a comprehensive discussion of the issues involved. 24 Although India’s share of services in GDP is high, it has been argued that jobs in the sector
are mostly of low productivity and poorly paid. While the booming business process outsourcing (BPO) sector has generated many productive and well-paid jobs, this has only benefited a small group of the educated (ADB 2007a).
25 Some argue that PRC’s low share of services is also related to the way the data for services are collected and included in national income accounting (Pant 2007).
Background papers and references
Background papersAizenmann, J., M. Lee, and D. Park. Forthcoming. The Relationship between
Structural Change and Inequality: A Conceptual Overview with Special Reference to Developing Asia. ADB Economics Working Paper Series. Manila: Asian Development Bank (ADB).
Claus, I., J. Martinez-Vazquez, and V. Vulovic. Forthcoming. Government Fiscal Policies and Redistribution in Asian Countries. ADB Economics Working Paper Series. Manila: ADB.
Lustig, N. Forthcoming. Taxes, Transfers and Redistribution in Argentina, Bolivia, Brazil, Mexico and Peru. ADB Economics Working Paper Series. Manila: ADB.
Nye, J. Forthcoming. Institutions and Economic Inequality in Asia: Disentangling Policy and Political Structure. ADB Economics Working Paper Series. Manila: ADB.
Rodgers, Y. and J. Zveglich Jr. Forthcoming. Inequality of Opportunity and Outcomes in Asia: A Gendered Perspective. ADB Economics Working Paper Series. Manila: ADB.
Son, H.H. 2011. On the Concept of Equity in Opportunity. ADB Economics Working Paper Series 266. Manila: ADB.

90 Asian Development Outlook 2012
ReferencesAcemoglu, D. 2002. Technical Change, Inequality and the Labor Market. Journal
of Economic Literature XL. pp.7–72.Agénor, P-R. 2002. Does Globalization Hurt the Poor? World Bank Working
Paper No. 2922. Washington, DC: World Bank.Ahluwalia, M. 1976. Income Distribution and Development: Some Stylized
Facts. American Economic Review. 66(2). pp. 128−135.Alesina, A. and D. Rodrik. 1994. Distributive Politics and Economic Growth.
The Quarterly Journal of Economics. 109(2). pp. 465−490. Ali, I. and J. Zhuang. 2007. Inclusive Growth toward a Prosperous Asia: Policy
Implications. ERD Working Paper Series No. 97.Manila: ADB.Anand, S. and R. Kanbur. 1993. Inequality and Development: A Critique.
Journal of Development Economics. 41(1). pp. 19−43.Anker, R. 1998. Gender and Jobs: Sex Segregation of Occupations in the World.
Geneva: International Labour Organization,.Arpaia, A., E. Pérez, and K. Pichelmann. 2009. Understanding Labour Income
Share Dynamics in Europe. MPR.000A Paper 15649. Germany: University Library of Munich.
Asian Development Bank (ADB). 2006. Social Protection Index for Committed Poverty Reduction. Manila.
______. 2007a. Asian Development Outlook 2007. Manila. ______. 2007b. Key Indicators for Asia and the Pacific 2007. Manila.______. 2008. Social Protection Index for Committed Poverty Reduction. 2 (Asia).
Manila.______. 2009a. Key Indicators for Asia and the Pacific 2009. Manila.______. 2009b. Philippines: Critical Development Constraints. Manila.______. 2010. Indonesia: Critical Development Constraints. Manila.______.2011a. Key Indicators for Asia and the Pacific 2011. Manila: ADB.
http://beta.adb.org/key-indicators/2011/main.______. 2011b. Nepal: Critical Development Constraints. Manila.______. Forthcoming. China 2030: Growing beyond the Low Cost Advantage:
Policy Issues and Options. Manila.Asian Productivity Organization (APO). 2011. APO Productivity Databook
2011. Tokyo: Keio University Press, Inc.Attanasio, O., P. K. Goldberg, and N. Pavcnik. 2004. Trade Reforms and Wage
Inequality in Colombia. Journal of Development Economics. 74(2). pp. 331−366.
Auer, P. 2007. Security in Labour Markets: Combining Flexibility with Security for Decent Work. Economic and Labour Market Papers 2007/12. Geneva: Employment Analysis and Research Unit, Economic and Labour Market Analysis Department, ILO.
Autor, D. H., L. F. Katz, and M. S. Kearney. 2008. Trends in US Wage Inequality: Revising the Revisionists. The Review of Economics and Statistics. 90(2). pp. 300−323.
Bai C. and Z. Qian. 2009. Factor Income Distribution: The Story Behind the Statistics. People’s Republic of China: Tsinghua University.
Balisacan, A. M. 2003. Pathways of Poverty Reduction: Rural Development and Transmission Mechanisms in the Philippines. In C. M. Edmonds, ed. Reducing Poverty in Asia: Emerging Issues in Growth, Targeting, and Measurement. Cheltenham, UK: Edward Elgar Publishing Co.
Barro, R. J. 2008. Inequality and Growth Revisited. ADB Working Paper Series on Regional Economic Integration No. 11. Manila: ADB.
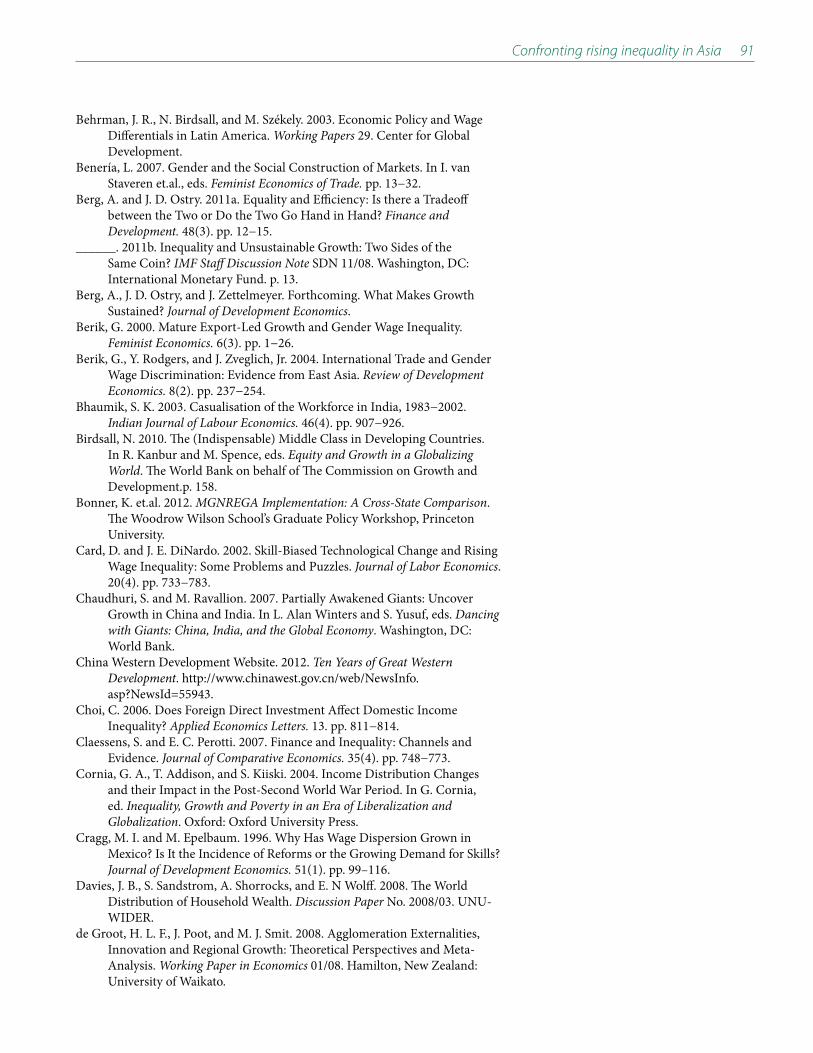
Confronting rising inequality in Asia 91
Behrman, J. R., N. Birdsall, and M. Székely. 2003. Economic Policy and Wage Differentials in Latin America. Working Papers 29. Center for Global Development.
Benería, L. 2007. Gender and the Social Construction of Markets. In I. van Staveren et.al., eds. Feminist Economics of Trade. pp. 13−32.
Berg, A. and J. D. Ostry. 2011a. Equality and Efficiency: Is there a Tradeoff between the Two or Do the Two Go Hand in Hand? Finance and Development. 48(3). pp. 12−15.
______. 2011b. Inequality and Unsustainable Growth: Two Sides of the Same Coin? IMF Staff Discussion Note SDN 11/08. Washington, DC: International Monetary Fund. p. 13.
Berg, A., J. D. Ostry, and J. Zettelmeyer. Forthcoming. What Makes Growth Sustained? Journal of Development Economics.
Berik, G. 2000. Mature Export-Led Growth and Gender Wage Inequality. Feminist Economics. 6(3). pp. 1−26.
Berik, G., Y. Rodgers, and J. Zveglich, Jr. 2004. International Trade and Gender Wage Discrimination: Evidence from East Asia. Review of Development Economics. 8(2). pp. 237−254.
Bhaumik, S. K. 2003. Casualisation of the Workforce in India, 1983−2002. Indian Journal of Labour Economics. 46(4). pp. 907−926.
Birdsall, N. 2010. The (Indispensable) Middle Class in Developing Countries. In R. Kanbur and M. Spence, eds. Equity and Growth in a Globalizing World. The World Bank on behalf of The Commission on Growth and Development.p. 158.
Bonner, K. et.al. 2012. MGNREGA Implementation: A Cross-State Comparison. The Woodrow Wilson School’s Graduate Policy Workshop, Princeton University.
Card, D. and J. E. DiNardo. 2002. Skill-Biased Technological Change and Rising Wage Inequality: Some Problems and Puzzles. Journal of Labor Economics. 20(4). pp. 733−783.
Chaudhuri, S. and M. Ravallion. 2007. Partially Awakened Giants: Uncover Growth in China and India. In L. Alan Winters and S. Yusuf, eds. Dancing with Giants: China, India, and the Global Economy. Washington, DC: World Bank.
China Western Development Website. 2012. Ten Years of Great Western Development. http://www.chinawest.gov.cn/web/NewsInfo.asp?NewsId=55943.
Choi, C. 2006. Does Foreign Direct Investment Affect Domestic Income Inequality? Applied Economics Letters. 13. pp. 811−814.
Claessens, S. and E. C. Perotti. 2007. Finance and Inequality: Channels and Evidence. Journal of Comparative Economics. 35(4). pp. 748−773.
Cornia, G. A., T. Addison, and S. Kiiski. 2004. Income Distribution Changes and their Impact in the Post-Second World War Period. In G. Cornia, ed. Inequality, Growth and Poverty in an Era of Liberalization and Globalization. Oxford: Oxford University Press.
Cragg, M. I. and M. Epelbaum. 1996. Why Has Wage Dispersion Grown in Mexico? Is It the Incidence of Reforms or the Growing Demand for Skills? Journal of Development Economics. 51(1). pp. 99–116.
Davies, J. B., S. Sandstrom, A. Shorrocks, and E. N Wolff. 2008. The World Distribution of Household Wealth. Discussion Paper No. 2008/03. UNU-WIDER.
de Groot, H. L. F., J. Poot, and M. J. Smit. 2008. Agglomeration Externalities, Innovation and Regional Growth: Theoretical Perspectives and Meta-Analysis. Working Paper in Economics 01/08. Hamilton, New Zealand: University of Waikato.

92 Asian Development Outlook 2012
de Mel, S., D. McKenzie, and C. Woodruff. 2008. Returns to Capital in Microenterprises: Evidence from a Field Experiment. Quarterly Journal of Economics. CXXIII(4). pp.1329−1372.
Deaton, A. 1987. Looking for Boy-Girl Discrimination in Household Expenditure Data. World Bank Economic Review. 3. pp. 1−15.
Demirgϋc-Kunt, A. and R. Levine. 2007. Finance and Opportunity: Financial Systems and Intergenerational Persistence of Relative Incomes. Washington, DC: World Bank. Processed.
Department of Social Welfare and Development (DSWD). 2012. Pantawid Pamilyang Pilipino Program. Philippines. http://pantawid.dswd.gov.ph (accessed on 28 March 2012).
Esquivel, G., N. Lustig, and J. Scott. 2010. A Decade of Falling Inequality in Mexico: Market Forces or State Action? In L. F. López Calva and N. Lustig, eds. Declining Inequality in Latin America: A Decade of Progress? Washington, DC: Brookings Institution and UNDP.
Fajnzylber, P., D. Lederman, and N. Loayza. 2002. Inequality and Violent Crime. Journal of Law and Economics. 45(1). pp. 1−40.
Fallon, P. R. and R. E. B. Lucas. 2002. The Impact of Financial Crises on Labor Markets, Household Incomes, and Poverty: A Review of Evidence. The World Bank Research Observer. 17(1). pp. 21–45.
Fan, S., L. Zhang, and X. Zhang. 2002. Growth, Inequality, and Poverty in Rural China: The Role of Infrastructure. IFRI Research Report 125. Washington, DC: International Food Research Institute.
Fan, S., R. Kanbur, and X. Zhang. 2011. China’s Regional Disparities: Experience and Policy. Review of Development Finance. 1(1). pp. 47−56.
Feenstra, R. C. and G. H. Hanson. 1997. Foreign Direct Investment and Relative Wages: Evidence from Mexico’s Maquiladoras. Journal of International Economics. 42. pp. 371−393.
Felipe, J. 2009. Inclusive Growth, Full Employment and Structural Change: Implications and Policies for Developing Asia. London: Anthem Press.
Felipe, J. and R. Hasan, eds. 2006. Labor Markets in Asia: Issues and Perspectives. London: Palgrave Macmillan for the Asian Development Bank.
Felipe, J. and U. Kumar. 2010. Technical Change in India’s Organized Manufacturing Sector. Levy Economics Institute of Bard College Working Paper No. 626. New York.
Felipe, J., U. Kumar, and A. Abdon. Forthcoming. Exports, Capabilities, and Industrial Policy in India. Journal of Comparative Economics.
Felipe, J. and G. C. Sipin. 2004. Competitiveness, Income Distribution, and Growth in the Philippines: What Does the Long-Run Evidence Show? ERD Working Paper No. 53. Manila: ADB.
Gill, I. and H. Kharas. 2007. An East Asian Renaissance: Ideas for Economic Growth. Washington, DC: World Bank.
Ginting, E. and P. Aji. 2012. Macroeconomic Management. In Hill, H. M.E. Khan, and J. Zhuang, eds. Diagnosing the Indonesia Economy. London: Anthem Press and Manila: ADB.
Goldberg, P. K. and N. Pavcnik. 2007. Distributional Effects of Globalization in Developing Countries. Journal of Economic Literature. 45(1). pp. 39−82.
Goldin, C. 1994. The U-Shaped Female Labor Force Function in Economic Development and Economic History. NBER Working Paper Series No. 4707. National Bureau of Economic Research.
Harrison, A. E. 2002. Has Globalization Eroded Labor’s Share? Some Cross-country Evidence. University of California at Berkely and National Bureau of Economic Research. http://www.econ.fea.usp.br/gilberto/eae0504/Harrison_Glob_Labor_Share_2002.pdf

Confronting rising inequality in Asia 93
Hausmann, R., L. Pritchett, and D. Rodrik. 2005. Growth Accelerations. Journal of Economic Growth. 10(4). pp. 303–329.
Hsieh, C. and K. Woo. 2005. The Impact of Outsourcing to China on Hong Kong’s Labor Market. American Economic Review. 95. pp. 1673−1687.
Huang, Y. 2010. China’s Great Ascendancy and Structural Risks: Consequences of Asymmetric Market Liberalization. Asian Pacific Economic Literature. 24(1). pp. 65-85.
International Energy Agency (IEA). 2011. Fossil-Fuel Subsidies in APEC Economies and the Benefits of Reform: An IEA background paper for the Asia-Pacific Economic Cooperation. Paris, France.
International Monetary Fund (IMF). 2007. Globalization and Inequality. In World Economic Outlook 2007. Washington, DC: IMF.
International Labour Organization (ILO). 2005. Global Employment Trends 2004. Geneva: International Labour Organization.
______. 2008. Can Low-Income Countries Afford Basic Social Security? Social Security Policy Briefings Paper 3. Geneva: Social Security Department, ILO.
______. 2011. Trends Econometric Model. Geneva: ILO.Jacobson, M. and P. Occhino. 2012. Behind the Decline in Labor’s Share of
Income. Economic Trends. Federal Reserve Bank of Cleveland.Jagannathan, P. 2011. Ministry Wants NREGS Shut in Farming Season. http://
epaper.timesofindia.com/Default/Scripting/ArticleWin.asp?From=Archive&Source=Page&Skin=ETNEW&BaseHref=ETBG/2011/07/19&PageLabel=1&EntityId=Ar00100&ViewMode=HTML
Jhabvala, R. and S. Sinha. 2002. Liberalization and the Woman Worker. Ahmedabad, India: Self Employed Women’s Association.
Kabeer, N. 2004. Globalization, Labor Standards, and Women’s Rights: Dilemmas of Collective (In)action in an Interdependent World. Feminist Economics. 10(1). pp. 3−35.
Kanbur, K. 2010. Intergenerationalities: Some Educational Questions on Quality, Quantity and Opportunity. Humanum: Revista Latino Americana De Desarrollo Humane No. 1.
______. 2011. Does Kuznets Still Matter? Paper written for a Festschrift in honor of Montek Ahluwalia, September 2011.
Kanbur, R., K. Gajwani, and X. Zhang. 2007. Comparing the Evolution of Spatial Inequality in China and India: A Fifty-Year Perspective. Annual World Bank Conference on Development Economics. pp. 155−177.
Kanbur, R. and N. Lustig. 2000. Why is Inequality Back on the Agenda? Proceedings of Annual World Bank Conference in Development Economics. pp. 285-313. Washington, DC: World Bank.
Khan, A. R., and C. Riskin. 2005. China’s Household Income and its Distribution, 1995 and 2002. The China Quarterly. 182. pp. 356−384.
Kijima, Y. 2006. Why Did Wage Inequality Increase? Evidence from Urban India 1983−99. Journal of Development Economics. 81. pp. 97−117.
Kochhar, K. et. al. 2006. India’s Pattern of Development: What Happened, What Follows? Journal of Monetary Economics. 53(5). pp. 981−1019.
KPMG. 2011. KPMG’s Individual Income Tax and Social Security Rate Survey 2011. KPMG International.
Krugman, P. 2008. The Increasing Returns Revolution in Trade and Geography. p. 345. http://www.nobelprize.org/nobel_prizes/economics/laureates/2008/krugman_lecture.pdf.
Kumar, U. and J. Felipe. 2011. A Reassessment of the Use of Unit Labor Costs as a Tool of Competitiveness and Policy Analyses in India. Economic and Political Weekly. XLVI(40). pp. 66−70.

94 Asian Development Outlook 2012
Kuznets, S. 1955. Economic Growth and Income Inequality. American Economic Review. 45. pp. 1–28.
Lewis, W.A. 1954. Economic Development with Unlimited Supply of Labour. The Manchester School. 22(2). pp.139-191.
Lewis, W. A. 1976. Development and Distribution. In A. Cairncross and M. Puri, eds. Employment, Income Distribution and Development Strategy: Problems of the Developing Countries (Essays in honour of H.W. Singer). New York: Holmes & Meier Publishers, Inc. pp. 26-42.
Lin, S. 2005. International Trade, Location and Wage Inequality in China. In R. Kanbur and A.J. Venables, eds. Spatial Inequality and Development. Oxford: Oxford University Press.
Lin, T. et.al. 2010. Decomposing Income Inequality: People’s Republic of China, 1990−2005. In J. Zhuang, ed., Poverty, Inequality, and Inclusive Growth: Measurement, Policy Issues, and Country Studies. London: Anthem Press and Manila: ADB.
Mammen, K. and C. Paxson. 2000. Women’s Work and Economic Development. Journal of Economic Perspectives. 14(4). pp. 141−64.
Marquis, M. H., B. Trehan, and W. Tantivong. 2011. The Wage Premium Puzzle and the Quality of Human Capital. Working Paper 2011−06. Federal Reserve Bank of San Francisco.
Mehta, A. et.al. 2011. Where Have all the Educated Workers Gone? Services and Wage Inequality in Three Asian Economies. Working Paper., University of California-Santa Barbara, Global & International Studies Program.
Milanovic, B. 2005. Can We Discern the Effect of Globalization on Income Distribution? Evidence from Household Surveys. The World Bank Economic Review. 19. pp. 21–44.
Organisation for Economic Co-operation and Development (OECD). 2011a. Divided We Stand: Why Inequality Keeps Rising. Paris:Paris: OECD.
______. 2011b. Education at Glance 2011: OECD Indicators. OECD Publishing.______. 2011c. Growing Income Inequality in OECD Countries: What Drives It
and How can Policy Tackle It? Paris: OECD Development Centre.______. 2012. Perspectives on Global Development 2012.Paris: OECD
Development Centre.Ortiz, I. and J. Yablonski. 2010. Investing in People: Social Protection for All. In
S. W. Handayani. ed. Enhancing Social Protection in Asia and the Pacific: The Proceedings of the Regional Workshop. Manila: ADB.
Özler, B. and G. Demombynes. 2002. Crime and Local Inequality in South Africa. World Bank Policy Research Working Paper No. 2925.Washington, DC: World Bank. http://www-wds.worldbank.org/external/default/WDSContentServer/WDSP/IB/2002/12/14/ 000094946_02120504013794/Rendered/PDF/multi0page.pdf
Paes de Barros, R., F., et.al. 2009. Measuring Inequality of Opportunities in Latin America and the Caribbean. Conference Edition., Washington, DC: World Bank.
Pant, B., ed. 2007. The National Accounts of the People’s Republic of China: Measurement Issues, Recent Developments, and the Way Forward. ADB, Manila.
Park, D. 2010. Social Protection in Asia. In J. Zhuang. ed. Poverty, Inequality, and Inclusive Growth in Asia: Measurement, Policy, Issues, and Country Studies. London: Anthem Press and Manila: ADB.
Reserve Bank of India (RBI). 2011. Deregulation of Savings Bank Deposit Interest Rate: A Discussion Paper. RBI.
Robbins, D. 1996. Evidence on Trade and Wages in the Developing World. OECD Technical Paper No. 119. Paris: Organisation for Economic Co-operation and Development.

Confronting rising inequality in Asia 95
Rodrik, D. 1997. Trade, Social Insurance, and the Limits to Globalization. NBER Working Papers 5905. National Bureau of Economic Research, Inc.
______. 1999. Where Did All the Growth Go? External Shocks, Social Conflict, and Growth Collapses. Journal of Economic Growth. 4(4). pp. 385–412.
______. 2005. Growth Strategies. In P. Aghion and S. Durlauf, eds. Handbook of Economic Growth. 1A. North-Holland.
Roemer, J. 1998. Equality of Opportunity. Cambridge, Massachusetts: Harvard University Press.
Sanchez-Paramo, C. and N. Schady. 2003. Off and Running? Technology, Trade, and the Rising Demand for Skilled Workers in Latin America. World Bank Policy Research Working Paper 3015.Washington, DC: World Bank.
Schady, N. and M. C. Araujo. 2006. Cash Transfers, Conditions, School Enrollment, and Child Work: Evidence from a Randomized Experiment in Ecuador. World Bank Policy Research Working Paper Series 3930. Washington, DC: World Bank.
Schultz, P. 2004. School Subsidies for the Poor: Evaluating the Mexican Progresa Program. Journal of Development Economics. 74(1). pp.199-250.
Sen, A. K. 1985. Commodities and Capabilities. Oxford: Oxford University Press.______. 1992. Missing Women: Social Inequality Outweighs Women’s Survival
Advantage in Asia and North Africa. British Medical Journal. 304(6827). pp. 586−587.
Sjoblom, D. and J. Farrington. 2008. ODI Project Briefings 7. http://www.odi.org.uk/resources/details.asp?id=440&title=indian-national-rural-employment-guarantee-act-will-reduce-poverty-boost-economy.
Soares, F. V. et.al. 2006. Cash Transfer Programmes in Brazil: Impacts on Poverty and Inequality. IPC Working Paper No.21.Brasilia: International Poverty Centre.
Son, H. H. 2006. Assessing the “Pro-Poorness” of Government Fiscal Policy in Thailand. Public Finance Review. 34. pp. 427−449.
______. 2010. Growth, Inequality, and the Labor Market: The Philippines. In J. Zhuang, ed. Poverty, Inequality, and Inclusive Growth: Measurement, Policy Issues, and Country Studies. London: Anthem Press and Manila: ADB.
State Council of China. 2011. The 12th Five Year Plan of National Economy and Social Development of People’s Republic of China 2011−2015. Beijing.
Stolper, W. F. and P. A. Samuelson. 1941. Protection and Real Wages. Review of Economic Studies. 9. pp. 58–73.
Tam, H. 2011. U-Shaped Female Labor Participation with Economic Development: Some Panel Data Evidence. Economics Letters. 110(2). pp. 140−142.
Taylor, K. and N. Driffield. 2005. Wage Inequality and the Role of Multinationals: Evidence from UK Panel Data. Labour Economics. 12. pp. 223−249.
United Nations (UN). 2005. Scaling-Up Rural Sanitation in South Asia. WPS Report 34873. Water and Sanitation Program. United Nations. http://esa.un.org/iys/docs/san_lib_docs/ Scaling%20Up%20Rural%20Saniltation.pdf
______. 2007. Development in an Ageing World: World Economic and Social Survey 2007. New York: United Nations Department of Economic and Social Affairs.
United Nations Economic and Social Commission for Asia and the Pacific (UNESCAP). 2011. Statistical Yearbook for Asia and the Pacific 2011. Bangkok: UNESCAP.
United Nations Educational, Scientific and Cultural Organization (UNESCO). 2005. Children Out of School: Measuring Exclusion from Primary Education.Montreal: UNESCO Institute for Statistics.
96 Asian Development Outlook 2012
______. 2011. Out-of-School Children: New Data Reveal Persistent Challenges. UIS Fact Sheet June 2011, No. 12. Montreal: UNESCO Institute for Statistics.
Vandenberg, P. 2010. Is Asia Adopting Flexicurity? International Labour Review. 149(1). pp. 31–58.
WaterAid. 2011. Off-track, Off-target: Why Investment in Water, Sanitation and Hygiene is not Reaching those Who Need it Most. http://www.wateraid.org/documents/Off-track-off-target.pdf.
World Health Organization (WHO) and United Nations Children’s Fund (UNICEF). 2006. Meeting the MDG Drinking Water and Sanitation Target: The Urban and Rural Challenge of the Decade. Geneva: WHO and UNICEF.
______. 2010. Progress on Sanitation and Drinking Water: 2010 Update. Geneva: WHO and UNICEF.
Wood, A. 1999. Openness and Wage Inequality in Developing Countries: The Latin American Challenge to East Asian Conventional Wisdom. In R. Baldwin et al. eds. Market Integration, Regionalism and the Global Economy. Cambridge, Massachusetts: Cambridge University Press.
World Bank. 2001. Social Protection Sector Strategy: From Safety Net to Springboard. Washington, DC: World Bank.
______. 2006. Equity and Development.World Development Report 2006. Washington, DC: World Bank.
______. 2012a. Is Higher Education Meeting its Promises? Putting Higher Education to Work: Skills and Research for Growth in East Asia. World Bank East Asia and Pacific Regional Report.
______. 2012b. China 2030: Building a Modern, Harmonious, and Creative High-Income Society. Conference Edition.Washington, DC: World Bank.
Zhang, X., J. Yang, and S. Wang. 2011. China Has Reached the Lewis Turning Point. China Economic Review. 22(4). pp. 542−554.
Zhuang, J. 1996. Estimating Distortions in the Chinese Economy: A General Equilibrium Approach. Economica. 63(252). pp. 543−568.
Zhuang, J., E. de Dios, and A. Lagman-Martin. 2010. Governance and Institutional Quality and the Links with Growth and Inequality: How Asia Fares. In J. Zhuang, ed. Poverty, Inequality, and Inclusive Growth: Measurement, Policy Issues, and Country Studies. London: Anthem Press and Manila: ADB.
Zhuang, J. and I. Ali. 2010. Poverty, Inequality, and Inclusive Growth in Asia. In J. Zhuang, ed. Poverty, Inequality, and Inclusive Growth: Measurement, Policy Issues, and Country Studies. London: Anthem Press and Manila: ADB.

Economic trends
and prospects in
developing Asia
3
Central Asia
Armenia
Azerbaijan
Georgia
Kazakhstan
Kyrgyz Republic
Tajikistan
Turkmenistan
Uzbekistan

Armenia
Armenia’s recovery continued in 2011, bolstered by buoyant growth in industry and agriculture. Prudent fiscal and monetary policies helped control inflation and lower the budget deficit, although public debt remained high in 2011, leaving little room for fiscal maneuver. The external accounts generally improved. Economic growth will continue in 2012 and 2013—but with downside risks—and over the medium term, continued and faster structural reforms are needed to support growth.
Economic performanceAfter modest growth of 2.1% in 2010, economic recovery continued in 2011, with growth estimated at 4.5%. On the supply side, industry, agriculture, and services were responsible for the stronger performance, as construction declined (Figure 3.1.1).
Industry (excluding construction) was the driving force, growing by an estimated 12.3%, including 12.2% in mining and quarrying and more than 16% in food processing. Agriculture expanded by an estimated 12.6%, rebounding from a 15.7% decline in 2010 that greatly impeded the country’s recovery from the 2009 recession. Agriculture was a major focus of government policy and benefited from interest rate subsidies and free seed distribution programs. Construction, largely household-financed and that had been the main driver before the crisis, remained weak, contracting by about 10% despite a recovery in remittances. As overall activity accelerated, services expanded by 5.8%, with the fastest growth in health and social work activities, entertainment and recreation.
On the demand side, net exports and consumption underpinned the recovery, while total investment detracted from growth. Net exports improved by 17%, reflecting the favorable external environment, and private consumption rose by an estimated 2.3%, on higher domestic bank lending and sustained remittance inflows. Total investment fell by 4.1%, marking sluggish private investment and restraints on public capital spending.
Average annual inflation decreased to 7.7% from 8.2% in 2010 (Figure 3.1.2). Monetary tightening and a slowdown in nonfood prices offset rapid increases in food prices, helping bring inflation closer to the central bank’s target band of 4% +/-1.5%. In December 2011, year-on-year inflation was 4.7%, half the previous year’s rate. The central bank raised the refinancing rate by 125 basis points in three steps in February–April to 8.5% and kept it steady until September, when it was cut by 50 basis points to 8.0%, owing to diminishing inflation pressures.
Propelled by increased credit activity and a continued buildup in net domestic assets, broad money (M2X) growth doubled to 23.7% in 2011. However, net foreign assets declined, reflecting the central bank’s sales
3.1.1 Contributions to growth (supply)
13.7
6.9
-14.12.1 4.5
-20
-10
0
10
20
2007 08 09 10 11
Percentage points
GDP
ConstructionAgriculture
Industry (excluding construction)Services (including indirect taxes and other items)
Sources: National Statistical Service of the Republic of Armenia. http://www.armstat.am; Central Bank of Armenia. http://www.cba.am (both accessed 15 March 2012).
This chapter was written by Grigor Gyurjyan of the Armenia Resident Mission, ADB,
Yerevan.
3.1.2 Inflation
-5
0
5
10
15
20
NonfoodFoodOverall
DecJulJan11
JulJan10
JulJan09
JulJan2008
%
Sources: CEIC Data Company; National Statistical Service of the Republic of Armenia. http://www.armstat.am (both accessed 15 March 2012).
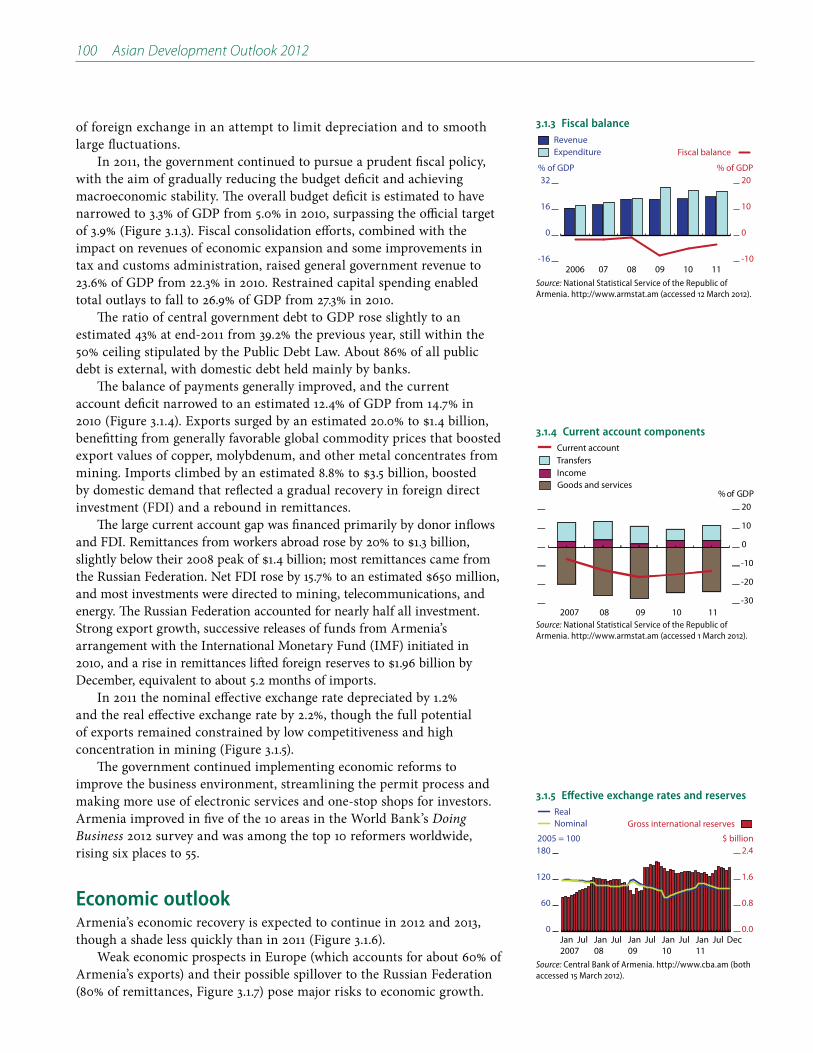
100 Asian Development Outlook 2012
of foreign exchange in an attempt to limit depreciation and to smooth large fluctuations.
In 2011, the government continued to pursue a prudent fiscal policy, with the aim of gradually reducing the budget deficit and achieving macroeconomic stability. The overall budget deficit is estimated to have narrowed to 3.3% of GDP from 5.0% in 2010, surpassing the official target of 3.9% (Figure 3.1.3). Fiscal consolidation efforts, combined with the impact on revenues of economic expansion and some improvements in tax and customs administration, raised general government revenue to 23.6% of GDP from 22.3% in 2010. Restrained capital spending enabled total outlays to fall to 26.9% of GDP from 27.3% in 2010.
The ratio of central government debt to GDP rose slightly to an estimated 43% at end-2011 from 39.2% the previous year, still within the 50% ceiling stipulated by the Public Debt Law. About 86% of all public debt is external, with domestic debt held mainly by banks.
The balance of payments generally improved, and the current account deficit narrowed to an estimated 12.4% of GDP from 14.7% in
benefitting from generally favorable global commodity prices that boosted export values of copper, molybdenum, and other metal concentrates from
by domestic demand that reflected a gradual recovery in foreign direct investment (FDI) and a rebound in remittances.
The large current account gap was financed primarily by donor inflows
and most investments were directed to mining, telecommunications, and energy. The Russian Federation accounted for nearly half all investment. Strong export growth, successive releases of funds from Armenia’s arrangement with the International Monetary Fund (IMF) initiated in
December, equivalent to about 5.2 months of imports.In 2011 the nominal effective exchange rate depreciated by 1.2%
and the real effective exchange rate by 2.2%, though the full potential of exports remained constrained by low competitiveness and high concentration in mining (Figure 3.1.5).
The government continued implementing economic reforms to improve the business environment, streamlining the permit process and making more use of electronic services and one-stop shops for investors. Armenia improved in five of the 10 areas in the World Bank’s Doing Business 2012 survey and was among the top 10 reformers worldwide, rising six places to 55.
Economic outlookArmenia’s economic recovery is expected to continue in 2012 and 2013, though a shade less quickly than in 2011 (Figure 3.1.6).
Weak economic prospects in Europe (which accounts for about 60% of Armenia’s exports) and their possible spillover to the Russian Federation (80% of remittances, Figure 3.1.7) pose major risks to economic growth.
3.1.3 Fiscal balance
-16
0
16
32
-10
0
10
20
Fiscal balanceExpenditureRevenue
11100908072006
% of GDP % of GDP
Source: National Statistical Service of the Republic of Armenia. http://www.armstat.am (accessed 12 March 2012).
3.1.4 Current account components
-30
-20
-10
0
10
20
2007 08 09 10 11
% of GDP
Current account
Income Transfers
Goods and services
Source: National Statistical Service of the Republic of Armenia. http://www.armstat.am (accessed 1 March 2012).
3.1.5 Effective exchange rates and reserves
0
60
120
180
0.0
0.8
1.6
2.4
Gross international reservesRealNominal
DecJulJan11
JulJan10
JulJan09
JulJan08
JulJan2007
2005 = 100 $ billion
Source: Central Bank of Armenia. http://www.cba.am (both accessed 15 March 2012).

Economic trends and prospects in developing Asia: Central Asia Armenia 101
However, structural policy reforms under way, such as an electronic listing of properties and property values as well as electronic facilities to issue construction permits, will help improve the investment climate.
On the supply side, agriculture is expected to continue to grow, but moderately, mainly reflecting government support and assuming continued normal weather conditions. The forecast increases in mining and food processing will contribute to overall industry growth. A moderate rise in construction is foreseen, mostly owing to large infrastructure projects, but no major changes are expected in household-financed construction. On the demand side, remittance-backed consumption is expected to be the growth driver, aided by a modest recovery in public investment spending.
Planned reforms will provide additional impetus to growth and should make it less volatile. Laws on free economic zones, an export-led strategy, and a “regulatory guillotine” initiative aimed at eliminating excessive regulation—all adopted in 2011—may lay the favorable groundwork for attracting investment and diversifying the country’s industrial base. Early in 2012, approving the first applications from the Russian Federation, the government authorized the creation of two economic zones, one for agricultural exports and one for high-tech goods.
Fiscal consolidation is set to continue in 2012 and 2013, given concerns about the buildup of public and external debt. The government’s medium-term fiscal objective is to reduce the budget deficit to 3.1% of GDP in 2012 and 2.0% in 2013. Although a pronounced global slowdown could reduce revenue, sustained reforms in tax, customs, and economic competition are expected to raise the tax-to-GDP ratio. They include a strong tax package adopted in 2011 that raised excises on liquor, luxury vehicles, and engine oil, the marginal rate on high-income taxpayers, and higher tax rates on gambling facilities and restaurants. Good revenue performance would enable the government to increase social security benefits and pensions, while reducing the overall budget deficit.
Average annual inflation is forecast to diminish to 4.1% in 2012 and rise slightly to 4.5% in 2013, as continued domestic support returns agricultural production to normal patterns and global food prices moderate and then pick up a little. Tight monetary policy will also help contain inflation. The 12-month (December–December) rate is expected to remain in the target band in the forecast period.
The external public debt-to-GDP ratio is set to rise in the forecast period (Figure 3.1.8), limiting the space for new borrowing. Still, the IMF, in its latest (December 2011) debt sustainability analysis, viewed external public debt as sustainable and the risk of debt distress as low, even after applying stress tests. The IMF judged that the 3% structural deficit target would maintain the debt ratio at current levels past 2016 without large shocks (although history suggests considerable likelihood of shocks occurring).
Lower world demand and a fall in prices for key commodity exports, such as copper and other metals, could harm export earnings. However, given the expected outcomes of the government’s export diversification strategy—approved in 2011 and targeted at developing 11 industrial branches with export potential, including pharmaceuticals, engineering, and brandy production—exports are projected to expand by 8.0% in 2012 and by about 11.0% in 2013 on top of the large growth
3.1.6 GDP growth
-16
-8
0
8
16
1312111009082007
%
Forecast
5-year moving average
Sources: National Statistical Service of the Republic of Armenia. http://www.armstat.am (accessed 15 March 2012); ADB estimates.
3.1.7 Sources of remittance inflows
-40
0
40
80
120
-60
0
60
120
180
Jan2008
Jul Jan09
Jul Jan10
Jul Jan11
Jul Dec
%, year on year$ millionChange in total
Russian FederationUnited States
Rest of the world
Source: Central Bank of Armenia. http://www.cba.am (accessed 16 March 2012).
3.1.8 External debt
0
10
20
30
40
1312111009082007
% of GDP
ForecastSource: National Statistical Service of the Republic of Armenia. http://www.armstat.am (accessed 12 March 2012).

102 Asian Development Outlook 2012
in 2011. Given recent trends in remittances and investments, imports are likely to continue to grow by about 4.5% in 2012 and 6.0% in 2013. The large infrastructure projects will likely boost domestic demand for imports. The recently adopted mining code, which reset mining royalties consistent with international best practices, is expected to attract further investment in the sector.
The current account deficit is forecast to widen to 11.2% of GDP in 2012 and then shrink to 10.0% of GDP in 2013, reflecting projections for gradual export diversification and continued strong remittances. Loan inflows and a modest rise in FDI are expected to help finance the current account deficit (Figure 3.1.9).
Policy challenge highlightsContinued reforms in tax and customs and in the business environment are needed to sustain economic growth and diversify the economic base from traditional overreliance on mining and construction, although the impact of reforms may take a considerable time.
The government has committed to accelerate these reforms. Despite the toughening of antitrust legislation, conditions for competitiveness remain unequal across firms of different sizes. Monopolistic practices of producers and importers of certain products distort prices and contribute to inflation. Corruption and inefficient state governance are still serious obstacles to reform.
Further improvements to the business environment, especially in paying taxes, enforcing contracts, and trading across borders, are a priority for the government. Moreover, slow progress in legal reform has hindered the effectiveness of new laws. Thus the government is implementing an action plan on doing business that encompasses some 50 activities, including reducing the cost of company registration and the steps to resolve contractual disputes, and, for small and medium-sized enterprises, simplifying tax payments and allowing electronic payment of customs duties.
More effort to strengthen governance will likewise be important to improve social policy, improve the distribution of resources, and reduce the recent crisis-related increase in poverty. Private sector development, especially through promoting small and medium-sized enterprises outside the capital, is critical in reducing the gap in living standards between the capital and the regions.
Despite the monetary tightening and the central bank’s policies to contain dollarization of the economy, foreign currency loans and deposits continue to be dominant (60% and 70%, respectively), increasing the country’s vulnerability to exchange rate shocks and making monetary policy less effective.
Additional spending on roads, urban infrastructure, and water services is crucial for inclusive growth over the longer term. Financing such spending without increasing the already high public debt-to-GDP ratio will require further increases in the tax-to-GDP ratio and reductions in public debt. Closer public –private partnership in infrastructure could also help reduce the burden on government finances and meet burgeoning infrastructure needs.
3.1.9 Current account balance
-18
-12
-6
0
6
1312111009082007
% of GDP
Forecast
5-year moving average
Sources: National Statistical Service of the Republic of Armenia. http://www.armstat.am (accessed 12 March 2012); ADB estimates.
3.1.1 Selected economic indicators (%)
2012 2013
GDP growth 3.8 4.2
Inflation 4.1 4.5
Current account balance (share of GDP)
-11.2 -10.0
Source: ADB estimates.

Azerbaijan
Growth was virtually nil in 2011, as safety concerns caused a stoppage in oil production at one of the main platforms for much of the year, offsetting gains from government-financed investment in other sectors. With expected more normal oil production, growth should strengthen in 2012 and 2013. Diversifying the economy will be important to maintain growth over the longer term.
Economic performanceOverall GDP grew by a mere 0.1% in 2011, as a 9.3% contraction in the oil sector largely offset a 9.4% expansion in non-oil activity, which was largely driven by public investment in infrastructure. Crude oil production fell by 10.5%, as a review and strengthening of safety procedures halted output at the Azeri-Chirag-Gunashli oil platform for much of the year. Natural gas production declined by 2.2%, as Turkey, the country’s major importer, reduced imports of Azeri gas and no other countries made offsetting purchases.
The non-oil sector recorded growth in agriculture, construction, and services (Figure 3.2.1). Agriculture grew by 5.8%, mainly from higher crops and livestock production, reflecting expanded cultivation and the impact of government tax credits and lending programs for improving access to modern farm equipment. Construction climbed by 20%, lifted by non-oil government projects and foreign investment in tourism. Industry contracted by 4.3% because of the lower oil output. Services rose by 6.5%, led by 10.3% growth in the wholesale and retail sector and some expansion of communications and tourism.
On the demand side, investment—mainly non-oil and largely financed from domestic resources—surged by 27.3%, with machinery and equipment manufacturing, communications, and chemical production receiving most of it. Private consumption grew by 9.9%, fueled in part by a 14.2% salary increase for civil servants introduced in September–November.
Average annual inflation moved up to 7.9%, largely reflecting higher food prices early in the year as a result of crop damage late in 2010 and price increases for imported foodstuffs, as well as inflation in trading partner countries. Monthly inflation spiked in the first half as food stocks declined, and then moderated in the second half with the new harvest (Figure 3.2.2).
Fiscal policy is driven largely by oil income, which accumulates in the State Oil Fund of Azerbaijan (SOFAZ), from where transfers are made to the budget to finance state spending. In 2011 such transfers constituted 57% of total government revenue (versus 52% in 2010); they helped finance
3.2.1 GDP growth, by sector
-20
0
20
40
60
ServicesIndustryAgricultureGDP
11100908072006
%
34.5
0.15.09.310.8
25.1
Source: State Statistical Committee of the Republic of Azerbaijan.
This chapter was written by Nail Valiyev of the Azerbaijan Resident Mission, ADB, Baku.
3.2.2 Monthly inflation
-3
0
3
6
9
12
Dec Jul Jan11
Jul Jan10
Jul Jan2009
%
Sources: International Monetary Fund. International Financial Statistics online database (accessed 10 March 2012); Central Bank of the Republic of Azerbaijan.
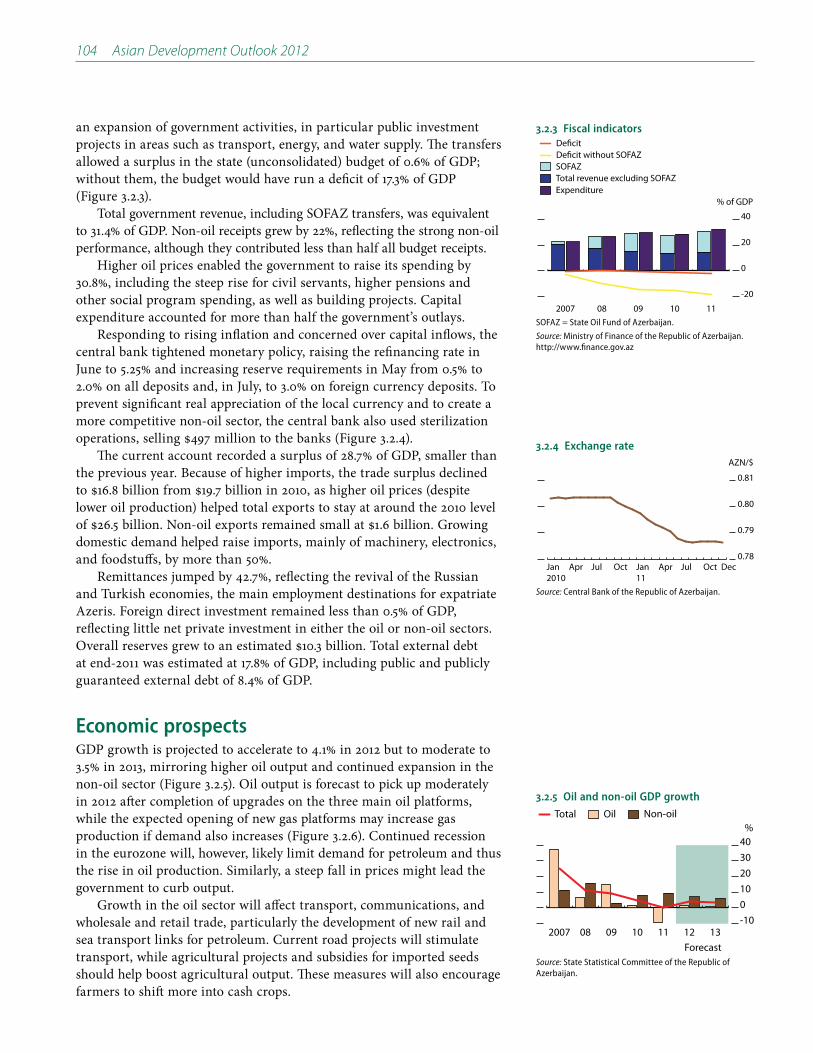
104 Asian Development Outlook 2012
an expansion of government activities, in particular public investment projects in areas such as transport, energy, and water supply. The transfers allowed a surplus in the state (unconsolidated) budget of 0.6% of GDP; without them, the budget would have run a deficit of 17.3% of GDP (Figure 3.2.3).
Total government revenue, including SOFAZ transfers, was equivalent to 31.4% of GDP. Non-oil receipts grew by 22%, reflecting the strong non-oil performance, although they contributed less than half all budget receipts.
Higher oil prices enabled the government to raise its spending by 30.8%, including the steep rise for civil servants, higher pensions and other social program spending, as well as building projects. Capital expenditure accounted for more than half the government’s outlays.
Responding to rising inflation and concerned over capital inflows, the central bank tightened monetary policy, raising the refinancing rate in June to 5.25% and increasing reserve requirements in May from 0.5% to 2.0% on all deposits and, in July, to 3.0% on foreign currency deposits. To prevent significant real appreciation of the local currency and to create a more competitive non-oil sector, the central bank also used sterilization
The current account recorded a surplus of 28.7% of GDP, smaller than the previous year. Because of higher imports, the trade surplus declined
lower oil production) helped total exports to stay at around the 2010 level
domestic demand helped raise imports, mainly of machinery, electronics, and foodstuffs, by more than 50%.
Remittances jumped by 42.7%, reflecting the revival of the Russian and Turkish economies, the main employment destinations for expatriate Azeris. Foreign direct investment remained less than 0.5% of GDP, reflecting little net private investment in either the oil or non-oil sectors.
at end-2011 was estimated at 17.8% of GDP, including public and publicly guaranteed external debt of 8.4% of GDP.
Economic prospectsGDP growth is projected to accelerate to 4.1% in 2012 but to moderate to 3.5% in 2013, mirroring higher oil output and continued expansion in the non-oil sector (Figure 3.2.5). Oil output is forecast to pick up moderately in 2012 after completion of upgrades on the three main oil platforms, while the expected opening of new gas platforms may increase gas production if demand also increases (Figure 3.2.6). Continued recession in the eurozone will, however, likely limit demand for petroleum and thus the rise in oil production. Similarly, a steep fall in prices might lead the government to curb output.
Growth in the oil sector will affect transport, communications, and wholesale and retail trade, particularly the development of new rail and sea transport links for petroleum. Current road projects will stimulate transport, while agricultural projects and subsidies for imported seeds should help boost agricultural output. These measures will also encourage farmers to shift more into cash crops.
3.2.3 Fiscal indicators
-20
0
20
40
Deficit without SOFAZDeficit
Expenditure
SOFAZTotal revenue excluding SOFAZ
111009082007
% of GDP
SOFAZ = State Oil Fund of Azerbaijan.
Source: Ministry of Finance of the Republic of Azerbaijan. http://www.finance.gov.az
3.2.4 Exchange rate
0.78
0.79
0.80
0.81
DecOctJulAprJan11
OctJulAprJan2010
AZN/$
Source: Central Bank of the Republic of Azerbaijan.
3.2.5 Oil and non-oil GDP growth
-10010203040
Non-oilOilTotal
1312111009082007
%
ForecastSource: State Statistical Committee of the Republic of Azerbaijan.

Economic trends and prospects in developing Asia: Central Asia Azerbaijan 105
Services are expected to stay largely driven by trade and tourism in 2012. The government’s investment program should, by expanding infrastructure, support industry and construction through boosting demand for local production of cement, steel pipes, and other building materials. Although the non-oil sector will remain small, its development and an improved business environment would improve domestic employment opportunities, possibly reducing remittances over the medium term.
Despite the central bank’s goal of reducing inflation to 7–7.5% in 2012 and 2013, various factors could take inflation to 9.0% in 2012 before it subsequently recedes to 8.5% in 2013 (Figure 3.2.7). Strong domestic demand fueled by oil income, rising public sector consumption (including planned government salary increases), and expanded domestic credit to the economy may heighten inflationary pressures in 2012. The completion of grain-storage and improved food-processing facilities should, however, reduce food imports, helping moderate inflation in 2013.
The budget envisages a deficit of 1.3% of GDP in 2012 (Figure 3.2.8), as total government spending is planned to rise by 10%, while revenue is forecast to grow by only 4%, based on a very conservative assumption for
at 37% of GDP in 2012, but would come in lower if petroleum prices plunged. Higher petroleum prices on the other hand could allow for even steeper increases in salaries and pensions in 2012, although a sharp fiscal expansion risks overheating the economy and stoking inflation.
The budget outlines a 22.2% expansion in social outlays in 2012. The government’s investment plan aims to keep capital spending, mainly for infrastructure projects on irrigation, roads and energy, at 2011 levels.
A budget deficit of 1% of GDP in 2013 is forecast, with total revenue, including SOFAZ transfers, of 32% of GDP. Because of limited non-oil sector income, the budget presumes that transfers from SOFAZ will account for 61% of total government revenue in 2012, and comparable transfers will likely be needed in 2013. Although SOFAZ balances, at close to 60% of 2010 GDP, should be sufficient to support such budget transfers over the next few years, global shocks and unexpected problems with oil production could affect the future sustainability of relying on SOFAZ transfers to fund expenditure.
Monetary policy will continue to focus on restraining inflation, so as to limit nominal interest rates and avoid a real appreciation of the local currency. The central bank plans to improve prudential and capital-adequacy control, as well as risk management, while strengthening the interbank market. Consolidating existing, small private banks and privatizing the state-owned International bank of Azerbaijan (the country’s largest bank) should foster a more competitive environment and cut banking costs.
The current account surplus is expected to remain high, at 22.0% of GDP in 2012 and 19.0% in 2013 (Figure 3.2.9), in light of elevated oil prices and increased output. Oil-related exports are expected to remain the dominant export category, at about 90% of the total.
Services imports, including transport, communications, and construction, are expected to grow once oil operations are back to strength. Continued hydrocarbon development—exploration for new oil
3.2.6 Oil production
0
100
200
300
400
13121110090807062005
Million barrels per year
ForecastSource: Ministry of Finance. http://www.finance.gov.az
3.2.7 Inflation
0
5
10
15
20
25
1312111009082007
%
ForecastSource: Central Bank of the Republic of Azerbaijan. http://www.cbar.az (accessed 14 March 2012).
3.2.1 Selected economic indicators (%)
2012 2013
GDP growth 4.1 3.5
Inflation 9.0 8.5
Current account balance (share of GDP)
22.0 19.0
Source: ADB estimates.
3.2.8 Fiscal balance
-2
-1
0
1
2
1312111009082007
% of GDP
ForecastSource: Ministry of Finance of the Republic of Azerbaijan. http://www.finance.gov.az

106 Asian Development Outlook 2012
wells and preparations for the second phase of the Shahdeniz (gas field) project—should sustain foreign investment.
Factors that may affect the actual outturn include rising imports of construction machinery and equipment, which may take the current account surplus below current forecasts. In addition, foreign investment could rise sharply if petroleum reserves are found in the area covered by an oil exploration agreement signed between BP and SOCAR in late 2010.
Financing for new projects is forecast to increase public and publicly guaranteed debt slightly, to about 8.7% of GDP in 2012. With international
external position should remain comfortable over the next several years.
Policy challenge—diversifying from petroleumSupporting growth in the non-oil sector and reducing dependence on oil revenue are the most pressing long-term issues for the economy. The key to maintaining long-term growth—diversifying the economy—will depend on developing a strong private sector. In turn this will require access to financing and an improved business and investment climate. Thus financial and regulatory reform making it easier to do business will be essential. Non-oil activity needs to be promoted in the regions especially, in order to reduce urban–rural income disparities.
With the country’s rich natural resources, agriculture appears the most promising area for diversification, and some studies suggest that its productivity can be increased two- or threefold over the medium term. Such gains would require a stronger legal framework, output reoriented toward cash crops, and improved market access, as the relatively few produce-collection points and processing plants hold back earnings opportunities. Heavy investment is thus needed to develop agroprocessing, which requires cold-storage tanks and transport systems, sophisticated processing plants, and strong marketing.
Public investment in the non-oil sector should increasingly be financed by taxes rather than transfers from SOFAZ, to improve the sustainability of public finances. SOFAZ revenue should be used mainly to smooth out public spending and finance large, one-time infrastructure projects.
In financial sector reform, the central bank’s decision to privatize the International Bank of Azerbaijan, is expected to strengthen competition among banks, while the additional capital obtained for that bank should strengthen banking generally (the bank’s liquidity and capital shortages have complicated privatization, however). Proposed consolidation of small banks could also improve competition and increase efficiency, which would benefit the private sector through lower banking costs and easier access to finance.
Azerbaijan improved its ranking in the World Bank’s 2012 Doing Business survey to 66, aided by reforms simplifying tax payments. Nevertheless, the country still rates poorly in many areas and was downgraded in several, including access to electricity and trading across borders (although current energy projects should improve the electricity ranking). Likewise, transport projects and regional cooperation programs may well encourage Azerbaijan and other member countries to streamline trading procedures and so boost cross-border trade.
3.2.9 Current account balance
0
10
20
30
40
1312111009082007
% of GDP
ForecastSource: Central Bank of the Republic of Azerbaijan. http://www.cbar.az (accessed 14 March 2012).

Georgia
The economy maintained robust growth in 2011, following its recovery in 2010 from the global recession, while annual inflation rose slightly. The current account deficit remained large, as nominal imports grew more than exports. In 2012 a weaker global environment will likely reduce growth by constraining exports, foreign direct investment, and remittances. A key policy challenge is to achieve more inclusive growth, particularly for rural areas.
Economic performanceThe economy continued to show robust growth, estimated by the government at 7.0% (Figure 3.3.1). Among the productive sectors, about half the growth came from services, which rose by 5.6% relative to the previous year, because of strong increases in the financial sector, tourism, and communications. Another two-fifths came from industry, which rose by 9.7% during 2011, as strong external demand and continued structural reforms boosted manufacturing, although mining declined due to reduced production of coal, lignite, and peat. The small balance came from agriculture, which, after 3 years of decline, rose by 5.5% during the year, reflecting higher crop production as a result of good weather and favorable prices.
On the demand side, private investment and private consumption are both estimated to have contributed to growth, with consumption benefiting from higher remittance inflows, aided by the Russian Federation’s healthy economy. Government consumption and investment had little impact, as fiscal consolidation held back government spending, while net exports had a negative impact (real imports grew far more than real exports).
Although average inflation rose to 8.5% from 7.1% in 2010, the 12-month rate slowed to 2.0% in December, after peaking at 14.3% in May 2011 (Figure 3.3.2), as the moderation in prices of food (domestic and imported) and other imports during the second half of the year outweighed price hikes for transport and utilities stemming from price liberalization.
The fiscal deficit narrowed to 2.9% of GDP from 6.6% of GDP in 2010, consistent with the adjustment program supported by the International Monetary Fund. Tax revenue rose by 26.0%, reflecting a new tax code, enforcement of new revenue measures, and simplification of tax compliance and reporting requirements, all of which took effect at the start of the year. Relative to GDP, however, total revenue rose only slightly, to 28.4% from 28.3% in 2010, because of declines in grants and nontax revenue as a share of GDP.
3.3.1 Contributions to growth (supply)
12.3
2.3
-3.8
6.3 7.0
-5
0
5
10
15
2007 08 09 10 11
%IndustryAgricultureGDP
ServicesNet indirect taxes
Source: National Statistics Office of Georgia. http://www.geostat.ge (accessed 20 March 2012).
This chapter was written by George Luarsabishvili of the Georgia Resident Mission,
ADB, Tbilisi.
3.3.2 Inflation
-8
0
8
16
24
32
DecJan11
Jan10
Jan09
Jan08
Jan2007
%
Food
Overall
Source: National Statistics Office of Georgia. http://www.geostat.ge (accessed 9 March 2012).

108 Asian Development Outlook 2012
Spending growth was kept to 4.7%, reflecting compression in capital expenditure as well as tighter spending limits on public salaries and defense. Total expenditure fell to 31.3% of GDP from 34.9% in 2010.
Treasury securities, foreign financing, and privatization receipts all contributed to budget financing. Treasury securities—funding 28.4% of the budget deficit in 2011—have emerged in recent years as an important source of deficit coverage, and successful issues of treasury notes of up to 10 years’ maturity have become an important step for developing the secondary market for tradable domestic debt. In addition, the successful issue of a second sovereign Eurobond (the first was in 2008) reduced the rollover risk from external liabilities falling due in 2012 and 2013. Total government debt was estimated at 36.8% of GDP at end-2011.
M3 broad money grew by 17.2% (Figure 3.3.3), reflecting a 19.5% rise in bank credit to the private sector. The central bank’s switch to a more accommodative monetary policy in July lowered the policy rate in steps from 7.5% to 6.5% by January 2012, although heavy dollarization of the banking system limits monetary policy effectiveness. Interest rates declined on long-term loans, despite strong growth in lari-denominated loans and higher credit risk premiums, although the lending rate remained high at 19.2%. Deposit interest rates rose slightly to 9.4%, as banks moved to increase deposits by offering competitive interest rates (Figure 3.3.4).
Banking stability improved, reflecting a near doubling of banks’ returns on assets and on equity in light of wider profit margins and a continued high capital-adequacy ratio of about 17%. The ratio of nonperforming loans to total loans decreased to 8.6%, partly due to rising credit volumes.
The current account deficit worsened to an estimated 13.3% of GDP from 11.5% in 2010. The trade deficit widened by an estimated 25% to
growth in vehicle reexports to Kazakhstan (in advance of higher customs duties, as Kazakhstan—a traditional major market—entered a customs union with Belarus and the Russian Federation in January 2012) and a near doubling of sales of nitric fertilizers due to heavier global demand associated with high food prices. Imports surged by 39.8% (from a larger base than exports), mainly reflecting increased imports of intermediate goods and petroleum products.
Strong remittances and continued surpluses in services—mainly from
some of the deterioration in the trade balance. A 21% rise in foreign direct
the larger current account deficit. Gross international reserves climbed
external debt, including private debt, fell to an estimated 57.5% of GDP at end-2011 from 61.6% the previous year.
The flexible exchange rate regime continued to provide relative stability for the external sector. The lari appreciated by 12.2% in nominal effective terms and by 8.4% in real effective terms during 2011 (Figure 3.3.6).
3.3.3 Contributions to money supply (M3) growth
-50
0
50
100
2007 08 09 10 11
Percentage pointsOther items (net)Credit to the economyNet claims on governmentNet foreign assetsBroad money (M3)
Source: International Monetary Fund. International Financial Statistics online database (accessed 15 March 2012).
3.3.4 Interest rates
0
10
20
30
0
10
20
30
DepositLendingPolicy
Jan12
JulJan11
JulJan10
JulJan09
JulJan2008
%%
Source: National Bank of Georgia. http://www.nbg.gov.ge (accessed 9 March 2012).
3.3.5 Current account components
-24
-16
-8
0
8
16
-9
-6
-3
0
3
6
2007 08 09 10 11
% of GDP $ billion
Net incomeNet transfersCurrent account
balance
Exports
Net services Imports
Source: National Bank of Georgia. http://www.nbg.gov.ge (accessed 9 March 2012).
3.3.6 Exchange rates
75
150
225
300
0.5
1.0
1.5
2.0
GEL/$Nominal effectiveReal effective
DecJulJan11
JulJan10
JulJan09
JulJan2008
Dec 1995 = 100 GEL/$
Source: National Bank of Georgia. http://www.nbg.gov.ge (accessed 15 March 2012).
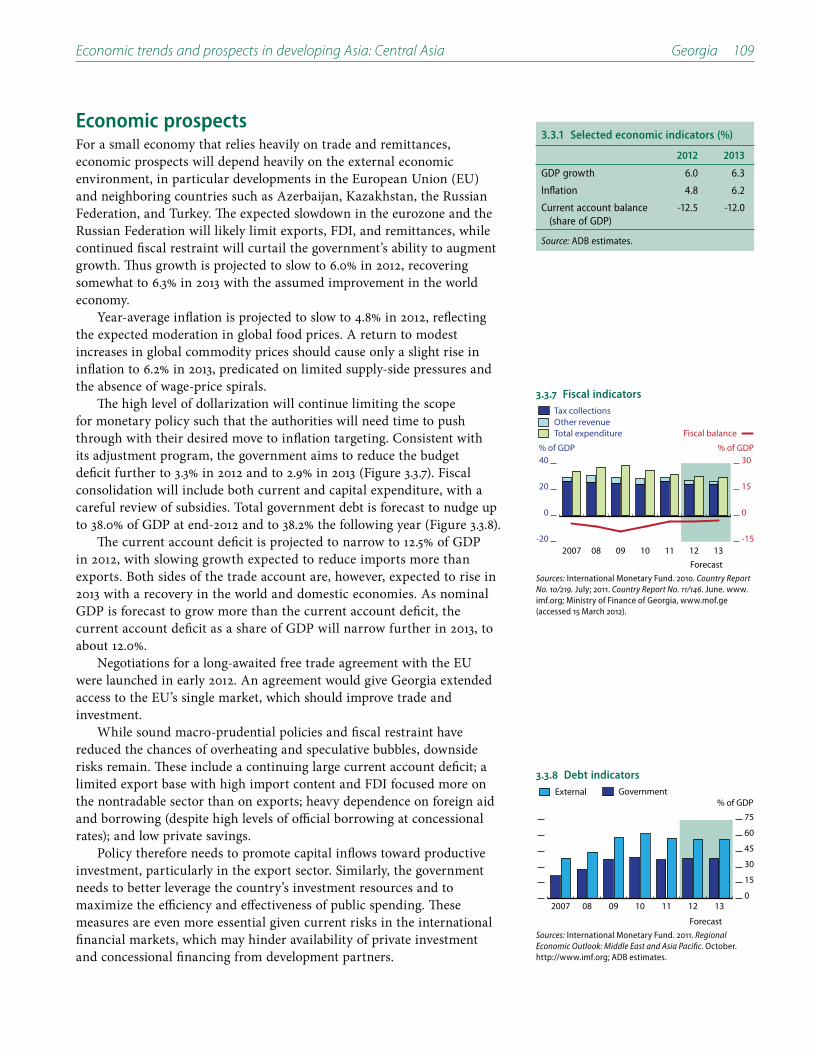
Economic trends and prospects in developing Asia: Central Asia Georgia 109
Economic prospectsFor a small economy that relies heavily on trade and remittances, economic prospects will depend heavily on the external economic environment, in particular developments in the European Union (EU) and neighboring countries such as Azerbaijan, Kazakhstan, the Russian Federation, and Turkey. The expected slowdown in the eurozone and the Russian Federation will likely limit exports, FDI, and remittances, while continued fiscal restraint will curtail the government’s ability to augment growth. Thus growth is projected to slow to 6.0% in 2012, recovering somewhat to 6.3% in 2013 with the assumed improvement in the world economy.
Year-average inflation is projected to slow to 4.8% in 2012, reflecting the expected moderation in global food prices. A return to modest increases in global commodity prices should cause only a slight rise in inflation to 6.2% in 2013, predicated on limited supply-side pressures and the absence of wage-price spirals.
The high level of dollarization will continue limiting the scope for monetary policy such that the authorities will need time to push through with their desired move to inflation targeting. Consistent with its adjustment program, the government aims to reduce the budget deficit further to 3.3% in 2012 and to 2.9% in 2013 (Figure 3.3.7). Fiscal consolidation will include both current and capital expenditure, with a careful review of subsidies. Total government debt is forecast to nudge up to 38.0% of GDP at end-2012 and to 38.2% the following year (Figure 3.3.8).
The current account deficit is projected to narrow to 12.5% of GDP in 2012, with slowing growth expected to reduce imports more than exports. Both sides of the trade account are, however, expected to rise in 2013 with a recovery in the world and domestic economies. As nominal GDP is forecast to grow more than the current account deficit, the current account deficit as a share of GDP will narrow further in 2013, to about 12.0%.
Negotiations for a long-awaited free trade agreement with the EU were launched in early 2012. An agreement would give Georgia extended access to the EU’s single market, which should improve trade and investment.
While sound macro-prudential policies and fiscal restraint have reduced the chances of overheating and speculative bubbles, downside risks remain. These include a continuing large current account deficit; a limited export base with high import content and FDI focused more on the nontradable sector than on exports; heavy dependence on foreign aid and borrowing (despite high levels of official borrowing at concessional rates); and low private savings.
Policy therefore needs to promote capital inflows toward productive investment, particularly in the export sector. Similarly, the government needs to better leverage the country’s investment resources and to maximize the efficiency and effectiveness of public spending. These measures are even more essential given current risks in the international financial markets, which may hinder availability of private investment and concessional financing from development partners.
3.3.1 Selected economic indicators (%)
2012 2013
GDP growth 6.0 6.3
Inflation 4.8 6.2
Current account balance (share of GDP)
-12.5 -12.0
Source: ADB estimates.
3.3.7 Fiscal indicators
-20
0
20
40
-15
0
15
30
Fiscal balanceTotal expenditureOther revenueTax collections
1312111009082007
% of GDP% of GDP
ForecastSources: International Monetary Fund. 2010. Country Report No. 10/219. July; 2011. Country Report No. 11/146. June. www.imf.org; Ministry of Finance of Georgia, www.mof.ge (accessed 15 March 2012).
3.3.8 Debt indicators
0
15
30
45
60
75
External Government
1312111009082007
% of GDP
ForecastSources: International Monetary Fund. 2011. Regional Economic Outlook: Middle East and Asia Pacific. October. http://www.imf.org; ADB estimates.
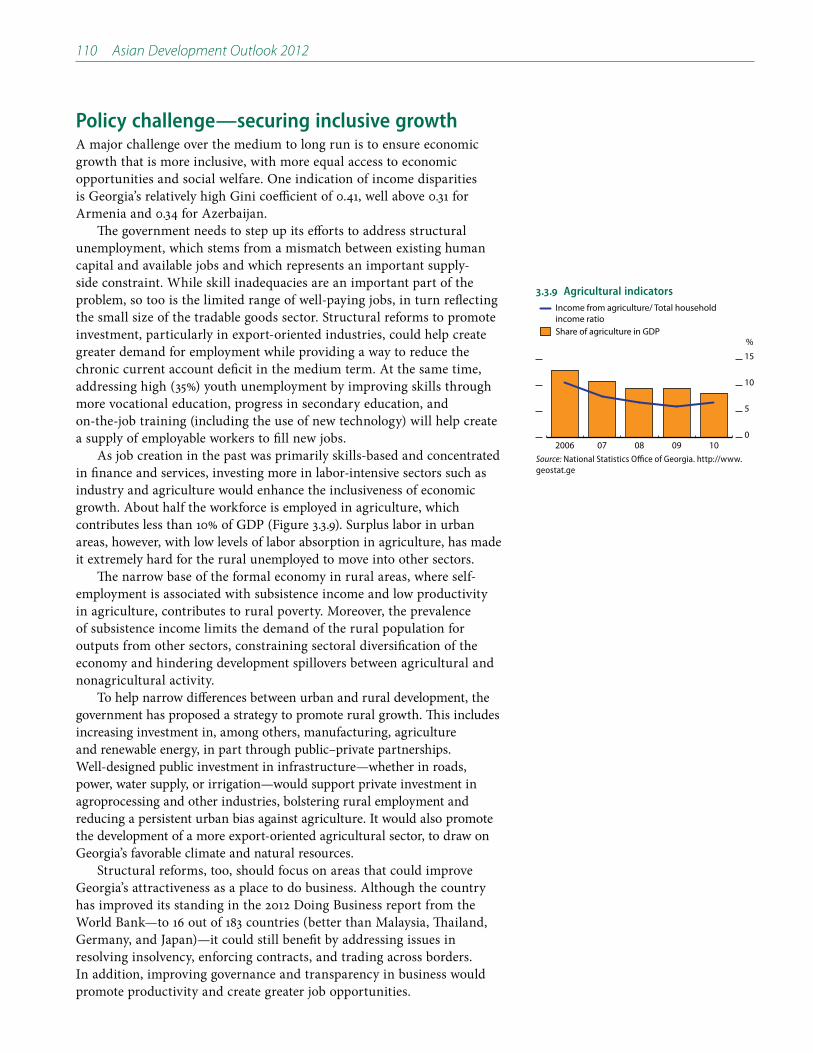
110 Asian Development Outlook 2012
Policy challenge—securing inclusive growthA major challenge over the medium to long run is to ensure economic growth that is more inclusive, with more equal access to economic opportunities and social welfare. One indication of income disparities is Georgia’s relatively high Gini coefficient of 0.41, well above 0.31 for Armenia and 0.34 for Azerbaijan.
The government needs to step up its efforts to address structural unemployment, which stems from a mismatch between existing human capital and available jobs and which represents an important supply-side constraint. While skill inadequacies are an important part of the problem, so too is the limited range of well-paying jobs, in turn reflecting the small size of the tradable goods sector. Structural reforms to promote investment, particularly in export-oriented industries, could help create greater demand for employment while providing a way to reduce the chronic current account deficit in the medium term. At the same time, addressing high (35%) youth unemployment by improving skills through more vocational education, progress in secondary education, and on-the-job training (including the use of new technology) will help create a supply of employable workers to fill new jobs.
As job creation in the past was primarily skills-based and concentrated in finance and services, investing more in labor-intensive sectors such as industry and agriculture would enhance the inclusiveness of economic growth. About half the workforce is employed in agriculture, which contributes less than 10% of GDP (Figure 3.3.9). Surplus labor in urban areas, however, with low levels of labor absorption in agriculture, has made it extremely hard for the rural unemployed to move into other sectors.
The narrow base of the formal economy in rural areas, where self-employment is associated with subsistence income and low productivity in agriculture, contributes to rural poverty. Moreover, the prevalence of subsistence income limits the demand of the rural population for outputs from other sectors, constraining sectoral diversification of the economy and hindering development spillovers between agricultural and nonagricultural activity.
To help narrow differences between urban and rural development, the government has proposed a strategy to promote rural growth. This includes increasing investment in, among others, manufacturing, agriculture and renewable energy, in part through public–private partnerships. Well-designed public investment in infrastructure—whether in roads, power, water supply, or irrigation—would support private investment in agroprocessing and other industries, bolstering rural employment and reducing a persistent urban bias against agriculture. It would also promote the development of a more export-oriented agricultural sector, to draw on Georgia’s favorable climate and natural resources.
Structural reforms, too, should focus on areas that could improve Georgia’s attractiveness as a place to do business. Although the country has improved its standing in the 2012 Doing Business report from the World Bank—to 16 out of 183 countries (better than Malaysia, Thailand, Germany, and Japan)—it could still benefit by addressing issues in resolving insolvency, enforcing contracts, and trading across borders. In addition, improving governance and transparency in business would promote productivity and create greater job opportunities.
3.3.9 Agricultural indicators
0
5
10
15
Income from agriculture/ Total household income ratioShare of agriculture in GDP
100908072006
%
Source: National Statistics Office of Georgia. http://www.geostat.ge

Kazakhstan
Good oil sector performance and sizable public investment contributed to robust expansion and a strong balance of payments in 2011. Growth is forecast to moderate in 2012, reflecting the slowdown expected in Europe and the Russian Federation, before recovering somewhat in 2013 as the world economy strengthens. Structurally, the economy remains dependent on oil production and constrained by financial sector weakness. Over time growth will depend on the success of the government’s diversification efforts, largely funded by oil earnings.
Economic performance Growth since independence has turned largely on strong oil and gas exports. Much of the proceeds have been saved in the National Fund for the Republic of Kazakhstan (NFRK), with portions transferred to the budget to fund public investment.
Global recovery helped growth rebound to 7.0% in 2010, and then to an estimated 7.5% in 2011, reflecting a surge in agricultural production, a strong upturn in services, and continued government investment in some industries (Figure 3.4.1). Agriculture, hit by a severe drought in 2010, was aided in 2011 by particularly favorable weather, which helped it grow by 26.7%. Grain production more than doubled, achieving record yields.
Industrial output (excluding construction) rose by 3.5%, driven mainly by a 6.2% increase in manufacturing, due to rapid growth in chemicals, metallurgy, and machinery and vehicles. Mining picked up by about 1.3%. Oil output fell by 0.5%, affected by social unrest in a key production area, although gas condensate and natural gas output climbed by 6.1% and 5.2%, respectively. Construction expanded by 2.7%, reflecting government stimulus and investment in infrastructure.
Services rose by 7.7%, driven by strong growth in wholesale and retail trade (14.5%), transport and warehousing (6.8%), and communications (18.7%). Financial services and insurance contracted by 4.5%, although the credit market expanded for the first time since the global financial crisis. Real estate activity slowed to 1.4% from 3.5% in 2010, despite continued support from the government for residential construction.
On the demand side, based on 9 months’ data, total consumption is estimated to have risen by almost 11%, driven by nearly 18% growth in government consumption and a 9% rise in private consumption, as higher household income strongly boosted retail trade (Figure 3.4.2).
Gross fixed capital formation moved up by an estimated 4.5%, underpinned by higher investment in manufacturing, transport and warehousing, information and communication, and real estate. Much of this investment involved government support under the Accelerated
3.4.1 Contributions to growth (supply side)
8.9
3.31.2
7.0 7.5
-3
0
3
6
9
2007 08 09 10 11
Percentage pointsConstructionAgricultureGDP Industry excluding
constructionServices
Note: Data in 2011 are not directly comparable to earlier years because of a break in the series.
Source: Agency of Statistics of the Republic of Kazakhstan.
This chapter was written by Christopher Hnanguie and Manshuk Nurseitova of the
Kazakhstan Resident Mission, ADB, Astana.
3.4.2 Growth of GDP demand components
-18
-9
0
9
18
27
Imports of goods and servicesExports of goods and servicesGross fixed investmentPublic consumptionPrivate consumption
111009082007
%
Note: Data for 2011 are for 9 months only.
Source: Staff estimates based on data from Agency of Statistics of the Republic of Kazakhstan.

112 Asian Development Outlook 2012
Program of Industrial and Innovative Development, which aims to promote economic diversification and greater competitiveness through its more than 600 government-led projects, many implemented by the government’s National Welfare Fund, Samruk-Kazyna (SK). Net exports rose by about 5%, reflecting higher oil prices.
Average annual inflation rose to 8.3%, slightly above the target of 6–8% set by the National Bank of Kazakhstan (NBK) (Figure 3.4.3). The acceleration reflected double-digit increases in food and fuel prices, despite stringent price regulation and efforts to contain fuel prices by having the national oil and gas company sell imported fuel products at a loss. Inflation accelerated during the first 8 months of the year, as food prices surged, and then slowed toward year-end. In the year through December, inflation was 7.4%.
The fiscal deficit narrowed slightly to 2.1% of GDP, from 2.4% of GDP in 2010, as revenue growth outpaced the rise in expenditure. Thanks to notable increases in both tax and nontax receipts—reflecting strong economic growth, higher export duties for oil products and larger receipts from the Russian Federation under the Customs Union agreement, and increased nontax income (penalties, fines, and dividends)—revenue rose by 35.6%. Total revenue, including transfers from the NFRK, remained at 19.7% of GDP.
Reductions in the number of government employees and more careful monitoring of government spending helped limit expenditure to 21.7% of GDP. Spending for education, health care, and social assistance remained at about the same share of GDP as in 2010. Public sector wages were increased by 18–24% through November, while pensions and social allowances were raised by 30% and 9%, respectively.
Broad money expanded by 15.0% and reserve money by 10.3% owing to higher net foreign assets at the NBK and commercial banks. The NBK, reversing the easing carried out during the crisis, raised the refinancing rate from 7.0% to 7.5% in March 2011 in response to higher inflation and maintained it through year-end.
With the foreign exchange market supporting the tenge (the national currency), the NBK returned to a managed float regime in March 2011 with limited intervention, buying in the first half of the year and selling in the second half, to minimize exchange rate fluctuations (Figure 3.4.4). In nominal terms, the tenge remained largely stable against major currencies and depreciated slightly against its currency basket. The real exchange rate, however, appreciated by 5.7% against the dollar and by 1.0% against the euro because of relative inflation rates, but depreciated by 2.8% against the Russian ruble toward end-2011, after appreciating between August and mid-December.
Positive trends in the economy led Standard & Poor’s and Fitch to raise their sovereign ratings by one notch each, to ВВВ+ and BВВ, respectively, in November. But the banking sector remains weak, and about one-third of loans are nonperforming.
In April the NBK’s role expanded to include financial supervision. Reserve requirements for banks were increased in May, from 1.5% to 2.5% on internal liabilities and from 2.5% to 4.5% on other liabilities, to address the high level of nonperforming loans (NPLs). Legal amendments were approved to prolong the guarantee of individual deposits up to T5 million
3.4.3 Inflation
3
5
7
9
11
13
ServicesNonfoodFoodAll goods and services
Feb12
OctJulAprJan11
OctJulAprJan2010
%
Sources: National Bank of Kazakhstan. http://www.nationalbank.kz (accessed 23 March 2012). Agency Statistics of Kazakhstan.
3.4.4 Foreign exchange market and NBK interventions
-4
-2
0
2
4
145
146
147
148
149
Net purchases by NBK Tenge exchange rate
Sep Jul May MarJan11
Nov Sep2010
$ billion KZT/$
Source: National Bank of Kazakhstan. Financial Stability. http://www.nationalbank.kz (accessed 23 March 2012).
3.4.5 Current account indicators
-90
-45
0
45
90
-10
-5
0
5
10
Current accountbalanceServices and transfers
Income Imports Exports
111009082007
$ billion % of GDP
-7.9
7.3
2.0
-3.5
4.7
Source: National Bank of Kazakhstan. http://www.nationalbank.kz (accessed 22 March 2012).

Economic trends and prospects in developing Asia: Central Asia Kazakhstan 113
deductible. The NBK will also establish a distressed assets fund to deal with the banks’ bad loans.
The current account surplus more than tripled to an estimated 7.3% of
46.1%, reflecting high oil prices, while imports grew by 31.8%. The services
mineral sector) and a large outflow from net remittances, estimated at
during the year, while the NFRK’s external assets rose by 43% to
at end-September, with external private sector debt estimated at 63% of GDP, half of which was intracompany debt of multinational subsidiaries operating in extractive industries. Government external debt remained very low at about 2.3% of GDP. State enterprises’ debt, which is not reported as public debt, exceeds 10% of GDP, and a June 2011 report by the International Monetary Fund noted indications of growing foreign borrowing by some enterprises in which SK has holdings.
Economic prospects Economic growth is projected to slow to 6.0% in 2012, reflecting the expected slowdown in the eurozone and the Russian Federation. It should accelerate to 6.5% in 2013, as the world economy strengthens (Figure 3.4.6). Growth could turn out slower if prospects for oil and other commodities worsen, the world outlook deteriorates, or domestic demand is weaker than expected.
Sizable investments under the Accelerated Program should boost manufacturing and construction, while an expected resurgence of mineral prices and minimal decline in oil prices is seen encouraging growth in petroleum and mining. Implementation of the Accelerated Program, supplemented by other programs aimed at improving infrastructure and productivity, and at promoting industrial and social modernization, are likely to support growth by easing bottlenecks and boosting domestic producers’ competitiveness.
Integration into the Common Economic Space (CES) with Belarus and the Russian Federation stands to expand trade, particularly if other countries also join. Inflation is projected to decline to 6.5% in 2012 due to lower food prices, and then rise slightly to 6.8% in 2013 as food price inflation resumes (Figure 3.4.7). The 20% rise in the producer price index during 2011 and the need to harmonize tariffs and prices under the CES to higher Russian prices will contribute to inflationary pressures in 2012. However, the authorities are expected to continue using price regulation, subsidies, and bans on individual products to keep observed inflation within the 6–8% target range
Fiscal policy envisages an increase in the overall budget deficit to about 2.5% of GDP in 2012, as revenue is forecast to decline to about 19% of GDP, while expenditure as a share of GDP is forecast to fall by less
3.4.6 GDP growth
0
2
4
6
8
10
1312111009082007
%
Forecast
5-year moving average
Source: Asian Development Outlook database.
3.4.1 Selected economic indicators (%)
2012 2013
GDP growth 6.0 6.5
Inflation 6.5 6.8
Current account balance (share of GDP)
1.0 1.0
Source: ADB estimates.
3.4.7 Inflation
0
6
12
18
1312111009082007
%
Forecast
5-year moving average
Source: Asian Development Outlook database.

114 Asian Development Outlook 2012
than revenue or to increase (Figure 3.4.8). The authorities aim to reduce the deficit to 1.5% of GDP in 2013 through further tax administration reform (by more extensive auditing, registering the remaining small sellers for tax payments, and moving toward universal tax declarations), better procurement methods, and a moratorium on government hiring. Nevertheless, pensions, social assistance, and wages for the social sector will grow in real terms.
In January 2012 the President announced a policy change to broaden the NFRK’s objectives with a new investment function. Part of the NFRK’s assets will be invested internally to fund government
(nearly 2% of GDP) to the national oil and gas company Kazmunaigas in two tranches, in 2013 and 2015, to accelerate production at the Kashagan oil field, the world’s largest field discovered in recent decades.
In 2012 and 2013, annual transfers from the NFRK, which are
in meeting or expanding social expenditure without exceeding budget
of GDP) in revenue is expected from sales of shares in state enterprises to the population and pension funds through the proposed launch of the People’s IPO Program in 2012. Total government debt (excluding state enterprises’ debt) is not expected to exceed 15% of GDP in 2012 and 2013, a very low rate by international standards.
In January 2012, 12-month inflation fell to 5.9%, the lowest in many years. In mid-February, the NBK reduced the refinancing rate by 0.5% and is considering another decrease in April if inflation remains low. Thus interest rates generally may also decline moderately. As for the exchange rate, in the first 2 months of 2012 the tenge remained stable,
Despite government support to the financial sector, a persistent high level of NPLs is a major concern and a key constraint to economic growth. At end-2011, banking sector performance was worse (in terms of credit-to-GDP and asset-to-GDP ratios, share of NPLs, return on assets, and return on equity) than at end-2010. In addition, the large BTA Bank, which was recapitalized and restructured in 2009–2010, remains in difficulty and in January 2012 requested approval for a second restructuring. In this situation, SK—a major shareholder—may be forced to bail out the bank using public money. Over the medium term, NPLs may also rise as a result of financial assistance provided through interest-rate subsidies and partial credit guarantees under the government’s Roadmap of Business 2020 program, which helped increase bank lending in 2011.
The poor performance of the state pension funds also presents a macroeconomic risk, given the aging population. Between losses on external assets and poor returns on the more than 40% of their funds invested in low-interest-rate government securities, the funds have lost over 20% of their real value during the past 6–8 years and could be hard hit if another crisis occurs.
The current account is forecast to record surpluses of about 1.0–1.5% of GDP in 2012 and 2013 (Figure 3.4.9). Surpluses of at least 20% of GDP are projected for the trade balance, supported by high prices for oil
3.4.9 Current account
-8
-4
0
4
8
1312111009082007
% of GDP5-year moving average
ForecastSource: Asian Development Outlook database.
3.4.8 Fiscal indicators
-7
0
7
14
21
28
Fiscal balance Expenditure Revenue
12111009082007
% of GDP
ForecastSources: Ministry of Finance of the Republic of Kazakhstan. National Budget 2012–2013.
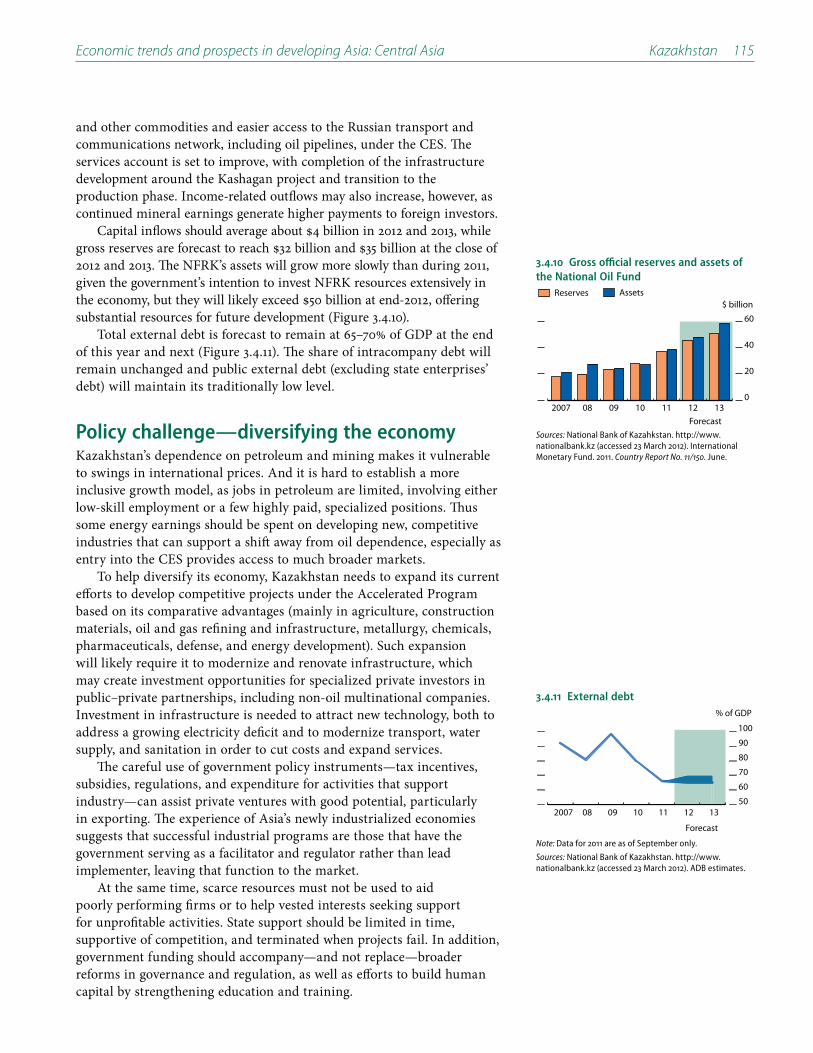
Economic trends and prospects in developing Asia: Central Asia Kazakhstan 115
and other commodities and easier access to the Russian transport and communications network, including oil pipelines, under the CES. The services account is set to improve, with completion of the infrastructure development around the Kashagan project and transition to the production phase. Income-related outflows may also increase, however, as continued mineral earnings generate higher payments to foreign investors.
2012 and 2013. The NFRK’s assets will grow more slowly than during 2011, given the government’s intention to invest NFRK resources extensively in
substantial resources for future development (Figure 3.4.10).Total external debt is forecast to remain at 65–70% of GDP at the end
of this year and next (Figure 3.4.11). The share of intracompany debt will remain unchanged and public external debt (excluding state enterprises’ debt) will maintain its traditionally low level.
Policy challenge—diversifying the economyKazakhstan’s dependence on petroleum and mining makes it vulnerable to swings in international prices. And it is hard to establish a more inclusive growth model, as jobs in petroleum are limited, involving either low-skill employment or a few highly paid, specialized positions. Thus some energy earnings should be spent on developing new, competitive industries that can support a shift away from oil dependence, especially as entry into the CES provides access to much broader markets.
To help diversify its economy, Kazakhstan needs to expand its current efforts to develop competitive projects under the Accelerated Program based on its comparative advantages (mainly in agriculture, construction materials, oil and gas refining and infrastructure, metallurgy, chemicals, pharmaceuticals, defense, and energy development). Such expansion will likely require it to modernize and renovate infrastructure, which may create investment opportunities for specialized private investors in public–private partnerships, including non-oil multinational companies. Investment in infrastructure is needed to attract new technology, both to address a growing electricity deficit and to modernize transport, water supply, and sanitation in order to cut costs and expand services.
The careful use of government policy instruments—tax incentives, subsidies, regulations, and expenditure for activities that support industry—can assist private ventures with good potential, particularly in exporting. The experience of Asia’s newly industrialized economies suggests that successful industrial programs are those that have the government serving as a facilitator and regulator rather than lead implementer, leaving that function to the market.
At the same time, scarce resources must not be used to aid poorly performing firms or to help vested interests seeking support for unprofitable activities. State support should be limited in time, supportive of competition, and terminated when projects fail. In addition, government funding should accompany—and not replace—broader reforms in governance and regulation, as well as efforts to build human capital by strengthening education and training.
3.4.10 Gross official reserves and assets of the National Oil Fund
0
20
40
60
Assets Reserves
1312111009082007
$ billion
ForecastSources: National Bank of Kazahkstan. http://www.nationalbank.kz (accessed 23 March 2012). International Monetary Fund. 2011. Country Report No. 11/150. June.
3.4.11 External debt
50
60
70
80
90
100
2007 08 09 10 11 12 13
% of GDP
Forecast
Note: Data for 2011 are as of September only.
Sources: National Bank of Kazakhstan. http://www.nationalbank.kz (accessed 23 March 2012). ADB estimates.

Kyrgyz Republic
The economy is still recovering from the political crisis of April 2010. A new government has been set up, public confidence is slowly returning, and all sectors have seen growth. Improved tax administration and high gold prices increased government revenue, but higher civil service wages and social spending, alongside continuing reconstruction in the south, strained overall finances. Integration into the customs union with the Russian Federation, Belarus, and Kazakhstan may be a challenge, with risks of inflation pressures, unemployment, and trade disruptions.
Economic performanceFollowing a sluggish first quarter, real growth picked up as the year progressed, reaching 5.7% for 2011 (Figure 3.5.1). All sectors showed robust gains, reflecting improved security and sustained public confidence after the events of April 2010, which saw the ouster of the president and ethnic violence in the south.
Agriculture showed a modest bounceback to 2.3% growth, following its 2.6% contraction in 2010. Land under cultivation increased by 9%, because shortages of fuel and financing were less severe than in 2010, although a drought in the south kept grain production stagnant.
Industry expanded by 8.8%, with growth in nearly all major subsectors (Figure 3.5.2). Manufacturing grew by 9.8%, or 18.8% excluding gold production, which declined slightly year on year due to low gold concentration in ore extracted during the year. Textile and chemical industries grew especially fast, reflecting the resumption of trade with the Russian Federation and Kazakhstan (disrupted by the crisis). However, food processing declined, reflecting the previous year’s fall in agricultural production and the weak recovery in 2011. Also within industry, construction declined by 3.9%—adding to the 18.5% fall in 2010—reflecting a slow recovery of private sector confidence and the continuing postponement of several large projects that were put on hold in 2010.
The services sector, which fell sharply in 2010 following the political events, rebounded by 5.2%, reflecting improved consumer sentiment and the reopening of borders with Kazakhstan and Uzbekistan. (The borders were closed periodically after April 2010. By October that year the border with Kazakhstan was largely reopened, and in October 2011 Uzbekistan reopened an important border crossing.) Most of its subsectors saw growth, including trade, hotels and restaurants, and transport and communications, although real estate contracted by 1.7% on continuing fears of socioeconomic turbulence.
On the demand side, private consumption is estimated to have grown by 4.5%, reflecting a notable rise in retail sales, despite a small increase
3.5.1 Contributions to growth (supply)
8.5 8.4
2.9
-0.5
5.7
-5
0
5
10
2007 08 09 10 11
Percentage points Agriculture Industry ServicesGDP
Source: National Statistics Committee of the Kyrgyz Republic. http://www.stat.kg (accessed 15 March 2012).
This chapter was written by Gulkayr Tentieva of the Kyrgyz Resident Mission, ADB,
Bishkek.
3.5.2 Growth in industry subsectors
-20
0
20
40
ConstructionElectricity, gas, and water
ManufacturingMining
111009082007
%
Source: National Statistics Committee of the Kyrgyz Republic. http://www.stat.kg (accessed 15 March 2012).

Economic trends and prospects in developing Asia: Central Asia Kyrgyz Republic 117
in unemployment. The growth in consumption was driven largely by returning consumer confidence and an increase in remittances to $1.4 billion, equivalent to 25% of GDP, reflecting more Kyrgyz migrants working in the Russian Federation in 2011.
Private investment is estimated to have fallen by a further 16%, after a 23% decline in 2010. By contrast, the growth rate of government investment roughly doubled to an estimated 16%, reflecting continued spending to rehabilitate damaged infrastructure in the south.
Consumer prices rose by 16.6% on a year-average basis, mainly because of rapid price increases during the first half of the year. Inflation slowed during the second half, and the 12-month (December over December) rise in the consumer price index was only 5.6% (Figure 3.5.3).
Food prices, which rose by 25.9%, were the main driver of inflation; nonfood prices rose by 10.3%. The slowdown in inflation during the second half of the year largely reflected good harvests in the Russian Federation and Kazakhstan, which lowered the cost of imported food, along with the impact of tighter monetary policy.
The overall budget deficit rose slightly, to 7.6% of GDP, as increases in tax revenue offset higher social—but not capital—spending (Figure 3.5.4).
Government revenue rose by around 30%, reflecting strong economic growth, high gold prices, and reforms in tax policy and administration, including improved customs valuation, higher excise tax yields, a stronger large taxpayer unit, and more effective audit procedures. Total revenue and grants reached 32.2% of GDP.
Government spending rose by 34%, reflecting higher government grants, wages, and social outlays to raise pensions toward the national subsistence level. Total expenditure reached 39.7% of GDP, and total public and publicly guaranteed debt—external and domestic—declined to 52% of GDP at end-2011.
Extensive dollarization of the economy and a shallow financial sector limit the impact of monetary policy in the country. Still, in 2011 the National Bank of the Kyrgyz Republic raised its policy rate steadily over the year, from 5.5% to 13.5%. Credit growth in the broad financial system accelerated to 19.2% from 18.2% in 2010, reflecting in part the lagged impact of earlier expansionary policy and the low reserve requirement set by the central bank in 2010. Commercial banks were responsible for most of the increased lending. The ratio of nonperforming loans to total credit portfolio declined, from 13.8% to 9.8%. Higher nominal interest rates contributed to the local currency’s appreciation from March to August.
The current account deficit narrowed slightly to 6.8% of GDP from 8.0% in 2010, despite higher imports, reflecting a less negative income balance and stronger remittances, which reached 25% of GDP (Figure 3.5.5).
Trade rebounded strongly, after the fall in 2010 due to the border closures. Exports are estimated to have grown by 31.1%, with gold remaining the largest item. Imports grew by an estimated 34.4%, mainly reflecting higher imports of gasoline and diesel fuel. The Commonwealth of Independent States countries remained the largest trading partners, with 64% of trade volume.
Foreign direct investment fell by 14% reflecting continued weak investor confidence. Nevertheless, net international reserves rose by 7% to $1.8 billion.
3.5.3 Monthly inflation
-20
0
20
40
60
NonfoodFoodOverall
DecJulJan11
JulJan10
JulJan09
JulJan08
JulJan2007
%
Source: National Bank of the Kyrgyz Republic. http://www.nbkr.kg (accessed 15 March 2012).
3.5.4 Budget indicators
-15
0
15
30
45
Capital expenditure
Grants
Current expenditure
Domestic revenue
Budget deficit
ERERERERER
% of GDP
2007 11100908R = Revenue; E = Expenditure.
Note: Domestic revenue includes capital receipts.
Sources: International Monetary Fund. 2009. Country Report No. 09/209. July; 2010. Country Report No. 10/336. October; 2011. Country Report No. 11-354. December. http://www.imf.org; Ministry of Finance.
3.5.5 Remittances
0
10
20
30
111009082007
% of GDP
Source: ADB estimates based on data from National Bank of the Kyrgyz Republic. http://www.nbkr.kg (accessed 15 March 2012).

118 Asian Development Outlook 2012
Economic prospectsGDP growth is expected to slow to 5.0% in 2012 and then rise to 5.5% in 2013 (Figure 3.5.6). With the restoration of public confidence and political stability, higher domestic demand and stronger investor confidence are expected to spur private sector activity in the non-gold sectors. Against this, the adverse impact of the eurozone recession on Kazakhstan and the Russian Federation—key trading partners and sources of worker remittances—will inhibit growth. Private transfers are expected to stay around 20–25% of GDP, however.
Growth is expected to be driven by the industry and services sectors. Government plans to provide subsidized loans to farmers in 2012 are expected to promote growth in agriculture.
Large investment projects in infrastructure will drive construction, such as rehabilitating major road networks and building new power grids. Many other projects, including additional power grids and hydropower plants, remain under negotiation.
Private consumption growth is forecast at 5.9% and 5.1%, respectively, in 2012 and 2013, although continuing tensions in the south could jeopardize these increases. Net exports are likely to show little growth, as slower growth in the country’s main trading partners—the People’s Republic of China, Kazakhstan, the Russian Federation, and the eurozone, point to only modest prospects for exports.
Year-average inflation is expected to continue decelerating, to 5.0% in 2012, reflecting tighter fiscal and monetary policies and likely moderation in the prices for imported food (Figure 3.5.7). Inflation is forecast to rise to 5.5% in 2013, on expected price increases for imported food.
The government aims to reduce the fiscal deficit to 7.3% of GDP or less in the next 2 years, in order to improve debt sustainability and contain inflation pressures. These lower deficits would likely maintain the ratio of total public debt to GDP at 52–53% in the forecast period.
Recent government announcements signal plans to continue improving tax administration and customs collection. Revenue is targeted to reach 32–33% of GDP over the forecast period.
On the spending side, cuts for operations, along with a planned 20% reduction in the civil service headcount this year, are forecast to offset the impact of higher pensions and other socially oriented expenditures. Total expenditure is forecast at 39.6% of GDP in 2012 and 38.7% in 2013.
Monetary policy should remain conservative, reflecting central bank support of fiscal policy to mitigate inflation pressures. Nominal interest rates are likely to stay within the 13–15% band, contributing to further appreciation of the local currency this year.
The current account balance is projected to improve somewhat to a deficit of 6.6% of GDP in 2012 before returning to and 6.8% in 2013 (Figure 3.5.8). Following the sharp recovery in 2011, export growth is forecast to moderate to 11.8% and then to 7.7% in 2013, as predicted slower growth in Kazakhstan and the Russian Federation weaken demand for the country’s exports. Import growth is forecast to ease to 10.4% and 9.2%, respectively, reflecting increasing domestic production of foodstuffs, continuing but slower remittance growth, and moderating imported food prices in 2012.
3.5.6 GDP growth
-3
0
3
6
9
1312111009082007
%
ForecastSources: National Statistics Committee of the Kyrgyz Republic. http://www.stat.kg (accessed 1 March 2012); ADB estimates.
3.5.1 Selected economic indicators (%)
2012 2013
GDP growth 5.0 5.5
Inflation 5.0 5.5
Current account balance (share of GDP)
-6.6 -6.8
Source: ADB estimates.
3.5.7 Inflation
0
5
10
15
20
25
1312111009082007
%
ForecastSources: National Bank of the Kyrgyz Republic. http://www.nbkr.kg (accessed 15 March 2012); ADB estimates.
3.5.8 Current account balance
-15
-10
-5
0
1312111009082007
% of GDP
ForecastSources: National Bank of the Kyrgyz Republic. http://www.nbkr.kg (accessed 15 March 2012); ADB estimates.

Economic trends and prospects in developing Asia: Central Asia Kyrgyz Republic 119
Foreign direct investment inflows will largely depend on the government pushing through with its proposed structural reforms, which include a reduction in business licenses as part of a broader effort to reduce regulatory burdens on activity. The ratio of total external debt to GDP is expected to remain relatively stable at around 48–49% in the forecast period (Figure 3.5.9).
Policy challenge—joining the customs unionAlthough economic activity is recovering after the crisis of 2010, political stability and investor confidence still need strengthening. As investments have been falling, the government is considering providing new tax incentives to investors. Unless substantial new investment is generated, this move could raise the fiscal deficit and increase the debt-to-GDP ratio.
Over the longer term, the planned accession of the Kyrgyz Republic into the customs union that Belarus, Kazakhstan, and the Russian Federation inaugurated in January 2012 poses major challenges to the economy. Entry into the customs union would make the country subject to new common external tariffs, which are generally higher than those now in force in the Kyrgyz Republic. These new tariffs would raise the price, and reduce the volume, of “shuttle trade” products, which consist largely of textiles reexported from the People’s Republic of China to the Russian Federation and Kazakhstan. The shuttle trade was estimated to contribute 3–4% of GDP in 2005–2009.
The terms of accession, including the common external tariffs, are being discussed. The government is concerned that premature accession may entail job losses and is seeking measures to mitigate the possible negative economic effects. Conflicts between customs union arrangements and the country’s obligations as a World Trade Organization member also need to be resolved.
3.5.9 External debt
20
30
40
50
60
1312111009082007
% of GDP
ForecastSources: The Ministry of Finance; National Statistics Committee. http://www.stat.kg; National Bank of the Kyrgyz Republic. http://www.nbkr.kg (both accessed 15 March 2012); ADB estimates.

Tajikistan
Underpinned by record-high remittance inflows and supported by expansion in agriculture, services, and industry, growth accelerated in 2011, continuing the recovery to precrisis levels. Inflation remained high for most of 2011 but gradually eased toward year-end. In the short and medium term, continued moderate growth is forecast, but heavy reliance on remittances and public investment as drivers of demand-driven growth alongside extremely low private investment may not be sustainable.
Economic performanceGDP growth accelerated to 7.4% (from 6.5% in 2010), reflecting strong domestic demand and expanding agriculture, services, and industry, despite limited electricity supply and disruptions to rail transit through neighboring countries that held back output in the first half (Figure 3.6.1).
Driven by record remittances, services were the main driver of growth, expanding by 13.5%. Agriculture grew by 7.9%, despite difficult climatic conditions. Cotton production shot up by 34%, reflecting a 30% rise in the area devoted to cotton, as high international prices encouraged additional planting. Other crops, particularly fruits and vegetables, also showed double-digit growth.
Industry grew by 5.9%, encompassing a wide variation between a more than 38% increase in mining and extraction industries and a 16% contraction in aluminum output caused by disruptions to alumina imports and reduced electricity generation in the early part of the year.
Consumption, reflecting higher imports, was the main source of growth on the demand side. Private investment showed little expansion, and its share in GDP remained extremely low at about 3%. Domestic investment was dominated by the government through state-owned enterprises.
Rising global food and fuel prices and higher remittances (which boosted domestic demand for imports) nearly doubled year-average inflation to 12.5% from 6.5% in 2010, although core inflation (excluding food and fuel) remained moderate at 5.7%.
Increases in export duties for oil products imposed by Tajikistan’s main supplier, the Russian Federation, in the first half of 2011 raised fuel prices by 59%. Food price inflation peaked in that half in response to rising world prices (Figure 3.6.2), with staple foods rising by an average of 32%, before slowing in the second. Massive public expenditure on infrastructure and special projects to commemorate the 20th anniversary of Tajikistan’s independence added to inflationary pressures.
The overall budget deficit widened to 3.1% of GDP, although the more narrowly defined fiscal deficit (excluding foreign-financed public investment projects) was less than 1% of GDP (Figure 3.6.3).
3.6.1 GDP growth by sector
-10
0
10
20
GDP ServicesIndustryAgriculture
111009082007
%
7.87.4
6.53.97.9
Sources: International Monetary Fund; Tajikistan State Statistics Agency. http://www.stat.tj (accessed 15 March 2012).
This chapter was written by Kakhorjon Aminov of the Tajikistan Resident Mission, ADB,
Dushanbe.
3.6.2 Monthly Inflation
0
10
20
30
40
Jan12
Jan11
Jan10
Jan09
Jan08
Jan2007
%
Food
Overall
Source: Tajikistan State Statistics Agency. http://www.stat.tj (accessed 15 March 2012).

Economic trends and prospects in developing Asia: Central Asia Tajikistan 121
Revenue receipts exceeded the budget target, with tax collection surging by 30% from 2010, reflecting high prices for key exports and increased imports. Nevertheless, a narrow tax base and heavy dependence on import-based taxes contributed to a fragile fiscal position. Total revenue equaled 24.4% of GDP.
Government expenditure, in particular capital spending on infrastructure, rose by close to 30%, reflecting strong revenue and heavy foreign financing. Government investment surged by 41%, with increased spending focused on energy and transport infrastructure projects, including rehabilitation of the massive Roghun hydropower plant. Spending for social insurance and social protection grew by about 7%, as the state budget focused on capital outlays. Total expenditure amounted to 27.6% of GDP.
Although the stock of public and publicly-guaranteed debt climbed, rapid GDP growth reduced the ratio of public and publicly-guaranteed debt to GDP to 33.3% from 36.5% in 2010 (Figure 3.6.4). Potential contingent liabilities for state enterprises and the financial sector continued to raise questions about fiscal sustainability over the medium term.
Although high dollarization and an underdeveloped financial market undermined such moves’ effectiveness, the National Bank of Tajikistan (NBT) pursued contractionary monetary policy during much of the year to curb inflation, raising its refinancing rate from 8.25% to 9.0% in February and again to 10.0% in October 2011. Yet reserve money still grew by more than 27% during the year, reflecting the recovery of private sector credit and considerable liquidity support from the central bank to commercial banks.
Since late December, with inflation slowing, the NBT has relaxed policy somewhat, lowering the refinancing rate in two steps to 9.0% by February 2012, to stimulate the economy.
Although financial sector indicators improved somewhat, more than 15% of loans remained nonperforming. The sector is constrained by limited private investment, few deposits, and exposure to risky agricultural loans. The exchange rate of the somoni, the local currency, depreciated by more than 8% against the US dollar and Russian ruble and 10% against the euro in 2011 (Figure 3.6.5).
The current account switched to a 4.1% of GDP deficit, after a 2.1% surplus in 2010. High remittances helped boost imports by about 20%, but exports picked up by only 5.2%, widening the trade deficit to over
a focus on a few export commodities—mainly aluminum and cotton—limited export growth. Import growth largely reflected surges in food products (38%) and textiles (27%), as well as industrial products (13%).
this was very low. The government continued borrowing for energy and
end-2010. Public and publicly guaranteed external debt declined to 31.3% of GDP at end-2011, compared with 34.4% of GDP a year earlier.
3.6.3 Fiscal balance
-8
-4
0
4
Excluding PIPIncluding PIP
111009082007
% of GDP
PIP = public investment program.
Sources: International Monetary Fund. 2010. Country Report No. 10/374. December; 2011. Country Report No. 11/130. June; 2012. Country Report No. 12/32. February. http://www.imf.org
3.6.4 Public and publicly guaranteed debt
20
25
30
35
40
111009082007
% of GDP
Sources: International Monetary Fund. 2010. Country Report No. 10/374. December; 2011. Country Report No. 11/130. June; 2012. Country Report No. 12/32. February. http://www.imf.org
3.6.5 Nominal exchange rate, 2011
4.3
4.4
4.5
4.6
4.7
4.8
DecOctJul AprJan
TJS/$
Source: National Bank of Tajikistan.
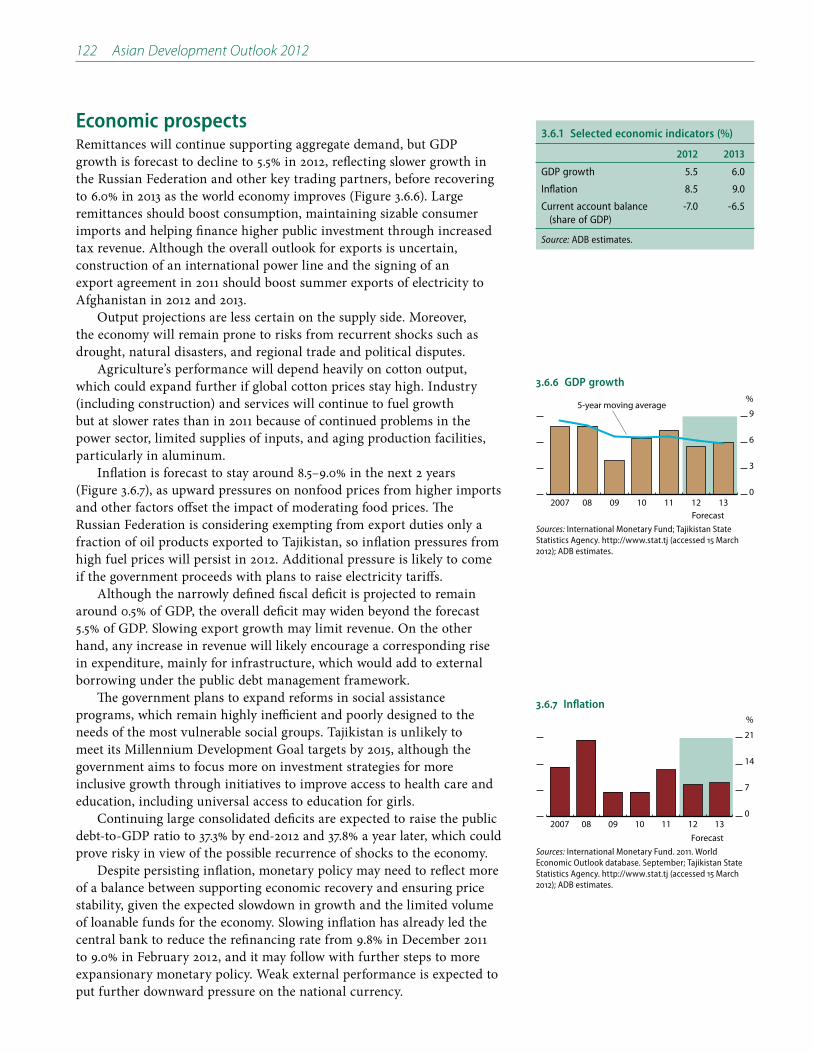
122 Asian Development Outlook 2012
Economic prospectsRemittances will continue supporting aggregate demand, but GDP growth is forecast to decline to 5.5% in 2012, reflecting slower growth in the Russian Federation and other key trading partners, before recovering to 6.0% in 2013 as the world economy improves (Figure 3.6.6). Large remittances should boost consumption, maintaining sizable consumer imports and helping finance higher public investment through increased tax revenue. Although the overall outlook for exports is uncertain, construction of an international power line and the signing of an export agreement in 2011 should boost summer exports of electricity to Afghanistan in 2012 and 2013.
Output projections are less certain on the supply side. Moreover, the economy will remain prone to risks from recurrent shocks such as drought, natural disasters, and regional trade and political disputes.
Agriculture’s performance will depend heavily on cotton output, which could expand further if global cotton prices stay high. Industry (including construction) and services will continue to fuel growth but at slower rates than in 2011 because of continued problems in the power sector, limited supplies of inputs, and aging production facilities, particularly in aluminum.
Inflation is forecast to stay around 8.5–9.0% in the next 2 years (Figure 3.6.7), as upward pressures on nonfood prices from higher imports and other factors offset the impact of moderating food prices. The Russian Federation is considering exempting from export duties only a fraction of oil products exported to Tajikistan, so inflation pressures from high fuel prices will persist in 2012. Additional pressure is likely to come if the government proceeds with plans to raise electricity tariffs.
Although the narrowly defined fiscal deficit is projected to remain around 0.5% of GDP, the overall deficit may widen beyond the forecast 5.5% of GDP. Slowing export growth may limit revenue. On the other hand, any increase in revenue will likely encourage a corresponding rise in expenditure, mainly for infrastructure, which would add to external borrowing under the public debt management framework.
The government plans to expand reforms in social assistance programs, which remain highly inefficient and poorly designed to the needs of the most vulnerable social groups. Tajikistan is unlikely to meet its Millennium Development Goal targets by 2015, although the government aims to focus more on investment strategies for more inclusive growth through initiatives to improve access to health care and education, including universal access to education for girls.
Continuing large consolidated deficits are expected to raise the public debt-to-GDP ratio to 37.3% by end-2012 and 37.8% a year later, which could prove risky in view of the possible recurrence of shocks to the economy.
Despite persisting inflation, monetary policy may need to reflect more of a balance between supporting economic recovery and ensuring price stability, given the expected slowdown in growth and the limited volume of loanable funds for the economy. Slowing inflation has already led the central bank to reduce the refinancing rate from 9.8% in December 2011 to 9.0% in February 2012, and it may follow with further steps to more expansionary monetary policy. Weak external performance is expected to put further downward pressure on the national currency.
3.6.1 Selected economic indicators (%)
2012 2013
GDP growth 5.5 6.0
Inflation 8.5 9.0
Current account balance (share of GDP)
-7.0 -6.5
Source: ADB estimates.
3.6.6 GDP growth
0
3
6
9
1312111009082007
%
Forecast
5-year moving average
Sources: International Monetary Fund; Tajikistan State Statistics Agency. http://www.stat.tj (accessed 15 March 2012); ADB estimates.
3.6.7 Inflation
0
7
14
21
1312111009082007
%
ForecastSources: International Monetary Fund. 2011. World Economic Outlook database. September; Tajikistan State Statistics Agency. http://www.stat.tj (accessed 15 March 2012); ADB estimates.

Economic trends and prospects in developing Asia: Central Asia Tajikistan 123
The current account deficit is expected to widen from 4.1% in 2011 to 7.0% in 2012 before narrowing to 6.5% in 2013 (Figure 3.6.8). Export receipts are projected to fall as a result of declining international prices for cotton and other exports. Imports, though, should remain at least at the current level because of higher remittances (Figure 3.6.9).
The government is likely to continue external borrowing to finance infrastructure projects, mainly in energy and transport. However, the above-mentioned debt management framework requires all new government borrowings to have at least a 35% grant element and to limit borrowings to priority projects. Total public debt is projected to stay below 40% of GDP over the foreseeable future.
Foreign direct investment inflows are projected to continue rising gradually over the medium term, in line with current reform initiatives in tax administration and regulatory simplification. The bulk of investments will likely go to several large infrastructure projects, such as hydropower stations, toll roads, and supporting facilities for mining. Public and publicly guaranteed external debt is forecast to reach 37.2% of GDP at end-2012 and 37.5% of GDP 12 months later.
Policy challenge—boosting investmentA big concern remains the very limited share of private investment and foreign direct investment inflows, and more generally, a weak business environment and problems in the financial sector. The government relies extensively on public investment, an approach that may be unsustainable given the limited room for additional budget outlays. The private sector still represents less than half of GDP—and private investment less than 5%—reflecting an unfavorable business environment and lack of investor confidence. Most private enterprises are still small or of medium size and require little capital, operating in areas such as trade and services.
Serious efforts are necessary to reverse the lack of investor confidence and declining levels of private investment. Reducing risks to private investors—by providing and then enforcing property rights, for example, by reducing corruption, and by enhancing supportive infrastructure—is critical. Improving the security situation at the border with Uzbekistan, where clashes between border guards have closed an important rail line, and maintaining macroeconomic stability would also encourage private investment inflows.
Difficult business regulations also discourage private investment. Despite being among the top 10 reformers in the World Bank’s 2010 and 2011 Doing Business reports, in the 2012 report Tajikistan still ranks 147 among 183 economies in the ease of doing business. Tax administration is complicated and time consuming, while the tax burden is high and encourages tax evasion. Limited financial intermediation and costly business financing are also major barriers. Addressing inefficiency, eliminating directed lending, and promoting competition by allowing international banks to enter the market could facilitate more lending and help cut financing costs.
Overall, understanding and eliminating key constraints to private investment, including deterrents to foreign investment, is critical to achieve sustainable economic growth in the medium term.
3.6.8 Current account balance
-600
-300
0
300
-10
-5
0
5
Amount, $ million % of GDP
1312111009082007
ForecastSources: International Monetary Fund. 2010. Country Report No. 10/374. December; 2011. Country Report No. 11/130. June; 2012. Country Report No. 12/32. February. http://www.imf.org
3.6.9 Net remittances
0
1
2
3
4
1312111009082007
$ billion
ForecastSources: International Monetary Fund. 2010. Country Report No. 10/374. December; 2011. Country Report No. 11/130. June; 2012. Country Report No. 12/32. February. http://www.imf.org
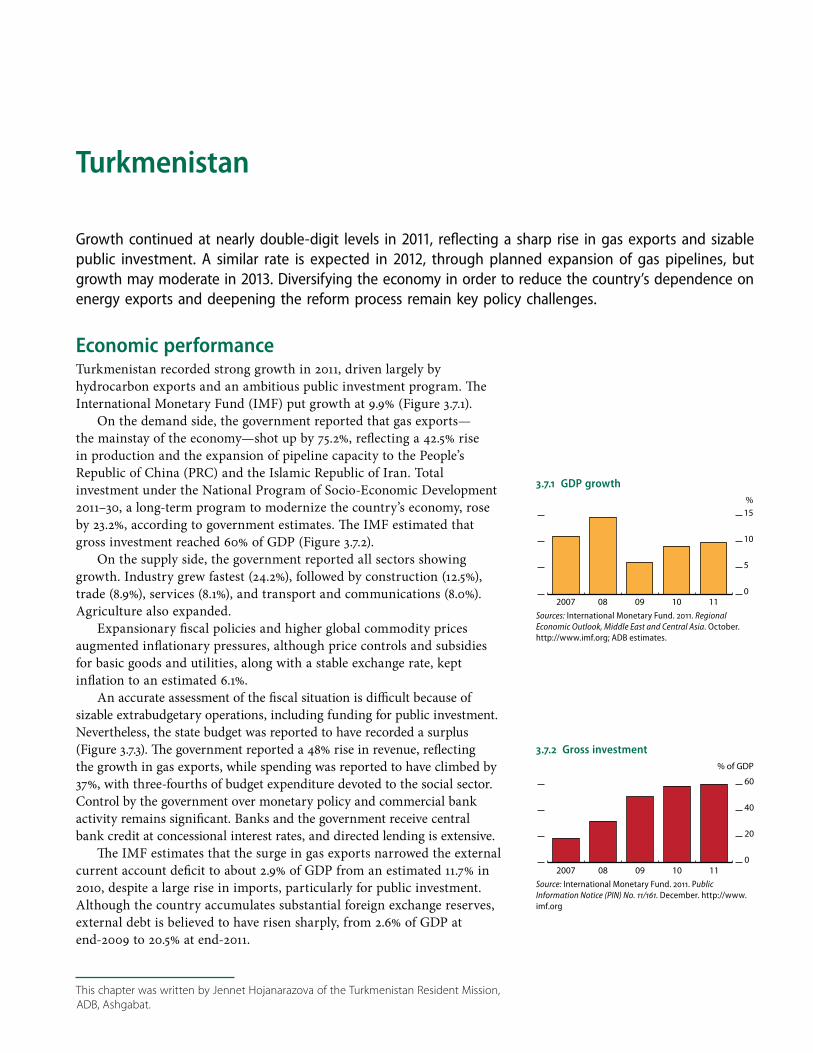
Turkmenistan
Growth continued at nearly double-digit levels in 2011, reflecting a sharp rise in gas exports and sizable public investment. A similar rate is expected in 2012, through planned expansion of gas pipelines, but growth may moderate in 2013. Diversifying the economy in order to reduce the country’s dependence on energy exports and deepening the reform process remain key policy challenges.
Economic performanceTurkmenistan recorded strong growth in 2011, driven largely by hydrocarbon exports and an ambitious public investment program. The International Monetary Fund (IMF) put growth at 9.9% (Figure 3.7.1).
On the demand side, the government reported that gas exports—the mainstay of the economy—shot up by 75.2%, reflecting a 42.5% rise in production and the expansion of pipeline capacity to the People’s Republic of China (PRC) and the Islamic Republic of Iran. Total investment under the National Program of Socio-Economic Development 2011–30, a long-term program to modernize the country’s economy, rose by 23.2%, according to government estimates. The IMF estimated that gross investment reached 60% of GDP (Figure 3.7.2).
On the supply side, the government reported all sectors showing growth. Industry grew fastest (24.2%), followed by construction (12.5%), trade (8.9%), services (8.1%), and transport and communications (8.0%). Agriculture also expanded.
Expansionary fiscal policies and higher global commodity prices augmented inflationary pressures, although price controls and subsidies for basic goods and utilities, along with a stable exchange rate, kept inflation to an estimated 6.1%.
An accurate assessment of the fiscal situation is difficult because of sizable extrabudgetary operations, including funding for public investment. Nevertheless, the state budget was reported to have recorded a surplus (Figure 3.7.3). The government reported a 48% rise in revenue, reflecting the growth in gas exports, while spending was reported to have climbed by 37%, with three-fourths of budget expenditure devoted to the social sector. Control by the government over monetary policy and commercial bank activity remains significant. Banks and the government receive central bank credit at concessional interest rates, and directed lending is extensive.
The IMF estimates that the surge in gas exports narrowed the external current account deficit to about 2.9% of GDP from an estimated 11.7% in 2010, despite a large rise in imports, particularly for public investment. Although the country accumulates substantial foreign exchange reserves, external debt is believed to have risen sharply, from 2.6% of GDP at end-2009 to 20.5% at end-2011.
3.7.1 GDP growth
0
5
10
15
111009082007
%
Sources: International Monetary Fund. 2011. Regional Economic Outlook, Middle East and Central Asia. October. http://www.imf.org; ADB estimates.
This chapter was written by Jennet Hojanarazova of the Turkmenistan Resident Mission,
ADB, Ashgabat.
3.7.2 Gross investment
0
20
40
60
111009082007
% of GDP
Source: International Monetary Fund. 2011. Public Information Notice (PIN) No. 11/161. December. http://www.imf.org

Economic trends and prospects in developing Asia: Central Asia Turkmenistan 125
Economic prospectsHydrocarbon exports will remain the chief source of growth and development project financing. GDP growth of 10.0% is forecast in 2012, reflecting further expansion of pipeline capacity to the PRC and large public investment. Somewhat slower growth (about 9%) is anticipated in 2013.
The government intends to widen its export destinations, and a private firm’s audit of gas deposits, released in October 2011, confirmed reserves of up to 26.2 trillion cubic meters, among the world’s largest. Besides existing pipelines to the PRC, the Islamic Republic of Iran, and the Russian Federation, a new pipeline under construction since 2010 is intended to connect the country’s eastern fields with the Caspian Sea and facilitate exports to Europe. Plans are also under way for a pipeline project from Turkmenistan to Afghanistan, Pakistan, and India agreed in December 2010, although security remains an issue.
Over time Turkmenistan will benefit from enhanced cooperation and trade with neighboring countries. The North–South railway line, scheduled for completion by 2014, will improve its access to Kazakhstan, the Gulf, the Russian Federation, and South Asia. This line could become the region’s main route for transporting goods such as petroleum, minerals, agricultural products, and textiles.
The state budget for 2012 projects a small deficit—financed by transferring the 2011 surplus—caused by increased spending. Expansionary fiscal policies will likely add to inflation, which is forecast to reach 7.0% by 2013 (Figure 3.7.4). Continued growth in gas exports is expected to move the current account to a surplus of 3.4% of GDP in 2012 and 2013 (Figure 3.7.5).
Policy challenge highlightsHydrocarbon products account for over 90% of exports, and high specialization in energy exports entails risks for sustainable economic development. The government has already taken some steps through the National Program of Socio-Economic Development to diversify the economy, aiming to develop agriculture, food processing and other agro-industry, textiles, chemicals and petrochemicals, electricity generation, tourism, and construction materials.
Substantial diversification will require extensive supply-side reforms. Numerous structural measures will be needed to free private firms from the state planning system’s disincentives. An adequate legal and regulatory framework for private businesses must be in place, along with an expanded and restructured banking sector that can provide financial capital and channel profits and savings from hydrocarbons to investment in other sectors.
Efficient resource allocation is also crucial. A long-term investment plan, with careful prioritization and sequencing of investments and cost-benefit analysis, must ensure that resource wealth is allocated to viable projects.
3.7.3 General government fiscal balance
0
2
4
6
8
10
111009082007
% of GDP
Source: International Monetary Fund. 2011. Regional Economic Outlook, Middle East and Central Asia. October. http://www.imf.org.
3.7.4 Inflation
-4
0
4
8
12
16
1312111009082007
%
ForecastSources: International Monetary Fund. 2011. Regional Economic Outlook, Middle East and Central Asia. October. http://www.imf.org; ADB estimates.
3.7.5 Current account
-20
-10
0
10
20
1312111009082007
% of GDP
ForecastSources: International Monetary Fund. 2011. Regional Economic Outlook, Middle East and Central Asia. October. http://www.imf.org; ADB estimates.
3.7.1 Selected economic indicators (%)
2012 2013
GDP growth 10.0 9.0
Inflation 6.5 7.0
Current account balance (share of GDP)
3.4 3.4
Source: ADB estimates.

Uzbekistan
Growth accelerated in 2011, driven by net exports, state-led investments, and remittances. With lower non-oil commodity prices in 2012, economic growth will be sustained by public investment and increasing foreign investment. The key downside risk is a deteriorating economic environment in the euro 20 and the Russian Federation. To reduce risks from reliance on commodity exports, the economy needs to diversify beyond the natural resources sectors and expand the private sector.
Economic performanceReflecting the favorable external environment, sustained public investment, and rising private consumption bolstered by remittances, Uzbekistan’s strong economic performance continued in 2011 with GDP growth of 8.3% (Figure 3.8.1). As in previous years, industry (including construction) and services were the main contributors to GDP growth, with estimated growth rates of 6.7% and 12.7%, respectively.
Industrial growth declined to 6.7% from 8.3% in 2010, mainly due to a slowdown in the fuel subsector, where a decline in natural gas output kept growth to 0.3%. Nevertheless, all subsectors grew collectively by 11.9%, in particular machinery and equipment, chemicals and petrochemicals, construction materials, and the food industry, reflecting strong external demand for metals and petrochemicals and continued industrial development. Construction grew by 8.5%, reflecting higher public construction, which offset a slowdown in foreign investment-related construction activities.
As in 2010, services were again a main source of growth, with retail trade, communications, and financial services recording a combined growth rate of 22.3%, supported by strong domestic demand, in particular, rising private consumption. The agricultural sector grew by 6.6%, supported by fruit and vegetable production and livestock breeding.
On the demand side, rising remittances, increased domestic lending, and wage and pension hikes boosted private consumption. Gross fixed capital formation increased by 11% in nominal terms, to 26% of GDP, as bank lending for investment rose by one-third (Figure 3.8.2). Most investment went to industry, for purchases of capital goods.
Estimates of inflation range from the government’s 7–9% to 13.1% from the International Monetary Fund, with the latter above 2010’s outturn of 9.4%. Inflation in 2011 reflected public sector and pension increases in August and December, totaling 26.5% since December 2010, with high foreign exchange inflows, rapid credit growth, local currency depreciation, and increased private and public spending.
3.8.1 GDP growth by sector
0
6
12
18
ServicesIndustryAgricultureGDP
111009082007
%
9.5 8.38.58.19.0
Sources: State Statistics Committee of Uzbekistan; ADB estimates.
This chapter was written by Iskandar Gulamov of the Uzbekistan Resident Mission, ADB,
Tashkent.
3.8.2 Structure of nominal GDP (expenditure)
-20020406080100
2007 08 09 10 11
%OthersNet exportsFixed capital investmentFinal consumption
Note: Others refer to statistical discrepancy and changes in stocks.
Sources: Center for Economic Research. Uzbekistan Almanac 2010; ADB estimates.

Economic trends and prospects in developing Asia: Central Asia Uzbekistan 127
It is believed that 0.3% output growth of the fuel sector in 2011 and subsequent substantial increases in fuel costs have provided additional inflationary pressures.
The central bank attempted to curb inflation by issuing certificates of deposit (equivalent to 40% of the existing stock) in order to
export revenues into the Fund for Reconstruction and Development, Uzbekistan’s sovereign wealth fund.
The augmented budget, which comprises the official budget plus the surplus from this fund, is estimated to have recorded a surplus of 3.2% of GDP. Revenue gains from higher commodity prices and improved tax administration (taking revenue to an estimated 38.5% of GDP, from 37.1% in 2010) offset the impact on spending of wage and pension increases, higher social outlays, and the rural development program (overall expenditure climbed to 35.3% of GDP, from 34.4% in 2010).
The central bank’s issuance of certificates of deposit helped reduce broad money growth from 52.4% in 2010 to a still high 27.7%. Banks benefited from heavy government injections aimed at strengthening their capital and increasing lending. Bank lending to small and medium-
increase from 2010. In August 2011, Moody’s reconfirmed its rating for the banking system as stable, following an upgrade a year earlier.
The central bank continued to intervene in the foreign exchange market, with the aim of depreciating the local currency—the sum—to promote competitiveness. Depreciation of the Russian ruble and Kazakh tenge against the US dollar added downward pressure on the rate. By year-end the sum depreciated by 8.6% against the dollar, more than in 2009 and 2010 (Figure 3.8.3).
An improved trade balance and higher remittances helped raise the current account surplus to 8.1% of GDP from 6.6% in 2010 (Figure 3.8.4).
international prices for gold, cotton, copper, and natural gas reached record levels, and strong consumer demand in the Russian Federation contributed to a 25% rise in automobile exports by GM Uzbekistan.
continued state-led public infrastructure development and industrial modernization required more imported capital goods. Remittances grew sharply, particularly from the Russian Federation, as the Russian economy improved.
of which 79% was for foreign direct investment (FDI), mainly in the fuel, energy, petrochemical, and automobile manufacturing sectors. External debt is estimated to have risen to 17.5% of GDP from 14.7% of GDP at end-2010, as the public investment program is increasingly being financed with foreign loans (Figure 3.8.5).
Economic prospectsGDP is forecast to grow by 8.0% in 2012 and 7.9% in 2013, as rising state-led investments are expected to offset a decline in exports. Industry and services are expected to be the major contributors to economic
3.8.3 Exchange rate
1,400
1,550
1,700
1,850
Mar12
JulJan11
JulJan10
JulJan2009
SUM/$
Source: Central Bank of Uzbekistan. http://www.cbu.uz/ (accessed 28 March 2012).
3.8.4 Current account indicators
0
4
8
12
16
0
3
6
9
12
Current accountbalanceMerchandise imports
Merchandise exports
111009082007
$ billion % of GDP
Sources: International Monetary Fund. 2011. Regional Economic Outlook: Middle East and Central Asia. October. http://www.imf.org; ADB estimates.
3.8.5 External debt indicators
0
5
10
15
20
0
5
10
15
20
External debt service Total external debt
111009082007
% of total exports % of GDP
Sources: International Monetary Fund. 2011. Regional Economic Outlook: Middle East and Central Asia. October. http://www.imf.org; ADB estimates.

128 Asian Development Outlook 2012
growth. Industrial output will be supported by higher domestic lending and foreign investment, while services will be driven by higher domestic demand, especially from the public sector. Higher vegetable and fruit output should boost agriculture relative to 2011.
On the demand side, continued public investment should be a key driver. Gross fixed capital formation is forecast to rise by 9.3% in 2012 in nominal terms, with investment exceeding 30% of GDP. The
and Infrastructure Development Program in 2011–2015, with significant investment planned in oil and gas, electricity generation, chemicals, metallurgy, and other strategic sectors.
Domestic consumption will be supported by expected increases in public sector wages and pensions, and additional measures—probably further wage increases and welfare payments—are likely to be taken if the slowdown in the eurozone and the Russian Federation appears to be hampering growth. Nevertheless, lower remittances are expected to moderate growth in private consumption, which is forecast to rise, in nominal terms, by 8.0% in 2012 and 9.0% in 2013.
Inflation is expected to come in at about 9.5% in 2012 and 9.0% in 2013, as global commodity prices decline, although continuing currency depreciation will keep import prices high (Figure 3.8.6). The authorities are also expected to limit measured inflation through sterilization operations and domestic price controls.
The official government budget, adopted in November 2011, projects a deficit of around 1% of GDP in 2012; the augmented budget is forecast to show surpluses of 4.0% in 2012 and 3.2% in 2013 (Figure 3.8.7). The official budget envisages substantial tax reductions, with the goal of reducing the ratio of tax revenue to GDP by 0.7 percentage points in 2012, although commodity-based revenue is expected to grow strongly, and additional revenue will come from new excise taxes on imported vegetable oil and domestically produced jewelry. Augmented budget revenue is forecast at 39.0% of GDP in 2012 and 38.3% in 2013. Almost 60% of expenditures will go to social security, welfare, health care, education, and culture. Augmented budget expenditures are projected at 35.0% of GDP in 2012 and 35.1% in 2013.
Money growth is expected to accelerate to 30% in 2012 and 33.6% in 2013, as public wages and pensions rise and banks increase their lending. Further increases in official reserves (at least in 2012) and continued foreign exchange intervention to depreciate the currency will increase reserve money, offset partly by further central bank sterilization operations.
The current account surplus is forecast to decrease to 7.5% of GDP in 2012 and 6.0% of GDP in 2013, as the trade balance weakens (Figure 3.8.8). Declining international prices for the country’s main exports, excluding natural gas, coupled with weaker external demand, will hamper export performance, with exports forecast to rise moderately in 2012 and decline in 2013. Recession in the European Union will likely lower growth in the Russian Federation, Uzbekistan’s main trading partner, reducing exports, especially for automobiles and food, and remittances. Moreover, an expected growth slowdown in the People’s Republic of China is expected to reduce key metal and cotton exports.
3.8.1 Selected economic indicators (%)
2012 2013
GDP growth 8.0 7.9
Inflation 9.5 9.0
Current account balance (share of GDP)
7.5 6.0
Source: ADB estimates.
3.8.6 Inflation and money supply
0
7
14
21
28
0
15
30
45
60
Broad money growth
Inflation, period average
1312111009082007
% %
ForecastSources: International Monetary Fund. 2011. Regional Economic Outlook: Middle East and Central Asia. October. http://www.imf.org; ADB estimates.
3.8.7 Fiscal indicators: Augmented budget
0
12
24
36
48
Fiscal balance Expenditure Revenue
1312111009082007
% of GDP
ForecastSources: International Monetary Fund. 2011. Regional Economic Outlook: Middle East and Central Asia. October. http://www.imf.org; ADB estimates.
3.8.8 Current account and reserves
0
6
12
18
24
30
0
2
4
6
8
10
Current account balanceReserves
1312111009082007
$ billion % of GDP
ForecastSources: International Monetary Fund. 2011. Regional Economic Outlook: Middle East and Central Asia. October. http://www.imf.org; ADB estimates.

Economic trends and prospects in developing Asia: Central Asia Uzbekistan 129
Import growth is forecast to slow to 8.3% in 2012 and 2.8% in 2013, despite infrastructure spending and the industrial modernization program, because of the projected moderation in imported food prices and tighter import controls, particularly on imported consumer goods. Gross international reserves are forecast to increase further in 2012 and
estimates, reflecting continuing current account surpluses and net capital inflows.
Reflecting increasing foreign borrowing for industrial modernization and infrastructure development, external debt is forecast to reach 20.2% of GDP and end-2012 and 22.8% a year later.
Policy challenge—developing the private sectorUzbekistan’s private sector will play a greater role in economic development as the economy moves toward middle-income status. The government has reported that small businesses accounted for 54% of GDP in 2011, which is at par with international averages, but the role of entrepreneurs in key areas of economic activity has yet to develop (Figure 3.8.9).
Policies and investment to improve the business climate, promote the private sector, and strengthen infrastructure and trade need to be reinforced for a more diversified and sophisticated export sector and to accelerate the economy’s transformation.
Improving the business climate is urgently required to develop the private sector, especially for the many small businesses that represent the overwhelming share of legal entities and provide most national employment. A more favorable business climate would promote diversification and the growth of new firms. It would also facilitate private sector participation in the infrastructure and other strategic sectors, as these are gradually opened to private firms. (The private sector is already involved in repairing and maintaining public roads, and its share in road freight transport reached 72.2% in 2010 from 58.7% in 2005.)
Uzbekistan is ranked overall 166 out of 183 economies in the World Bank’s 2012 Doing Business report (and lowest in the trading across borders category). Accelerating regulatory reforms to attract investors, ensuring access to finance and foreign exchange, simplifying customs procedures, and continuing the efforts to offer competitive factor prices would help transform the national economic landscape and sustain economic growth.
Other key measures include further steps to reform the tax regime, liberalize regulations for small firms, increase access to external financing in the banking and nonbank sectors, and develop the securities market. Finally, although the country has taken steps toward decentralizing some activities in public administration, further reforms in this area will multiply the benefits of economic growth.
3.8.9 Economic participation of small businesses and entrepreneurs, 2011
0
20
40
60
80
100
OthersPrivate enterpreneursSmall businesses
ImportsExports
ServicesTrade
ConstructionAgriculture
Industry
%
Sources: State Statistics Committee; ADB estimates.

East Asia
People’s Republic of China
Hong Kong, China
Republic of Korea
Mongolia
Taipei,China

People’s Republic of China
Domestic demand rather than exports was the driving force behind 2011’s strong performance, with high investment and consumption. The outlook for 2012 and 2013, despite uncertain global prospects, is for only moderately slower growth. The economy is gradually diversifying, with imports rising rapidly and the trade surplus now much less as a percentage of economic output. Currency appreciation, rising wage rates, increasing income disparities, and environmental concerns underscore the need for modifying the country’s growth model. With a strong fiscal position and declining inflation, the government is well positioned to implement the 12th Five-Year Plan, designed to further transform the economy.
Economic performanceGDP of the People’s Republic of China (PRC) grew at 9.2% in 2011, despite subdued external demand for exports and the effects of domestic policy tightening. Although growth came in a full percentage point less than in 2010, it far exceeded that in most other countries, further consolidating the country’s status as the world’s second-largest economy. The main factors continuing to drive the economy were high domestic and foreign investment, brisk government expenditure, and increased domestic consumption.
Investment and consumption accounted for all the growth in 2011 (Figure 3.9.1). Net exports were a marginally negative contributor, as real imports grew faster than real exports.
Fixed asset investment increased by almost 24%, slightly slower than in 2010 on the policy-induced slowdown in real estate investment to curb speculation (Figure 3.9.2). Local government expenditure on infrastructure also stayed strong, although again at a slower rate than in 2010.
Rising urban and rural per capita incomes (up 8.4% and 11.4% in real terms) bolstered consumption, reflecting wage and pension increases. Retail sales (a proxy for consumption) increased by 17% in nominal terms, somewhat slower than in 2010. Sales of furniture, household appliances, and audiovisual equipment registered the highest growth, while car sales grew much more slowly, showing the impacts of restricted licensing to control traffic congestion and of the end of subsidies and rebates.
By sector, agricultural output benefited from an abundant grain harvest in the second half of the year and increased overall by 4.5%, slightly above the pace set in 2010. Slowing investment and exports caused growth of industrial output to slow to 10.6% from 12.3% the previous year; the sector was still the main contributor to growth (Figure 3.9.3). Services increased by 8.9%, slower than the 9.8% growth in 2010, driven by retail sales and financial services.
3.9.1 Contributions to growth (demand)
14.2 9.6
9.2 10.4 9.2
-505101520
2007 08 09 10 11
Percentage points
Government consumptionPrivate consumptionGDP
Net exportsInvestments
Sources: National Bureau of Statistics of China. http://www.stats.gov.cn/english/ (accessed 1 March 2012); ADB estimates.
This chapter was written by Yolanda Fernandez Lommen, Niny Khor, and Jian Zhuang
of the People’s Republic of China Resident Mission, ADB, Beijing.
3.9.2 Growth in fixed asset investment
10
20
30
40
50
Q3Q111
Q3Q110
Q3Q12009
%
Real
Nominal
Source: ADB estimates based on data from CEIC Data Company (accessed 1 March 2012).
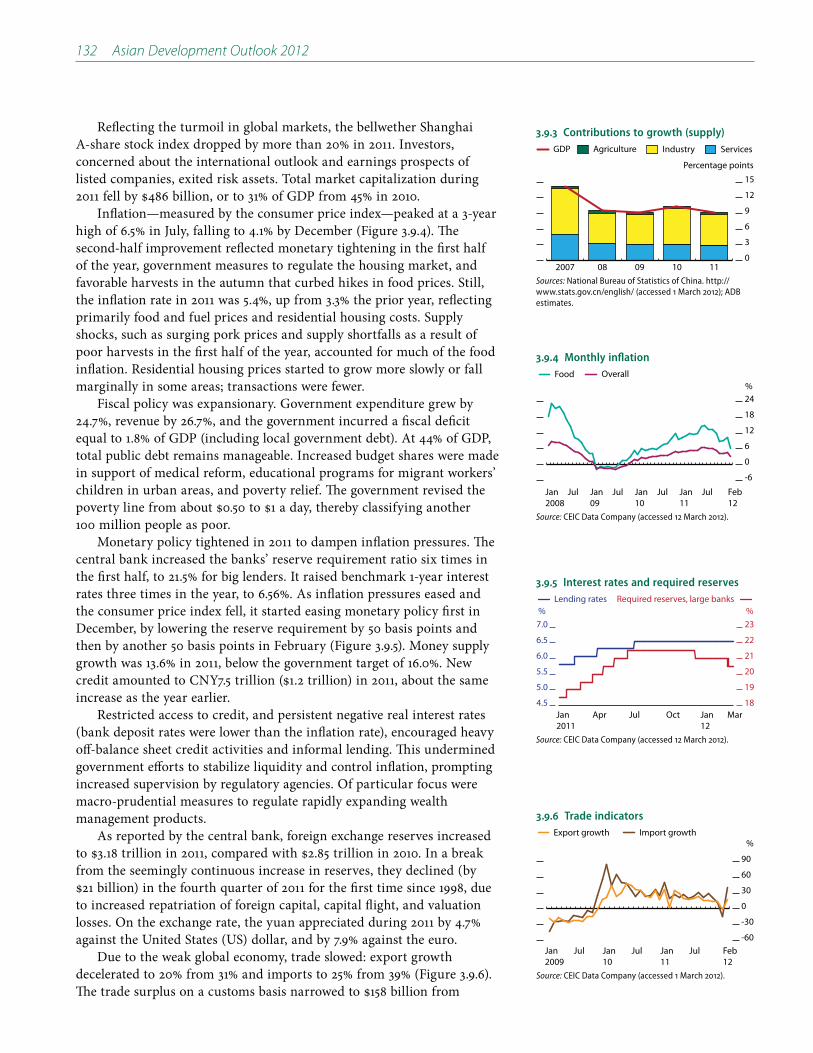
132 Asian Development Outlook 2012
Reflecting the turmoil in global markets, the bellwether Shanghai A-share stock index dropped by more than 20% in 2011. Investors, concerned about the international outlook and earnings prospects of listed companies, exited risk assets. Total market capitalization during
Inflation—measured by the consumer price index—peaked at a 3-year high of 6.5% in July, falling to 4.1% by December (Figure 3.9.4). The second-half improvement reflected monetary tightening in the first half of the year, government measures to regulate the housing market, and favorable harvests in the autumn that curbed hikes in food prices. Still, the inflation rate in 2011 was 5.4%, up from 3.3% the prior year, reflecting primarily food and fuel prices and residential housing costs. Supply shocks, such as surging pork prices and supply shortfalls as a result of poor harvests in the first half of the year, accounted for much of the food inflation. Residential housing prices started to grow more slowly or fall marginally in some areas; transactions were fewer.
Fiscal policy was expansionary. Government expenditure grew by 24.7%, revenue by 26.7%, and the government incurred a fiscal deficit equal to 1.8% of GDP (including local government debt). At 44% of GDP, total public debt remains manageable. Increased budget shares were made in support of medical reform, educational programs for migrant workers’ children in urban areas, and poverty relief. The government revised the
100 million people as poor. Monetary policy tightened in 2011 to dampen inflation pressures. The
central bank increased the banks’ reserve requirement ratio six times in the first half, to 21.5% for big lenders. It raised benchmark 1-year interest rates three times in the year, to 6.56%. As inflation pressures eased and the consumer price index fell, it started easing monetary policy first in December, by lowering the reserve requirement by 50 basis points and then by another 50 basis points in February (Figure 3.9.5). Money supply growth was 13.6% in 2011, below the government target of 16.0%. New
increase as the year earlier. Restricted access to credit, and persistent negative real interest rates
(bank deposit rates were lower than the inflation rate), encouraged heavy off-balance sheet credit activities and informal lending. This undermined government efforts to stabilize liquidity and control inflation, prompting increased supervision by regulatory agencies. Of particular focus were macro-prudential measures to regulate rapidly expanding wealth management products.
As reported by the central bank, foreign exchange reserves increased
from the seemingly continuous increase in reserves, they declined (by
to increased repatriation of foreign capital, capital flight, and valuation losses. On the exchange rate, the yuan appreciated during 2011 by 4.7% against the United States (US) dollar, and by 7.9% against the euro.
Due to the weak global economy, trade slowed: export growth decelerated to 20% from 31% and imports to 25% from 39% (Figure 3.9.6).
3.9.3 Contributions to growth (supply)
0
3
6
9
12
15
Agriculture Industry ServicesGDP
111009082007
Percentage points
Sources: National Bureau of Statistics of China. http://www.stats.gov.cn/english/ (accessed 1 March 2012); ADB estimates.
3.9.4 Monthly inflation
-6
0
6
12
18
24
Food Overall
Feb12
JulJan11
JulJan10
JulJan09
JulJan2008
%
Source: CEIC Data Company (accessed 12 March 2012).
3.9.5 Interest rates and required reserves
4.5
5.0
5.5
6.0
6.5
7.0
18
19
20
21
22
23
Required reserves, large banksLending rates
MarJan12
OctJulAprJan2011
% %
Source: CEIC Data Company (accessed 12 March 2012).
3.9.6 Trade indicators
-60
-30
0
30
60
90
Import growthExport growth
Feb12
JulJan11
JulJan10
JulJan2009
%
Source: CEIC Data Company (accessed 1 March 2012).

Economic trends and prospects in developing Asia: East Asia People’s Republic of China 133
high of 7.5% in 2007). The current account surplus fell to 2.8% of GDP in 2011. Foreign direct investment in the PRC increased, however, from
and European Union investors were more than offset by increased inflows from Asia.
Economic prospectsThe outlook assumes that the US economy will continue its slow recovery, that the eurozone sovereign debt crisis will not worsen, and that the PRC’s policy stance will remain accommodative.
During the Annual Central Economic Work Conference in December 2011—a major economic policy forum—the government announced the main policy guidelines for 2012. These include a shift in emphasis from curbing inflation to maintaining stable and relatively fast economic growth, promoting restructuring, and managing inflation expectations. These objectives will be addressed through fiscal and financial reforms supporting domestic demand as well as emerging and strategic industries, and structural reform to rebalance the sources of growth, in line with the main guidelines of the 12th Five-Year Plan (2011–2015).
Fiscal policy is expected to remain broadly expansionary in the forecast period, with higher spending on education, health care, pensions, public housing, and other social security programs (including a 40% increase in the 2012 budget allocation for poverty relief). The overall fiscal deficit is expected to be 1.7% of GDP in 2012 and 2.0% in 2013. To ease the tax burden on consumers and small and medium-sized enterprises, the government may again raise the minimum income tax exemption level and replicate nationwide the Shanghai pilot tax reform of shifting from the business tax to a value-added tax (Box 3.9.1). Plans have also been announced for improved support of small businesses, including tax relief and easier access to capital markets.
Monetary policy will accommodate a continued high rate of economic growth. Money supply (M2) is set to grow by 14% in 2012, with new
for 2013. Financial sector reform will continue, including prudential regulation of off-balance sheet credit activities that could destabilize the real economy. A cornerstone reform in this context would be a more market-based approach to setting interest rates, leading to a more effective allocation of capital and savings.
In view of exchange rate movements in 2011 and earlier, and the effects of increased labor and other domestic costs on export competitiveness, continued appreciation of the yuan against the US dollar may slow.
Fixed asset investment is projected to remain the major engine of growth, increasing by 20% or more in 2012 and 2013. Investment in infrastructure (such as railways, rural irrigation, and urban public transport) is expected to continue at a high level. As part of the current five-year plan, 7 million housing units are to be constructed in 2012, which will partly offset the slowdown in real estate investment by the private sector. Consistent with government efforts to narrow regional
3.9.1 Tax reforms
The authorities introduced new tax policies in 2011. In a step designed to improve energy efficiency and strengthen local government finances, a national resource tax system was launched in November 2011. Following a trial period in Xinjiang Uygur Autonomous region, oil and gas producers now face a 5% tax on sales value. The reform does not cover coal, however—the source of about 70% of the country’s total energy.
A trial program for the services sector began in January 2012, in Shanghai, to replace the business tax (on gross revenue) with a value-added tax (VAT).
The trial will focus on selected service providers and will be extended nationwide if effective. As part of the program, the Shanghai government announced new brackets of lower VAT rates for transport and certain service industries. The reform is expected to lower the tax burden for the service sector and support development of the country’s modern service industry.
To bolster development of small and medium-sized enterprises (SMEs)—which employ a large proportion of the country’s work force, especially in urban centers—the government raised the minimum threshold of the VAT and business tax for SMEs.
It also abolished the stamp tax on loan contracts between financial institutions and micro and small enterprises. Government departments have been requested to allocate at least 30% of their purchasing quota to SMEs.
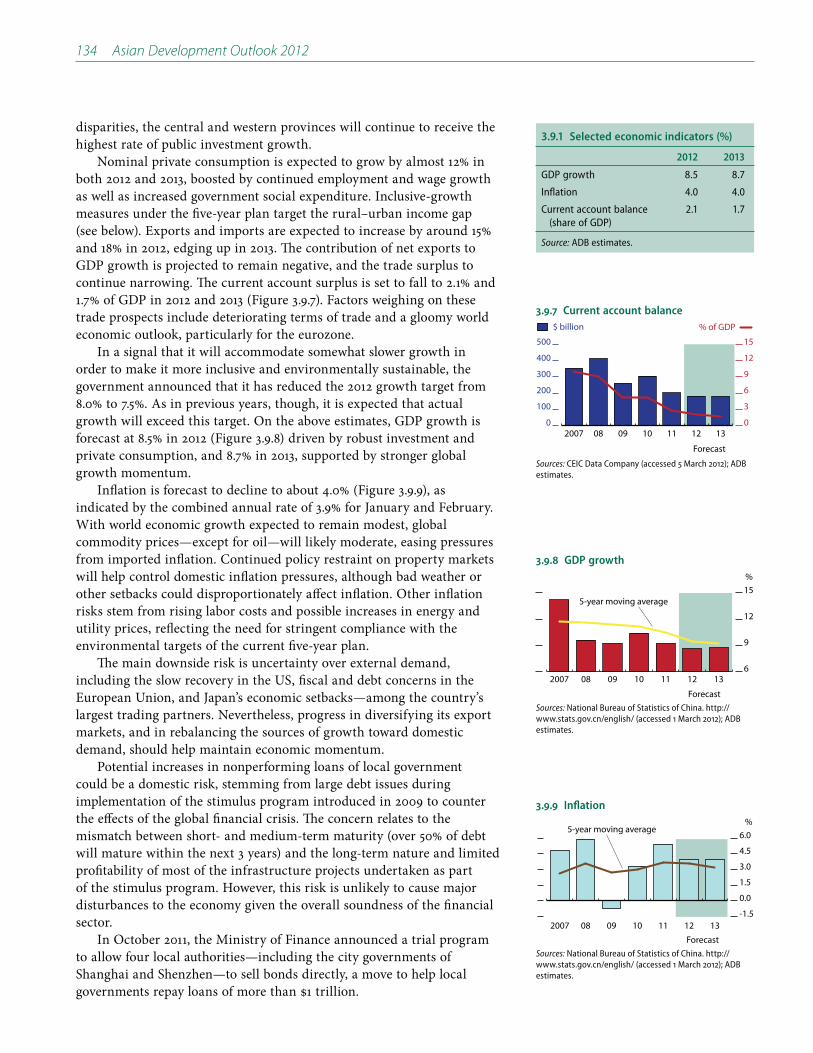
134 Asian Development Outlook 2012
disparities, the central and western provinces will continue to receive the highest rate of public investment growth.
Nominal private consumption is expected to grow by almost 12% in both 2012 and 2013, boosted by continued employment and wage growth as well as increased government social expenditure. Inclusive-growth measures under the five-year plan target the rural–urban income gap (see below). Exports and imports are expected to increase by around 15% and 18% in 2012, edging up in 2013. The contribution of net exports to GDP growth is projected to remain negative, and the trade surplus to continue narrowing. The current account surplus is set to fall to 2.1% and 1.7% of GDP in 2012 and 2013 (Figure 3.9.7). Factors weighing on these trade prospects include deteriorating terms of trade and a gloomy world economic outlook, particularly for the eurozone.
In a signal that it will accommodate somewhat slower growth in order to make it more inclusive and environmentally sustainable, the government announced that it has reduced the 2012 growth target from 8.0% to 7.5%. As in previous years, though, it is expected that actual growth will exceed this target. On the above estimates, GDP growth is forecast at 8.5% in 2012 (Figure 3.9.8) driven by robust investment and private consumption, and 8.7% in 2013, supported by stronger global growth momentum.
Inflation is forecast to decline to about 4.0% (Figure 3.9.9), as indicated by the combined annual rate of 3.9% for January and February. With world economic growth expected to remain modest, global commodity prices—except for oil—will likely moderate, easing pressures from imported inflation. Continued policy restraint on property markets will help control domestic inflation pressures, although bad weather or other setbacks could disproportionately affect inflation. Other inflation risks stem from rising labor costs and possible increases in energy and utility prices, reflecting the need for stringent compliance with the environmental targets of the current five-year plan.
The main downside risk is uncertainty over external demand, including the slow recovery in the US, fiscal and debt concerns in the European Union, and Japan’s economic setbacks—among the country’s largest trading partners. Nevertheless, progress in diversifying its export markets, and in rebalancing the sources of growth toward domestic demand, should help maintain economic momentum.
Potential increases in nonperforming loans of local government could be a domestic risk, stemming from large debt issues during implementation of the stimulus program introduced in 2009 to counter the effects of the global financial crisis. The concern relates to the mismatch between short- and medium-term maturity (over 50% of debt will mature within the next 3 years) and the long-term nature and limited profitability of most of the infrastructure projects undertaken as part of the stimulus program. However, this risk is unlikely to cause major disturbances to the economy given the overall soundness of the financial sector.
In October 2011, the Ministry of Finance announced a trial program to allow four local authorities—including the city governments of Shanghai and Shenzhen—to sell bonds directly, a move to help local
3.9.1 Selected economic indicators (%)
2012 2013
GDP growth 8.5 8.7
Inflation 4.0 4.0
Current account balance (share of GDP)
2.1 1.7
Source: ADB estimates.
3.9.9 Inflation
-1.5
0.0
1.5
3.0
4.5
6.0
1312111009082007
%
Forecast
5-year moving average
Sources: National Bureau of Statistics of China. http://www.stats.gov.cn/english/ (accessed 1 March 2012); ADB estimates.
3.9.7 Current account balance
0
100
200
300
400
500
0
3
6
9
12
15
$ billion % of GDP
1312111009082007
Forecast
Sources: CEIC Data Company (accessed 5 March 2012); ADB estimates.
3.9.8 GDP growth
6
9
12
15
1312111009082007
%
Forecast
5-year moving average
Sources: National Bureau of Statistics of China. http://www.stats.gov.cn/english/ (accessed 1 March 2012); ADB estimates.
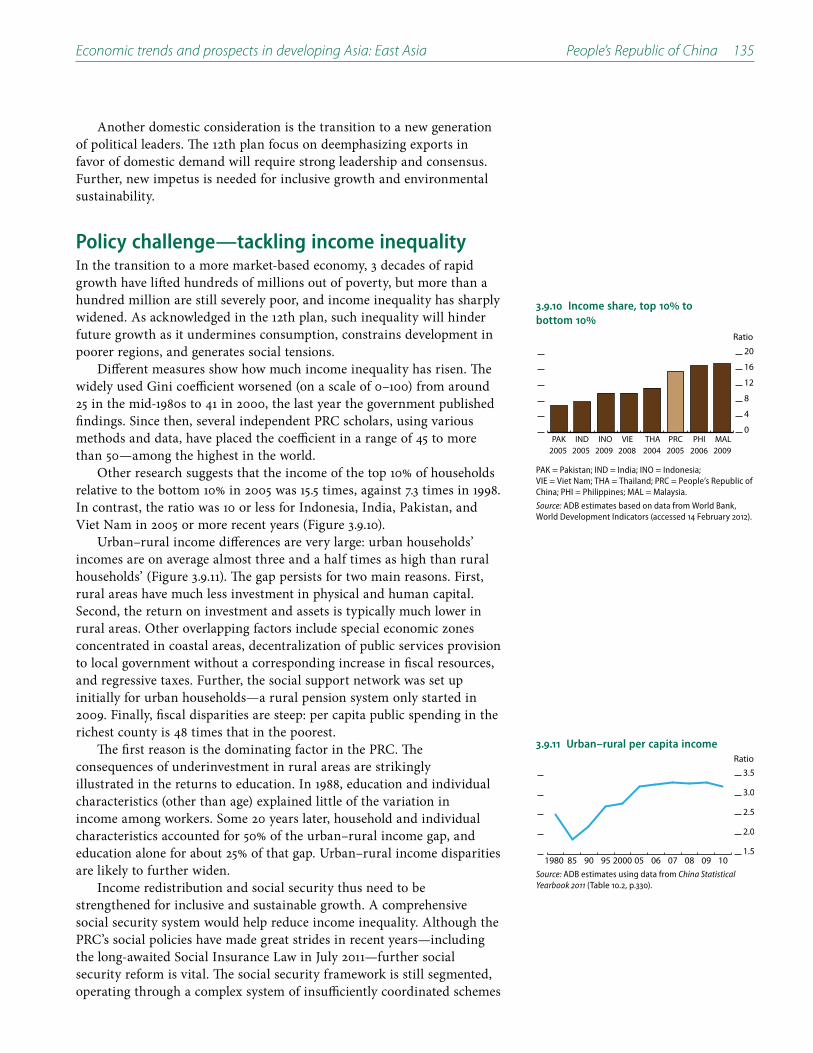
Economic trends and prospects in developing Asia: East Asia People’s Republic of China 135
Another domestic consideration is the transition to a new generation of political leaders. The 12th plan focus on deemphasizing exports in favor of domestic demand will require strong leadership and consensus. Further, new impetus is needed for inclusive growth and environmental sustainability.
Policy challenge—tackling income inequalityIn the transition to a more market-based economy, 3 decades of rapid growth have lifted hundreds of millions out of poverty, but more than a hundred million are still severely poor, and income inequality has sharply widened. As acknowledged in the 12th plan, such inequality will hinder future growth as it undermines consumption, constrains development in poorer regions, and generates social tensions.
Different measures show how much income inequality has risen. The widely used Gini coefficient worsened (on a scale of 0–100) from around 25 in the mid-1980s to 41 in 2000, the last year the government published findings. Since then, several independent PRC scholars, using various methods and data, have placed the coefficient in a range of 45 to more than 50—among the highest in the world.
Other research suggests that the income of the top 10% of households relative to the bottom 10% in 2005 was 15.5 times, against 7.3 times in 1998. In contrast, the ratio was 10 or less for Indonesia, India, Pakistan, and Viet Nam in 2005 or more recent years (Figure 3.9.10).
Urban–rural income differences are very large: urban households’ incomes are on average almost three and a half times as high than rural households’ (Figure 3.9.11). The gap persists for two main reasons. First, rural areas have much less investment in physical and human capital. Second, the return on investment and assets is typically much lower in rural areas. Other overlapping factors include special economic zones concentrated in coastal areas, decentralization of public services provision to local government without a corresponding increase in fiscal resources, and regressive taxes. Further, the social support network was set up initially for urban households—a rural pension system only started in 2009. Finally, fiscal disparities are steep: per capita public spending in the richest county is 48 times that in the poorest.
The first reason is the dominating factor in the PRC. The consequences of underinvestment in rural areas are strikingly illustrated in the returns to education. In 1988, education and individual characteristics (other than age) explained little of the variation in income among workers. Some 20 years later, household and individual characteristics accounted for 50% of the urban–rural income gap, and education alone for about 25% of that gap. Urban–rural income disparities are likely to further widen.
Income redistribution and social security thus need to be strengthened for inclusive and sustainable growth. A comprehensive social security system would help reduce income inequality. Although the PRC’s social policies have made great strides in recent years—including the long-awaited Social Insurance Law in July 2011—further social security reform is vital. The social security framework is still segmented, operating through a complex system of insufficiently coordinated schemes
3.9.10 Income share, top 10 to bottom 10
0
4
8
12
16
20
MALPHIPRCTHAVIEINOINDPAK
Ratio
2005 2005 2009 20052008 2004 2006 2009
PAK = Pakistan; IND = India; INO = Indonesia; VIE = Viet Nam; THA = Thailand; PRC = People’s Republic of China; PHI = Philippines; MAL = Malaysia.
Source: ADB estimates based on data from World Bank, World Development Indicators (accessed 14 February 2012).
3.9.11 Urban–rural per capita income
1.5
2.0
2.5
3.0
3.5
10090807060520009590851980
Ratio
Source: ADB estimates using data from China Statistical Yearbook 2011 (Table 10.2, p.330).

136 Asian Development Outlook 2012
that result in inadequate coverage of benefits and beneficiaries. Further, its dual nature—parallel rural and urban programs—resulting from the household registration system or hukou, is no longer suitable. A much more unified system, as envisaged under the Social Insurance Law, is required to address the needs arising from increased labor mobility (including those of migrant workers), the challenges of accelerated urbanization, and the implications of a rapidly aging population.
Central–local fiscal arrangements must also be strengthened. Although transfer payments from the central government have been increased, the capacity of local governments to provide public services has not improved in tandem. Equally, revenue sharing and expenditure responsibilities between the central and local governments need to be better aligned.
Beyond challenges of inclusive growth and income inequality are many others, notably water resource management and energy use. The country needs to manage its water better, as water scarcity and pollution are threatening the agricultural base. (The 12th plan aims to reduce water consumption per unit of industrial value added by 30%.)
The PRC is now the world’s biggest energy consumer and since 2007 the largest source of energy-related greenhouse gas emissions; its energy intensity (energy consumption per unit of GDP) is nearly double the average of countries in the Organisation for Economic Co-operation and Development (Figure 3.9.12). (The 12th plan has set a target of cutting energy intensity by 17%.)
As the world’s second-largest economy, the PRC will increasingly influence the rate and manner of world economic growth. Global interdependence requires the eurozone crisis to be resolved, a repeat recession in industrial countries to be avoided, trade protectionism to be rejected, and international consensus to be secured on actions on climate change and other issues. The PRC’s growth in 2012 and 2013 is heavily dependent on the global context, as are its longer-term prospects.
3.9.12 Energy intensity
0.0
0.1
0.2
0.3
USAUKGSWEJPNITAGERFRACANPRC
Energy consumptionper unit of GDP
PRC = People’s Republic of China; CAN = Canada; FRA = France; GER = Germany; ITA = Italy; JPN = Japan; SWE = Sweden; UKG = United Kingdom; USA = United States.
Source: Enerdata. Global Energy Statistical Yearbook. http://yearbook.enerdata.net (accessed 5 March 2012).
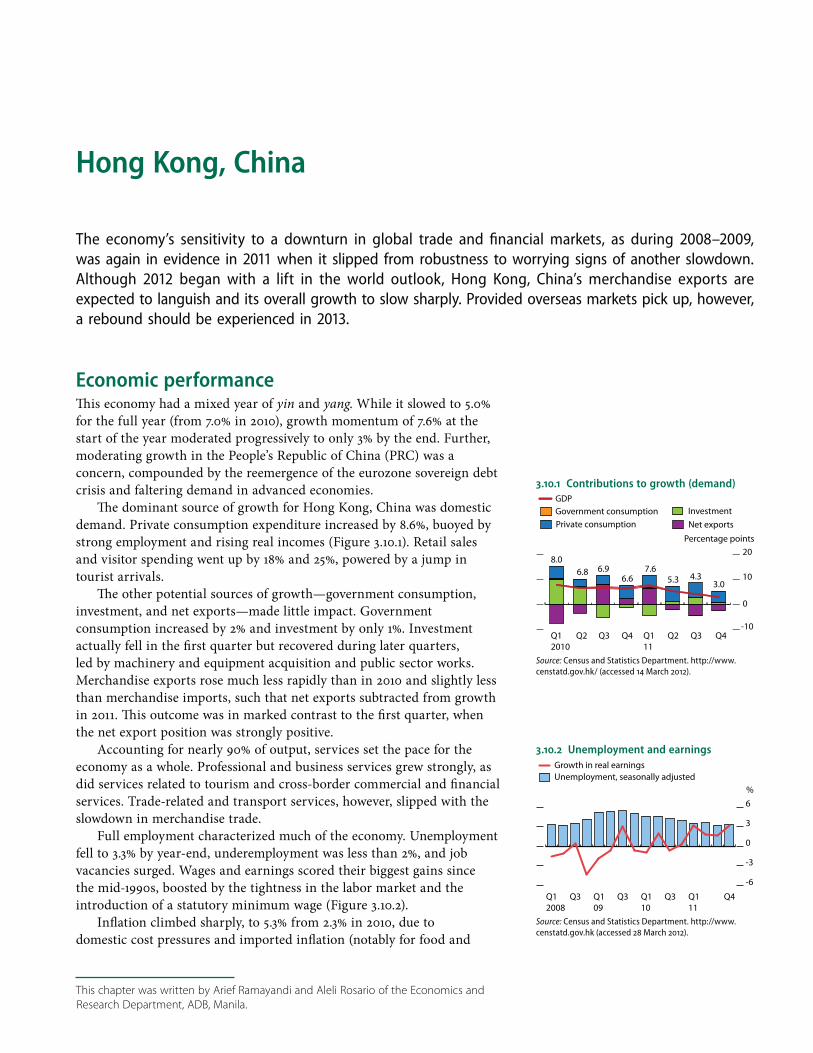
Hong Kong, China
The economy’s sensitivity to a downturn in global trade and financial markets, as during 2008–2009, was again in evidence in 2011 when it slipped from robustness to worrying signs of another slowdown. Although 2012 began with a lift in the world outlook, Hong Kong, China’s merchandise exports are expected to languish and its overall growth to slow sharply. Provided overseas markets pick up, however, a rebound should be experienced in 2013.
Economic performanceThis economy had a mixed year of yin and yang. While it slowed to 5.0% for the full year (from 7.0% in 2010), growth momentum of 7.6% at the start of the year moderated progressively to only 3% by the end. Further, moderating growth in the People’s Republic of China (PRC) was a concern, compounded by the reemergence of the eurozone sovereign debt crisis and faltering demand in advanced economies.
The dominant source of growth for Hong Kong, China was domestic demand. Private consumption expenditure increased by 8.6%, buoyed by strong employment and rising real incomes (Figure 3.10.1). Retail sales and visitor spending went up by 18% and 25%, powered by a jump in tourist arrivals.
The other potential sources of growth—government consumption, investment, and net exports—made little impact. Government consumption increased by 2% and investment by only 1%. Investment actually fell in the first quarter but recovered during later quarters, led by machinery and equipment acquisition and public sector works. Merchandise exports rose much less rapidly than in 2010 and slightly less than merchandise imports, such that net exports subtracted from growth in 2011. This outcome was in marked contrast to the first quarter, when the net export position was strongly positive.
Accounting for nearly 90% of output, services set the pace for the economy as a whole. Professional and business services grew strongly, as did services related to tourism and cross-border commercial and financial services. Trade-related and transport services, however, slipped with the slowdown in merchandise trade.
Full employment characterized much of the economy. Unemployment fell to 3.3% by year-end, underemployment was less than 2%, and job vacancies surged. Wages and earnings scored their biggest gains since the mid-1990s, boosted by the tightness in the labor market and the introduction of a statutory minimum wage (Figure 3.10.2).
Inflation climbed sharply, to 5.3% from 2.3% in 2010, due to domestic cost pressures and imported inflation (notably for food and
3.10.1 Contributions to growth (demand)
8.06.8 6.9
6.67.6
5.3 4.33.0
-10
0
10
20
Q12010
Q2 Q3 Q4 Q111
Q2 Q3 Q4
Percentage points
Private consumptionGovernment consumptionGDP
Net exportsInvestment
Source: Census and Statistics Department. http://www.censtatd.gov.hk/ (accessed 14 March 2012).
This chapter was written by Arief Ramayandi and Aleli Rosario of the Economics and
Research Department, ADB, Manila.
3.10.2 Unemployment and earnings
-6
-3
0
3
6
Growth in real earningsUnemployment, seasonally adjusted
Q4 Q111
Q3 Q110
Q3 Q109
Q3 Q12008
%
Source: Census and Statistics Department. http://www.censtatd.gov.hk (accessed 28 March 2012).

138 Asian Development Outlook 2012
oil) (Figure 3.10.3). Housing prices stabilized in the second half but showed steep appreciation (7.2%) for the year as a whole. Government interventions, such as increased land supply and restrictions to mortgage availability, helped cool the property market (Figure 3.10.4).
Macroeconomic policy focused on investing in the future, as well as fighting inflation and the risk of an asset bubble. Fiscal policy helped low-income groups deal with the rising cost of living, especially food and housing-related costs, as these account for two-thirds of such groups’ overall spending. Measures to moderate the cost of living included electricity subsidies and rate concessions on property taxes and public housing rentals. Netting out the effects of the government’s one-time measures, underlying inflation rose at the same rate as headline inflation.
Fiscal policy for FY2011 (1 April–31 March 2012) was consolidative. Expenditure was up 22% and revenue 15%, with the result that the budget surplus narrowed to 3.5% of GDP (from 4.5% in FY2010).
Monetary policy reflected the pegged exchange rate to the United States (US) dollar and the accommodative policy of the US Federal Reserve, including low interest rates that helped maintain strong domestic demand. Similar to the US dollar, the nominal trade-weighted effective exchange rate index of the Hong Kong dollar depreciated by 2.4% in December from a year earlier.
Trade activity was deflated by the eurozone crisis, the sluggish US economy, and disruptions to global supply chains resulting from Japan’s earthquake in March. Merchandise exports rose (in nominal terms) by only 11.2%, or less than half the rate of the previous year. Although the PRC accounts for over half of Hong Kong, China’s exports and reexports of goods, slackening demand in the advanced markets became increasingly evident in Asian markets (Figure 3.10.5).
Services exports increased by 14%, a sharp deceleration from the gain of 23% the previous year. Tourism boomed but transport and trade-related services weakened appreciably. Despite the 20% slump in the Hang Seng index during 2011, the economy retained its rank as the world’s top initial public offering center.
Merchandise imports climbed by 12%, again around half the rate of 2010. Retained imports, which account for one-fourth of total imports, increased by 16%, reflecting strong domestic demand and tourist spending.
Hong Kong, China continued to have a large current account surplus, equivalent to 5.1% of GDP. The positive balance for trade in services more than offset the deficit in trade in goods. The capital account was negative, with heavy portfolio investment outflows. Net foreign direct investment was substantially positive, despite outflows in the latter part of the year.
Economic prospectsThe economy is highly open and trade dependent, hence growth is critically dependent on conditions of its major economic partners. The business outlook is uncertain and growth of only 3.0% is forecast for Hong Kong, China in 2012, well below the 5-year average before the global financial crisis. The forecast for 2013 is much stronger, with growth of 4.5%. This is premised on a continued, gradually improving US economy,
3.10.3 Sources of inflation
-3
0
3
6
Percentage points
9
Jan2010
Apr Jul Oct Apr Jul Oct Feb12
Jan2010
TransportHousingOverall Food
OthersElectricity, gas, and water
Source: CEIC Data Company (accessed 23 March 2012).
3.10.4 Property indicators
-6
0
6
12
18
-22
0
22
44
66
Sales transaction volumeAffordability ratioRental indexPrice index
Jan12
JulJan11
JulJan10
JulJan09
JulJan2008
Thousand units % change
Note: Sales transaction refers to residential and nonresidential properties. Price and rental indexes refer to residential properties only. Affordability ratio refers to the ratio of mortgage payments (for a 45 square meter apartment) to the median income of all households.
Source: CEIC Data Company (accessed 14 March 2012).
3.10.5 Main export destinations
0
20
40
60
80
100
People’s Rep. of ChinaOther AsiaAssociation of Southeast Asian NationsUnited StatesEuropean UnionRest of the world
111009082007
%
Source: CEIC Data Company (accessed 28 March 2012).

Economic trends and prospects in developing Asia: East Asia Hong Kong, China 139
easing of the eurozone crisis, and slowing but still strong growth of the PRC economy.
Private consumption will remain the main source of stimulus, supported by full or near full employment and continued income growth. A decline in investor confidence is expected to cause investment to slow sharply in 2012 but then to strengthen in 2013 as the global outlook improves. Net exports are projected to be negative in the first half of 2012—a drag on economic growth—before becoming positive toward year-end.
Most of the four “pillar industries”—financial services, tourism, trade and logistics, and producer and professional services—are expected to continue expanding at a healthy rate, abetted by the PRC. Trade and logistics, however will slow in 2012 as a result of weak growth globally.
During the forecast period Hong Kong, China will continue to deepen its economic integration with the PRC through the Closer Economic Partnership Agreement and Pan-Pearl River Delta region platforms, and continue to expand its role as an international financial and trade center. It will also continue to expand its yuan business, supported by measures that encourage citizens of the PRC to invest in Hong Kong, China stocks, that allow repatriation of the yuan, and that increase yuan-denominated bond issuance in the territory (Figure 3.10.6).
Growth of tourism will provide an important injection to the economy, helping offset weakness in the trade and logistics sector. Visitor arrivals from the PRC surged by 24% to 28.1 million in 2011, accounting for 67% of the total (Figure 3.10.7).
External trade is expected to remain sluggish in 2012. In view of weak external demand, merchandise exports will show little growth and could even decline if the PRC, US, and European Union experience an unexpected setback. Since advanced economies account for close to 30% of East Asia’s total export value, their import demand directly bears on demand for Hong Kong, China’s exports. Service exports should remain buoyant, aided by tourism and the growth of professional services to the PRC. The current account surplus is forecast to narrow to the equivalent of 5.0% of GDP in 2012 and 2013.
Average annual inflation is expected to decline to 3.8% for the year as a whole, reflecting more stable food prices and lower commodity prices, except for oil. Also, the short-term price effects of government intervention in rental housing will have worked through, with a consequent drop in the housing component in the inflation index. Inflation is expected to drop further in 2013, to 3.3%, as food and housing prices continue to stabilize.
Fiscal policy is being realigned, from fighting inflation to ensuring stability of employment and income growth. For FY2012 (ending 31 March 2013), six priority areas have been identified for budget support and government action: supporting enterprises; preserving employment; caring for people; stabilizing the financial system; increasing land supply; and strengthening social capital.
The 2012 budget indicates increased government expenditure of 7.5%, but a decrease in revenues in part because of one-time reductions in taxes on profits and salaries, waiving of business registration fees, and halving charges for import and export declarations. A budget deficit of
3.10.1 Selected economic indicators (%)
2012 2013
GDP growth 3.0 4.5
Inflation 3.8 3.3
Current account balance (share of GDP)
5.0 5.0
Source: ADB estimates.
3.10.6 Deposits
0
20
40
60
80
100
HK$CNYForeign currency
Jan12
JulJan11
JulJan10
JulJan09
JulJan2008
%
Source: CEIC Data Company (accessed 20 March 2012).
3.10.7 Tourist arrivals by area of origin
0
9
18
27
36
45
PacificEurope, Africa, and Middle EastAmericasOther AsiaPeople's Rep. of China
11 08 05 2002 99 1996
Millions
Source: CEIC Data Company (accessed 22 March 2012).
3.10.8 Fiscal indicators
-150
0
150
300
450
-4
0
4
8
12
Fiscal balanceExpenditureRevenue
12111009082007
HK$ billion % of GDP
BudgetSource: Hong Kong Monetary Authority. 28 March 2012.
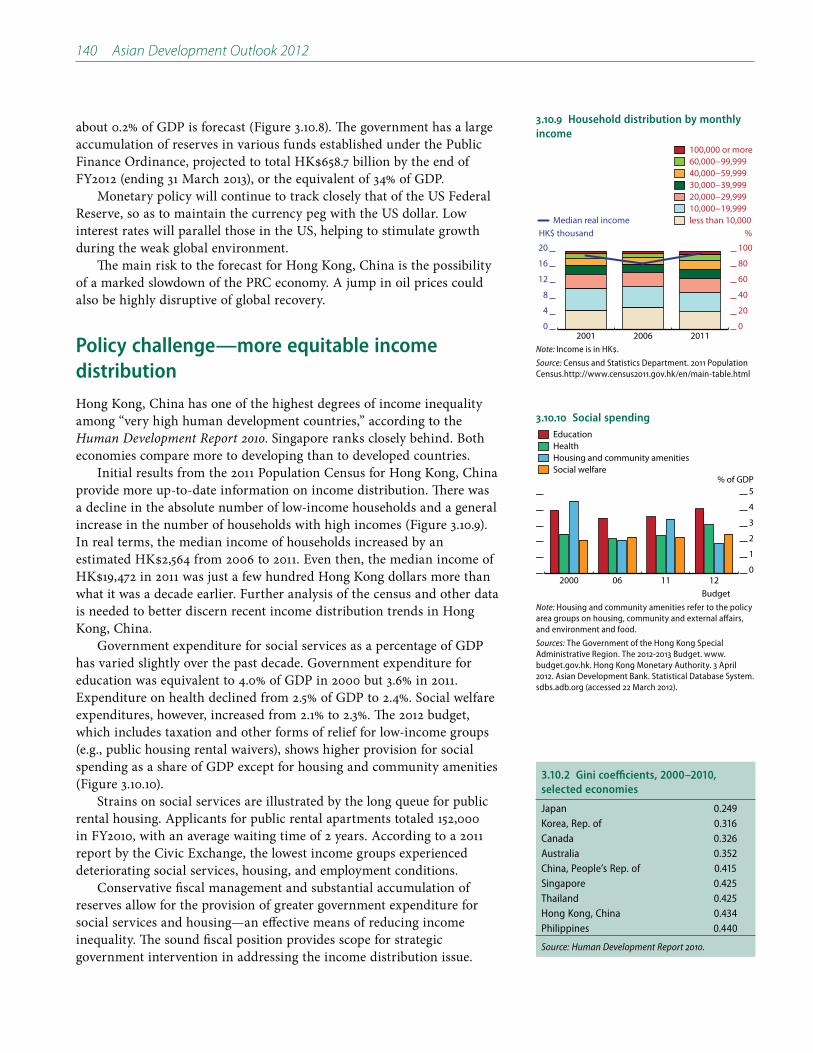
140 Asian Development Outlook 2012
about 0.2% of GDP is forecast (Figure 3.10.8). The government has a large accumulation of reserves in various funds established under the Public
FY2012 (ending 31 March 2013), or the equivalent of 34% of GDP.Monetary policy will continue to track closely that of the US Federal
Reserve, so as to maintain the currency peg with the US dollar. Low interest rates will parallel those in the US, helping to stimulate growth during the weak global environment.
The main risk to the forecast for Hong Kong, China is the possibility of a marked slowdown of the PRC economy. A jump in oil prices could also be highly disruptive of global recovery.
Policy challenge—more equitable income distribution
Hong Kong, China has one of the highest degrees of income inequality among “very high human development countries,” according to the Human Development Report 2010. Singapore ranks closely behind. Both economies compare more to developing than to developed countries.
Initial results from the 2011 Population Census for Hong Kong, China provide more up-to-date information on income distribution. There was a decline in the absolute number of low-income households and a general increase in the number of households with high incomes (Figure 3.10.9). In real terms, the median income of households increased by an
what it was a decade earlier. Further analysis of the census and other data is needed to better discern recent income distribution trends in Hong Kong, China.
Government expenditure for social services as a percentage of GDP has varied slightly over the past decade. Government expenditure for education was equivalent to 4.0% of GDP in 2000 but 3.6% in 2011. Expenditure on health declined from 2.5% of GDP to 2.4%. Social welfare expenditures, however, increased from 2.1% to 2.3%. The 2012 budget, which includes taxation and other forms of relief for low-income groups (e.g., public housing rental waivers), shows higher provision for social spending as a share of GDP except for housing and community amenities (Figure 3.10.10).
Strains on social services are illustrated by the long queue for public rental housing. Applicants for public rental apartments totaled 152,000 in FY2010, with an average waiting time of 2 years. According to a 2011 report by the Civic Exchange, the lowest income groups experienced deteriorating social services, housing, and employment conditions.
Conservative fiscal management and substantial accumulation of reserves allow for the provision of greater government expenditure for social services and housing—an effective means of reducing income inequality. The sound fiscal position provides scope for strategic government intervention in addressing the income distribution issue.
3.10.9 Household distribution by monthly income
0
4
8
12
16
20
0
20
40
60
80
100
Median real income
100,000 or more60,000−99,99940,000−59,99930,000−39,99920,000−29,99910,000−19,999less than 10,000
201120062001
%HK$ thousand
Note: Income is in HK.
Source: Census and Statistics Department. 2011 Population Census.http://www.census2011.gov.hk/en/main-table.html
3.10.10 Social spending
0
1
2
3
4
5
Social welfareHousing and community amenitiesHealthEducation
1211062000
% of GDP
BudgetNote: Housing and community amenities refer to the policy area groups on housing, community and external affairs, and environment and food.
Sources: The Government of the Hong Kong Special Administrative Region. The 2012-2013 Budget. www.budget.gov.hk. Hong Kong Monetary Authority. 3 April 2012. Asian Development Bank. Statistical Database System. sdbs.adb.org (accessed 22 March 2012).
3.10.2 Gini coefficients, 2000–2010, selected economies
Japan 0.249Korea, Rep. of 0.316Canada 0.326Australia 0.352China, People’s Rep. of 0.415Singapore 0.425Thailand 0.425Hong Kong, China 0.434Philippines 0.440
Source: Human Development Report 2010.

Republic of Korea
The export sector was surprisingly strong in 2011, but domestic demand wilted, resulting in economic growth below potential. Subpar growth is expected again this year, with the uncertain global outlook restraining trade and investment. Excessive household debt weighs heavily, prompting deleveraging but hampering efforts to lift the economy and reduce income disparities. Policy makers face the dual challenge of how best to shelter the economy from external risk and strengthen inclusive growth.
Economic performanceAfter surging by 6.2% in 2010, economic growth in the Republic of Korea slowed to 3.6% in 2011. As indicated by the economic performance prior to the 2008–2009 global financial crisis, a rate around 4% is closer to potential. A slowdown was expected—given the exceptionally high rate in 2010—but not to this degree. The underlying cause was sluggish domestic demand, particularly with respect to investment. Manufacturing output expanded by 7.1% and services by 2.6%, but construction contracted by 5.6%. The strength of manufacturing relates to exports as the mainstay of growth in 2011, a contrast with 2010, when high levels of consumption and investment spurred growth while the trade sector acted as a drag.
More precisely, net exports were strongly positive in 2011 (exports increased faster than imports) and accounted for over half GDP growth (Figure 3.11.1). Despite a much less rapid rise than in the previous year, private consumption added another third. Government consumption accounted for little, reflecting the completion of fiscal stimulus. Investment contributed even less as plant and equipment expenditures were relatively flat; facilities investment increased by less than 4%, down from 25% in 2010. Construction fell deeper into negative territory.
Growth momentum slowed during the year. Year on year, output was up 4.2% in the first quarter but then fell to the 3.5% range in the subsequent 3 quarters. Softening of growth was more evident quarter on quarter (Figure 3.11.2): reflecting the growing weakness of the economy, all the main components of GDP expenditure contracted in the fourth. This drop-off was especially pronounced for plant and equipment investment, but also extended to exports. The decelerating growth momentum closely paralleled the deteriorating global outlook.
Merchandise exports increased in nominal terms by a subdued but still-healthy 20.0% in 2011 (versus 28.8% in 2010), underscoring exports’ resilience. Export growth year on year, however, slowed steadily from 26.5% in the first quarter to 12.1% in the fourth (Figure 3.11.3). A flurry of ship orders and March’s earthquake in Japan initially buttressed exports, but as the year progressed, softening demand—notably from the
3.11.1 Contributions to growth (demand)
5.1
2.30.3
6.2
3.6
-6
-3
0
3
6
9
2007 08 09 10 11
Percentage pointsPrivate consumptionGovernment consumptionGDP Investment
Statistical discrepancyNet exports
Sources: Bank of Korea. Economics Statistics System. http://ecos.bok.or.kr (accessed 1 February 2012); ADB estimates.
This chapter was written by Donghyun Park of the Economics and Research
Department, ADB, Manila.
3.11.2 Quarterly GDP growth
0
2
4
6
8
10
Quarter on quarterYear on year
Q4Q3Q2Q111
Q4Q3Q2Q12010
%
Source: Bank of Korea. Economics Statistics System. http://ecos.bok.or.kr (accessed 1 February 2012).

142 Asian Development Outlook 2012
European Union—markedly dented the momentum of export-led growth. Robust exports to developing Asia only partly offset weakening demand from advanced economies. In turn, import growth fell steadily over the year, indicative of softening domestic demand. Merchandise imports rose by 23.8%, down from 31.5% in 2010. The pattern for services trade was broadly similar. The current account surplus is estimated to be the equivalent of 2.5% of GDP, slightly lower than in 2010. The won exchange rate against the dollar remained essentially unchanged at 1,100 (it was 1,150 in 2010).
Private consumption climbed by only 2.2% in 2011, half the year-earlier rate. As was the case with the export sector, it also weakened progressively during the year, starting with growth of almost 3% but falling to just over 1% by the fourth quarter (Figure 3.11.4). Consumer confidence fell in tandem, eroded by inflation and declining real household purchasing power. Further, gross domestic income increased by only 1%, as higher oil prices and a deterioration of the terms of trade cut into disposable income. The one positive note was a large pickup in employment of some 400,000, much higher than the usual 250,000.
The sharp investment slowdown is reflected in the industrial production index and the ratio of producer’s shipments to inventory (Figure 3.11.5). Investment in export-oriented industries such as automobiles and semiconductors fell in parallel with the global outlook. The slowdown also partly reflects normalization from the exceptionally rapid investment growth of 2010. Construction investment contracted, reflecting the weak housing market and subdued public works activity.
Inflation, as measured by the consumer price index, rose to 4.0%, the upper limit of the Bank of Korea’s inflation target band. Supply-side factors included domestic food prices as well as oil and other commodity prices. The spike in domestic food prices was caused by bad weather. While supply-side factors were the immediate catalyst of higher inflation in 2011, aggregate demand pressures also played a role. The central bank raised the policy interest rate during the first half of the year, then held monetary policy steady in light of the global outlook (Figure 3.11.6).
The government continued to consolidate its financial position, which had been sharply expansionary in response to the global financial crisis. The fiscal deficit narrowed progressively, to 0.7% of GDP from 4.8% in 2009 and 1.5% in 2010. Government expenditure rose to 21.2% of GDP and revenue even more significantly to 20.5%; the ratio of public debt to GDP fell marginally to 35%.
In summary, the country’s overall economic performance in 2011 was worse than expected, largely due to the deteriorating global outlook as the year unfolded. Even though export growth slowed progressively during the year, it remained the main driver. Private consumption was supportive while investment lost steam.
Economic prospectsGrowth for 2012 is forecast at 3.4% (below potential), rising moderately in 2013 to 4.0%. These rates are based on the expectation that the Republic of Korea’s main export markets, including the European Union, the United States (US), and Japan, will experience slow growth at best. Thus the
3.11.3 Merchandise export and import growth
0
10
20
30
40
50
ImportExport
Q4Q3Q2Q111
Q4Q3Q2Q12010
%
Source: CEIC Data Company (accessed 21 February 2012).
3.11.4 Private consumption growth
-2
0
2
4
6
8
Quarter on quarterYear on year
Q4Q3Q2Q111
Q4Q3Q2Q12010
%
Source: Bank of Korea. Economics Statistics System. http://ecos.bok.or.kr (accessed 1 February 2012).
3.11.5 Monthly industrial production and producer’s shipment to inventory ratio
-15
0
15
30
45
Producer's shipment to inventory ratio (year on year, 3- month lag)
Industrial production growth (year on year)
Jan12
OctJulAprJan11
OctJulAprJan2010
%
Sources: CEIC Data Company (accessed 6 March 2012); ADB estimates.
3.11.6 Month-end policy interest rate
0
2
4
6
Feb12
SepMar11
SepMar10
SepMar09
Sep2008
%
Source: CEIC Data Company (accessed 8 March 2012).

Economic trends and prospects in developing Asia: East Asia Republic of Korea 143
pessimistic global outlook that so hampered the country’s performance in the second half of 2011 will set the tone for the forecast period.
Exports in nominal terms are expected to increase by about 8% in 2012, or less than half last year’s rate. Export unit prices are expected to remain flat, in contrast to significant gains in 2011. The fragile state of economic recovery in advanced countries is constraining demand for key exports from the Republic of Korea, such as automobiles, electronics, and other consumer durables. Demand for key ICT parts, such as memory chips used in personal computers, has also been affected.
More positively, exports of general machinery and other goods to the People’s Republic of China and other emerging markets in Asia are expected to remain strong. Petrochemical exports will also be robust, including those to Japan. Overall export growth is projected to strengthen gradually during 2012 and into 2013, in line with a gradually improving global outlook. Imports will likely climb faster than exports, and the current account surplus to decline to around 2.0% of GDP. The US dollar exchange rate is unlikely to change much either way.
Investment is forecast to increase by little more than 2% in 2012. Subdued investment, especially in the export sector, has mirrored the worsening external environment. Corporate investment surveys indicate that major Korean firms plan to reduce investment relative to their levels in 2011 by 5–10%. Beyond weak business sentiment, an impediment to stronger investment is the decline in corporate profitability, notably among ICT firms. Another negative element for equipment investment is the recent fall in capacity utilization (Figure 3.11.7). Construction investment, including housing, which contracted in both 2010 and 2011, is expected to increase, but only moderately. Overall investment is expected to strengthen in the second half of 2012 as the global outlook picks up.
Private consumption is projected to increase by about 3% in 2012, or somewhat more strongly than in 2011. Various factors constrain its growth, though. Consumer confidence is weak (Figure 3.11.8) and is unlikely to strengthen until the global outlook improves convincingly. Purchases of consumer durables, especially automobiles, may be constrained by the prospective free trade agreement with the US, which is expected to lower prices. Further, sluggish exports will limit wage growth and ultimately private consumption. Real wage growth has lagged GDP growth since the mid-2000s and this trend is likely to continue. Excessive household debt also constrains increased private consumption, especially among low-income groups. On the positive side, inflation pressures are expected to ease and to help raise household purchasing power.
Inflation is forecast to decline to 3.0%, a full percentage lower than in 2011. It is anticipated that the ratcheting down of global growth predictions for 2012 and 2013 will be tracked by moderating commodity prices and help ease core inflation. However, international oil and food prices are volatile; they were high in the first part of 2011 then eased, but oil prices have again risen sharply. Supply shocks—such as a spike in oil prices—could prove highly disruptive. A firmer basis for optimism on inflation is the abatement of domestic demand pressures and the projected disappearance of the small inflationary gap that emerged in 2011 (Figure 3.11.9).
Employment is forecast to increase by 250,000—healthy but far short of the exceptional gain in 2011. The elasticity of employment growth
3.11.7 Capacity utilization ratio
70
75
80
85
Oct Jul AprJan2011
%
Source: CEIC Data Company (accessed 6 March 2012).
3.11.8 Consumer confidence
95
100
105
110
115
Feb12
Oct Jul AprJan11
Oct Jul AprJan2010
Index
Source: Bank of Korea. Economic Statistics System. http://ecos.bok.or.kr (accessed 6 March 2012).
3.11.1 Selected economic indicators (%)
2012 2013
GDP growth 3.4 4.0
Inflation 3.0 3.0
Current account balance (share of GDP)
2.0 2.0
Source: ADB estimates.

144 Asian Development Outlook 2012
relative to GDP growth in recent years reflects the large expansion of labor supply. This, in turn, stems from the reentry of retired 50-plus baby boomers into the workforce, usually self-employed, to cope with insufficient retirement income. “Silver workers”—those 60 and over—now constitute around 12% of the workforce. For those 65 and older, the employment rate is more than double the OECD average. Except for professionals, these workers are typically unskilled, on low wages and with little job security. Self-employment in small, scarcely profitable retail outlets is common. Strong employment growth therefore masks questions about the quality of employment.
The current basic monetary and fiscal policy framework is likely to continue—that is, to lower inflation while supporting growth. The policy interest rate is expected to remain largely unchanged. Although the adverse global environment may call for stimulus—including yet lower interest rates—the current policy rate of 3.25% is already accommodative. High and growing household debt further weakens the case for monetary loosening (Figure 3.11.10). The Bank of Korea will closely monitor developments, tightening monetary policy if inflationary pressures revive but loosening it if the economic outlook deteriorates further.
The fiscal position is fundamentally sound, as indicated by the public debt-to-GDP ratio of 35%, which is far lower than the OECD average. The relatively favorable fiscal conditions support continued consolidation within a medium-term fiscal framework. Public expenditure requirements associated with the country’s aging population, among other pressures, call for a gradual buildup in the fiscal position. The government is targeting fiscal balance by 2014, if not sooner.
Summarizing the above considerations, GDP growth is likely to remain slightly below potential in the short term (Figure 3.11.11). Although domestic demand will help cushion some of the loss of momentum since the exceptional growth in 2010, the recovery will be gradual—tracking the global outlook.
The main short-term downside risk for the economy stems from the eurozone’s sovereign debt issue: the speed and effectiveness of its resolution bear heavily on the global outlook and hence prospects for Korean exporters. If the situation deteriorates into another global financial crisis, exports and GDP growth would be hard hit, as in 2008–2009. Alternatively, if the eurozone crisis is resolved faster and better than expected, growth could surprise on the upside.
Another source of external uncertainty is the potential impact on global oil prices of Middle Eastern geopolitical tensions. Concern over the change of political leadership in the Democratic People’s Republic of Korea has abated. A domestic risk is the high and growing level of household debt.
Policy challenge—household debtHousehold debt has continued to climb rapidly, despite regulatory efforts. However, the current surge in household debt appears to be driven by financing of consumption rather than purchases of homes, and the ratio of nonhousing to housing loans is rising (Figure 3.11.12). Further, household debt rose by 9% in 2011 whereas financial assets and real
3.11.9 Potential versus actual GDP, Q1 2007–Q3 2011
220
240
260
280
Q111
Q110
Q109
Q108
Q12007
Won trillion
Actual
Potential
Source: LG Economic Research Institute.
3.11.10 Household debt-to-GDP ratio
55
60
65
70
75
Q111
Q110
Q109
Q108
Q107
Q106
Q12005
%
Sources: Bank of Korea. Economic Statistics System. http://ecos.bok.or.kr; ADB estimates.
3.11.11 GDP growth
0
2
4
6
8
1312111009082007
5-year moving average
%
ForecastSources: Bank of Korea. Economics Statistics System. http://ecos.bok.or.kr (accessed 1 February 2012); ADB estimates.

Economic trends and prospects in developing Asia: East Asia Republic of Korea 145
estate owned by households went up by only 7.1%. This supports the view that households, in response to shrinking real disposable incomes, are borrowing more to finance consumption. It is expected that increases in household debt will slow in 2012, as the financial authorities are likely to clamp down on household borrowing to protect the soundness of the financial sector. The weak housing market will weigh on household loans and should act to help constrain the growth of household debt.
High and growing household debt may be a domestic risk for the economy, but the probability of it causing a macro financial crisis is quite small. The ratio of nonperforming household loans stood at 0.8% at end-2011. The banking sector’s improved profitability and stronger capacity to absorb losses further reduces the likelihood of a financial crisis. Stringent loan-to-value regulations minimize the risk of a vicious cycle of falling housing prices and rising numbers of nonperforming loans. Household debt repayment pressures still affect macroeconomic performance though, because they crimp disposable income, private consumption, and aggregate demand.
Household debt also seriously affects certain groups of households and components of the financial sector. Low-income households may face financial difficulties for two reasons. First, slow economic and hence income growth limits their repayment capacity. Second, repayment pressures are likely to intensify owing to government efforts to rein in household debt. Financial institutions will become more cautious in rolling over loans and demand quicker repayment of the principal. For households in the bottom 20% by income, the ratio of debt to disposable income rose sharply in 2011 (Figure 3.11.13). Low-income households earning less than 20 million won annually accounted for about 40% of total loans, and these loans are more at risk of becoming nonperforming.
A related area of concern is the so-called secondary financial sector. This sector consists of financial institutions that deal extensively with borrowers with poor credit ratings and that have only limited capacity to absorb losses. The ratio of subprime loans and nonperforming loans has already risen sharply for these institutions. If the risk premium rises in response, borrowers’ repayment ability will decline, setting in train a potentially intensifying cycle of nonrepayment by borrowers and worsening balance sheets in the secondary financial sector.
In 2011, authorities introduced several measures to address household debt. These included reinstatement of debt-to-income limits for mortgage loans and various measures to ensure low-income households’ access to loans through the primary financial sector. While these measures are encouraging, authorities will need to closely monitor the growth of household debt, especially loans from the secondary financial sector to low-income households, and to take further cautionary measures.
3.11.12 Share of nonhousing loans
35
40
45
50
H111
H2H110
H2H12009
%
Source: LG Economic Research Institute.
3.11.13 Debt to disposable income, households in the bottom 20 by income
0.0
0.5
1.0
1.5
2.0
2.5
20112010
Ratio
Source: LG Economic Research Institute.

Mongolia
Medium-term economic prospects are excellent, with a very large mining project expected to begin production early next year and another in the initial stage of development. Growth has been driven both by the booming mining sector and by too rapidly increasing government expenditure. There are signs of overheating, reflected in double-digit inflation. As already scheduled by the government, a substantial fiscal reserve needs to be built so as to protect against contingencies, including a drop in global commodity prices.
Economic performanceThe economy grew by 17.3% in 2011, driven mainly by infrastructure spending related to mining activity (Figure 3.12.1). Gross capital formation increased by about 60%, including for equipment, buildings and intermediate goods, and public infrastructure. Investment in the world-
mine is nearing commercial production.Domestic consumption was another important driver, rising by 14.5%
in real terms. Private consumption was up strongly, supported by rising employment and incomes.
A surge in exports, almost entirely to the People’s Republic of China (PRC), was driven by increases in the volume and value of coal output. Imports, however, surged even more, largely reflecting the equipment and machinery needs of mining. Net exports were negative and, therefore, heavily reduced the national accounts measure of overall growth.
Economic growth primarily originated in mining, but was quite broad-based (Figure 3.12.2). Domestic trade (wholesale and retail) rose by 42.5%, stimulated by large government cash payments to all citizens. Mining rose by 8.7%, manufacturing by 16.0%, and construction by 14.3%. Agriculture, which accounts for more than a third of total employment, increased by only 0.3%—disappointing progress in view of the sharp contraction in 2010. While official unemployment was less than 5%, labor force surveys indicate that the overall rate was about 9%, down from 13% at end-2010.
Macroeconomic management of the economy has been mixed. The government completed successfully a stand-by arrangement with the International Monetary Fund in October 2010 but since then fiscal policy has become more expansionary and pro-cyclical. Government expenditure in fiscal 2011 (1 January–31 December) surged by 55.6% to the equivalent of 44.2% of GDP as spending on social transfers, wages and cash transfers surged. Government revenue jumped by 40.9%, supported by sharply higher receipts from import duties on mining-related equipment and corporate and personal income taxes.
3.12.1 Contributions to growth (demand)
-21
0
21
42
2010 2011
Percentage points Total investmentsGDP Total consumption
Net exports
Source: National Statistics Office of Mongolia 2011. Monthly Statistical Bulletin. December. http://www.nso.mn
This chapter was written by Jan Hansen and Amar Lkhagvasuren of the Mongolia
Resident Mission, ADB, Ulaanbaatar.
3.12.2 Contributions to growth (supply)
10.2 8.9
-1.3
6.4
17.3
-6
0
6
12
18
2007 08 09 10 11
Percentage points ServicesIndustryAgricultureGDP
Source: National Statistics Office of Mongolia 2011. Monthly Statistical Bulletin. December. http://www.nso.mn

Economic trends and prospects in developing Asia: East Asia Mongolia 147
Late in the year, Parliament amended the budget to raise revenue and expenditure—by some 20% over the initial budget estimates for both revenue and expenditure. Compounding the inflationary effects of the spending increase, 20% of total budgetary expenditures were in December. The budget deficit was the equivalent of 3.6% of GDP, compared with a small surplus in 2010 (Figure 3.12.3). While excess mineral revenues were placed in a stabilization fund, as provided for by the Fiscal Stability Law (FSL) adopted in 2010, the overall budgetary framework was inappropriate for 2011 given the inflationary pressures.
The Bank of Mongolia (the central bank) tightened monetary policy throughout the year. It increased the reserve requirement for banks from 5% at the start of 2011 to 11% in August. It has raised the policy rate four times since early 2010 by a total of 1.75 percentage points to 12.75% by year-end. Adjusting for inflation, the slightly positive real interest rate indicates a modest contractionary monetary policy stance, although insufficient to offset excessive fiscal stimulus.
The official exchange rate of the local currency (the togrog) against the US dollar depreciated by about 11% during August–December 2011, reflecting global risk aversion and declining commodity prices, which similarly affected the currencies of other emerging, mineral-rich economies. The real effective exchange rate of the togrog was broadly stable over the year (Figure 3.12.4).
The institutional framework for monetary policy has been strengthened. The broadly flexible exchange rate system adopted since 2009 helps control inflation, provides an absorber against external shocks, and facilitates the real exchange rate changes that are likely to take place over the medium term in view of the rapid growth of the mineral sector. The new Central Bank Law, enacted in early 2010, mandates the Bank of Mongolia to concentrate solely on price stability. The real effective exchange rate does not seem to be out of line with medium-term fundamentals.
Broad money supply (M2) grew by nearly 40% through December 2011, too rapidly given the need to restrain inflationary pressures. The commercial banking system in Mongolia has structural weaknesses, with weak supervision and regulation. Several small to medium sized banks are highly vulnerable. Year-on-year bank lending was up by more than 70% in December. The rapid acceleration in bank lending is fueling aggregate demand, heightening the vulnerability of banks and putting stress on the financial system.
For the year as whole, inflation was 9.2%, but varied widely with fluctuations in food prices and increased to 10.2% in December year on year (Figure 3.12.5). Inflation in Mongolia is volatile, making it hard to discern underlying inflationary pressures, which is crucial for guiding macroeconomic policy. The drop in inflation in early 2011 was largely due to a decline in meat prices through government-managed sales of meat reserves at below-market prices. (Meat constitutes about 40% of the food basket.) Core inflation (excluding food and energy) averaged 9.7%, indicating overheating of the economy.
External trade soared in 2011. The value of exports, largely minerals,
3.12.3 Fiscal indicators
-40
-20
0
20
40
60
-6
-3
0
3
6
9
Fiscal balanceSpendingRevenue
111009082007
% growth % of GDP
Note: 2011 revenue includes infusion from Stabilization Fund.
Sources: National Statistical Office. 2012. Monthly Bulletin.
January. http://www.nso.mn
3.12.4 Exchange rate
600
900
1,200
1,500
1,800
0
100
200
300
400
Real effective Monthly average
Feb12
JulJan11
JulJan10
JulJan09
JulJan08
JulJan2007
MNT/$ Dec 2005 = 100
Source: CEIC Data Company (accessed 22 March 2012).
3.12.5 Monthly Inflation
-6
0
6
12
18
24
DecJulJan11
JulJan10
JulJan2009
%
Source: Bank of Mongolia. 2012. Statistical Bulletin. January. http://www.mongolbank.mn
3.12.6 Global prices of main exports
70
140
210
280
350
Feb12
JulJan11
JulJan10
JulJan09
JulJan08
JulJan2007
Jan 2005 = 100
CopperCoal
Source: International Monetary Fund. Primary Commodity Prices. http://www.imf.org (accessed 22 March 2012).

148 Asian Development Outlook 2012
purchases of equipment for mining as well as higher prices for oil and food.
to about 30.0% of GDP in 2011 (as against 14% of GDP in 2010). The main source of financing of the current account deficit was foreign direct
Economic prospectsThe economy is forecast to continue growing at double digit rates: 15.0% in 2012 and 17.5% in 2013. The drivers of growth are expected to remain the same, notably mining-related investment and output. Commercial production from the Oyu Tolgoi mine is scheduled to begin in early 2013, accounting for the boost in growth that year. The time frame for developing the Tavan Tolgoi coal deposit, one of the world’s largest untapped reserves, is less certain. Growth is likely to be further supported by strong growth in construction and services activity associated with mining, and by rising government spending.
With an estimated budget deficit of 1.0% in 2012, fiscal policy is expected to remain pro-cyclical. Government revenue is projected to rise by about 40% and expenditure by about 32%. Contingent liabilities may also increase significantly, reflecting the government’s guarantee of bond issuances by the Development Bank of Mongolia and scheduled public–private projects. Under the amendments to the Social Welfare Law enacted in January 2012, a means-tested poverty benefit will be introduced at midyear, replacing the universal cash transfers from the Human Development Fund. This represents a major step toward setting up a fiscally sustainable social protection system while supporting the poor.
Inflation is expected to remain in double digits—15.0% in 2012 and 12.0% in 2013—owing to very high public spending and large pay rises for public-sector workers in 2012, as well as the emergence of supply bottlenecks in the mining industry and shortages in the labor market (Figure 3.12.7). Adherence to the FSL, in particular the phasing out of cash payments in mid-2012, will put the central bank in a better position to contain inflation in 2013. If, however, public spending growth does not moderate (as prescribed by the FSL), inflation may continue to accelerate beyond 2012. The recent exchange rate depreciation will further stoke inflationary pressure due to the high import content of consumer goods.
Monetary policy may need to play a more active role in countering inflationary pressures. The central bank’s target for 2012 is an inflation rate below 10%, which will require further tightening of monetary policy. Containing credit growth, which is increasing systemic risks in the banking sector, will require strict enforcement of prudential regulation.
Export growth is projected to be robust in the forecast period, based on strong demand from the PRC and continued high commodity prices. Export earnings will also be boosted when the Oyu Tolgoi mine starts commercial production.
Imports will continue to be driven by investments linked to mining and strong growth in private consumption. As new mines come on stream and mineral exports surge, the current account deficit is expected to narrow to an estimated 25.0% and 15.0% of GDP in 2012 and 2013 (Figure 3.12.8).
3.12.1 Selected economic indicators (%)
2012 2013
GDP growth 15.0 17.5
Inflation 15.0 12.0
Current account balance (share of GDP)
-25.0 -15.0
Source: ADB estimates.
3.12.7 Inflation
0
6
12
18
24
30
1312111009082007
%
Forecast
5-year moving average
Source: Asian Development Outlook database.
3.12.8 Current account and trade indicators
-30
-15
0
15
30
-12
-6
0
6
12
2007 08 09 10 11 12 13
% of GDP$ billion
Current accountbalanceImports
Exports
Sources: Bank of Mongolia. 2012. Balance of Payments Report. January. http://www.mongolbank.mn; ADB estimates.

Economic trends and prospects in developing Asia: East Asia Mongolia 149
With committed investments for the Oyu Tolgoi mine and pre-operation activities related to the Tavan Tolgoi mine, foreign direct investment is set to remain high and to fully finance the current account deficit.
Downside risks to the forecast reflect Mongolia’s small, open, mining-dependent economy. Because of the heavy dependence on mineral development and exports, and associated government revenue, the current account and state finances are highly vulnerable to commodity price fluctuations. Another risk is the possibility of a sharp slowdown in the PRC’s growth, the destination for more than 90% of exports.
Domestically, weak corporate governance and regulation and supervision have resulted in the banking sector being vulnerable to external shocks; it could—as during the 2008–2009 crisis—generate severe financial stress.
Policy challenges—institutional strengthening and public finance management
Worldwide, countries have shown that, paradoxically, an abundance of natural resources can hinder their long-term development by increasing macroeconomic volatility, thus reducing incentives to invest in physical and human capital and undermining economic and political institutions. Resource dependence often leads to widening income disparities, as resource extraction creates relatively few jobs and a small proportion of the population may secure most of the income.
Mongolia, which historically had comparatively balanced income distribution, has in recent years seen a clear trend toward increasing inequality that could undermine its social cohesion and stability. An important medium-term challenge will be to improve its economic and political institutions so as to ensure transparent, accountable and equitable management of natural resource revenue.
Macroeconomic management of an economy characterized by very rapid development of its natural resources often leads to what is called “Dutch Disease”—that is, high inflationary pressures, upward pressure on the exchange rate, crowding out of the private sector, and increasing vulnerability to external shocks. Recognizing the possible risks, the government strengthened the legal framework for fiscal policy and budget management through enactment of the FSL (in June 2010) and the Integrated Budget Law in early 2012.
The FSL aims to ensure that mining revenues are better managed by putting in place three complementary rules (Box 3.12.1). The FSL—if properly enforced—will make an important contribution to insulating fiscal policy from commodity price shocks and smoothing the economy’s adjustment to higher mineral output. In turn, conservative management of fiscal resources will facilitate development of the nonmineral economy.
While the 2012 government budget appears to be overly expansionary, the authorities are expressing their commitment to the FSL. The Integrated Budget Law is a comprehensive law which aims to reform the entire budget process, from investment planning to budget execution and auditing, and puts in place a new framework for fiscal decentralization. It is vital that both these laws be implemented in spirit and practice.
3.12.1 Fiscal rules for budget discipline
Good fiscal policy is critical for helping to ensure that mineral wealth contributes to sustainable economic prosperity. The Fiscal Stability Law will promote needed budget discipline through three fiscal rules:
Ceiling on structural budget deficit of 2% of GDP. The structural deficit adjusts the budget deficit to take account of trends in major mineral prices (currently copper and coal) and their impact on government revenues. The structural balance is calculated by using the moving average price of major minerals over 16 years (past 12 years, current year, and future 3 years). This provision takes effect in 2013.Ceiling on expenditure growth. Spending growth that is too fast leads to overheating and inflation and, from a budget perspective, is difficult to manage efficiently. The ceiling is the greater of the non-mineral GDP growth rate of the particular year or the average of the non-mineral GDP growth rate for the 12 consecutive preceding years. This provision takes effect in 2013.Net present value of public debt must not exceed 40% of GDP. This provision takes effect from 2014, with a transition period specified for the preceding years. It excludes any borrowing in which the government has agreed to contribute into the paid-in capital of a foreign mining entity and which is repayable from the future profits of the entity.

Taipei,China
Forward-looking business indicators are now more positive than in late 2011 but weak global conditions will limit export growth in this trade-heavy economy. Domestic demand should continue to provide a relatively strong base, supported by rising incomes reaching around US$21,000 per capita this year. A gradually improving global outlook will boost growth in 2013, but longer term, increased R&D and investment is needed to secure broad-based, stable growth through diversification and restructuring of the economy.
Economic performanceFollowing the post-recession rebound, economic growth slowed to 4.0% in 2011 (Figure 3.13.1). Growth decelerated to 1.9% in the fourth quarter, reflecting the slump in gross capital formation and investor concerns about the global outlook.
Positive net exports accounted for most of the increase in output, despite weak external demand, as the slowdown in exports was less marked than that for imports.
Domestic demand was mixed, as domestic consumption was relatively strong but investment declined. Private consumption rose by 3.0% in 2011, supported by robust job growth, low unemployment (4.4%), and rising earnings. Government consumption picked up by about 2%. Private investment, however, fell by 2.3%, more sharply so in the second half of the year as business enterprises, especially in electronics, put their investment plans on hold. Public investment declined even faster, by 8.4%, as stimulus-related infrastructure outlays were gradually completed (Figure 3.13.2).
Growth was almost evenly distributed between industry and services. The former grew by 4.4% for the year—in contrast to 2010 when it jumped by 23%—slowing sharply in the fourth quarter. Manufacturing rose by 4.9% but construction activity was flat, in line with a slowing property market. Services saw modest gains in wholesale and retail trade, finance and insurance, information and communications, and strong gains in hotel and restaurant services. Agriculture grew by 1.9%, but accounts for less than 2% of GDP.
Inflation of 1.4% was well within the central bank’s target. Measures to curb mortgage lending, as in the previous year, continued to slow residential property price increases. The appreciating local currency against the United States (US) dollar—up 7.4% through end-December 2011, taking it to near the rate before the global financial crisis—also helped curb inflation.
Monetary policy continued tightening in 2011 (Figure 3.13.3). However, from September 2011 the central bank kept the discount rate
3.13.1 Contributions to growth (demand)
6.0
0.7 -1.8
10.7
4.0
-6
0
6
12
2007 08 09 10 11
Percentage pointsPrivate consumptionGovernment consumptionGDP
Net exportsTotal investment
Source: Directorate-General of Budget, Accounting and Statistics. http://eng.stat.gov.tw (accessed 15 March 2012).
This chapter was written by Shiela Camingue of the Economics and Research
Department, ADB, Manila.
3.13.2 Growth in gross capital formation
-20
0
20
40
PrivatePublic
111009082007
%
Sources: Directorate-General of Budget, Accounting and Statistics. http://eng.stat.gov.tw; CEIC Data Company (both accessed 15 March 2012).

Economic trends and prospects in developing Asia: East Asia Taipei,China 151
unchanged at 1.875%, as concerns mounted about the risk of another global economic slowdown. Money supply and bank credit expansion climbed only slowly, although loans to the private sector increased faster than in 2010, at 8.1%.
Fiscal policy remained accommodative, with a deficit of 2.5%. Overall government expenditure increased by 4.4%, reflecting rising social welfare payments and development-related initiatives. Revenue rose by 10%, supported by a healthy rate of expansion in nominal GDP. Public debt is projected to rise to the equivalent of 37% of GDP, still below the limit of 40% set by law.
Trade decelerated (Figure 3.13.4). Growth of goods exports slowed to 12.1%, on a combination of weakening external demand and adjustment from the unsustainable 34.6% postcrisis rebound of 2010. Exports to advanced countries slumped while developing Asian markets remained relatively strong. In particular, the Economic Cooperation Framework Agreement with the People’s Republic of China (PRC) resulted in rapid growth in exports of products included under the Early Harvest Program.
Merchandise import growth contracted to 13.0% from 43.1% in 2010, as imports of capital goods fell sharply. The trade surplus increased by
The services account was in surplus, boosted by strong growth in tourist arrivals from the PRC. The income account remained positive as repatriated profits and dividends from Taipei,China’s investments abroad exceeded its payments to nonresidents. A current account surplus of
mainly to firm expansions abroad and relocation of less advanced parts of the manufacturing base to the PRC (Figure 3.13.5). Portfolio
the previous year, reflecting both concern about the global outlook and safe-haven capital flight. The decline in the capital account more than offset the rise in the current account, bringing foreign reserves down to 82.6% of GDP, from 89% in 2010.
Economic prospectsGrowth is forecast to slow further in 2012 to an annual 3.4%, on the uncertain world outlook and moderating rate of expansion of the PRC, the island’s largest trading partner. Improvement to 4.6% is forecast for 2013, as both domestic and external demand strengthen.
Growth of exports of goods is forecast to weaken to about 4% in 2012, or a third of the year-earlier rate. Exports of services will be more robust, growing by more than 7%, supported by greater tourist arrivals from the PRC as visa restrictions are relaxed further. Continued growth of exports to developing Asian markets in 2012 and 2013 will compensate in part for the slow growth of exports to developed countries.
Imports of goods and services will also slow sharply, but less so than exports, in part because of the rising cost of oil imports. Net exports will remain positive. Both exports and imports will strengthen as the economy strengthens in the latter half of 2012 and into 2013. The current
3.13.3 Credit indicators
-1
0
1
2
3
4
-3
0
3
6
9
12
M2 growthPolicy ratePrivate credit growth
DecJulJan11
JulJan10
JulJan09
JulJan2008
% %
Source: CEIC Data Company (accessed 16 March 2012).
3.13.4 Trade indicators
-6
0
6
12
-50
0
50
100
Import growthExport growth
Trade balance
Q3 Q111
Q3 Q110
Q3 Q109
Q3 Q108
Q3 Q12007
$ billion %
Sources: Directorate-General of Budget, Accounting and Statistics. http://eng.stat.gov.tw; CEIC Data Company (both accessed 15 March 2012).
3.13.5 Net investment flows
-45
-36
-27
-18
-9
0
PortfolioDirect
111009082007
$ billion
Sources: Directorate-General of Budget, Accounting and Statistics. http://eng.stat.gov.tw; CEIC Data Company (both accessed 15 March 2012).

152 Asian Development Outlook 2012
account surplus is expected to decline to about 8.0% of GDP for this year and next.
Private consumption is forecast to increase by 2.5% this year, supported by relatively low unemployment, low interest rates, and recovering consumer confidence (Figure 3.13.6), which had fallen at end-2011 following cutbacks in overtime work and encouragement for employees to take leave.
Investment is expected to register little growth in 2012, reflecting the high degree of uncertainty about global demand for information-technology products. Opening the semiconductor and flat-panel subsectors to foreign investment (announced in March 2011) has so far not met expectations. However, another round of liberalization, which began in March 2012, together with the expected gradual resurgence of growth in the US and other major markets, should lead to a pickup in investment later this year and during 2013.
The National Development Plan for 2012, announced in December 2011, is also expected to lift investment in the second half of 2012 and in 2013.
Fiscal policy, however, will be less stimulative than last year. Overall expenditure is budgeted to drop marginally, as spending under the Special Budget will fall to almost zero—with the winding up of crisis measures in response to the 2009 typhoon and the stimulus measures related to the 2008–2009 recession. Revenue is expected to increase by 5%, resulting in a narrowing of the deficit to about 1–2% of GDP, consistent with the government’s policy of gradual fiscal consolidation.
Inflation is expected to remain little changed in 2012 and 2013, at 1.5% and 1.6%. Oil prices are forecast to be marginally higher than last year but slow growth, both domestically and internationally, will in general ease commodity and other prices, including those for food. Property prices have started to decelerate, a result of the monetary authority’s policies on curbing speculative activities. The upsurge in consumer prices in December–January is considered a short-term aberration, attributable to bad weather and increased demand during the Chinese New Year.
In January, authorities announced that investors from the PRC would be allowed to acquire stakes in local banks and financial holding companies, helping the local stock market rise (by 14%) and the national currency to appreciate against the US dollar (by 2.5%) from end-2011 to mid-March 2012. Uncertainties about the global economy will, however, encourage the central bank to closely monitor exchange rate movements and to keep interest rates at their current levels, while ensuring that inflation stays in check. Monetary policy is expected to tighten in 2013.
Risks to the economic forecast stem primarily from the eurozone sovereign debt crisis and the consequences for the global economy if it were to deepen. Another risk is instability in the Middle East, with the possibility of an oil spike and derailment of economic recovery in the US and elsewhere.
3.13.1 Selected economic indicators (%)
2012 2013
GDP growth 3.4 4.6
Inflation 1.5 1.6
Current account balance (share of GDP)
8.1 7.9
Source: ADB estimates.
3.13.6 Consumer confidence
40
60
80
100
Feb12
Jan11
Jan10
Jan09
Jan08
Jan2007
Index
Source: CEIC Data Company (accessed 15 March 2012).
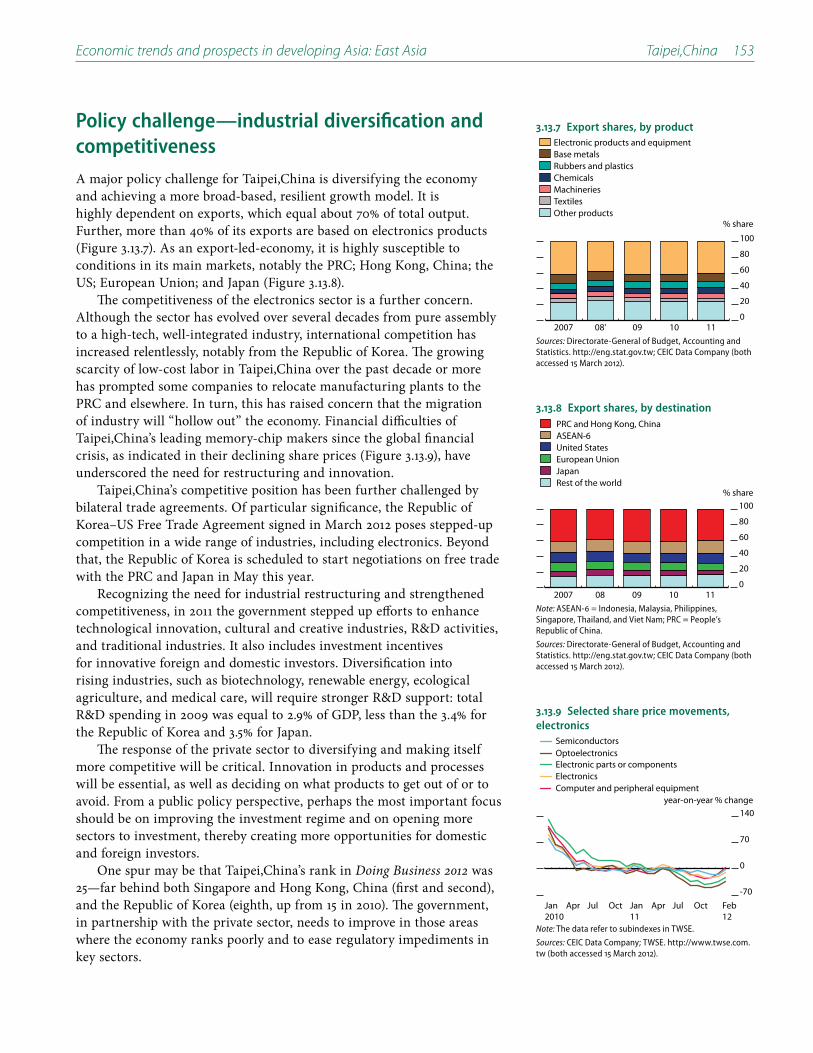
Economic trends and prospects in developing Asia: East Asia Taipei,China 153
Policy challenge—industrial diversification and competitiveness
A major policy challenge for Taipei,China is diversifying the economy and achieving a more broad-based, resilient growth model. It is highly dependent on exports, which equal about 70% of total output. Further, more than 40% of its exports are based on electronics products (Figure 3.13.7). As an export-led-economy, it is highly susceptible to conditions in its main markets, notably the PRC; Hong Kong, China; the US; European Union; and Japan (Figure 3.13.8).
The competitiveness of the electronics sector is a further concern. Although the sector has evolved over several decades from pure assembly to a high-tech, well-integrated industry, international competition has increased relentlessly, notably from the Republic of Korea. The growing scarcity of low-cost labor in Taipei,China over the past decade or more has prompted some companies to relocate manufacturing plants to the PRC and elsewhere. In turn, this has raised concern that the migration of industry will “hollow out” the economy. Financial difficulties of Taipei,China’s leading memory-chip makers since the global financial crisis, as indicated in their declining share prices (Figure 3.13.9), have underscored the need for restructuring and innovation.
Taipei,China’s competitive position has been further challenged by bilateral trade agreements. Of particular significance, the Republic of Korea–US Free Trade Agreement signed in March 2012 poses stepped-up competition in a wide range of industries, including electronics. Beyond that, the Republic of Korea is scheduled to start negotiations on free trade with the PRC and Japan in May this year.
Recognizing the need for industrial restructuring and strengthened competitiveness, in 2011 the government stepped up efforts to enhance technological innovation, cultural and creative industries, R&D activities, and traditional industries. It also includes investment incentives for innovative foreign and domestic investors. Diversification into rising industries, such as biotechnology, renewable energy, ecological agriculture, and medical care, will require stronger R&D support: total R&D spending in 2009 was equal to 2.9% of GDP, less than the 3.4% for the Republic of Korea and 3.5% for Japan.
The response of the private sector to diversifying and making itself more competitive will be critical. Innovation in products and processes will be essential, as well as deciding on what products to get out of or to avoid. From a public policy perspective, perhaps the most important focus should be on improving the investment regime and on opening more sectors to investment, thereby creating more opportunities for domestic and foreign investors.
One spur may be that Taipei,China’s rank in Doing Business 2012 was 25—far behind both Singapore and Hong Kong, China (first and second), and the Republic of Korea (eighth, up from 15 in 2010). The government, in partnership with the private sector, needs to improve in those areas where the economy ranks poorly and to ease regulatory impediments in key sectors.
3.13.8 Export shares, by destination
0
20
40
60
80
100
PRC and Hong Kong, ChinaASEAN-6United StatesEuropean UnionJapanRest of the world
111009082007
% share
Note: ASEAN-6 = Indonesia, Malaysia, Philippines, Singapore, Thailand, and Viet Nam; PRC = People’s Republic of China.
Sources: Directorate-General of Budget, Accounting and Statistics. http://eng.stat.gov.tw; CEIC Data Company (both accessed 15 March 2012).
3.13.9 Selected share price movements, electronics
-70
0
70
140
Optoelectronics
Computer and peripheral equipment
Semiconductors
Electronic parts or componentsElectronics
Feb12
OctJulAprJan11
OctJulAprJan2010
year-on-year % change
Note: The data refer to subindexes in TWSE.
Sources: CEIC Data Company; TWSE. http://www.twse.com.tw (both accessed 15 March 2012).
3.13.7 Export shares, by product
0
20
40
60
80
100
Electronic products and equipmentBase metalsRubbers and plasticsChemicalsMachineriesTextilesOther products
11100908'2007
% share
Sources: Directorate-General of Budget, Accounting and Statistics. http://eng.stat.gov.tw; CEIC Data Company (both accessed 15 March 2012).
South Asia
Afghanistan
Bangladesh
Bhutan
India
Maldives
Nepal
Pakistan
Sri Lanka

Afghanistan
Full responsibility for security is to be handed over to the government by end-2014 as international troops are withdrawn. Since economic development (as well as security) has depended heavily on aid and international military spending, the transition will require the country to find new sources of growth and ways to achieve fiscal sustainability, in an uncertain security environment. These challenges will require major domestic efforts and reforms alongside substantial external support by donors if development momentum is to be sustained.
Economic performanceGDP growth is estimated to have slowed to 5.7% in FY2011 (ending 20 March 2012)—following an 8.4% expansion the previous year—mainly because of a large fall in agricultural foodgrain production owing to unfavorable weather conditions for a second year (Figure 3.14.1).
Private consumption remained the main source of economic growth, fueled by the large aid inflows that underpin most of the demand for goods and services. Growth in services activity, which accounted for 53% of GDP, moderated during the year, reflecting lower foreign inflows. Domestic investment is estimated at 22.6% of GDP, including private investment of just over a third of that.
Opium production increased by 61% in 2011, rebounding from a disease the year earlier that wiped out much of the crop, and farmers responded to high prices offered by traffickers. Farm income for opium in
part of GDP, but earnings generated by it and then retained and spent in the country boost domestic demand.
Consumer prices are highly volatile because of heavy import dependence, including food and fuel (Figure 3.14.2). Overall (year-on -year) inflation, which peaked at 18.2% in January 2011, receded to 9.2% in February 2012, mainly due to a fall in food inflation, which dropped from 21.0% to 7.1% mainly because of declining global food prices. Nonfood inflation was fairly stable in this period—varying around 14%—kept high by price adjustments for electricity and fuel, construction materials, transport, and housing rents. Average inflation in FY2011 is estimated at 10.5%.
Revenue collection is estimated to have met the FY2011 budget target of AF98.8 billion (11.5% of GDP), reflecting tax administration reforms, improved tax compliance, and new tax measures such as a business receipts tax (Figure 3.14.3). Operating expenditure is estimated to have increased by 37.0% in FY2011, mainly because of growing security expenditure taken on to the budget and rapid implementation of pay and grading reforms for civil servants. Domestic revenue coverage of
3.14.1 GDP growth
-20
0
20
40
60
ServicesIndustryAgricultureGDP
111009082007
%
13.75.78.4
21.0
3.6
Source: Ministry of Finance.
This chapter was written by Rehman Rahmani of the Afghanistan Resident Mission,
ADB, Kabul.
3.14.2 Kabul inflation
-25
0
25
50
75
NonfoodFoodOverall
Feb12
Jul Jan11
Jul Jan10
Jul Jan09
Jul Jan2008
%
Sources: Central Statistical Office of Afghanistan; Da Afghanistan Bank.

156 Asian Development Outlook 2012
operating expenditure therefore fell, to about 65% from 73% a year earlier; the balance of operating expenditure was financed through donor grants.
The government tightened its policy on new project additions to the development budget in view of the low execution rate, which has been a major concern for the government and donors in recent years. The government has been struggling to meet its budgetary targets to achieve the Millennium Development Goals, for example.
The central bank adopted a relatively tight monetary policy during FY2011 to contain inflation pressures, although they largely stemmed from global price increases. Growth in currency in circulation was cut by nearly half to 17.8% from 34.2% in FY2010. The afghani remained broadly stable in real effective terms; it depreciated by about 8% against the dollar during FY2011 (Figure 3.14.4).
The current account deficit (excluding grants) is estimated to have narrowed by about 5.5% of GDP to a deficit of 34.3% of GDP in FY2011 (Figure 3.14.5). The narrowing trend reflects the fact that grant financing
recent years but is falling in relation to a growing nominal GDP. Including grants, the current account is expected to run a surplus of 0.1% of GDP in FY2011, down from the 1.7% surplus in FY2011 due to a much smaller expansion in exports. The financial account improved slightly on increased foreign direct investment as a result of initial investment in mining industry. Gross international reserves are estimated to have
Economic prospectsEconomic activity will continue to be driven mainly by consumption expenditure and is expected to pick up to 7.1% in FY2012 (assuming more favorable weather for agriculture). A slowdown to 5.8% is expected in FY2013, though, because of declining local spending from foreign security forces as they gradually withdraw and waning grant-financed development spending that is not channeled through the government budget. An economic program with the IMF under its Extended Credit Facility was agreed in November 2011 and it provides an overall macroeconomic adjustment framework for the next 3 years, as well as guidance to reform banking regulations after the failure of Kabul Bank (Box 3.14.1).
The government’s operating budget deficit will come under pressure in the next 2 years because of increases in security spending, continuing pay and grading reforms in the civil service, absorption of the public servants paid by donors, and operation and maintenance cost of projects handed over by donors. Projections indicate that recurrent spending will rise to 18.6% of GDP, while domestic revenues will stay at about 11.5% of GDP over the next 2 years, thus domestic revenue will fall by another 3 percentage points to finance about 62% of recurrent expenditures. Increases in operating and development grants, however, are expected to keep total budget expenditure higher at over 25% of GDP in FY2012 and FY2013, or about 1.5–2 percentage points above that in FY2011.
Monetary policy aims to bring down inflation to about 5% in the next 2 years. While the main drivers of prices are external and out of direct control, the Asian Development Outlook 2012 baseline assumes broadly
3.14.3 Domestic revenue and operating expenditure
% of GDP
0
5
10
15
20
Operating expenditure
NontaxTax
Domestic revenue
111009082007Source: International Monetary Fund. 2011. Country Report No. 11/330. November. http://www.imf.org
3.14.4 Nominal exchange rate
52
50
48
46
44
Feb12
OctApr11
OctApr10
OctApr09
OctApr2008
AF/$
Source: Da Afghanistan Bank. http://www.centralbank.gov.af
3.14.5 Current account balance
-80
-60
-40
-20
0
20
Current account balance (excluding grants)Current account balance (including grants)
1312111009082007
% of GDP
ForecastSource: International Monetary Fund. 2011. Country Report No. 11/330. November. http://www.imf.org
3.14.1 Selected economic indicators (%)
2012 2013
GDP growth 7.1 5.8
Inflation 4.6 5.0
Current account balance (share of GDP)
-1.1 -2.5
Source: ADB estimates.

Economic trends and prospects in developing Asia: South Asia Afghanistan 157
stable global commodity prices, indicating that this objective is attainable. The monetary authorities also intend, as in the past, to operate to smooth out volatility in the exchange rate and strengthen international reserves. Donors’ projected substantial, though declining, aid inflows will facilitate meeting these objectives.
Foreign aid will continue to finance most of the balance-of-payments deficit, though pressures here will begin to emerge in the next 2 years. The current account deficit (excluding grants) as a share of GDP is projected to fall to 33.2% in FY2012 to 31.5% in FY2013 as responsibility for security is handed over to the government. Mainly because of reduced (export) sales to nonresidents and also some fall off in public grants, the current account balance (including grants) will turn to a deficit estimated at 1.1% of GDP in FY2012 and 2.5% of GDP in FY2013. Because domestic exports are so small, the country has very limited debt-carrying capacity and will be forced to rely on foreign direct investment and highly concessional loan assistance to cover these deficits.
Policy challenge—coping with the transitionThe planned foreign troop pullout by end-2014 is seen lowering annual growth by at least 2–3 percentage points after that date, due to reduced local spending by these forces and by foreign civilian organizations with international and national staff. Unemployment will go up when local staff hired by foreign security and civilian organizations are laid off.
The fiscal impact of the transition will come mainly from increasing pressure on the government to take over externally financed operating expenditures (security and nonsecurity); declining grants to the government’s development budget; and donors’ continuously declining externally financed development budgets (some of their projects will be brought on budget). Over the next 10 years, fiscal policy will have to balance the takeover of externally financed security spending and other expenditures, while increasing propoor and development outlays within a very tight budget constraint. The transition will lead to limited fiscal space, thereby pushing back fiscal sustainability (defined as domestic revenue funding the government’s recurrent expenditure). Without sustained, high grant assistance, the concept of fiscal sustainability is reduced to fiscal survival.
Afghanistan’s debt burden could rise substantially in the near future. Current public sector debt is around 12.1% of GDP, but with a heavy reliance on external grants to finance its budget, a rapid reduction in grants could require the government to assume new loans to meet its financing needs. A worsening security environment could exacerbate these financing requirements and reduce the government’s ability even to collect domestic revenue.
The external sector will be affected through pressures on the current account balance and the exchange rate due to declining aid inflows. But a weak policy, regulatory, and institutional framework seems to be more challenging for Afghanistan’s competitiveness than the exchange rate, as shown by the World Bank’s Doing Business Report 2012. Afghanistan stands at 160 out of 183 countries, showing further degradation from 154 the previous year.
3.14.1 Kabul Bank crisis update
Fraudulent loans came to light at Kabul Bank, the largest bank in the country, in September 2010, triggering a run on deposits. The central bank initially placed the bank under conservatorship, appointed new management and guaranteed all deposits. Subsequently, Kabul Bank was placed under receivership and its assets have been split into “good” and “bad” banks.
The bank’s deposits and good assets are with a bridge bank called New Kabul Bank, which will likely be privatized in FY2012. The bad assets have been retained by the receiver, appointed and overseen by a newly created independent Financial Dispute Resolution Committee. Based on the latest estimates, around $935 million (principal and interest) are receivable, although this amount is likely to increase when an audit is completed. Formal charges have been brought against two shareholders who represent over 50% of the assets sought for recovery and seven bank officers, but the legal process is moving slowly.
This crisis exemplifies the risks of rapid banking sector growth with weak governance and rule of law, and a lack of capacity and experience in supervision at the central bank. In November 2011, the government and IMF agreed to a new three-year Extended Credit Facility that includes measures to address corruption and strengthen regulation and supervision over the banking system.
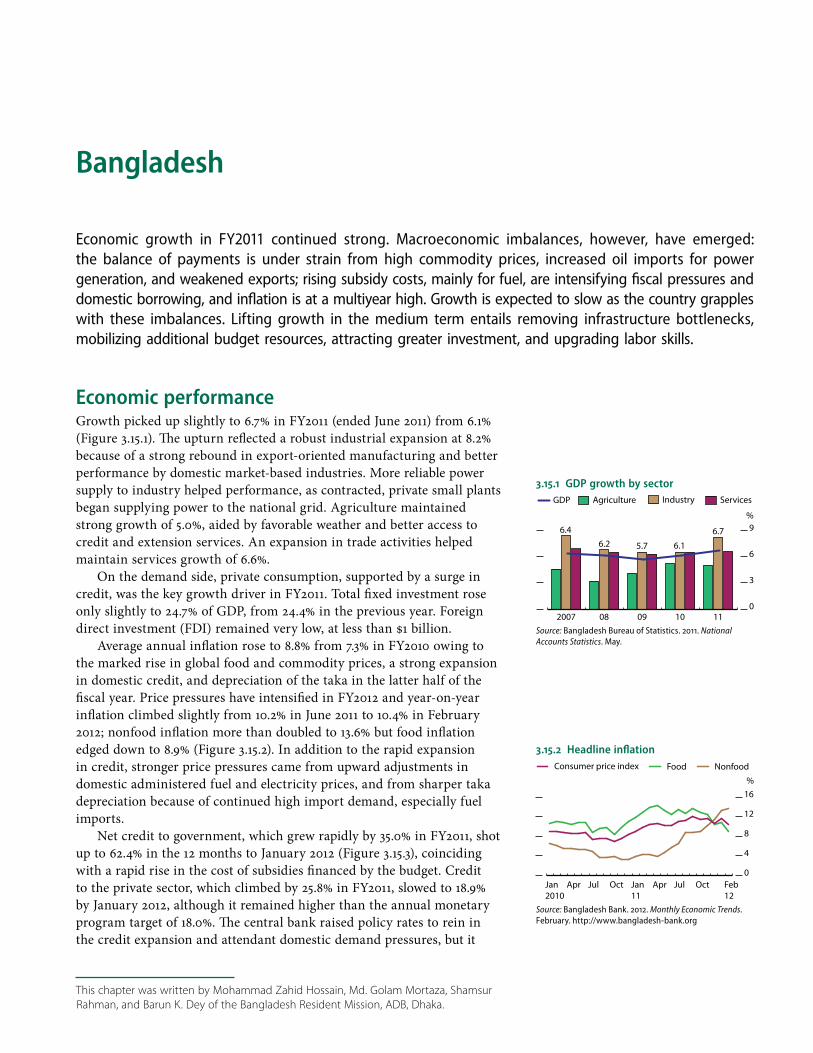
Bangladesh
Economic growth in FY2011 continued strong. Macroeconomic imbalances, however, have emerged: the balance of payments is under strain from high commodity prices, increased oil imports for power generation, and weakened exports; rising subsidy costs, mainly for fuel, are intensifying fiscal pressures and domestic borrowing, and inflation is at a multiyear high. Growth is expected to slow as the country grapples with these imbalances. Lifting growth in the medium term entails removing infrastructure bottlenecks, mobilizing additional budget resources, attracting greater investment, and upgrading labor skills.
Economic performanceGrowth picked up slightly to 6.7% in FY2011 (ended June 2011) from 6.1% (Figure 3.15.1). The upturn reflected a robust industrial expansion at 8.2% because of a strong rebound in export-oriented manufacturing and better performance by domestic market-based industries. More reliable power supply to industry helped performance, as contracted, private small plants began supplying power to the national grid. Agriculture maintained strong growth of 5.0%, aided by favorable weather and better access to credit and extension services. An expansion in trade activities helped maintain services growth of 6.6%.
On the demand side, private consumption, supported by a surge in credit, was the key growth driver in FY2011. Total fixed investment rose only slightly to 24.7% of GDP, from 24.4% in the previous year. Foreign
Average annual inflation rose to 8.8% from 7.3% in FY2010 owing to the marked rise in global food and commodity prices, a strong expansion in domestic credit, and depreciation of the taka in the latter half of the fiscal year. Price pressures have intensified in FY2012 and year-on-year inflation climbed slightly from 10.2% in June 2011 to 10.4% in February 2012; nonfood inflation more than doubled to 13.6% but food inflation edged down to 8.9% (Figure 3.15.2). In addition to the rapid expansion in credit, stronger price pressures came from upward adjustments in domestic administered fuel and electricity prices, and from sharper taka depreciation because of continued high import demand, especially fuel imports.
Net credit to government, which grew rapidly by 35.0% in FY2011, shot up to 62.4% in the 12 months to January 2012 (Figure 3.15.3), coinciding with a rapid rise in the cost of subsidies financed by the budget. Credit to the private sector, which climbed by 25.8% in FY2011, slowed to 18.9% by January 2012, although it remained higher than the annual monetary program target of 18.0%. The central bank raised policy rates to rein in the credit expansion and attendant domestic demand pressures, but it
3.15.1 GDP growth by sector
0
3
6
9
GDP ServicesIndustryAgriculture
111009082007
%
6.26.7
6.15.7
6.4
Source: Bangladesh Bureau of Statistics. 2011. National Accounts Statistics. May.
This chapter was written by Mohammad Zahid Hossain, Md. Golam Mortaza, Shamsur
Rahman, and Barun K. Dey of the Bangladesh Resident Mission, ADB, Dhaka.
3.15.2 Headline inflation
0
4
8
12
16
Nonfood Food Consumer price index
Feb12
OctJulAprJan11
OctJulAprJan2010
%
Source: Bangladesh Bank. 2012. Monthly Economic Trends. February. http://www.bangladesh-bank.org

Economic trends and prospects in developing Asia: South Asia Bangladesh 159
also provided occasional liquidity support to the commercial banks, partly countering these measures’ impact.
Revenue collection was buoyant in FY2011, with the revenue-to-GDP ratio rising to 11.6% from 10.9% in FY2010, owing to the pickup in economic activity and improvement in tax administration. Total government spending increased by nearly 25% to 15.9% of GDP from 14.6% in the previous year, as current spending mounted because of a rise in subsidies for food, fuel, fertilizer and electricity. The budget deficit (4.3% of GDP) nonetheless, remained below target (5.0%), largely because implementation of the annual development program was weak, reflecting continued capacity constraints in key line agencies. The bulk of the budget financing came from domestic sources (3.4% of GDP), mostly from the banking system (Figure 3.15.4), as sales of national saving certificates fell off from the high level a year earlier and foreign financing was lower than expected (0.9%).
Export growth jumped to 41.7% in FY2011, reflecting a sharp recovery in garment demand in the main markets in the European Union (EU) and the United States (US) and a pickup in garment exports to new markets though these remain a small part of total sales. Garment export earnings grew by 43.4%, buoyed in part by higher export prices following the rise in prices of cotton, yarn, and accessories. Exports of other products also grew rapidly with a rise in demand and also reflecting the low base in the previous year.
Imports grew in step by 41.8% owing to larger import costs of raw materials for the garment industry, higher global commodity prices—especially for foodgrains, fertilizer, and fuel—and the generally strong domestic demand conditions. Foodgrain imports rose very steeply, buoyed by larger volumes as well as price, as the government sought to build large stocks to bolster food security. Because the base for imports is much larger than that for exports, even with similar growth rates, the trade deficit widened by 2.0% of GDP. Worker remittances, the main offset to the trade deficit, expanded by only 6.0% however, down from 13.4% the previous year.
The larger trade deficit and slower growth in remittances took the
The combined capital and financial accounts recorded a deficit of
because of the larger outflows on account of trade credit and lower net
Because of rapidly growing import demand, the exchange rate came under pressure, especially in the second half of FY2011, and the taka depreciated by 6.3% against the dollar during the year. Balance-of-payments pressures continued in the first 7 months of FY2012 and the taka depreciated further by 12.2% (Figure 3.15.6). The real effective exchange rate depreciated by 9.0% in the year to January 2012, implying some gain in export competitiveness, as nominal depreciation of the currency offset higher inflation than in major trading partners.
3.15.3 Credit growth
-20
0
20
40
60
80
Credit to private sectorCredit to government (net)
Jan12
OctJulAprJan11
OctJulAprJan2010
%
Source: Bangladesh Bank. 2012. Monthly Economic Trends. February. http://www.bangladesh-bank.org
3.15.4 Budget deficit financing
-2
0
2
4
6
2007 08 09 10 11
% of GDP
Domestic—nonbank financing (net)
Foreign financing (net)Domestic—bank financing (net)
Source: Asian Development Outlook database.
3.15.5 Components of the current account balance
-4
-2
0
2
4
-40
-20
0
20
40
2007 08 09 10 11
% of GDP$ billion
Current account
Exports
RemittancesImports
Net services
Other net transfersNet income
Source: Bangladesh Bank. Annual Report 2010–2011. http://www.bangladesh-bank.org

160 Asian Development Outlook 2012
Economic prospectsThe forecasts for FY2012 and FY2013 assume that it will be hard to contain inflation in FY2012, despite policy tightening. It is expected that credit tightening measures announced in the central bank’s January 2012 Monetary Policy Statement would more effectively damp inflation in FY2013. It is also assumed that the government will further raise fuel and electricity prices, and mobilize more foreign financing of the budget, as part of its efforts to eliminate external and domestic imbalances and put the economy on a sustainable higher growth path. Finally, political stability and normal weather are expected to prevail.
GDP growth in FY2012 is projected to slow to 6.2%. The performance of exports, a key growth driver, is weakening as the year progresses, largely because of weaknesses in its key market, the eurozone, which is in a prolonged period of adjustment to its debt crisis. Export growth slowed sharply to 13.0% in the first 8 months of FY2012, from 40.3% in the year-earlier period, which will also affect production in export-linked domestic industries. The rise in interest rates is expected to moderate domestic demand. GDP growth in FY2013 is expected to slip to 6.0% as interest rates are raised to bring down inflation, and as export growth slows further.
Agricultural growth in FY2012 will moderate to 4.4%, crimped by rising irrigation costs (reflecting higher fuel and electricity prices) and because of the high base in the previous year. In FY2013, sector growth is projected to rise slightly to 4.5% in response to better procurement prices, as the government steps up food procurement programs and strengthens policy support.
Industrial growth is expected to slow to 7.8% in FY2012, mainly reflecting falling export demand. Higher interest rates and labor costs as well as the expected increases in fuel and electricity prices will further raise the cost of production and squeeze profit margins. Higher interest rates will also weaken the construction industry and investment activity. Industrial growth is projected to ease to 7.5% in FY2013 reflecting policies to eliminate imbalances in the economy taking greater hold, and weakening domestic and external demand conditions.
In FY2012, services growth will slip to 6.2%, as growth in agriculture and industry slows. With industry activity slowing further in FY2013, expansion in services will ease to 6.0%.
Annual average inflation will edge up to 11.0% in FY2012. While food inflation has traditionally driven up the headline rate, the sharp rise in nonfood prices from July 2011 has emerged as a major policy concern. To rein in inflation, the central bank continued the previous year’s credit-tightening measures and raised its policy rates in September 2011 and January 2012 by 100 basis points each, to 7.75% and 5.75%, respectively. They are expected to be raised more. In January 2012, the central bank abolished the cap on commercial bank lending rates to more effectively transmit its policy to the private sector. Inflation is projected to slow to 8.5% in FY2013 as monetary tightening takes greater hold.
12.2% more than in the equivalent period a year earlier, reflecting a steep rise in the number of workers leaving for overseas jobs since June 2011 (Figure 3.15.7). The upturn in worker placements and remittances is a welcome financial development that will both help sustain family incomes
3.15.1 Selected economic indicators (%)
2012 2013
GDP growth 6.2 6.0
Inflation 11.0 8.5
Current account balance (share of GDP)
-0.5 -1.0
Source: ADB estimates.
3.15.6 Exchange rates
90
85
80
75
70
65
75
80
85
90
95
100
Real effectiveNominal
Jan12
JulJan11
JulJan10
JulJan09
Jul2008
Taka/$ Index
Source: Bangladesh Bank. 2012. Monthly Economic Trends. February. http://www.bangladesh-bank.org
3.15.7 Out-of-country employment
0
200
400
600
800
1,000
Jul−Feb FY12
Jul−Feb FY11
111009082007
Thousands
Source: Bangladesh Bank. 2012. Monthly Economic Trends. February. http://www.bangladesh-bank.org

Economic trends and prospects in developing Asia: South Asia Bangladesh 161
and domestic consumption, and contain the current account deficit. Most Bangladeshi overseas workers go to Gulf countries and are largely recruited to fill low-skill jobs. Remittances are expected to grow by 10.0% in FY2012, from 6.0% a year earlier, and rise further by 12.0% in FY2013.
Export growth is projected to slow to 12.0% in FY2012 and further to 10.0% in FY2013, mainly reflecting weak demand for garments (over three-fourths of exports) from the eurozone and from the US, which is experiencing a slow recovery from its financial crisis. In the first 8 months of FY2012, growth in knitwear exports declined sharply to 8.7%, from 43.9% in the year-earlier period, although growth in woven fabric exports held up well at 22.2% (Figure 3.15.8), benefiting from the EU’s relaxed rules of origin (from January 2011). Growth in other export items also slowed markedly. While taka depreciation should favor exporters, the benefits are being largely negated by the lower prices negotiated by garment buyers. Although garment exports to new (mainly developing country) markets are becoming more important, they are yet to become major markets to offset declining exports to the EU and US, the two dominant traditional markets.
Imports grew by 15.6% in the first 7 months of FY2012. Growth in imports of foodgrains, consumer goods, capital machinery and industrial raw materials moderated from a year ago, although some intermediate goods, especially fuel and fertilizer, grew very strongly. Imports are forecast to grow by 17.0% in FY2012 and stay robust at 15.0% in FY2013 to cover fuel requirements for what is becoming a more reliable power generation, even as economic growth moderates.
The current account is projected to move to a deficit of 0.5% of GDP in FY2012 and to 1.0% in FY2013 as the trade deficit widens further (Figure 3.15.9). Foreign exchange reserves declined further in the first 8 months of FY2012 (Figure 3.15.10) as the current account surplus nearly halved and a large deficit was still recorded in the capital and financial accounts. Net inflows of foreign assistance declined, although FDI inflows rose marginally. Pressure on the balance of payments is expected to intensify in the forecast period, with larger import payments relative to export and remittance receipts. The government is seeking to adopt policies to address the growing imbalances, including discussing a 3-year program with the International Monetary Fund under its Extended Credit Facility.
The FY2012 budget aimed at revenue growth of 24.4%, although revenue collection in the first 7 months of the fiscal year indicates that this target is unlikely to be met. The budget set growth in public spending at 25.8%. While current spending is likely to greatly exceed the budgeted amount because of the rapid rise in subsidies, utilization of the annual development program will again fall short of allocation, which is expected to keep the fiscal deficit within the budgeted 5.0% of GDP (Figure 3.15.11). Domestic financing, mainly from banks, was set to cover 3.7% of GDP, while the remaining 1.3% was planned to come from foreign financing.
Subsidies are putting increasing pressure on the budget. The government has raised fuel and electricity prices in phases to cut them, but these adjustments are too small to cover rising costs. Indeed, spending on subsidies is expected to increase from the previous year’s 2.2% of GDP to 3.4% in FY2012, or more than a quarter of projected revenue collection for the year.
3.15.9 Current account balance
-2
0
2
4
1312111009082007
% of GDP5-year moving average
ForecastSources: Bangladesh Bank. Annual Report 2010–2011. http://www.bangladesh-bank.org; ADB estimates.
3.15.10 Gross foreign exchange reserves
0
3
6
9
12
Jan12
JulJan11
JulJan10
Jul2009
$ billion
Source: Bangladesh Bank. 2012. Monthly Economic Trends. February. http://www.bangladesh-bank.org
3.15.8 Growth in exports and components
-20
0
20
40
60
TotalOthersWoven garments
Knitwear products
Jul−Feb FY12
Jul−Feb FY11
111009082007
%
Sources: Bangladesh Bank. 2012. Major Economic Indicators: Monthly Update. February; Annual Report 2010–2011. http://www.bangladesh-bank.org

162 Asian Development Outlook 2012
The state-owned Bangladesh Petroleum Corporation is facing challenges in mobilizing foreign exchange to pay for its fuel import bill, which is projected to rise by more than half in FY2013. It has obtained a
timely adjustments in fuel prices are made, this loan will ultimately have to be repaid from budgetary resources.
The projections are subject to various downside risks. The global economic slowdown may be more severe than expected, while policy tightening could be compromised by political considerations: the government may find it politically costly to further raise fuel and electricity prices.
Policy challenge—strengthening growth policiesIn the short term, Bangladesh needs to reduce its growing fiscal and external imbalances. It needs to cut subsidies by adjusting fuel and electricity prices, creating space for more—acutely needed—outlays on infrastructure and human development, and reducing the budget’s excessive domestic borrowing. The effort to expand the economy’s productive capacity will also require higher domestic revenue, which could be raised by strengthening tax reforms and attracting more concessional financing. Monetary policy tightening would need to continue to reduce inflation and eliminate pressure on reserves through reducing import demand. Exports need to be raised through broadening the export base and deepening access to new markets.
Over the long term, the government needs to substantially improve the business climate (Figure 3.15.12) in order to scale up private investment, including FDI, as highlighted in the World Bank’s Doing Business 2012. As shown in the World Economic Forum’s Global Competitiveness Report 2011–12, Bangladesh lags far behind other countries in South Asia in infrastructure (Table 3.15.2). To mobilize resources needed for closing these wide infrastructure gaps, greater private participation in infrastructure development, including public–private partnerships, is essential to supplement finite public resources. The capital market also needs to be developed as a source of long-term infrastructure financing.
Bangladesh has a raft of strategic advantages, including cheap labor and a location in a fast-growing region, which can help attract large FDI inflows into light industry. In several countries in Asia, labor costs are rising fast, opening up prospects for foreign investors to relocate investment to Bangladesh. To attract greater FDI, however, it is essential to remove infrastructure bottlenecks, make land readily available, upgrade skills of the labor force, and remove administrative delays and impediments.
3.15.11 Government budget trends
-5
0
5
10
15
20
Fiscal balanceTotal expenditureTotal revenue
121110092008
% of GDP
ForecastSource: Asian Development Outlook database.
3.15.12 How Bangladesh ranks on Doing Business topics
1
51
101
151
Starting a business (86)
Dealing with construction permits (82)
Registering property (173)
Getting credit (78)
Protecting investors (24)
Paying taxes (100)
Trading across borders (115)
Enforcing contracts (180)
Resolving insolvency (107)
Getting electricity (182)
Note: Numbers in parentheses show ranking out of 183 countries worldwide, 1 = best.
Source: The World Bank. Doing Business database. http://www.doingbusiness.org/data (accesssed 14 March 2012).
3.15.2 Comparison of infrastructure quality, 2011
Country rankinga
Overall infrastructure
Electricity Roads Railroads Ports Air transport
1 = extremely underdeveloped, 7 = extensive and efficient (by international standards)
Bangladesh 129 2.8 1.6 2.9 2.5 3.4 3.5China, People’s Rep. of 69 4.2 5.5 4.4 4.6 4.5 4.6India 86 3.8 3.1 3.4 4.4 3.9 4.7Pakistan 109 3.5 2.2 3.7 2.8 4.1 4.3Sri Lanka 48 4.7 5.0 4.5 3.8 4.9 4.9
a Ranking out of 142 countries, 1 = best.
Source: 2011 World Economic Forum, The Global Competitiveness Report 2011–2012.

Bhutan
After a solid year, the outlook remains favorable with growth staying robust, in part driven by the construction of large hydropower projects. Current account deficits will remain high, though, reflecting the projects’ import requirements—but associated capital inflows are expected to keep the overall balance of payments in surplus. A main challenge for government is to implement policies that would rapidly expand private sector activity to boost job opportunities and broaden the country’s economic base.
Economic performanceGrowth is estimated to have moderated slightly to 8.3% in FY2011 (ended 30 June 2011) from 9.3% a year earlier (Figure 3.16.1). Reflecting the country’s hydropower project cycle, the construction phase is under way on four large projects that would more than double power capacity, thus construction and manufacturing (cement mainly) are the main drivers of expansion. Electricity generation capacity has not risen since 2007, so power production provided little impetus to growth—sales to India rose by only about 4% during the year. Expansion in services eased solely on community services while the rest of the components remained robust.
Agriculture has been unable to record significant growth in the past 7 fiscal years, and is gradually losing its overall share of output, because it is hard to provide development services to raise productivity to the many small villages in the remote mountainous parts of the country.
Broad money (M2) growth moderated—along with the economy—to 21.2% in FY2011, mainly due to small expansion in net foreign assets. Private sector credit grew 31.9% in FY2011, broadly in line with its long-term average of 32%, concentrated in housing and construction and in personal loans. The ratio of nonperforming loans declined to 8.5% at end-FY2011 from 10.2% a year earlier.
Local price movements continue to follow India’s because Bhutan’s currency is pegged to India’s and because the country keeps strong trading ties with its giant neighbor (taking about 90% of exports and providing 75% of imports). Bhutan’s average inflation, therefore, rose to 8.6% in FY2011, almost twice the FY2010 rate. (Food prices rose by 9.3% and nonfood prices by 8.0%—Figure 3.16.2.)
The government revenue-to-GDP ratio fell to 39.1% in FY2011 from 46.4% a year earlier as nontax revenue growth slowed (Figure 3.16.3). Expenditures (43.8% of GDP) rose by 14.4% in FY2011 on the back of rising capital expenditures reflecting hydropower construction and a pay hike for public servants from January 2011. The fiscal deficit was 4.7% of GDP in FY2011 (from a surplus equivalent to 1.6% of GDP in FY2010) and was financed mostly from domestic borrowing.
3.16.1 Contributions to growth (supply)
12.610.8
5.79.3 8.3
-5
0
5
10
15
2007 08 09 10 11
Percentage points
ElectricityAgricultureGDP
Construction
Taxes net of subsidiesServices
Other industries
Source: National Statistics Bureau. 2011. National Accounts Statistics 2010. http://www.nsb.gov.bt
This chapter was written by Jeffry Kongoasa and Ruzette Mariano of the South Asia
Department, ADB, Manila.
3.16.2 Contributions to inflation
0
3
6
9
12
India wholesale price indexConsumer price index
NonfoodFood
Q111
Q3Q110
Q3Q109
Q3Q108
Q3Q12007
Percentage points
Source: Royal Monetary Authority of Bhutan. 2011. Selected Economic Indicators. June. http://www.rma.org.bt

164 Asian Development Outlook 2012
According to the Royal Monetary Authority (RMA), public external debt amounted to 76.2% of GDP at end-FY2011. By currency, nearly three-fifths was in Indian rupees; by use, just over two-fifths of the total had been allotted for hydropower loans and the balance for development projects.
Even though the overall current account deficit widened from 9.9% of GDP in FY2010 to about 20.6% in FY2011 as trade deficit widened from 20.9% of GDP to 30.2%, the overall balance of payments recorded a sizable surplus equivalent to 5.7% of GDP as loans and capital grants more than compensated for the current account deficit (Figure 3.16.4). However, Bhutan’s external position with India has weakened greatly because export growth to it has slowed, given that power sales have reached generation capacity and that import demand has accelerated because of the power construction program and strong economic growth. At end-FY2011 Bhutan’s rupee reserves amounted to about one week of imports, although convertible currency reserves were high at
inessential) imports (Figure 3.16.5).
Economic prospectsGrowth is forecast at 8.0% for FY2012 and 8.5% for FY2013 largely on the account of continued hydropower construction. The FY2012 budget will continue to support high growth with total planned expenditure to increase by about 11%. More than half the budget is allocated to capital expenditure, which rises by about 13%, with about two-thirds of it financed by grants. Current expenditure is slated to grow by 9%, mainly on account of public servants’ salary revisions and higher operations and maintenance expenses. The overall deficit is projected to rise to 6% of GDP.
Inflation is expected to moderate to 7.3% in FY2012 and 6.5% in FY2013, broadly in line with assumed price developments in India. The Asian Development Outlook baseline forecast of relative stable global oil and food prices underpins a favorable outlook.
The current account deficit is projected to stay high at 20% and 22% of GDP in FY2012 and FY2013, mainly owing to continued high imports for power plant construction. The overall balance of payments is expected to remain in surplus reflecting continued substantial project loans and capital grants. The tight overall balance with India is not expected to improve and pressures on rupee liquidity will persist.
In recent years the RMA has borrowed through an overdraft facility (at relatively steep rates) with the State Bank of India and through a credit line with the government of India to keep an adequate working balance. Its borrowing from the overdraft exceeded Rs8 billion as well as reaching the Rs3 billion credit line limit with the government before end-2011. The
2011 to eliminate this expensive overdraft and to partly pay other rupee debt. However, liquidity pressures caused the RMA in March 2012 to clamp down on import spending and to restrict the use of reserves to importing priority items, including fuel. Because Bhutan’s constitution requires foreign reserves to provide 12 months of cover for essential imports and they are about at this level, there is limited scope to sell additional reserves. To avoid disrupting the economy, the RMA is, therefore, expected by
3.16.3 Fiscal indicators
-20
0
20
40
60
Overall balanceCapital expenditureCurrent expenditure
Total revenue
111009082007
% of GDP
Source: Royal Monetary Authority. 2012. Annual Report FY2011. http://www.rma.org.bt
3.16.4 Balance of payments
-20
-10
0
10
20
30
2007 08 09 10 11
Ngultrum billion
Current accountOverall balance Capital and financial account
Errors and omissions
Source: Royal Monetary Authority. 2012. Annual Report FY2011. http://www.rma.org.bt
3.16.5 Gross international reserves
0
200
400
600
800
1,000
0
3
6
9
12
15
Months of importsRupee Convertible currency
111009082007
Months$ million
Source: Royal Monetary Authority. 2012. Annual Report FY2011. http://www.rma.org.bt

Economic trends and prospects in developing Asia: South Asia Bhutan 165
April 2012 to negotiate a higher ceiling on the credit line with the Indian government and, possibly, carry out a currency swap arrangement through the facilitation of the SAARC FINANCE. Power exports from the plants under construction will, of course, provide an enduring solution.
The RMA and the Reserve Bank of India are working to establish guidelines to create a base-rate system for Bhutanese financial institutions, expected to come in this fiscal year, which would make loan pricing more transparent and foster competition in the sector. This is a precursor to the RMA’s carrying out monetary policy by setting policy rates, a change that would be a more effective mechanism for monetary policy.
Policy challenge—broadening the economic baseThe private sector needs to expand to tackle rising unemployment. The unemployment rate has averaged 3.5% in the last 3 years, well above the government target of 2.5% set for 2013. Unemployment is an especially serious problem among those aged 15 to 24 years—over 45% of the unemployed, this group has a 9.4% jobless rate (Figure 3.16.6). This stems from limited job openings and deficiencies in labor skills necessary for employability in various sectors. The government is the employer of choice especially among the young but the absorptive capacity of the public sector to hire more staff is nearing saturation. Hydropower—the industrial mainstay—offers very few jobs.
The government recognizes the problem. Its Economic Development Policy, issued in 2010, specified fiscal incentives to attract foreign direct investment (FDI). It has, therefore, drafted new FDI regulations that include clearer provisions for owning land as well as liberalizing other features of current regulations. The policy also identified niche business opportunities for cottage and small industries and tourism, where the government believes it can promote local entrepreneurship.
The government has identified the information and communications technology industry as a promising niche sector. The country’s first park for this, the Thimpu Techpark, was inaugurated in 2011 and is expected to attract FDI and provide some high-skilled jobs. The industry is, however, still at a very early stage.
According to World Bank’s 2010 Bhutan Investment Climate Assessment Report, the top constraint for small firms is access to finance. In an effort to ease it, the government has recently adopted expanded microfinance policies, including subsidized interest rates, new credit products suitable for small firms, and incentives for socially and environmentally friendly lending.
The same report notes that the major constraint for large firms is inadequate education. The 2011 Labor Force Survey Report noted that only 6% of the work force has received higher secondary education (and 3% has tertiary education) (Figure 3.16.7). The government has introduced competency-based training programs for five trades, namely auto-mechanics, construction carpentry, plumbing, masonry, and industrial electrical. It has also launched a grant program to train tertiary graduates working in the private sector. Other constraints faced by large firms include the difficulty in hiring foreign workers, transport difficulties, high tax rates, and restrictive labor regulations.
3.16.6 Unemployment
0
20
40
60
80
100
0
3
6
9
12
15
Unemployed adultsUnemployed youths
Total unemployment rateYouth unemployment rate
1110092006
% %
Source: Ministry of Labour and Human Resources. 2011. Labour Force Survey Report. http://www.molhr.gov.bt
3.16.7 Education level of employed persons, 2011
MonasticNonformalMasters and aboveGraduates and undergraduates
Higher secondaryJunior and highNursery to primaryIlliterate
Education level
64%
1%3%
10%
13%
5%3%
1%
Source: Ministry of Labour and Human Resources. 2011. Labour Force Survey Report. http://www.molhr.gov.bt
3.16.1 Selected economic indicators (%)
2012 2013
GDP growth 8.0 8.5
Inflation 7.3 6.5
Current account balance (share of GDP)
-20.0 -22.2
Source: ADB estimates.

India
GDP growth slowed markedly in FY2011 as industrial and investment activity slumped and the current account deficit widened. A combination of tight monetary policy to counter persistently high inflation, strained global economic conditions, larger subsidies that pushed up the budget deficit, and lack of political consensus on resolving the policy impediments to growth were factors in the downdraft. Boosting investment and growth to match the strong performance of recent years will hinge on reaching agreement on measures to deal with long-standing and challenging policy issues. The outlook is for a moderate pickup.
Economic performanceEconomic growth fell to 6.9% in FY2011 (ended 31 March 2012) from 8.4% in FY2010 according to the government’s advance estimates. The pace slowed as the year progressed (Figure 3.17.1). The slowdown was concentrated in industry and driven by slumping investment activity, falling exports in the latter months, and attendant weakening in consumer spending.
Investment growth recovered quickly from its low point in the depths of the global financial crisis, although the trend reversed once more to a marked decline over the past 2 fiscal years (Figure 3.17.2). Notably, in the first 3 quarters of FY2011, fixed investment is estimated to have fallen by 0.25% from the corresponding period a year earlier, although the government’s advance estimates of GDP for the full fiscal year show an increase of 5.6%.
However the final data for the year turn out, the downward trend is evident—as is the need to reverse it to get the country back on its recent-year high growth path. The causes of investment’s sharp deceleration are multiple, including the slump in the global economy and trade, tighter monetary policy and higher nominal interest rates (to combat persistent high inflation), a larger than expected budget deficit in FY2011 (adding to uncertainty over the direction of the economy), and a growing sense of a national policy paralysis (due to political parties’ inability to agree on certain issues, including structural measures).
Industrial growth dropped to a decade-low 3.9%. Slumping investment took its toll: manufacturing growth fell by half to 3.9%, largely reflecting weak capital goods output, and construction growth fell to 4.8% from 8.0% a year earlier. In industry, mining contracted by 2.2%, partly due to uncertainty over land and environmental clearances. Coal production continued its slowing-growth trend of recent years, shrinking by 1.5%. The controlling state monopoly is unable to ramp up production to meet rapidly growing demand from new power plants, thereby increasing reliance on more costly imports. Natural gas production fell by 8.8%, owing to technical problems at a large new field and pricing issues.
3.17.1 GDP growth by sector
0
3
6
9
12
ServicesIndustryAgricultureGDP
111009082007
%
9.3
6.98.48.4
6.7
Source: Ministry of Statistics and Programme Implementation.
This chapter was written by Abhijit Sen Gupta of the India Resident Mission, ADB,
New Delhi.
3.17.2 Investment growth indicators
-6
0
6
12
18
24
Real repo rateInvestment growthGDP growth (at factor cost)
Q111
Q110
Q109
Q108
Q107
Q12006
%
Source: CEIC Data Company (accessed 24 March 2012).
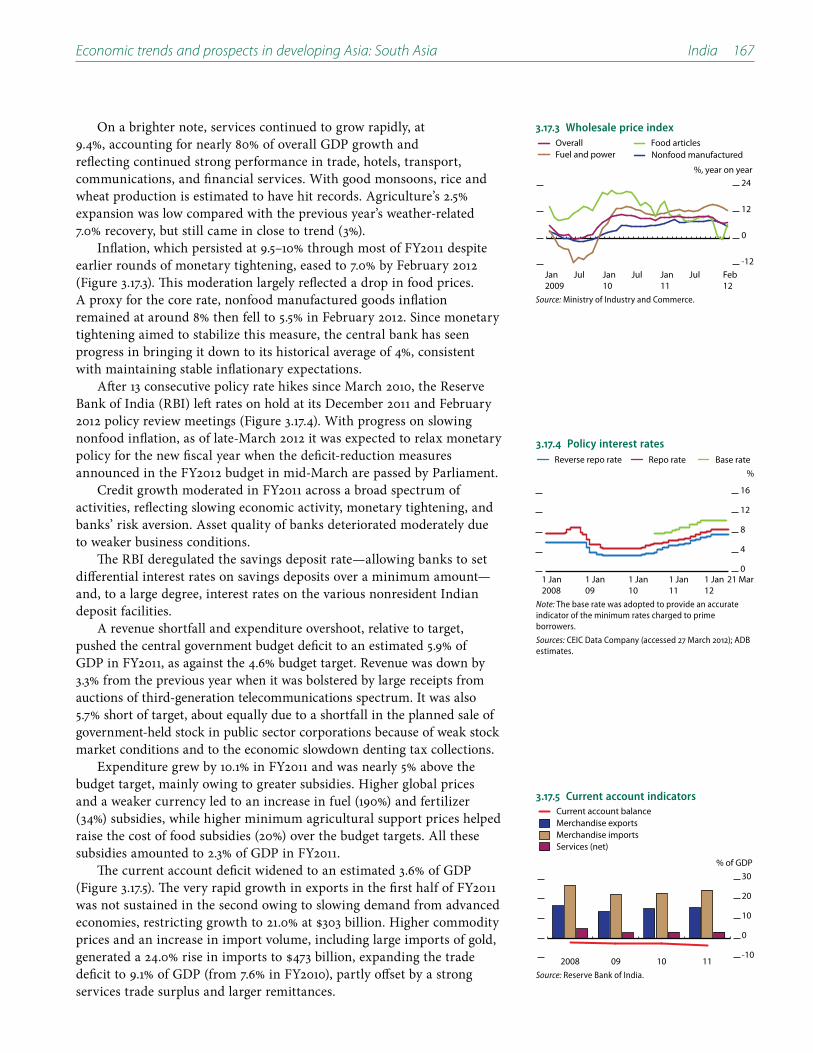
Economic trends and prospects in developing Asia: South Asia India 167
On a brighter note, services continued to grow rapidly, at 9.4%, accounting for nearly 80% of overall GDP growth and reflecting continued strong performance in trade, hotels, transport, communications, and financial services. With good monsoons, rice and wheat production is estimated to have hit records. Agriculture’s 2.5% expansion was low compared with the previous year’s weather-related 7.0% recovery, but still came in close to trend (3%).
Inflation, which persisted at 9.5–10% through most of FY2011 despite earlier rounds of monetary tightening, eased to 7.0% by February 2012 (Figure 3.17.3). This moderation largely reflected a drop in food prices. A proxy for the core rate, nonfood manufactured goods inflation remained at around 8% then fell to 5.5% in February 2012. Since monetary tightening aimed to stabilize this measure, the central bank has seen progress in bringing it down to its historical average of 4%, consistent with maintaining stable inflationary expectations.
After 13 consecutive policy rate hikes since March 2010, the Reserve Bank of India (RBI) left rates on hold at its December 2011 and February 2012 policy review meetings (Figure 3.17.4). With progress on slowing nonfood inflation, as of late-March 2012 it was expected to relax monetary policy for the new fiscal year when the deficit-reduction measures announced in the FY2012 budget in mid-March are passed by Parliament.
Credit growth moderated in FY2011 across a broad spectrum of activities, reflecting slowing economic activity, monetary tightening, and banks’ risk aversion. Asset quality of banks deteriorated moderately due to weaker business conditions.
The RBI deregulated the savings deposit rate—allowing banks to set differential interest rates on savings deposits over a minimum amount—and, to a large degree, interest rates on the various nonresident Indian deposit facilities.
A revenue shortfall and expenditure overshoot, relative to target, pushed the central government budget deficit to an estimated 5.9% of GDP in FY2011, as against the 4.6% budget target. Revenue was down by 3.3% from the previous year when it was bolstered by large receipts from auctions of third-generation telecommunications spectrum. It was also 5.7% short of target, about equally due to a shortfall in the planned sale of government-held stock in public sector corporations because of weak stock market conditions and to the economic slowdown denting tax collections.
Expenditure grew by 10.1% in FY2011 and was nearly 5% above the budget target, mainly owing to greater subsidies. Higher global prices and a weaker currency led to an increase in fuel (190%) and fertilizer (34%) subsidies, while higher minimum agricultural support prices helped raise the cost of food subsidies (20%) over the budget targets. All these subsidies amounted to 2.3% of GDP in FY2011.
The current account deficit widened to an estimated 3.6% of GDP (Figure 3.17.5). The very rapid growth in exports in the first half of FY2011 was not sustained in the second owing to slowing demand from advanced
prices and an increase in import volume, including large imports of gold,
deficit to 9.1% of GDP (from 7.6% in FY2010), partly offset by a strong services trade surplus and larger remittances.
3.17.3 Wholesale price index
-12
0
12
24
Overall Food articlesFuel and power Nonfood manufactured
Feb12
JulJan11
JulJan10
JulJan2009
%, year on year
Source: Ministry of Industry and Commerce.
3.17.4 Policy interest rates
0
4
8
12
16
Base rateRepo rateReverse repo rate
21 Mar 1 Jan 12
1 Jan11
1 Jan10
1 Jan09
1 Jan2008
%
Note: The base rate was adopted to provide an accurate indicator of the minimum rates charged to prime borrowers.
Sources: CEIC Data Company (accessed 27 March 2012); ADB estimates.
3.17.5 Current account indicators
-10
0
10
20
30
Services (net)Merchandise importsMerchandise exportsCurrent account balance
1110092008
% of GDP
Source: Reserve Bank of India.

168 Asian Development Outlook 2012
The heavy current account deficit was mostly financed by financial inflows. With concerns over sovereign debt and fiscal prospects in the United States and eurozone, net portfolio inflows were slight for much of
in FY2011, about half that of a year earlier. Improved foreign direct investment (FDI) and larger commercial borrowing and bank loans by the private sector rounded out the financing.
intervention by the RBI to prevent excessive downward drift (and volatility) in the exchange rate. Over FY2011, the rupee depreciated by about 12% against the US dollar; the real effective exchange rate weakened by about 4% (Figure 3.17.7). Stock market prices drifted lower for most of FY2011 and then strengthened in early 2012, helped by a marked increase in portfolio investment. Nevertheless, the BSE Sensex was down about 10% in FY2011.
Economic prospectsInvestment is likely to remain lackluster for some time because new project announcements continued to decline during the third quarter of FY2011 (Figure 3.17.8). Data on planned capital spending from the Centre for Monitoring Indian Economy also point toward a sharp increase in the number of stalled projects, reflecting a host of structural bottlenecks related to fuel and power shortages, delays in environmental clearance, and other policy hurdles.
Business sentiment has deteriorated on various indicators in the RBI’s Business Expectation Index (Figure 3.17.9), and in similar surveys conducted by chambers of commerce. On balance, these business indicators suggest that investment will remain subdued in FY2012.
The impact of monetary easing and lower interest rates, improving external conditions, and some progress on stalled reforms and removal of the bottlenecks should lead to a revival of industrial activity starting in the second half of FY2012 and into FY2013. But their effect is likely to be limited until the government eliminates the policy issues. Recent steps, such as increasing the pace of road building as well as fast-track clearances for coal and power projects, are encouraging, though many other issues remain in the wings.
A normal monsoon would help agriculture expand at its trend rate (around 3%), in turn bolstering rural incomes and private consumption. The services sector, which has so far been resilient to the domestic slowdown, is expected to maintain its solid growth, supported by robust trends in private consumption spending and in urbanization. The global slowdown is, however, likely to trim growth in software and business services.
Based on assumptions for growth in industrial countries and oil prices, as well as expected moves toward monetary easing coupled with budget deficit reduction, GDP growth in FY2012 is forecast to nudge up to 7.0%. Recovery in the global economy and resolution of some of the structural bottlenecks are expected to increase GDP growth to 7.5% in FY2013.
Sustaining the progress against inflation in FY2012 depends on macroeconomic policies and structural reforms. Much of the past
3.17.6 International reserves
230
250
270
290
310
330
Foreign exchange reservesGross international reserves
Mar12
JulJan11
JulJan10
JulJan09
JulJan2008
$ billion
Note: Gross international reserves include gold and SDRs.
Source: Reserve Bank of India. http://www.rbi.org.in (accessed 27 March 2012).
3.17.7 Exchange rates
55
50
45
40
35
90
95
100
105
110
Real effectiveNominal
Feb12
OctApr11
Oct Apr10
Oct Apr09
OctApr08
Oct Apr2007
Rs/$ Index, 2005 = 100
Source: CEIC Data Company (accessed 27 March 2012).
3.17.8 Value of new announced projects
0
3
6
9
Q3Q111
Q3Q110
Q3Q109
Q3Q12008
Rs trillion
Source: Centre for Monitoring Indian Economy. 2011. Monthly Review of the Indian Economy. March 2012.
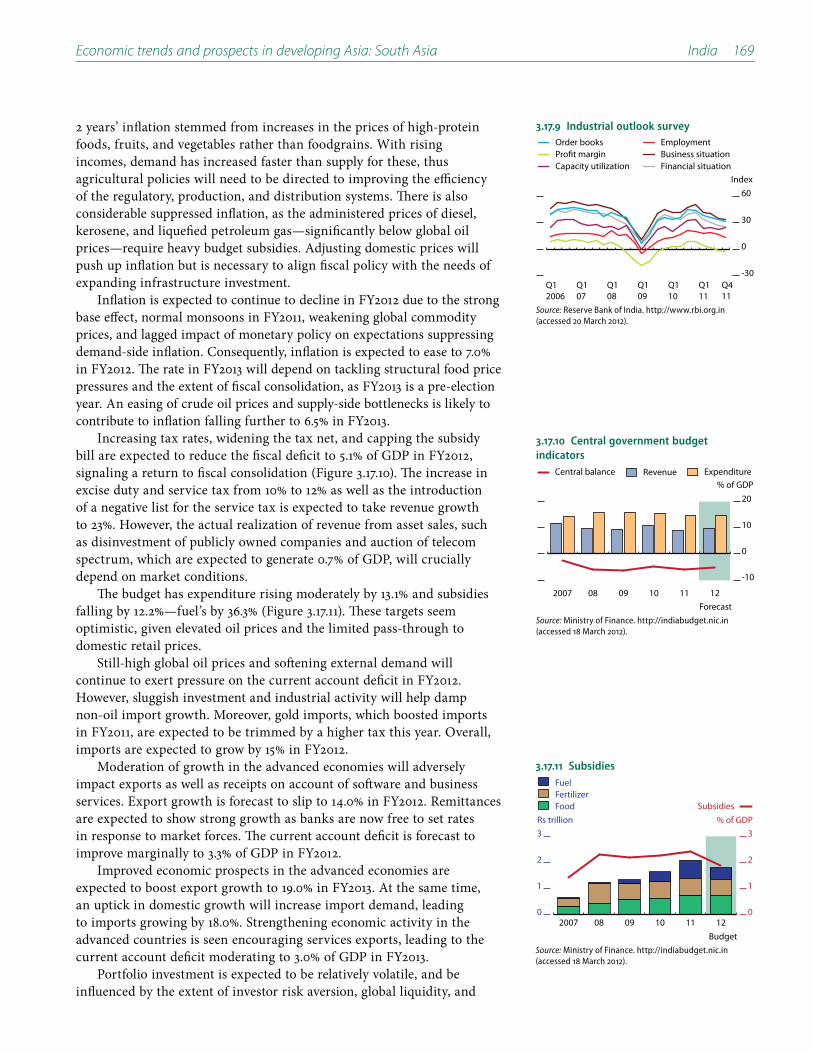
Economic trends and prospects in developing Asia: South Asia India 169
2 years’ inflation stemmed from increases in the prices of high-protein foods, fruits, and vegetables rather than foodgrains. With rising incomes, demand has increased faster than supply for these, thus agricultural policies will need to be directed to improving the efficiency of the regulatory, production, and distribution systems. There is also considerable suppressed inflation, as the administered prices of diesel, kerosene, and liquefied petroleum gas—significantly below global oil prices—require heavy budget subsidies. Adjusting domestic prices will push up inflation but is necessary to align fiscal policy with the needs of expanding infrastructure investment.
Inflation is expected to continue to decline in FY2012 due to the strong base effect, normal monsoons in FY2011, weakening global commodity prices, and lagged impact of monetary policy on expectations suppressing demand-side inflation. Consequently, inflation is expected to ease to 7.0% in FY2012. The rate in FY2013 will depend on tackling structural food price pressures and the extent of fiscal consolidation, as FY2013 is a pre-election year. An easing of crude oil prices and supply-side bottlenecks is likely to contribute to inflation falling further to 6.5% in FY2013.
Increasing tax rates, widening the tax net, and capping the subsidy bill are expected to reduce the fiscal deficit to 5.1% of GDP in FY2012, signaling a return to fiscal consolidation (Figure 3.17.10). The increase in excise duty and service tax from 10% to 12% as well as the introduction of a negative list for the service tax is expected to take revenue growth to 23%. However, the actual realization of revenue from asset sales, such as disinvestment of publicly owned companies and auction of telecom spectrum, which are expected to generate 0.7% of GDP, will crucially depend on market conditions.
The budget has expenditure rising moderately by 13.1% and subsidies falling by 12.2%—fuel’s by 36.3% (Figure 3.17.11). These targets seem optimistic, given elevated oil prices and the limited pass-through to domestic retail prices.
Still-high global oil prices and softening external demand will continue to exert pressure on the current account deficit in FY2012. However, sluggish investment and industrial activity will help damp non-oil import growth. Moreover, gold imports, which boosted imports in FY2011, are expected to be trimmed by a higher tax this year. Overall, imports are expected to grow by 15% in FY2012.
Moderation of growth in the advanced economies will adversely impact exports as well as receipts on account of software and business services. Export growth is forecast to slip to 14.0% in FY2012. Remittances are expected to show strong growth as banks are now free to set rates in response to market forces. The current account deficit is forecast to improve marginally to 3.3% of GDP in FY2012.
Improved economic prospects in the advanced economies are expected to boost export growth to 19.0% in FY2013. At the same time, an uptick in domestic growth will increase import demand, leading to imports growing by 18.0%. Strengthening economic activity in the advanced countries is seen encouraging services exports, leading to the current account deficit moderating to 3.0% of GDP in FY2013.
Portfolio investment is expected to be relatively volatile, and be influenced by the extent of investor risk aversion, global liquidity, and
3.17.10 Central government budget indicators
-10
0
10
20
ExpenditureRevenueCentral balance
12111009082007
% of GDP
ForecastSource: Ministry of Finance. http://indiabudget.nic.in (accessed 18 March 2012).
3.17.11 Subsidies
0
1
2
3
0
1
2
3
Subsidies
FuelFertilizerFood
12111009082007
Rs trillion % of GDP
BudgetSource: Ministry of Finance. http://indiabudget.nic.in (accessed 18 March 2012).
3.17.9 Industrial outlook survey
Index
-30
0
30
60
Financial situationCapacity utilizationBusiness situationProfit marginEmploymentOrder books
Q411
Q111
Q110
Q109
Q108
Q107
Q12006
Source: Reserve Bank of India. http://www.rbi.org.in (accessed 20 March 2012).

170 Asian Development Outlook 2012
improvement in domestic fundamentals. FDI is likely to increase only modestly; however, external borrowings are set to remain healthy given the interest rate differential with advanced economies. The current account deficit is expected to be financed by capital flows.
The above forecasts are subject to a number of risks. The global environment remains fragile and a worsening of the situation in the eurozone would have a significant adverse impact. A poor monsoon, fiscal slippage, or a continued policy logjam to resolve some of the long-standing issues would also prove detrimental to growth.
Policy challenge—attracting FDIIn view of the large investment needs of the economy, especially infrastructure, a reasonable current account deficit is appropriate, notwithstanding India’s high savings rate. The government’s clear preference is for the deficit to be financed by equity flows rather than debt flows and for FDI over volatile portfolio flows.
FDI has increased in recent years from the 1990s’ negligible levels, but remains small relative to comparable destinations: according to UNCTAD’s World Investment Report 2011
A key issue confronting FDI is acquisition of land for economic activity as it involves a number of complex issues. These include use of agricultural land for non-agricultural purposes, adequate compensation, displacement of people—including indigenous tribal populations—and the dichotomy between state and center laws, which in many cases has impeded investment. The Land Acquisition, Rehabilitation and Resettlement Bill, introduced in Parliament in 2011, addresses some of these issues, although reaching a consensus among the various stakeholders is likely to be arduous.
Environmental issues such as high ecological costs and concerns about tribal rights have held up some foreign projects. In mining, for example, securing licenses and clearances has become contentious, given that most mineral deposits are in forested areas, home to the country’s indigenous tribes. The draft Mining and Minerals Development and Regulation Bill is deemed by the industry as taxing it too heavily. Similarly, government initiatives, like guidelines for the Comprehensive Environmental Pollution Index and demarcation of stretches of ecologically sensitive coastline, need to ensure that they do not deter investment in critical sectors.
Certain elements of labor laws deter investment, and need to be revisited if India is to attract FDI into labor-intensive manufacturing. The need for labor market reforms has been long recognized by policy makers but the issue is highly fraught, lacking the necessary political support for change. Weak infrastructure, especially in the areas of transport, power, and education and training, has also reduced India’s attractiveness to FDI.
Finally, inconsistent policy making can also damp investor confidence by raising transaction costs and uncertainty about the business environment. Reducing the number of clearances and introducing single-window nodal agencies can help to remove regulatory hurdles and fast-track projects.
3.17.1 Selected economic indicators (%)
2012 2013
GDP growth 7.0 7.5
Inflation 7.0 6.5
Current account balance (share of GDP)
-3.3 -3.0
Source: ADB estimates.
3.17.12 FDI inflows
0
30
60
90
120
Russian FederationIndiaPeople's Rep. of ChinaBrazil
1009082007
$ billion
Source: United Nations Conference on Trade and Development. World Investment Report 2011.

Maldives
The economy grew fast in 2011 owing to continued strong growth in mainly Asia-sourced tourism, but still has to grapple with hefty fiscal and external imbalances. A devaluation of the local currency in April 2011 should help, over the longer term, counter dollar shortages, though it has pushed inflation higher. The resignation in February 2012 of the president—succeeded by the vice president, from the opposition—was met with unrest and has raised uncertainty for the outlook. The impact on tourism, however, is expected to be limited.
Economic performance The economy grew by 7.5% in 2011, supported by continued buoyant growth in tourism and related sectors such as construction, transport, and communications (Figure 3.18.1). Tourism, accounting for about 30% of GDP, saw a second year of strong recovery with arrivals up by 17.6% (Figure 3.18.2). An influx of visitors from the Peoples’ Republic of China (up by 67%) and elsewhere in Asia (up 13%) again drove the expansion, while growth of European tourists slowed to 6%. Asian visitors now make up a third of the market.
Fisheries, the main source of employment in the outer atolls, has steadily declined from its peak in 2006. The total catch declined by about 5% in 2011, although the value of fish exports posted a strong gain on increases in price and volume of sales. The volume of the fish catch is not expected to improve, given the continued decline of fish resources in the Indian Ocean.
Inflation in 2011 moved to double digits, reflecting a steep rise in prices of fish, a staple, and increases in global food and oil prices, exacerbated by a 16% devaluation of the local currency against the US dollar (Figure 3.18.3).
The budget deficit improved substantially to 10.2% of GDP (16.1% in 2010). Although further tax reform was delayed, the Tourist General Service Tax (T-GST) that came into effect during the year helped lift revenue by 38.9%. Growth in expenditure was kept to 12.4% in line with the expansion in nominal GDP, holding expenditure to just over 40% of GDP.
Broad money supply (M2) increased by about 20%, driven by the rise of government claims and expansion of private sector credits. Credit to the private sector grew by 6%, largely owing to an increase in wholesale and retail trade and investment in resort development.
The current account deficit is estimated to have widened to
reflecting the economic recovery, much higher commodity prices, and
3.18.1 Contributions to growth (supply)
10.6 12.2
-4.7
5.77.5
-6
0
6
12
18
2007 08 09 10 11
Percentage points
ServicesIndustryAgricultureGDP
Source: Maldives Monetary Authority. 2012. Monthly Statistics. February. http://www.mma.gov.mv.
This chapter was written by Huiping Huang of the South Asia Department, ADB,
Manila.
3.18.2 Tourist arrivals
0
200
400
600
800
1,000
Other areasEuropeOther Asian countriesPeople’s Republic of China
111009082007
Thousands
Source: Maldives Monetary Authority. 2012. Monthly Statistics. February. http://www.mma.gov.mv
3.18.1 Selected economic indicators (%)
2012 2013
GDP growth 3.5 4.5
Inflation 4.5 7.5
Current account balance (share of GDP)
-38.0 -38.0
Source: ADB estimates.

172 Asian Development Outlook 2012
improved tourism receipts. Preliminary estimates indicate that financing fell short of the deficit and gross international reserves went down by
Economic prospectsThe economic outlook is of course tightly interwoven with developments in tourism. The political instability and unrest in the capital Malé and other atolls in early 2012, which were widely reported in the foreign media, caused some cancellations and will likely hold back the growth in bookings in 2012. Still, the Maldives has an established reputation as a high-quality destination and has traditionally strong marketing links with Europe and demand is fast growing among Asia’s increasingly affluent middle class.
Assuming no major incidents of unrest in the lead-up to the presidential election (the date has yet to be set) tourism should stay robust. With the outlook underpinned by a sizable expansion in government expenditure, economic growth is expected to moderate to 3.5% in 2012 and then pick up to 4.5% in 2013.
The budget deficit for 2012 is set to ease slightly, but remains heavy at 9.7% of GDP. Total budget revenue in 2012 is expected to rise substantially despite reduced import tariff rates provided in the 2012 budget. Large deficits have been financed both domestically, mainly by issuance of Treasury bills and privatization of state-owned assets over the past several years, and externally by borrowings. But the privatizing approach is reaching a limit, and Treasury-bill financing cannot be sustained in the long term.
A more immediate complication for the budget is that already-programmed multilateral financing could be postponed due to the delays in completing the program because of unmet performance criteria. The GST Act that was approved by Parliament had a lower T-GST rate for 2013 and beyond.
On the expenditure side, the second phase of the redundancy plan of further downsizing the civil service will be difficult to implement in 2012 due to political conditions.
Inflation is expected to moderate in 2012 and then move higher in 2013 on domestic demand pressures, pacing global commodity prices. Pressure from the persistently large fiscal deficit remains, though tightening of monetary policy will be partly offsetting.
With likely slower growth in tourist arrivals, earnings are expected to moderate. Slower growth and an expected modest fall in global oil prices will ease the import bill a little, although the current account deficit will widen and as a share of GDP climb to about 38.0% in 2012 and 2013.
3.18.3 Contributions to inflation in Malé
-5
0
5
10
15
Jan2010
Apr Jul Oct Jan11
Apr Jul Oct Jan12
Percentage pointsOthersHousing, water, electricity, gas, and other fuelFood and non-alcoholic beveragesConsumer price index
Source: Maldives Monetary Authority. 2012. Monthly Statistics. February. http://www.mma.gov.mv
3.18.1 Policy challenge—reducing the budget deficit
Since 2009, the government has sought to implement an economic program aimed at reducing the large fiscal deficit, but with Parliament and presidency in the hands of different political parties, progress has been slow.
It looks set to remain that way in the medium term, too, because, although an initial voluntary redundancy plan for government staff and the first phase of a detailed plan for staff reduction has been carried out, the second phase (or raising taxes) faces strong political resistance.
Expanding the tax base could be one outcome of creating regional economic and commercial centers in larger islands outside Malé, with the right policy incentives for population consolidation.
Such moves would also help diversify the economy from tourism—four-fifths of the economy is directly or indirectly related to the industry—and create a more inclusive growth model other than expanding resorts.
The new centers could help bring forward myriad opportunities for trade, construction, and transport, and creating jobs for locals (tourism relies heavily on expatriate workers).

Nepal
Growth slowed in FY2011 on weaker remittance inflows, a downdraft in real estate, fuel and power shortages, and continued political uncertainty. Inflation stayed hovering around the double-digit threshold, and the banking system came under stress. The outlook is for a modest pickup in growth but with some progress in bringing down inflation. Timely completion of the peace process, including an agreement on a federal structure and on a new constitution, would allow political leaders to focus on spurring growth and development.
Economic performanceEconomic growth dipped to 3.5% in FY2011 (ended 15 July 2011), restrained by slower growth in the worker remittances that underpin consumer spending, a deep correction in the real estate market, and continued political uncertainties (Figure 3.19.1). Expansion in services slowed sharply on hesitant consumer spending and a marked decline in tourism receipts. Industrial growth fell by half, reflecting severe fuel and electricity shortages, weak construction, and the closure of several manufacturing plants owing to labor–management disputes. Favorable weather allowed agricultural output to rebound, but the gain was too little to prevent overall GDP growth from slowing.
Inflation was high in FY2009–2011, broadly mirroring price developments in India, with which Nepal has a pegged exchange rate arrangement and tight trade links (Figure 3.19.2). Escalating food prices were the main driver in the first half of the year and, as these moderated in the second half, nonfood prices picked up, partly because of increases in fuel prices by the Nepal Oil Corporation, the state-owned monopoly supplier. Prices were adjusted several times (political pressure reversed two of the increases), but were inadequate to prevent either a buildup of arrears with the India Oil Corporation or supply disruptions, which led to frequent fuel shortages and transport strikes.
The budget deficit widened from 1.9% to 2.4% of GDP in FY2011: capital spending picked up, marking the government’s moves to improve project implementation, and revenue fell short of target. Revenue collection as a share of GDP fell for a second year, mainly because of sharply weaker growth of customs receipts and value-added tax (VAT) (Figure 3.19.3), damped by stagnant non-oil imports and slow growth in private consumption (a key source of VAT). The deficit was financed mainly by borrowing from banks.
Nepal Rastra Bank, the central bank, focused much of its effort in FY2011 on managing vulnerabilities in the financial sector. In recent years a growing number of small financial institutions have aggressively
3.19.1 Contributions to growth (supply)
2.8
5.8
3.8 4.03.5
-2
0
2
4
6
2007 08 09 10 11
Percentage points
ServicesIndustryAgricultureGDP
Source: Ministry of Finance. 2012. Mid-term Review of the FY2011-12 Budget.
This chapter was written by Yubraj Acharya and Neelina Nakarmi of the Nepal Resident
Mission, ADB, Kathmandu.
3.19.2 Inflation
0
5
10
15
20
Nonfood and servicesFood and beverageOverall inflation
NovAug11
MayFebNovAug10
MayFebNovAug2009
% change
Source: Nepal Rastra Bank. 2012. Recent Macroeconomic Situation. http://www.nrb.org.np

174 Asian Development Outlook 2012
attracted deposits from commercial banks to expand their lending, especially for real estate. As market prices of property have fallen heavily, the share of nonperforming loans has increased throughout the financial system, and several small institutions required emergency assistance. Balance-sheet problems at banks coupled with too few attractive lending opportunities ensured slow growth in credit to the private sector, despite abundant bank liquidity that pushed the interbank rate down (Figure 3.19.4).
With about half the banking system’s credit collateralized by property, the central bank is encouraging bank consolidation through incentives (it has approved six merger deals and is reviewing another six) and intends to use other measures to assist banks through a troublesome period.
The current account deficit slimmed to 0.9% of GDP in FY2011 after widening to 2.7% of GDP a year earlier. Exports, having declined in FY2010, grew by 11.7%, thanks to a rebound in the growth of traditional exports such as carpets and pashmina (Figure 3.19.5), items that mainly go to countries other than India.
Apart from the slower worker remittances—possibly affected by the unsettled times in the main employment destination of the Middle East—a key hindrance to greater improvement in the current account was the higher oil import bill, as non-oil imports were essentially unchanged from a year earlier. The Nepal Tourism Year 2011 campaign did attract tourists over and above the usual numbers, but as most were budget tourists from neighboring countries earnings fell by nearly 10% from a year earlier.
Net capital inflows more than covered the current deficit and
5.8 months of imports (Figure 3.19.6).
Economic prospectsEconomic performance in the forecast period depends primarily on how the political situation evolves. Timely completion of the peace process, including a draft of the constitution ready by the 31 May deadline, will help spur growth, but will require an agreement on federal restructuring—one of the main contentious issues in the peace process. Such closure could allow political leaders to refocus on the economic agenda, paving the way for measures ushering in much-needed private participation in development, boosting business confidence, and improving labor relations. It would also allow them to pursue policies in the Immediate Action Plan for Economic Development and Prosperity, announced in January 2012.
Assuming that the peace process shows success—and that the weather is normal—GDP is projected to grow by 4.5% in FY2012. The improvement from a year earlier will come from faster growth in agriculture and services. Strengthening remittances and rebounding tourism earnings (foreshadowed in the early months of the fiscal year) will buttress services. Industry is notable by its absence as a growth driver: with no improvement expected in power supply, its performance will remain sluggish.
GDP growth will slow to 4.0% in FY2013, around the speed limit for an economy inhibited by long-standing structural bottlenecks and policy
3.19.3 Revenue indicators
0
20
40
60
80
0
10
20
30
40
Total revenue growthNontax revenueCustomsIncome taxValue-added tax
111009082007
NRs billion %
Source: Nepal Rastra Bank. 2012. Recent Macroeconomic Situation. http://www.nrb.org.np
3.19.4 Credit to private sector and interbank rate
0
15
30
45
0
5
10
15
Interbank rateCredit growth to theprivate sector
Dec Jul Jan11
Jul Jan10
Jul Jan2009
% change %
Source: Nepal Rastra Bank. 2012. Recent Macroeconomic Situation. http://www.nrb.org.np
3.19.5 Trade, tourism, and workers’ remittances
0
2
4
6
Tourism receiptsExports
RemittancesImports
111009082007
$ billion
Source: Nepal Rastra Bank. 2012. Recent Macroeconomic Situation. http://www.nrb.org.np

Economic trends and prospects in developing Asia: South Asia Nepal 175
distortions that can be addressed only gradually. Agriculture’s expansion in FY2011 and FY2012 reflects a recovery (from earlier poor weather) that provided a fillip to growth in the sector and to GDP, but that upturn masks deep-seated problems in raising low productivity and growth to the sector’s higher potential.
Inflation gently declined in the first half of FY2012, pointing to an annual average of 8.0%. Food inflation is benefiting from better harvests as well as mitigated global price pressures. The high base effect of the previous year and supportive monetary policies will also keep price rises down. Despite pressures from needed upward revisions in fuel prices, inflation is expected to ease to 7.0% in FY2013, broadly in line with India’s.
On the monetary side, the central bank will maintain its focus on encouraging financial sector consolidation, reforming poorly performing banks, enhancing financial inclusion, and strengthening its own supervisory capacity. Managing commercial banks’ liquidity will remain tricky, given the need to strike a balance between containing inflation and supporting growth (for the latter, the central bank has directed commercial banks to increase lending to agriculture and energy).
The trade deficit will widen over the next 2 years, with faster growth in imports than exports spurred by sustained high oil prices, and by a rise in non-oil imports. Yet the current account is projected to move to a surplus of 0.5% of GDP in FY2012 and to 1.0% of GDP in FY2013 owing to stronger remittances and tourism receipts. Remittances will accelerate because of the high number of out-migrants in FY2011 and wage increments in destination countries; tourism receipts are on the rise, apparently reflecting the delayed impact of the Visit Nepal Year 2011 campaign.
The FY2012 budget, which was announced on time for the first time since the Constituent Assembly elections in 2008, targeted growth in revenue and expenditure of 19% and 25%, respectively, compared with the estimated amounts in FY2011 (Figure 3.19.7). Though ambitious, if these targets are met, they would create a domestic borrowing need of about 2% of GDP—reflecting the government’s continued commitment to fiscal prudence.
Yet the government still faces an uphill task in fiscal management. Recent years have seen the budget increasingly stretched by subsidies, in particular to public enterprises. Such payments in FY2012 are put at about one-fifth of budget expenditure, and rolling them back in a politically charged environment will be hard. Building the physical infrastructure and human resources for the envisaged federal structure will also require heavy spending.
The government needs to end such subsidies, and create a fiscal cushion, including bringing the informal sector into the formal tax base. In addition, expanding the tax base is necessary to reduce dependence on foreign aid, which finances about three-fifths of government capital spending. Public external debt as a share of GDP has stabilized in recent years primarily because the World Bank and ADB (the two largest donors) have been providing a significant share of their contribution in the form of grants, but at more than one-third of GDP, it warrants prudent debt management.
3.19.6 Gross international reserves
0
1
2
3
4
Dec Jul Jan11
Jul Jan10
Jul Jan2009
$ billion
Source: Nepal Rastra Bank. 2012. Recent Macroeconomic Situation. http://www.nrb.org.np
3.19.7 Fiscal indicators
-10
0
10
20
Fiscal deficitRevenue including grantsCapital expenditure Current expenditure
111009082007
% of GDP
Source: Asian Development Outlook database.
3.19.1 Selected economic indicators (%)
2012 2013
GDP growth 4.5 4.0
Inflation 8.0 7.0
Current account balance (share of GDP)
0.5 1.0
Source: ADB estimates.

176 Asian Development Outlook 2012
Policy challenge—politically induced market distortions
In recent years, the economy has suffered from several market distortions, originating mainly in the fragile political environment and compounded by poor law enforcement (Table 3.19.2). These distortions—seen most clearly in electricity theft and technical leakages (estimated at 29% of total output), business cartels, fuel hoarding and frequent shortages, and transport syndicates—are responsible for keeping prices high and for exacerbating the already-poor investment climate.
Fuel shortages are a direct result of the slow reform of Nepal Oil Corporation. It subsidizes petrol, diesel fuel, and liquefied petroleum gas. The subsidies are partly financed by profits on sales of kerosene and aviation turbine fuel, which are sold above the international price. The prices of subsidized items are being adjusted upward, but there is strong political pressure to maintain high subsidies. The corporation’s losses came to NRs11 billion (0.8% of GDP) in FY2011.
The government’s decision to recruit a professional managing director for the corporation is a step in the right direction, but wholesale reform, accompanied by complete deregulation of oil prices and legal provisions to allow private service providers in the market, is needed. (Well-directed social protection measures would, of course, be required.) Ultimately, the corporation should cover its own operating costs and make a reasonable return on the government’s invested capital.
The country reels under severe power shortages, lasting up to 16 hours a day during the winter months of low hydropower generation, because potential demand is twice current supply. Fixing this situation to provide a foundation for exploiting the country’s vast water resources for power generation will be difficult as it requires huge public expenditure as well as public–private partnerships for financing. The first step is to reform Nepal Electricity Authority, allowing it to set tariffs that would induce investment and to tackle its arrears and power theft, without undue political friction.
The current reform of Agriculture Development Bank, which was originally fully owned by the government, lends credence to the view that well-sequenced reforms of human resources, information technology, and commercialization can turn a poorly performing institution into a financially viable entity without impairing its development mission. Nepal has 36 public enterprises, and 11 of them incurred heavy losses in FY2011. Many—particularly the ones with many employees, such as the Nepal Water Supply Corporation—have losses greater than their assets, reflecting the urgent need for public enterprise reform.
3.19.2 The most problematic factors for doing business (% of responses)
Government instability/coups 21.8
Inefficient government bureaucracy 11.8
Policy instability 10.4
Corruption 10.0
Inadequate supply of infrastructure 8.6
Restrictive labor regulations 8.1
Access to financing 7.7
Poor work ethic in national labor force 7.2
Inadequately educated workforce 3.4
Inflation 3.4
Tax regulations 2.5
Crime and theft 2.3
Foreign currency regulations 1.1
Tax rates 1.1
Poor public health 0.6
Note: From a list of 15 factors, respondents were asked to select the five most problematic factors for doing business in their country and to rank them between 1 (most problematic) and 5.
Source: World Economic Forum. 2011. The Global Competitiveness Report 2011-2012. http://www.weforum.org/issues/global-competitiveness

Pakistan
The economy continues to be affected by structural problems, including a domestic energy crisis, a precipitous decline in investment, persistently high inflation, and security issues. Budget deficits remain high, driven by substantial subsidies and losses at state-owned enterprises, and tax revenue below target. The slow growth in recent years was exacerbated by widespread floods in FY2011. Unless progress can be made in resolving these fundamental problems, the growth outlook will stay modest.
Economic assessmentSevere floods at the start of FY2011 (ended 30 June 2011) disrupted economic activity in most sectors in the first half of the year. A slight recovery during the second half—supported by higher prices for key exports and expanded services activity in part related to flood relief—kept growth positive at 2.4% for the year (Figure 3.20.1). Solid growth in livestock, minor crops, and wheat and sugarcane outweighed a marked fall in cotton and rice harvests to allow a 1.2% expansion in agriculture.
Industry, however, stagnated under the weight of energy shortages and low investment. Thus for the fourth year the economy was characterized by low growth (a period average of 3%), well below the estimated 7% needed to provide a firm basis to provide jobs to new labor-force entrants, increase per capita income, and reduce poverty.
A surge in workers’ remittances, higher civil service salaries, greater farm income from increases in commodity prices, and higher outlays in the wake of the floods lifted total consumption expenditure by 7%, which accounted for more than 90% of GDP growth in FY2011.
Investment continued to shrink, reflecting structural and security issues: gross fixed investment has declined for 4 years, from about 21% of GDP in FY2007 to 11.8% in FY2011 (Figure 3.20.2), the lowest rate since FY1974. This trend raises concerns that production capacity is being eroded, undermining growth prospects for the near and medium term.
Inflation, already under pressure from increasing global commodity prices, remained high, reflecting flood-related shortages, especially for food, and higher costs due to damaged transport networks. Peaking at more than 15% in December 2010, inflation eased modestly in the second half, and declined to 13.3% for the year to June 2011.
Responding to price pressures, the central bank tightened monetary policy in FY2011, raising the discount rate by 50 basis points in each of July, September, and November 2010, bringing it to 14%. As inflation stabilized and the balance of payments strengthened in the second half, the central bank made no further increases in the rate for the rest of FY2011.
Higher than planned budget expenditure and declining foreign
3.20.1 GDP growth by sector
-3
0
3
6
9
ServicesIndustryAgricultureGDP
111009082007
%6.8
2.4
3.8
1.73.7
Source: Ministry of Finance. Pakistan Economic Survey 2010–11. http://www.finance.gov.pk
This chapter was written by Dawn Elizabeth Rehm and Farzana Noshab of the Pakistan
Resident Mission, ADB, Islamabad.
3.20.2 Gross fixed capital formation
0
5
10
15
20
25
Private sectorTotal
111009082007
% of GDP
Source: CEIC Data Company (accessed 23 March 2012).
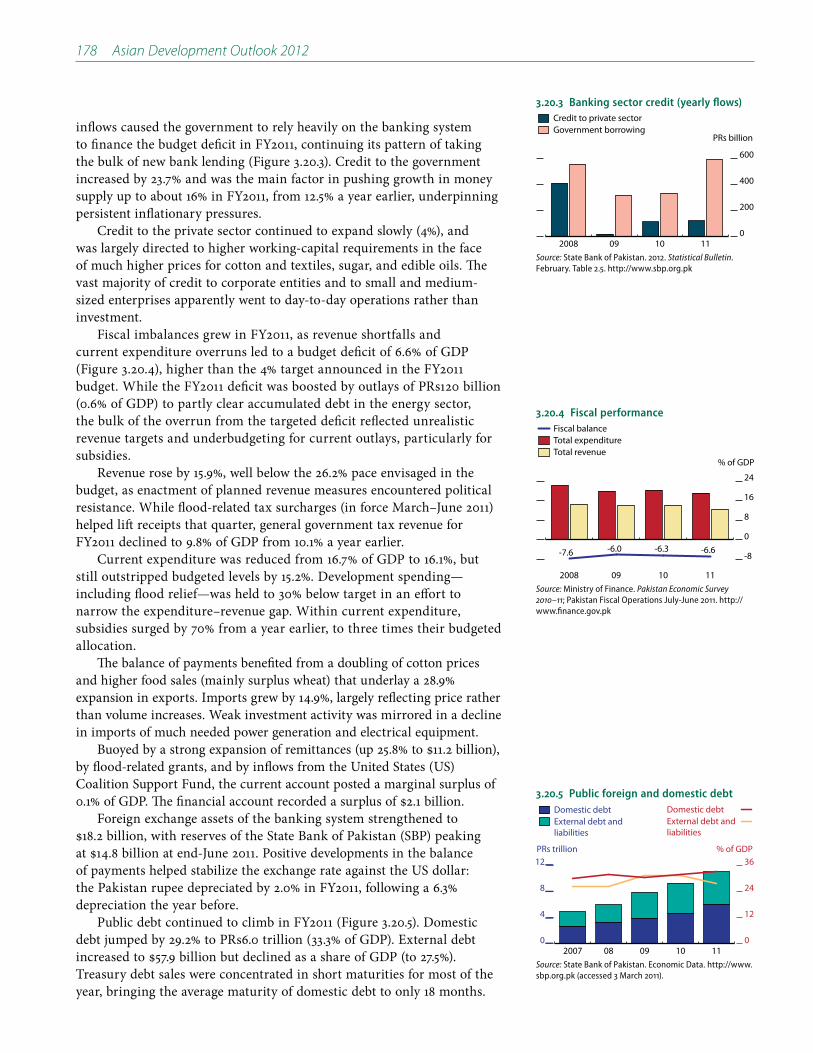
178 Asian Development Outlook 2012
inflows caused the government to rely heavily on the banking system to finance the budget deficit in FY2011, continuing its pattern of taking the bulk of new bank lending (Figure 3.20.3). Credit to the government increased by 23.7% and was the main factor in pushing growth in money supply up to about 16% in FY2011, from 12.5% a year earlier, underpinning persistent inflationary pressures.
Credit to the private sector continued to expand slowly (4%), and was largely directed to higher working-capital requirements in the face of much higher prices for cotton and textiles, sugar, and edible oils. The vast majority of credit to corporate entities and to small and medium-sized enterprises apparently went to day-to-day operations rather than investment.
Fiscal imbalances grew in FY2011, as revenue shortfalls and current expenditure overruns led to a budget deficit of 6.6% of GDP (Figure 3.20.4), higher than the 4% target announced in the FY2011 budget. While the FY2011 deficit was boosted by outlays of PRs120 billion (0.6% of GDP) to partly clear accumulated debt in the energy sector, the bulk of the overrun from the targeted deficit reflected unrealistic revenue targets and underbudgeting for current outlays, particularly for subsidies.
Revenue rose by 15.9%, well below the 26.2% pace envisaged in the budget, as enactment of planned revenue measures encountered political resistance. While flood-related tax surcharges (in force March–June 2011) helped lift receipts that quarter, general government tax revenue for FY2011 declined to 9.8% of GDP from 10.1% a year earlier.
Current expenditure was reduced from 16.7% of GDP to 16.1%, but still outstripped budgeted levels by 15.2%. Development spending—including flood relief—was held to 30% below target in an effort to narrow the expenditure–revenue gap. Within current expenditure, subsidies surged by 70% from a year earlier, to three times their budgeted allocation.
The balance of payments benefited from a doubling of cotton prices and higher food sales (mainly surplus wheat) that underlay a 28.9% expansion in exports. Imports grew by 14.9%, largely reflecting price rather than volume increases. Weak investment activity was mirrored in a decline in imports of much needed power generation and electrical equipment.
by flood-related grants, and by inflows from the United States (US) Coalition Support Fund, the current account posted a marginal surplus of
Foreign exchange assets of the banking system strengthened to
of payments helped stabilize the exchange rate against the US dollar: the Pakistan rupee depreciated by 2.0% in FY2011, following a 6.3% depreciation the year before.
Public debt continued to climb in FY2011 (Figure 3.20.5). Domestic debt jumped by 29.2% to PRs6.0 trillion (33.3% of GDP). External debt
Treasury debt sales were concentrated in short maturities for most of the year, bringing the average maturity of domestic debt to only 18 months.
3.20.3 Banking sector credit (yearly flows)
0
200
400
600
Government borrowingCredit to private sector
1110092008
PRs billion
Source: State Bank of Pakistan. 2012. Statistical Bulletin. February. Table 2.5. http://www.sbp.org.pk
3.20.4 Fiscal performance
-8
0
8
16
24
Fiscal balance
Total revenueTotal expenditure
1110092008
% of GDP
-7.6 -6.6-6.3-6.0
Source: Ministry of Finance. Pakistan Economic Survey 2010–11; Pakistan Fiscal Operations July-June 2011. http://www.finance.gov.pk
3.20.5 Public foreign and domestic debt
0
4
8
12
0
12
24
36
External debt and liabilities
Domestic debtExternal debt and liabilities
Domestic debt
111009082007
PRs trillion % of GDP
Source: State Bank of Pakistan. Economic Data. http://www.sbp.org.pk (accessed 3 March 2011).

Economic trends and prospects in developing Asia: South Asia Pakistan 179
Economic prospectsThe economy is expected to grow modestly without a more predictable energy supply and improved investment flows. Evidence from the FY2011 Household Integrated Economic Survey indicates a widening income gap between rich and poor, with income for the two lowest quintiles (40% of the population) growing more slowly than the average. In addition, food inflation has averaged 18% a year for the past 3 years (much higher than overall inflation), ensuring that a larger share of income, particularly for the lower quintiles, is required to meet this essential need. With low investment and economic growth below the pace needed to accommodate the predominately young population, the rich– poor income gap is set to widen further.
Energy outages and damage to the cotton crop from floods (for the second consecutive year) in early FY2012 are expected to hold fiscal year growth to 3.6%. The impact of substantial gas and power load-shedding from December 2011 and continuing into FY2012 is holding down both manufacturing output and export performance.
Moreover, textile manufacturers report substantial reductions in orders this year, as unpredictable energy outages prevented many of them from meeting their production commitments last year. Manufacturers’ associations have expressed concerns that energy outages will nullify any potential gains from European Union tariff waiver concessions (on 75 items, including textiles, approved in February 2012).
With little relief expected for power shortages and assuming no major floods similar to those experienced in the past 2 years, economic growth in FY2013 is forecast to strengthen marginally to 4.0%. Private and government consumption expenditure should continue to drive growth, as investment remains depressed.
After slowing to 9.7% in December 2011, inflation (year on year) picked up to 11% in February 2012 (Figure 3.20.6). Core inflation remains near double digits, pointing to continued persistence of inflationary pressures. Increases in energy prices in March 2012 and further expected adjustments will keep upward pressure on prices. For FY2012 as a whole, average inflation is projected at 12.0%. On assumptions of a strengthened budget performance and broad stability in oil and other global commodity prices, inflation could ease to 10.0% in FY2013.
Slower inflation and measures by the government to contain borrowing from the SBP supported an easing of monetary policy. In two separate steps (July and October 2011), the central bank reduced the policy rate by 200 basis points to 12%. With a weakening overall balance of payments, however, and a decline in reserves, the SBP has kept the rate at 12%.
Fiscal developments for FY2012 present a mixed picture. Federal Board of Revenue collections are much improved, running a full 33% ahead of last year’s performance for the first 6 months (Figure 3.20.7). This reflects improved economic activity in the first half of the year, as well as extension of the flood-related tax surcharges and improvements to tax administration. Yet it is unclear that the overall revenue target for FY2012 will be achieved, as this in part depends on the sale of third-generation telecoms licenses in the latter part FY2012—a sale already rescheduled over the past 2 years.
3.20.1 Selected economic indicators (%)
2012 2013
GDP growth 3.6 4.0
Inflation 12.0 10.0
Current account balance (share of GDP)
-1.8 -1.9
Source: ADB estimates.
3.20.7 Federal Board of Revenue tax collections
500
1,000
1,500
2,000
3
6
9
12
ShareLevel
Jul−Dec 2012
2012 Target
1110090807062005
PRs billion % of GDP
9.1 8.69.19.19.89.89.4
Sources: Ministry of Finance. Pakistan Economic Survey 2010–11; Federal Board of Revenue. http://www.fbr.gov.pk (accessed 26 Jan 2012).
3.20.6 Inflation and policy rate
0
8
16
24
Policy rateCoreFood Overall inflation
Jan12
OctJul AprJan11
OctJul2010
%
Source: State Bank of Pakistan. Economic Data. http://www.sbp.org.pk (accessed 3 March 2011).

180 Asian Development Outlook 2012
Despite the implementation of an automated pass-through of input price increases to electricity tariffs, the overrun on energy subsidies is expected to be more than triple the amount budgeted, at slightly above 2% of GDP, as key energy-efficiency measures have been delayed and state-owned enterprises continue to absorb the losses. Taken together, uncertainties over nontax revenue and higher than targeted current expenditure point to a budget deficit in excess of the 4.7% of GDP target.
The external accounts are increasingly fragile, as the current account returns to deficit (Figure 3.20.8), with scant cushion from the financial and capital accounts. Lower prices for key export commodities, particularly cotton, combined with higher import prices, pushed the current account from near balance for the first 7 months of FY2011 to a deficit of
remain unchanged as a share of GDP over the rest of FY2012—as strong growth in remittances continues to offset a widening trade balance—increasing slightly to 1.9% in FY2013.
Growth in export receipts slowed to 7.2% for the first 7 months of FY2012 from 20.1% for the same period the previous year, as cotton prices declined and export industries were hit by increased load-shedding. Imports were 17.7% higher, largely reflecting substantial payments for oil. The services account showed similar signs of deterioration, with services exports contracting by 22.0% as inflows from the US Coalition Support Fund declined.
Workers’ remittances expanded by 23.4% during July 2011–February 2012, slightly slower than the pace for the same period a year earlier.
7 months of FY2012 (Figure 3.20.9), reflecting the current account deficit and a sharp narrowing of the capital and financial account surplus as inflows continued to fall and debt service payments mount. Reacting to pressure on reserves, the Pakistan rupee depreciated by 5.7% against the US dollar in the first 8 months (Figure 3.20.10).
Policy challenge—efficiency constraintsPower is the main constraint for economic growth, as load-shedding intensifies and becomes less predictable (Box 3.20.1). Estimates from the Planning Commission suggest that losses arising from power and gas shortages held down GDP growth by 3–4 percentage points in FY2011 and FY2012. Improved management of power resources could ameliorate predictability of load-shedding to allow the private sector to better schedule work and minimize costs.
The current system, with tariff and collections below cost recovery, is a major deterrent to investment for capacity expansion in the sector. Cost recovery has not yet been achieved despite substantial increases in tariffs over the past 2 years, and measures to bring down costs have not been effective. For every unit of power sold, there is a loss to the sector reflected in the form of subsidies or accumulation of losses in the state-owned power companies. An outstanding accumulation of PRs220 billion was carried into FY2012, and an additional financing of 1–1.5% of GDP is likely to be required in FY2012. Implementation of many of the actions taken by the government has been complicated by legal challenges.
3.20.8 Components of the current account balance
-15
-10
-5
0
5
10
-30
-20
-10
0
10
20
2007 08 09 10 11 Jul−Jan FY11
Jul−Jan FY12
% of GDP$ million
ServicesIncome Trade balance
Current account balanceCurrent transfers
Source: State Bank of Pakistan. Economic Data. http://www.sbp.org.pk (accessed 26 January 2012).
3.20.9 Liquid foreign exchange reserves with the State Bank of Pakistan
0
4
8
12
16
MarJan12
NovSepJul11
111009082007
$ billion
Source: State Bank of Pakistan. http://www.sbp.org.pk (accessed 1 February 2012).
3.20.10 Nominal exchange rate
94
90
86
82
78
Jan12
JulJan11
JulJan10
JulJan2009
PRs/$
Source: State Bank of Pakistan. 2012. Statistical Bulletin. February. http://www.sbp.org.pk

Economic trends and prospects in developing Asia: South Asia Pakistan 181
State-owned enterprises represent a heavy drain on fiscal resources. Pakistan Railways, Pakistan International Airlines, and Pakistan Steel Mills have incurred steep losses for the past several years. The challenge of improving efficiency and putting these enterprises on a viable commercial footing is formidable. Reforms are needed, including a separation of these enterprises from operational interference by government ministries.
The power shortage is the main factor constraining economic growth. The supply-demand gap at peak hours reached over 5,000 megawatts (MW) in FY2011 (Box figure 1). This reduced economic output, hitting manufacturing the hardest.
The cause of the power sector crisis can be divided into three pillars: cost-efficient generation capacity not keeping up with demand, financial issues, and management issues.
The supply–demand gap has widened because of a lack of investment in energy. The government has in fact added 1,604 MW to the system by commissioning six new independent power producers (1,264 MW) and a nuclear power plant (340 MW). A 49.5 MW wind power plant has recently obtained financing.
However, other domestic resources (hydro, gas, and coal) have not grown enough to cover demand, thereby increasing reliance on imported fuel oil. The energy mix has changed from predominantly hydro to thermal, which consists of domestic gas and imported fuel oil.
Industrial, retail, and fertilizer users are competing for the depleting gas supply, the preferred fuel for existing thermal plants. Plans to increase domestic gas production, import liquefied natural gas, pipe gas from neighboring countries, or bring in electricity from Central Asia have yet to materialize.
Financial issues are rooted in the fact that the cost-recovery tariff determined by the National Electric Power
Regulatory Authority is not applied to customers. Thus the government bears the differential as a subsidy. Losses and costs excluded from the tariff formula also accumulate at the public sector company level. The lack of financing leads to arrears for the power generation and fuel companies.
Timely payment to these companies, essential for the sector’s reliability, has become increasingly difficult, partly because of increased dependence on imported fuel, which is subject to wide price fluctuations. The cost of (oil-based) power generation in the country escalated by almost 40% in the 2 fiscal years ending FY2011. Despite steep increases in tariff and fuel price adjustments, customer tariffs remain below cost recovery, requiring large government subsidies to keep the system operating (Box figure 2).
The focus on massively increasing spending on power subsidies, reforms, and efficiency measures has been unable to remedy the accumulation of arrears in the system.
To improve management, the government has appointed independent boards for the public power companies to select chief executive officers for these companies. Efforts are also ongoing to decrease commercial and technical losses (around 20%). However, these efforts have been overshadowed by the increase in costs and unwillingness of some customers to pay the higher tariffs.
For a sustainable and reliable power sector, a multiyear plan with solid support from customers and other stakeholders needs to be implemented.
3.20.1 Energy challenges
1 Deficit in demand and supply
-10,000
0
10,000
20,000
Surplus/(Deficit)Demand during system peak hoursGeneration capability
111009082007
Megawatt
Sources: Government of Pakistan. National Electric Power Regulatory Authority (NEPRA). State of Industry Report 2011.
2 Power subsidies
0
100
200
300
400
TargetActualTargetActualTarget
PRs billion
2010 20122011Sources: Ministry of Finance. Pakistan Economic Surrvey 2010–11; Federal Budget 2011–12. http://www.finance.gov.pk

Sri Lanka
Growth stayed high in 2011 despite bad weather, which affected agriculture. A policy to keep the exchange rate stable in the face of credit-fueled strong domestic demand led to a growing trade deficit and loss of official reserves, while nonfood prices trended sharply higher. The authorities in response adopted in February 2012 more flexible exchange rate and monetary-tightening policies, and made steep power and fuel price adjustments. The outlook is for moderate but still strong growth.
Economic performanceThe economy grew at 8.3% in 2011 as the country continued to absorb the benefits of the end of its long-running civil conflict in May 2009 (Figure 3.21.1). Industrial output (accounting for a little less than one-third of GDP) expanded by 9.6%. Within that, manufacturing grew by 8.1%, led by the export-oriented readymade garment industry. Construction and mining came in at double-digit growth, reflecting projects started since the conflict ended.
Services, the largest component of GDP (three-fifths), climbed by 8.8%. Hotel and restaurant activity was up by one-third, reflecting a 30.8% increase in tourist arrivals. Both transport and communications grew with the further integration of the northern and eastern provinces (former conflict areas) with the rest of the economy.
Agricultural output, however, was hit by adverse weather and heavy flooding in early 2011 and was down in the first half, but it picked up in the second to show annual growth of 2.5%.
Private consumption remained the main driver of economic expansion, fueled by remittances, greater demand from the northern and eastern provinces, and salary increases for civil servants and the defense forces. Investment activity also strengthened owing to implementation of major infrastructure development initiatives (especially in transport, energy, water, sanitation, and irrigation) and rising business investment, including international companies seeking a foothold in a fast-expanding economy. Private investment focused on tourism, telecommunications, manufacturing, and housing.
Overall inflation remained in single digits in 2011, averaging 6.7% and little changed from a year earlier (Figure 3.21.2). Food inflation, though, was volatile, reflecting flood damage, crop failures, and price pressure early in the year and, later, declining prices as production recovered. Nonfood inflation trended upward, due to strong demand and price increases for diesel, petrol, kerosene, liquefied petroleum gas, and bus fares late in 2011 and in February 2012, when it reached 9.2%. Fuel prices were suppressed during 2011 as international oil prices shot up by 41%
3.21.1 Contributions to growth (supply)
0
2
4
6
8
10
GDP Agriculture Industry Services
111009082007
Percentage points
6.88.38.0
3.5
6.0
Sources: Central Bank of Sri Lanka. Recent Economic Developments Highlights of 2011 and Prospects for 2012. http://www.cbsl.gov.lk; ADB estimates.
This chapter was written by Tadateru Hayashi, Nimali Hasitha Wickremasinghe, and
Savindi Jayakody of the Sri Lanka Resident Mission, ADB, Colombo.
3.21.2 Inflation
-5
0
5
10
15
Overall NonfoodFood
Feb12
Jul Jan11JulJan10
Jul Jan2009
%
Source: Department of Census and Statistics Sri Lanka. http://www.statistics.gov.lk (accessed 12 March 2012).
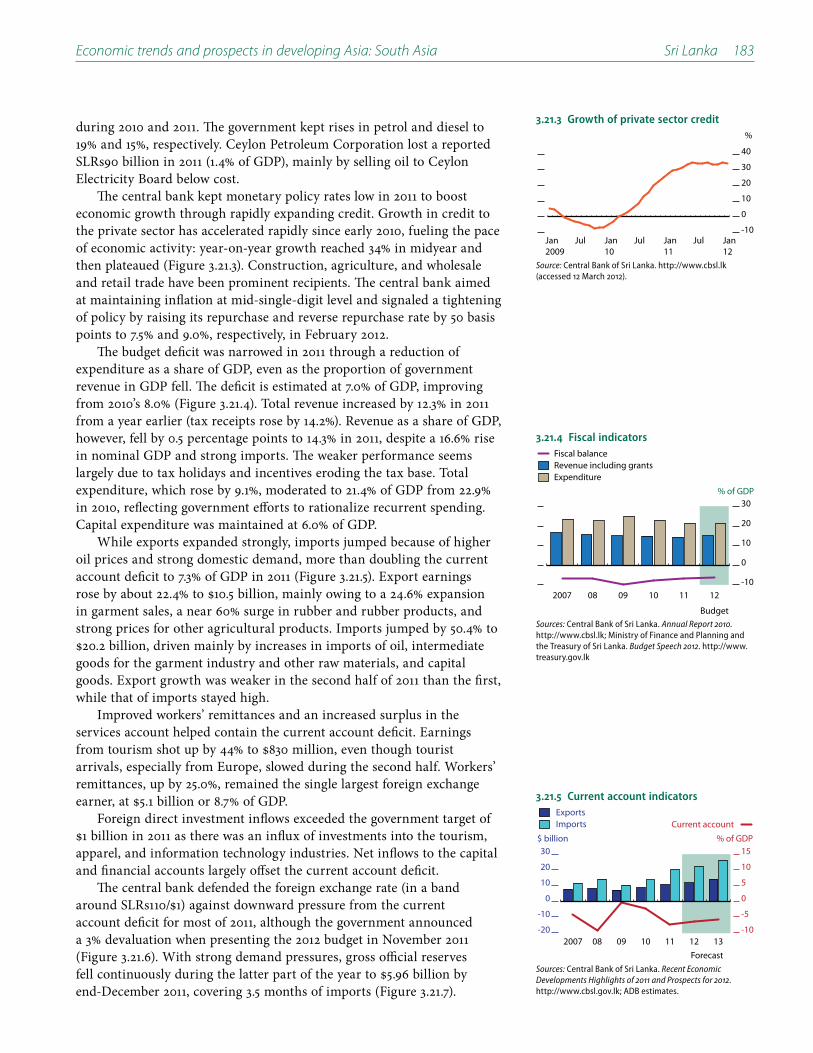
Economic trends and prospects in developing Asia: South Asia Sri Lanka 183
during 2010 and 2011. The government kept rises in petrol and diesel to 19% and 15%, respectively. Ceylon Petroleum Corporation lost a reported SLRs90 billion in 2011 (1.4% of GDP), mainly by selling oil to Ceylon Electricity Board below cost.
The central bank kept monetary policy rates low in 2011 to boost economic growth through rapidly expanding credit. Growth in credit to the private sector has accelerated rapidly since early 2010, fueling the pace of economic activity: year-on-year growth reached 34% in midyear and then plateaued (Figure 3.21.3). Construction, agriculture, and wholesale and retail trade have been prominent recipients. The central bank aimed at maintaining inflation at mid-single-digit level and signaled a tightening of policy by raising its repurchase and reverse repurchase rate by 50 basis points to 7.5% and 9.0%, respectively, in February 2012.
The budget deficit was narrowed in 2011 through a reduction of expenditure as a share of GDP, even as the proportion of government revenue in GDP fell. The deficit is estimated at 7.0% of GDP, improving from 2010’s 8.0% (Figure 3.21.4). Total revenue increased by 12.3% in 2011 from a year earlier (tax receipts rose by 14.2%). Revenue as a share of GDP, however, fell by 0.5 percentage points to 14.3% in 2011, despite a 16.6% rise in nominal GDP and strong imports. The weaker performance seems largely due to tax holidays and incentives eroding the tax base. Total expenditure, which rose by 9.1%, moderated to 21.4% of GDP from 22.9% in 2010, reflecting government efforts to rationalize recurrent spending. Capital expenditure was maintained at 6.0% of GDP.
While exports expanded strongly, imports jumped because of higher oil prices and strong domestic demand, more than doubling the current account deficit to 7.3% of GDP in 2011 (Figure 3.21.5). Export earnings
in garment sales, a near 60% surge in rubber and rubber products, and strong prices for other agricultural products. Imports jumped by 50.4% to
goods for the garment industry and other raw materials, and capital goods. Export growth was weaker in the second half of 2011 than the first, while that of imports stayed high.
Improved workers’ remittances and an increased surplus in the services account helped contain the current account deficit. Earnings
arrivals, especially from Europe, slowed during the second half. Workers’ remittances, up by 25.0%, remained the single largest foreign exchange
Foreign direct investment inflows exceeded the government target of
apparel, and information technology industries. Net inflows to the capital and financial accounts largely offset the current account deficit.
The central bank defended the foreign exchange rate (in a band
account deficit for most of 2011, although the government announced a 3% devaluation when presenting the 2012 budget in November 2011 (Figure 3.21.6). With strong demand pressures, gross official reserves
end-December 2011, covering 3.5 months of imports (Figure 3.21.7).
3.21.3 Growth of private sector credit
-10
0
10
20
30
40
Jan12
JulJan11
JulJan10
JulJan2009
%
Source: Central Bank of Sri Lanka. http://www.cbsl.lk (accessed 12 March 2012).
3.21.4 Fiscal indicators
-10
0
10
20
30
Fiscal balance
ExpenditureRevenue including grants
12111009082007
% of GDP
BudgetSources: Central Bank of Sri Lanka. Annual Report 2010. http://www.cbsl.lk; Ministry of Finance and Planning and the Treasury of Sri Lanka. Budget Speech 2012. http://www.treasury.gov.lk
3.21.5 Current account indicators
-20
-10
0
10
20
30
-10
-5
0
5
10
15
Current account ImportsExports
1312111009082007
$ billion % of GDP
ForecastSources: Central Bank of Sri Lanka. Recent Economic Developments Highlights of 2011 and Prospects for 2012. http://www.cbsl.gov.lk; ADB estimates.
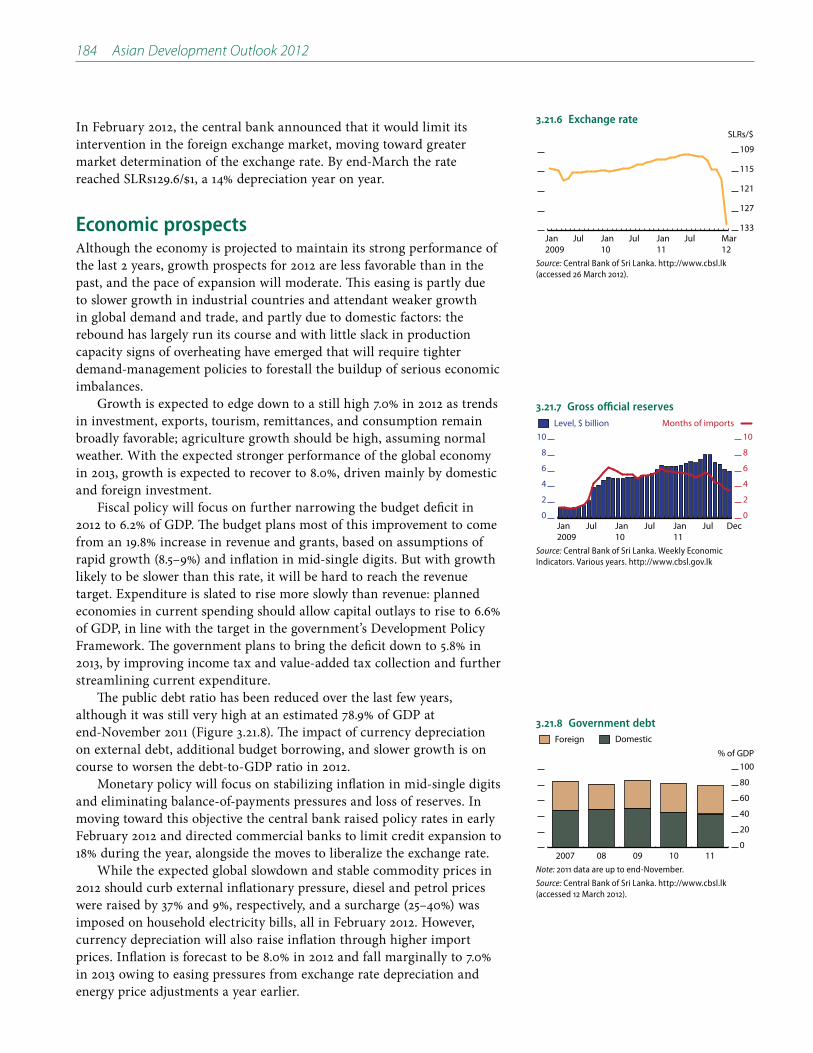
184 Asian Development Outlook 2012
In February 2012, the central bank announced that it would limit its intervention in the foreign exchange market, moving toward greater market determination of the exchange rate. By end-March the rate
Economic prospectsAlthough the economy is projected to maintain its strong performance of the last 2 years, growth prospects for 2012 are less favorable than in the past, and the pace of expansion will moderate. This easing is partly due to slower growth in industrial countries and attendant weaker growth in global demand and trade, and partly due to domestic factors: the rebound has largely run its course and with little slack in production capacity signs of overheating have emerged that will require tighter demand-management policies to forestall the buildup of serious economic imbalances.
Growth is expected to edge down to a still high 7.0% in 2012 as trends in investment, exports, tourism, remittances, and consumption remain broadly favorable; agriculture growth should be high, assuming normal weather. With the expected stronger performance of the global economy in 2013, growth is expected to recover to 8.0%, driven mainly by domestic and foreign investment.
Fiscal policy will focus on further narrowing the budget deficit in 2012 to 6.2% of GDP. The budget plans most of this improvement to come from an 19.8% increase in revenue and grants, based on assumptions of rapid growth (8.5–9%) and inflation in mid-single digits. But with growth likely to be slower than this rate, it will be hard to reach the revenue target. Expenditure is slated to rise more slowly than revenue: planned economies in current spending should allow capital outlays to rise to 6.6% of GDP, in line with the target in the government’s Development Policy Framework. The government plans to bring the deficit down to 5.8% in 2013, by improving income tax and value-added tax collection and further streamlining current expenditure.
The public debt ratio has been reduced over the last few years, although it was still very high at an estimated 78.9% of GDP at end-November 2011 (Figure 3.21.8). The impact of currency depreciation on external debt, additional budget borrowing, and slower growth is on course to worsen the debt-to-GDP ratio in 2012.
Monetary policy will focus on stabilizing inflation in mid-single digits and eliminating balance-of-payments pressures and loss of reserves. In moving toward this objective the central bank raised policy rates in early February 2012 and directed commercial banks to limit credit expansion to 18% during the year, alongside the moves to liberalize the exchange rate.
While the expected global slowdown and stable commodity prices in 2012 should curb external inflationary pressure, diesel and petrol prices were raised by 37% and 9%, respectively, and a surcharge (25–40%) was imposed on household electricity bills, all in February 2012. However, currency depreciation will also raise inflation through higher import prices. Inflation is forecast to be 8.0% in 2012 and fall marginally to 7.0% in 2013 owing to easing pressures from exchange rate depreciation and energy price adjustments a year earlier.
3.21.6 Exchange rate
133
127
121
115
109
Mar12
JulJan11
JulJan10
JulJan2009
SLRs/$
Source: Central Bank of Sri Lanka. http://www.cbsl.lk (accessed 26 March 2012).
3.21.7 Gross official reserves
0
2
4
6
8
10
0
2
4
6
8
10Months of importsLevel, $ billion
DecJulJan11
JulJan10
JulJan2009
Source: Central Bank of Sri Lanka. Weekly Economic Indicators. Various years. http://www.cbsl.gov.lk
3.21.8 Government debt
0
20
40
60
80
100
Foreign Domestic
111009082007
% of GDP
Note: 2011 data are up to end-November.
Source: Central Bank of Sri Lanka. http://www.cbsl.lk (accessed 12 March 2012).

Economic trends and prospects in developing Asia: South Asia Sri Lanka 185
Export growth is expected to fall to 11.0% in 2012, mainly owing to weaker demand, especially from Europe. Still, the trade gap is projected to stabilize, as import growth will also be much slower as higher interest rates, tighter credit, and a marked depreciation in the exchange rate are felt, especially for consumer goods. The current account deficit is projected to edge down to 6.4% of GDP in 2012, reflecting the more stable trade gap and continued large gains in remittance receipts. Growth in tourism-related inflows will take a hit but the sector will stay a major earner.
With stronger industrial-country growth and a pickup in trade in 2013, stronger export growth is projected to help narrow the current account deficit to 6.0% of GDP.
Policy challenge—boosting private investmentThe government’s Development Policy Framework for 2010–2016 aims to raise GDP growth to above 8% in the medium term and to nearly
period. The government has therefore embarked on an ambitious plan to remove infrastructure bottlenecks. It has already undertaken significant investments in some sectors, especially among the major infrastructure development initiatives.
The government, as seen in the framework, would like to see a greater role for the private sector through increased investment by both domestic and foreign investors, as investment is key for increasing supply capacity and bolstering growth. The framework also seeks private investor participation (beyond the traditional areas of industry and commerce) in infrastructure. The framework projects private investment to rise from around 21% of GDP in 2011 to about 26–28% in the next few years.
Yet despite the improved political and economic environment, growth in private investment—domestic and foreign—is falling below planned levels. One reason is that the government has taken only a few steps to reduce red tape and improve the business climate, needed to create the conditions for ramping up private investment. Although Sri Lanka’s position in the World Bank’s Doing Business index has improved in 2012 to 89 (out of 183 countries) from 98 in 2011, some challenges still deter private investment (Figure 3.21.9), especially paying taxes.
Investor confidence is a key factor in attracting investment and this requires a predictable policy environment as articulated and reinforced through the legal, regulatory, and institutional framework. Thus the lack of such an environment for the private sector is a major obstacle to private sector development. Developing that framework will reduce uncertainties in the business environment and avoid unplanned actions that may send mixed signals to potential investors.
3.21.9 How Sri Lanka ranks on Doing Business indicators
1
51
101
151
Starting abusiness (38)
Dealing with construction permits (111)
Registering property (161)
Getting credit (78)
Protecting investors (46)
Paying taxes (173)
Trading across borders (53)
Enforcing contracts (136)
Resolving insolvency (42)
Getting electricity (95)
Note: Numbers in parentheses show ranking out of 183 countries worldwide, 1 = best.
Source: The World Bank. Doing Business database. http://www.doingbusiness.org/data (accessed 20 March 2012).
3.21.1 Selected economic indicators (%)
2012 2013
GDP growth 7.0 8.0
Inflation 8.0 7.0
Current account balance (share of GDP)
-6.4 -6.0
Source: ADB estimates.
Southeast Asia
Brunei Darussalam
Cambodia
Indonesia
Lao People’s Democratic Republic
Malaysia
Myanmar
Philippines
Singapore
Thailand
Viet Nam

Brunei Darussalam
This hydrocarbon-based economy grew slightly faster in 2011 and is expected to maintain modest growth during the forecast period. The pace of inflation lifted last year, but will likely ease in 2012. Substantial fiscal and current account surpluses provide a cushion against shocks. Diversifying sources of growth is the main challenge.
Economic performanceThe economy grew by an estimated 2.9% in 2011, quickening from a revised 2.6% in 2010 (Figure 3.22.1). Growth stemmed from production and exports of natural gas and crude oil, which account for two-thirds of GDP, and a better performance by the nonenergy sector.
The oil and gas sector expanded by 2.2% in the first 3 quarters of the year, mainly owing to a 5.1% increase in production of liquefied natural gas (LNG). A large methanol plant, opened in May 2010, made its first full-year contribution to growth in 2011.
The nonenergy sector grew by 2.8% in the 3 quarters. It comprises—mainly government—services, and small agriculture and manufacturing output. Government services (about one quarter of the economy) grew by 3.3% in the 3 quarters. Strong growth of about 20% was recorded in air transport and hotels and restaurants services. Manufacture of garments declined for a fourth consecutive year.
Government price controls and subsidies keep inflation to the 1–2% range most years—a bracket again achieved for the full year (2.0% on average). Higher global prices for food and other consumer goods nudged up inflation to 2.8% year on year in October 2011, before it receded (Figure 3.22.2). Tobacco prices jumped after the government raised excise duties on tobacco in November 2010.
Helping to contain inflation, the Brunei dollar appreciated against the US dollar by 8.4% on average last year, a result of its peg to the Singapore dollar through a currency board arrangement.
Merchandise exports, mostly LNG and oil, rose by an estimated
hydrocarbons. According to import data from Japan and the Republic of Korea, the biggest LNG customers, in 2011 these countries together lifted their purchases from Brunei Darussalam of LNG by 39% (to
Merchandise imports are much lower than exports, reflecting the
3.22.1 GDP growth
-3
0
3
6
13 12 11 1009082007
%
ForecastSources: Asian Development Outlook database; ADB estimates.
This chapter was written by Mohammed Parvez Imdad of the Southeast Asia
Department, ADB, Manila.
3.22.2 Monthly inflation
0
1
2
3
4
5
Food and nonalcoholic beveragesOverall
Jan12
OctJulAprJan11
OctJulAprJan2010
%
Source: CEIC Data Company (accessed 28 March 2012).
3.22.1 Selected economic indicators (%)
2012 2013
GDP growth 2.6 3.2
Inflation 1.8 2.0
Current account balance (share of GDP)
50.0 50.0
Source: ADB estimates.

188 Asian Development Outlook 2012
The trade surplus soared and the current account surplus increased to an estimated 50.0% of GDP.
Taxes, dividends, and royalties from hydrocarbons provide the government with about 90% of its revenue to fund wages for the large public sector and finance public services and subsidies. Rising oil prices boosted revenue by 43% in FY2010 (ended 31 March 2011). Government spending fell slightly owing to a decline in capital outlays, leaving a fiscal surplus equivalent to about 16% of GDP.
The government established the Autoriti Monetari Brunei Darussalam in January 2011 to supervise the financial sector and manage monetary affairs. It also set up a Deposit Protection Corporation to insure deposits
being formed to help banks assess the creditworthiness of borrowers.Concerned about rising household debt and banks’ high exposure to
consumer loans, the authorities required banks to curb consumer lending and they tightened limits on credit card debt. The ratio of consumer loans to total credit fell sharply to 39% as at September 2011. Lending to the private sector fell by 5.3% during the first 7 months of 2011.
Economic prospectsThe economy is expected to maintain modest growth during the forecast period, based on solid demand and prices of oil, investment in oil exploration, high levels of government spending, and gradual development of the nonenergy sector.
Two large export-oriented projects linked to hydrocarbons received
cracker. (The country has only one small oil refinery.)The complex, to be built at the Sungai Liang industrial park by
Japanese companies, could eventually involve six downstream plants to produce chemicals for fertilizers, textiles, and plastics. The refinery and cracker project is planned by a firm from the People’s Republic of China for the Pulau Muara Besar industrial zone. If it proceeds as proposed, it will have capacity of 135,000 barrels of oil a day and produce petroleum products and chemicals for textiles.
Current infrastructure activity includes completing the Pulau Muara Besar port and updating the Brunei international air terminal to double its capacity to 3 million passengers a year.
Inflation is projected to ease slightly to average 1.8% in 2012 as prices of imported food soften. It will edge up in 2013. Large current account surpluses are likely to be sustained, mainly on exports of oil and gas, and on income flows from the country’s overseas investments.
3.9.1 Policy challenge—diversifying growth
Heavy reliance on oil and gas leaves the economy vulnerable to swings in global hydrocarbon prices. It also exposes it to dwindling production, unless exploration companies find new oil and gas fields. Oil output declined from a peak of 219,000 barrels a day in 2006 to 170,000 barrels in 2010.
Moreover, the oil and gas sector employs only about 3% of the work force. The government provides jobs to the majority of those in work, but says it can no longer absorb the growing number seeking employment.
A government drive to attract petrochemicals and other energy-related industries is having some success. Port facilities and an export processing zone are being built to attract manufacturers. The authorities have identified Islamic businesses including halal products, financial, logistics, and telecommunications services, and tourism for development, and have allocated funding for public–private partnerships.
To redress weaknesses in the business environment, the government plans to further cut the corporate income tax rate to 20% (it was 30% in 2006), to tax income from exports of domestically produced goods at just 1%, to lower excise duties for some machinery used in industry, and to set up a Business Facilitation Center.
It might also want to consider opening more areas for private participation and better align public–private remuneration packages so that private business can attract skilled workers.
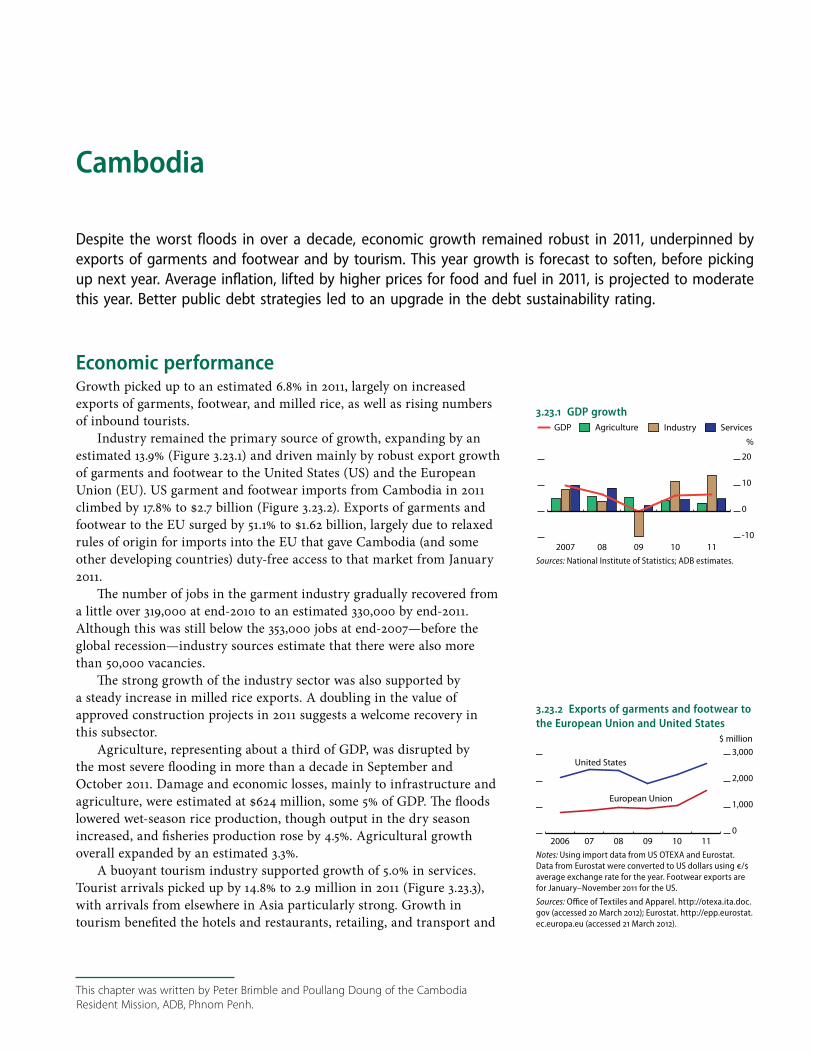
Cambodia
Despite the worst floods in over a decade, economic growth remained robust in 2011, underpinned by exports of garments and footwear and by tourism. This year growth is forecast to soften, before picking up next year. Average inflation, lifted by higher prices for food and fuel in 2011, is projected to moderate this year. Better public debt strategies led to an upgrade in the debt sustainability rating.
Economic performanceGrowth picked up to an estimated 6.8% in 2011, largely on increased exports of garments, footwear, and milled rice, as well as rising numbers of inbound tourists.
Industry remained the primary source of growth, expanding by an estimated 13.9% (Figure 3.23.1) and driven mainly by robust export growth of garments and footwear to the United States (US) and the European Union (EU). US garment and footwear imports from Cambodia in 2011
rules of origin for imports into the EU that gave Cambodia (and some other developing countries) duty-free access to that market from January 2011.
The number of jobs in the garment industry gradually recovered from a little over 319,000 at end-2010 to an estimated 330,000 by end-2011. Although this was still below the 353,000 jobs at end-2007—before the global recession—industry sources estimate that there were also more than 50,000 vacancies.
The strong growth of the industry sector was also supported by a steady increase in milled rice exports. A doubling in the value of approved construction projects in 2011 suggests a welcome recovery in this subsector.
Agriculture, representing about a third of GDP, was disrupted by the most severe flooding in more than a decade in September and October 2011. Damage and economic losses, mainly to infrastructure and
lowered wet-season rice production, though output in the dry season increased, and fisheries production rose by 4.5%. Agricultural growth overall expanded by an estimated 3.3%.
A buoyant tourism industry supported growth of 5.0% in services. Tourist arrivals picked up by 14.8% to 2.9 million in 2011 (Figure 3.23.3), with arrivals from elsewhere in Asia particularly strong. Growth in tourism benefited the hotels and restaurants, retailing, and transport and
3.23.1 GDP growth
-10
0
10
20
ServicesIndustryAgricultureGDP
111009082007
%
Sources: National Institute of Statistics; ADB estimates.
This chapter was written by Peter Brimble and Poullang Doung of the Cambodia
Resident Mission, ADB, Phnom Penh.
3.23.2 Exports of garments and footwear to the European Union and United States
0
1,000
2,000
3,000
11100908072006
$ million
United States
European Union
Notes: Using import data from US OTEXA and Eurostat. Data from Eurostat were converted to US dollars using / average exchange rate for the year. Footwear exports are for January–November 2011 for the US.
Sources: Office of Textiles and Apparel. http://otexa.ita.doc.gov (accessed 20 March 2012); Eurostat. http://epp.eurostat.ec.europa.eu (accessed 21 March 2012).

190 Asian Development Outlook 2012
communications subsectors. Greater public confidence in the financial sector underpinned continued expansion there.
The surge in global prices for food and fuel pushed inflation from 3.3% year on year in January 2011 to 7.1% in June and July. Inflation then began to ease (Figure 3.23.4), although the floods put some upward pressure on rice prices. For the year, inflation averaged 5.5%, up from 4.0% in 2010.
Reflecting the economic pickup, credit to the private sector accelerated from 27% at end-2010 to 31.7% a year later. More than 95% was denominated in foreign currency, mostly US dollars. Broad money (M2, excluding foreign currency outside banks) increased by 21.5% year on year at end-2011, driven by growing foreign currency deposits as a result of increased export earnings. The riel appreciated by 2.9% against the US dollar during 2011.
An expansionary fiscal stance since 2009 has considerably reduced the government’s deposits in the banking system from about 8% of GDP in 2008 to around 4% in 2011 (Figure 3.23.5). The overall fiscal deficit (excluding grants and other expenditure adjustments), though staying high, narrowed to an estimated 7.6% of GDP in 2011 from 8.1% in 2010. Most of the gap (6.5 percentage points of GDP) was financed by external grants and concessional loans, the rest by drawdowns of government deposits.
Domestic revenue, estimated at 12.7% of GDP, fell short of target. Property tax, introduced in July 2010, started to generate income in 2011, making a small contribution. General government spending was above target at 20.2% of GDP.
Concessional assistance from the People’s Republic of China (mainly for infrastructure) as well as private investment (especially in hydropower) played a greater role in financing infrastructure last year than in 2010.
In the external accounts, the rise in shipments of garments, footwear, and milled rice propelled merchandise exports 35.8% higher in US dollar terms in 2011. Imports increased by an estimated 25.9%, largely reflecting purchases of oil, raw materials for garments, and consumer goods. The current account deficit (excluding official transfers), at an estimated 7.1% of GDP, was covered by inflows of foreign direct investment (FDI)
with a sharp increase for the garment industry. Gross official reserves of
A debt sustainability analysis published in February 2012 by the International Monetary Fund and World Bank upgraded Cambodia from moderate risk of debt distress to low risk. External public debt at end-2011 was manageable at 29% of GDP; domestic debt was less than 1% of GDP. In recent years, the People’s Republic of China has become an important creditor, accounting for about two-thirds of total bilateral disbursements in 2010, for example.
The Ministry of Economy and Finance estimated that poverty incidence declined to 25% as of early 2012, from about 30% in 2007, although there are concerns over apparent increases in income inequality. The government adopted a national social protection strategy in 2011, foreshadowing both an expansion of targeted programs such as free
3.23.4 Inflation
0
2
4
6
8
10
Jan12
OctJulAprJan11
OctJulAprJan2010
%
Food
Headline
Source: National Institute of Statistics. http://www.nis.gov.kh (accessed 21 March 2012).
3.23.3 Tourism indicators
0
1
2
0
2
4
Receipts Arrivals
11100908072006
$ billion Million persons
Source: Ministry of Tourism.
3.23.5 Government deposits
0
2
4
6
8
1110092008
% of GDP
Source: Ministry of Economy and Finance.
3.23.6 Gross international reserves and import cover
0
2
4
0
3
6
Months of importsGross international reserves
111009082007
$ billion Number of months
Source: National Bank of Cambodia.

Economic trends and prospects in developing Asia: Southeast Asia Cambodia 191
health care for the poor and the pilot testing of conditional cash transfers and labor-intensive public works.
Economic prospectsExport-led sectors will remain the main sources of growth during the forecast period, with some new manufacturing industries beginning to emerge, such as automotive parts and assembly of small electric motors. The subdued economic outlook for the EU and US, Cambodia’s main export markets, suggests that GDP growth will edge down to 6.5% in 2012 (Figure 3.23.7). In 2013, growth is seen picking up to 7.0%, tracking the expected upturn in the global outlook.
Demand for garment and footwear imports in the EU and US is expected to slow this year, mitigated to some extent by Cambodia’s privileged import access to the EU and the development of some high value-added garment production. Given these trends, the growth in industry overall is projected to slow to 11.4%, before picking up to 12.5% in 2013.
Construction is expected to strengthen, stimulated by FDI in property. The extent and timing of exploitation of oil and gas reserves in Cambodia remain unclear, but it is not anticipated to have an impact on GDP before 2015.
Growth in services is expected to edge up to 5.3% in 2012 and 5.6% in 2013 largely on the back of continued increases in tourist arrivals supported by gradual improvement in real estate.
Assuming favorable weather, agriculture is forecast to register higher growth of 3.8% in 2012, partly a result of the base effect of last year’s floods on the rice crop. It also reflects government support for agriculture, in particular rice production.
Fiscal consolidation is expected to continue, as envisaged in the 2012 budget. The fiscal deficit (excluding grants and other expenditure adjustments) is targeted at 5.7% of GDP, to be achieved largely by an ambitious domestic revenue target of 13.7% of GDP. Government spending is budgeted at 19.4% of GDP. The budget anticipates that domestic financing of the deficit will be as low as 0.2% of GDP. This indicates an important step toward rebuilding fiscal flexibility, necessary to give the government the leeway to spur the economy if needed.
humanitarian and infrastructure spending in 2011.Inflation in 2012 and 2013 is forecast to ease to about 5% on a year-
average basis (Figure 3.23.8), assuming relatively low domestic financing of the budget deficit. (High levels of domestic financing would involve the injection of large amounts of riels that could put upward pressure on inflation.) Rising global oil prices early in 2012 put the inflation forecast for this year at risk.
The trade deficit in 2012 is set to widen slightly due to softening external demand. Increases in tourism receipts will keep the services account in surplus. The current account deficit (excluding official transfers) is projected to widen to 7.6% of GDP in 2012 before narrowing a little as the global economy picks up (Figure 3.23.9).
3.23.1 Selected economic indicators (%)
2012 2013
GDP growth 6.5 7.0
Inflation 5.0 5.0
Current account balance (share of GDP)
-7.6 -7.0
Source: ADB estimates.
3.23.7 GDP growth
0
4
8
12
1312111009082007
%
Forecast
5-year moving average
Source: Asian Development Outlook database.
3.23.8 Inflation
-5
0
5
10
1312111009082007
Forecast
%
5-year moving average25 15
Source: Asian Development Outlook database.
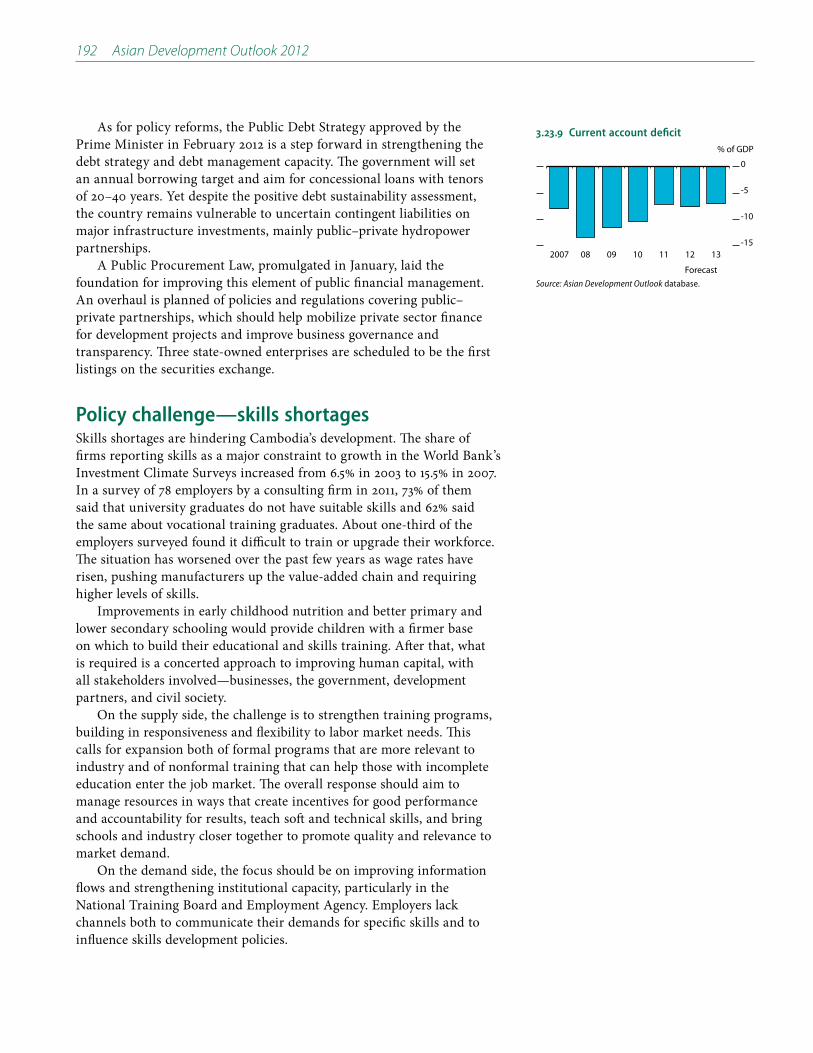
192 Asian Development Outlook 2012
As for policy reforms, the Public Debt Strategy approved by the Prime Minister in February 2012 is a step forward in strengthening the debt strategy and debt management capacity. The government will set an annual borrowing target and aim for concessional loans with tenors of 20–40 years. Yet despite the positive debt sustainability assessment, the country remains vulnerable to uncertain contingent liabilities on major infrastructure investments, mainly public–private hydropower partnerships.
A Public Procurement Law, promulgated in January, laid the foundation for improving this element of public financial management. An overhaul is planned of policies and regulations covering public–private partnerships, which should help mobilize private sector finance for development projects and improve business governance and transparency. Three state-owned enterprises are scheduled to be the first listings on the securities exchange.
Policy challenge—skills shortagesSkills shortages are hindering Cambodia’s development. The share of firms reporting skills as a major constraint to growth in the World Bank’s Investment Climate Surveys increased from 6.5% in 2003 to 15.5% in 2007. In a survey of 78 employers by a consulting firm in 2011, 73% of them said that university graduates do not have suitable skills and 62% said the same about vocational training graduates. About one-third of the employers surveyed found it difficult to train or upgrade their workforce. The situation has worsened over the past few years as wage rates have risen, pushing manufacturers up the value-added chain and requiring higher levels of skills.
Improvements in early childhood nutrition and better primary and lower secondary schooling would provide children with a firmer base on which to build their educational and skills training. After that, what is required is a concerted approach to improving human capital, with all stakeholders involved—businesses, the government, development partners, and civil society.
On the supply side, the challenge is to strengthen training programs, building in responsiveness and flexibility to labor market needs. This calls for expansion both of formal programs that are more relevant to industry and of nonformal training that can help those with incomplete education enter the job market. The overall response should aim to manage resources in ways that create incentives for good performance and accountability for results, teach soft and technical skills, and bring schools and industry closer together to promote quality and relevance to market demand.
On the demand side, the focus should be on improving information flows and strengthening institutional capacity, particularly in the National Training Board and Employment Agency. Employers lack channels both to communicate their demands for specific skills and to influence skills development policies.
3.23.9 Current account deficit
-15
-10
-5
0
1312111009082007
% of GDP
ForecastSource: Asian Development Outlook database.

Indonesia
Southeast Asia’s biggest economy in 2011 grew at its fastest rate since before the 1997–1998 Asian financial crisis. The pace will likely ease in 2012 on weaker external demand, before accelerating again in 2013 on the expected recovery in trade. Inflation, which receded in 2011, is forecast to quicken when the government raises administered fuel prices. The external current account is projected to slip into deficit this year as exports soften while robust investment keeps capital-equipment imports high. Addressing a major challenge to development, the government is stepping up efforts to improve infrastructure.
Economic performanceGrowth of 6.5% in 2011, the highest in 15 years, was based on sustained private consumption, stronger investment, and expansion of net exports (Figure 3.24.1).
Private consumption grew by 4.7%, contributing 2.7 percentage points of total growth. It was driven by rising incomes and employment and by easing inflation. In a notably positive development, fixed investment grew by 8.8% and contributed 2.1 percentage points of GDP growth. Public investment was constrained by weakness in implementing capital works, although private investment in construction and machinery was robust, supported by increases in foreign direct investment (FDI) and in bank lending. The ratio of nominal fixed capital investment to GDP rose to 32.0% in 2011, up by 7.1 percentage points over 5 years (Figure 3.24.2). Net exports contributed 1.5 percentage points of growth.
From the supply side, economic growth was led by services and manufacturing. Services grew by 8.5% to account for more than half the total GDP increase. Retail and wholesale trading, as well as transport and communications, showed double-digit expansions, while financial services benefited from a stronger performance in banking.
Manufacturing registered its best performance in 7 years: expanding by 6.2% and contributing 1.6 percentage points of overall growth, this outturn was based on the country’s large and growing domestic market, alongside a better performance from exports. Subsectors to report significant production gains in 2011 included iron and basic steel, food processing, textiles and footwear, and transport equipment (Figure 3.24.3). By contrast, mining and quarrying recorded weak growth of 1.4%, reflecting years of underinvestment and production problems in crude oil and natural gas.
Agricultural output rose by a modest 3.0%. An increase in production of estate crops, such as palm oil and rubber, was partly offset by a decline in food crops. Paddy rice output fell by 1.6% during the year, owing to dry weather in the second half.
3.24.1 Contributions to growth (demand)
6.36.0
4.6 6.2 6.5
-3
0
3
6
9
2007 08 09 10 11
Percentage pointsGovernment consumptionPrivate consumptionGDP Investment
Statistical discrepancyNet exports
Source: Asian Development Outlook database; CEIC Data Company (accessed 1 March 2012).
This chapter was written by Edimon Ginting and Priasto Aji of the Indonesia Resident
Mission, ADB, Jakarta.
3.24.2 Gross fixed capital formation
0
7
14
21
28
35
111009080706050403022001
% of GDP
Sources: Asian Development Outlook database; CEIC Data Company (accessed 1 March 2012).
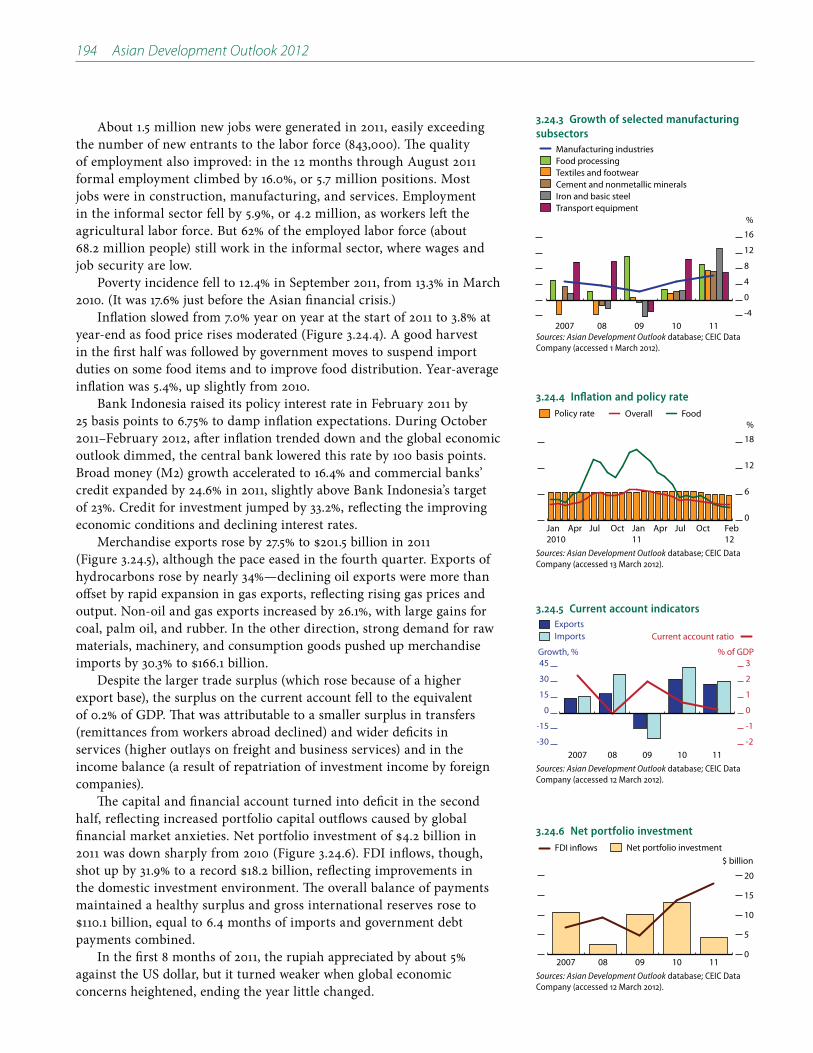
194 Asian Development Outlook 2012
About 1.5 million new jobs were generated in 2011, easily exceeding the number of new entrants to the labor force (843,000). The quality of employment also improved: in the 12 months through August 2011 formal employment climbed by 16.0%, or 5.7 million positions. Most jobs were in construction, manufacturing, and services. Employment in the informal sector fell by 5.9%, or 4.2 million, as workers left the agricultural labor force. But 62% of the employed labor force (about 68.2 million people) still work in the informal sector, where wages and job security are low.
Poverty incidence fell to 12.4% in September 2011, from 13.3% in March 2010. (It was 17.6% just before the Asian financial crisis.)
Inflation slowed from 7.0% year on year at the start of 2011 to 3.8% at year-end as food price rises moderated (Figure 3.24.4). A good harvest in the first half was followed by government moves to suspend import duties on some food items and to improve food distribution. Year-average inflation was 5.4%, up slightly from 2010.
Bank Indonesia raised its policy interest rate in February 2011 by 25 basis points to 6.75% to damp inflation expectations. During October 2011–February 2012, after inflation trended down and the global economic outlook dimmed, the central bank lowered this rate by 100 basis points. Broad money (M2) growth accelerated to 16.4% and commercial banks’ credit expanded by 24.6% in 2011, slightly above Bank Indonesia’s target of 23%. Credit for investment jumped by 33.2%, reflecting the improving economic conditions and declining interest rates.
(Figure 3.24.5), although the pace eased in the fourth quarter. Exports of hydrocarbons rose by nearly 34%—declining oil exports were more than offset by rapid expansion in gas exports, reflecting rising gas prices and output. Non-oil and gas exports increased by 26.1%, with large gains for coal, palm oil, and rubber. In the other direction, strong demand for raw materials, machinery, and consumption goods pushed up merchandise
Despite the larger trade surplus (which rose because of a higher export base), the surplus on the current account fell to the equivalent of 0.2% of GDP. That was attributable to a smaller surplus in transfers (remittances from workers abroad declined) and wider deficits in services (higher outlays on freight and business services) and in the income balance (a result of repatriation of investment income by foreign companies).
The capital and financial account turned into deficit in the second half, reflecting increased portfolio capital outflows caused by global
2011 was down sharply from 2010 (Figure 3.24.6). FDI inflows, though,
the domestic investment environment. The overall balance of payments maintained a healthy surplus and gross international reserves rose to
payments combined.In the first 8 months of 2011, the rupiah appreciated by about 5%
against the US dollar, but it turned weaker when global economic concerns heightened, ending the year little changed.
3.24.3 Growth of selected manufacturing subsectors
-4
0
4
8
12
16
Transport equipmentIron and basic steelCement and nonmetallic mineralsTextiles and footwearFood processingManufacturing industries
111009082007
%
Sources: Asian Development Outlook database; CEIC Data Company (accessed 1 March 2012).
3.24.4 Inflation and policy rate
0
6
12
18
Policy rate FoodOverall
Feb12
OctJulAprJan11
OctJulAprJan2010
%
Sources: Asian Development Outlook database; CEIC Data Company (accessed 13 March 2012).
3.24.5 Current account indicators
-30
-15
0
15
30
45
-2
-1
0
1
2
3
Current account ratioImportsExports
111009082007
% of GDPGrowth, %
Sources: Asian Development Outlook database; CEIC Data Company (accessed 12 March 2012).
3.24.6 Net portfolio investment
0
5
10
15
20
FDI inflows Net portfolio investment
111009082007
$ billion
Sources: Asian Development Outlook database; CEIC Data Company (accessed 12 March 2012).

Economic trends and prospects in developing Asia: Southeast Asia Indonesia 195
A strengthening bond market saw the yield on 5-year rupiah government bonds fall by 139 basis points to 5.4% during 2011. The government stepped in to stabilize the market by buying bonds when foreign investors cut their holdings in August–November’s market turbulence. Over the year, the stock market edged up 3.2%.
The government aimed for a budget deficit equal to 2.1% of GDP, but the outcome was around half that, at 1.1%. One reason was that public capital spending fell short of target because of chronic weakness in implementing capital projects. Another was buoyant revenue: tax receipts increased to 11.8% of GDP (from 11.2% in 2010) owing to a widening tax net, improving tax administration, strong economic activity, and high commodity prices.
Subsidies for fuel and electricity, however, remained a heavy burden on the budget, at 3.4% of GDP, and their cost exceeded the amount invested in public capital works. Still, the ratio of national government debt to GDP fell to 24.3% in 2011, maintaining a declining trend (Figure 3.24.7).
Reflecting the country’s improved macroeconomic performance, two major rating agencies raised Indonesia sovereign ratings to investment grade: Fitch to BBB minus in December 2011 and Moody’s to Baa3 in January 2012.
Economic prospectsForecasts assume the government will maintain its efforts to improve both the investment climate and public financial management, especially for budget execution. The forecasts also assume that the authorities will pursue major policies outlined in the master plan for economic development 2011–2025 (known by its Indonesian acronym MP3EI), published last year. The plan calls for raising public investment in infrastructure, reducing bottlenecks, and closing the development gap between eastern and western regions of the country.
Private consumption is forecast to remain strong this year and next. Surveys of households conducted by Bank Indonesia show high consumer confidence (Figure 3.24.8), driven mainly by optimism about growth in jobs and incomes. Consumption is underpinned by an expanding middle
terms, a group increasing by about 7 million a year) and rising labor force participation.
Private investment is expected to maintain its upward trend, given the country’s solid record of economic growth over recent years (averaging 5.7% since 2004), upgrades in sovereign ratings, and an improved investment environment. Indonesia’s ranking as an investment destination rose two places to seventh in the 2011 World Investment Report by the United Nations Commission of Trade and Development. A Bank Indonesia Business Survey conducted in the fourth quarter of 2011 indicated a steady rise in planned business activity and investment in the first half of 2012, and the Business Tendency Survey conducted in that quarter by the statistics office also suggested optimism over the near-term outlook (Figure 3.24.8).
3.24.7 Fiscal indicators
-50
-25
0
25
50
-2
-1
0
1
2
Debt ratio Fiscal balance
1110090807062005
% of GDP % of GDP
Sources: Directorate General of Debt Management. http://www.dmo.or.id; Republic of Indonesia Ministry of Finance. http://www.fiskal.depkeu.go.id (both accessed 13 March 2012).
3.24.8 Business and consumer confidence indexes
90
100
110
120
Consumer tendencybBusiness tendencya
Consumer confidencec
Q4Q3Q2Q111
Q4Q3Q2Q12010
Index
a From a quarterly Statistics Indonesia survey among business executives. b From a quarterly Statistics Indonesia survey among middle- and upper-income households. c From a monthly Bank Indonesia survey among households.
Note: A score above 100 means that respondents are optimistic and vice versa.
Source: CEIC Data Company (accessed 13 March 2012).
3.24.9 Average lending rates of commercial banks
11
12
13
14
Jan12
OctJulAprJan11
OctJulAprJan2010
% per year
Investment
Working capital
Note: Refers to rupiah credit.
Sources: Asian Development Outlook database; CEIC Data Company (accessed 13 March 2012).

196 Asian Development Outlook 2012
The fiscal stance will be accommodative to mitigate the impact on economic growth of the global slowdown. In late March 2012, Parliament passed a revision to the 2012 budget, widening the fiscal deficit to 2.2% of GDP from an originally planned 1.5%. The revised budget contains three key components: a provision to increase administered domestic fuel prices
investment is expected to surge by 48.6% in 2012 from that spent in 2011. A budget deficit recorded in January 2012, unlike recent years’ surpluses for this month, indicates improved budget execution.
Investment in infrastructure by the private sector and state-owned firms could start to increase, as outlined in the MP3EI. A Land Law for Public Use (approved by Parliament in December 2011) should help in acquiring land for public infrastructure, easing a serious constraint. Domestic commercial banks, which have excess liquidity, have expressed interest in financing infrastructure development, and the sovereign investment-grade ratings are expected to facilitate a greater volume of long-term financing.
Lending interest rates have come down (Figure 3.24.9, above) since Bank Indonesia lowered its policy rate. Credit to the private sector is projected to grow by at least 25% this year, financing increases in investment and consumption.
Manufacturing output looks set to increase further during the forecast period, based on announcements by companies of planned new facilities. The expansion has spread to industries such as metal products and machinery, which are more export oriented than transport, storage, and communications, sectors that previously attracted most investment. This diversification of manufactured products contributed to the solid increase in output last year (Figure 3.24.10).
Exports, though, face headwinds this year as global trade slows. GDP growth is therefore forecast to ease to 6.4%, before stepping up in 2013 (Figure 3.24.11) as world trade and economic growth pick up and infrastructure investment gathers momentum.
Inflation during the forecast period depends in part on the timing and size of increases in fuel prices. The year-average rate for 2012 is projected at 5.5%, on the assumption that fuel prices will be lifted later this year (Figure 3.24.12). If fuel prices are increased later than anticipated, inflation would likely be lower than forecast this year and higher than projected in 2013.
Slower growth in exports will likely produce a small current account deficit in 2012. Merchandise exports are projected to increase by about 13.5% and imports by 18.5% (strong investment will spur imports of capital equipment). The income deficit will widen, consistent with strengthening FDI flows and related repatriation of corporate earnings. In 2013, the current account is seen returning to a small surplus as external demand recovers (Figure 3.24.13).
Inflows of foreign direct and portfolio investment are expected to keep the overall balance of payments in surplus through the forecast period. The rupiah could soften this year against the US dollar in light of the current account deficit and higher inflation.
3.24.10 Manufacturing production index
85
95
105
115
Jan12
OctJulAprJan11
OctJulAprJan2010
2010 = 100
Source: CEIC Data Company (accessed 13 March 2012).
3.24.11 GDP growth
0
2
4
6
8
1312111009082007
%
ForecastSource: Asian Development Outlook database.
3.24.1 Selected economic indicators (%)
2012 2013
GDP growth 6.4 6.7
Inflation 5.5 5.0
Current account balance (share of GDP)
-0.1 0.2
Source: ADB estimates.

Economic trends and prospects in developing Asia: Southeast Asia Indonesia 197
Uncertainties in the global economic outlook mean that risks to the forecasts are tilted to the downside. A sharper deterioration than anticipated in major export markets would translate into even lower export growth. Further, Indonesia is vulnerable to financial-market volatility because of its relatively open capital account and heavy foreign presence in its stock and bond markets (about two-thirds of equities and one-third of sovereign bonds are foreign held).
The government’s gross financing needs remain high, despite its low budget deficit and declining debt-to-GDP ratio. The share of financing from market sources is expected to increase to about 85% this year, from 60% in 2009, in line with official policies to develop the capital market. This suggests the financing of the budget could be disrupted in the event of large capital outflows.
Anticipating such risks, the government included provisions in its 2012 budget that enable it, in an economic emergency, to get approval from Parliament within 24 hours to raise spending above the budgeted level and to switch spending priorities. That is in addition to the additional capital and social spending added to the budget in March that should provide a buffer to weaker external demand. Contingency plans also include the bond stabilization program that provides for the government to tap funds from its current budget, accumulated budget surpluses, and state-owned enterprises to steady a volatile market.
Moreover, the central bank has upgraded macroprudential measures to reduce short-term and speculative capital inflows and mitigate the risks of sudden outflows. These include gradually replacing short-term Bank Indonesia certificates with government bonds for liquidity management, reinstating limits on short-term offshore borrowing by banks to a maximum of 30% of their capital, increasing banks’ foreign currency reserve requirements, and requiring an underlying economic exchange for
Policy challenge—strengthening infrastructureLagging development of infrastructure—transport and telecommunications networks, electricity, and water supply—is a prime constraint on economic growth. The quality of infrastructure is ranked below that of, for example, Malaysia and Thailand (Table 3.24.2). Indonesia’s logistics costs (including transportation, warehousing, and distribution) are about 14% of total production costs, much higher than Japan’s roughly 5%.
The government has made infrastructure development a key priority in both its Medium-Term Development Plan 2010–2014 and the longer-term MP3EI. Several transport projects financed through the budget are scheduled to get under way this year, including expansion of Jakarta’s main airport, construction of highways and ports, and the building of transport infrastructure in eastern provinces.
Indeed, budget allocations for infrastructure have been raised significantly since 2010, but the execution of capital projects has lagged (Figure 3.24.14) because of capacity and other constraints. In efforts to address this issue, officials are simplifying procedures and strengthening procurement capacity in the spending agencies: the Ministry of Public
3.24.2 Rank in Global Competitiveness Index
2010–2011 (out of 139)
2011–2012 (out of 142)
Overall rankingSingapore 3 2Malaysia 26 21Thailand 38 39Indonesia 44 46Philippines 85 75
InfrastructureSingapore 5 3Malaysia 30 26Thailand 35 42Indonesia 82 76Philippines 104 105
Source: World Economic Forum. 2011. The Global Competitiveness Report 2011–2012. http://www.weforum.org/reports/global-competitiveness-report-2011-2012 (accessed 22 March 2012).
3.24.12 Inflation
0
2
4
6
8
10
1312111009082007Forecast
%
Source: CEIC Data Company (accessed 13 March 2012).
3.24.13 Current account
-1
0
1
2
3
1312111009082007
% of GDP
ForecastSource: CEIC Data Company (accessed 13 March 2012).

198 Asian Development Outlook 2012
Works, for example, is introducing electronic bidding and procurement systems. Further, a new task force to accelerate budget execution reports directly to the President. Coordination between the central and local governments will also need to improve and local governments’ weak capacity to implement infrastructure projects has to be addressed.
As for private participation in infrastructure development, the Land Law for Public Use will provide greater certainty on land acquisition for infrastructure projects. Moves to refine regulations and institutions to support public–private partnerships are starting to produce results. Agreements were signed in October 2011 for private investors to build a
Rajabasa and Muaralaboh geothermal projects, involving total investment
Also in March, the government issued a blueprint for the development of a national logistics system that aims to attract considerable private sector participation.
However, to ensure sustained private investment in infrastructure, further efforts are needed to improve governance, develop a more consistent legal and regulatory framework, and address government capacity constraints in preparing projects for private participation.
The subdued external economic environment in 2012 should provide an incentive for a stronger push on infrastructure development to support growth in the near term, as well as raise the country’s potential in the medium term.
3.24.14 Government capital expenditure
0
1
2
RealizedBudgeted
111009082007
% of GDP
Source: Republic of Indonesia Ministry of Finance. http://www.fiskal.depkeu.go.id (accessed 13 March 2012).

Lao People’s Democratic Republic
Resource-based industries, manufacturing, and services generated robust growth in 2011, and are expected to drive similar growth rates during the forecast period. Inflation, after speeding up last year, is projected to moderate. The country signed agreements that bring it closer to joining the World Trade Organization. However, generating well-paying jobs remains a major challenge.
Economic performanceDespite severe flooding that damaged agriculture in 2011, the economy grew by 7.8% (Figure 3.25.1), mainly owing to expansion of hydropower, manufacturing, mining, and services.
Typhoons in the second half of the year brought floods that took down rice output by 11% to about 2.9 million tons. Production of corn, beans, and vegetables also fell, although sugarcane, fisheries, and poultry performed better than in 2010. Output of timber declined as the government curbed illegal logging and restricted logging quotas. Agriculture as a whole, which accounts for just under one third of GDP, was virtually flat in 2011.
By contrast, industry expanded by 15.6%. Production of copper from the country’s two biggest mines—Phu Bia and Sepon—rose by about 5% to 139,000 tons. Silver production also gained, by about 6% to 538,000 ounces, though output of gold fell by about 22% to 128,000 ounces.
Hydropower output rose by 18.5% in 2011, spurred by new plants coming online, including the 615 megawatt Nam Ngum 2 in April 2011, and by heavy rainfall during parts of the year. Most of the electricity generated is exported to Thailand. Investment in mining and power plants contributed to growth: several mines, including the Ban Houayxai gold and silver mine as well as eight hydropower plants and a lignite power plant were being built. Other construction focused on housing, commercial buildings, and hotels in Vientiane, Luang Prabang, and Savannakhet. Construction overall increased by about 6% in 2011.
Garment manufacturing benefited from the European Union’s relaxation, from January 2011, of rules of origin for imports of garments from certain developing countries, including the Lao People’s Democratic Republic (the Lao PDR) (Figure 3.25.2). Garment exports to the European Union and United States, the two main markets, rose by about 17% to
The services sector grew by 7.9% last year. Tourist arrivals went up by 9% to 2.7 million (Figure 3.25.3), supporting the hotels and restaurants as well as transport subsectors. The rollout of third-generation
3.25.1 GDP growth
6
7
8
1312111009082007
%5-year moving average
ForecastSource: Asian Development Outlook database.
This chapter was written by A. Barend Frielink and Soulinthone Leuangkhamsing of the
Lao PDR Resident Mission, ADB, Vientiane.
3.25.2 Garment exports to the European Union and United States
0
50
100
150
200
11100908072006
$ million
United States
European Union
Notes: Using import data from US OTEXA and Eurostat. Data from Eurostat were converted to US dollars using / average exchange rate for the year.
Sources: Office of Textiles and Apparel. http://otexa.ita.doc.gov (accessed 20 March 2012); Eurostat. http://epp.eurostat.ec.europa.eu (accessed 21 March 2012).
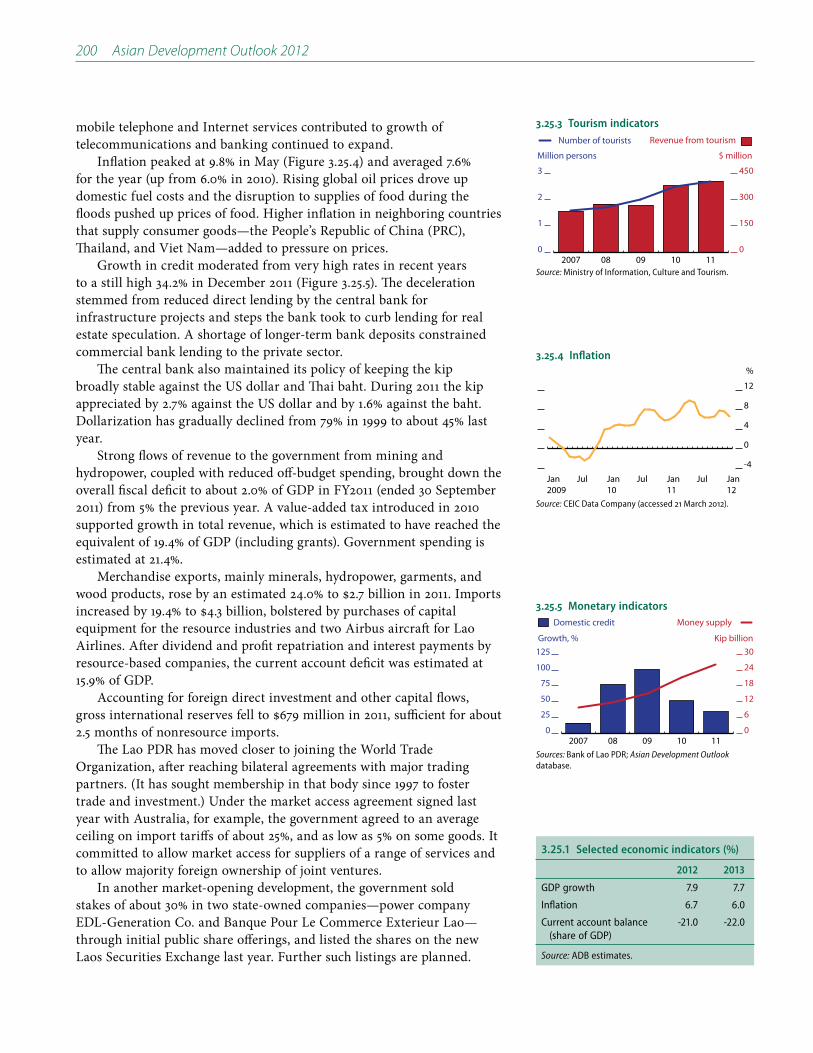
200 Asian Development Outlook 2012
mobile telephone and Internet services contributed to growth of telecommunications and banking continued to expand.
Inflation peaked at 9.8% in May (Figure 3.25.4) and averaged 7.6% for the year (up from 6.0% in 2010). Rising global oil prices drove up domestic fuel costs and the disruption to supplies of food during the floods pushed up prices of food. Higher inflation in neighboring countries that supply consumer goods—the People’s Republic of China (PRC), Thailand, and Viet Nam—added to pressure on prices.
Growth in credit moderated from very high rates in recent years to a still high 34.2% in December 2011 (Figure 3.25.5). The deceleration stemmed from reduced direct lending by the central bank for infrastructure projects and steps the bank took to curb lending for real estate speculation. A shortage of longer-term bank deposits constrained commercial bank lending to the private sector.
The central bank also maintained its policy of keeping the kip broadly stable against the US dollar and Thai baht. During 2011 the kip appreciated by 2.7% against the US dollar and by 1.6% against the baht. Dollarization has gradually declined from 79% in 1999 to about 45% last year.
Strong flows of revenue to the government from mining and hydropower, coupled with reduced off-budget spending, brought down the overall fiscal deficit to about 2.0% of GDP in FY2011 (ended 30 September 2011) from 5% the previous year. A value-added tax introduced in 2010 supported growth in total revenue, which is estimated to have reached the equivalent of 19.4% of GDP (including grants). Government spending is estimated at 21.4%.
Merchandise exports, mainly minerals, hydropower, garments, and
equipment for the resource industries and two Airbus aircraft for Lao Airlines. After dividend and profit repatriation and interest payments by resource-based companies, the current account deficit was estimated at 15.9% of GDP.
Accounting for foreign direct investment and other capital flows,
2.5 months of nonresource imports.The Lao PDR has moved closer to joining the World Trade
Organization, after reaching bilateral agreements with major trading partners. (It has sought membership in that body since 1997 to foster trade and investment.) Under the market access agreement signed last year with Australia, for example, the government agreed to an average ceiling on import tariffs of about 25%, and as low as 5% on some goods. It committed to allow market access for suppliers of a range of services and to allow majority foreign ownership of joint ventures.
In another market-opening development, the government sold stakes of about 30% in two state-owned companies—power company EDL-Generation Co. and Banque Pour Le Commerce Exterieur Lao—through initial public share offerings, and listed the shares on the new Laos Securities Exchange last year. Further such listings are planned.
3.25.1 Selected economic indicators (%)
2012 2013
GDP growth 7.9 7.7
Inflation 6.7 6.0
Current account balance (share of GDP)
-21.0 -22.0
Source: ADB estimates.
3.25.3 Tourism indicators
0
1
2
3
0
150
300
450
Revenue from tourismNumber of tourists
111009082007
Million persons $ million
Source: Ministry of Information, Culture and Tourism.
3.25.4 Inflation
-4
0
4
8
12
Jan12
Jul Jan11
Jul Jan10
Jul Jan2009
%
Source: CEIC Data Company (accessed 21 March 2012).
3.25.5 Monetary indicators
0
25
50
75
100
125
0
6
12
18
24
30
Money supplyDomestic credit
111009082007
Growth, % Kip billion
Sources: Bank of Lao PDR; Asian Development Outlook database.

Economic trends and prospects in developing Asia: Southeast Asia Lao People’s Democratic Republic 201
Economic prospectsGrowth looks likely to continue in 2012–2013 at similar rates to last year.
thermal power plant (1,878 megawatts) and associated coal mine. Work will get under way this year on Nam Ngum 3 (440 megawatts), joining eight other hydro plants under construction. Expansion of Theun Hiboun (280 megawatts) is due to be completed in July 2012.
The Ban Houayxai mine is scheduled to start production in the first half of 2012, at a full-year rate of 100,000 ounces of gold and 700,000 ounces of silver, and the Phu Kham copper–gold project, one of the biggest in the country, is being expanded. A potash mine and processing
company from Viet Nam has started work on a larger potash project
potash plants will be exported.In the capital Vientiane, the government is investing more than
senior officials from 50 countries to be held in November 2012. The PRC is providing loans for conference facilities and airport expansion.
Tourism will get a lift from international promotion of 2012 as Visit Laos Year and from the ASEAN University Games to be held in December 2012. Lao Airlines has launched flights between Vientiane and Singapore after acquiring the Airbus planes in late 2011.
Rice production is expected to recover from last year’s flood-suppressed level. Agricultural production is expected to increase by 2–3% in 2012, depending on the weather. The government is repairing irrigation systems damaged by the floods and building new irrigation systems to support dry-season crops.
Fiscal policy is more expansionary in FY2012, and the fiscal deficit is projected to widen to 4.6% of GDP. The government has budgeted to increase spending considerably, in part to repair the flood-damaged infrastructure. The central bank is targeting 25% growth in M2 money supply and aims to curtail expansion of credit to 28% (such targets have been missed in recent years, though).
Inflation is forecast to moderate to average 6.7% this year and 6.0% in 2013. Lower global food prices and a better domestic harvest will ease the pressures on food, which has a large share in the consumer price index. There will be some upward impact on prices from an increase of about 18% in administered electricity tariffs in the first half of 2012.
Sluggish global economic growth is expected to weigh on prices of copper, holding back merchandise export growth to about 19.0% in 2012. Imports of capital equipment needed for new mining and power projects will underpin an increase of about 17.0% in merchandise imports. The current account deficit is forecast to widen to 21.0% of GDP.
2011, although as a ratio to GDP it fell to about 47%. An external-debt sustainability analysis by the International Monetary Fund in 2011 found that the country still faces a high risk of debt distress, and that the projected rate of debt accumulation could increase in the next few years, reflecting borrowings mainly from the PRC.
3.9.1 Policy challenge—generating more jobs
Poverty incidence declined from 46% of the population in 1993 to a still high 27% in 2008. Consequently, major development goals are to sustain growth of income and employment, and better distribute income and wealth.
Central to these tasks is raising productivity and incomes in agriculture, which employs about three-fifths of the workforce. Rural areas are home to the majority of the poor. As improved productivity reduces the number of workers in agriculture, however, industry and services must grow if the surplus workers are to find jobs.
Investment in recent years has focused on mining and hydropower. They have indeed driven much of the growth, but, being capital intensive, have not generated enough jobs to take in all the workers leaving agriculture.
Industries that could create many well-paid jobs include:
Agribusiness. Processing crops like rice, corn, and natural rubber adds value and is labor intensive. As links strengthen between the Lao PDR and its neighbors Cambodia, the PRC, Myanmar, Thailand, and Viet Nam, market access for agribusiness production will expand.
Tourism. This group of countries also offers a cluster of tourism destinations that could be developed and promoted to achieve faster growth. Services associated with tourism, such as hotels, have a strong employment response to growth in output.
Services. It is efficient to cluster development of services in towns and cities to capture economies of scale and agglomeration. Moves in this direction require the government to address issues including inadequate urban planning and provision of water and sewerage systems.
More broadly, development of these and other industries depends on bringing down the high cost of finance, expanding education and skills training, building transport infrastructure, and addressing weaknesses in governance.

Malaysia
Strong private consumption drove economic growth in 2011, supported by government spending and, less so, fixed investment. The weaker global environment is forecast to slow growth in this highly open economy in 2012, but the better global backdrop next year should help lift its performance. Moderating growth this year suggests that inflation will also ease. The external current account surplus will remain buoyant.
Economic performanceExpansion of 5.1% in 2011 was fueled mainly by private and government consumption on the demand side and by an expansion of the services sector on the production side. Slower global trade and growth weighed on exports and manufacturing.
Private consumption rose by 6.9%, accelerating from 2010 and contributing about two-thirds of total GDP growth in 2011 (Figure 3.26.1). This reflected a robust labor market (employment increased by 3.2% and unemployment fell to an 11-year low of 3.1%), favorable prices for agricultural commodities (supporting farm incomes), and availability of credit (household borrowing rose by 12.5%). Government consumption, too, made a significant contribution to growth. It surged by 16.8% as the government raised outlays on supplies and services, raised public service wages, and paid a 1-month bonus.
Fixed capital investment growth moderated to 6.0% in 2011. While private investment was strong for much of the year, government investment fell, reflecting the phasing out in 2010 of a fiscal stimulus package. Gross fixed capital investment as a ratio to GDP was flat at around 20%, well below levels seen in the mid-1990s (Figure 3.26.2). This reflects, in large part, rising costs of production and limited progress in attracting higher valued-added industries.
Imports of goods and services in real terms rose faster than exports, holding back GDP growth from the demand perspective.
In supply-side terms, services contributed the vast bulk of growth, expanding by 6.8%. The robust private consumption drove a solid gain in retail and wholesale trading. Finance and insurance services benefited from strength in bank lending and insurance sales, and real estate services from an upturn in the housing market.
Manufacturing grew by only 4.5% as demand weakened in major industrial countries for manufactured products, particularly electronics. Supply disruptions caused by the March earthquake and tsunami in Japan and second-half floods in Thailand also dented manufacturing output (Figure 3.26.3). The electronics and electrical subsector contracted by 2.4% last year.
3.26.1 Contributions to growth (demand)
6.54.8
-1.6
7.2
5.1
-10
-5
0
5
10
15
2007 08 09 10 11
Percentage pointsGovernment consumptionPrivate consumptionGDP
Net exportsTotal investment
Source: Department of Statistics Malaysia. http://statistics.gov.my; CEIC Data Company (both accessed 16 March 2012).
This chapter was written by Gary Krishnan of the Southeast Asia Department, ADB,
Manila.
3.26.2 Fixed investment ratio
0
15
30
45
10080604022000989694921990
% of GDP
Source: CEIC Data Company (accessed 20 March 2012).

Economic trends and prospects in developing Asia: Southeast Asia Malaysia 203
Construction increased by a modest 3.5%, reflecting the end of the fiscal stimulus in 2010. The mining subsector (mainly oil), contracted by 5.7%, a result of maintenance shutdowns and output declines in mature fields.
The performance of agriculture—5.6% growth—was the strongest in 8 years. This was largely based on a sharp increase in crude palm oil production, which accounts for about one-third of the sector. Palm oil output rose by 11.3% to 18.9 million tons owing to good weather and firm international prices.
Higher food costs and increases in administered prices of electricity, fuel, and sugar nudged up inflation to 3.5% year on year in June (Figure 3.26.4). On a year-average basis, it accelerated to a 3-year high of 3.2%. House prices also turned up, by 8.6% in the first 3 quarters, a pace more than double the average of 2000–2010.
To lean against inflation, Bank Negara Malaysia, the central bank, raised its policy interest rate in May 2011 by 25 basis points to 3.0%. It also lifted the reserve requirement for banks from 1.0% to 4.0% to drain excess liquidity from the banking system.
The government boosted public expenditure by about 13% in 2011 (it had declined slightly in the prior year). Revenue rose by 15%, propelled by the surge in oil prices. These outcomes compressed the federal budget deficit slightly to 5.3% of GDP (Figure 3.26.5). The ratio of federal government debt to GDP edged higher to 53.5%.
Growth in M2 money supply rose by 14.6% year on year in December 2011, double the rate of the prior-year month. Credit to the private sector accelerated to 12.2% in 2011.
The external position remained strong. Merchandise exports climbed
commodities. The value of palm oil shipments jumped by 32.6% and minerals (mainly oil) by just over 22%. By contrast, the weakness in global demand for electronics and electrical products, alongside supply disruptions, took down their exports by 5.4%. After a 13.9% increase in
(Figure 3.26.6). The current account surplus as a share of GDP remained large at 11.5%.
In the capital and financial accounts, net portfolio investment of
risk aversion caused by the eurozone and United States fiscal and debt concerns in the second half of the year. Inward direct investment rose
to finance about 8 months of retained imports and 4.1 times short-term external debt. The ringgit depreciated against the US dollar by about 3% during the year.
Concerned about high levels of household debt (equivalent to 76.6% of GDP in 2011), the central bank moved to damp speculation in housing and to tighten credit card issuance. For housing loans, it imposed a 70% loan-to-value ratio on individual borrowers with more than two housing loans, and ruled that housing loan approvals be based on net rather than gross household income. Capital charges on commercial banks were
3.26.3 Manufacturing production index
-45
0
45
90
Electrical productsElectronicsOverall
Jan12
JulJan11
JulJan10
JulJan2009
year-on-year % change
Source: CEIC Data Company (accessed 20 March 2012).
3.26.4 Inflation and policy interest rate
0
1
2
3
4
Inflation rate Overnight policy rate
Jan12
OctJulAprJan11
OctJulAprJan2010
%
Source: CEIC Data Company (accessed 20 March 2012).
3.26.5 Fiscal performance
-8
0
8
16
24
-8
0
8
16
24
Overall balanceRevenue growthExpenditure growth
111009082007
% % of GDP
Source: Asian Development Outlook database.
3.26.6 Merchandise trade
-40
-20
0
20
40
-60
-30
0
30
60
Import growthExport growth
Trade balance
111009082007
% $ billion
Source: Asian Development Outlook database.

204 Asian Development Outlook 2012
increased for housing loans with loan-to-value ratios exceeding 90%, and on personal loans of more than 5 years.
On credit cards, the central bank put limits on the number of cards and the amount of credit available for people earning less than
on credit cards.
Economic prospectsGiven the country’s close integration with the world economy—exports and imports of goods and services are equivalent to over 100% of GDP—weakness in the global outlook clouds Malaysia’s prospects in 2012. Growth is seen moderating to about 4.0% in 2012, then quickening to 5.0% in 2013 as the external environment improves (Figure 3.26.7).
Domestic demand will again anchor growth. Private consumption will get support from government decisions in the 2012 budget to raise wages for the public sector and to make a one-time cash payment to low- and middle-income groups (53% of all households). Government plans to introduce a minimum wage in 2012 are expected to lift incomes for the low paid.
Still, the labor market is likely to soften in 2012, particularly in trade-exposed industries. Job vacancies in January 2012 declined steeply from the prior-year period. Consumer sentiment weakened late in 2011 (Figure 3.26.8).
Private investment in export-oriented industries such as electrical and electronics products will be subdued by the weak global outlook this year, although investment will likely be relatively buoyant in industries that depend on domestic demand.
The government is pressing ahead with its Economic Transformation Programme, launched in 2010, to develop higher value-added industries and infrastructure in partnership with private investors. According
committed through 2020 under the program. Several large projects associated with this initiative will start construction during the forecast
Lumpur and redevelopment of the Sungai Besi military airbase and a large site near the center of the capital for residential and commercial purposes.
The leading index of economic activity in January 2012 suggested slower economic growth in the near term, and the forward-looking Business Conditions Index, compiled from a survey of manufacturers, fell late last year (Figure 3.26.8).
From the production side, services are likely to continue to drive growth in 2012. The government is relaxing some restrictions on foreign investment in 17 services subsectors, including accounting, education, legal, and medical services, following a similar easing for 27 services subsectors in 2009. Tax breaks have been offered to encourage treasury management, Islamic, and other financial services.
Construction will gain from work on major projects and on
infrastructure. The impact on construction from the curbs on credit
3.26.1 Selected economic indicators (%)
2012 2013
GDP growth 4.0 5.0
Inflation 2.4 2.8
Current account balance (share of GDP)
12.1 11.9
Source: ADB estimates.
3.26.7 GDP growth
-2
0
2
4
6
8
1312111009082007
%
ForecastSource: Asian Development Outlook database.
3.26.8 Confidence indexes
50
75
100
125
Consumer sentimentBusiness conditions
Sep Mar11
Sep Mar10
Sep Mar2009
Index
Note: The business conditions index is derived from a quarterly survey of over 350 manufacturing firms. The consumer sentiment index is from a quarterly survey of over 1200 households in peninsular Malaysia. Above 100 indicates expansion for manufacturing and optimism among consumers.
Source: CEIC Data Company (accessed 20 March 2012).

Economic trends and prospects in developing Asia: Southeast Asia Malaysia 205
for speculation in housing and an increase in the tax on profits from selling properties within 5 years of acquisition is expected to be modest. Sluggish external demand will weigh on manufacturing and on trade-related services. Growth of agriculture will decelerate from the rapid pace seen last year.
Fiscal policy is targeted at stimulating domestic demand again this year. The federal deficit is expected to be broadly similar to that recorded for 2011 as a share of GDP. The central bank has signaled that it has the flexibility to increase monetary stimulus if the global economy deteriorates.
Inflation is forecast to recede to 2.4% (Figure 3.26.9) in light of moderating domestic demand and generally lower prices for imported commodities. This forecast assumes that subsidies on electricity, food, and fuel will not be cut ahead of national elections due in 2013. The ringgit appreciated by 3.4% against the US dollar in the first quarter of 2012, helping to damp inflation. In 2013, inflation is seen picking up to 2.8%, in line with domestic demand.
Growth in merchandise exports is expected to be subdued in 2012 owing to torpid global trade and softer prices for export commodities, including palm oil. Similarly, imports will increase at a modest rate, in tandem with weakness in manufacturing industries and more moderate growth in private domestic demand. The current account will continue to record substantial surpluses through the forecast period.
Lower than expected growth in global trade would put the 2012 growth forecast at risk, given the country’s reliance on exports. Domestically, the high level of household debt poses a risk if the labor market is weaker than anticipated.
Policy challenge—reining in subsidiesThe cost of government subsidies on fuel, staple foods, electricity, health, and education has climbed from 1.3% of total government spending in 1990 to 14.3% in 2011 (about 4% of GDP). Fuel subsidies alone amounted to 4.7% of total government spending in 2010 (Figure 3.26.10). Mainly for this reason, Malaysians consume 450 liters of fuel a head each year, 4.5 times as much as Thais and nine times Indonesians, according to the government.
Subsidies suppress inflation, but also contribute to the chronic fiscal deficit, reduce budget funding available for social and economic development, and distort resource allocation. The vast bulk of the subsidies benefit consumers, students, and companies in general, rather than the poor, because of inadequate targeting.
The government started to gradually reduce subsidies in 2010 on gasoline, cooking gas, electricity, and road tolls, and committed to better target remaining subsidies to lower income groups. It offered partial compensation for the upward impact on inflation, including cash rebates to owners of motorcycles and small cars (below 1,000cc). Budget savings
phased down were to have been applied to reining in the fiscal deficit. However the phase-down plan has since been suspended and it is unclear when it will resume.
3.26.10 Subsidies
0
5
10
15
20
Fuel subsidiesTotal subsidies
10080604022000989694921990
% of government expenditure
Sources: Ministry of Finance. Economic Report 2011/2012. http:// www.treasury.gov.my; CEIC Data Company (accessed 20 March 2012).
3.26.9 Inflation
0
2
4
6
1312111009082007
%
ForecastSource: Asian Development Outlook database.

Myanmar
Economic growth picked up in FY2011, based largely on foreign investment in energy and exports of commodities and natural gas. That trend is forecast to continue, assisted by policy reforms and higher gas exports in 2013. Inflation is expected to quicken, after receding in 2011. The government has taken steps to revitalize the economy, but the agenda of required reforms is long.
Economic performanceGDP growth edged up to an estimated 5.5% in FY2011 (ended 31 March 2012), from an average of 4.9% over the previous 4 years, based mainly on investment in hydropower, natural gas, and oil. Agriculture remained subdued owing to flooding and currency appreciation that hurt exports.
International tourist arrivals rose by an estimated 26% (Figure 3.27.1), in part a response to initial political and economic reforms after national elections in November 2010.
(Official GDP growth figures, which are considerably higher than these unofficial estimates, are inconsistent with variables that are closely correlated with economic growth, such as energy use.)
The exchange rate of the kyat on the unofficial market appreciated to
in 2009. The appreciation was driven largely by foreign investment. (The
One outcome of the stronger market exchange rate was to reduce rice exports, which created a surplus in the domestic market and brought down rice prices. That helped slow inflation to 4.2% on average in FY2011, from 7.3% in the previous fiscal year.
(Figure 3.27.2). Gemstone and jade exports, however, likely declined after doubling in FY2010. Higher levels of imports, particularly construction materials and machinery, widened the current account deficit to an estimated 2.7% of GDP in FY2011, from 0.9% in FY2010.
Increased foreign investment in energy and hydropower, estimated at
by March 2012, equivalent to 9.4 months of imports (Figure 3.27.3). Foreign investment in other industries is insignificant owing to barriers to entry and a poor business environment. Total external debt is
The consolidated fiscal deficit—covering the central government and state economic enterprises—is estimated at 5.5% of GDP in FY2011 (Figure 3.27.4). Revenue collection remained low because of weak tax administration and a reduction of export taxes implemented to support
This chapter was written by Alfredo Perdiguero of the Thailand Resident Mission, ADB,
Bangkok.
3.27.1 Tourism indicators
0
150
300
450
0
150
300
450
Revenue from tourismInternational tourists
111009082007
Thousand persons $ million
Source: Ministry of Hotels and Tourism.
3.27.2 Gas exports
0
1
2
3
4
11100908072006
$ billion
Note: In fiscal years.
Source: Department of Energy Planning, Ministry of Energy.

Economic trends and prospects in developing Asia: Southeast Asia Myanmar 207
agricultural exports. The phasing down of construction of the new capital Naypyidaw helped rein in growth of government spending.
The monetary authorities lowered administered bank interest rates by 4 percentage points from 17% to 13% for lending and from 12% to 8% for deposits in FY2011, though banks were also given some flexibility in setting deposit rates. Yields on Treasury bonds made them attractive investments for banks, which reduced central bank monetization of the fiscal deficit in FY2011.
Economic prospectsThe government that took office in March 2011 has an opportunity to rejuvenate the economy after more than 50 years of stagnation. In a promising start, the authorities took steps to unify the multiple exchange rates and are preparing other reforms, including a new national development plan.
New currency arrangements from 1 April 2012 involve a managed float
plans to establish a formal interbank market and relax exchange restrictions on current international payments and transfers. Fiscal policy in FY2012 targets a modest fiscal deficit equivalent to 4.6% of GDP.
Among planned reforms is a land law giving farmers the right to own, sell, and mortgage their land. Credit to the farm sector remains inadequate, even though the Myanmar Agriculture Development Bank has doubled its funding for farmers in each of the past 2 years. A microfinance law was approved in November 2011 to expand microcredit to farmers.
The government is preparing a new foreign investment law that is expected to offer tax breaks to investors and allow them to lease private land and repatriate investment proceeds using market exchange rates. Special economic zones in Dawei in southern Myanmar, Thilawa near Yangon, and Kyaukphyu on the west coast will be established to attract industry.
While the government last year ordered that work be suspended on the large Myitsone hydropower project owing to environmental concerns, investment is picking up on other hydropower and coal-powered plants, gas fields, and oil and gas pipelines.
Gas production and exports are scheduled to increase sharply in FY2013 when the Shwe and Zawtika gas fields and pipelines to the People’s Republic of China (PRC) and Thailand, now under construction, come on line. However, a market-determined exchange rate will threaten the viability of state economic enterprises that long benefited from importing inputs at the official exchange rate, abolished on 1 April this year.
GDP is forecast to grow by about 6.0% in FY2012 and 6.3% in FY2013 (Figure 3.27.5). Inflation is seen quickening to just over 6% (Figure 3.27.6). The authorities raised administered electricity prices in late 2011 and fuel prices in early 2012. A government plan to help farmers by supporting rice prices is likely to lead to higher retail prices of rice.
Relaxing foreign exchange controls is expected to propel imports upward and contribute to a widening of the current account deficit (Figure 3.27.7).
3.27.3 International reserves
0
2
4
6
8
10
0
2
4
6
8
10
Import cover Level
111009082007
$ billion Months
Source: Asian Development Outlook database.
3.27.4 Fiscal indicators
-10
0
10
20
Overall budget balanceRevenueExpenditure and net lending
111009082007
% of GDP
Source: Asian Development Outlook database.
3.27.5 GDP growth
0
2
4
6
8
1312111009082007Forecast
%5-year moving average
Source: Asian Development Outlook database.
3.27.1 Selected economic indicators (%)
2012 2013
GDP growth 6.0 6.3
Inflation 6.2 6.3
Current account balance (share of GDP)
-4.8 -5.0
Source: ADB estimates.

208 Asian Development Outlook 2012
Easing of economic sanctions imposed on Myanmar by industrial countries would lead to higher levels of trade and investment, as well as the resumption of assistance and concessionary financing both from these countries and from international financial institutions.
Policy challenge highlightsA key challenge is to maintain macroeconomic stability as the country opens to increased flows of trade and investment.
As for policy reforms, the agenda is extensive, given the low level of economic and social development. Per capita GDP is one of the lowest
60 million people live in poverty. Myanmar’s ranking on the United Nations Human Development Index is near the bottom of the list (149 of 187 countries). The country needs to embark on a comprehensive and well-sequenced program of reforms if it is to realize its potential.
Public institutions, the financial system, and workforce skills are focuses for strengthening. Developing the private sector depends on opening more areas to its participation and upgrading the regulatory, legal, and policy environment.
The government needs to generate adequate fiscal resources to expand infrastructure (75% of the population do not have access to electricity) and improve health, education, and social protection systems. A simpler and broader tax structure and greater emphasis on direct (rather than indirect) taxes would bolster fiscal resources and be fairer to the poor.
Extending transport networks to link Myanmar more closely with neighbors would enable its businesses to participate in East and Southeast Asian, as well as global, production chains.
Unifying the exchange rate will expose the inefficiencies and losses of state enterprises, which dominate parts of the economy. That is likely to require reforms to put state enterprises on a more commercial basis, including privatizing some and possibly closing others. Thus, temporary and transparent subsidies will have to be introduced to minimize the impact on the poor as state enterprises raise prices and lay off employees.
Expanded access to formal finance is another key challenge that will require a phasing out of bank deposit-to-capital ratios and an easing of collateral requirements. Upgrading the central bank would involve granting it operational autonomy and strengthening its capacity to supervise the financial sector. Consolidating the domestic banking sector and developing partnerships with foreign banks would strengthen the banking system.
Agriculture, which employs over half the population, has great potential for improvement. The distribution of land ownership certificates under the new land law is a step forward, but will require careful implementation to ensure that the poor benefit. This measure should be complemented by an expansion of credit to farmers, increased public investment in rural infrastructure, and better seeds, fertilizers, extension services, and post-harvest facilities.
3.27.6 Inflation
0
6
12
18
24
1312111009082007
%
5-year moving average
Forecast
32.9 30
Sources: Asian Development Outlook database; ADB estimates.
3.27.7 Current account balance
-6
-4
-2
0
2
1312111009082007
% of GDP
ForecastSources: Asian Development Outlook database; ADB estimates.
3.27.8 Per capita income, 2011
400
800
1,200
1,600
VIELAOCAMBANMYA
$
BAN = Bangladesh; CAM = Cambodia; LAO = Lao People’s Democratic Republic; MYA = Myanmar; VIE = Viet Nam.
Source: Asian Development Outlook database.

Philippines
Slumping exports and a fall in government spending undercut the impact on economic growth of strong private consumption in 2011. This year, the authorities have stepped up public spending and relaxed monetary policy, laying the ground for an upturn in GDP growth that is projected to continue through 2013. Inflation is seen at moderate levels through the forecast period. Nevertheless, considerably stronger economic growth is needed to make substantial reductions in unemployment and poverty.
Economic performanceA sharp decline in exports of electronic products and weak government spending curtailed GDP growth to 3.7% in 2011. Most of the growth (Figure 3.28.1) came from a 6.1% increase in private consumption, which was again supported by remittances from overseas Filipino workers (up by 7.2%
Fixed capital investment decelerated because of sluggish public construction and slower growth in private investment. As a share of GDP, fixed capital investment declined to 19.3% from a 7-year peak of 20.5% in 2010.
Government consumption and capital spending fell, reflecting a high base in 2010 (when expenditure had risen ahead of national elections) and the introduction of governance reforms in 2011 (which delayed spending by government agencies). As the economy softened, the government accelerated budget disbursements late in the year, mitigating the impact on the economy of a steep slide in exports.
Lower than planned government spending, coupled with some improvement in tax revenue, narrowed the fiscal deficit to 2.0% of GDP (Figure 3.28.2), well within the 3.0% deficit target. Expenditure rose by just 2.3% (nominal terms), with significant shortfalls in infrastructure outlays. The tax-to-GDP ratio rose slightly to 12.3%. One impact of these developments was to reduce national government debt to the equivalent of 50.9% of GDP, the lowest since 1998.
From the production aspect, services grew by 5.0% in 2011 and provided three-fourths of total GDP growth. Retail trade, business process outsourcing (BPO), and financial and real estate services were the main contributors. Industry grew by only 1.9% owing to weak public construction and subdued manufacturing, caused mainly by a slump in electronics exports. Some other manufacturing subsectors, such as food, chemicals, and furniture, drew support from the expanding domestic consumption. Private construction growth eased from the rapid pace in 2010. Agriculture, after 2 years of contraction due to bad weather, recovered by 2.6%.
Employment improved by 3.2% in 2011, or about 1.2 million new
3.28.1 Contributions to growth (demand)
6.6 4.2
1.1
7.63.7
-3
0
3
6
9
2007 08 09 10 11
Percentage pointsGovernment consumptionPrivate consumptionGDP Investment
Statistical discrepancyNet exports
Sources: Asian Development Outlook database; National Statistical Coordination Board. http://www.nscb.gov.ph (accessed 1 March 2012).
This chapter was written by Norio Usui and Teresa Mendoza of the Philippines Country
Office, ADB, Manila. The policy challenge section is sourced from N. Usui. Taking the
Right Road to Inclusive Growth: Industrial Upgrading and Diversification in the Philippines.
Asian Development Bank, forthcoming.
3.28.2 Fiscal performance
-8
0
8
16
-8
0
8
16
Overall balanceRevenue growthExpenditure growth
111009082007
% % of GDP
Sources: CEIC Data Company; Bureau of the Treasury. http://www.treasury.gov.ph (both accessed 14 March 2012).

210 Asian Development Outlook 2012
jobs, although most were part time. The new jobs slightly exceeded the increase in the labor force. The unemployment rate eased to 7.0% from 7.4%, but the rate of underemployment rose to 19.3% while other labor market indicators remained weak: youth unemployment was high at 16.3% and employment in manufacturing was low at 8.3% of total employment. About 20% of the unemployed were college graduates, indicating a mismatch between their skills and the needs of the labor market.
Higher global oil and food prices lifted average inflation to 4.8%, just within the central bank’s 3–5% target range. A good harvest helped slow inflation from October (Figure 3.28.3). Earlier concerns over inflation prompted Bangko Sentral ng Pilipinas to lift its policy interest rates by 50 basis points in early 2011, to 4.5% for overnight borrowing and 6.5% for overnight lending. It also raised bank reserve requirements, by 2 percentage points to 21.0%. As inflation moderated, the central bank kept policy rates steady for the rest of the year. The pace of lending to the private sector almost doubled to 15.7%, and growth in total domestic credit rose sharply to nearly 15%.
A slump in exports widened the trade deficit in 2011, eroding the current account surplus (Figure 3.28.4). Merchandise exports fell by
chain disruptions in electronics caused by the March earthquake in Japan and floods in Thailand later in the year. Electronic products (mainly semiconductors), which make up about half of total exports, plunged by 23.4%, although the impact was cushioned by double-digit growth in shipments of clothing, chemicals, and agricultural commodities. Exports of minerals also posted strong gains, helped by high world mineral prices.
(reflecting much higher oil prices), and in durable consumer goods and industrial machinery. By contrast, imports of electronics fell, in line with electronics exports, and imports of automobiles were disrupted by the flooding in Thailand that closed factories there.
Trade in services produced a larger surplus, mainly owing to income from BPO. Remittances also contributed to the current account
and inflows of foreign direct investment (FDI) were broadly steady at
(Figure 3.28.5). Relatively low levels of FDI reflect deficiencies in the investment
environment. The country’s ranking in the World Economic Forum’s Global Competitiveness Report 2011–2012 rose by 10 places to 75 (of 142 countries), mainly due to the lower public deficit and debt, improved credit ratings, and moderate inflation. However, the Philippines scored low marks for infrastructure, quality of public institutions, and corruption, so that its overall competitiveness ranking lagged behind neighbors such as Indonesia (46) and Viet Nam (65).
for 11.1 months of imports. Domestic financial markets strengthened, with stock prices up by 4% over the year and yields declining on government bonds. The peso ended 2011 little changed against the United States (US) dollar from a year earlier.
3.28.3 Inflation and policy interest rate
0
2
4
6
Overnight borrowing rateMonthly inflation
Jan12
OctJulAprJan11
OctJulAprJan2010
%
Source: CEIC Data Company (accessed 16 March 2012).
3.28.4 Merchandise trade growth and current account balance
-30
-15
0
15
30
45
-4
-2
0
2
4
6
Current accountImport growthExport growth
111009082007
% % of GDP
Sources: Asian Development Outlook database; National Statistical Coordination Board. http://www.nscb.gov.ph (accessed 23 March 2012).
3.28.5 Capital account indicators
-6
-3
0
3
6
9
Capital and financial account balance
Portfolio investmentForeign direct investment inflows
111009082007
$ billion
Sources: Asian Development Outlook database; National Statistical Coordination Board. http://www.nscb.gov.ph (accessed 23 March 2012).

Economic trends and prospects in developing Asia: Southeast Asia Philippines 211
Economic prospectsForecasts for 2012 and 2013 assume that the government will raise spending, follow through on its commitment to improve the business environment, and carry out some of the planned public–private partnerships, which include airports, highways, and water supply operations (they were delayed in 2011).
GDP growth is forecast to recover to 4.8% in 2012 (Figure 3.28.6), underpinned by strong private consumption and a pickup in public and private investment. Household consumption will benefit from inflows of remittances, lower average inflation, and positive consumer sentiment. Remittances in US dollars will increase by about 5% in 2012, the central bank projects.
Business sentiment is positive, too, according to a survey by the central bank in the first quarter of 2012 (Figure 3.28.7). Respondents cited increasing orders, new contracts and projects, and higher government spending. Investment commitments approved by state agencies rose by 37.6% in 2011. Bank credit has been on an upward trend and the stock market index reached a record high in March 2012, spurred by expectations of better corporate earnings.
Sovereign rating upgrades support the investment outlook. Moody’s raised the country’s foreign and local currency long-term bond ratings in 2011 from Ba3 to Ba2 (two notches below investment grade), while Fitch lifted the long-term foreign currency rating from BB to BB plus (one notch below investment grade). Standard & Poor’s late last year raised the rating outlook to positive from stable (its long-term foreign currency rating is two notches below investment grade).
Fiscal policy is set to be more expansionary in 2012. Budget allocations for social services and infrastructure are up sharply from 2011 (Figure 3.28.8) and the budget deficit target is widened to 2.6% of GDP from last year’s actual deficit of 2.0%. The pickup in budget spending that started late last year continued into January 2012, and in that month the government released to its agencies a large portion of the 2012 infrastructure budget, signifying early project implementation.
Monetary policy has been relaxed to support growth. Early in 2012, the central bank cut policy rates by 50 basis points to the low levels set during the 2009 global recession—4.0% for overnight borrowing and 6.0% for overnight lending. It also reduced bank reserve requirements by 3 percentage points, though this was primarily to offset the impact of other changes in the reserve requirements.
The drag on economic growth exerted by weakness in net exports is expected to diminish in 2012. Modest growth is seen for merchandise exports (about 5%), on a pickup in economic growth in the US and Japan (which together take about a third of exports) and solid growth in Southeast Asia (about a sixth). Weakness in Europe and moderating growth in the People’s Republic of China (each absorbing about one-eighth of exports) will temper export growth.
Reversing an 8-month slide, exports in January 2012 rose by 3.0% year on year (21% month on month). Electronics exports picked up, and the outlook for semiconductor sales to the US showed improving signs.
Merchandise imports will likely rise faster than exports, given robust consumer demand and the expected lift in investment. The current
3.28.6 GDP growth
0
2
4
6
8
1312111009082007
%
ForecastSources: Asian Development Outlook database; National Statistical Coordination Board. http://www.nscb.gov.ph (accessed 1 March 2012).
3.28.7 Confidence indexes
-25
0
25
50
75
Consumer outlook: next 12 monthsBusiness outlook: next quarter
Mar12
Mar11
Mar10
Mar09
Mar08
Mar2007
Index
Notes: The consumer (or business) outlook index is computed as the percentage of households (or firms) answering affirmatively less the percentage of households (or firms) answering negatively for a given indicator. A positive index shows a favorable view.
Sources: Bangko Sentral ng Pilipinas. 2012. Consumer Expectations Survey Fourth Quarter 2011. December; 2012. Business Expectations Survey First Quarter 2012. February.http://www.bsp.gov.ph
3.28.1 Selected economic indicators (%)
2012 2013
GDP growth 4.8 5.0
Inflation 3.7 4.1
Current account balance (share of GDP)
2.1 2.3
Source: ADB estimates.

212 Asian Development Outlook 2012
account surplus is forecast at 2.1% of GDP, after taking into account increases in remittances and income from BPO.
Services will remain the main contributor to growth on the supply
and this industry continues to expand. Construction will benefit from the anticipated ramping up of infrastructure projects.
In 2013, GDP growth is projected to quicken to about 5% on expectations of a more favorable external environment and gathering momentum in infrastructure investment.
Inflation is forecast to be lower in 2012 than last year (Figure 3.28.9), assuming global food and oil prices on average change little this year relative to 2011. The peso is expected to be broadly stable against the US dollar.
The government aims to rein in the 2013 budget deficit to 2.0% of GDP, which is likely to require a sizable increase in revenue. Thus, in addition to efforts on tax administration, the authorities are seeking higher tax revenue from alcohol and tobacco products and an overhaul of incentives to attract direct investment. Revenue increases are also needed if the country is to achieve key Millennium Development Goals. The Philippines is making slow progress on the goals related to poverty, primary education, and maternal and child health.
Policy challenge—securing inclusive growthEconomic growth in 2000–2011 averaged 4.7%, well above 2.9% in the 1990s and 1.7% in the 1980s. The pickup in growth was driven mainly by private consumption, backed by remittance inflows, and on the production side by services. Inflation has generally been moderate at an average of 5.1% in 2000–2011, and the external position has strengthened. Despite this better performance, however, structural weaknesses have frustrated the achievement of inclusive growth.
Weak link between growth and development. Unemployment and underemployment stayed high in 2011. Many workers are in low-productivity jobs and real average wages have declined. With a Gini coefficient of 45, income inequality is also high. The incidence of poverty fell from 33.1% in 1991 to 24.9% in 2003, but then turned up to 26.4% in 2006 and stayed around that rate in 2009. About 9.5 million Filipinos, or nearly 10% of the population, work abroad because of a lack of good jobs at home.
Rising growth and declining investment. Although growth quickened in 2000–2011, fixed investment as a share of GDP declined to 19% in the most recent years (it was 19.3% in 2011, for example), from slightly above 20% in 2000 (Figure 3.38.10). In Indonesia, by contrast, the investment rate has climbed from about 19% to 32% over the same period.
Limited diversification of exports. Merchandise exports are highly concentrated in electronics (60% of total exports in 2010), particularly semiconductors (about 77% of total electronics exports). This structure makes the economy vulnerable to downturns in global electronics demand and to disrupted electronics production chains, as happened in 2011. Philippine merchandise exports fell in the second half of 2011, while exports generally increased in other Southeast Asian countries.
3.28.9 Inflation
0
3
6
9
1312111009082007
%
ForecastSources: Asian Development Outlook database; National Statistics Office. http://www.census.gov.ph (accessed 15 March 2012).
3.28.10 Nominal fixed capital
15
17
19
21
23
11100908070605040302012000
% of GDP
Sources: Asian Development Outlook database; National Statistical Coordination Board. http://www.nscb.gov.ph (accessed 1 March 2012).
3.28.8 Government infrastructure outlays
0
50
100
150
200
12111009082007
P billion
Source: Department of Budget and Management. Various years. Budget of Expenditures and Sources of Financing. http://www.dbm.gov.ph

Economic trends and prospects in developing Asia: Southeast Asia Philippines 213
The root cause—industry has stagnated. The main growth engine of high-performing Asian economies has been dynamic structural transformation: output shifts from low-productivity goods into high-productivity ones, particularly manufactures; labor moves from agriculture to industry; and exports become more diversified. Industry in these economies has maintained productivity gains by upgrading technology and manufactured products. This transformation sustains growth and generates better-paying jobs to reduce poverty.
But in the Philippines, industry’s share of GDP declined from 39% in 1980 to 32% in 2011. Manufacturing accounted for just 22.4% of GDP and 8.3% of employment that year. Growth has instead relied on services (Figure 3.28.11), a trend accelerated by rapid expansion of BPO services over the past 7 years (Figure 3.28.12).
Weak growth in industry has suppressed economy-wide labor productivity, which rose by only 10% over the past 30 years (Figure 3.28.13). Labor productivity in services has been less than half that of industry over this period. This implies that, although services has made the greatest contribution to economic growth and job creation, it is not necessarily associated with a rise in high-productivity employment on aggregate.
The BPO industry employs only about 1% of the labor force and it hires relatively skilled workers. Given the large, and increasing, number of underutilized workers with moderate skills, it is unlikely that BPO alone can drive inclusive growth.
Underlying reasons for the industrial stagnation can be traced to the 1980s, when global manufacturers relocated production to East and Southeast Asia. They sidestepped the Philippines largely because of domestic political instability. Later success at attracting electronics, mainly assembly work, in the 1990s raised the promise of a deepening of industrial capabilities. However, the electronics industry has not upgraded and diversified its products and its presence has not spurred significant development in fields such as machinery, chemicals, and metals processing, owing to the underprovision of infrastructure (particularly transport networks and electricity supply) and an unfriendly business environment (poor governance, weak contract enforcement and property rights, and cumbersome business regulations).
Policy actions. A first step is to resolve pervasive constraints by accelerating development of the physical, institutional, and social infrastructure; instituting good governance; and improving the business environment.
Specifically for industry, the government could consider support for diversification and value addition. Decisions on restructuring, innovation, and product mixes are matters for the private sector. Still, the government can play a strategic and coordinating role in creating incentives for industrial development and providing targeted support for selected products, with benchmarks for success and sunset clauses for phasing out support. Such measures would involve close government–private sector cooperation to identify promising products and to diagnose and address impediments to their development.
3.28.11 Sector contribution to GDP growth, 1980–2010
0
25
50
75
100
Agriculture Industry Services
ThailandPhilippinesMalaysiaIndonesia
%
39.1 47.067.7
41.8
49.049.0
9.329.029.0
3.3
44.744.7
8.4
48.4
Source: Author’s calculations.
3.28.12 Business process outsourcing
0
4
8
12
0
250
500
750
Export revenue Employment
111009080706052004
$ billion Thousands
Sources: Business Processing Association of the Philippines. 2012. BPAP 2011 and 2012. March. http://www.bpap.org; Senate Economic Planning Office. 2010. BPO Industry at a glance. June. http://www.senate.gov.ph
3.28.13 Labor productivity growth, 1980–2009
35.8
9.0
12.298.2
71.3 105.6
-1.8
77.8
-50
0
50
100
150
200
Indonesia Malaysia Philippines Thailand
%Structural transformationSector productivity growth
Source: Author’s calculations.
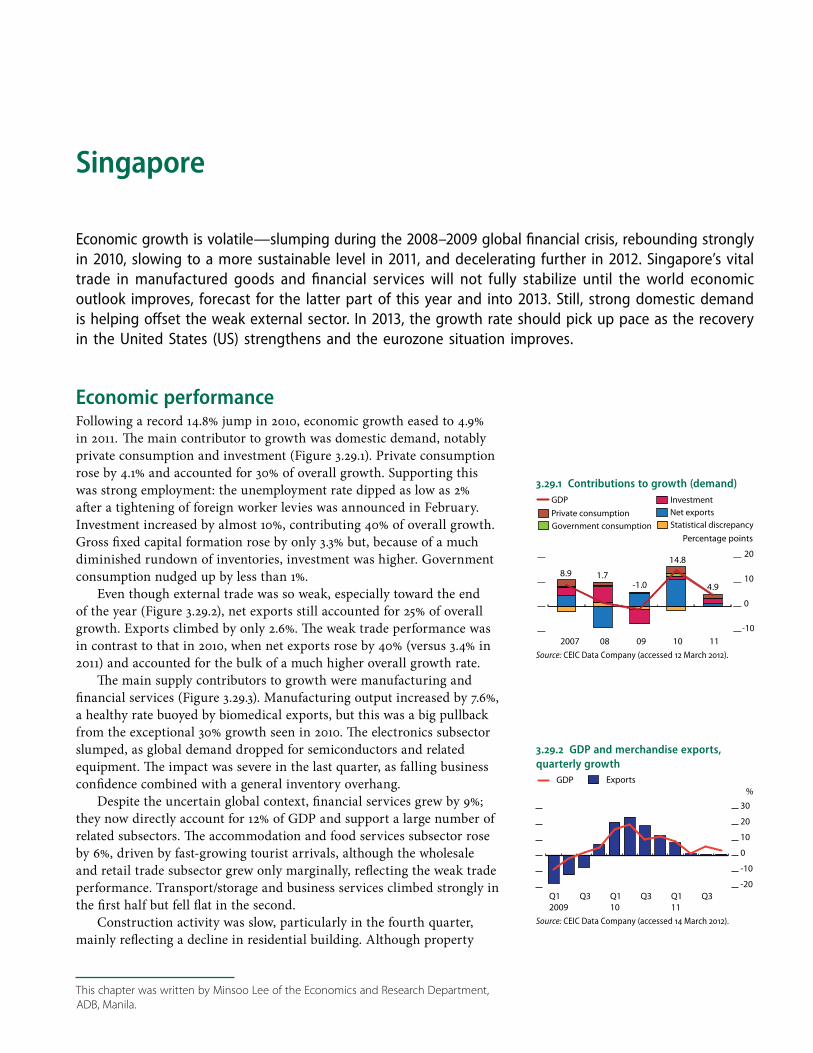
Singapore
Economic growth is volatile—slumping during the 2008–2009 global financial crisis, rebounding strongly in 2010, slowing to a more sustainable level in 2011, and decelerating further in 2012. Singapore’s vital trade in manufactured goods and financial services will not fully stabilize until the world economic outlook improves, forecast for the latter part of this year and into 2013. Still, strong domestic demand is helping offset the weak external sector. In 2013, the growth rate should pick up pace as the recovery in the United States (US) strengthens and the eurozone situation improves.
Economic performanceFollowing a record 14.8% jump in 2010, economic growth eased to 4.9% in 2011. The main contributor to growth was domestic demand, notably private consumption and investment (Figure 3.29.1). Private consumption rose by 4.1% and accounted for 30% of overall growth. Supporting this was strong employment: the unemployment rate dipped as low as 2% after a tightening of foreign worker levies was announced in February. Investment increased by almost 10%, contributing 40% of overall growth. Gross fixed capital formation rose by only 3.3% but, because of a much diminished rundown of inventories, investment was higher. Government consumption nudged up by less than 1%.
Even though external trade was so weak, especially toward the end of the year (Figure 3.29.2), net exports still accounted for 25% of overall growth. Exports climbed by only 2.6%. The weak trade performance was in contrast to that in 2010, when net exports rose by 40% (versus 3.4% in 2011) and accounted for the bulk of a much higher overall growth rate.
The main supply contributors to growth were manufacturing and financial services (Figure 3.29.3). Manufacturing output increased by 7.6%, a healthy rate buoyed by biomedical exports, but this was a big pullback from the exceptional 30% growth seen in 2010. The electronics subsector slumped, as global demand dropped for semiconductors and related equipment. The impact was severe in the last quarter, as falling business confidence combined with a general inventory overhang.
Despite the uncertain global context, financial services grew by 9%; they now directly account for 12% of GDP and support a large number of related subsectors. The accommodation and food services subsector rose by 6%, driven by fast-growing tourist arrivals, although the wholesale and retail trade subsector grew only marginally, reflecting the weak trade performance. Transport/storage and business services climbed strongly in the first half but fell flat in the second.
Construction activity was slow, particularly in the fourth quarter, mainly reflecting a decline in residential building. Although property
3.29.1 Contributions to growth (demand)
8.9 1.7-1.0
14.8
4.9
-10
0
10
20
2007 08 09 10 11
Percentage points Government consumptionPrivate consumptionGDP Investment
Statistical discrepancyNet exports
Source: CEIC Data Company (accessed 12 March 2012).
This chapter was written by Minsoo Lee of the Economics and Research Department,
ADB, Manila.
3.29.2 GDP and merchandise exports, quarterly growth
-20
-10
0
10
20
30
ExportsGDP
Q3 Q111
Q3 Q110
Q3 Q12009
%
Source: CEIC Data Company (accessed 14 March 2012).
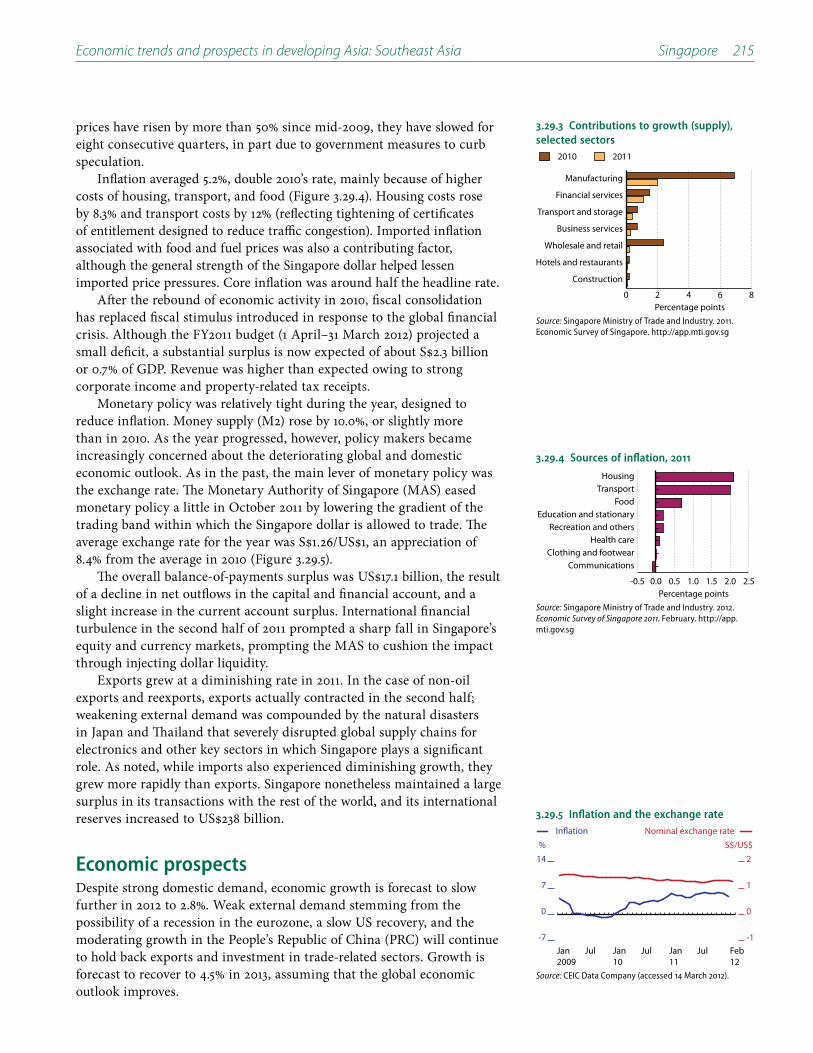
Economic trends and prospects in developing Asia: Southeast Asia Singapore 215
prices have risen by more than 50% since mid-2009, they have slowed for eight consecutive quarters, in part due to government measures to curb speculation.
Inflation averaged 5.2%, double 2010’s rate, mainly because of higher costs of housing, transport, and food (Figure 3.29.4). Housing costs rose by 8.3% and transport costs by 12% (reflecting tightening of certificates of entitlement designed to reduce traffic congestion). Imported inflation associated with food and fuel prices was also a contributing factor, although the general strength of the Singapore dollar helped lessen imported price pressures. Core inflation was around half the headline rate.
After the rebound of economic activity in 2010, fiscal consolidation has replaced fiscal stimulus introduced in response to the global financial crisis. Although the FY2011 budget (1 April–31 March 2012) projected a
or 0.7% of GDP. Revenue was higher than expected owing to strong corporate income and property-related tax receipts.
Monetary policy was relatively tight during the year, designed to reduce inflation. Money supply (M2) rose by 10.0%, or slightly more than in 2010. As the year progressed, however, policy makers became increasingly concerned about the deteriorating global and domestic economic outlook. As in the past, the main lever of monetary policy was the exchange rate. The Monetary Authority of Singapore (MAS) eased monetary policy a little in October 2011 by lowering the gradient of the trading band within which the Singapore dollar is allowed to trade. The
8.4% from the average in 2010 (Figure 3.29.5).
of a decline in net outflows in the capital and financial account, and a slight increase in the current account surplus. International financial turbulence in the second half of 2011 prompted a sharp fall in Singapore’s equity and currency markets, prompting the MAS to cushion the impact through injecting dollar liquidity.
Exports grew at a diminishing rate in 2011. In the case of non-oil exports and reexports, exports actually contracted in the second half; weakening external demand was compounded by the natural disasters in Japan and Thailand that severely disrupted global supply chains for electronics and other key sectors in which Singapore plays a significant role. As noted, while imports also experienced diminishing growth, they grew more rapidly than exports. Singapore nonetheless maintained a large surplus in its transactions with the rest of the world, and its international
Economic prospectsDespite strong domestic demand, economic growth is forecast to slow further in 2012 to 2.8%. Weak external demand stemming from the possibility of a recession in the eurozone, a slow US recovery, and the moderating growth in the People’s Republic of China (PRC) will continue to hold back exports and investment in trade-related sectors. Growth is forecast to recover to 4.5% in 2013, assuming that the global economic outlook improves.
3.29.3 Contributions to growth (supply), selected sectors
0 2 4 6 8
Construction
Hotels and restaurants
Wholesale and retail
Business services
Transport and storage
Financial services
Manufacturing
Percentage points
20112010
Source: Singapore Ministry of Trade and Industry. 2011. Economic Survey of Singapore. http://app.mti.gov.sg
3.29.4 Sources of inflation, 2011
-0.5 0.0 0.5 1.0 1.5 2.0 2.5
CommunicationsClothing and footwear
Health careRecreation and others
Education and stationaryFood
TransportHousing
Percentage pointsSource: Singapore Ministry of Trade and Industry. 2012. Economic Survey of Singapore 2011. February. http://app.mti.gov.sg
3.29.5 Inflation and the exchange rate
-7
0
7
14
-1
0
1
2
Nominal exchange rateInflation
Feb12
Jul Jan11
Jul Jan10
Jul Jan2009
% S$/US$
Source: CEIC Data Company (accessed 14 March 2012).

216 Asian Development Outlook 2012
Private consumption is expected to be high, with the labor force benefiting from tight supply conditions as the government endeavors to reduce the country’s reliance on foreign workers. Private sector investment will likely be anemic on concern over global prospects. Public infrastructure investment, though, will remain a priority of the government, even as it continues its policy of fiscal consolidation.
The FY2012 budget announced in February indicated a surplus of 0.4% of GDP for the current fiscal year (ending 31 March 2013). The budget focuses on measures to reduce the dependence on foreign workers and to strengthen productivity and innovation, following the recommendations last year of the Economic Strategies Committee of the Prime Minister’s Office. The government is in a solid position to introduce new fiscal stimuli, if they are needed, to act early against any early signs of a developing economic setback.
Manufacturing, especially its electronics subsector, will continue to run into the headwinds that have not fully dissipated from the second half of 2011 (Figure 3.29.6). The sector is highly dependent on final demand in the US and Europe, neither of which is expected to show strength this year.
Also, Singaporean electronics firms have to restructure and seek higher value-added development opportunities. Firms are continuing to hire and expand, but cautiously in light of the uncertain global outlook. Although trade within Asia, notably with the PRC, has continued to expand rapidly, it is heavily based on global value chains and final demand in advanced countries. The biomedical manufacturing subsector is, however, less sensitive than the electronics industry to variations in external demand, and appears to have strong growth potential.
Similar to manufacturing, financial services are expected to face continued headwinds during the next couple of years, but recently international equity markets have seen a big lift, including those in Singapore, one of Asia’s biggest wealth management centers. Demand from the region for services such as finance, logistics, and tourism is likely to continue growing.
The conditions driving Singapore property prices higher in recent years—notably brisk demand and tight supply—are expected to continue easing, mainly because the measures taken last year by the government to cool the property market appear to have been effective (Figure 3.29.7). The continued slowdown in the economy should help cool demand further, contributing to a correction in home prices and sales volume this year.
Inflation is forecast to decline to 3.0% and 2.5% in 2012 and 2013, abetted by slow domestic and global growth. The strength of the Singapore dollar will also help contain imported inflation, as will the expected easing of world commodity prices (apart from oil). As inflation recedes, the MAS will likely take further steps to loosen monetary policy.
Singapore will continue to have very large current account surpluses, the equivalent of 18.0% and 16.0% of GDP in 2012 and 2013. Merchandise exports, although with subdued growth, will remain an important source of growth. The services account will likely remain in surplus, boosted by tourism receipts and strong external demand for Singapore’s financial services. By contrast, the income account will remain in deficit.
3.29.1 Selected economic indicators (%)
2012 2013
GDP growth 2.8 4.5
Inflation 3.0 2.5
Current account balance (share of GDP)
18.0 16.0
Source: ADB estimates.
3.29.7 Private residential property price index
100
140
180
220
Q3 Q111
Q3 Q110
Q3 Q12009
Q4 1998 = 100
Source: CEIC Data Company (accessed 14 March 2012).
3.29.6 Manufacturing growth, 6-month moving average
-30
-15
0
15
30
45
Electronics, month on month Manufacturing, month on month Manufacturing, year on year
DecJul Jan11
Jul Jan10
Jul Jan2009
%
Source: Singapore Economic Development Board. Monthly Manufacturing Performance - December 2011. http://www.edb.gov.sg

Economic trends and prospects in developing Asia: Southeast Asia Singapore 217
Although income from abroad is expected to grow as local companies make increased returns on investments abroad, income payments will also mount, in line with steady profits made by foreign companies with subsidiaries in Singapore.
Forecast risks are on the downside, as the global economic outlook is so uncertain. The biggest risk lies in the eurozone and possible worsening of its sovereign debt crisis. Independently of that, a sharper than expected slowdown in the PRC would weaken Singapore’s growth prospects. Yet another risk is a possible spike in oil prices caused by Middle East tensions.
Policy challenge—Foreign workers/productivity tradeoff
Foreign workers account for over one-third of the labor force (Figure 3.29.8), reflecting the aging structure of the population and declining birth rates (Figure 3.29.9). The large presence of foreign workers has enabled Singapore to expand its manufacturing, financial services, and other key sectors. Further, skilled foreign workers have helped it maintain its cost competitiveness in high-end products.
Their prevalence may, however, have lowered the wages of local low-skilled workers. There has also been concern that such a large presence may have discouraged technology adoption and lowered labor productivity. Housing pressures and other consequences are further areas of concern.
In this slow-growth period, policy makers are concentrating on ways to mitigate some of these effects, especially the intensifying competition with foreign workers for unskilled jobs. The Economic Strategies Committee has recommended restricting the number of foreign workers and targeting productivity growth of 2–3% annually, leading to an economy of highly skilled workers employed in innovative services and industry sectors.
Thus foreign worker levies, paid by employers, are being raised at 6-month intervals, starting in January 2012 through July 2013. Increases in the levies vary by sector, generally higher for low-skilled work (e.g., construction) and lower for high-skilled work (manufacturing and financial services). Dependency ratio ceilings are also being reduced, which specify the maximum proportion of foreign workers that companies can hire. Concurrently, the government is encouraging businesses to invest in productivity and to reduce their reliance on low-skilled foreign workers. Multinational and large companies should adjust to the higher levies and lower quotas without much difficulty, but small and medium-sized companies (SMEs) relying heavily on foreign workers will find it hard to restructure.
been established. Further, the government has introduced specific initiatives to help SMEs restructure their operations, such as the SME Productivity Roadmap, which provides a systematic approach for improving productive capacity. The Continuing Education and Training system is designed to ensure that Singaporeans’ skills are regularly upgraded.
Singapore has determined that it must reduce its dependence on foreign workers and transition to higher value-added activities. The structural realignment will be gradual, but potentially far-reaching.
3.29.8 Labor force
0
700
1,400
2,100
ForeignResident
11100908072006
Thousand persons
Note: Resident refers to Singapore citizens and permanent residents.
Source: CEIC Data Company (accessed 14 March 2012).
3.29.9 Selected demographic trends
0
5
10
15
0
1
2
3
Old-age dependency ratio Fertility rate
100520009590851980
Births perwoman
% of working-agepopulation
Source: World Bank. World Development Indicators online database (accessed 14 March 2012).

Thailand
Devastating floods disrupted manufacturing and other industries in the second half of 2011, leaving the economy virtually flat over the 12 months. This year, reconstruction and policy stimulus will spark a rebound in growth, despite sluggish exports, and inflation, which quickened in 2011, is forecast to moderate. Rebuilding factories and infrastructure, as well as investor confidence, will be a major task during the forecast period.
Economic performanceWidespread flooding in August–November 2011, the worst in more than 50 years, devastated the economy. The floods across central and northern Thailand disrupted industries, including agriculture, construction, transport, and retailing, for months. The economy contracted by 9.0% year on year in the fourth quarter (Figure 3.30.1), leaving GDP for the year just 0.1% higher than in 2010.
Manufacturing slumped by 21.8% in the fourth quarter when the floods submerged factories making automobiles, hard-disk drives, electrical appliances, semiconductors, and textiles. As Thailand is the world’s 12th biggest automobile maker and accounts for 25% of global hard-disk drives, the factory closures caused economic dislocation far beyond its borders.
Earlier in the year, the Japanese earthquake and tsunami had caused supply shortages for the Thai auto and hard-disk drive industries, reducing output. For the whole year, overall manufacturing production fell by 4.3%.
Construction was also hit on two fronts—public projects were delayed by national elections and a change of government in July 2011, and private activity was curtailed during the flooding. Total construction activity for the year fell by 5.1%.
Services contracted in the fourth quarter, largely because of the floods, although grew by 3.8% over the whole year and were the main contributor to the marginal rise in GDP in 2011. Tourist arrivals fell by 4.7% in October–December (but still rose by 17.9% to 18.8 million in 2011 from 2010, a year in which arrivals fell because of 2 months of violent demonstrations).
Flooding reduced agricultural yields in the second half, though for the full year farm output increased by 3.8% owing to a rebound in the first half from a weak prior-year performance.
Private consumption was subdued in 2011 (Figure 3.30.2), in part a result of the floods, which dented consumer confidence and lowered incomes in affected areas. Farm incomes were hurt in the second half,
3.30.2 Contributions to growth (demand)
-10
-5
0
5
10
-10
-5
0
5
10
2007 08 09 10 11
%Percentage points
GDPNet exportsTotal investmentGovernment consumptionPrivate consumption
5.02.5
-2.3
7.8
0.1
Source: National Economic and Social Development Board. http://www.nesdb.go.th (accessed 20 March 2012).
This chapter was written by Luxmon Attapich of the Thailand Resident Mission, ADB,
Bangkok.
3.30.1 Contributions to growth (supply)
-10
-5
0
5
10
15
-10
-5
0
5
10
15
Q12008
Q3 Q109
Q3 Q110
Q3 Q111
Q3
Percentage points %
GDPServicesIndustry Agriculture
Source: National Economic and Social Development Board. http://www.nesdb.go.th (accessed 20 March 2012).

Economic trends and prospects in developing Asia: Southeast Asia Thailand 219
both by the impact of flooding and lower prices for some agricultural commodities. Rising inflation contributed to weakness in private consumption, which grew by just 1.3% in 2011.
Government consumption was similarly sluggish. The government that took office in August 2011 reviewed and adjusted the budget for the fiscal year starting October 2011 (FY2012), which held up some spending.
Private fixed investment, robust for most of 2011, suffered when the floods hit, but still rose by 7.2% for the year. Public investment, by contrast, fell by 8.7% owing to a combination of the floods, postponement of decisions on public works during the election period, and the delay in completing the FY2012 budget.
Growth in merchandise exports slowed to 16.4% in US dollar terms from 28.4% in 2010. The inundation of many export-oriented factories cut merchandise exports by nearly 5.2% in the fourth quarter (Figure 3.30.3). Rice exports turned down late in the year because of the impact of floods and a new government policy to pay higher prices to farmers for rice, reducing its competitiveness in export markets.
Closure of factories during the floods and supply disruptions from March 2011’s earthquake in Japan cut import growth to 24.7%, despite much higher prices for imported oil. The surplus in goods trade fell, but the deficit in services narrowed slightly, reflecting higher receipts from tourism and insurance (from flood claims). That left a current account surplus equivalent to 3.4% of GDP, a decline of about a half percentage point from the previous year.
The capital and financial account recorded a net outflow of
withdrawal of portfolio investment from emerging markets in the second half of last year. Foreign direct investment into Thailand fell by
cover for 10 months of imports.Higher oil prices and flood-induced disruptions to supplies of food
and other consumer goods lifted average inflation to 3.8% in 2011. The pace of food price inflation reached a 3-year high of 10.2% in November (Figure 3.30.4).
In response to upward pressure on prices and inflation expectations, the Bank of Thailand raised its policy interest rate six times in the first 8 months of the year, to 3.5%. It then reversed course when the flooding hit, the economy contracted, and the global economic outlook deteriorated, lowering the policy rate in November and again in January 2012, to 3.0% (Figure 3.30.5). Commercial bank lending slowed toward end-2011, though still rose by 14.9% for the year. The baht depreciated by 3.9% on average against the US dollar during 2011.
The fiscal deficit narrowed to 1.5% of GDP in FY2011 and public debt declined to 40.3% of GDP. Spending on the Thai Khem Kaeng (Strong Thailand) infrastructure program fell short of target (about 86% of its budgeted funding was disbursed).
To support farmers, the new government committed to purchase
3.30.3 Merchandise trade growth
-40
0
40
80
ImportsExports
Q3 Q111
Q3Q110
Q3Q109
Q3Q108
Q3Q12007
%
Source: Bank of Thailand. http://www.bot.or.th (accessed 28 March 2012).
3.30.4 Monthly inflation
-10
0
10
20
Food Headline
Feb12
JulJan11
JulJan10
JulJan09
JulJan08
JulJan2007
%
Sources: CEIC Data Company; Bureau of Trade and Economic Indices. http://www.price.moc.go.th (both accessed 20 March 2012).
3.30.5 Policy interest rate
1
2
3
4
20Mar12
JulJan11
JulJan10
JulJan09
JulJan2008
%
Source: Bloomberg (accessed 20 March 2012).
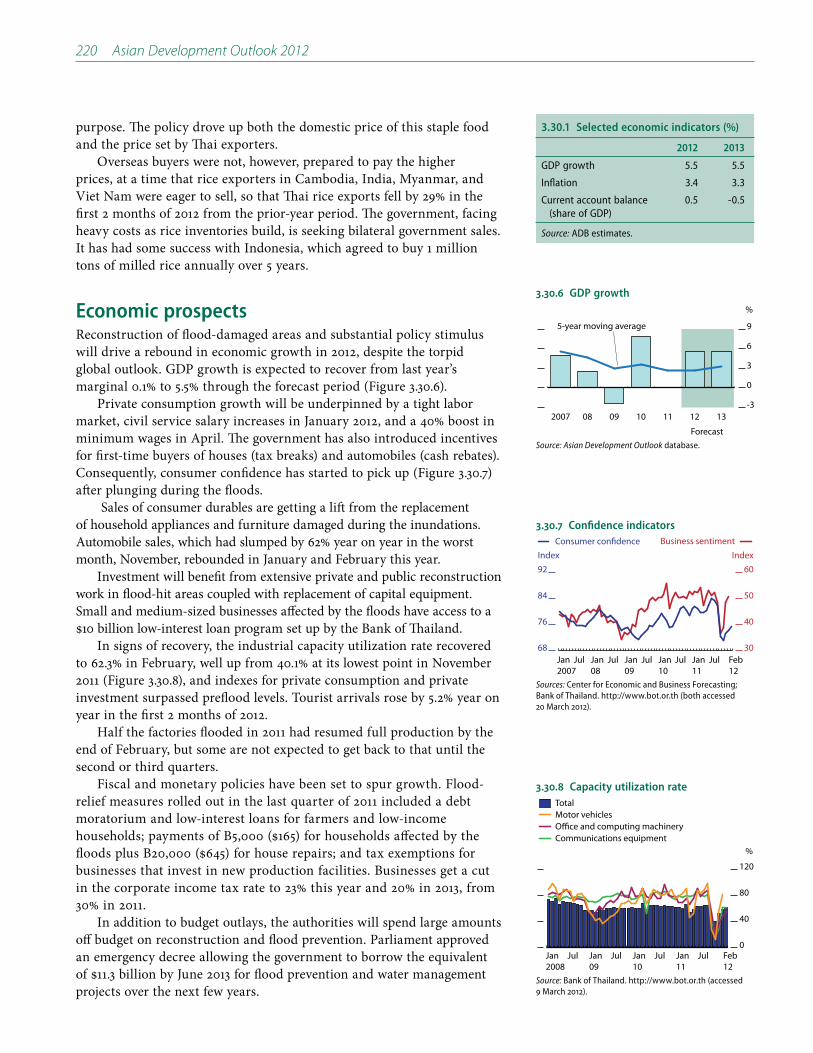
220 Asian Development Outlook 2012
purpose. The policy drove up both the domestic price of this staple food and the price set by Thai exporters.
Overseas buyers were not, however, prepared to pay the higher prices, at a time that rice exporters in Cambodia, India, Myanmar, and Viet Nam were eager to sell, so that Thai rice exports fell by 29% in the first 2 months of 2012 from the prior-year period. The government, facing heavy costs as rice inventories build, is seeking bilateral government sales. It has had some success with Indonesia, which agreed to buy 1 million tons of milled rice annually over 5 years.
Economic prospectsReconstruction of flood-damaged areas and substantial policy stimulus will drive a rebound in economic growth in 2012, despite the torpid global outlook. GDP growth is expected to recover from last year’s marginal 0.1% to 5.5% through the forecast period (Figure 3.30.6).
Private consumption growth will be underpinned by a tight labor market, civil service salary increases in January 2012, and a 40% boost in minimum wages in April. The government has also introduced incentives for first-time buyers of houses (tax breaks) and automobiles (cash rebates). Consequently, consumer confidence has started to pick up (Figure 3.30.7) after plunging during the floods.
Sales of consumer durables are getting a lift from the replacement of household appliances and furniture damaged during the inundations. Automobile sales, which had slumped by 62% year on year in the worst month, November, rebounded in January and February this year.
Investment will benefit from extensive private and public reconstruction work in flood-hit areas coupled with replacement of capital equipment. Small and medium-sized businesses affected by the floods have access to a
In signs of recovery, the industrial capacity utilization rate recovered to 62.3% in February, well up from 40.1% at its lowest point in November 2011 (Figure 3.30.8), and indexes for private consumption and private investment surpassed preflood levels. Tourist arrivals rose by 5.2% year on year in the first 2 months of 2012.
Half the factories flooded in 2011 had resumed full production by the end of February, but some are not expected to get back to that until the second or third quarters.
Fiscal and monetary policies have been set to spur growth. Flood-relief measures rolled out in the last quarter of 2011 included a debt moratorium and low-interest loans for farmers and low-income
businesses that invest in new production facilities. Businesses get a cut in the corporate income tax rate to 23% this year and 20% in 2013, from 30% in 2011.
In addition to budget outlays, the authorities will spend large amounts off budget on reconstruction and flood prevention. Parliament approved an emergency decree allowing the government to borrow the equivalent
projects over the next few years.
3.30.6 GDP growth
-3
0
3
6
9
1312111009082007
%
Forecast
5-year moving average
Source: Asian Development Outlook database.
3.30.7 Confidence indicators
68
76
84
92
30
40
50
60
Business sentimentConsumer confidence
Feb12
JulJan11
JulJan10
JulJan09
JulJan08
JulJan2007
Index Index
Sources: Center for Economic and Business Forecasting; Bank of Thailand. http://www.bot.or.th (both accessed 20 March 2012).
3.30.8 Capacity utilization rate
0
40
80
120
Communications equipmentOffice and computing machineryMotor vehiclesTotal
Feb12
JulJan11
JulJan10
JulJan09
JulJan2008
%
Source: Bank of Thailand. http://www.bot.or.th (accessed 9 March 2012).
3.30.1 Selected economic indicators (%)
2012 2013
GDP growth 5.5 5.5
Inflation 3.4 3.3
Current account balance (share of GDP)
0.5 -0.5
Source: ADB estimates.
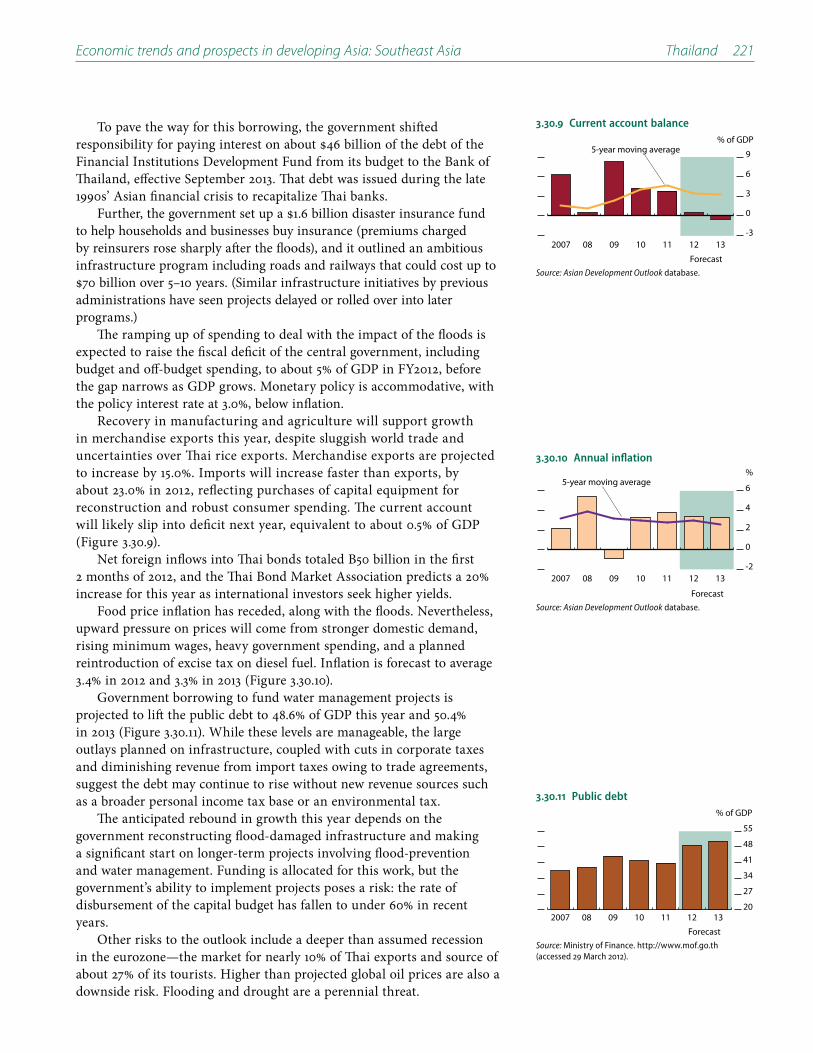
Economic trends and prospects in developing Asia: Southeast Asia Thailand 221
To pave the way for this borrowing, the government shifted
Financial Institutions Development Fund from its budget to the Bank of Thailand, effective September 2013. That debt was issued during the late 1990s’ Asian financial crisis to recapitalize Thai banks.
to help households and businesses buy insurance (premiums charged by reinsurers rose sharply after the floods), and it outlined an ambitious infrastructure program including roads and railways that could cost up to
administrations have seen projects delayed or rolled over into later programs.)
The ramping up of spending to deal with the impact of the floods is expected to raise the fiscal deficit of the central government, including budget and off-budget spending, to about 5% of GDP in FY2012, before the gap narrows as GDP grows. Monetary policy is accommodative, with the policy interest rate at 3.0%, below inflation.
Recovery in manufacturing and agriculture will support growth in merchandise exports this year, despite sluggish world trade and uncertainties over Thai rice exports. Merchandise exports are projected to increase by 15.0%. Imports will increase faster than exports, by about 23.0% in 2012, reflecting purchases of capital equipment for reconstruction and robust consumer spending. The current account will likely slip into deficit next year, equivalent to about 0.5% of GDP (Figure 3.30.9).
Net foreign inflows into Thai bonds totaled B50 billion in the first 2 months of 2012, and the Thai Bond Market Association predicts a 20% increase for this year as international investors seek higher yields.
Food price inflation has receded, along with the floods. Nevertheless, upward pressure on prices will come from stronger domestic demand, rising minimum wages, heavy government spending, and a planned reintroduction of excise tax on diesel fuel. Inflation is forecast to average 3.4% in 2012 and 3.3% in 2013 (Figure 3.30.10).
Government borrowing to fund water management projects is projected to lift the public debt to 48.6% of GDP this year and 50.4% in 2013 (Figure 3.30.11). While these levels are manageable, the large outlays planned on infrastructure, coupled with cuts in corporate taxes and diminishing revenue from import taxes owing to trade agreements, suggest the debt may continue to rise without new revenue sources such as a broader personal income tax base or an environmental tax.
The anticipated rebound in growth this year depends on the government reconstructing flood-damaged infrastructure and making a significant start on longer-term projects involving flood-prevention and water management. Funding is allocated for this work, but the government’s ability to implement projects poses a risk: the rate of disbursement of the capital budget has fallen to under 60% in recent years.
Other risks to the outlook include a deeper than assumed recession in the eurozone—the market for nearly 10% of Thai exports and source of about 27% of its tourists. Higher than projected global oil prices are also a downside risk. Flooding and drought are a perennial threat.
3.30.9 Current account balance
-3
0
3
6
9
1312111009082007
% of GDP
Forecast
5-year moving average
Source: Asian Development Outlook database.
3.30.10 Annual inflation
-2
0
2
4
6
1312111009082007
%
Forecast
5-year moving average
Source: Asian Development Outlook database.
3.30.11 Public debt
20
27
34
41
48
55
1312111009082007
% of GDP
ForecastSource: Ministry of Finance. http://www.mof.go.th (accessed 29 March 2012).

222 Asian Development Outlook 2012
Policy challenge—after the delugeThe expansion of industrial zones, often on former low-lying farm land, has increased chances that heavy floods will have a really severe impact on the economy, as in 2011.
Resulting prolonged closures of factories and extensive damage to a broad range of businesses (Figure 3.30.12) also raises the risk that foreign firms could become reluctant to expand manufacturing and warehousing in Thailand. Maintaining investor confidence depends on rebuilding flood-damaged infrastructure promptly, carrying out flood prevention and mitigation projects, and establishing a better institutional structure to handle crises.
By January 2012, the government had approved a master plan for water management that, among other things, covers upgrading warning systems, flood protection and management infrastructure, and a central agency for water resource management.
Further, the cabinet cleared 246 flood management projects costing
projects include raising highway levels in flood-prone areas and building dikes and drainage systems. Line agencies are scrambling to get as many projects as possible completed or under way before the next wet season. Officials are identifying land to be set aside as floodways.
Thailand’s ability to assuage investor sentiment will also depend on the replacement infrastructure being better able to manage the impact of prolonged heavy rainfall and floods than the former structures.
Moreover, although reconstruction must be pursued quickly, it will be important to address longer-term water management issues as well, and to ensure that water-related projects in one region take into account their impact on other regions. For example, Bangkok and surrounding industrial areas at the lower reaches of the Chao Phraya river basin depend on good water management in the basin’s upper reaches to prevent floods that later affect the heavily populated lower regions.
3.30.12 Flood damages and losses, 2011
Education, health, andcultural heritage
HousingFinance and banking
TourismManufacturing
Agriculture, livestock,and fishery
Infrastructure
Total = $46.7 billion
70.3%
6.7%
8.1%
5.9% 1.9%4.0%
2.8%
Sources: Department of Disaster Prevention and Mitigation; Ministry of Finance.

Viet Nam
The policy tightening adopted to curb high inflation in 2011 also slowed economic growth. The authorities loosened monetary policy a notch in early 2012, and signaled that further easing is likely if inflation trends down. It is indeed seen receding this year, but then edging up again next year. GDP growth is forecast to remain subdued, before picking up in 2013. Beyond macroeconomic stabilization, the government needs to address risks in the financial sector.
Economic performanceConfronted at the start of 2011 with soaring inflation and rapidly depleting foreign reserves, the government adopted a package of monetary and fiscal tightening measures—Resolution 11—that were sustained through the year. Policy tightening started to rein in inflation and damped economic growth, to 5.9% for the year (Figure 3.31.1) as investment fell and consumption growth moderated, more than offsetting an improvement in net exports.
Investment declined by 9.2% owing to high lending rates and cuts in public infrastructure investment, both elements of the policy tightening. Gross capital formation as a ratio to GDP moderated to 38.7%, the lowest in 4 years.
Private consumption decelerated to 4.4% as high inflation eroded real incomes. Public consumption growth slowed to 7.2%, reflecting the firmer fiscal stance. Net exports, by contrast, strengthened in 2011 as exports grew faster than imports, making a major contribution to GDP growth.
From the production side, a 7.0% expansion in services made the biggest contribution to total growth (2.9 percentage points). Wholesale and retail trading and hotels and restaurants both grew by about 7.5%, the latter supported by a 19% increase in visitor arrivals.
Stronger exports of manufactured goods underpinned an 8.3% expansion in manufacturing. However, construction fell by 1.0% due to cuts in public investment and curbs on lending for property. Better weather, strong commodity prices, and solid export demand for high-quality rice drove a 4.0% pickup in agriculture.
Inflation climbed to a 2011 peak of 23.0% year on year in August (Figure 3.31.2). It was driven by rising food prices, the lagged impact of high credit growth in 2010, exchange rate devaluations, and hikes in administrative prices of electricity and fuel. Food prices shot up by 34.1% year on year in August. Subsequently, food prices eased and, coupled with the impact of the policy tightening, brought inflation down, although it was still high at 14.2% in March 2012.
Policy tightening by the State Bank of Viet Nam (SBV, the central
3.31.1 Contributions to growth (demand)
6.35.3
6.85.9
-5
0
5
10
15
2008 09 10 11
Percentage points
Net exportsInvestmentGDP
Statistical discrepancyPrivate consumptionGovernment consumption
Source: General Statistics Office.
This chapter was written by Dominic Mellor, Chu Hong Minh, and Nguyen Luu Thuc
Phuong of the Viet Nam Resident Mission, ADB, Ha Noi.
3.31.2 Inflation
-7
0
7
14
21
28
-1
0
1
2
3
4
Headline excluding food (year on year)Headline (year on year)
Headline (month on month)
Mar12
JulJan11
JulJan10
JulJan2009
% %
Source: General Statistics Office.
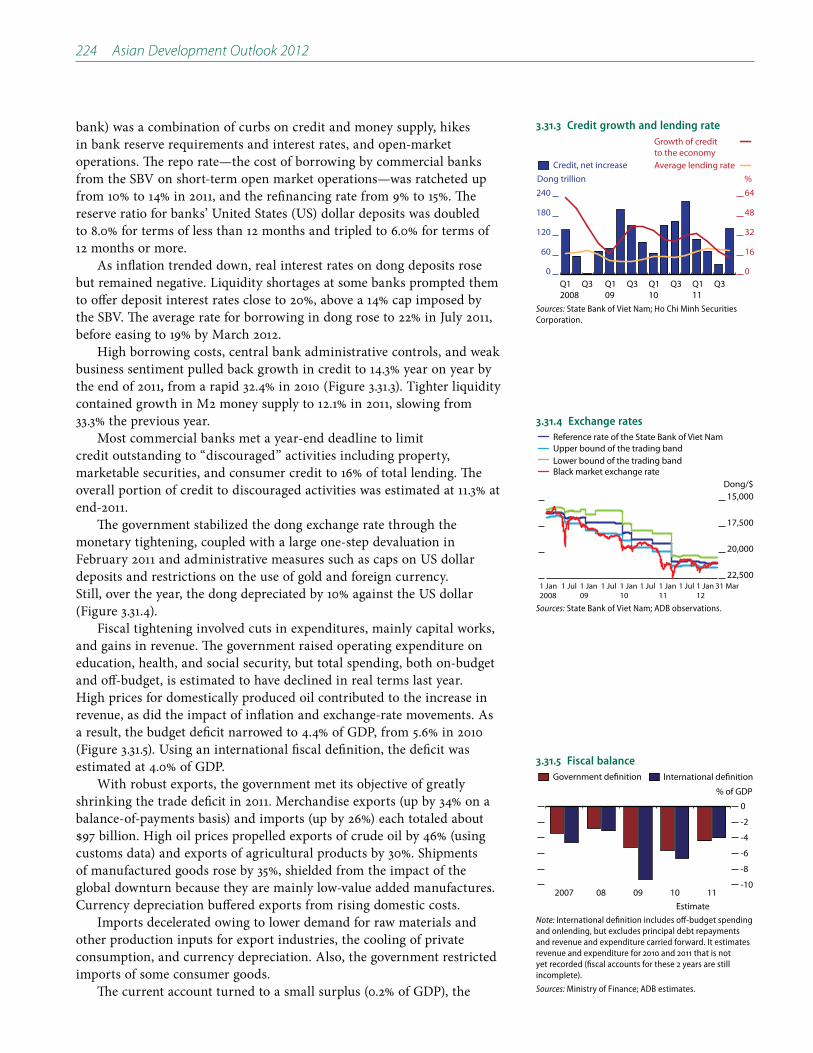
224 Asian Development Outlook 2012
bank) was a combination of curbs on credit and money supply, hikes in bank reserve requirements and interest rates, and open-market operations. The repo rate—the cost of borrowing by commercial banks from the SBV on short-term open market operations—was ratcheted up from 10% to 14% in 2011, and the refinancing rate from 9% to 15%. The reserve ratio for banks’ United States (US) dollar deposits was doubled to 8.0% for terms of less than 12 months and tripled to 6.0% for terms of 12 months or more.
As inflation trended down, real interest rates on dong deposits rose but remained negative. Liquidity shortages at some banks prompted them to offer deposit interest rates close to 20%, above a 14% cap imposed by the SBV. The average rate for borrowing in dong rose to 22% in July 2011, before easing to 19% by March 2012.
High borrowing costs, central bank administrative controls, and weak business sentiment pulled back growth in credit to 14.3% year on year by the end of 2011, from a rapid 32.4% in 2010 (Figure 3.31.3). Tighter liquidity contained growth in M2 money supply to 12.1% in 2011, slowing from 33.3% the previous year.
Most commercial banks met a year-end deadline to limit credit outstanding to “discouraged” activities including property, marketable securities, and consumer credit to 16% of total lending. The overall portion of credit to discouraged activities was estimated at 11.3% at end-2011.
The government stabilized the dong exchange rate through the monetary tightening, coupled with a large one-step devaluation in February 2011 and administrative measures such as caps on US dollar deposits and restrictions on the use of gold and foreign currency. Still, over the year, the dong depreciated by 10% against the US dollar (Figure 3.31.4).
Fiscal tightening involved cuts in expenditures, mainly capital works, and gains in revenue. The government raised operating expenditure on education, health, and social security, but total spending, both on-budget and off-budget, is estimated to have declined in real terms last year. High prices for domestically produced oil contributed to the increase in revenue, as did the impact of inflation and exchange-rate movements. As a result, the budget deficit narrowed to 4.4% of GDP, from 5.6% in 2010 (Figure 3.31.5). Using an international fiscal definition, the deficit was estimated at 4.0% of GDP.
With robust exports, the government met its objective of greatly shrinking the trade deficit in 2011. Merchandise exports (up by 34% on a balance-of-payments basis) and imports (up by 26%) each totaled about
customs data) and exports of agricultural products by 30%. Shipments of manufactured goods rose by 35%, shielded from the impact of the global downturn because they are mainly low-value added manufactures. Currency depreciation buffered exports from rising domestic costs.
Imports decelerated owing to lower demand for raw materials and other production inputs for export industries, the cooling of private consumption, and currency depreciation. Also, the government restricted imports of some consumer goods.
The current account turned to a small surplus (0.2% of GDP), the
3.31.3 Credit growth and lending rate
0
60
120
180
240
0
16
32
48
64
Average lending rate
Growth of creditto the economy
Credit, net increase
Q3Q111
Q3Q110
Q3Q109
Q3Q12008
Dong trillion %
Sources: State Bank of Viet Nam; Ho Chi Minh Securities Corporation.
3.31.4 Exchange rates
22,500
20,000
17,500
15,000
Black market exchange rateLower bound of the trading bandUpper bound of the trading bandReference rate of the State Bank of Viet Nam
31 Mar 1 Jan12
1 Jul1 Jan11
1 Jul1 Jan10
1 Jul1 Jan09
1 Jul1 Jan2008
Dong/$
Sources: State Bank of Viet Nam; ADB observations.
3.31.5 Fiscal balance
-10
-8
-6
-4
-2
0
International definitionGovernment definition
111009082007
% of GDP
EstimateNote: International definition includes off-budget spending and onlending, but excludes principal debt repayments and revenue and expenditure carried forward. It estimates revenue and expenditure for 2010 and 2011 that is not yet recorded (fiscal accounts for these 2 years are still incomplete).
Sources: Ministry of Finance; ADB estimates.

Economic trends and prospects in developing Asia: Southeast Asia Viet Nam 225
first surplus in 10 years. That reflected the smaller trade deficit and a
of share prices dropped by 27% in 2011) and foreign direct investment was
These capital inflows contributed to a rebuilding of international
foreign exchange market conditions in the first quarter of 2012 enabled
equivalent to about 2 months of import cover (Figure 3.31.6).Monetary tightening led to liquidity stress in some banks last year.
Three small banks facing liquidity problems merged in December 2011 under the supervision of the SBV, which provided liquidity support to the merged entity and instructed a state-owned commercial bank to provide it with credit.
Economic prospectsThe government, attempting to expand the economy while bringing down high inflation, targets a modest acceleration in GDP growth in 2012 (to 6.0–6.5%) and much lower inflation (under 10%). Fiscal and monetary statements suggest some easing in policy settings. The budget indicates that on-budget public spending could rise by about 6% in real terms (compared with a decline in 2011) and the fiscal deficit target in 2012 is widened slightly from last year to 4.8% of GDP.
The SBV is targeting credit growth of 15–17% in 2012, slightly faster than 14.3% recorded in 2011, and the goal for growth in M2 money supply is 14–16%, up from last year’s outcome of 12.1%. The authorities have directed banks to continue to limit lending for property, securities, and consumer credit to 16% of loan portfolios.
Credit growth ceilings this year are bank-specific, depending on a range of financial soundness indicators. Weaker banks have a lower ceiling for credit growth than others. Strong banks with higher credit growth ceilings hold an estimated 90% of total banking assets.
In March 2012, the SBV responded to the gradual easing of inflation by lowering the refinancing and discount rates by 100 basis points (Figure 3.31.7) and reducing the ceiling on dong deposit rates from 14.0% to 13.0%. The monetary authorities indicated that further easing depends on inflation trending down toward the target (and the forecasts below assume this will be the case).
The SBV introduced central bank bills of 1–6-month terms to improve liquidity management, and used these securities to sterilize bank reserves created by foreign exchange purchases.
Preliminary data indicate that GDP grew by 4.0% in the first quarter of 2012, decelerating from 6.1% in the fourth quarter of 2011. Industrial production increased by 4.1% year on year. Credit contracted by 2.5% during the first 2 months of this year. In further signs of sluggish economic activity, merchandise imports grew by 7% in the first quarter.
Private consumption in 2012 will get support from easing inflation. Investment will likely remain subdued, given uncertainties about the health of the financial sector, and government capital spending
3.31.1 Selected economic indicators (%)
2012 2013
GDP growth 5.7 6.2
Inflation 9.5 11.5
Current account balance (share of GDP)
-1.5 -2.2
Source: ADB estimates.
3.31.6 Gross official reserves
0
5
10
15
20
25
0
1
2
3
4
5Months of importsLevel, $ billion
Q4 Q211
Q4 Q210
Q4 Q209
Q42008
Notes: Data exclude government foreign exchange deposits at the State Bank of Viet Nam and the foreign exchange counterpart of swap operations. Import data are on free-on-board basis.
Sources: State Bank of Viet Nam; ADB estimates.
3.31.7 Interest rates
4
8
12
16
Repo rate for 7 daysDiscount rateRefinancing rate
MarJan12
OctJulAprJan11
OctJulAprJan2010
% per annum
Source: State Bank of Viet Nam.

226 Asian Development Outlook 2012
is expected to be flat. Growth in exports will slow from 2011, owing to weaker world trade, although Viet Nam should benefit from the expected gradual pickup in the United States, its biggest export market.
On the balance of these factors, GDP is forecast to grow by 5.7% in 2012 (Figure 3.31.8). Growth is expected to pick up to 6.2% in 2013, owing to the improved global outlook for trade and investment and likelihood of easier monetary policy next year.
Inflation is forecast to trend down this year, reflecting the policy tightening and high base set for the consumer price index in 2011. Food price inflation is abating. Weather conditions for agriculture were generally favorable in the first quarter of 2012 and global food prices are projected to ease this year. However, the government raised administered fuel prices by 3–12% in March. Average inflation this year could ease to just under double digits, provided policy settings are kept sufficiently firm. (Core inflation, which excludes food and energy, will be more persistent, though.) Year average inflation in 2013 is seen quickening to 11.5%, in tandem with economic growth and on expectations of higher global food prices and hikes in domestic electricity and fuel costs.
The current account is forecast to record a deficit equivalent to 1.5% of GDP in 2012 and 2.2% in 2013, largely due to subdued exports.
This outlook would be at risk if the government were to ease policies at a pace unsettling the foreign exchange market. Real savings of dong depositors have been eroded by negative interest rates over a prolonged period. The cumulative “errors and omissions” in the balance of
large volumes of foreign currency and gold outside the banking system.Lowering interest rates too quickly could put the dong under
renewed pressure. This would undermine macroeconomic stabilization efforts, erode investor and consumer confidence, and undermine foreign reserves. Vulnerabilities in the banking system also pose a risk. Business confidence and the financial system would be shaken if problems at small banks were to spread.
While foreign reserves have been rebuilt, they are still low, making the economy vulnerable to external shocks. On the fiscal side, the costs of recapitalizing banks, restructuring state-owned enterprises (SOEs), and raising civil service wages to compensate for rapid inflation puts at risk public capital spending. The ratio of current to capital expenditure increased significantly last year. Additionally, an increasing proportion of government spending is being channeled off budget (Figure 3.31.10), raising public financial management risks.
The authorities will need to accelerate reforms of SOEs if they are to raise the efficiency of this large sector of the economy, a prerequisite for lifting average GDP growth to 7–8%, the target of the Socioeconomic Development Strategy 2011-2020. Reform efforts so far have focused on small to medium-sized SOEs. The government has committed to draw up restructuring plans for 21 large state groups to make them more commercially oriented. It wants to reduce by about half the number of SOEs to 690 by 2015, and then to 200 by 2020, through full or part privatization.
Concerned about SOEs expanding into areas unrelated to their
3.31.8 GDP growth
0
3
6
9
1312111009082007
5-year moving average%
ForecastSource: Asian Development Outlook database.
3.31.9 Balance-of-payments indicators
-10
-5
0
5
10
Errors and omissions
Overall balance
Capital account balanceCurrent account balance
11102009
% of GDP
Sources: State Bank of Viet Nam; ADB estimates.
3.31.10 Expenditure indicators
0
1
2
3
4
0
5
10
15
20
Current expenditureratio to capital expenditure
Off-budget expenditureratio to total expenditure
11100908070605042003
% %
EstimateNote: At end-March 2012, the government had yet to finalize fiscal accounts for 2010.
Sources: Ministry of Finance and ADB estimates.

Economic trends and prospects in developing Asia: Southeast Asia Viet Nam 227
core businesses, the government has banned them from making such investments. Increased transparency of the financial performance of state enterprises would provide a strong signal to the market that the government was committed to reforms.
Policy challenge—financial sector restructuringRapid growth in lending over several years, followed by the squeeze on credit in 2011 and exacerbated by downturns in property and equities markets, have added to stresses for banks. The ratio of nonperforming loans to total loans increased to an estimated 3.4% (Figure 3.31.11), although it would be much higher under international accounting standards. This rising ratio and the risk profile of some bank balance sheets, particularly those with exposure to unprofitable and overstretched SOEs, raises questions about capital adequacy, particularly for small banks. The dangers are compounded by shortcomings in risk management at banks and weaknesses in the regulatory and supervisory framework.
A 16% increase in US dollar borrowing in 2011 heightened foreign exchange risk for banks. The SBV increased surveillance of foreign currency lending. From May 2012, it will restrict foreign currency lending only to firms engaged in export and import activity; it will also reduce limits on banks’ foreign exchange positions.
Uncertainty over the financial health of banks has unsettled investors and hampered interbank market operations. A Financial Sector Assessment Program, to be conducted by the International Monetary Fund and World Bank at the request of the Vietnamese authorities, suggests they intend to address weaknesses in the banking system. The assessment, expected in the first half of 2013, will give recommendations for financial sector restructuring.
In March 2012, the government outlined a plan that includes injecting capital into banks and encouraging strong banks to acquire weaker ones. Officials said part-privatization of state-owned commercial banks will be accelerated and bank capital requirements raised. Funding and timing of the bank recapitalization have not been disclosed in detail. The government wants to see, over the next few years, one or two state-owned commercial banks well placed to compete against other banks in Southeast Asia.
Safeguarding the banking sector is the immediate priority. The longer-term requirement is to develop a diversified and efficient financial system that can mobilize funding to meet the 7–8% economic growth target.
The government has already this year approved a plan to revamp the securities market. It covers development of the government and corporate bond markets, a restructuring of the two stock exchanges as well as securities firms, and an improved payment and settlement system for securities. Under the plan, policies are to be formulated to encourage more domestic and foreign investors in securities.
These complex reforms, which will take years to complete, would benefit from coordination with the proposed restructuring of SOEs.
3.31.11 Nonperforming loans
1,200
1,350
1,500
1,650
1,800
0
1
2
3
4
Property price Nonperforming loans
1110092008
$ per square meter % of bank loans
Note: Property price is the average price of high and medium-priced condominiums.
Sources: State Bank of Viet Nam; CB Richard Ellis; ADB estimates.
The Pacific
Fiji
Papua New Guinea
Timor-Leste
Cook Islands
Kiribati
Marshall Islands
Federated States of Micronesia
Nauru
Palau
Samoa
Solomon Islands
Tonga
Tuvalu
Vanuatu

Fiji
The country continues with weak economic growth, held back by policy uncertainty and structural constraints, which have contributed to low levels of private investment. Tourism is performing well, but other leading sectors, such as sugar and textiles, are struggling to compete internationally. Economic prospects are further clouded by weak global markets. Public expenditure is limited by high levels of debt and, longer term, structural reforms are essential for the economy to achieve its growth potential.
Economic performance In 2011, the economy grew by 2.1% after 2 years of contraction. The improvement reflects recovery in agriculture, which had been affected by cyclone damage in 2010. It also reflects an increase in tourist arrivals of 6.8% (Figure 3.32.1). Offsetting these gains, gold output fell by 22% as capital works reduced output from the key Vatukoula mine. Electricity production was also down more than 4%, because consumption was constrained by higher electricity prices.
Exports (through higher earnings from reexports, sugar, gold, molasses, and timber) rose by 26.5% in 2011, while merchandise imports (largely machinery and transport equipment, food, and mineral fuels) climbed by 16.3%.
Inflation reached double digits in midyear but averaged 8.7% for the year, up from 7.8% in 2010 (Figure 3.32.2). This reflected higher fuel and food prices, an increase in value-added tax, and steeper electricity prices.
The budget deficit was equivalent to 3.5% of GDP in 2011, up from 2.1% of GDP in 2010. Tax revenue exceeded budget estimates with growth in collections from value-added, hotel turnover, and water resource taxes. Total revenue fell below budget estimates, however, on delays in selling government assets. Expenditure was slightly lower than expected because of underspending on the operating and capital budgets.
Government expenditure in 2011 was dominated by current spending, which accounted for 86% of budget outlays. The wage bill remained at around 40% of total public spending, or nearly half current outlays. In recent years the government has increased spending on infrastructure. Capital investment has risen from 9% of total public spending (3.5% of GDP) in 2007 to an average of 14% of total public spending (5.2% of GDP) in 2008–2011.
foreign bond issue by the government in March 2011 and resulting influx of foreign exchange, as well as higher foreign exchange earnings and weak import growth.
This chapter was written by Laisiasa Tora of the South Pacific Subregional Office, ADB,
Suva.
3.32.2 Quarterly inflation
-20
0
20
40
60
Utilities Transport Food Overall
Q4Q111
Q3Q110
Q3Q109
Q3Q12008
%
Source: Reserve Bank of Fiji.
3.32.1 Visitor arrivals
-250
0
250
500
750
-8
0
8
16
24
GrowthPersons
111009082007
Thousands %
Sources: Reserve Bank of Fiji; ADB estimates.

230 Asian Development Outlook 2012
Since 2008, Fiji’s financial markets have had excess liquidity but, despite monetary-policy easing, domestic credit growth has continued to slow, rising by just 10% in the 4 years to end-2011. After holding steady for 6 months, the Reserve Bank of Fiji (RBF) cut its policy rate in October 2011 by 100 basis points, to 0.5%. Although lending to the private sector subsequently rose, the RBF is concerned that small and medium-sized enterprises are being excluded. It has, therefore, introduced a loan guarantee scheme, among other measures, to encourage such lending.
Fiji’s index for the real effective exchange rate rose on an annual basis by 5.2% in 2011 due to comparatively high domestic prices. This indicates a loss in international competitiveness against major trading partners, as well as an erosion of the benefits from devaluation in 2009.
The current account deficit widened marginally to 11.2% of GDP in 2011, from 11.0% the previous year. The surplus in the capital and financial
issued in 2006, using part of its March 2011 bond issue. As of end-2011,
around 5 months of imports.
Economic prospects The Asian Development Bank projects GDP growth of 1.0% in 2012 and 1.2% in 2013 (Figure 3.32.3)—lower than government expectations—reflecting its assessment of likely weak global demand, slow growth in bank lending, low levels of private investment, and the effects of the floods in early 2012.
Construction and investments in mining could support modest growth. For example, investment to date for the Namosi copper mine
investment on growth is likely to be muted, however, as equipment will be imported.
The government foresees a budget deficit of 1.9% of GDP for 2012, based largely on expectations of improvements in the economy
2011. Corporate and personal income tax cuts are expected to boost spending and investment. Tax revenue will be supplemented by the conversion of the 5% hotel turnover tax to a service turnover tax applying to most tourism-related services. This is expected to generate
airport departure tax, higher excise taxes, and new levies, including voice call charges and credit card fees.
5.9% from 2011. Operating spending, which makes up 70% of the total
spending program include a 3% salary increase for civil servants and
budget allocation, to be financed largely by the export-import banks of the People’s Republic of China and of Malaysia. The government projects a reduction in the debt-to-GDP ratio, from 51% in 2012 to around 49% by
3.32.1 Selected economic indicators (%)
2012 2013
GDP growth 1.0 1.2
Inflation 5.1 3.0
Current account balance (share of GDP)
-9.6 -11.6
Source: ADB estimates.
3.32.4 Budget balance
-6
-4
-2
0
2
1312111009082007
%
ForecastSource: Fiji Ministry of Finance. Economic and Fiscal Update: Supplement to the 2012 Budget Address.
3.32.3 GDP growth
-2
-1
0
1
2
3
1312111009082007
%
ForecastSources: Fiji Ministry of Finance. Economic and Fiscal Update: Supplement to the 2012 Budget Address; ADB estimates.
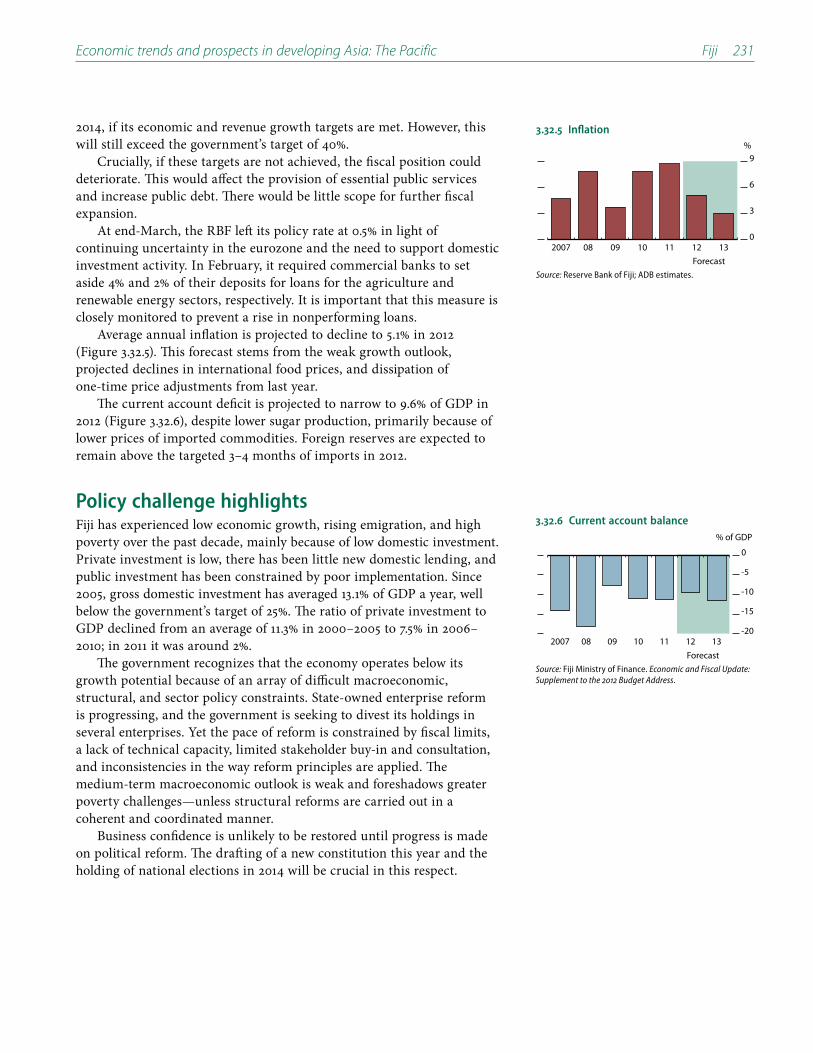
Economic trends and prospects in developing Asia: The Pacific Fiji 231
2014, if its economic and revenue growth targets are met. However, this will still exceed the government’s target of 40%.
Crucially, if these targets are not achieved, the fiscal position could deteriorate. This would affect the provision of essential public services and increase public debt. There would be little scope for further fiscal expansion.
At end-March, the RBF left its policy rate at 0.5% in light of continuing uncertainty in the eurozone and the need to support domestic investment activity. In February, it required commercial banks to set aside 4% and 2% of their deposits for loans for the agriculture and renewable energy sectors, respectively. It is important that this measure is closely monitored to prevent a rise in nonperforming loans.
Average annual inflation is projected to decline to 5.1% in 2012 (Figure 3.32.5). This forecast stems from the weak growth outlook, projected declines in international food prices, and dissipation of one-time price adjustments from last year.
The current account deficit is projected to narrow to 9.6% of GDP in 2012 (Figure 3.32.6), despite lower sugar production, primarily because of lower prices of imported commodities. Foreign reserves are expected to remain above the targeted 3–4 months of imports in 2012.
Policy challenge highlights Fiji has experienced low economic growth, rising emigration, and high poverty over the past decade, mainly because of low domestic investment. Private investment is low, there has been little new domestic lending, and public investment has been constrained by poor implementation. Since 2005, gross domestic investment has averaged 13.1% of GDP a year, well below the government’s target of 25%. The ratio of private investment to GDP declined from an average of 11.3% in 2000–2005 to 7.5% in 2006–2010; in 2011 it was around 2%.
The government recognizes that the economy operates below its growth potential because of an array of difficult macroeconomic, structural, and sector policy constraints. State-owned enterprise reform is progressing, and the government is seeking to divest its holdings in several enterprises. Yet the pace of reform is constrained by fiscal limits, a lack of technical capacity, limited stakeholder buy-in and consultation, and inconsistencies in the way reform principles are applied. The medium-term macroeconomic outlook is weak and foreshadows greater poverty challenges—unless structural reforms are carried out in a coherent and coordinated manner.
Business confidence is unlikely to be restored until progress is made on political reform. The drafting of a new constitution this year and the holding of national elections in 2014 will be crucial in this respect.
3.32.5 Inflation
0
3
6
9
1312111009082007
%
ForecastSource: Reserve Bank of Fiji; ADB estimates.
3.32.6 Current account balance
-20
-15
-10
-5
0
1312111009082007
% of GDP
ForecastSource: Fiji Ministry of Finance. Economic and Fiscal Update: Supplement to the 2012 Budget Address.

Papua New Guinea
High international commodity prices boosted economic growth in 2011. Restrained expenditure growth allowed the government to accumulate public trust fund savings. GDP growth will remain high in 2012 as construction of a large resource project reaches its peak. The following year, economic pressures will emerge as construction of that project winds down and government revenues from existing mining operations decline A major challenge is to ensure that the poor benefit from the country’s higher income.
Economic performanceThe economy continued its strong performance in 2011, with GDP growth of 8.9% marking a decade of uninterrupted expansion. Industry made the largest contribution to growth owing to resource investments,
project and high government spending that boosted demand in the sector (Figure 3.33.1). Construction was also supported by property developments as investors responded to very high rental demand in urban centers.
The contribution of industry to overall growth was partly offset by the mining and oil sector, which contracted by 8.7% as a result of declining output from maturing mining and oil operations. Agricultural output rose by 4.5% as producers responded to higher commodity and food prices.
Strong economic growth continued to create income-earning opportunities. The Central Bank Business Liaison Survey showed a 7.1% increase in formal employment in the first half of 2011.
The deficit on the current account of the balance of payments widened to 36.8% of GDP in 2011. Higher commodity prices raised the US dollar value of merchandise exports by 27.8%. Mineral exports climbed by 17%, as rising copper and gold sales more than offset an 11% decline in oil revenue. The value of agricultural exports, which make up roughly a quarter of export revenue, rose by about 51% in 2011, primarily as a result of 63% growth in palm oil exports, an 88% jump in coffee sales, and a 100% surge in marine products.
Increased exports were, however, outweighed by a rise in imports, particularly those related to construction of resource projects. Yet because resource-project imports are financed mainly through foreign direct investment, the large current account deficit does not jeopardize external stability. High foreign exchange reserves held by the central bank, which totaled 15 months of nonmineral import cover in 2011 (reaching 18 months in October), also support external stability (Figure 3.33.2).
3.33.1 Contributions to growth (supply)
0
2
4
6
8
10
GDP Agriculture Industry Services
111009082007
Percentage points
7.26.0
8.97.4
8.9
Sources: Department of Treasury. 2012 National Budget. Volume 1. Economic and Development Policies. http://www.treasury.gov.pg; ADB estimates.
This chapter was written by Aaron Batten of the Papua New Guinea Resident Mission,
ADB, Port Moresby.
3.33.2 Gross reserves
4
8
12
16
111009082007
Months of imports
Note: Imports exclude mining and oil commodities.
Sources: Bank of Papua New Guinea. Quarterly Economic Bulletin. Various issues. http://www.bankpng.gov.pg

Economic trends and prospects in developing Asia: The Pacific Papua New Guinea 233
0.3% of GDP) (Figure 3.33.3). Adjusting official numbers for net trust fund deposits, though, gives an effective budget surplus equal to 2% of GDP. This difference arises owing to the government’s classification of trust fund deposits as spending, while international government accounting standards treat them as savings.
Strong growth and high commodity prices took domestic revenue collection 6.6% above projections (Figure 3.33.4). A midyear
infrastructure, health centers, and prefunding for a new commitment to achieve universal primary and secondary education.
High levels of government expenditure, large resource investments, and rising international food prices spurred inflation in the first half of 2011, with the consumer price index increasing year on year by 9.6% at end-June 2011. Price increases slowed in the second half, mainly reflecting strong exchange rate appreciation.
Also supporting moderating price growth was monetary intervention:
policy interest rate (the kina facility rate) by 75 basis points to 7.75%, and lifted the capital-adequacy requirement for banks from 4.0% to 6.0%.
A significant policy development in 2011 was the announcement of a new sovereign wealth fund to manage all future mineral revenue. The fund aims to encourage stable and sustainable increases in government expenditure by establishing a maximum drawdown rule and channeling all mineral funds through the budget. The fund also aims to protect local export industries by investing unspent mineral revenue in offshore assets.
One challenge, however, is that the proposed new agencies that will use mineral revenue to finance infrastructure and state-owned enterprise investments have the potential to replicate existing government structures and complicate public financial management.
Economic prospectsGrowth is seen moderating to 7.5% in 2012 and more sharply to 4.5% in 2013 (Figure 3.33.5). This year growth will be supported by higher prices for the country’s key export commodities, heavy government spending, and rising domestic employment, at the same time as the LNG project’s construction phase reaches its peak. Growth will also be supported by a 20% expansion of the mineral sector as production starts at the Ramu nickel and cobalt mine, although this will be partly offset by a 9.9% reduction in oil production.
The slowdown in 2013 will stem from the winding down of LNG project construction, which will hit demand in a range of sectors, including construction itself, transport, and aviation. This effect will spill over into the wholesale and retail sectors. Adding to this shock will be further declines in oil production, which is predicted to contract by 17% in 2013.
Inflation is expected to remain high in 2012 (Figure 3.33.6). Record public and private investment will leave many areas of the economy, including construction, shipping, and port facilities, operating at close to full capacity. Offsetting these pressures is the kina exchange rate,
3.33.3 Budget balance
-8
-4
0
4
8
12
Official Adjusted for trust funds
111009082007
% of GDP
Sources: Department of Treasury. 2012 National Budget. Volume 1. Economic and Development Policies. http://www.treasury.gov.pg; ADB estimates.
3.33.4 Export indexes
0
50
100
150
200
250
Price (mining and oil)Price (agriculture and logs)Volume (mining and oil)Volume (agriculture and logs)
Dec11
Dec10
Dec09
Dec08
Dec07
Dec06
Dec2005
Dec 2005 = 100
Note: Index rebased to December 2005 = 100.
Source: Bank of Papua New Guinea. Quarterly Economic Bulletin. Various issues. http://www.bankpng.gov.pg
3.33.5 GDP growth
0
2
4
6
8
10
1312111009082007
%
ForecastSources: Department of Treasury. 2012 National Budget. Volume 1. Economic and Development Policies. http://www.treasury.gov.pg; ADB estimates.

234 Asian Development Outlook 2012
which is likely to remain high against those of major trading partners in 2012, after appreciating by 21% against the US dollar and 18% against the Australian dollar in 2011. On balance, price growth in 2012 is expected to ease slightly to 7.0% and to 6.0% in 2013 as the economy slows further and LNG-related construction activity declines.
In the external accounts, resource-project imports will maintain a large current account deficit, of around 33.2% of GDP in 2012 and 29.7% in 2013 (Figure 3.33.7). Foreign direct investment will continue to finance this gap. Foreign reserves are expected to remain adequate in terms of import cover over the forecast period.
The 2012 budget targets a balanced position, with an expected 9.5% increase in domestic revenue collection. As in previous years, the budget excludes net trust fund expenditure. Pressure to draw on these accumulated savings will be raised in the lead-up to national elections in mid-2012. Given existing capacity constraints, any large trust-fund drawdowns would add to inflationary pressures and crowd out private sector activity.
Fiscal stress will mount in 2013 as revenues from maturing mining and oil operations continue to decline. Combined with slowing growth, this is expected to begin a 2-year period of stagnant revenue collection, until LNG revenue begins in 2015.
Low public debt—about 24% of GDP in 2011—will enable measured government borrowing to maintain expenditure without compromising macroeconomic stability, although public finances face some risks, and a decline in international commodity prices would be painful. Revenue projections in the 2012 budget are predicated on an optimistic outlook for commodities: cocoa, coffee, palm oil, rubber, and tea prices are expected to moderate only slightly but remain near record highs, while prices of copra, copra oil, and copper are all expected to rise. The price of gold in particular, which makes up almost half of export earnings, is forecast to be 20% higher in 2012 than in 2011.
If commodity prices decline significantly this year, the government will face pressures to meet expenditure commitments without undermining the fiscal discipline that has underpinned the last decade of macroeconomic stability.
Another risk to the economic outlook is the government’s growing off-balance sheet contingent liabilities related to resource-project guarantees and unfunded superannuation liabilities, now totaling 32% of GDP. Of particular concern is the potential for unresolved landowner compensation issues to delay LNG project construction, which may result in the government being obliged to meet its project-completion guarantees.
On the upside, medium-term projections do not incorporate some potential new mining investments, including extending the lifespan of the Ok Tedi mine and a second LNG project.
Policy challenge—tackling inequalitiesThe last decade of economic growth has led to rising inequalities. Mineral exports and resource-project construction have underpinned a
2011. But the link between economic growth and the welfare of the poor
3.33.6 Inflation
0
3
6
9
12
1312111009082007
%
ForecastSources: Department of Treasury. 2012 National Budget. Volume 1. Economic and Development Policies. http://www.treasury.gov.pg; ADB estimates.
3.33.7 Current account balance
-45
-30
-15
0
15
30
1312111009082007
% of GDP
ForecastSources: Department of Treasury. 2012 National Budget. Volume 1. Economic and Development Policies. http://www.treasury.gov.pg; ADB estimates.
3.33.1 Selected economic indicators (%)
2012 2013
GDP growth 7.5 4.5
Inflation 7.0 6.0
Current account balance (share of GDP)
-33.2 -29.7
Source: ADB estimates.

Economic trends and prospects in developing Asia: The Pacific Papua New Guinea 235
is weak—the country is not expected to meet any of the Millennium Development Goals by 2015, and is ranked 153 out of 187 countries in the 2011 human development index compiled by the United Nations Development Programme.
A major challenge is the limited ability of the public sector to translate higher revenue into improved public services. A lack of socioeconomic data makes tracking performance difficult, but anecdotal evidence suggests that, despite a 120% increase in government expenditure since 2002, the quality of service delivery has remained stagnant and in some cases even declined, particularly in rural areas.
The effects of growth on employment creation are also restricted by the business environment. The country ranked 101 out of 183 countries on the World Bank’s 2012 Doing Business survey, the lowest in the South Pacific and well behind regional partners in Southeast Asia. So, despite some growth in recent years, the formal private sector remains small, employing less than 10% of the economically active population (Figure 3.33.8) and concentrated in just a few industries such as mining and agriculture.
High inflation has also undermined the inclusiveness of growth. Although wage earners can negotiate higher wages when costs rise, the roughly 85% of the population reliant on cash crops for their semi-subsistence livelihoods have seen their purchasing power deteriorate rapidly in recent years. Further, structural constraints in land and housing markets have restricted the supply response to rising property demand, and contributed to rising rental prices. As a result, an increasing portion of urban residents are now forced to live in informal urban settlements, which have poor access to power and sanitation facilities and which pose significant personal security risks.
Inequality is also growing in villages, reflecting rising compensation payments to incorporated landowner groups made by mining companies for use of land. With low educational and financial literacy levels, members of these groups can rarely hold leaders to account for the equitable distribution of royalty payments.
The government will have a major opportunity to improve living standards when revenue starts to flow to the budget from LNG exports. Inclusive growth will, however, require substantial reforms to public financial management to ensure that higher expenditure improves service delivery. A rejuvenated public sector is also needed to create a more diversified private sector able to create jobs on a broad base, by rehabilitating infrastructure and by pursuing an aggressive structural reform agenda that addresses the pervasively high cost of doing business.
3.33.8 Employment
80
100
120
140
160
180
7
8
9
10
11
12
Share of private formalemployment in labor force
Employment
1107200399951991
Index %
Sources: Bank of Papua New Guinea. Quarterly Economic Bulletin. Various issues. http://www.bankpng.gov.pg; PNG National Census 1990; World Bank. World Development Indicators online database (accessed 15 March 2012); ADB estimates.

Timor-Leste
Economic growth remained high in 2011, supported by another large increase in government expenditure. Double-digit growth is forecast for 2012, before a moderation in fiscal expansion sees some easing in economic growth. Inflation climbed sharply, and is expected to remain internationally high in 2012 and 2013. The key economic challenge is to move from an economy driven by public sector activity to one in which the private sector plays a key role.
Economic performanceThe economy’s strong growth performance continued in 2011, with GDP, excluding the offshore petroleum sector and the United Nations (the measure of GDP used hereafter), expanding by 10.0%. The spending of petroleum revenue continued to drive the economy. Although the full 2011 budget allocation was not spent, government expenditure, including
increase of 36.4% from 2010, and saw the ratio of government expenditure to GDP reach 185.5% in 2011.
The government’s capital spending more than doubled in 2011 (Figure 3.34.1), while recurrent expenditure rose by only 2.2%. Expenditure
because a large number of temporary civil service positions were converted to permanent positions during the year (Figure 3.34.2). This moved expenditure out of goods and services and this category was therefore below both the budgeted level and the outturn for 2010. Overall, 88.3% of the budget was spent in 2011, a similar ratio to the previous 2 years.
The national electrification program begun in 2008 accounted for most of the capital spending in 2011. Around half the total cost of
power stations and a new transmission system, and will greatly extend the distribution system. The first major milestone was met in late 2011, when the first power station entered operation.
A large budget surplus was again recorded. The steep rise in the world
around 12 times GDP.Average annual inflation was 13.1%. Inflation rose rapidly in the
first quarter of 2011 as higher world oil and food prices fed through the economy. Other contributing factors to the first quarter rise were a reduction in rice subsidies, and disruption to the harvest cycle because of excessive rain in 2010. There was little additional inflation in the second
3.34.1 Recurrent and capital expenditure
0
500
1,000
1,500
2,000
Capital Recurrent
13121110092008
$ million
ForecastSources: ADB estimates based on Timor-Leste National Statistics Directorate. Government of Timor-Leste Transparency Portal. http://www.transparency.gov.tl/english.html; Government of Timor-Leste. State Budget: Book 1 and Book 6. Various years.
This chapter was written by Craig Sugden, of the Special Office in Timor-Leste, ADB,
Dili.
3.34.2 Recurrent expenditure items
0
100
200
300
400
2012 budget201120102009
TransfersGoods and services
Wages and salaries
$ million
Sources: ADB estimates based on Timor-Leste National Statistics Directorate. Government of Timor-Leste Transparency Portal. http://www.transparency.gov.tl/english.html; Government of Timor-Leste. State Budget: Book 1 and Book 6. Various years.
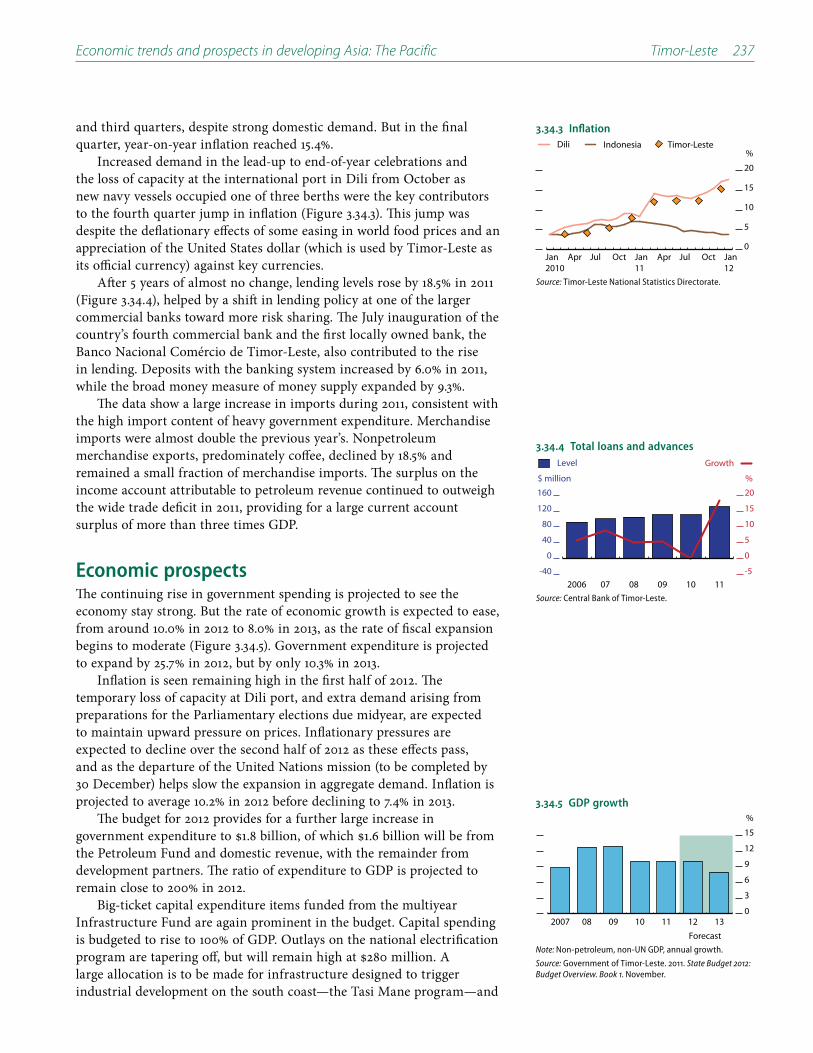
Economic trends and prospects in developing Asia: The Pacific Timor-Leste 237
and third quarters, despite strong domestic demand. But in the final quarter, year-on-year inflation reached 15.4%.
Increased demand in the lead-up to end-of-year celebrations and the loss of capacity at the international port in Dili from October as new navy vessels occupied one of three berths were the key contributors to the fourth quarter jump in inflation (Figure 3.34.3). This jump was despite the deflationary effects of some easing in world food prices and an appreciation of the United States dollar (which is used by Timor-Leste as its official currency) against key currencies.
After 5 years of almost no change, lending levels rose by 18.5% in 2011 (Figure 3.34.4), helped by a shift in lending policy at one of the larger commercial banks toward more risk sharing. The July inauguration of the country’s fourth commercial bank and the first locally owned bank, the Banco Nacional Comércio de Timor-Leste, also contributed to the rise in lending. Deposits with the banking system increased by 6.0% in 2011, while the broad money measure of money supply expanded by 9.3%.
The data show a large increase in imports during 2011, consistent with the high import content of heavy government expenditure. Merchandise imports were almost double the previous year’s. Nonpetroleum merchandise exports, predominately coffee, declined by 18.5% and remained a small fraction of merchandise imports. The surplus on the income account attributable to petroleum revenue continued to outweigh the wide trade deficit in 2011, providing for a large current account surplus of more than three times GDP.
Economic prospectsThe continuing rise in government spending is projected to see the economy stay strong. But the rate of economic growth is expected to ease, from around 10.0% in 2012 to 8.0% in 2013, as the rate of fiscal expansion begins to moderate (Figure 3.34.5). Government expenditure is projected to expand by 25.7% in 2012, but by only 10.3% in 2013.
Inflation is seen remaining high in the first half of 2012. The temporary loss of capacity at Dili port, and extra demand arising from preparations for the Parliamentary elections due midyear, are expected to maintain upward pressure on prices. Inflationary pressures are expected to decline over the second half of 2012 as these effects pass, and as the departure of the United Nations mission (to be completed by 30 December) helps slow the expansion in aggregate demand. Inflation is projected to average 10.2% in 2012 before declining to 7.4% in 2013.
The budget for 2012 provides for a further large increase in
the Petroleum Fund and domestic revenue, with the remainder from development partners. The ratio of expenditure to GDP is projected to remain close to 200% in 2012.
Big-ticket capital expenditure items funded from the multiyear Infrastructure Fund are again prominent in the budget. Capital spending is budgeted to rise to 100% of GDP. Outlays on the national electrification
large allocation is to be made for infrastructure designed to trigger industrial development on the south coast—the Tasi Mane program—and
3.34.3 Inflation
0
5
10
15
20
Timor-LesteIndonesiaDili
Jan12
OctJulAprJan11
OctJulAprJan2010
%
Source: Timor-Leste National Statistics Directorate.
3.34.4 Total loans and advances
-40
0
40
80
120
160
-5
0
5
10
15
20
GrowthLevel
11100908072006
$ million %
Source: Central Bank of Timor-Leste.
3.34.5 GDP growth
0
3
6
9
12
15
1312111009082007
%
ForecastNote: Non-petroleum, non-UN GDP, annual growth.
Source: Government of Timor-Leste. 2011. State Budget 2012: Budget Overview. Book 1. November.

238 Asian Development Outlook 2012
from development partners is proposed to support a multiyear project to begin upgrading the country’s major roads.
World oil prices are projected to remain around current levels in 2012 and 2013, underpinning high petroleum revenue (Figure 3.34.6) as well as large budget and current account surpluses. These surpluses are projected to remain close to 200% of GDP in 2012, before easing in 2013 (Figure 3.34.7).
Longer-term prospects for private sector development and the economy more broadly have been strengthened by the early 2012 government approval of a framework for public–private partnerships. The framework identifies the type of public infrastructure that may be considered for such partnerships, and how such projects will be evaluated, provisioned, and managed. It is now important to bring forward the best candidate projects to address looming infrastructure bottlenecks. Priorities are operating and maintaining the expanding electricity system, rehabilitating the only international airport, building a new international sea port, and upgrading the degraded water supply system in Dili.
A large step forward was also taken through Parliament’s approval in early 2012 of a land law that provides a framework for land ownership and resolution of conflicting claims. Complementary laws that allow the state to acquire land for public purposes were also approved. These new laws extend a legal process established in 2011 for registering land claims and confirming those that are undisputed (so far, 92% of 47,000 registered claims have been undisputed). A Civil Code that came into force in March 2012 also includes a section governing day-to-day decisions such as the sale and lease of land. Such legal reforms are an essential underpinning of private sector development because they provide greater certainty over property rights.
Policy challenge highlightsA key issue facing Timor-Leste is whether the economy should be slowed in an effort to reduce inflation. While some farmers have benefited from the boost to their income provided by higher food prices, many of the urban poor are suffering from the increased cost of living. Other policy responses also warrant consideration. Notably, enhanced targeting of the government’s sizable public social safety net, which received another large funding increase in the 2012 budget, could help alleviate pressures on the poor. It is also important to keep infrastructure investment high, as this is needed to alleviate supply bottlenecks and reduce the cost of local production.
The major economic challenge remains moving from an economy in which growth has been primarily dependent on public sector activity to one in which the private sector plays a key role. The inaugural Business Activity Survey, covering 2010, has provided a reminder of the nascent state of the private sector. The survey confirmed the concentration of the formal business sector in Dili—more than 80% of employment and value-added was earned by Dili-based businesses—and its shallow structure—the retail and wholesale, construction, and accommodation and food services accounted for about 60% of total employment and value added.
3.34.6 Petroleum accounts
0
1,000
2,000
3,000
4,000
Petroleum Fund withdrawalPetroleum revenue
13121110092008Forecast
$ million
Sources: ADB estimates based on Timor-Leste National Statistics Directorate. Government of Timor-Leste Transparency Portal. http://www.transparency.gov.tl/english.html; Government of Timor-Leste. State Budget: Book 1 and Book 6. Various years.
3.34.7 Expenditure and revenue
0
200
400
600
Budget balance RevenueExpenditure
13121110092008
% of GDP
ForecastNote: Non-petroleum, non-UN GDP, annual growth.
Sources: ADB estimates based on Timor-Leste National Statistics Directorate. Government of Timor-Leste Transparency Portal. http://www.transparency.gov.tl/english.html; Government of Timor-Leste. State Budget: Book 1 and Book 6. Various years.
3.34.1 Selected economic indicators (%)
2012 2013
GDP growth 10.0 8.0
Inflation 10.2 7.4
Current account balance (share of GDP)
229.4 153.7
Source: ADB estimates.

Small Pacific countries
Overall growth among the 11 small Pacific countries was faster in 2011 than in 2010. All of them except Tonga expanded. In three, the growth in gross domestic product (GDP) was 5.0% or more and the Solomon Islands—at 9.3%—was one of the fastest-growing economies in developing Asia.
The growth in tourism evident in 2010 continued in 2011, particularly in the Cook Islands, Palau, and Samoa, and the number of tourist arrivals hit records. Construction had an important influence on growth in many of the small economies, notably Cook Islands, Marshall Islands, Samoa, and Vanuatu, but in the Federated States of Micronesia a winding down of large public construction projects led to slower growth.
The outlook for these small economies is positive. Most of them are expected to have faster growth in 2012 than in 2011. The main exception is Solomon Islands where growth is likely to decelerate because of a decline in logging. All of them are expected to continue expanding in 2013, but all—apart from Vanuatu—at a slower pace than in 2012.
Stable oil and lower food prices will keep inflation generally lower in 2012 than in 2011, but several countries will have higher inflation on increased domestic demand and domestic constraints. In 2013 most of these economies face the prospect of slightly higher inflation, because food prices are expected to pick up.
Improving government fiscal management and public sector efficiency, as well as maintaining basic public services by investing in vital infrastructure, are priority needs to support sustained growth in the small Pacific countries.
Cook IslandsAfter several years of negative or slow growth, the Cook Islands recovered in FY2011 (ended 30 June 2011) with GDP growth of 3.4% (Figure 3.35.1). This reflected expansion in tourism and fisheries, as well as increased construction associated with upgrading of Avatiu port. Tourism accounts for about two-thirds of GDP and an improved economic outlook in Australia and New Zealand (the source of four-fifths of arrivals) helped push visitor arrivals to over 108,000 in FY2011, a new fiscal year high. During July–December 2011, arrivals increased by 6.4% relative to the same 6 months in 2010 (Figure 3.35.2).
In FY2011, inflation slipped to 0.6% from 1.8% in FY2010, driven primarily by declines in housing and household costs, such as rent and utilities.
3.35.1 GDP growth, Cook Islands
-4
-2
0
2
4
6
1312111009082007
%
ForecastSources: Ministry of Finance. 2011. 2012/13 Budget Policy Statement and 2011/12 Half Year Economic and Fiscal Update. December; ADB estimates.
This chapter was written by Christopher Edmonds, Emma Veve, Rommel Rabanal, and
Cara Tinio of the Pacific Department, ADB, Manila; Malie Lototele and Laisiasa Tora
of the South Pacific Subregional Office, ADB, Suva; and Milovan Lucich of the Pacific
Liaison and Coordination Office, ADB, Sydney.
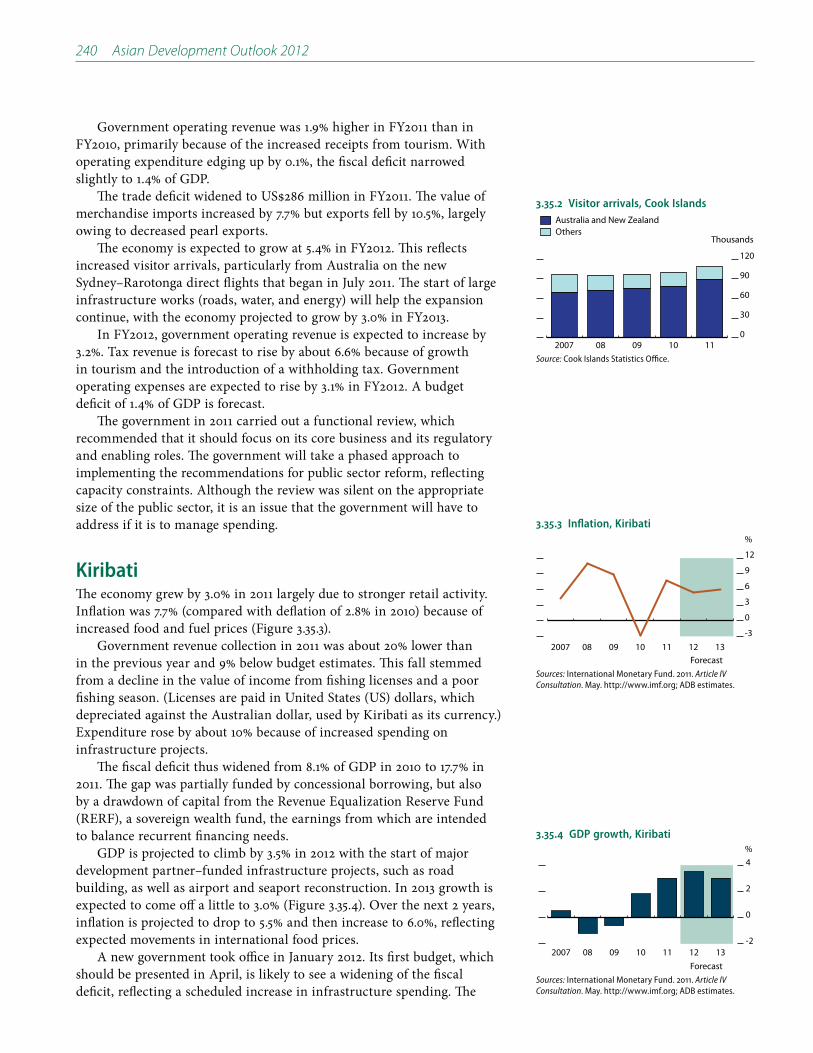
240 Asian Development Outlook 2012
Government operating revenue was 1.9% higher in FY2011 than in FY2010, primarily because of the increased receipts from tourism. With operating expenditure edging up by 0.1%, the fiscal deficit narrowed slightly to 1.4% of GDP.
merchandise imports increased by 7.7% but exports fell by 10.5%, largely owing to decreased pearl exports.
The economy is expected to grow at 5.4% in FY2012. This reflects increased visitor arrivals, particularly from Australia on the new Sydney–Rarotonga direct flights that began in July 2011. The start of large infrastructure works (roads, water, and energy) will help the expansion continue, with the economy projected to grow by 3.0% in FY2013.
In FY2012, government operating revenue is expected to increase by 3.2%. Tax revenue is forecast to rise by about 6.6% because of growth in tourism and the introduction of a withholding tax. Government operating expenses are expected to rise by 3.1% in FY2012. A budget deficit of 1.4% of GDP is forecast.
The government in 2011 carried out a functional review, which recommended that it should focus on its core business and its regulatory and enabling roles. The government will take a phased approach to implementing the recommendations for public sector reform, reflecting capacity constraints. Although the review was silent on the appropriate size of the public sector, it is an issue that the government will have to address if it is to manage spending.
KiribatiThe economy grew by 3.0% in 2011 largely due to stronger retail activity. Inflation was 7.7% (compared with deflation of 2.8% in 2010) because of increased food and fuel prices (Figure 3.35.3).
Government revenue collection in 2011 was about 20% lower than in the previous year and 9% below budget estimates. This fall stemmed from a decline in the value of income from fishing licenses and a poor fishing season. (Licenses are paid in United States (US) dollars, which depreciated against the Australian dollar, used by Kiribati as its currency.) Expenditure rose by about 10% because of increased spending on infrastructure projects.
The fiscal deficit thus widened from 8.1% of GDP in 2010 to 17.7% in 2011. The gap was partially funded by concessional borrowing, but also by a drawdown of capital from the Revenue Equalization Reserve Fund (RERF), a sovereign wealth fund, the earnings from which are intended to balance recurrent financing needs.
GDP is projected to climb by 3.5% in 2012 with the start of major development partner–funded infrastructure projects, such as road building, as well as airport and seaport reconstruction. In 2013 growth is expected to come off a little to 3.0% (Figure 3.35.4). Over the next 2 years, inflation is projected to drop to 5.5% and then increase to 6.0%, reflecting expected movements in international food prices.
A new government took office in January 2012. Its first budget, which should be presented in April, is likely to see a widening of the fiscal deficit, reflecting a scheduled increase in infrastructure spending. The
3.35.3 Inflation, Kiribati
-3
0
3
6
9
12
1312111009082007
%
ForecastSources: International Monetary Fund. 2011. Article IV Consultation. May. http://www.imf.org; ADB estimates.
3.35.4 GDP growth, Kiribati
-2
0
2
4
1312111009082007
%
ForecastSources: International Monetary Fund. 2011. Article IV Consultation. May. http://www.imf.org; ADB estimates.
3.35.2 Visitor arrivals, Cook Islands
0
30
60
90
120
OthersAustralia and New Zealand
111009082007
Thousands
Source: Cook Islands Statistics Office.

Economic trends and prospects in developing Asia: The Pacific Small Pacific countries 241
deficit will be partly funded by an RERF drawdown, raising concerns about the fund’s long-term sustainability after drawdowns averaging
Growth of the RERF is the key to ensuring long-term fiscal sustainability. Reducing the annual demands on the fund to a level that can be met from its income will require extensive fiscal consolidation. Over the medium term, the government should aim to stabilize the value of the RERF, by keeping budget deficits to 5–6% of GDP. Stronger control of expenditure on personnel costs is one option it could investigate.
Republic of the Marshall IslandsEconomic growth slowed slightly to 5.0% in FY2011 (ended 30 September 2011). This solid performance was supported by fishing activity, continued high spending related to US military operations under the Kwajalein Land Use Agreement, and the upgrade of the international airport in Majuro.
Inflation shot up to 9.5% (from 1.6% in FY2010). Steep rises in the prices of commodities (which have a weighting of nearly 50% in the consumer price index), high transport costs arising from the country’s remote location, and the pickup in domestic demand drove this increase.
The fiscal surplus fell from 4.6% of GDP in FY2010 to 1.4%. Although grants declined, domestic revenue—mainly from fishing license fees—rose. Public expenditure climbed by 6.1%, reflecting, primarily, increased purchases of goods and services.
The current account remained in deficit (12.6% of GDP). Although
Economic growth is foreseen to reach 5.4% in FY2012, boosted by continued growth in fisheries and airport-related construction, before slowing to 2.6% in FY2013 (Figure 3.35.5). FY2013 is likely to see a fiscal surplus of slightly over 1% of GDP. A projected step-up in grants will finance about 70% of the budget and contribute to a 5.1% gain in total receipts. Total government expenditure will rise by 5.7%, partly due to greater subsidies to state-owned enterprises (SOEs).
Inflation is projected to slow to 2.5% in FY2012 before accelerating to 3.0% in FY2013, in line with expected trends in global food prices (Figure 3.35.6).
The current account deficit is forecast to widen to 30.3% of GDP in FY2012. Although merchandise exports will grow by 14.8%, imports are expected to jump by 29.8% owing to continued demand from the airport upgrade and expansion of fisheries.
The country has to build up the Compact Trust Fund to prepare for fiscal self-sufficiency once US Compact grants expire in 2023, while paying down the high government debt. It also needs to generate sustainable economic growth. Fiscal and structural reforms are needed to stimulate private sector economic activity, generate domestic employment and income, and broaden the local tax base. Tax reforms are required to increase government revenue and offset planned reductions in grants. In addition, SOE reforms and cutbacks in public expenditure are needed to improve the fiscal balance.
3.35.5 GDP growth, the Marshall Islands
-2
0
2
4
6
1312111009082007
%
ForecastSources: Republic of Marshall Islands Fiscal Year 2010 Economic Review. http://www.pitiviti.org; International Monetary Fund. 2011. Article IV Consultation—Staff Report. November. http://www.imf.org
3.35.6 Inflation, the Marshall Islands
0
4
8
12
16
1312111009082007
%
ForecastSources: Republic of Marshall Islands Fiscal Year 2010 Economic Review. http://www.pitiviti.org; ADB estimates.
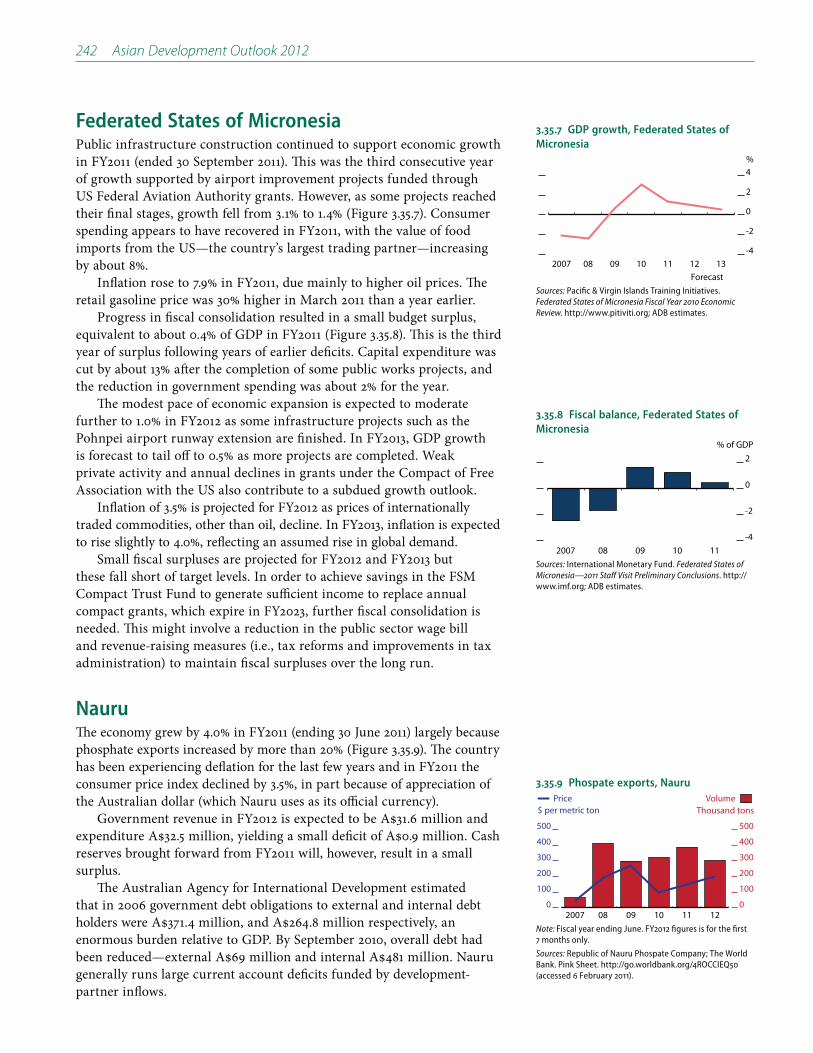
242 Asian Development Outlook 2012
Federated States of MicronesiaPublic infrastructure construction continued to support economic growth in FY2011 (ended 30 September 2011). This was the third consecutive year of growth supported by airport improvement projects funded through US Federal Aviation Authority grants. However, as some projects reached their final stages, growth fell from 3.1% to 1.4% (Figure 3.35.7). Consumer spending appears to have recovered in FY2011, with the value of food imports from the US—the country’s largest trading partner—increasing by about 8%.
Inflation rose to 7.9% in FY2011, due mainly to higher oil prices. The retail gasoline price was 30% higher in March 2011 than a year earlier.
Progress in fiscal consolidation resulted in a small budget surplus, equivalent to about 0.4% of GDP in FY2011 (Figure 3.35.8). This is the third year of surplus following years of earlier deficits. Capital expenditure was cut by about 13% after the completion of some public works projects, and the reduction in government spending was about 2% for the year.
The modest pace of economic expansion is expected to moderate further to 1.0% in FY2012 as some infrastructure projects such as the Pohnpei airport runway extension are finished. In FY2013, GDP growth is forecast to tail off to 0.5% as more projects are completed. Weak private activity and annual declines in grants under the Compact of Free Association with the US also contribute to a subdued growth outlook.
Inflation of 3.5% is projected for FY2012 as prices of internationally traded commodities, other than oil, decline. In FY2013, inflation is expected to rise slightly to 4.0%, reflecting an assumed rise in global demand.
Small fiscal surpluses are projected for FY2012 and FY2013 but these fall short of target levels. In order to achieve savings in the FSM Compact Trust Fund to generate sufficient income to replace annual compact grants, which expire in FY2023, further fiscal consolidation is needed. This might involve a reduction in the public sector wage bill and revenue-raising measures (i.e., tax reforms and improvements in tax administration) to maintain fiscal surpluses over the long run.
NauruThe economy grew by 4.0% in FY2011 (ending 30 June 2011) largely because phosphate exports increased by more than 20% (Figure 3.35.9). The country has been experiencing deflation for the last few years and in FY2011 the consumer price index declined by 3.5%, in part because of appreciation of the Australian dollar (which Nauru uses as its official currency).
reserves brought forward from FY2011 will, however, result in a small surplus.
The Australian Agency for International Development estimated that in 2006 government debt obligations to external and internal debt
enormous burden relative to GDP. By September 2010, overall debt had
generally runs large current account deficits funded by development-partner inflows.
3.35.7 GDP growth, Federated States of Micronesia
-4
-2
0
2
4
1312111009082007
%
ForecastSources: Pacific & Virgin Islands Training Initiatives. Federated States of Micronesia Fiscal Year 2010 Economic Review. http://www.pitiviti.org; ADB estimates.
3.35.8 Fiscal balance, Federated States of Micronesia
-4
-2
0
2
111009082007
% of GDP
Sources: International Monetary Fund. Federated States of Micronesia—2011 Staff Visit Preliminary Conclusions. http://www.imf.org; ADB estimates.
3.35.9 Phospate exports, Nauru
0
100
200
300
400
500
0
100
200
300
400
500
Price Volume
12111009082007
$ per metric ton Thousand tons
Note: Fiscal year ending June. FY2012 figures is for the first 7 months only.
Sources: Republic of Nauru Phospate Company; The World Bank. Pink Sheet. http://go.worldbank.org/4ROCCIEQ50 (accessed 6 February 2011).

Economic trends and prospects in developing Asia: The Pacific Small Pacific countries 243
Recently improved phosphate-loading facilities are expected to lift phosphate exports to 450,000 tons in FY2012 from 350,000 tons in FY2011, taking economic growth to 4.8% in FY2012 and 4.2% in FY2013.
The level of national debt precludes sovereign borrowing, so Nauru will maintain near-balanced budgets in the forecast period. Recent reforms to the phosphate export enterprise may improve fiscal performance gradually. Inflation is expected to turn positive, as currency appreciation effects wash through, and average 1.5% and 2.0% in the next 2 fiscal years.
The limited growth prospects for very small Pacific countries, such as Nauru, was acknowledged in a recent review of Australia’s official development assistance (ODA). A planned increase in ODA, to offset the lack of private sector activity, is likely to be delivered through program-based approaches. This will require improvements to the country’s public financial management strategies in order to efficiently absorb and manage higher ODA levels and translate this into economic growth.
Republic of PalauThe economy grew by 5.8% in FY2011 (ended 30 September 2011), up from 0.3% the previous year. Growth reflected strong data for tourism, which accounts for about half GDP. Arrivals from Asia, particularly East Asia, rose steeply (Figure 3.35.10), aided by the addition of Delta Airlines flights between Palau and Japan. In FY2011, visitor arrivals increased by over 25% and exceeded 100,000 for the first time.
Rising food and transport costs raised inflation to 2.1% in FY2011, from 1.2% in FY2010. Inflation largely tracks price developments in the US—Palau’s primary trading partner—in the absence of any major domestic inflationary factors.
The government continued to reduce expenditure (by 3.1% during FY2011), with cuts focused on publicly provided goods and services. Public sector wages and salaries, which account for over a third of total government spending, rose by about 5% FY2011. The fiscal deficit widened to 2.3% of GDP as lower grants from the US outweighed an increase in domestic revenue associated with the economic recovery.
Tourism will remain the key source of growth for the foreseeable future, and visitor arrivals will continue to depend on developments abroad—particularly in Japan; Republic of Korea; and Taipei,China. Palau’s visitor arrivals are projected to go up by 7.5% and 6.0% in the next 2 fiscal years, supporting GDP growth of 3.0% and 2.0% (Figure 3.35.11).
Inflation is projected to fall to 2.0% in FY2012 and to edge up to 2.5% the following year, in line with expected international commodity price trends.
The government is expected to maintain its contractionary fiscal stance on concerns about its fiscal position. Comprehensive civil service reform is needed to reduce the public sector wage bill. New revenue-raising measures, including increased tax rates for high-income earners and a steeper hotel-room tax, are under consideration and are likely to be adopted this fiscal year. Further tax reforms, such as a value-added tax, may also be required.
Palau’s tourism-oriented economy relies heavily on basic public
3.35.10 Visitor arrivals, Palau
0
30
60
90
120
OthersRep. of KoreaTaipei,ChinaJapan
111009082007
Thousand persons
Source: Palau Visitors Authority. http://www.visit-palau.com (accessed 16 March 2012).
3.35.11 GDP growth, Palau
-8
-4
0
4
8
1312111009082007
%
ForecastSources: Pacific Financial Technical Assistance Centre; ADB estimates.
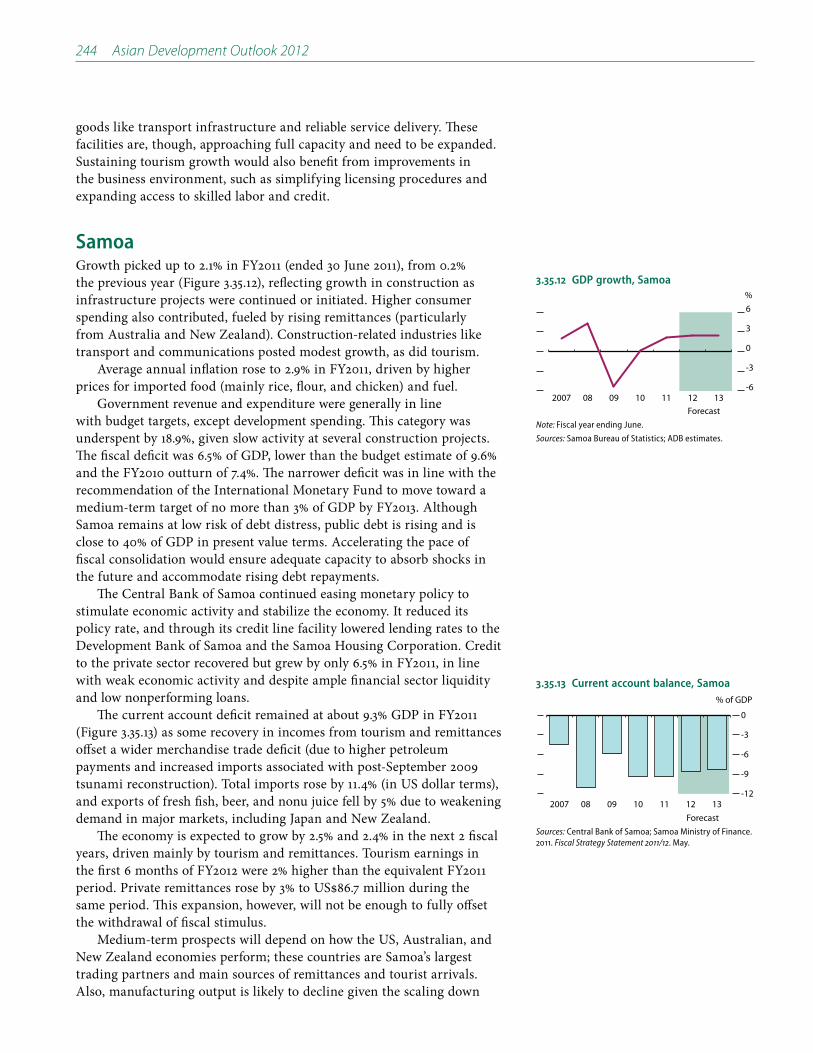
244 Asian Development Outlook 2012
goods like transport infrastructure and reliable service delivery. These facilities are, though, approaching full capacity and need to be expanded. Sustaining tourism growth would also benefit from improvements in the business environment, such as simplifying licensing procedures and expanding access to skilled labor and credit.
SamoaGrowth picked up to 2.1% in FY2011 (ended 30 June 2011), from 0.2% the previous year (Figure 3.35.12), reflecting growth in construction as infrastructure projects were continued or initiated. Higher consumer spending also contributed, fueled by rising remittances (particularly from Australia and New Zealand). Construction-related industries like transport and communications posted modest growth, as did tourism.
Average annual inflation rose to 2.9% in FY2011, driven by higher prices for imported food (mainly rice, flour, and chicken) and fuel.
Government revenue and expenditure were generally in line with budget targets, except development spending. This category was underspent by 18.9%, given slow activity at several construction projects. The fiscal deficit was 6.5% of GDP, lower than the budget estimate of 9.6% and the FY2010 outturn of 7.4%. The narrower deficit was in line with the recommendation of the International Monetary Fund to move toward a medium-term target of no more than 3% of GDP by FY2013. Although Samoa remains at low risk of debt distress, public debt is rising and is close to 40% of GDP in present value terms. Accelerating the pace of fiscal consolidation would ensure adequate capacity to absorb shocks in the future and accommodate rising debt repayments.
The Central Bank of Samoa continued easing monetary policy to stimulate economic activity and stabilize the economy. It reduced its policy rate, and through its credit line facility lowered lending rates to the Development Bank of Samoa and the Samoa Housing Corporation. Credit to the private sector recovered but grew by only 6.5% in FY2011, in line with weak economic activity and despite ample financial sector liquidity and low nonperforming loans.
The current account deficit remained at about 9.3% GDP in FY2011 (Figure 3.35.13) as some recovery in incomes from tourism and remittances offset a wider merchandise trade deficit (due to higher petroleum payments and increased imports associated with post-September 2009 tsunami reconstruction). Total imports rose by 11.4% (in US dollar terms), and exports of fresh fish, beer, and nonu juice fell by 5% due to weakening demand in major markets, including Japan and New Zealand.
The economy is expected to grow by 2.5% and 2.4% in the next 2 fiscal years, driven mainly by tourism and remittances. Tourism earnings in the first 6 months of FY2012 were 2% higher than the equivalent FY2011
same period. This expansion, however, will not be enough to fully offset the withdrawal of fiscal stimulus.
Medium-term prospects will depend on how the US, Australian, and New Zealand economies perform; these countries are Samoa’s largest trading partners and main sources of remittances and tourist arrivals. Also, manufacturing output is likely to decline given the scaling down
3.35.12 GDP growth, Samoa
-6
-3
0
3
6
1312111009082007
%
ForecastNote: Fiscal year ending June.
Sources: Samoa Bureau of Statistics; ADB estimates.
3.35.13 Current account balance, Samoa
-12
-9
-6
-3
0
1312111009082007
% of GDP
ForecastSources: Central Bank of Samoa; Samoa Ministry of Finance. 2011. Fiscal Strategy Statement 2011/12. May.

Economic trends and prospects in developing Asia: The Pacific Small Pacific countries 245
3.35.14 GDP growth, Solomon Islands
-4
0
4
8
12
1312111009082007
%
ForecastSources: Solomon Islands National Statistics Office; ADB estimates.
of production at the Yazaki auto-part plant due to a reduction in wire harness orders from Toyota Australia.
The FY2012 budget projects the fiscal deficit to remain at 6.5% of GDP. Inflation is expected to continue rising to about 5.0% in FY2012—
as strong domestic demand counteracts increased local agricultural production and falling international commodity prices—but then to fall back to 3.3% in FY2013.
The balance of payments is projected to record an overall surplus in FY2012 due to the anticipated heavy influx of donor funds (about
fish, and nonu juice are likely to benefit, as the People’s Republic of China phases in duty-free entry of a greater range of Samoan products in line with a July 2010 trade agreement.
Continued efforts to advance fiscal consolidation and to lower public debt are essential to create the fiscal flexibility necessary to enable the government to respond to external shocks.
Solomon IslandsThe economy grew at 9.3% in 2011–the fastest of the Pacific island countries. As in previous years, the major contributor to growth was log production, where output was more than 1.9 million cubic meters, around one-third more than in 2010. This reflected continued high demand in Asia. The country also benefited from high international prices for other commodities such as palm oil, cocoa, copra, and fish, as well as renewed gold exports from the Gold Ridge mine in Guadalcanal, which resumed production after closing in June 2000 due to civil conflict.
After falling to 1.0% in 2010, inflation jumped to 7.4%, largely reflecting strong growth and higher global food and energy prices. In 2011, the central bank allowed the Solomon Islands dollar to appreciate vis-à-vis the US dollar by 8.7% in an explicit effort to contain inflation. It also resumed issuing its own short-term bills to reduce liquidity in the banking system. After contracting in 2010 and the first 9 months of 2011, credit growth increased to 7.2% in the last quarter of the year.
A budget surplus equivalent to 2.1% of GDP was recorded in 2011. Revenue increased by almost 25% from 2010. Strong production of logs and favorable prices in 2011 boosted customs duties, while strong economic activity and elevated fuel prices led to higher inland revenues (i.e., goods and sales taxes, personal and corporate income taxes).
Overall recurrent expenditure grew by 1.2% in 2011, with payrolls growing by 4.2% owing to cost-of-living adjustments to public service salaries. Development expenditure grew by 54% during the year. Public debt declined from 24.0% of GDP in 2010 to 21.6% in late 2011, related to debt repayments and an increase in nominal GDP.
The current account deficit narrowed to 11.2% of GDP, from 27.6% in 2010 on higher exports and reduced imports of capital equipment following the reopening of the Gold Ridge mine. The deficit has been funded through donor inflows and foreign investment. Foreign reserve cover improved to over 9 months of imports as of December 2011.
Growth is expected to moderate to 6.0% and 5.0% over the next 2 years (Figure 3.35.14). Reduced logging output, due to overexploitation

246 Asian Development Outlook 2012
3.35.15 Inflation, Solomon Islands
0
5
10
15
20
1312111009082007
%
ForecastSources: Central Bank of Solomon Islands; ADB estimates.
3.35.16 GDP growth, Tonga
-2
-1
0
1
2
3
1312111009082007
Forecast
%
Sources: Ministry of Finance and National Planning; ADB estimates.
of the native forest, will be partly offset by increased value of gold output, as the Gold Ridge mine reaches full output, and by strengthening commodities such as palm oil, copra, and vanilla.
The 2012 budget is balanced. Expenditure is to increase by 47%, which will be covered by a 22.4% gain in revenue, a drawdown on the National Transport Fund for development projects, and by using grants from the Regional Assistance Mission to Solomon Islands (RAMSI). To help preserve the budgetary position if the strong revenue growth does not continue, much of the increase in spending is in one-time items such as the hosting of the Pacific Arts Festival, or items that can be scaled back, including a planned doubling of debt repayments in late 2012.
This rate of expenditure growth, however, is unsustainable and will need to be reduced in future budgets.
Inflation is expected to moderate over the next 2 years as growth and global commodity prices ease. Average inflation of 5.5% and 5.0% are forecast (Figure 3.35.15). The central bank will likely continue to let the exchange rate appreciate modestly if inflation does not moderate.
The current account deficit is forecast to widen to around 15.0% of GDP in 2012 and 2013 as a result of slower export growth. The gap will be funded through continued donor inflows and foreign investment. Foreign reserves should remain at around 7–8 months of imports.
The private sector faces numerous challenges to doing business. It must compete with SOEs, which receive preferential access to resources and operate in markets reserved for them, such as power and water supply. The SOEs hold nearly a quarter of the nation’s fixed assets, absorb large amounts of scarce capital, and generally yield negative returns on their fixed assets and investments, thereby increasing costs for private enterprises.
A State Owned Enterprise Act, passed in 2007, and its accompanying regulations, issued in 2010, now provide a robust framework for SOE governance and monitoring. Implementation of this act—including improving the accuracy and timeliness of the financial information prepared by SOEs as well as requiring proper costing, funding, and documentation of all community service obligations—is essential to improving efficiency and accountability.
Major gaps exist in access to infrastructure across the country. A majority of the nation’s rural population does not, for example, have access to paved roads, regular electricity supplies, or telecommunications.
TongaThe economy contracted by 0.3% in FY2011 (ended 30 June 2011) after growth of 0.3% the previous year (Figure 3.35.16). Remittances, coming largely from the US, continued to decline, and, coupled with banks’ steps to repair their balance sheets, affected both business and household investment and consumption. Tourism, and particularly the cruise liner market segment, was the bright spot in the economy, with tourism receipts growing by 14.8% (in real terms) in FY2011 from the previous year.
Inflation rose to about 6.1%, reflecting the surge in global fuel and food prices and higher excise taxes on tobacco and alcohol.

Economic trends and prospects in developing Asia: The Pacific Small Pacific countries 247
3.35.17 Private remittances, Tonga
-30
-20
-10
0
10
20
RealNominal
DecSepJunMar11
DecSepJunMar2010
year-on-year % change, 3-month moving average
Source: National Reserve Bank of Tonga.
Revenue in FY2011 was 5.8% more than in FY2010, but despite this and receipt of budget support grants from development partners, the FY2011 fiscal deficit widened to 7.9% of GDP, financed mainly by loans from the EXIM Bank of China and drawdowns on domestic cash balances. The share of public debt to GDP rose to 56.1% (including the undisbursed portion of loans) by end-FY2011, exceeding the government’s target ceiling of 40%.
To boost commercial bank lending, the central bank continued to ease monetary policy, although lending to businesses and households in 2011 continued declining, by 11.1% and 4.6%, respectively.
In the external account, fish and squash exports (which account for more than half of all exports) grew by only 1.9% in FY2011 (after more than doubling in FY2010) given problems in meeting quarantine requirements for New Zealand, and unfavorable weather. Imports, dominated by basic consumption goods, increased by 16.6%, largely due to higher oil prices as well as increased imports of wholesale and retail goods and construction materials.
Foreign reserves remained at comfortable levels, reaching 7.7 months of imports, reflecting receipts of development-partner funds, ample liquidity in the financial system, and weak business and household activity.
The economy is forecast to show virtually zero growth in the next 2 years. Domestic economic activity is expected to remain weak despite donor-funded public construction, in view of declining remittances and flat credit growth, which will affect household consumption and private sector investment.
A bleak outlook on remittances is also foreseen given the slow recovery in the US and continuing high unemployment in other source economies such as New Zealand. Government analysis suggests remittances are likely to be permanently lower than in the past (Figure 3.35.17). Exports, which are around 3% of GDP, could, however, lead a stronger expansion of the economy if supply-side constraints are addressed and compliance with export market quarantine standards improves.
The central bank is expected to continue its loose monetary policy stance, unless global commodity prices rise further. Inflation is likely to hover around 6.0% in FY2012.
Tonga is classified by the International Monetary Fund as at high risk of debt distress. The high public debt and its composition pose serious challenges. Debt repayments are expected to increase by 70% in FY2014, when repayments start on a loan from the EXIM Bank of China. It is critical that the government uses year-end cash surpluses, reprioritizes expenditure, and raises the tax effort to build cash reserves, which could provide a buffer against cross-currency foreign exchange risks and safeguard the government‘s expenditure programs.
TuvaluAfter 2 years of contraction, the economy grew by 1.0% in 2011 (Figure 3.35.18), largely due to higher remittances. The consumer price index increased by 0.5% in 2011, which was lower than in most other Pacific economies, reflecting the appreciation of the Australian dollar (which Tuvalu uses as its currency) against the US dollar.

248 Asian Development Outlook 2012
3.35.19 Total government debt, Tuvalu
0
5
10
15
20
25
0
15
30
45
60
75
% of GDPA$ million
12111009082007Forecast
Sources: International Monetary Fund. 2011. Article IV Consultation. August. http://www.imf.org; ADB estimates.
3.35.20 Visitor arrivals, Vanuatu
0
30
60
90
120
OthersNew ZealandAustralia
111009082007
Thousand persons
Source: Vanuatu National Statistics Office.
Total revenues and grants for 2011 were slightly below budget but about 20% higher than in 2010. The increase was mainly due to the grants. Government expenditure fell by more than 7% as subsidies were reduced and spending on capital projects declined. These developments led to a reduction in the fiscal deficit from over 30% of GDP in 2010 to about 8% in 2011. However, weakly controlled spending on the Tuvalu Medical Treatment Scheme remains a heavy drain on the budget with actual expenditure 70% above budget in 2011. Total government debt was estimated at 44.3% of GDP in 2010, and may be higher with the status of contingent liabilities from joint-venture fishing companies to be determined (Figure 3.35.19).
of 30 September 2011. As this was 9.7% below its prescribed maintained value, nothing was distributed from the fund to the Consolidated Investment Fund (CIF—the vehicle through which budget deficits are financed).
Growth is expected to edge up to 1.4% and 1.3% in the next 2 years, supported by development partner–financed upgrading of the Tuvalu airfield and airport. Increases in remittances are also expected.
less than the 2011 outturn, due to a projected 3.3% reduction in receipts from fisheries licenses and lower grant funds. Government expenditure is
and, given the expected deficit, is likely to be exhausted this year. Further distribution from trust fund earnings is not expected until 2014 at the earliest.
The fiscal situation remains precarious. With the likely exhaustion of the CIF in 2012, development partners will become the primary avenue for budget financing, underlining the importance of reforms and expenditure controls.
VanuatuGrowth nearly doubled in 2011 to 4.3%, reflecting strong agricultural exports (notably copra and coconut oil), high international commodity prices, and growth in construction. Tourist arrivals fell, however, by 3.5% from the 2010 level, which had been inflated because flooding in Fiji diverted tourists to other destinations (Figure 3.35.20).
Despite high global energy and food prices, the consumer price index rose by just 0.8% in 2011. This was partly explained by a slowdown in growth of private credit.
The current account deficit was steady at 5.9% of GDP in 2011, and was more than covered by foreign investment and donor inflows. By December 2011, foreign exchange reserves had risen to 6.3 months of import cover, from 5.8 months in March 2011.
Economic growth of 4.5–5.0% is forecast over the next 2 years (Figure 3.35.21). This will be driven by increasing construction, continuing strength in agricultural production, and recovering tourism (additional flights are planned from Australia and Fiji).
3.35.18 GDP growth, Tuvalu
-2
0
2
4
6
8
1312111009082007
%
ForecastSources: International Monetary Fund. 2011. Article IV Consultation. August. http://www.imf.org; ADB estimates.

Economic trends and prospects in developing Asia: The Pacific Small Pacific countries 249
3.35.21 GDP growth, Vanuatu
0
2
4
6
8
1312111009082007
%
Forecast
Sources: Vanuatu National Statistics Office; ADB estimates.
Small fiscal deficits of 1.5% and 2.7% of GDP are expected as the government increases borrowing to fund improvements to infrastructure. Public debt as a share of GDP is expected to remain around 20%, as higher debt is offset by growth in nominal GDP. If, however, contingent liabilities associated with past losses of some of the poorer performing SOEs were included, debt as a share of GDP would likely exceed the government’s ceiling of 40%.
Inflation is expected to pick up as the economy grows, to around 3.0–4.0%.
The current account deficit is forecast to widen a little to 6.3–6.5% of GDP over the next 2 years, as a result of stronger imports related to infrastructure projects. The gap will be funded through continued donor inflows and foreign investment. Foreign exchange reserves are expected to remain at levels needed to finance 5–6 months of imports.
Vanuatu became WTO’s 154th member in November 2011. Joining required reductions in tariffs but the resulting loss in revenue will be partly offset by excise increases. Taxes as a share of GDP are already relatively low at around 19% of GDP. Thus, as the indirect tax base erodes, the government will need to consider bringing in measures to broaden the tax base, such as a progressive income tax.

Statistical
appendix

Statistical notes
The statistical appendix presents selected economic indicators for 44 developing member economies of the Asian Development Bank (ADB) and for Brunei Darussalam, an unclassified regional member, in a total of 18 tables. The economies are grouped into five subregions: Central Asia, East Asia, South Asia, Southeast Asia, and the Pacific. Most of the tables contain historical data from 2007 to 2011; some have forecasts for 2012 and 2013.
The data were standardized to the degree possible in order to allow comparability over time and across economies, but differences in statistical methodology, definitions, coverage, and practices make full comparability impossible. The national income accounts section is based on the United Nations System of National Accounts, while the balance-of-payments data are based on International Monetary Fund (IMF) accounting standards. Historical data were obtained from official sources, statistical publications and databases, and documents of ADB, IMF, and World Bank. Projections for 2012 and 2013 are generally staff estimates made on the basis of available quarterly or monthly data, although some projections are from governments.
Most countries report on a calendar-year basis. Some economies record their government finance data on a fiscal year basis, such as Armenia; Azerbaijan; Cook Islands; Hong Kong, China; Kazakhstan; Kyrgyz Republic; the Lao People’s Democratic Republic (Lao PDR); Samoa; Singapore; Taipei,China; Tajikistan; Thailand; and Uzbekistan. Federated States of Micronesia, Nauru, Republic of Marshall Islands, and Republic of Palau (hereafter Palau) report government finance and balance-of-payments data on a fiscal year basis. South Asian countries (except for Maldives and Sri Lanka), Myanmar, Samoa, and Tonga report all variables on a fiscal year basis.
Regional and subregional averages/totals are provided for seven tables (A1, A2, A6, A11, A12, A13, and A14). For tables A1, A2, A6, and A14, the averages are computed using weights derived from levels of gross national income
method. The GNI data for 2007–2010 were obtained from the World Bank’s World Development Indicators online. Weights for 2010 were carried over through 2013. The GNI data for Cook Islands were estimated using the Atlas conversion factor. Myanmar and Nauru have no GNI data. For tables A11 and
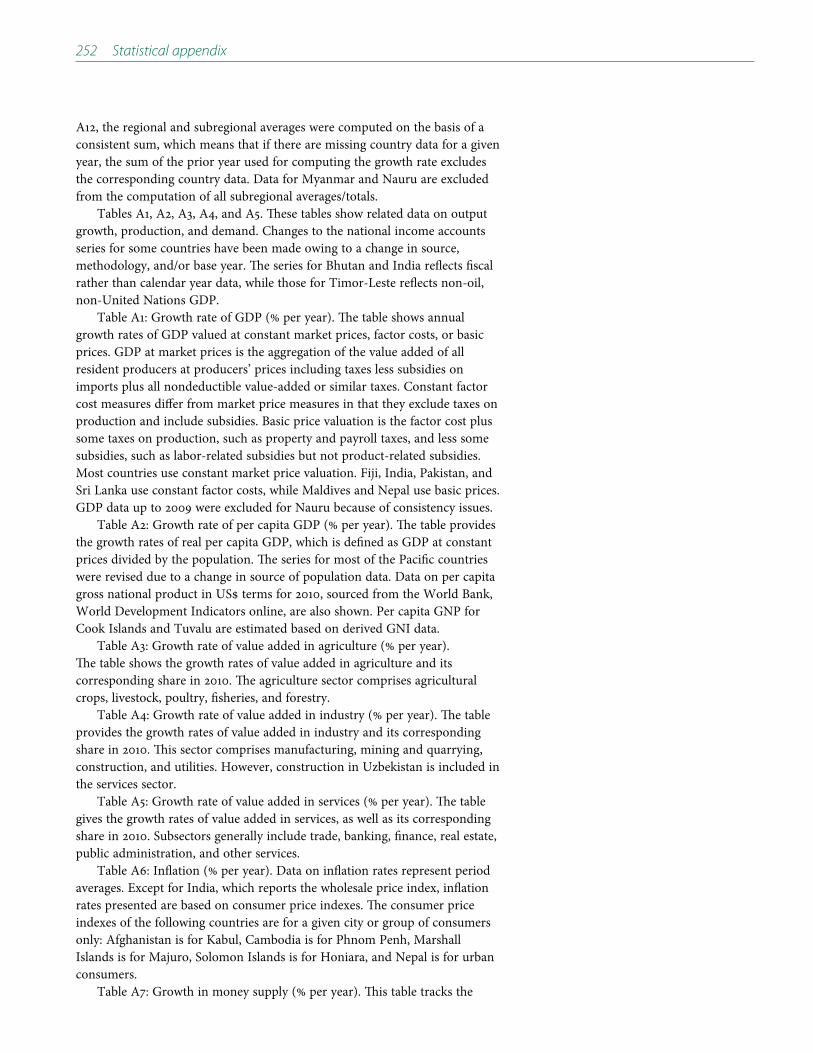
252 Statistical appendix
A12, the regional and subregional averages were computed on the basis of a consistent sum, which means that if there are missing country data for a given year, the sum of the prior year used for computing the growth rate excludes the corresponding country data. Data for Myanmar and Nauru are excluded from the computation of all subregional averages/totals.
Tables A1, A2, A3, A4, and A5. These tables show related data on output growth, production, and demand. Changes to the national income accounts series for some countries have been made owing to a change in source, methodology, and/or base year. The series for Bhutan and India reflects fiscal rather than calendar year data, while those for Timor-Leste reflects non-oil, non-United Nations GDP.
Table A1: Growth rate of GDP (% per year). The table shows annual growth rates of GDP valued at constant market prices, factor costs, or basic prices. GDP at market prices is the aggregation of the value added of all resident producers at producers’ prices including taxes less subsidies on imports plus all nondeductible value-added or similar taxes. Constant factor cost measures differ from market price measures in that they exclude taxes on production and include subsidies. Basic price valuation is the factor cost plus some taxes on production, such as property and payroll taxes, and less some subsidies, such as labor-related subsidies but not product-related subsidies. Most countries use constant market price valuation. Fiji, India, Pakistan, and Sri Lanka use constant factor costs, while Maldives and Nepal use basic prices. GDP data up to 2009 were excluded for Nauru because of consistency issues.
Table A2: Growth rate of per capita GDP (% per year). The table provides the growth rates of real per capita GDP, which is defined as GDP at constant prices divided by the population. The series for most of the Pacific countries were revised due to a change in source of population data. Data on per capita
World Development Indicators online, are also shown. Per capita GNP for Cook Islands and Tuvalu are estimated based on derived GNI data.
Table A3: Growth rate of value added in agriculture (% per year). The table shows the growth rates of value added in agriculture and its corresponding share in 2010. The agriculture sector comprises agricultural crops, livestock, poultry, fisheries, and forestry.
Table A4: Growth rate of value added in industry (% per year). The table provides the growth rates of value added in industry and its corresponding share in 2010. This sector comprises manufacturing, mining and quarrying, construction, and utilities. However, construction in Uzbekistan is included in the services sector.
Table A5: Growth rate of value added in services (% per year). The table gives the growth rates of value added in services, as well as its corresponding share in 2010. Subsectors generally include trade, banking, finance, real estate, public administration, and other services.
Table A6: Inflation (% per year). Data on inflation rates represent period averages. Except for India, which reports the wholesale price index, inflation rates presented are based on consumer price indexes. The consumer price indexes of the following countries are for a given city or group of consumers only: Afghanistan is for Kabul, Cambodia is for Phnom Penh, Marshall Islands is for Majuro, Solomon Islands is for Honiara, and Nepal is for urban consumers.
Table A7: Growth in money supply (% per year). This table tracks the
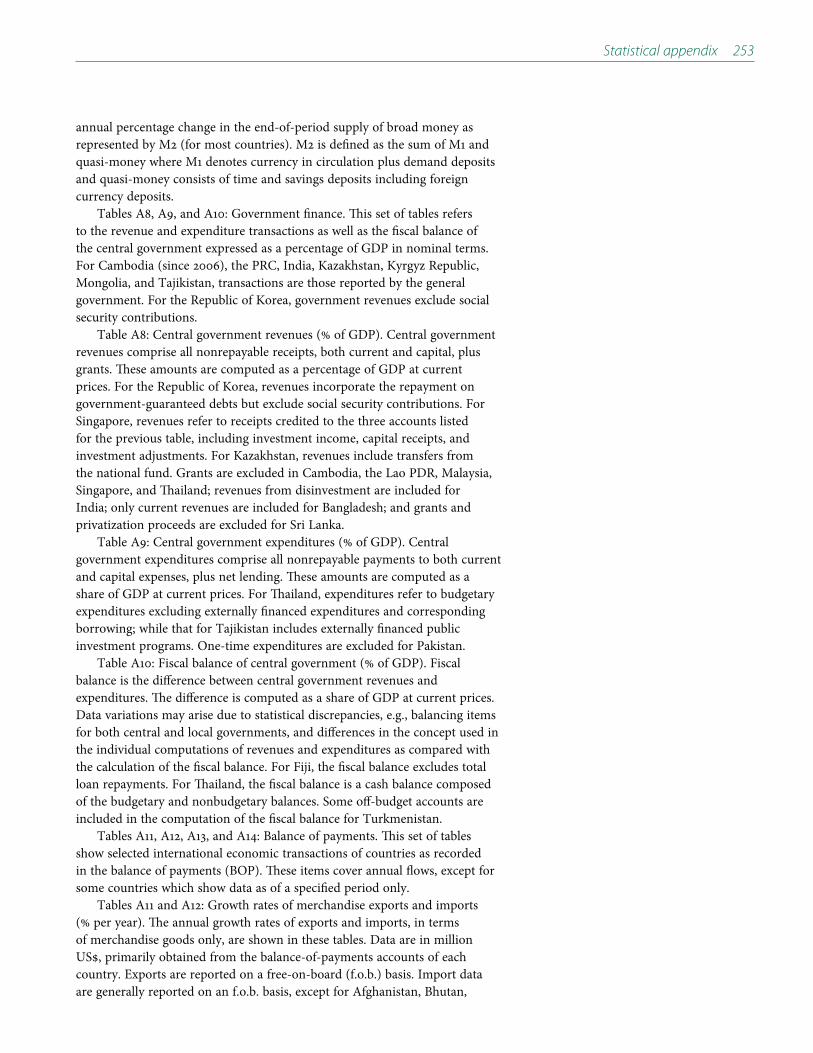
Statistical appendix 253
annual percentage change in the end-of-period supply of broad money as represented by M2 (for most countries). M2 is defined as the sum of M1 and quasi-money where M1 denotes currency in circulation plus demand deposits and quasi-money consists of time and savings deposits including foreign currency deposits.
Tables A8, A9, and A10: Government finance. This set of tables refers to the revenue and expenditure transactions as well as the fiscal balance of the central government expressed as a percentage of GDP in nominal terms. For Cambodia (since 2006), the PRC, India, Kazakhstan, Kyrgyz Republic, Mongolia, and Tajikistan, transactions are those reported by the general government. For the Republic of Korea, government revenues exclude social security contributions.
Table A8: Central government revenues (% of GDP). Central government revenues comprise all nonrepayable receipts, both current and capital, plus grants. These amounts are computed as a percentage of GDP at current prices. For the Republic of Korea, revenues incorporate the repayment on government-guaranteed debts but exclude social security contributions. For Singapore, revenues refer to receipts credited to the three accounts listed for the previous table, including investment income, capital receipts, and investment adjustments. For Kazakhstan, revenues include transfers from the national fund. Grants are excluded in Cambodia, the Lao PDR, Malaysia, Singapore, and Thailand; revenues from disinvestment are included for India; only current revenues are included for Bangladesh; and grants and privatization proceeds are excluded for Sri Lanka.
Table A9: Central government expenditures (% of GDP). Central government expenditures comprise all nonrepayable payments to both current and capital expenses, plus net lending. These amounts are computed as a share of GDP at current prices. For Thailand, expenditures refer to budgetary expenditures excluding externally financed expenditures and corresponding borrowing; while that for Tajikistan includes externally financed public investment programs. One-time expenditures are excluded for Pakistan.
Table A10: Fiscal balance of central government (% of GDP). Fiscal balance is the difference between central government revenues and expenditures. The difference is computed as a share of GDP at current prices. Data variations may arise due to statistical discrepancies, e.g., balancing items for both central and local governments, and differences in the concept used in the individual computations of revenues and expenditures as compared with the calculation of the fiscal balance. For Fiji, the fiscal balance excludes total loan repayments. For Thailand, the fiscal balance is a cash balance composed of the budgetary and nonbudgetary balances. Some off-budget accounts are included in the computation of the fiscal balance for Turkmenistan.
Tables A11, A12, A13, and A14: Balance of payments. This set of tables show selected international economic transactions of countries as recorded in the balance of payments (BOP). These items cover annual flows, except for some countries which show data as of a specified period only.
Tables A11 and A12: Growth rates of merchandise exports and imports (% per year). The annual growth rates of exports and imports, in terms of merchandise goods only, are shown in these tables. Data are in million
country. Exports are reported on a free-on-board (f.o.b.) basis. Import data are generally reported on an f.o.b. basis, except for Afghanistan, Bhutan,
254 Statistical appendix
Cambodia, India, Lao PDR, Myanmar, Philippines, Samoa, Singapore, Solomon Islands, and Thailand, which value them on a cost, insurance, freight (c.i.f.) basis.
between merchandise exports and merchandise imports. Figures in this table are based on the export and import levels used to generate Tables A11 and A12.
Table A14: Current account balance (% of GDP). The current account balance is the sum of the balance of trade for merchandise, net trade in services and factor income, and net transfers. The values reported are divided
Nam, official transfers are excluded from the current account balance. Table A15: Exchange rates to the US dollar (annual average). The annual
average exchange rates of each economy are quoted in local currencies per US dollar. The rate for 2011 for India is for the period April 2011–January 2012. The Turkmenistan Manat was redenominated on 1 January 2009 from TMM 14,250 to TMM 2.8 per US dollar.
drawing rights (SDR), reserve position in the IMF, and gold at the end of a given period. For Turkmenistan, gold is excluded in the computation. For Marshall Islands and Taipei,China, this heading refers to foreign exchange reserves only. In some countries, the rubric comprises foreign assets and reserves of national monetary authorities and national oil funds, i.e., foreign assets of the Maldives Monetary Authority, net foreign reserves of the State Bank of Pakistan, assets of the National Oil Fund of Azerbaijan, and official external assets of Kiribati. The data for India are as of 23 March 2012.
external debt outstanding—public and private—includes medium- and long-term debt, short-term debt, and IMF credit. For Cambodia, Georgia, and Lao PDR, only public external debt is reported. For Azerbaijan; India; Kazakhstan; Kyrgyz Republic; Malaysia, Philippines; and Singapore the figures for 2011 are as of end-September.
Table A18: Debt service ratio (% of exports of goods and services). This table generally presents the total debt service payments of each economy, which comprise principal repayments (excluding on short-term debt) and interest payments on outstanding external debt, as a percentage of exports of goods and services. For Cambodia and Lao PDR, debt service refers to external public debt only. For Papua New Guinea, Samoa, and Viet Nam, exports of goods are used as the denominator in the calculation of the ratio; for the Philippines, exports of goods, services, and income are used as the denominator. For Bangladesh, the ratio represents debt service payments on medium- and long-term loans as a percentage of exports of goods, nonfactor services, and workers’ remittances; while for Azerbaijan, the ratio represents public and publicly guaranteed external debt service payments as a percentage of exports of goods and nonfactor services.

Statistical appendix 255
Table A1 Growth rate of GDP (% per year)
2007 2008 2009 2010 2011 2012 2013
Central Asia 12.0 6.5 3.2 6.6 6.2 6.1 6.2Armenia 13.7 6.9 -14.1 2.1 4.5 3.8 4.2Azerbaijan 25.1 10.8 9.3 5.0 0.1 4.1 3.5Georgia 12.3 2.3 -3.8 6.3 7.0 6.0 6.3Kazakhstan 8.9 3.3 1.2 7.0 7.5 6.0 6.5Kyrgyz Republic 8.5 8.4 2.9 -0.5 5.7 5.0 5.5Tajikistan 7.8 7.9 3.9 6.5 7.4 5.5 6.0Turkmenistan 11.1 14.7 6.1 9.2 9.9 10.0 9.0Uzbekistan 9.5 9.0 8.1 8.5 8.3 8.0 7.9
East Asia 11.3 7.3 6.7 9.8 8.0 7.4 7.7China, People’s Rep. of 14.2 9.6 9.2 10.4 9.2 8.5 8.7Hong Kong, China 6.4 2.3 -2.6 7.0 5.0 3.0 4.5Korea, Rep. of 5.1 2.3 0.3 6.2 3.6 3.4 4.0Mongolia 10.2 8.9 -1.3 6.4 17.3 15.0 17.5Taipei,China 6.0 0.7 -1.8 10.7 4.0 3.4 4.6
South Asia 8.8 6.4 7.5 7.8 6.4 6.6 7.1Afghanistan 13.7 3.6 21.0 8.4 5.7 7.1 5.8Bangladesh 6.4 6.2 5.7 6.1 6.7 6.2 6.0Bhutan 12.6 10.8 5.7 9.3 8.3 8.0 8.5India 9.3 6.7 8.4 8.4 6.9 7.0 7.5Maldives 10.6 12.2 -4.7 5.7 7.5 3.5 4.5Nepal 2.8 5.8 3.8 4.0 3.5 4.5 4.0Pakistan 6.8 3.7 1.7 3.8 2.4 3.6 4.0Sri Lanka 6.8 6.0 3.5 8.0 8.3 7.0 8.0
Southeast Asia 6.6 4.4 1.4 7.9 4.6 5.2 5.7Brunei Darussalam 0.2 -1.9 -1.8 2.6 2.9 2.6 3.2Cambodia 10.2 6.7 0.1 6.0 6.8 6.5 7.0Indonesia 6.3 6.0 4.6 6.2 6.5 6.4 6.7Lao People’s Dem. Rep. 7.9 7.2 7.3 7.5 7.8 7.9 7.7Malaysia 6.5 4.8 -1.6 7.2 5.1 4.0 5.0Myanmar 5.5 3.6 5.1 5.3 5.5 6.0 6.3Philippines 6.6 4.2 1.1 7.6 3.7 4.8 5.0Singapore 8.9 1.7 -1.0 14.8 4.9 2.8 4.5Thailand 5.0 2.5 -2.3 7.8 0.1 5.5 5.5Viet Nam 8.5 6.3 5.3 6.8 5.9 5.7 6.2
The Pacific 4.6 6.6 4.2 5.5 7.0 6.0 4.1Cook Islands -0.2 -3.5 -3.6 0.2 3.4 5.4 3.0Fiji -0.9 1.0 -1.3 -0.2 2.1 1.0 1.2Kiribati 0.5 -1.2 -0.6 1.8 3.0 3.5 3.0Marshall Islands 3.0 -1.9 -1.3 5.2 5.0 5.4 2.6Micronesia, Fed. States of -2.1 -2.4 0.7 3.1 1.4 1.0 0.5Nauru - - - 0.0 4.0 4.8 4.2Palau -0.5 -6.1 -4.6 0.3 5.8 3.0 2.0Papua New Guinea 7.2 8.9 6.0 7.4 8.9 7.5 4.5Samoa 2.0 4.3 -5.4 0.2 2.1 2.5 2.4Solomon Islands 6.8 5.2 -1.0 7.1 9.3 6.0 5.0Timor-Leste 9.1 12.1 13.0 9.5 10.0 10.0 8.0Tonga -0.9 2.6 -1.0 0.3 -0.3 0.4 0.2Tuvalu 5.5 7.6 -1.7 -0.5 1.0 1.4 1.3Vanuatu 6.5 6.2 3.5 2.2 4.3 4.5 5.0
Average 10.1 6.7 6.0 9.1 7.2 6.9 7.3
- = not available.
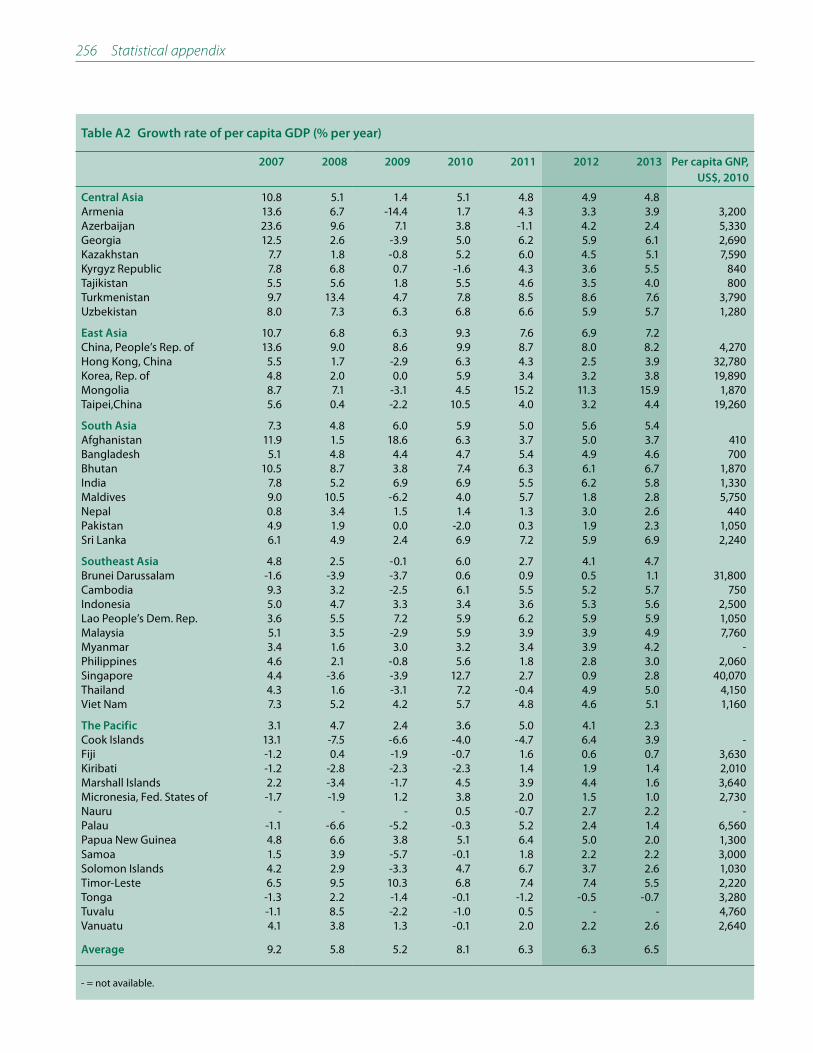
256 Statistical appendix
Table A2 Growth rate of per capita GDP (% per year)
2007 2008 2009 2010 2011 2012 2013 Per capita GNP,
US$, 2010
Central Asia 10.8 5.1 1.4 5.1 4.8 4.9 4.8Armenia 13.6 6.7 -14.4 1.7 4.3 3.3 3.9 3,200Azerbaijan 23.6 9.6 7.1 3.8 -1.1 4.2 2.4 5,330Georgia 12.5 2.6 -3.9 5.0 6.2 5.9 6.1 2,690Kazakhstan 7.7 1.8 -0.8 5.2 6.0 4.5 5.1 7,590Kyrgyz Republic 7.8 6.8 0.7 -1.6 4.3 3.6 5.5 840Tajikistan 5.5 5.6 1.8 5.5 4.6 3.5 4.0 800Turkmenistan 9.7 13.4 4.7 7.8 8.5 8.6 7.6 3,790Uzbekistan 8.0 7.3 6.3 6.8 6.6 5.9 5.7 1,280
East Asia 10.7 6.8 6.3 9.3 7.6 6.9 7.2China, People’s Rep. of 13.6 9.0 8.6 9.9 8.7 8.0 8.2 4,270Hong Kong, China 5.5 1.7 -2.9 6.3 4.3 2.5 3.9 32,780Korea, Rep. of 4.8 2.0 0.0 5.9 3.4 3.2 3.8 19,890Mongolia 8.7 7.1 -3.1 4.5 15.2 11.3 15.9 1,870Taipei,China 5.6 0.4 -2.2 10.5 4.0 3.2 4.4 19,260
South Asia 7.3 4.8 6.0 5.9 5.0 5.6 5.4Afghanistan 11.9 1.5 18.6 6.3 3.7 5.0 3.7 410Bangladesh 5.1 4.8 4.4 4.7 5.4 4.9 4.6 700Bhutan 10.5 8.7 3.8 7.4 6.3 6.1 6.7 1,870India 7.8 5.2 6.9 6.9 5.5 6.2 5.8 1,330Maldives 9.0 10.5 -6.2 4.0 5.7 1.8 2.8 5,750Nepal 0.8 3.4 1.5 1.4 1.3 3.0 2.6 440Pakistan 4.9 1.9 0.0 -2.0 0.3 1.9 2.3 1,050Sri Lanka 6.1 4.9 2.4 6.9 7.2 5.9 6.9 2,240
Southeast Asia 4.8 2.5 -0.1 6.0 2.7 4.1 4.7Brunei Darussalam -1.6 -3.9 -3.7 0.6 0.9 0.5 1.1 31,800Cambodia 9.3 3.2 -2.5 6.1 5.5 5.2 5.7 750Indonesia 5.0 4.7 3.3 3.4 3.6 5.3 5.6 2,500Lao People’s Dem. Rep. 3.6 5.5 7.2 5.9 6.2 5.9 5.9 1,050Malaysia 5.1 3.5 -2.9 5.9 3.9 3.9 4.9 7,760Myanmar 3.4 1.6 3.0 3.2 3.4 3.9 4.2 -Philippines 4.6 2.1 -0.8 5.6 1.8 2.8 3.0 2,060Singapore 4.4 -3.6 -3.9 12.7 2.7 0.9 2.8 40,070Thailand 4.3 1.6 -3.1 7.2 -0.4 4.9 5.0 4,150Viet Nam 7.3 5.2 4.2 5.7 4.8 4.6 5.1 1,160
The Pacific 3.1 4.7 2.4 3.6 5.0 4.1 2.3Cook Islands 13.1 -7.5 -6.6 -4.0 -4.7 6.4 3.9 -Fiji -1.2 0.4 -1.9 -0.7 1.6 0.6 0.7 3,630Kiribati -1.2 -2.8 -2.3 -2.3 1.4 1.9 1.4 2,010Marshall Islands 2.2 -3.4 -1.7 4.5 3.9 4.4 1.6 3,640Micronesia, Fed. States of -1.7 -1.9 1.2 3.8 2.0 1.5 1.0 2,730Nauru - - - 0.5 -0.7 2.7 2.2 -Palau -1.1 -6.6 -5.2 -0.3 5.2 2.4 1.4 6,560Papua New Guinea 4.8 6.6 3.8 5.1 6.4 5.0 2.0 1,300Samoa 1.5 3.9 -5.7 -0.1 1.8 2.2 2.2 3,000Solomon Islands 4.2 2.9 -3.3 4.7 6.7 3.7 2.6 1,030Timor-Leste 6.5 9.5 10.3 6.8 7.4 7.4 5.5 2,220Tonga -1.3 2.2 -1.4 -0.1 -1.2 -0.5 -0.7 3,280Tuvalu -1.1 8.5 -2.2 -1.0 0.5 - - 4,760Vanuatu 4.1 3.8 1.3 -0.1 2.0 2.2 2.6 2,640
Average 9.2 5.8 5.2 8.1 6.3 6.3 6.5
- = not available.

Statistical appendix 257
Table A3 Growth rate of value added in agriculture (% per year)
2007 2008 2009 2010 2011 Sector share 2010, %
Central Asia
Armenia 10.4 3.3 6.0 -15.7 12.6 15.7Azerbaijan 4.0 6.1 3.5 -2.2 5.8 6.2Georgia 3.3 -4.4 -6.8 -4.8 5.5 10.3Kazakhstan 9.7 -6.1 13.8 -11.6 26.7 6.6Kyrgyz Republic 1.6 0.9 6.7 -2.6 2.3 20.6Tajikistan 6.5 7.8 10.5 6.8 7.9 -Turkmenistan - - - - - -Uzbekistan 6.1 4.7 5.7 6.8 6.6 31.8
East Asia
China, People’s Rep. of 3.7 5.4 4.2 4.3 4.5 8.2Hong Kong, China -4.3 -16.9 -4.6 3.9 - 0.1Korea, Rep. of 4.0 5.6 3.2 -4.3 -1.0 3.0Mongolia 14.4 4.7 3.6 -16.6 0.3 18.5Taipei,China -2.4 0.1 -3.0 1.2 1.9 1.4
South Asia
Afghanistan 14.7 -14.9 44.6 -6.4 -15.8 23.3Bangladesh 4.6 3.2 4.1 5.2 5.0 20.3Bhutan 1.7 0.8 1.7 1.5 0.6 15.6India 5.8 0.1 1.0 7.0 2.5 14.5Maldives -11.9 -3.4 -7.4 -6.9 -1.1 3.2Nepal 1.0 5.8 3.0 1.3 4.1 34.7Pakistan 4.1 1.0 4.0 0.6 1.2 21.2Sri Lanka 3.4 7.5 3.2 7.0 2.5 11.9
Southeast Asia
Brunei Darussalam -4.5 3.8 5.6 -5.8 - 1.1Cambodia 5.0 5.7 5.4 4.0 3.3 29.4Indonesia 3.5 4.8 4.0 3.0 3.0 13.2Lao People’s Dem. Rep. 6.2 2.0 2.3 2.0 1.0 31.6Malaysia 1.3 4.3 0.6 2.1 5.6 7.1Myanmar - - - - - -Philippines 4.7 3.2 -0.7 -0.2 2.6 11.6Singapore 0.6 -4.3 -1.8 -3.1 3.0 0.0Thailand 1.2 4.2 1.3 -2.3 3.8 8.3Viet Nam 3.8 4.7 1.8 2.8 4.0 16.4
The Pacific
Cook Islands 5.2 -9.9 -5.6 14.4 - 5.9Fiji -4.9 4.9 -12.9 -5.0 8.3 12.1Kiribati 0.2 1.8 1.4 - - -Marshall Islands 7.0 -2.0 13.3 24.8 - 12.3Micronesia, Fed. States of 4.5 -0.1 -0.7 1.0 - 25.3Nauru - - - - - -Palau -14.9 -7.1 6.0 - - -Papua New Guinea 4.2 4.3 0.7 2.9 4.5 33.5Samoa -1.7 2.4 -10.8 -3.2 -2.7 9.9Solomon Islands 4.7 10.5 -1.3 - - -Timor-Leste -5.4 13.2 12.6 0.4 0.0 28.3Tonga 1.7 0.6 -1.8 -3.1 0.3 18.8Tuvalu 3.0 0.4 - - - -Vanuatu 2.0 3.3 1.7 - - -
- = not available.

258 Statistical appendix
Table A4 Growth rate of value added in industry (% per year)
2007 2008 2009 2010 2011 Sector share 2010, %
Central Asia
Armenia 11.7 7.8 -29.6 6.1 0.3 37.5Azerbaijan 32.9 9.7 10.6 4.4 -4.3 60.9Georgia 14.5 -3.9 -3.5 9.1 9.7 26.7Kazakhstan 9.2 2.7 -0.3 7.2 3.3 45.2Kyrgyz Republic 10.3 14.0 -0.3 2.5 8.8 27.4Tajikistan -8.7 -8.9 -6.5 9.7 5.9 -Turkmenistan - - - - - -Uzbekistan 8.3 6.5 9.7 8.3 6.7 35.7
East Asia
China, People’s Rep. of 15.1 9.9 9.9 12.3 10.6 59.5Hong Kong, China -0.5 2.1 -5.2 7.6 - 7.4Korea, Rep. of 6.0 2.0 -0.6 11.3 4.2 39.6Mongolia 7.0 -0.8 -0.4 4.3 10.1 32.2Taipei,China 9.0 0.2 -4.1 23.0 4.4 35.7
South Asia
Afghanistan 7.6 5.7 6.1 6.3 6.6 26.0Bangladesh 8.4 6.8 6.5 6.5 8.2 29.9Bhutan 25.4 20.4 4.8 8.2 8.4 45.7India 9.7 4.4 8.4 7.2 3.9 27.8Maldives 22.5 9.5 -26.2 5.2 5.9 14.8Nepal 3.9 1.7 -1.4 3.3 1.4 15.3Pakistan 8.8 1.4 -0.1 8.3 -0.1 26.4Sri Lanka 7.6 5.9 4.2 8.4 9.6 28.7
Southeast Asia
Brunei Darussalam -5.6 -5.4 -5.0 1.7 - 52.5Cambodia 8.4 4.0 -9.5 13.6 13.9 28.6Indonesia 4.7 3.7 3.6 4.9 5.3 41.1Lao People’s Dem. Rep. 6.5 10.0 17.0 18.0 15.6 27.7Malaysia 3.0 0.7 -7.6 8.6 2.5 36.9Myanmar - - - - - -Philippines 5.8 4.8 -1.9 11.6 1.9 32.6Singapore 6.8 -1.5 -1.4 24.8 6.8 32.9Thailand 5.8 3.2 -5.0 12.8 -3.9 48.7Viet Nam 10.2 6.0 5.5 7.7 5.5 41.9
The Pacific
Cook Islands 4.6 2.5 -5.0 -2.7 - 9.1Fiji -5.2 -1.4 -0.4 8.1 0.3 19.3Kiribati 12.7 -7.1 -1.6 - - -Marshall Islands -2.7 3.3 -7.3 -6.0 - 10.4Micronesia, Fed. States of -7.0 8.9 33.5 16.3 - 7.8Nauru - - - - - -Palau -24.3 -30.7 -11.6 - - -Papua New Guinea 7.3 7.0 8.1 10.8 11.1 35.4Samoa 5.1 5.9 -15.7 3.0 2.9 28.0Solomon Islands 11.8 13.0 1.3 - - -Timor-Leste 43.7 19.6 20.5 21.6 - 14.6Tonga -2.0 4.8 1.7 -0.4 4.4 19.8Tuvalu 30.8 -8.2 - - - -Vanuatu 7.7 15.6 9.2 - - -
- = not available.
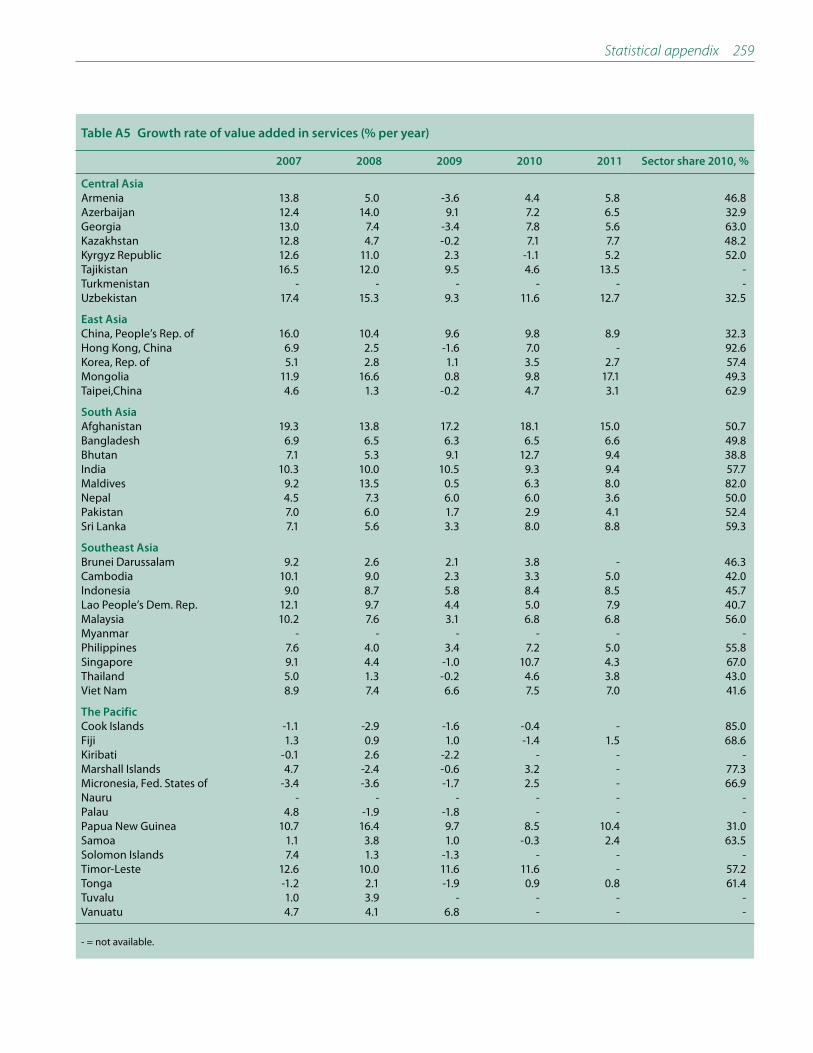
Statistical appendix 259
Table A5 Growth rate of value added in services (% per year)
2007 2008 2009 2010 2011 Sector share 2010, %
Central Asia
Armenia 13.8 5.0 -3.6 4.4 5.8 46.8Azerbaijan 12.4 14.0 9.1 7.2 6.5 32.9Georgia 13.0 7.4 -3.4 7.8 5.6 63.0Kazakhstan 12.8 4.7 -0.2 7.1 7.7 48.2Kyrgyz Republic 12.6 11.0 2.3 -1.1 5.2 52.0Tajikistan 16.5 12.0 9.5 4.6 13.5 -Turkmenistan - - - - - -Uzbekistan 17.4 15.3 9.3 11.6 12.7 32.5
East Asia
China, People’s Rep. of 16.0 10.4 9.6 9.8 8.9 32.3Hong Kong, China 6.9 2.5 -1.6 7.0 - 92.6Korea, Rep. of 5.1 2.8 1.1 3.5 2.7 57.4Mongolia 11.9 16.6 0.8 9.8 17.1 49.3Taipei,China 4.6 1.3 -0.2 4.7 3.1 62.9
South Asia
Afghanistan 19.3 13.8 17.2 18.1 15.0 50.7Bangladesh 6.9 6.5 6.3 6.5 6.6 49.8Bhutan 7.1 5.3 9.1 12.7 9.4 38.8India 10.3 10.0 10.5 9.3 9.4 57.7Maldives 9.2 13.5 0.5 6.3 8.0 82.0Nepal 4.5 7.3 6.0 6.0 3.6 50.0Pakistan 7.0 6.0 1.7 2.9 4.1 52.4Sri Lanka 7.1 5.6 3.3 8.0 8.8 59.3
Southeast Asia
Brunei Darussalam 9.2 2.6 2.1 3.8 - 46.3Cambodia 10.1 9.0 2.3 3.3 5.0 42.0Indonesia 9.0 8.7 5.8 8.4 8.5 45.7Lao People’s Dem. Rep. 12.1 9.7 4.4 5.0 7.9 40.7Malaysia 10.2 7.6 3.1 6.8 6.8 56.0Myanmar - - - - - -Philippines 7.6 4.0 3.4 7.2 5.0 55.8Singapore 9.1 4.4 -1.0 10.7 4.3 67.0Thailand 5.0 1.3 -0.2 4.6 3.8 43.0Viet Nam 8.9 7.4 6.6 7.5 7.0 41.6
The Pacific
Cook Islands -1.1 -2.9 -1.6 -0.4 - 85.0Fiji 1.3 0.9 1.0 -1.4 1.5 68.6Kiribati -0.1 2.6 -2.2 - - -Marshall Islands 4.7 -2.4 -0.6 3.2 - 77.3Micronesia, Fed. States of -3.4 -3.6 -1.7 2.5 - 66.9Nauru - - - - - -Palau 4.8 -1.9 -1.8 - - -Papua New Guinea 10.7 16.4 9.7 8.5 10.4 31.0Samoa 1.1 3.8 1.0 -0.3 2.4 63.5Solomon Islands 7.4 1.3 -1.3 - - -Timor-Leste 12.6 10.0 11.6 11.6 - 57.2Tonga -1.2 2.1 -1.9 0.9 0.8 61.4Tuvalu 1.0 3.9 - - - -Vanuatu 4.7 4.1 6.8 - - -
- = not available.

260 Statistical appendix
Table A6 Inflation (% per year)
2007 2008 2009 2010 2011 2012 2013
Central Asia 11.2 16.4 5.9 7.0 9.0 7.2 7.3Armenia 4.4 9.0 3.4 8.2 7.7 4.1 4.5Azerbaijan 16.7 20.8 1.5 5.7 7.9 9.0 8.5Georgia 9.2 10.0 1.7 7.1 8.5 4.8 6.2Kazakhstan 10.8 17.0 7.3 7.1 8.3 6.5 6.8Kyrgyz Republic 10.2 24.5 6.8 8.0 16.6 5.0 5.5Tajikistan 13.2 20.4 6.5 6.5 12.5 8.5 9.0Turkmenistan 6.3 14.5 -2.7 4.4 6.1 6.5 7.0Uzbekistan 12.3 12.7 14.1 9.4 13.1 9.5 9.0
East Asia 4.0 5.5 -0.1 3.1 5.0 3.7 3.7China, People’s Rep. of 4.8 5.9 -0.7 3.3 5.4 4.0 4.0Hong Kong, China 2.0 4.3 0.6 2.3 5.3 3.8 3.3Korea, Rep. of 2.5 4.7 2.8 3.0 4.0 3.0 3.0Mongolia 9.6 28.0 7.6 10.1 9.2 15.0 12.0Taipei,China 1.8 3.5 -0.9 1.0 1.4 1.5 1.6
South Asia 5.5 8.0 5.2 9.4 9.4 7.7 6.9Afghanistan 13.0 26.8 -12.2 7.7 10.5 4.6 5.0Bangladesh 7.2 9.9 6.7 7.3 8.8 11.0 8.5Bhutan 5.2 6.4 7.1 4.8 8.6 7.3 6.5India 4.7 8.1 3.8 9.6 9.0 7.0 6.5Maldives 7.4 12.3 4.0 4.7 9.7 4.5 7.5Nepal 6.4 7.7 12.6 9.6 9.6 8.0 7.0Pakistan 7.8 12.0 17.0 10.1 13.7 12.0 10.0Sri Lanka 15.8 -20.8 3.5 6.2 6.7 8.0 7.0
Southeast Asia 4.0 8.5 2.7 4.1 5.5 4.4 4.4Brunei Darussalam 1.0 2.1 1.0 0.4 2.0 1.8 2.0Cambodia 7.7 25.0 -0.7 4.0 5.5 5.0 5.0Indonesia 6.4 9.8 4.8 5.1 5.4 5.5 5.0Lao People’s Dem. Rep. 4.5 7.6 0.0 6.0 7.6 6.7 6.0Malaysia 2.0 5.4 0.6 1.7 3.2 2.4 2.8Myanmar 32.9 22.5 8.2 7.3 4.2 6.2 6.3Philippines 2.9 8.2 4.2 3.8 4.8 3.7 4.1Singapore 2.1 6.6 0.6 2.8 5.2 3.0 2.5Thailand 2.2 5.4 -0.9 3.3 3.8 3.4 3.3Viet Nam 8.3 23.0 6.9 9.2 18.7 9.5 11.5
The Pacific 3.4 9.4 5.3 5.5 8.6 6.6 5.4Cook Islands 2.2 4.3 10.2 1.8 0.6 3.0 4.2Fiji 4.7 7.8 3.7 7.8 8.7 5.1 3.0Kiribati 4.2 11.0 8.8 -2.8 7.7 5.5 6.0Marshall Islands 2.6 14.7 0.5 1.6 9.5 2.5 3.0Micronesia, Fed. States of 3.6 6.6 8.2 4.3 7.9 3.5 4.0Nauru 5.6 1.0 21.2 -0.6 -3.5 1.5 2.0Palau 3.0 9.9 4.6 1.2 2.1 2.0 2.5Papua New Guinea 0.9 10.8 6.9 6.0 8.7 7.0 6.0Samoa 4.6 6.1 14.6 -0.2 2.9 5.0 3.3Solomon Islands 4.8 17.4 7.1 1.0 7.4 5.5 5.0Timor-Leste 8.9 7.6 0.0 5.6 13.1 10.2 7.4Tonga 5.8 10.4 1.4 3.6 6.1 6.0 7.5Tuvalu 2.3 10.4 -0.1 -1.9 0.5 2.6 3.0Vanuatu 3.9 4.8 4.3 2.8 0.8 3.0 4.0
Average 4.4 6.6 1.4 4.4 5.9 4.6 4.4
- = not available.
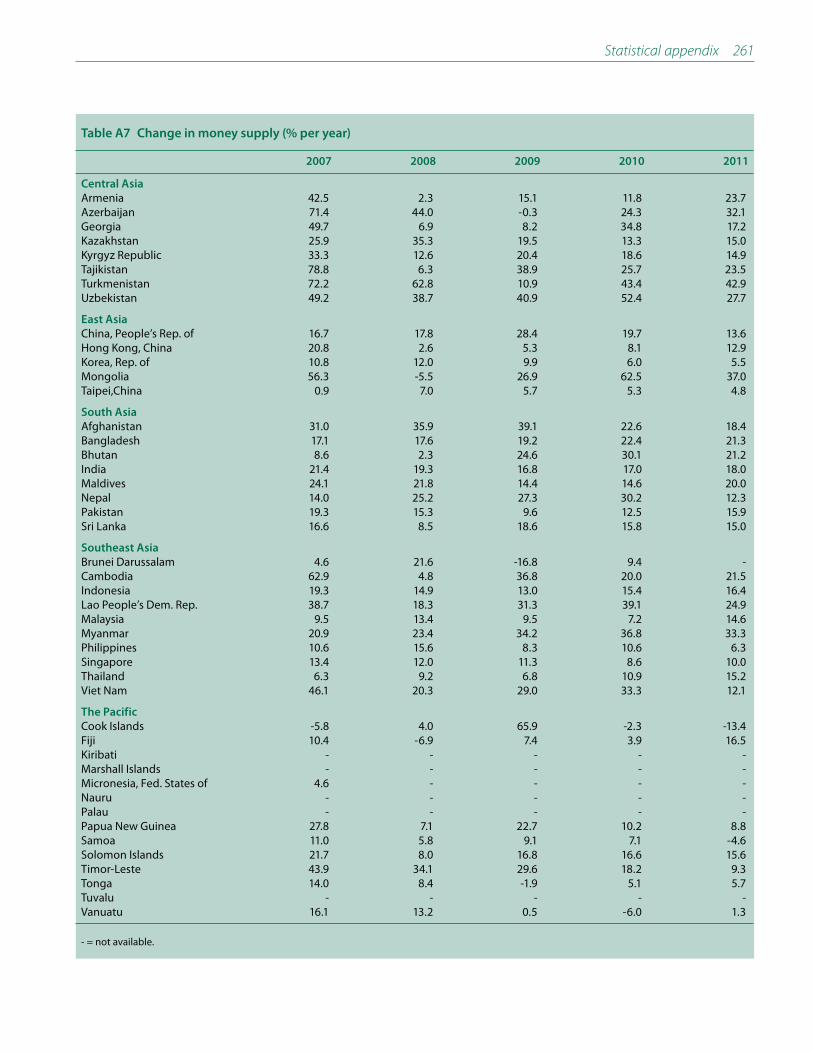
Statistical appendix 261
Table A7 Change in money supply (% per year)
2007 2008 2009 2010 2011
Central Asia
Armenia 42.5 2.3 15.1 11.8 23.7Azerbaijan 71.4 44.0 -0.3 24.3 32.1Georgia 49.7 6.9 8.2 34.8 17.2Kazakhstan 25.9 35.3 19.5 13.3 15.0Kyrgyz Republic 33.3 12.6 20.4 18.6 14.9Tajikistan 78.8 6.3 38.9 25.7 23.5Turkmenistan 72.2 62.8 10.9 43.4 42.9Uzbekistan 49.2 38.7 40.9 52.4 27.7
East Asia
China, People’s Rep. of 16.7 17.8 28.4 19.7 13.6Hong Kong, China 20.8 2.6 5.3 8.1 12.9Korea, Rep. of 10.8 12.0 9.9 6.0 5.5Mongolia 56.3 -5.5 26.9 62.5 37.0Taipei,China 0.9 7.0 5.7 5.3 4.8
South Asia
Afghanistan 31.0 35.9 39.1 22.6 18.4Bangladesh 17.1 17.6 19.2 22.4 21.3Bhutan 8.6 2.3 24.6 30.1 21.2India 21.4 19.3 16.8 17.0 18.0Maldives 24.1 21.8 14.4 14.6 20.0Nepal 14.0 25.2 27.3 30.2 12.3Pakistan 19.3 15.3 9.6 12.5 15.9Sri Lanka 16.6 8.5 18.6 15.8 15.0
Southeast Asia
Brunei Darussalam 4.6 21.6 -16.8 9.4 -Cambodia 62.9 4.8 36.8 20.0 21.5Indonesia 19.3 14.9 13.0 15.4 16.4Lao People’s Dem. Rep. 38.7 18.3 31.3 39.1 24.9Malaysia 9.5 13.4 9.5 7.2 14.6Myanmar 20.9 23.4 34.2 36.8 33.3Philippines 10.6 15.6 8.3 10.6 6.3Singapore 13.4 12.0 11.3 8.6 10.0Thailand 6.3 9.2 6.8 10.9 15.2Viet Nam 46.1 20.3 29.0 33.3 12.1
The Pacific
Cook Islands -5.8 4.0 65.9 -2.3 -13.4Fiji 10.4 -6.9 7.4 3.9 16.5Kiribati - - - - -Marshall Islands - - - - -Micronesia, Fed. States of 4.6 - - - -Nauru - - - - -Palau - - - - -Papua New Guinea 27.8 7.1 22.7 10.2 8.8Samoa 11.0 5.8 9.1 7.1 -4.6Solomon Islands 21.7 8.0 16.8 16.6 15.6Timor-Leste 43.9 34.1 29.6 18.2 9.3Tonga 14.0 8.4 -1.9 5.1 5.7Tuvalu - - - - -Vanuatu 16.1 13.2 0.5 -6.0 1.3
- = not available.
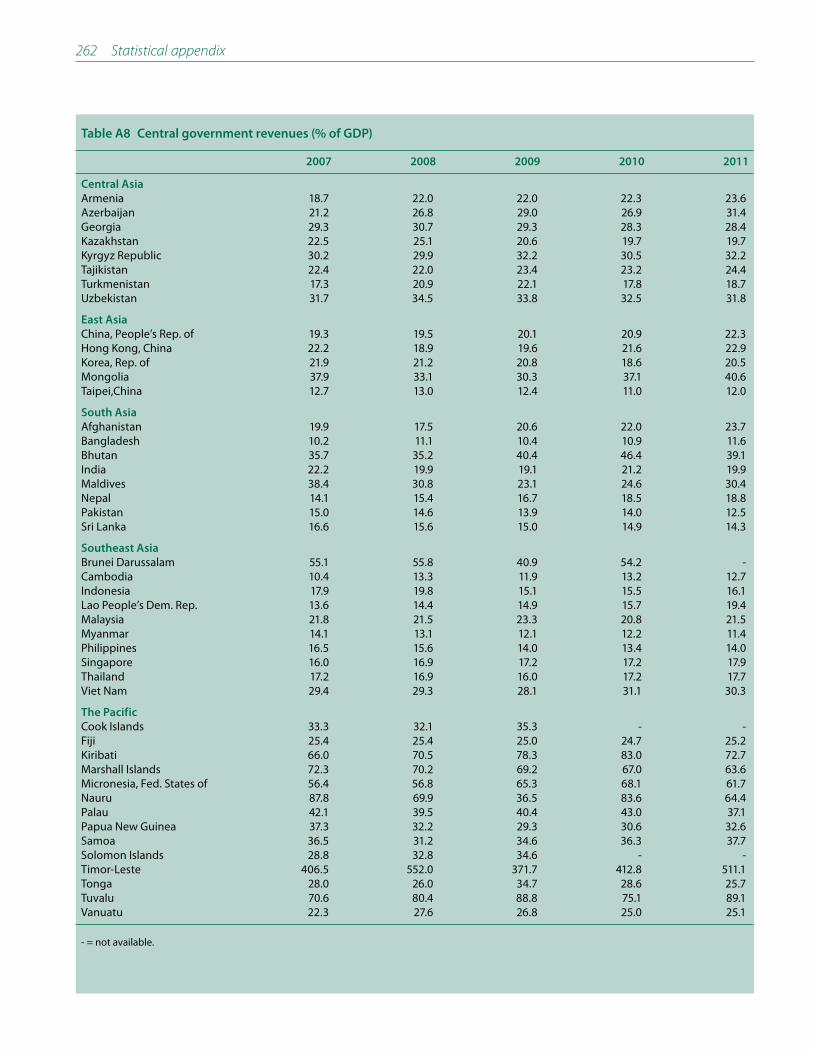
262 Statistical appendix
Table A8 Central government revenues (% of GDP)
2007 2008 2009 2010 2011
Central Asia
Armenia 18.7 22.0 22.0 22.3 23.6Azerbaijan 21.2 26.8 29.0 26.9 31.4Georgia 29.3 30.7 29.3 28.3 28.4Kazakhstan 22.5 25.1 20.6 19.7 19.7Kyrgyz Republic 30.2 29.9 32.2 30.5 32.2Tajikistan 22.4 22.0 23.4 23.2 24.4Turkmenistan 17.3 20.9 22.1 17.8 18.7Uzbekistan 31.7 34.5 33.8 32.5 31.8
East Asia
China, People’s Rep. of 19.3 19.5 20.1 20.9 22.3Hong Kong, China 22.2 18.9 19.6 21.6 22.9Korea, Rep. of 21.9 21.2 20.8 18.6 20.5Mongolia 37.9 33.1 30.3 37.1 40.6Taipei,China 12.7 13.0 12.4 11.0 12.0
South Asia
Afghanistan 19.9 17.5 20.6 22.0 23.7Bangladesh 10.2 11.1 10.4 10.9 11.6Bhutan 35.7 35.2 40.4 46.4 39.1India 22.2 19.9 19.1 21.2 19.9Maldives 38.4 30.8 23.1 24.6 30.4Nepal 14.1 15.4 16.7 18.5 18.8Pakistan 15.0 14.6 13.9 14.0 12.5Sri Lanka 16.6 15.6 15.0 14.9 14.3
Southeast Asia
Brunei Darussalam 55.1 55.8 40.9 54.2 -Cambodia 10.4 13.3 11.9 13.2 12.7Indonesia 17.9 19.8 15.1 15.5 16.1Lao People’s Dem. Rep. 13.6 14.4 14.9 15.7 19.4Malaysia 21.8 21.5 23.3 20.8 21.5Myanmar 14.1 13.1 12.1 12.2 11.4Philippines 16.5 15.6 14.0 13.4 14.0Singapore 16.0 16.9 17.2 17.2 17.9Thailand 17.2 16.9 16.0 17.2 17.7Viet Nam 29.4 29.3 28.1 31.1 30.3
The Pacific
Cook Islands 33.3 32.1 35.3 - -Fiji 25.4 25.4 25.0 24.7 25.2Kiribati 66.0 70.5 78.3 83.0 72.7Marshall Islands 72.3 70.2 69.2 67.0 63.6Micronesia, Fed. States of 56.4 56.8 65.3 68.1 61.7Nauru 87.8 69.9 36.5 83.6 64.4Palau 42.1 39.5 40.4 43.0 37.1Papua New Guinea 37.3 32.2 29.3 30.6 32.6Samoa 36.5 31.2 34.6 36.3 37.7Solomon Islands 28.8 32.8 34.6 - -Timor-Leste 406.5 552.0 371.7 412.8 511.1Tonga 28.0 26.0 34.7 28.6 25.7Tuvalu 70.6 80.4 88.8 75.1 89.1Vanuatu 22.3 27.6 26.8 25.0 25.1
- = not available.
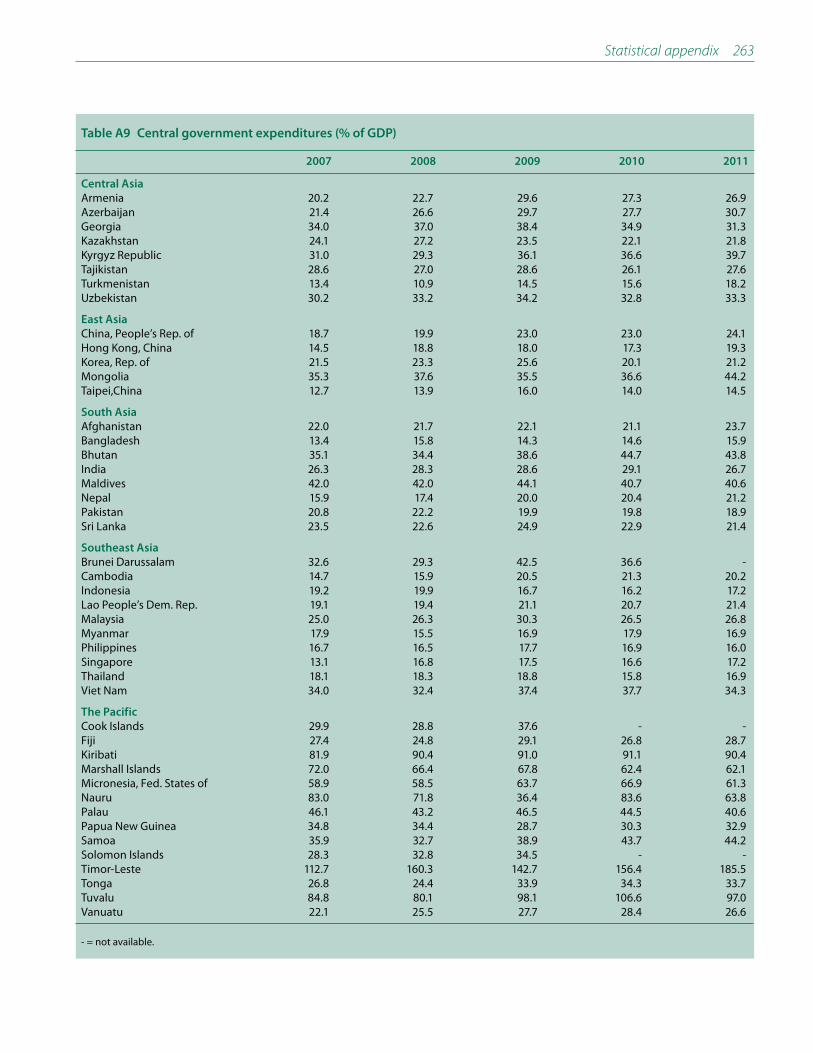
Statistical appendix 263
Table A9 Central government expenditures (% of GDP)
2007 2008 2009 2010 2011
Central Asia
Armenia 20.2 22.7 29.6 27.3 26.9Azerbaijan 21.4 26.6 29.7 27.7 30.7Georgia 34.0 37.0 38.4 34.9 31.3Kazakhstan 24.1 27.2 23.5 22.1 21.8Kyrgyz Republic 31.0 29.3 36.1 36.6 39.7Tajikistan 28.6 27.0 28.6 26.1 27.6Turkmenistan 13.4 10.9 14.5 15.6 18.2Uzbekistan 30.2 33.2 34.2 32.8 33.3
East Asia
China, People’s Rep. of 18.7 19.9 23.0 23.0 24.1Hong Kong, China 14.5 18.8 18.0 17.3 19.3Korea, Rep. of 21.5 23.3 25.6 20.1 21.2Mongolia 35.3 37.6 35.5 36.6 44.2Taipei,China 12.7 13.9 16.0 14.0 14.5
South Asia
Afghanistan 22.0 21.7 22.1 21.1 23.7Bangladesh 13.4 15.8 14.3 14.6 15.9Bhutan 35.1 34.4 38.6 44.7 43.8India 26.3 28.3 28.6 29.1 26.7Maldives 42.0 42.0 44.1 40.7 40.6Nepal 15.9 17.4 20.0 20.4 21.2Pakistan 20.8 22.2 19.9 19.8 18.9Sri Lanka 23.5 22.6 24.9 22.9 21.4
Southeast Asia
Brunei Darussalam 32.6 29.3 42.5 36.6 -Cambodia 14.7 15.9 20.5 21.3 20.2Indonesia 19.2 19.9 16.7 16.2 17.2Lao People’s Dem. Rep. 19.1 19.4 21.1 20.7 21.4Malaysia 25.0 26.3 30.3 26.5 26.8Myanmar 17.9 15.5 16.9 17.9 16.9Philippines 16.7 16.5 17.7 16.9 16.0Singapore 13.1 16.8 17.5 16.6 17.2Thailand 18.1 18.3 18.8 15.8 16.9Viet Nam 34.0 32.4 37.4 37.7 34.3
The Pacific
Cook Islands 29.9 28.8 37.6 - -Fiji 27.4 24.8 29.1 26.8 28.7Kiribati 81.9 90.4 91.0 91.1 90.4Marshall Islands 72.0 66.4 67.8 62.4 62.1Micronesia, Fed. States of 58.9 58.5 63.7 66.9 61.3Nauru 83.0 71.8 36.4 83.6 63.8Palau 46.1 43.2 46.5 44.5 40.6Papua New Guinea 34.8 34.4 28.7 30.3 32.9Samoa 35.9 32.7 38.9 43.7 44.2Solomon Islands 28.3 32.8 34.5 - -Timor-Leste 112.7 160.3 142.7 156.4 185.5Tonga 26.8 24.4 33.9 34.3 33.7Tuvalu 84.8 80.1 98.1 106.6 97.0Vanuatu 22.1 25.5 27.7 28.4 26.6
- = not available.

264 Statistical appendix
Table A10 Fiscal balance of central government (% of GDP)
2007 2008 2009 2010 2011
Central Asia
Armenia -1.5 -0.7 -7.6 -5.0 -3.3Azerbaijan -0.2 0.2 -0.7 -0.9 0.6Georgia -4.7 -6.3 -9.2 -6.6 -2.9Kazakhstan -1.7 -2.1 -2.9 -2.4 -2.1Kyrgyz Republic -0.8 0.0 -3.7 -6.3 -7.6Tajikistan -6.1 -5.5 -5.4 -3.7 -3.1Turkmenistan 3.9 10.0 7.6 2.3 0.5Uzbekistan 2.3 4.5 0.6 1.8 -1.5
East Asia
China, People’s Rep. of 0.6 -0.4 -2.9 -2.1 -1.8Hong Kong, China 7.7 0.1 1.6 4.3 3.5Korea, Rep. of 0.4 -2.0 -4.8 -1.5 -0.7Mongolia 2.7 -4.5 -5.2 0.5 -3.6Taipei,China -0.1 -0.9 -3.5 -3.0 -2.5
South Asia
Afghanistan -2.0 -4.1 -1.6 0.9 0.0Bangladesh -3.2 -4.7 -3.9 -3.7 -4.3Bhutan 0.6 0.8 1.9 1.6 -4.7India -4.1 -8.4 -9.4 -7.9 -6.9Maldives -3.6 -11.2 -21.0 -16.1 -10.2Nepal -1.8 -2.1 -3.3 -1.9 -2.4Pakistan -4.4 -7.6 -6.0 -6.3 -6.6Sri Lanka -6.9 -7.0 -9.9 -8.0 -7.0
Southeast Asia
Brunei Darussalam 22.5 26.5 -1.6 17.5 -Cambodia -4.3 -2.7 -8.6 -8.1 -7.6Indonesia -1.3 -0.1 -1.6 -0.7 -1.1Lao People’s Dem. Rep. -5.5 -5.0 -6.3 -5.0 -2.0Malaysia -3.2 -4.8 -7.0 -5.6 -5.3Myanmar -3.8 -2.4 -4.8 -5.7 -5.5Philippines -0.2 -0.9 -3.7 -3.5 -2.0Singapore 2.9 0.1 -0.3 0.7 0.7Thailand -0.9 -1.3 -4.8 -2.0 -1.5Viet Nam -4.6 -3.1 -9.3 -6.6 -4.0
The Pacific
Cook Islands 3.4 3.3 -2.3 -1.8 -1.4Fiji -2.0 0.6 -4.1 -2.1 -3.5Kiribati -15.9 -19.9 -12.7 -8.1 -17.7Marshall Islands 0.2 3.7 1.4 4.6 1.4Micronesia, Fed. States of -2.5 -1.7 1.6 1.2 0.4Nauru 4.8 -1.9 0.1 0.1 0.6Palau -5.8 -3.1 -2.9 -1.5 -2.3Papua New Guinea 2.4 -2.2 0.6 0.3 -0.3Samoa 0.6 -1.5 -4.3 -7.4 -6.5Solomon Islands 0.5 0.0 0.1 7.1 2.1Timor-Leste 293.8 391.6 229.1 256.4 325.6Tonga 1.3 1.6 0.8 -5.7 -7.9Tuvalu -14.2 0.4 -9.4 -31.5 -7.9Vanuatu 0.1 2.2 -0.9 -3.4 -1.5
- = not available.

Statistical appendix 265
Table A11 Growth rate of merchandise exports (% per year)
2007 2008 2009 2010 2011 2012 2013
Central Asia 33.8 43.3 -31.9 27.7 33.2 5.5 -6.7Armenia 16.7 -7.1 -32.7 57.0 20.0 8.0 11.0Azerbaijan 63.4 43.8 -31.0 25.5 0.4 26.5 -3.5Georgia 25.3 16.3 -22.0 30.0 42.3 -5.9 5.5Kazakhstan 24.7 48.9 -39.0 38.5 46.1 -1.1 -14.4Kyrgyz Republic 47.7 40.1 -9.6 5.0 31.1 11.8 7.7Tajikistan 10.0 18.7 -10.7 45.6 5.2 -2.0 9.9Turkmenistan 26.7 29.5 -22.8 8.4 44.7 6.0 16.0Uzbekistan 43.1 40.5 -4.2 4.7 31.3 9.0 -0.8
East Asia 19.2 13.1 -16.2 29.9 18.2 11.3 15.9China, People’s Rep. of 25.8 17.6 -16.1 31.4 20.4 15.0 18.0Hong Kong, China 8.9 5.6 -11.9 22.4 11.2 5.0 10.9Korea, Rep. of 15.8 11.6 -17.6 28.8 20.0 7.5 15.0Mongolia 26.3 30.1 -25.6 54.3 64.4 25.0 60.0Taipei,China 10.1 3.4 -20.2 34.6 12.1 3.9 9.4
South Asia 24.5 14.2 -3.3 31.1 22.5 12.3 17.6Afghanistan 1.3 34.4 2.1 12.7 2.5 -8.8 -3.4Bangladesh 15.8 17.4 10.1 4.2 41.7 12.0 10.0Bhutan 83.7 4.4 -13.8 5.5 22.2 -6.7 10.1India 28.9 13.7 -3.5 37.3 21.0 14.0 19.0Maldives 1.2 45.2 -49.0 6.5 -4.3 - -Nepal 2.6 9.3 -4.7 -6.3 11.7 5.0 5.5Pakistan 4.4 18.2 -6.4 2.9 28.9 -4.2 7.0Sri Lanka 11.0 6.2 -12.7 21.0 22.4 11.0 20.0
Southeast Asia 12.4 14.7 -16.7 30.0 18.7 8.5 12.6Brunei Darussalam 0.3 40.4 -33.0 29.8 32.5 - -Cambodia -12.1 7.6 -14.2 29.7 35.8 24.0 30.0Indonesia 14.0 18.3 -14.3 32.1 27.5 13.5 24.3Lao People’s Dem. Rep. 16.6 21.8 -5.5 45.8 24.0 19.0 15.0Malaysia 9.5 13.1 -21.1 26.4 14.5 2.9 7.0Myanmar 23.9 12.3 -1.4 25.8 10.1 6.1 8.0Philippines 6.4 -2.5 -22.1 34.9 -6.9 5.4 9.4Singapore 11.2 13.5 -18.7 28.7 15.7 2.5 6.7Thailand 18.2 15.9 -13.9 28.4 16.4 15.0 17.0Viet Nam 21.9 29.1 -8.9 26.4 34.2 12.0 13.8
The Pacific 22.9 -18.2 -7.2 31.8 29.0 - -Cook Islands 19.7 -0.8 - - - - -Fiji 9.5 10.6 -29.8 36.2 26.5 4.3 8.3Kiribati 21.9 23.1 -16.7 - - - -Marshall Islands 2.5 10.4 2.7 55.2 26.5 15.0 14.7Micronesia, Fed. States of 38.8 5.2 -7.8 19.1 - - -Nauru - - - - - - -Palau -20.4 12.4 -34.6 -13.3 -5.6 4.4 -Papua New Guinea 25.4 -24.4 -2.7 31.3 27.8 7.2 -9.7Samoa 33.7 -18.8 -1.2 15.7 -4.7 35.7 -Solomon Islands 44.4 27.9 -21.6 37.3 80.7 - -Timor-Leste -39.7 0.0 -31.5 163.1 -18.5 0.0 22.7Tonga 26.6 -14.3 -22.3 7.9 4.8 8.9 9.1Tuvalu 20.0 - - - - - -Vanuatu -21.2 40.4 32.4 -6.9 - - -
Average 18.0 14.3 -16.0 29.9 19.1 10.5 14.5
- = not available.

266 Statistical appendix
Table A12 Growth rate of merchandise imports (% per year)
2007 2008 2009 2010 2011 2012 2013
Central Asia 36.6 27.1 -15.0 5.5 30.5 9.6 -2.7Armenia 45.6 35.0 -25.0 13.4 8.8 4.5 6.0Azerbaijan 14.7 25.3 -14.0 3.6 44.7 15.3 -6.7Georgia 35.2 25.6 -31.4 17.6 39.8 -8.6 1.1Kazakhstan 37.9 15.6 -24.7 10.3 31.8 14.1 -11.4Kyrgyz Republic 45.8 43.6 -25.0 5.9 34.4 10.4 9.2Tajikistan 54.0 54.4 -24.9 6.7 20.0 7.0 7.0Turkmenistan 36.1 59.2 44.9 -3.5 23.9 3.7 16.0Uzbekistan 44.6 48.5 -2.7 -6.8 26.5 8.3 2.8
East Asia 15.8 15.8 -15.6 35.5 21.6 13.2 17.0China, People’s Rep. of 20.3 18.7 -11.1 39.1 25.1 18.0 20.0Hong Kong, China 10.3 6.2 -10.2 25.3 13.1 5.2 11.2Korea, Rep. of 15.5 21.9 -25.4 31.5 23.8 9.0 15.5Mongolia 43.7 57.4 -34.1 49.7 104.0 20.0 32.0Taipei,China 8.2 9.4 -26.9 43.1 13.0 5.9 10.3
South Asia 29.6 21.1 -3.8 22.9 24.4 14.2 17.4Afghanistan 15.7 14.7 -0.8 3.0 0.4 0.0 0.6Bangladesh 16.6 25.6 4.2 5.4 41.8 17.0 15.0Bhutan 21.1 27.4 -9.6 39.0 40.5 -0.9 17.6India 35.1 19.8 -2.6 26.7 24.0 15.0 18.0Maldives 18.3 26.6 -30.3 14.9 17.4 - -Nepal 13.9 24.1 8.3 37.0 7.7 12.0 11.0Pakistan 8.0 31.2 -10.3 -1.7 14.9 9.3 15.1Sri Lanka 10.2 24.7 -27.6 31.8 50.4 9.0 18.0
Southeast Asia 12.8 21.0 -21.5 33.1 20.8 11.4 14.6Brunei Darussalam 25.1 44.1 -20.3 2.0 19.3 - -Cambodia -5.3 12.4 -11.6 21.7 25.9 21.0 24.0Indonesia 15.4 36.9 -24.0 43.7 30.3 18.5 26.1Lao People’s Dem. Rep. 34.7 31.5 2.0 23.8 19.4 17.0 21.0Malaysia 12.1 6.7 -20.8 34.1 13.9 2.7 7.5Myanmar 88.0 25.6 1.9 15.8 23.8 21.1 23.0Philippines 8.7 5.6 -24.0 32.9 1.6 7.2 10.8Singapore 10.6 22.5 -23.0 27.7 17.5 2.8 7.1Thailand 9.1 26.7 -25.1 37.0 24.7 23.0 22.0Viet Nam 38.5 27.9 -14.3 19.5 25.9 12.5 15.0
The Pacific 17.8 19.6 -16.7 20.6 57.2 - -Cook Islands 28.2 1.0 - - - - -Fiji 0.3 20.8 -37.3 24.2 16.3 1.1 14.2Kiribati 10.5 8.7 -21.3 - - - -Marshall Islands 7.3 2.4 4.5 33.4 -8.8 29.8 -9.1Micronesia, Fed. States of 0.7 12.5 4.2 3.1 - - -Nauru - - - - - - -Palau -6.7 21.1 -28.6 8.2 23.6 0.2 -Papua New Guinea 32.5 18.6 -8.5 23.5 84.6 0.8 -2.3Samoa 3.7 9.9 -8.0 14.1 11.4 16.4 -Solomon Islands 33.9 11.6 -18.2 50.6 15.0 - -Timor-Leste 12.9 61.7 9.9 2.8 87.3 15.0 13.0Tonga 16.8 21.1 -14.6 -16.8 16.6 -4.2 -5.2Tuvalu 62.4 - - - - - -Vanuatu 24.6 50.7 -6.9 -0.3 - - -
Average 16.8 17.9 -15.8 32.6 21.9 12.8 16.1
- = not available.
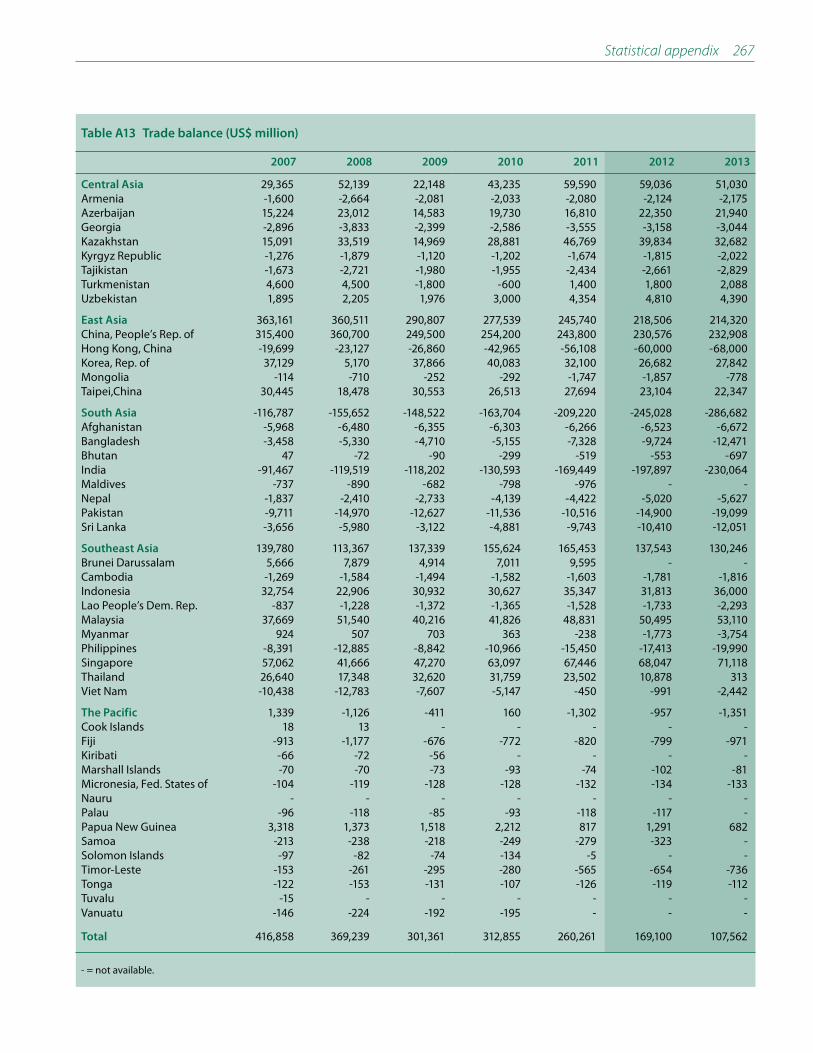
Statistical appendix 267
Table A13 Trade balance (US$ million)
2007 2008 2009 2010 2011 2012 2013
Central Asia 29,365 52,139 22,148 43,235 59,590 59,036 51,030Armenia -1,600 -2,664 -2,081 -2,033 -2,080 -2,124 -2,175Azerbaijan 15,224 23,012 14,583 19,730 16,810 22,350 21,940Georgia -2,896 -3,833 -2,399 -2,586 -3,555 -3,158 -3,044Kazakhstan 15,091 33,519 14,969 28,881 46,769 39,834 32,682Kyrgyz Republic -1,276 -1,879 -1,120 -1,202 -1,674 -1,815 -2,022Tajikistan -1,673 -2,721 -1,980 -1,955 -2,434 -2,661 -2,829Turkmenistan 4,600 4,500 -1,800 -600 1,400 1,800 2,088Uzbekistan 1,895 2,205 1,976 3,000 4,354 4,810 4,390
East Asia 363,161 360,511 290,807 277,539 245,740 218,506 214,320China, People’s Rep. of 315,400 360,700 249,500 254,200 243,800 230,576 232,908Hong Kong, China -19,699 -23,127 -26,860 -42,965 -56,108 -60,000 -68,000Korea, Rep. of 37,129 5,170 37,866 40,083 32,100 26,682 27,842Mongolia -114 -710 -252 -292 -1,747 -1,857 -778Taipei,China 30,445 18,478 30,553 26,513 27,694 23,104 22,347
South Asia -116,787 -155,652 -148,522 -163,704 -209,220 -245,028 -286,682Afghanistan -5,968 -6,480 -6,355 -6,303 -6,266 -6,523 -6,672Bangladesh -3,458 -5,330 -4,710 -5,155 -7,328 -9,724 -12,471Bhutan 47 -72 -90 -299 -519 -553 -697India -91,467 -119,519 -118,202 -130,593 -169,449 -197,897 -230,064Maldives -737 -890 -682 -798 -976 - -Nepal -1,837 -2,410 -2,733 -4,139 -4,422 -5,020 -5,627Pakistan -9,711 -14,970 -12,627 -11,536 -10,516 -14,900 -19,099Sri Lanka -3,656 -5,980 -3,122 -4,881 -9,743 -10,410 -12,051
Southeast Asia 139,780 113,367 137,339 155,624 165,453 137,543 130,246Brunei Darussalam 5,666 7,879 4,914 7,011 9,595 - -Cambodia -1,269 -1,584 -1,494 -1,582 -1,603 -1,781 -1,816Indonesia 32,754 22,906 30,932 30,627 35,347 31,813 36,000Lao People’s Dem. Rep. -837 -1,228 -1,372 -1,365 -1,528 -1,733 -2,293Malaysia 37,669 51,540 40,216 41,826 48,831 50,495 53,110Myanmar 924 507 703 363 -238 -1,773 -3,754Philippines -8,391 -12,885 -8,842 -10,966 -15,450 -17,413 -19,990Singapore 57,062 41,666 47,270 63,097 67,446 68,047 71,118Thailand 26,640 17,348 32,620 31,759 23,502 10,878 313Viet Nam -10,438 -12,783 -7,607 -5,147 -450 -991 -2,442
The Pacific 1,339 -1,126 -411 160 -1,302 -957 -1,351Cook Islands 18 13 - - - - -Fiji -913 -1,177 -676 -772 -820 -799 -971Kiribati -66 -72 -56 - - - -Marshall Islands -70 -70 -73 -93 -74 -102 -81Micronesia, Fed. States of -104 -119 -128 -128 -132 -134 -133Nauru - - - - - - -Palau -96 -118 -85 -93 -118 -117 -Papua New Guinea 3,318 1,373 1,518 2,212 817 1,291 682Samoa -213 -238 -218 -249 -279 -323 -Solomon Islands -97 -82 -74 -134 -5 - -Timor-Leste -153 -261 -295 -280 -565 -654 -736Tonga -122 -153 -131 -107 -126 -119 -112Tuvalu -15 - - - - - -Vanuatu -146 -224 -192 -195 - - -
Total 416,858 369,239 301,361 312,855 260,261 169,100 107,562
- = not available.

268 Statistical appendix
Table A14 Current account balance (% of GDP)
2007 2008 2009 2010 2011 2012 2013
Central Asia 0.4 8.1 0.3 5.1 8.5 4.6 3.9Armenia -6.4 -11.8 -15.8 -14.7 -12.4 -11.2 -10.0Azerbaijan 27.3 33.7 23.0 28.4 28.7 22.0 19.0Georgia -19.7 -22.8 -11.2 -11.5 -13.3 -12.5 -12.0Kazakhstan -7.9 4.7 -3.5 2.0 7.3 1.0 1.0Kyrgyz Republic -5.9 -13.7 -2.2 -8.0 -6.8 -6.6 -6.8Tajikistan -8.6 -7.6 -5.9 2.1 -4.1 -7.0 -6.5Turkmenistan 15.5 16.5 -16.0 -11.7 -2.9 3.4 3.4Uzbekistan 7.3 8.9 2.2 6.6 8.1 7.5 6.0
East Asia 8.4 7.5 5.5 5.1 3.1 2.5 2.2China, People’s Rep. of 10.1 9.1 5.2 5.2 2.8 2.1 1.7Hong Kong, China 12.3 13.7 8.6 5.5 5.1 5.0 5.0Korea, Rep. of 2.1 0.3 3.9 2.9 2.5 2.0 2.0Mongolia 1.8 -12.3 -7.5 -14.3 -30.0 -25.0 -15.0Taipei,China 8.9 6.9 11.4 9.3 8.8 8.1 7.9
South Asia -1.6 -3.0 -2.7 -2.3 -3.1 -3.1 -2.9Afghanistan 1.3 0.9 -2.8 1.7 0.1 -1.1 -2.5Bangladesh 1.4 0.9 2.7 3.7 0.9 -0.5 -1.0Bhutan 14.2 -2.2 -1.1 -9.9 -20.6 -20.0 -22.2India -1.3 -2.4 -2.8 -2.7 -3.6 -3.3 -3.0Maldives -28.4 -34.2 -21.6 -22.3 -31.9 -38.0 -38.0Nepal -0.1 2.9 4.2 -2.7 -0.9 0.5 1.0Pakistan -4.8 -8.5 -5.7 -2.2 0.1 -1.8 -1.9Sri Lanka -4.3 -9.5 -0.5 -2.2 -7.3 -6.4 -6.0
Southeast Asia 8.2 4.3 6.9 6.1 5.6 4.4 4.0Brunei Darussalam 39.2 48.5 37.3 48.5 50.0 50.0 50.0Cambodia -7.4 -11.1 -10.3 -10.4 -7.1 -7.6 -7.0Indonesia 2.4 0.0 2.0 0.7 0.2 -0.1 0.2Lao People’s Dem. Rep. -16.4 -19.1 -21.0 -17.1 -15.9 -21.0 -22.0Malaysia 15.9 17.7 16.5 11.5 11.5 12.1 11.9Myanmar 0.6 -2.2 -1.3 -0.9 -2.7 -4.8 -5.0Philippines 4.8 2.1 5.6 4.5 3.1 2.1 2.3Singapore 25.8 13.9 16.2 24.4 21.9 18.0 16.0Thailand 6.3 0.5 8.3 4.2 3.4 0.5 -0.5Viet Nam -10.0 -11.9 -6.8 -4.0 0.2 -1.5 -2.2
The Pacific 42.1 61.6 23.1 30.8 25.8 11.9 3.3Cook Islands 5.8 4.0 - - - - -Fiji -14.2 -18.1 -7.6 -11.0 -11.2 -9.6 -11.6Kiribati -29.4 -34.7 -29.8 -23.1 -28.9 -29.2 -Marshall Islands -2.0 -2.2 -17.0 -24.6 -12.6 -30.3 -Micronesia, Fed. States of -7.3 -15.6 -18.9 -15.5 -17.1 -17.2 -16.6Nauru - - - - - - -Palau -6.2 -17.8 -1.5 2.0 4.1 5.9 -Papua New Guinea 21.7 -6.1 -7.1 -6.5 -36.8 -33.2 -29.7Samoa -4.5 -11.1 -5.9 -9.3 -9.3 -8.6 -8.3Solomon Islands -14.7 -20.3 -20.9 -27.6 -11.2 -15.0 -15.0Timor-Leste 320.1 430.8 223.4 269.4 339.4 229.4 153.7Tonga -6.0 -19.0 -16.8 -9.2 -11.0 -11.7 -10.7Tuvalu - - - - - - -Vanuatu -7.0 -11.1 -8.1 -6.0 -5.9 -6.3 -6.5
Average 6.5 5.3 4.2 4.0 2.6 1.9 1.7
- = not available.

Statistical appendix 269
Table A15 Exchange rates to the US dollar (annual average)
Currency Symbol 2007 2008 2009 2010 2011
Central Asia
Armenia Dram AMD 342.1 306.0 363.3 373.7 369.7Azerbaijan Azerbaijan new manat AZN 0.9 0.8 0.8 0.8 0.8Georgia Lari GEL 1.7 1.5 1.7 1.8 1.7Kazakhstan Tenge T 122.6 120.3 147.5 147.4 146.6Kyrgyz Republic Som Som 37.3 36.6 42.9 46.0 46.1Tajikistan Somoni TJS 3.4 3.4 4.1 4.4 4.6Turkmenistan Turkmen manat TMM 1.0 2.3 2.9 2.9 2.9Uzbekistan Sum SUM 1,263.5 1,319.6 1,465.6 1,576.8 1,717.8
East Asia
China, People’s Rep. of Yuan CNY 7.6 6.9 6.8 6.8 6.5Hong Kong, China Hong Kong dollar HK$ 7.8 7.8 7.8 7.8 7.8Korea, Rep. of Won W 929.1 1,100.5 1,275.0 1,155.4 1,107.4Mongolia Togrog MNT 1,181.2 1,165.8 1,437.8 1,357.9 1,265.2Taipei,China NT dollar NT$ 32.8 31.5 33.1 31.6 29.5
South Asia
Afghanistan Afghani AF 49.8 51.0 49.3 45.8 48.4Bangladesh Taka Tk 69.0 68.6 68.8 69.2 71.2Bhutan Ngultrum Nu 44.2 40.4 47.8 46.7 45.3India Indian rupee/s Re/Rs 40.2 45.9 47.4 45.6 47.5Maldives Rufiyaa Rf 12.8 12.8 12.8 12.8 15.4Nepal Nepalese rupee/s NRe/NRs 70.2 64.7 76.6 74.2 72.1Pakistan Pakistan rupee/s PRe/PRs 60.6 62.5 78.5 83.8 85.5Sri Lanka Sri Lanka rupee/s SLRe/SLRs 110.6 108.3 114.9 113.1 110.6
Southeast Asia
Brunei Darussalam Brunei dollar B$ 1.5 1.4 1.5 1.4 1.3Cambodia Riel KR 4,060.0 4,060.0 4,148.3 4,188.5 4,065.9Indonesia Rupiah Rp 9,136.2 9,678.3 10,398.6 9,084.6 8,779.5Lao People’s Dem. Rep. Kip KN 9,581.2 8,734.9 8,501.0 8,254.5 8,029.3Malaysia Ringgit RM 3.4 3.3 3.5 3.2 3.1Myanmar Kyat MK 5.6 5.4 5.5 5.6 5.4Philippines Peso P 46.1 44.5 47.6 45.1 43.3Singapore Singapore dollar S$ 1.5 1.4 1.5 1.4 1.3Thailand Baht B 34.5 33.3 34.3 32.2 30.5Viet Nam Dong D 16,105.0 16,302.0 17,065.0 18,621.0 20,490.0
The Pacific
Cook Islands New Zealand dollar NZ$ 1.4 1.4 1.6 1.4 1.3Fiji Fiji dollar F$ 1.6 1.6 2.0 1.9 1.8Kiribati Australian dollar A$ 1.2 1.2 1.3 1.1 1.0Marshall Islands US dollar US$ 1.0 1.0 1.0 1.0 1.0Micronesia, Fed. States of US dollar US$ 1.0 1.0 1.0 1.0 1.0Nauru Australian dollar A$ 1.2 1.2 1.3 1.1 1.0Palau US dollar US$ 1.0 1.0 1.0 1.0 1.0Papua New Guinea Kina K 3.0 2.7 2.8 2.7 2.2Samoa Tala ST 2.6 2.6 2.7 2.5 2.3Solomon Islands Sol. Islands dollar SI$ 7.7 7.8 8.1 8.1 7.7Timor-Leste US dollar US$ 1.0 1.0 1.0 1.0 1.0Tonga Pa’anga T$ 1.9 1.9 2.0 2.0 -Tuvalu Australian dollar A$ 1.2 1.2 1.3 1.1 1.0Vanuatu Vatu Vt 103.2 101.4 105.9 97.3 91.7
- = not available.

270 Statistical appendix
Table A16 Gross international reserves (US$ million)
2007 2008 2009 2010 2011
Central Asia
Armenia 1,659 1,407 2,004 1,866 1,959Azerbaijan 4,273 6,467 5,364 6,409 10,274Georgia 1,361 1,480 2,110 2,264 2,795Kazakhstan 17,629 19,872 23,091 28,291 44,500Kyrgyz Republic 1,177 1,225 1,588 1,719 1,846Tajikistan 85 150 278 476 582Turkmenistan 13,222 - - - -Uzbekistan 7,510 9,534 12,226 14,580 19,780
East Asia
China, People’s Rep. of 1,530,280 1,949,260 2,416,040 2,866,080 3,200,000Hong Kong, China 152,702 182,539 255,816 268,731 285,408Korea, Rep. of 262,224 201,223 269,995 291,571 306,402Mongolia 975 637 1,294 2,197 2,457Taipei,China 270,311 291,707 348,198 382,005 385,547
South Asia
Afghanistan 2,784 3,591 4,209 5,321 6,121Bangladesh 5,077 6,149 7,471 10,750 10,912Bhutan 608 589 704 792 906India 299,230 251,985 278,193 301,838 295,140Maldives 308 241 261 350 335Nepal 1,999 2,477 2,872 2,759 3,003Pakistan 13,393 8,731 9,529 13,112 15,662Sri Lanka 3,508 1,753 5,097 6,610 5,958
Southeast Asia
Brunei Darussalam 667 751 1,357 1,563 -Cambodia 1,616 2,164 2,367 2,653 3,032Indonesia 56,920 51,639 66,105 96,207 110,123Lao People’s Dem. Rep. 528 636 633 727 679Malaysia 101,532 91,648 96,744 106,590 138,408Myanmar 3,638 4,042 5,233 6,070 7,903Philippines 33,751 37,551 44,243 62,373 75,302Singapore 162,957 174,196 187,809 225,754 237,737Thailand 87,455 111,008 138,418 172,129 175,124Viet Nam 20,964 23,022 14,148 12,382 13,800
The Pacific
Cook Islands - - - - -Fiji 805 559 557 680 852Kiribati 586 412 414 - -Marshall Islands 3 2 - - -Micronesia, Fed. States of 50 45 - - -Nauru - - - - -Palau - - - - -Papua New Guinea 1,998 2,022 2,621 2,600 3,758Samoa 81 88 94 164 154Solomon Islands 121 92 146 266 -Timor-Leste 230 210 238 394 450Tonga 47 48 68 89 104Tuvalu 17 26 23 23 28Vanuatu 120 115 149 161 -
- = not available.
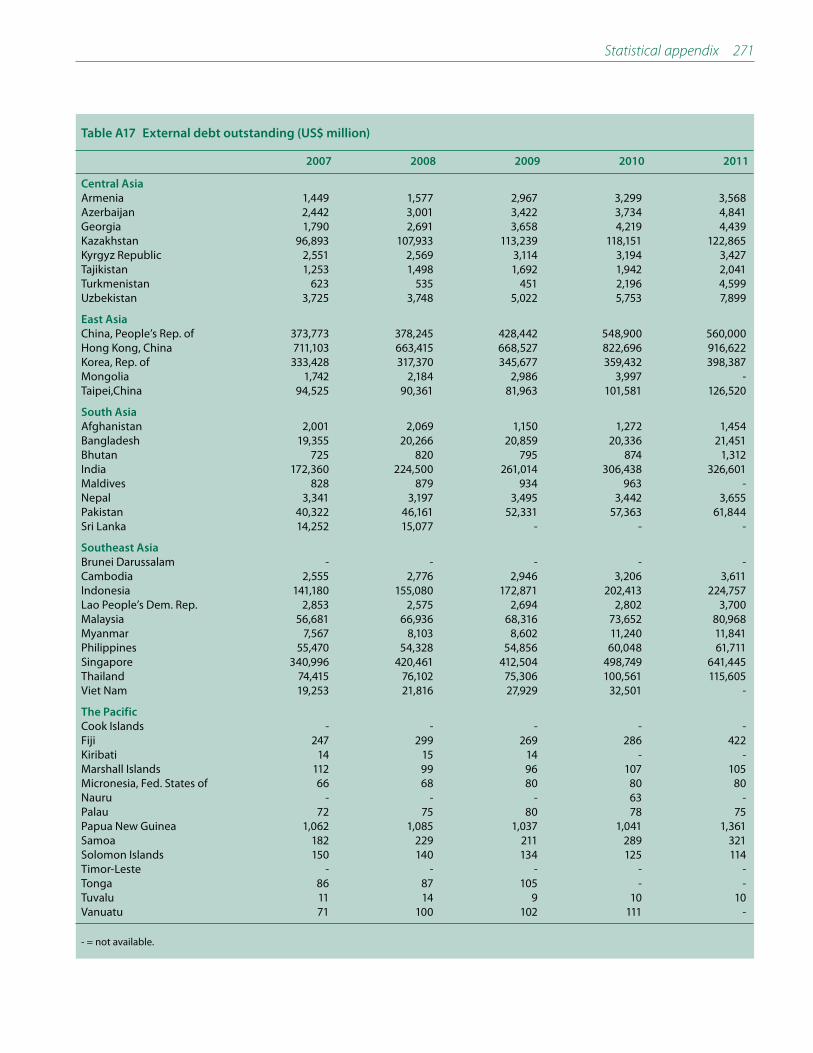
Statistical appendix 271
Table A17 External debt outstanding (US$ million)
2007 2008 2009 2010 2011
Central Asia
Armenia 1,449 1,577 2,967 3,299 3,568Azerbaijan 2,442 3,001 3,422 3,734 4,841Georgia 1,790 2,691 3,658 4,219 4,439Kazakhstan 96,893 107,933 113,239 118,151 122,865Kyrgyz Republic 2,551 2,569 3,114 3,194 3,427Tajikistan 1,253 1,498 1,692 1,942 2,041Turkmenistan 623 535 451 2,196 4,599Uzbekistan 3,725 3,748 5,022 5,753 7,899
East Asia
China, People’s Rep. of 373,773 378,245 428,442 548,900 560,000Hong Kong, China 711,103 663,415 668,527 822,696 916,622Korea, Rep. of 333,428 317,370 345,677 359,432 398,387Mongolia 1,742 2,184 2,986 3,997 -Taipei,China 94,525 90,361 81,963 101,581 126,520
South Asia
Afghanistan 2,001 2,069 1,150 1,272 1,454Bangladesh 19,355 20,266 20,859 20,336 21,451Bhutan 725 820 795 874 1,312India 172,360 224,500 261,014 306,438 326,601Maldives 828 879 934 963 -Nepal 3,341 3,197 3,495 3,442 3,655Pakistan 40,322 46,161 52,331 57,363 61,844Sri Lanka 14,252 15,077 - - -
Southeast Asia
Brunei Darussalam - - - - -Cambodia 2,555 2,776 2,946 3,206 3,611Indonesia 141,180 155,080 172,871 202,413 224,757Lao People’s Dem. Rep. 2,853 2,575 2,694 2,802 3,700Malaysia 56,681 66,936 68,316 73,652 80,968Myanmar 7,567 8,103 8,602 11,240 11,841Philippines 55,470 54,328 54,856 60,048 61,711Singapore 340,996 420,461 412,504 498,749 641,445Thailand 74,415 76,102 75,306 100,561 115,605Viet Nam 19,253 21,816 27,929 32,501 -
The Pacific
Cook Islands - - - - -Fiji 247 299 269 286 422Kiribati 14 15 14 - -Marshall Islands 112 99 96 107 105Micronesia, Fed. States of 66 68 80 80 80Nauru - - - 63 -Palau 72 75 80 78 75Papua New Guinea 1,062 1,085 1,037 1,041 1,361Samoa 182 229 211 289 321Solomon Islands 150 140 134 125 114Timor-Leste - - - - -Tonga 86 87 105 - -Tuvalu 11 14 9 10 10Vanuatu 71 100 102 111 -
- = not available.

272 Statistical appendix
Table A18 Debt service ratio (% of exports of goods and services)
2007 2008 2009 2010 2011
Central Asia
Armenia 2.9 3.1 5.4 4.7 4.6Azerbaijan 0.6 0.9 1.3 - -Georgia 3.5 3.4 5.2 4.9 7.1Kazakhstan 49.0 41.7 63.2 32.4 16.8Kyrgyz Republic 14.7 18.3 40.9 12.7 7.1Tajikistan 13.0 19.9 37.5 12.3 -Turkmenistan 2.1 1.4 1.7 1.5 -Uzbekistan 8.5 5.7 5.4 7.9 9.7
East Asia
China, People’s Rep. of 2.4 2.2 3.1 2.9 2.5Hong Kong, China - - - - -Korea, Rep. of 6.9 7.9 7.8 6.8 6.9Mongolia 1.8 1.1 2.0 2.1 -Taipei,China 2.7 3.9 2.6 1.2 1.7
South Asia
Afghanistan 1.1 1.1 0.8 0.4 0.5Bangladesh 3.7 3.2 3.2 2.9 2.5Bhutan 3.6 17.3 30.5 29.8 52.2India 4.8 4.4 5.5 4.2 4.6Maldives 4.5 5.0 6.1 5.6 7.2Nepal 10.3 9.6 10.2 11.5 11.6Pakistan 8.3 8.1 15.4 19.2 25.0Sri Lanka 13.1 15.1 19.0 14.8 9.3
Southeast Asia
Brunei Darussalam - - - - -Cambodia 1.0 1.2 1.5 1.4 1.2Indonesia 19.4 18.1 23.2 21.7 22.5Lao People’s Dem. Rep. 4.3 4.3 4.9 4.5 4.6Malaysia 3.8 3.8 2.6 6.5 7.4Myanmar 4.6 5.1 4.3 3.1 3.9Philippines 10.1 9.7 10.4 8.7 8.9Singapore - - - - -Thailand 12.1 8.3 7.6 4.6 2.4Viet Nam 5.5 6.5 7.5 8.5 -
The Pacific
Cook Islands - - - - -Fiji 1.5 1.1 1.8 1.3 9.2Kiribati 2.9 2.1 2.5 - -Marshall Islands 59.4 24.7 24.8 17.3 14.2Micronesia, Fed. States of 4.8 5.3 5.9 6.4 7.1Nauru - 0.6 2.1 - -Palau 0.9 49.3 69.9 62.4 48.3Papua New Guinea 3.6 2.9 1.4 1.2 1.2Samoa 55.6 67.8 62.0 74.5 -Solomon Islands 5.6 5.6 3.6 3.0 -Timor-Leste - - - - -Tonga 10.5 - - - -Tuvalu 16.1 17.2 22.8 39.4 17.9Vanuatu 1.2 1.3 1.5 1.4 -
- = not available.

Asian Development Outlook 2012Confronting Rising Inequality in Asia
The annual Asian Development Outlook provides a comprehensive analysis of economic performance for the past year and offers forecasts for the next 2 years for the 45 economies in Asia and the Pacific that make up developing Asia.
Despite weak global demand, Asian Development Outlook 2012 expects that developing Asia will largely maintain its growth momentum in the next couple of years, in an environment of easing inflation for most regional economies, although policy makers must be alert to further oil-price spikes arising from threats of oil supply disruptions.
The report sees that the greatest risk to the outlook is the uncertainty surrounding the resolution of sovereign debt problems in the eurozone. Still, in the absence of any sudden shocks, developing Asia can manage the effects on its trade flows and financial markets.
The theme chapter looks at widening inequality: in spite of developing Asia’s great success in raising living standards and reducing poverty, swelling income disparities threaten to undermine the pace of progress. Regional policy makers need to ensure that the benefits of growth are widely shared.
About the Asian Development Bank
ADB’s vision is an Asia and Pacific region free of poverty. Its mission is to help its developing member countries reduce poverty and improve the quality of life of their people. Despite the region’s many successes, it remains home to two-thirds of the world’s poor: 1.8 billion people who live on less than $2 a day, with 903 million struggling on less than $1.25 a day. ADB is committed to reducing poverty through inclusive economic growth, environmentally sustainable growth, and regional integration.
Based in Manila, ADB is owned by 67 members, including 48 from the region. Its main instruments for helping its developing member countries are policy dialogue, loans, equity investments, guarantees, grants, and technical assistance.
Asian Development Bank6 ADB Avenue, Mandaluyong City1550 Metro Manila, Philippineswww.adb.org
April 2012
Printed in the PhilippinesPrinted on recycled paper