Poverty Maps of Northern Samar 2000 and 2002 Maps of Northern Samar 2000 and 2002 Republic of the...
40
Poverty Maps of Northern Samar 2000 and 2002 Republic of the Philippines NATIONAL STATISTICAL COORDINATION BOARD (PAMBANSANG LUPON SA UGNAYANG PANG-ESTADISTIKA) Regional Division VIII, Tacloban City
-
Upload
dangnguyet -
Category
Documents
-
view
214 -
download
0
Transcript of Poverty Maps of Northern Samar 2000 and 2002 Maps of Northern Samar 2000 and 2002 Republic of the...
Poverty Maps of Northern Samar2000 and 2002
Republic of the PhilippinesNATIONAL STATISTICAL COORDINATION BOARD(PAMBANSANG LUPON SA UGNAYANG PANG-ESTADISTIKA)Regional Division VIII, Tacloban City
INTRODUCTION
The National Statistical Coordination Board (NSCB) produces provincial poverty statistics which serves the need of localexecutives, planners and policy makers for a more disaggregated data on poverty. Also, to further serve the needs of LGUsespecially at the municipal level, the NSCB started to produce poverty maps covering the poorest 44 provinces in the country. Themaps are useful tools for identifying priority areas that should benefit from poverty alleviation programs. They also show the relativeposition of the municipalities in terms of the overall poverty situation in the province.
In the poverty mapping activity, we adopted the Minimum Basic Needs (MBN) Framework which contains the three majorconcerns: Survival, Security and Enabling. The methodology involves the computation of the municipal indexes of each of the MBNindicators. These indexes are then plotted on the map using a Geographic Information System (GIS) software.
The NSCB Regional Division VIII is preparing poverty maps for the 5 provinces in the region belonging to the poorest 44provinces in the country which include the Province of Northern Samar (Annex A). The poverty maps for Northern Samar weregenerated using the MBN data gathered by the Provincial Planning and Development Office (PPDO). The 2000 and 2002 datawere used to compare the poverty situation of the municipalities. The maps were validated by concerned LGUs, agencies andprivate sector during a Users’ Forum on Poverty Mapping in Northern Samar held on October 19, 2004, at the Ibabao Hall, NewCapitol Building, Catarman, Northern Samar. The activity was a joint effort of the NSCB and the Provincial Government of NorthernSamar through its PPDO. The maps are targetted to be updated annually.
i
CONTENTS
Introduction ............................................................................................................................................................................................ i
Contents .................................................................................................................................................................................... ii
Poverty Team ..................................................................................................................................................................................... iii
Data Sources ..................................................................................................................................................................................... iii
List of MBN Indicators Used ............................................................................................................................................................. 1
Poverty Maps ................................................................................................................................................................................. 2 - 22
Tables ............................................................................................................................................................................................. 23- 35
Highlights ................................................................................................................................................................................ .......... 36
Annex
Poverty Incidence of Families by Province, Region VIII: 2000 ............................................................................................ 37
ii
iii
POVERTY TEAM
NATIONAL STATISTICAL COORDINATION BOARD PROVINCIAL PLANNING AND DEVELOPMENT OFFICE
Ms. Evangeline M. Paran Mr. Lorenzo S. Mahinay Regional Head Provincial Planning and Development Coordinator
Ms. Riza N. Moraleta Mr. Vicente P. Letran Statistical Coordination Officer II Project Development Officer I
DATA SOURCES
Commission on Elections, Northern Samar
Department of Education, Division of Northern Samar
National Statistics Office
Philippine National Police, Northern Samar
Provincial Health Office, Northern Samar

1
SURVIVALNutrition
Malnourished children 0-5 years old Newborn with birth weight at least 2.5 kilograms
HealthInfant mortality rate
Number and ratio of medical and other health workers to population
Water and SanitationAccess to safe water
Access to sanitary toilet
LIST OF MINIMUM BASIC NEEDS INDICATORS USED
SECURITYPeace and Order/Public Safety
Number of victims of crime against personNumber of victims of crime against property
ENABLINGBasic Education
Elementary participation rateCompletion rate
People’s ParticipationFamily members able to vote at election
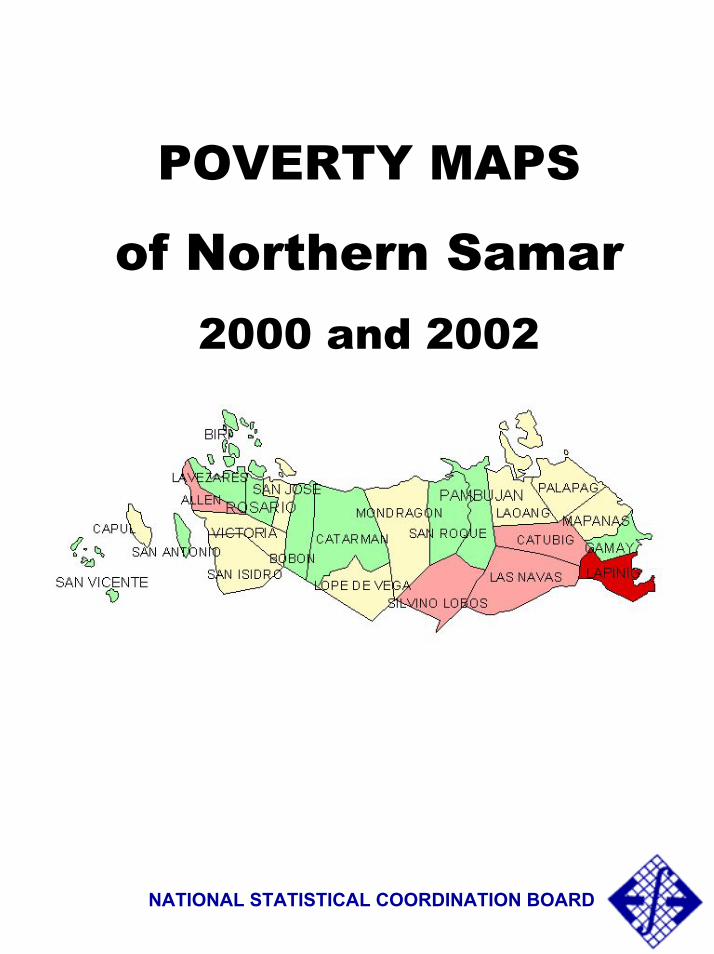
POVERTY MAPS
of Northern Samar2000 and 2002
NATIONAL STATISTICAL COORDINATION BOARD
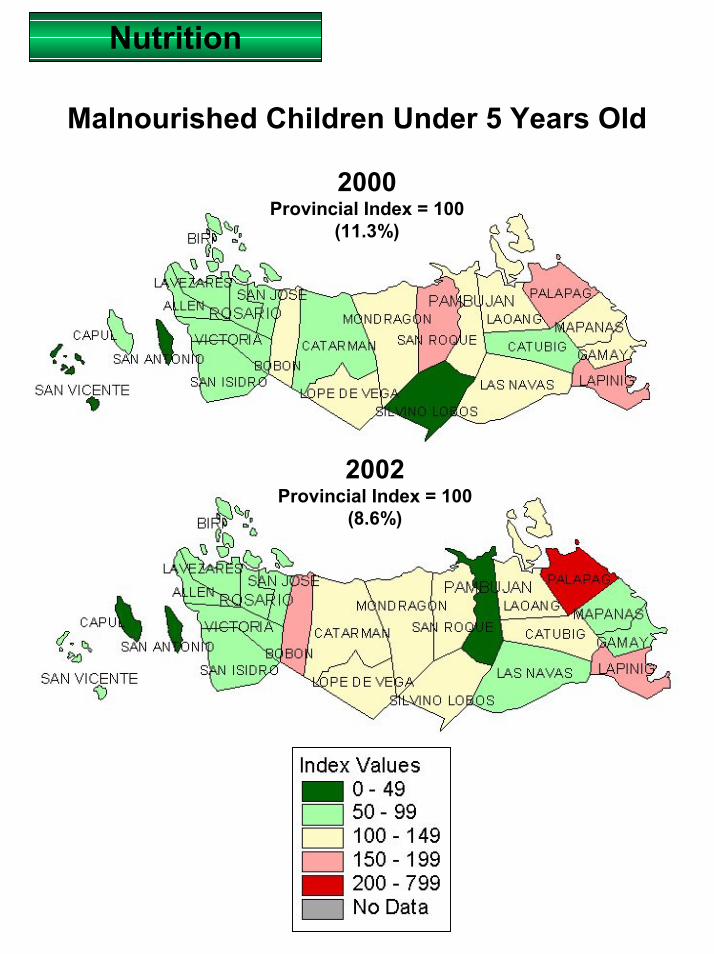
Nutrition
Malnourished Children Under 5 Years Old
2000Provincial Index = 100
(11.3%)
2002Provincial Index = 100
(8.6%)
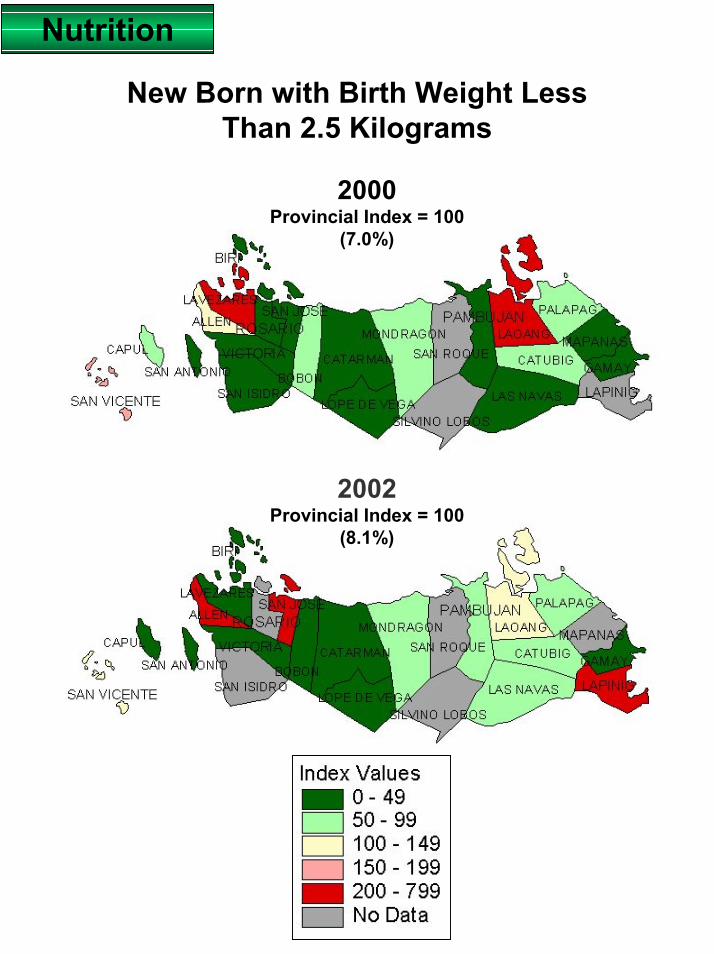
Nutrition
New Born with Birth Weight Less Than 2.5 Kilograms
2000Provincial Index = 100
(7.0%)
2002Provincial Index = 100
(8.1%)

Nutrition(Composite Index)
(Provincial Index = 100)
2000
2002
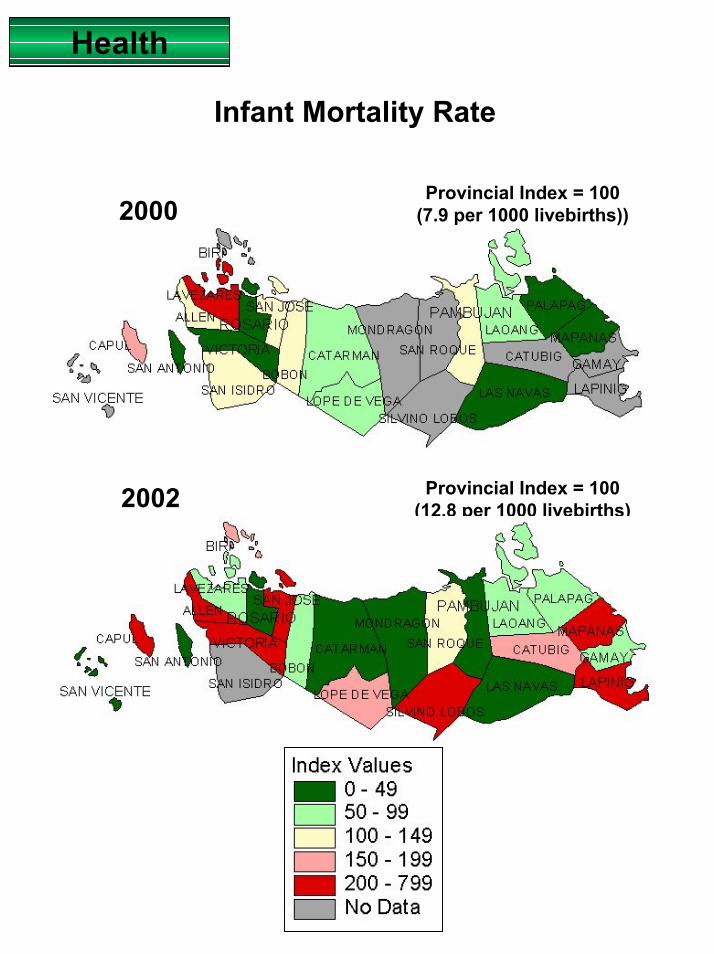
Health
Infant Mortality Rate
2000Provincial Index = 100
(7.9 per 1000 livebirths))
2002 Provincial Index = 100(12.8 per 1000 livebirths)
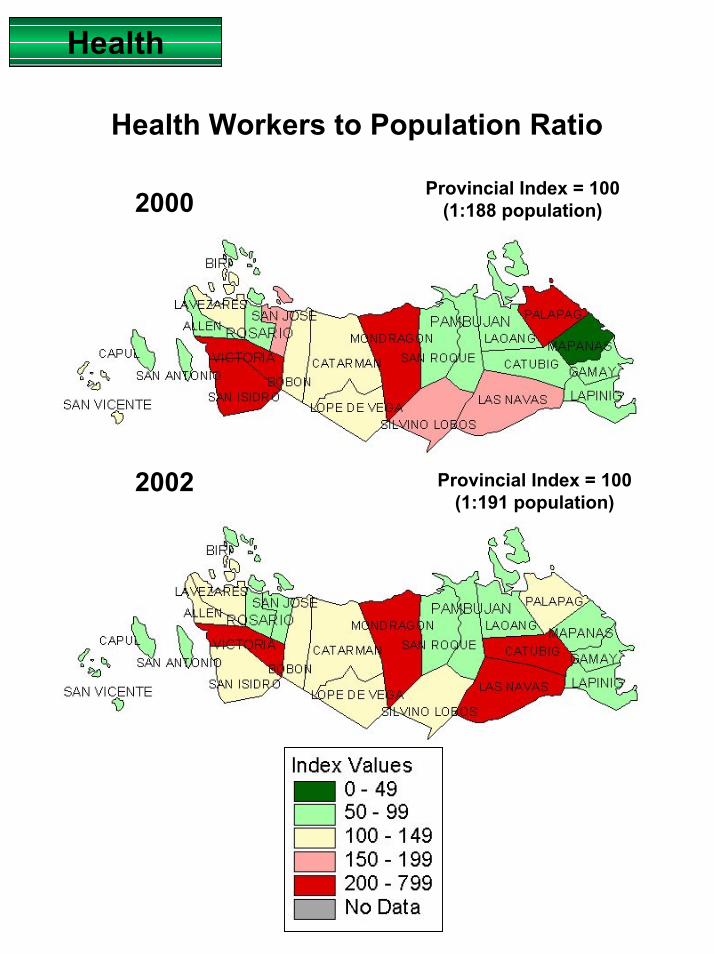
Health
Health Workers to Population Ratio
Provincial Index = 100(1:188 population)2000
2002 Provincial Index = 100(1:191 population)
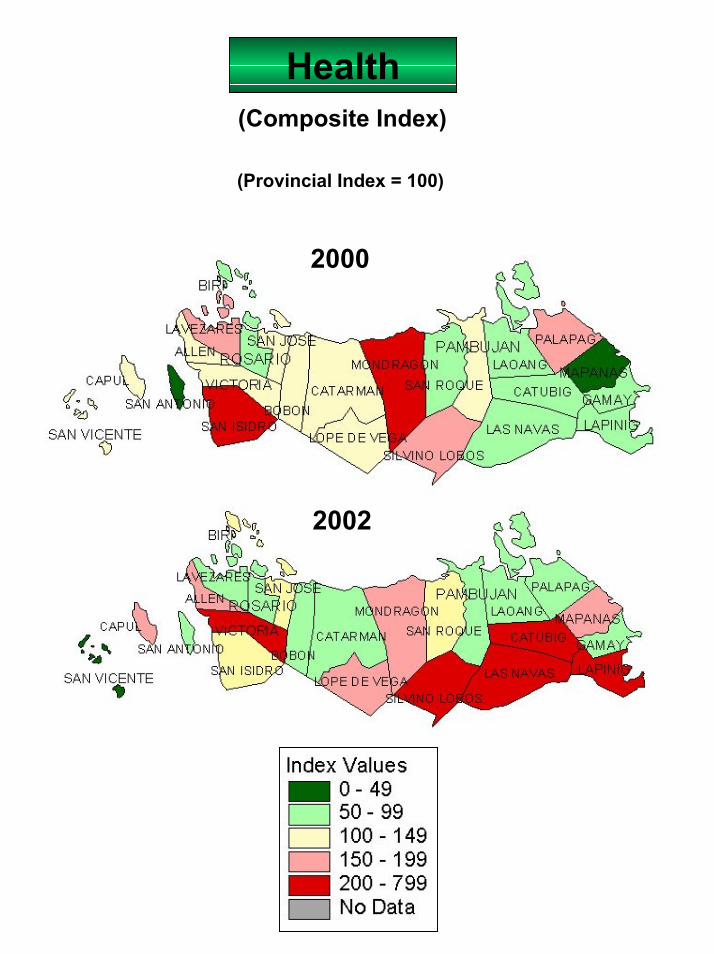
Health(Composite Index)
(Provincial Index = 100)
2000
2002
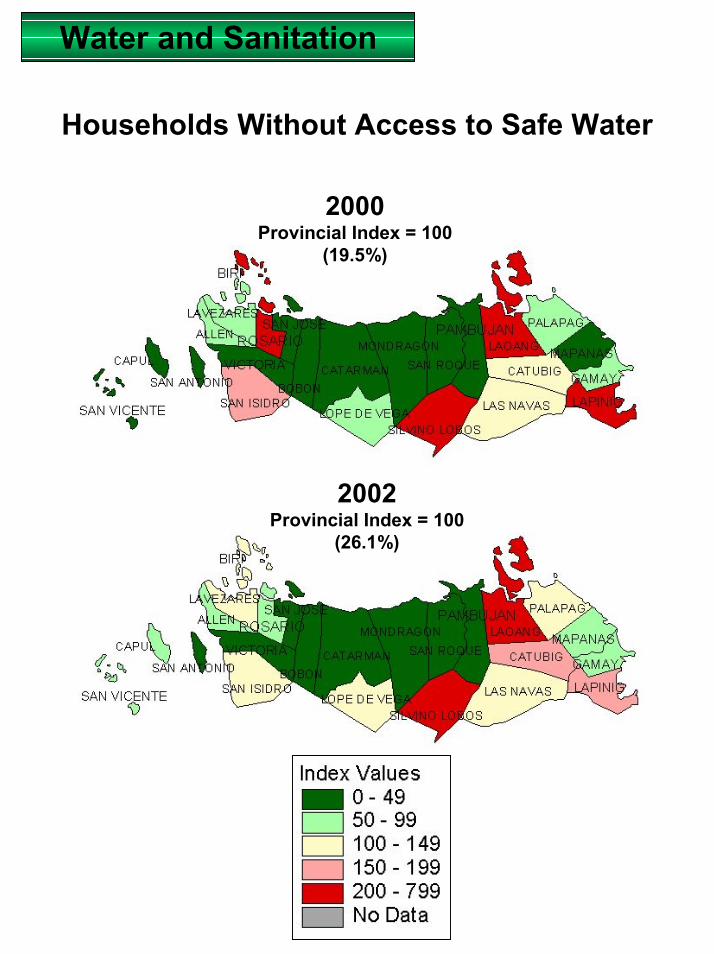
Water and Sanitation
Households Without Access to Safe Water
2000Provincial Index = 100
(19.5%)
2002Provincial Index = 100
(26.1%)
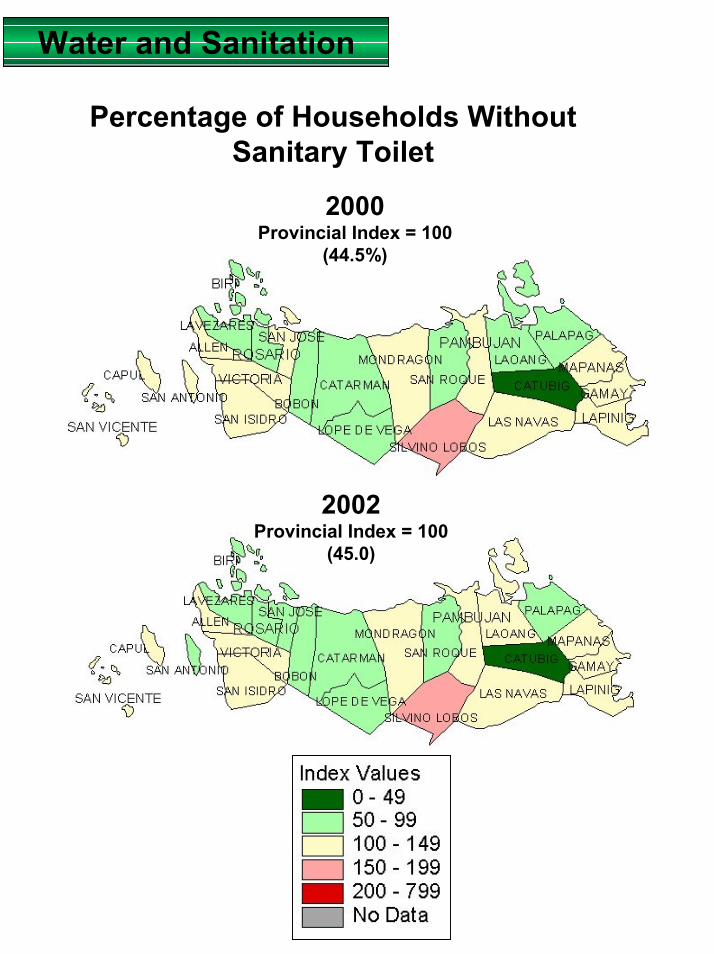
Water and Sanitation
Percentage of Households Without Sanitary Toilet
2000Provincial Index = 100
(44.5%)
2002Provincial Index = 100
(45.0)
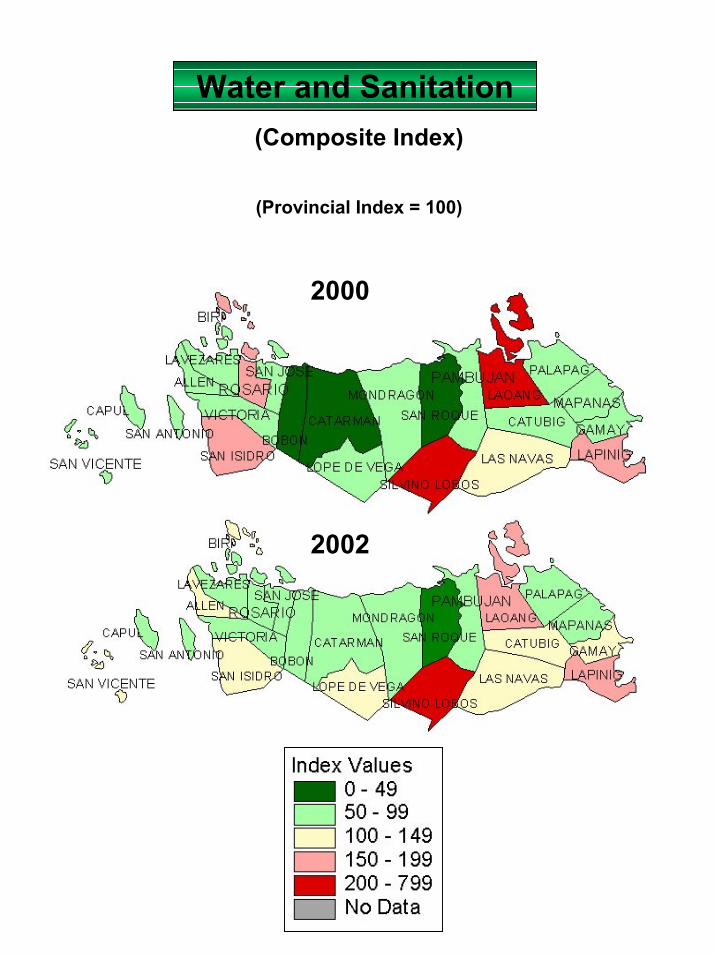
Water and Sanitation(Composite Index)
(Provincial Index = 100)
2000
2002
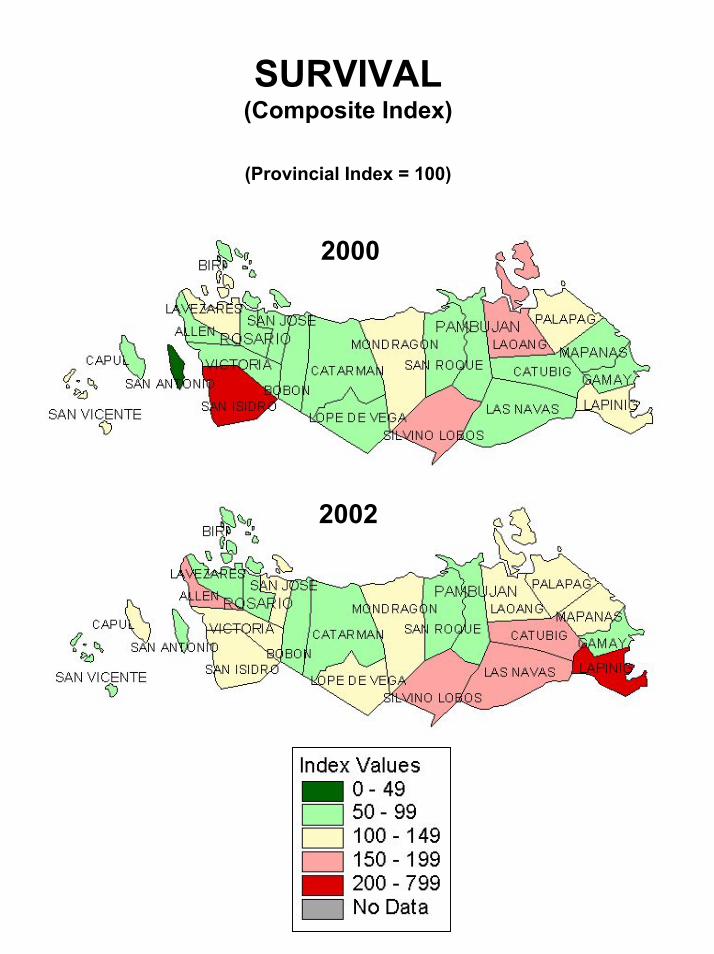
SURVIVAL(Composite Index)
(Provincial Index = 100)
2000
2002
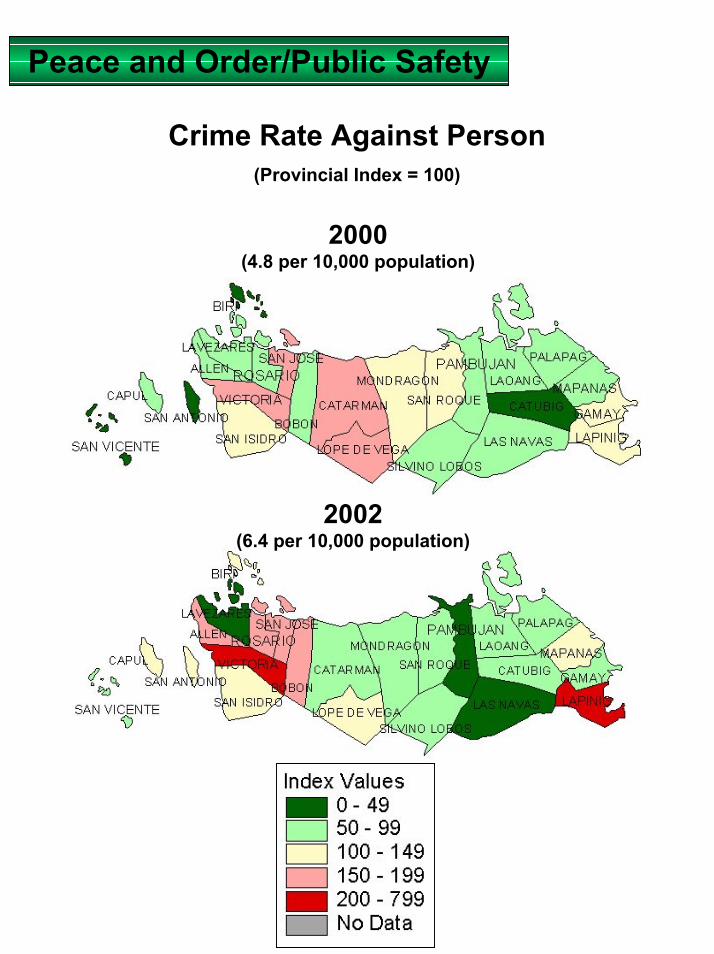
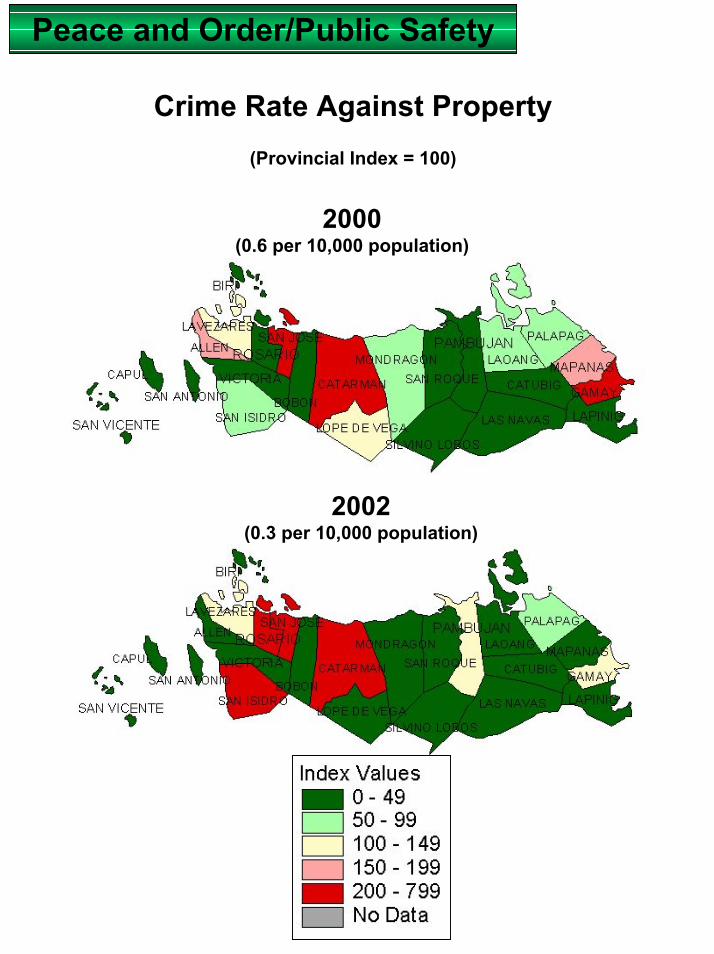
Peace and Order/Public Safety
Crime Rate Against Person(Provincial Index = 100)
2000(4.8 per 10,000 population)
2002(6.4 per 10,000 population)
Peace and Order/Public Safety
Crime Rate Against Property(Provincial Index = 100)
2000(0.6 per 10,000 population)
2002(0.3 per 10,000 population)
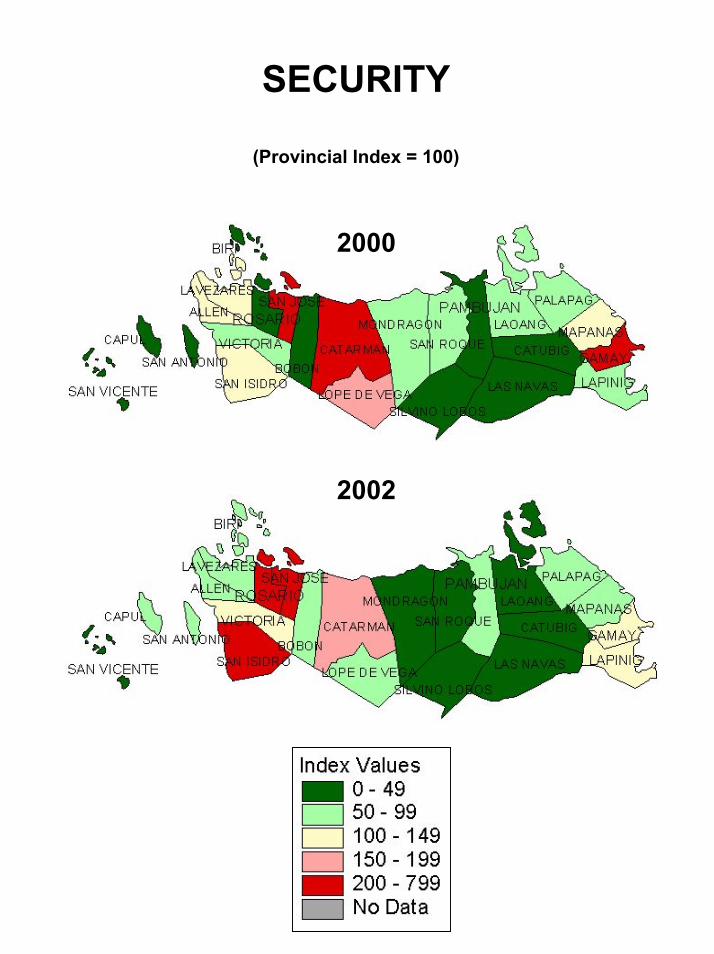
SECURITY
(Provincial Index = 100)
2000
2002
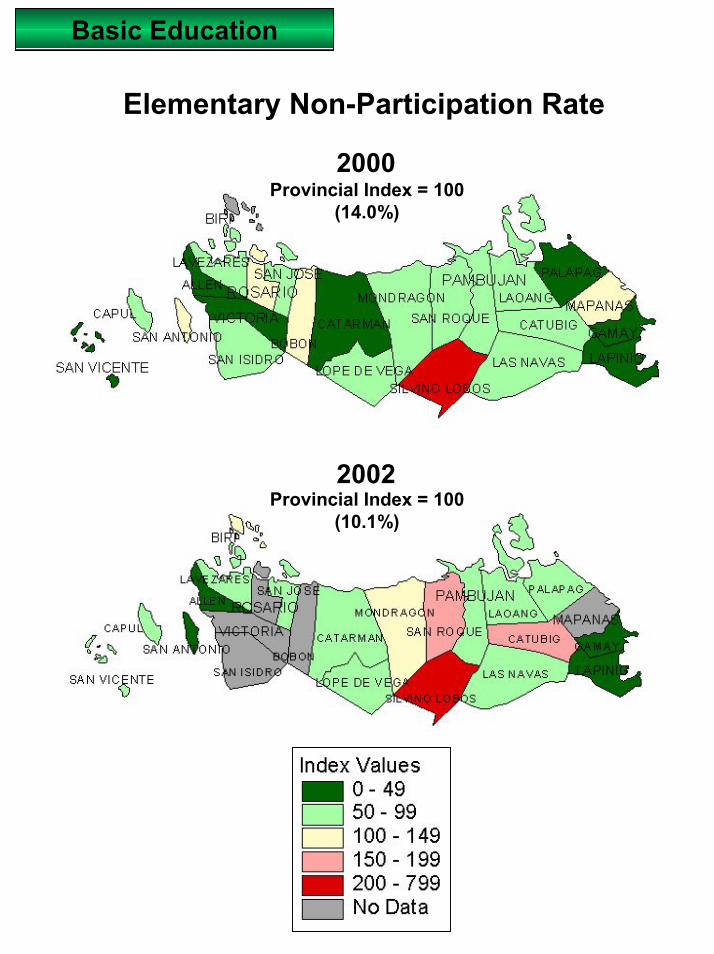
Basic Education
Elementary Non-Participation Rate
2000Provincial Index = 100
(14.0%)
2002Provincial Index = 100
(10.1%)

Basic Education
Elementary Non-Completion Rate
2000Provincial Index = 100
(39.1%)
2002Provincial Index = 100
(39.1%)
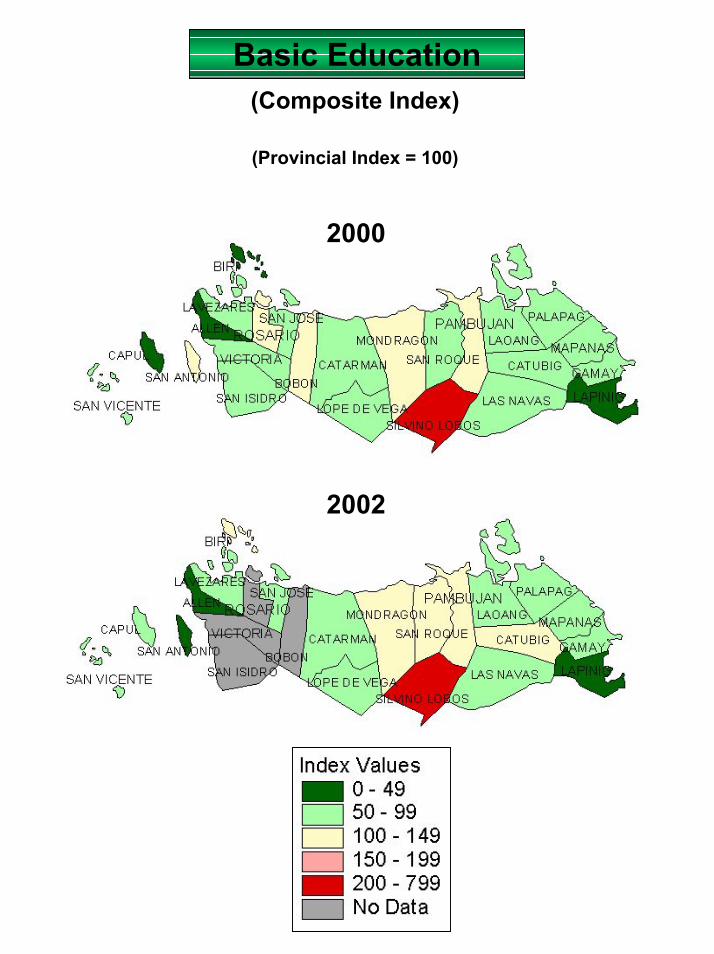
Basic Education(Composite Index)
(Provincial Index = 100)
2000
2002
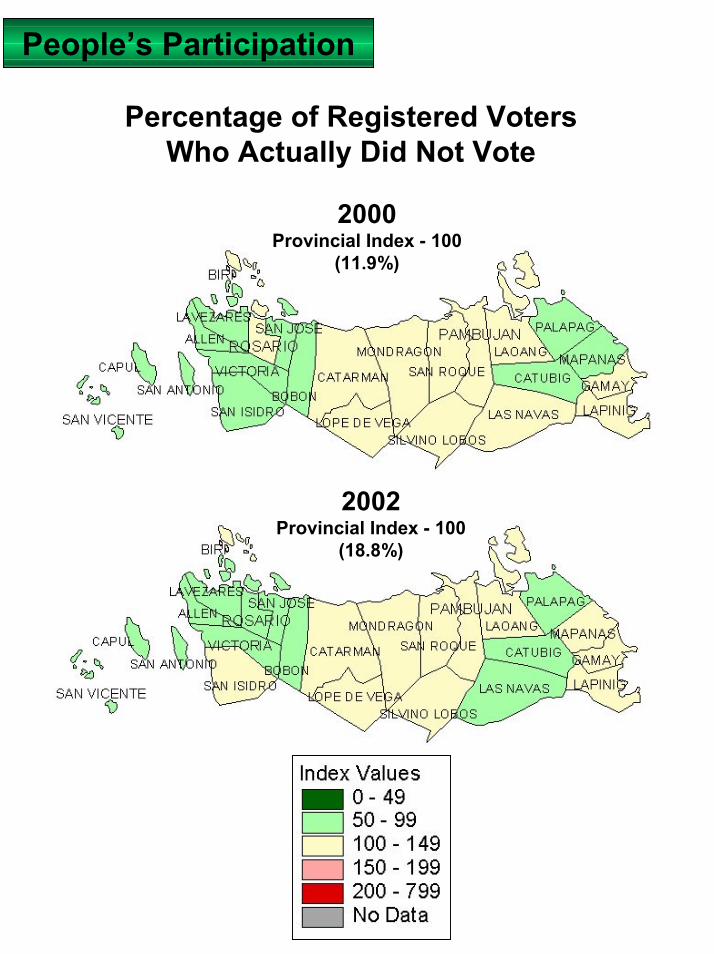
People’s Participation
Percentage of Registered VotersWho Actually Did Not Vote
2000Provincial Index - 100
(11.9%)
2002Provincial Index - 100
(18.8%)
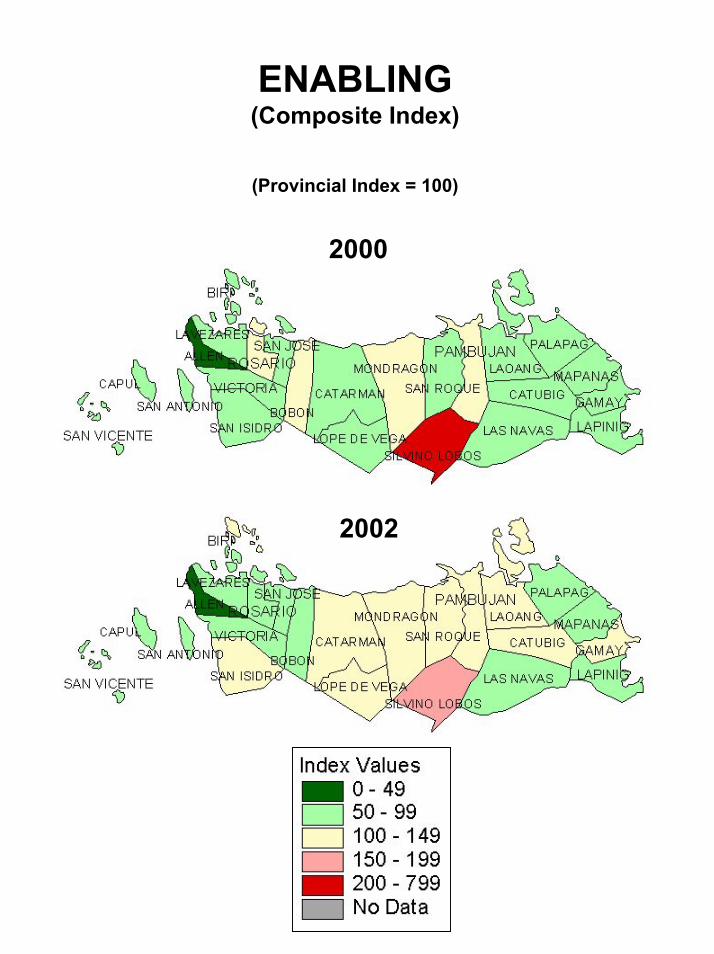
ENABLING(Composite Index)
(Provincial Index = 100)
2000
2002
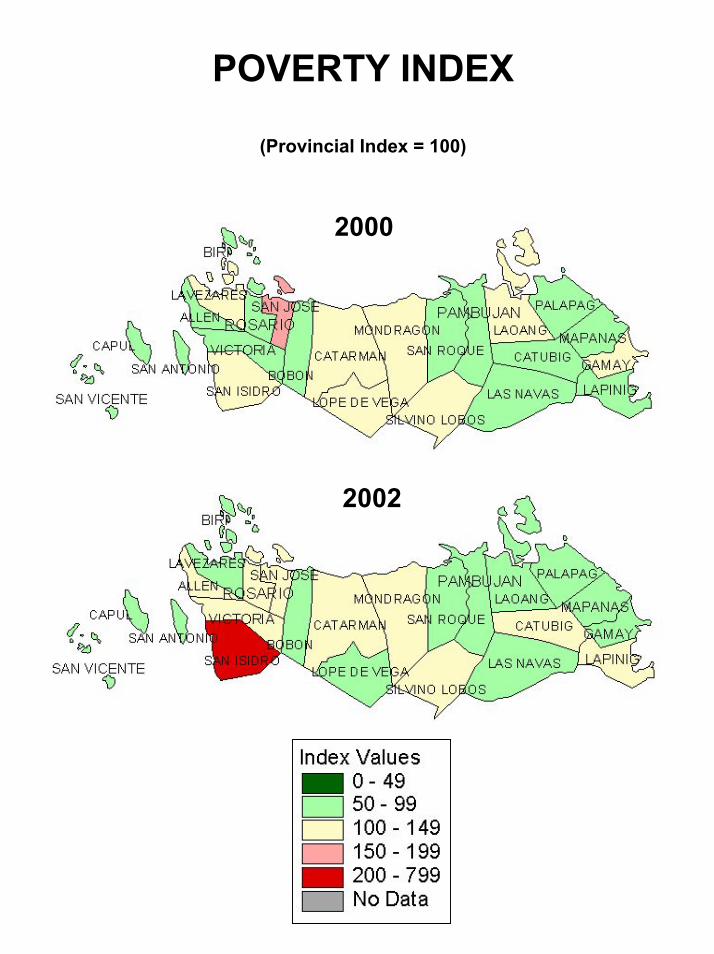
POVERTY INDEX
(Provincial Index = 100)
2000
2002
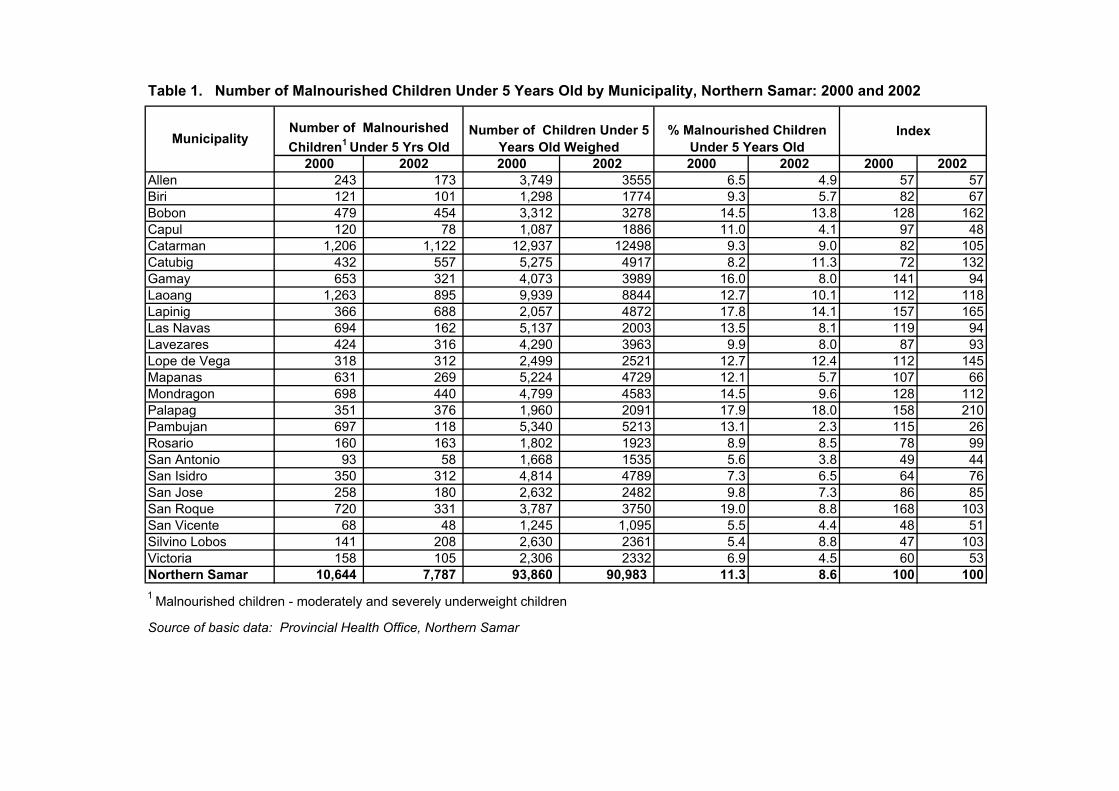
Table 1. Number of Malnourished Children Under 5 Years Old by Municipality, Northern Samar: 2000 and 2002
2000 2002 2000 2002 2000 2002 2000 2002Allen 243 173 3,749 3555 6.5 4.9 57 57Biri 121 101 1,298 1774 9.3 5.7 82 67Bobon 479 454 3,312 3278 14.5 13.8 128 162Capul 120 78 1,087 1886 11.0 4.1 97 48Catarman 1,206 1,122 12,937 12498 9.3 9.0 82 105Catubig 432 557 5,275 4917 8.2 11.3 72 132Gamay 653 321 4,073 3989 16.0 8.0 141 94Laoang 1,263 895 9,939 8844 12.7 10.1 112 118Lapinig 366 688 2,057 4872 17.8 14.1 157 165Las Navas 694 162 5,137 2003 13.5 8.1 119 94Lavezares 424 316 4,290 3963 9.9 8.0 87 93Lope de Vega 318 312 2,499 2521 12.7 12.4 112 145Mapanas 631 269 5,224 4729 12.1 5.7 107 66Mondragon 698 440 4,799 4583 14.5 9.6 128 112Palapag 351 376 1,960 2091 17.9 18.0 158 210Pambujan 697 118 5,340 5213 13.1 2.3 115 26Rosario 160 163 1,802 1923 8.9 8.5 78 99San Antonio 93 58 1,668 1535 5.6 3.8 49 44San Isidro 350 312 4,814 4789 7.3 6.5 64 76San Jose 258 180 2,632 2482 9.8 7.3 86 85San Roque 720 331 3,787 3750 19.0 8.8 168 103San Vicente 68 48 1,245 1,095 5.5 4.4 48 51Silvino Lobos 141 208 2,630 2361 5.4 8.8 47 103Victoria 158 105 2,306 2332 6.9 4.5 60 53Northern Samar 10,644 7,787 93,860 90,983 11.3 8.6 100 100
Source of basic data: Provincial Health Office, Northern Samar
1 Malnourished children - moderately and severely underweight children
Number of Children Under 5 Years Old WeighedMunicipality
Number of Malnourished Children1 Under 5 Yrs Old
Index% Malnourished Children Under 5 Years Old
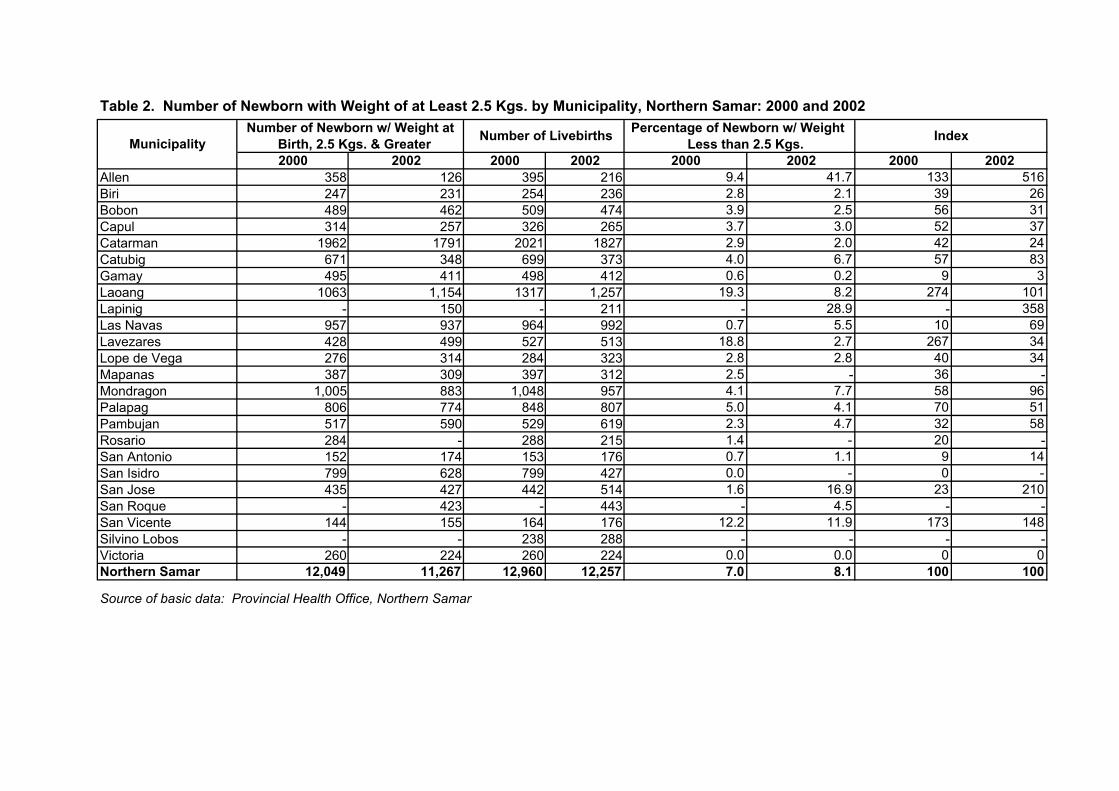
Table 2. Number of Newborn with Weight of at Least 2.5 Kgs. by Municipality, Northern Samar: 2000 and 2002
2000 2002 2000 2002 2000 2002 2000 2002Allen 358 126 395 216 9.4 41.7 133 516Biri 247 231 254 236 2.8 2.1 39 26Bobon 489 462 509 474 3.9 2.5 56 31Capul 314 257 326 265 3.7 3.0 52 37Catarman 1962 1791 2021 1827 2.9 2.0 42 24Catubig 671 348 699 373 4.0 6.7 57 83Gamay 495 411 498 412 0.6 0.2 9 3Laoang 1063 1,154 1317 1,257 19.3 8.2 274 101Lapinig - 150 - 211 - 28.9 - 358Las Navas 957 937 964 992 0.7 5.5 10 69Lavezares 428 499 527 513 18.8 2.7 267 34Lope de Vega 276 314 284 323 2.8 2.8 40 34Mapanas 387 309 397 312 2.5 - 36 -Mondragon 1,005 883 1,048 957 4.1 7.7 58 96Palapag 806 774 848 807 5.0 4.1 70 51Pambujan 517 590 529 619 2.3 4.7 32 58Rosario 284 - 288 215 1.4 - 20 -San Antonio 152 174 153 176 0.7 1.1 9 14San Isidro 799 628 799 427 0.0 - 0 -San Jose 435 427 442 514 1.6 16.9 23 210San Roque - 423 - 443 - 4.5 - -San Vicente 144 155 164 176 12.2 11.9 173 148Silvino Lobos - - 238 288 - - - -Victoria 260 224 260 224 0.0 0.0 0 0Northern Samar 12,049 11,267 12,960 12,257 7.0 8.1 100 100
Source of basic data: Provincial Health Office, Northern Samar
MunicipalityPercentage of Newborn w/ Weight
Less than 2.5 Kgs. IndexNumber of Newborn w/ Weight at Birth, 2.5 Kgs. & Greater Number of Livebirths
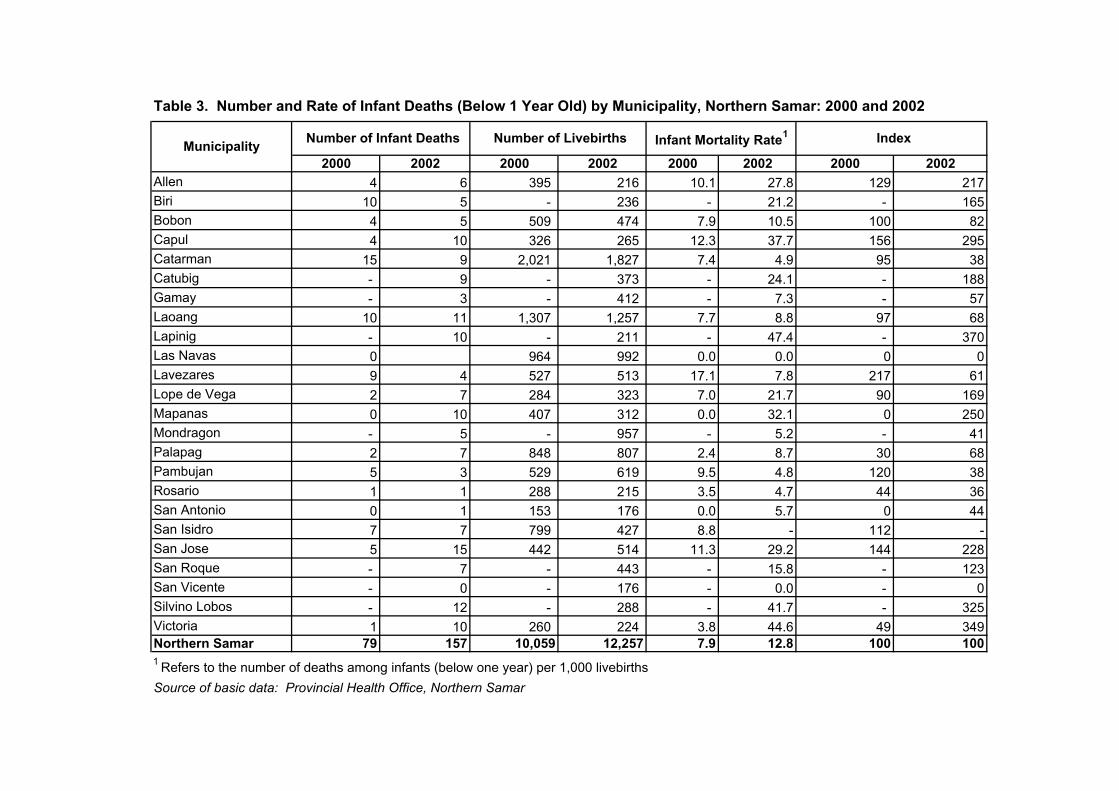
Table 3. Number and Rate of Infant Deaths (Below 1 Year Old) by Municipality, Northern Samar: 2000 and 2002
2000 2002 2000 2002 2000 2002 2000 2002Allen 4 6 395 216 10.1 27.8 129 217Biri 10 5 - 236 - 21.2 - 165Bobon 4 5 509 474 7.9 10.5 100 82Capul 4 10 326 265 12.3 37.7 156 295Catarman 15 9 2,021 1,827 7.4 4.9 95 38Catubig - 9 - 373 - 24.1 - 188Gamay - 3 - 412 - 7.3 - 57Laoang 10 11 1,307 1,257 7.7 8.8 97 68Lapinig - 10 - 211 - 47.4 - 370Las Navas 0 964 992 0.0 0.0 0 0Lavezares 9 4 527 513 17.1 7.8 217 61Lope de Vega 2 7 284 323 7.0 21.7 90 169Mapanas 0 10 407 312 0.0 32.1 0 250Mondragon - 5 - 957 - 5.2 - 41Palapag 2 7 848 807 2.4 8.7 30 68Pambujan 5 3 529 619 9.5 4.8 120 38Rosario 1 1 288 215 3.5 4.7 44 36San Antonio 0 1 153 176 0.0 5.7 0 44San Isidro 7 7 799 427 8.8 - 112 -San Jose 5 15 442 514 11.3 29.2 144 228San Roque - 7 - 443 - 15.8 - 123San Vicente - 0 - 176 - 0.0 - 0Silvino Lobos - 12 - 288 - 41.7 - 325Victoria 1 10 260 224 3.8 44.6 49 349Northern Samar 79 157 10,059 12,257 7.9 12.8 100 1001 Refers to the number of deaths among infants (below one year) per 1,000 livebirthsSource of basic data: Provincial Health Office, Northern Samar
IndexMunicipality Number of Infant Deaths Number of Livebirths Infant Mortality Rate1
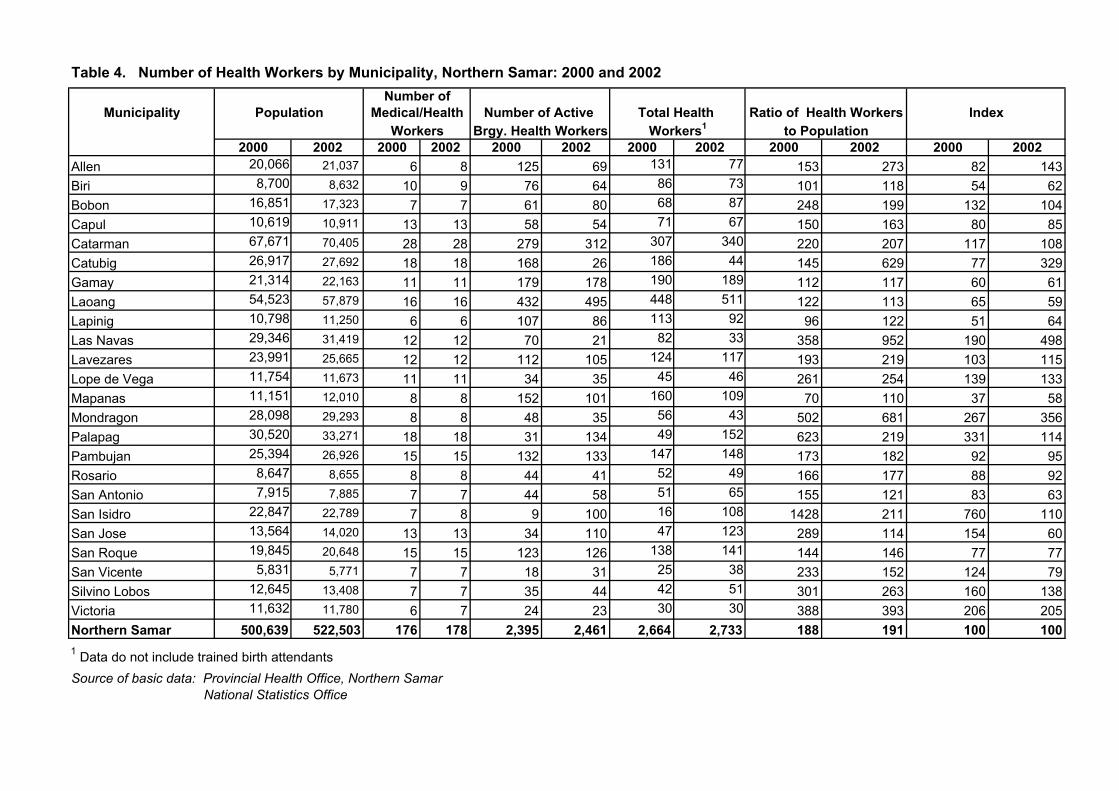
Table 4. Number of Health Workers by Municipality, Northern Samar: 2000 and 2002
Municipality
2000 2002 2000 2002 2000 2002 2000 2002 2000 2002 2000 2002Allen 20,066 21,037 6 8 125 69 131 77 153 273 82 143Biri 8,700 8,632 10 9 76 64 86 73 101 118 54 62Bobon 16,851 17,323 7 7 61 80 68 87 248 199 132 104Capul 10,619 10,911 13 13 58 54 71 67 150 163 80 85Catarman 67,671 70,405 28 28 279 312 307 340 220 207 117 108Catubig 26,917 27,692 18 18 168 26 186 44 145 629 77 329Gamay 21,314 22,163 11 11 179 178 190 189 112 117 60 61Laoang 54,523 57,879 16 16 432 495 448 511 122 113 65 59Lapinig 10,798 11,250 6 6 107 86 113 92 96 122 51 64Las Navas 29,346 31,419 12 12 70 21 82 33 358 952 190 498Lavezares 23,991 25,665 12 12 112 105 124 117 193 219 103 115Lope de Vega 11,754 11,673 11 11 34 35 45 46 261 254 139 133Mapanas 11,151 12,010 8 8 152 101 160 109 70 110 37 58Mondragon 28,098 29,293 8 8 48 35 56 43 502 681 267 356Palapag 30,520 33,271 18 18 31 134 49 152 623 219 331 114Pambujan 25,394 26,926 15 15 132 133 147 148 173 182 92 95Rosario 8,647 8,655 8 8 44 41 52 49 166 177 88 92San Antonio 7,915 7,885 7 7 44 58 51 65 155 121 83 63San Isidro 22,847 22,789 7 8 9 100 16 108 1428 211 760 110San Jose 13,564 14,020 13 13 34 110 47 123 289 114 154 60San Roque 19,845 20,648 15 15 123 126 138 141 144 146 77 77San Vicente 5,831 5,771 7 7 18 31 25 38 233 152 124 79Silvino Lobos 12,645 13,408 7 7 35 44 42 51 301 263 160 138Victoria 11,632 11,780 6 7 24 23 30 30 388 393 206 205Northern Samar 500,639 522,503 176 178 2,395 2,461 2,664 2,733 188 191 100 1001 Data do not include trained birth attendantsSource of basic data: Provincial Health Office, Northern Samar National Statistics Office
Brgy. Health WorkersWorkers
Number ofPopulation Medical/Health Number of Active Index
Workers1Ratio of Health WorkersTotal Health
to Population
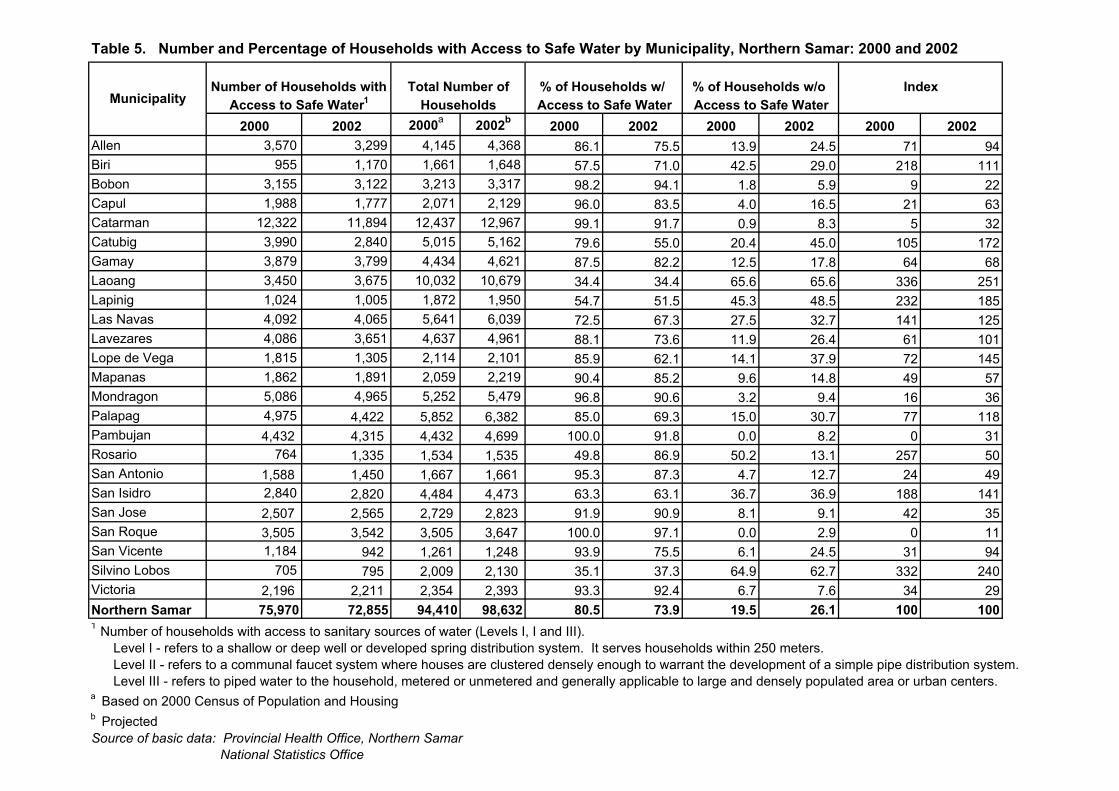
Table 5. Number and Percentage of Households with Access to Safe Water by Municipality, Northern Samar: 2000 and 2002
2000 2002 2000a 2002b 2000 2002 2000 2002 2000 2002Allen 3,570 3,299 4,145 4,368 86.1 75.5 13.9 24.5 71 94Biri 955 1,170 1,661 1,648 57.5 71.0 42.5 29.0 218 111Bobon 3,155 3,122 3,213 3,317 98.2 94.1 1.8 5.9 9 22Capul 1,988 1,777 2,071 2,129 96.0 83.5 4.0 16.5 21 63Catarman 12,322 11,894 12,437 12,967 99.1 91.7 0.9 8.3 5 32Catubig 3,990 2,840 5,015 5,162 79.6 55.0 20.4 45.0 105 172Gamay 3,879 3,799 4,434 4,621 87.5 82.2 12.5 17.8 64 68Laoang 3,450 3,675 10,032 10,679 34.4 34.4 65.6 65.6 336 251Lapinig 1,024 1,005 1,872 1,950 54.7 51.5 45.3 48.5 232 185Las Navas 4,092 4,065 5,641 6,039 72.5 67.3 27.5 32.7 141 125Lavezares 4,086 3,651 4,637 4,961 88.1 73.6 11.9 26.4 61 101Lope de Vega 1,815 1,305 2,114 2,101 85.9 62.1 14.1 37.9 72 145Mapanas 1,862 1,891 2,059 2,219 90.4 85.2 9.6 14.8 49 57Mondragon 5,086 4,965 5,252 5,479 96.8 90.6 3.2 9.4 16 36Palapag 4,975 4,422 5,852 6,382 85.0 69.3 15.0 30.7 77 118Pambujan 4,432 4,315 4,432 4,699 100.0 91.8 0.0 8.2 0 31Rosario 764 1,335 1,534 1,535 49.8 86.9 50.2 13.1 257 50San Antonio 1,588 1,450 1,667 1,661 95.3 87.3 4.7 12.7 24 49San Isidro 2,840 2,820 4,484 4,473 63.3 63.1 36.7 36.9 188 141San Jose 2,507 2,565 2,729 2,823 91.9 90.9 8.1 9.1 42 35San Roque 3,505 3,542 3,505 3,647 100.0 97.1 0.0 2.9 0 11San Vicente 1,184 942 1,261 1,248 93.9 75.5 6.1 24.5 31 94Silvino Lobos 705 795 2,009 2,130 35.1 37.3 64.9 62.7 332 240Victoria 2,196 2,211 2,354 2,393 93.3 92.4 6.7 7.6 34 29Northern Samar 75,970 72,855 94,410 98,632 80.5 73.9 19.5 26.1 100 1001 Number of households with access to sanitary sources of water (Levels I, I and III). Level I - refers to a shallow or deep well or developed spring distribution system. It serves households within 250 meters. Level II - refers to a communal faucet system where houses are clustered densely enough to warrant the development of a simple pipe distribution system. Level III - refers to piped water to the household, metered or unmetered and generally applicable to large and densely populated area or urban centers.a Based on 2000 Census of Population and Housingb ProjectedSource of basic data: Provincial Health Office, Northern Samar National Statistics Office
% of Households w/o Access to Safe WaterMunicipality Households Access to Safe Water
IndexNumber of Households withAccess to Safe Water1
% of Households w/ Total Number of
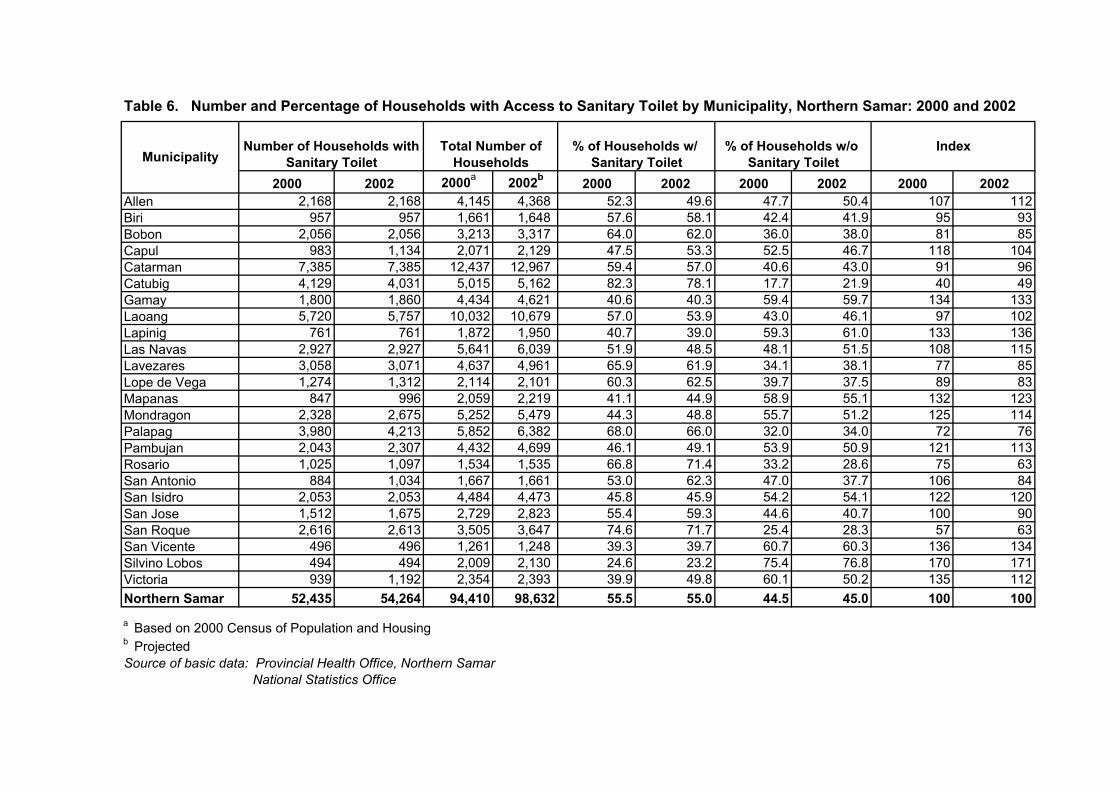
Table 6. Number and Percentage of Households with Access to Sanitary Toilet by Municipality, Northern Samar: 2000 and 2002
2000 2002 2000a 2002b 2000 2002 2000 2002 2000 2002Allen 2,168 2,168 4,145 4,368 52.3 49.6 47.7 50.4 107 112Biri 957 957 1,661 1,648 57.6 58.1 42.4 41.9 95 93Bobon 2,056 2,056 3,213 3,317 64.0 62.0 36.0 38.0 81 85Capul 983 1,134 2,071 2,129 47.5 53.3 52.5 46.7 118 104Catarman 7,385 7,385 12,437 12,967 59.4 57.0 40.6 43.0 91 96Catubig 4,129 4,031 5,015 5,162 82.3 78.1 17.7 21.9 40 49Gamay 1,800 1,860 4,434 4,621 40.6 40.3 59.4 59.7 134 133Laoang 5,720 5,757 10,032 10,679 57.0 53.9 43.0 46.1 97 102Lapinig 761 761 1,872 1,950 40.7 39.0 59.3 61.0 133 136Las Navas 2,927 2,927 5,641 6,039 51.9 48.5 48.1 51.5 108 115Lavezares 3,058 3,071 4,637 4,961 65.9 61.9 34.1 38.1 77 85Lope de Vega 1,274 1,312 2,114 2,101 60.3 62.5 39.7 37.5 89 83Mapanas 847 996 2,059 2,219 41.1 44.9 58.9 55.1 132 123Mondragon 2,328 2,675 5,252 5,479 44.3 48.8 55.7 51.2 125 114Palapag 3,980 4,213 5,852 6,382 68.0 66.0 32.0 34.0 72 76Pambujan 2,043 2,307 4,432 4,699 46.1 49.1 53.9 50.9 121 113Rosario 1,025 1,097 1,534 1,535 66.8 71.4 33.2 28.6 75 63San Antonio 884 1,034 1,667 1,661 53.0 62.3 47.0 37.7 106 84San Isidro 2,053 2,053 4,484 4,473 45.8 45.9 54.2 54.1 122 120San Jose 1,512 1,675 2,729 2,823 55.4 59.3 44.6 40.7 100 90San Roque 2,616 2,613 3,505 3,647 74.6 71.7 25.4 28.3 57 63San Vicente 496 496 1,261 1,248 39.3 39.7 60.7 60.3 136 134Silvino Lobos 494 494 2,009 2,130 24.6 23.2 75.4 76.8 170 171Victoria 939 1,192 2,354 2,393 39.9 49.8 60.1 50.2 135 112Northern Samar 52,435 54,264 94,410 98,632 55.5 55.0 44.5 45.0 100 100a Based on 2000 Census of Population and Housingb ProjectedSource of basic data: Provincial Health Office, Northern Samar National Statistics Office
IndexNumber of Households withSanitary Toilet
% of Households w/ Total Number of % of Households w/o Sanitary ToiletMunicipality Households Sanitary Toilet
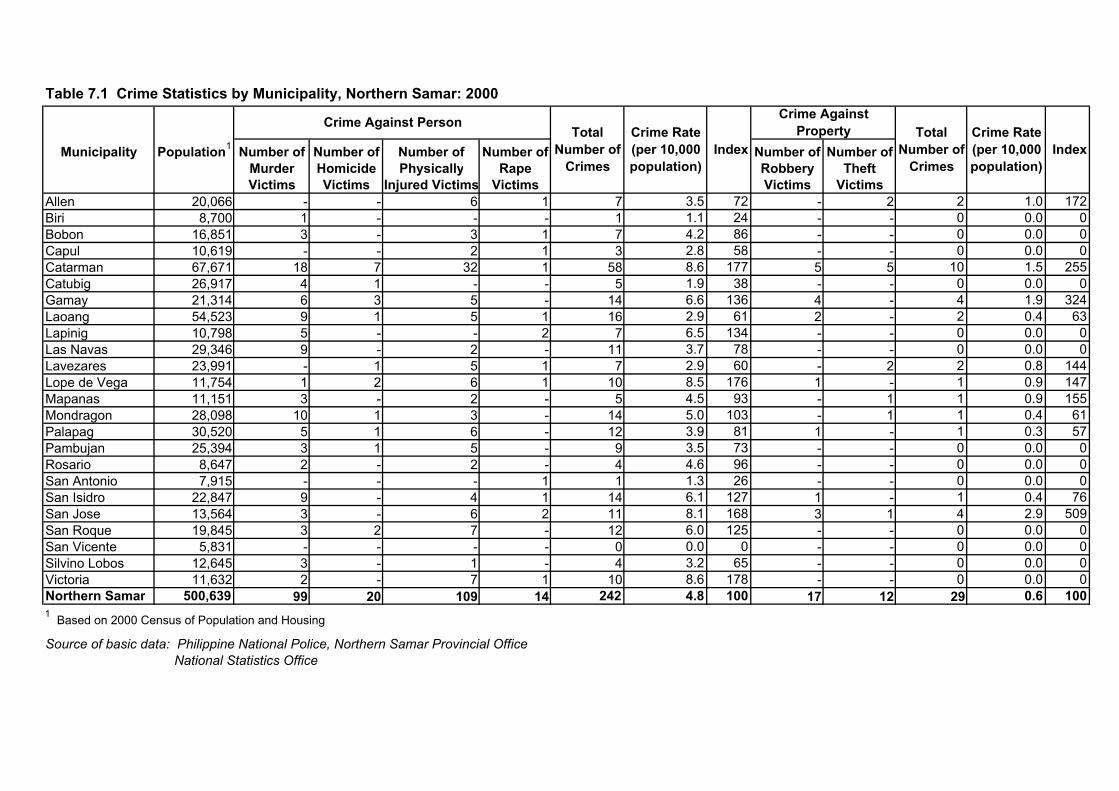
Table 7.1 Crime Statistics by Municipality, Northern Samar: 2000
Municipality Population1 Number of Number of Number of Number of Number of Number ofMurder Homicide Physically Rape Robbery TheftVictims Victims Injured Victims Victims Victims Victims
Allen 20,066 - - 6 1 7 3.5 72 - 2 2 1.0 172Biri 8,700 1 - - - 1 1.1 24 - - 0 0.0 0Bobon 16,851 3 - 3 1 7 4.2 86 - - 0 0.0 0Capul 10,619 - - 2 1 3 2.8 58 - - 0 0.0 0Catarman 67,671 18 7 32 1 58 8.6 177 5 5 10 1.5 255Catubig 26,917 4 1 - - 5 1.9 38 - - 0 0.0 0Gamay 21,314 6 3 5 - 14 6.6 136 4 - 4 1.9 324Laoang 54,523 9 1 5 1 16 2.9 61 2 - 2 0.4 63Lapinig 10,798 5 - - 2 7 6.5 134 - - 0 0.0 0Las Navas 29,346 9 - 2 - 11 3.7 78 - - 0 0.0 0Lavezares 23,991 - 1 5 1 7 2.9 60 - 2 2 0.8 144Lope de Vega 11,754 1 2 6 1 10 8.5 176 1 - 1 0.9 147Mapanas 11,151 3 - 2 - 5 4.5 93 - 1 1 0.9 155Mondragon 28,098 10 1 3 - 14 5.0 103 - 1 1 0.4 61Palapag 30,520 5 1 6 - 12 3.9 81 1 - 1 0.3 57Pambujan 25,394 3 1 5 - 9 3.5 73 - - 0 0.0 0Rosario 8,647 2 - 2 - 4 4.6 96 - - 0 0.0 0San Antonio 7,915 - - - 1 1 1.3 26 - - 0 0.0 0San Isidro 22,847 9 - 4 1 14 6.1 127 1 - 1 0.4 76San Jose 13,564 3 - 6 2 11 8.1 168 3 1 4 2.9 509San Roque 19,845 3 2 7 - 12 6.0 125 - - 0 0.0 0San Vicente 5,831 - - - - 0 0.0 0 - - 0 0.0 0Silvino Lobos 12,645 3 - 1 - 4 3.2 65 - - 0 0.0 0Victoria 11,632 2 - 7 1 10 8.6 178 - - 0 0.0 0Northern Samar 500,639 99 20 109 14 242 4.8 100 17 12 29 0.6 100
Source of basic data: Philippine National Police, Northern Samar Provincial Office National Statistics Office
1 Based on 2000 Census of Population and Housing
IndexCrime Rate (per 10,000 population)
Total Number of
Crimes
Crime Against Person Crime Against PropertyTotal
Number of Crimes
Crime Rate (per 10,000 population)
Index
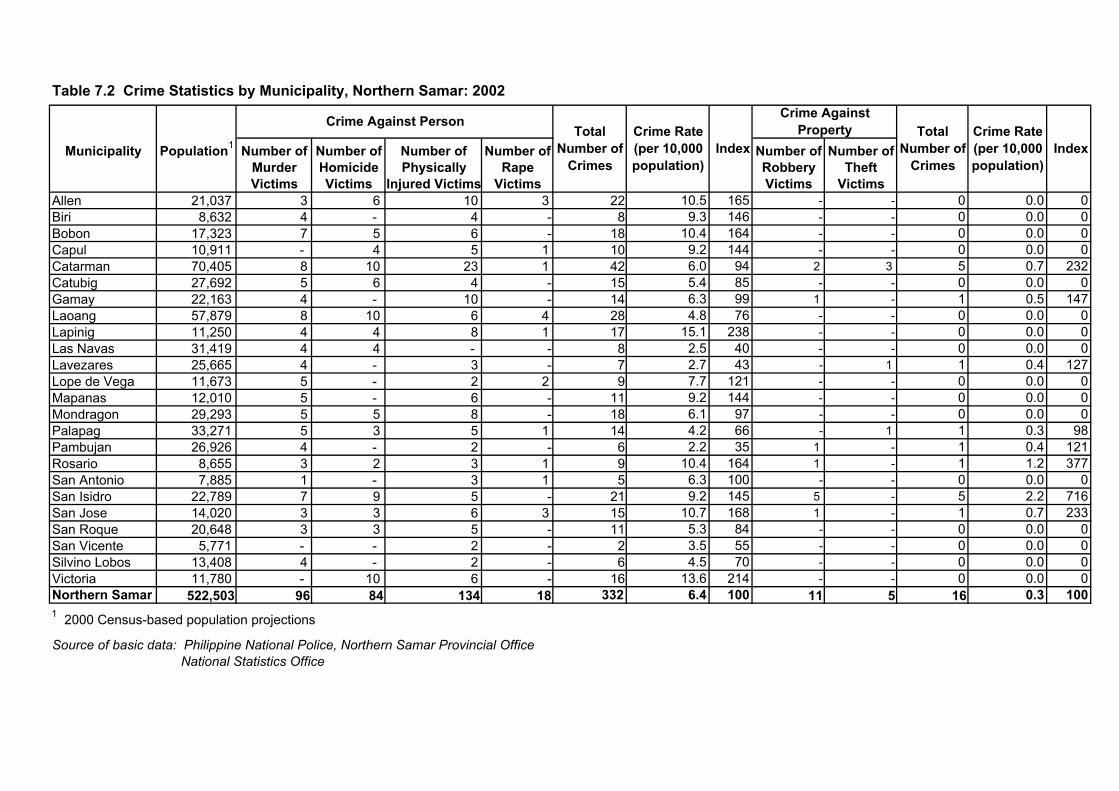
Table 7.2 Crime Statistics by Municipality, Northern Samar: 2002
Municipality Population1 Number of Number of Number of Number of Number of Number ofMurder Homicide Physically Rape Robbery TheftVictims Victims Injured Victims Victims Victims Victims
Allen 21,037 3 6 10 3 22 10.5 165 - - 0 0.0 0Biri 8,632 4 - 4 - 8 9.3 146 - - 0 0.0 0Bobon 17,323 7 5 6 - 18 10.4 164 - - 0 0.0 0Capul 10,911 - 4 5 1 10 9.2 144 - - 0 0.0 0Catarman 70,405 8 10 23 1 42 6.0 94 2 3 5 0.7 232Catubig 27,692 5 6 4 - 15 5.4 85 - - 0 0.0 0Gamay 22,163 4 - 10 - 14 6.3 99 1 - 1 0.5 147Laoang 57,879 8 10 6 4 28 4.8 76 - - 0 0.0 0Lapinig 11,250 4 4 8 1 17 15.1 238 - - 0 0.0 0Las Navas 31,419 4 4 - - 8 2.5 40 - - 0 0.0 0Lavezares 25,665 4 - 3 - 7 2.7 43 - 1 1 0.4 127Lope de Vega 11,673 5 - 2 2 9 7.7 121 - - 0 0.0 0Mapanas 12,010 5 - 6 - 11 9.2 144 - - 0 0.0 0Mondragon 29,293 5 5 8 - 18 6.1 97 - - 0 0.0 0Palapag 33,271 5 3 5 1 14 4.2 66 - 1 1 0.3 98Pambujan 26,926 4 - 2 - 6 2.2 35 1 - 1 0.4 121Rosario 8,655 3 2 3 1 9 10.4 164 1 - 1 1.2 377San Antonio 7,885 1 - 3 1 5 6.3 100 - - 0 0.0 0San Isidro 22,789 7 9 5 - 21 9.2 145 5 - 5 2.2 716San Jose 14,020 3 3 6 3 15 10.7 168 1 - 1 0.7 233San Roque 20,648 3 3 5 - 11 5.3 84 - - 0 0.0 0San Vicente 5,771 - - 2 - 2 3.5 55 - - 0 0.0 0Silvino Lobos 13,408 4 - 2 - 6 4.5 70 - - 0 0.0 0Victoria 11,780 - 10 6 - 16 13.6 214 - - 0 0.0 0Northern Samar 522,503 96 84 134 18 332 6.4 100 11 5 16 0.3 100
Source of basic data: Philippine National Police, Northern Samar Provincial Office National Statistics Office
1 2000 Census-based population projections
IndexCrime Rate (per 10,000 population)
Total Number of
Crimes
Crime Against Person Crime Against PropertyTotal
Number of Crimes
Crime Rate (per 10,000 population)
Index
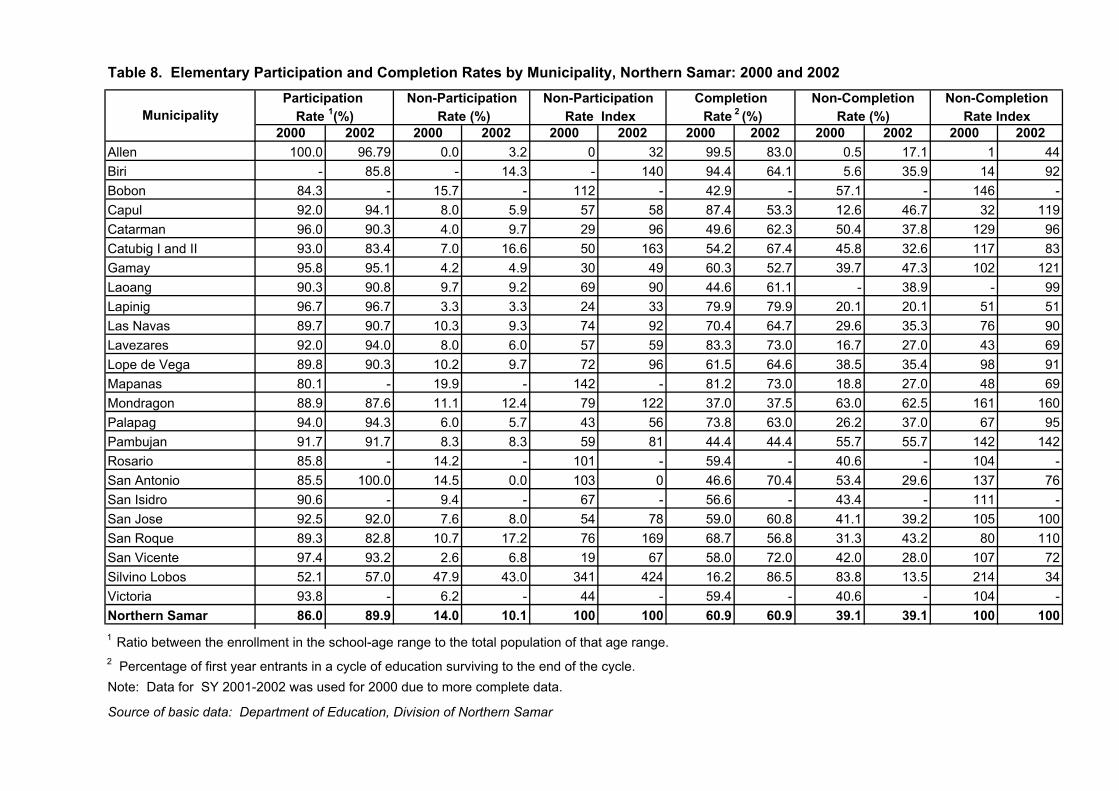
Table 8. Elementary Participation and Completion Rates by Municipality, Northern Samar: 2000 and 2002
2000 2002 2000 2002 2000 2002 2000 2002 2000 2002 2000 2002Allen 100.0 96.79 0.0 3.2 0 32 99.5 83.0 0.5 17.1 1 44Biri - 85.8 - 14.3 - 140 94.4 64.1 5.6 35.9 14 92Bobon 84.3 - 15.7 - 112 - 42.9 - 57.1 - 146 -Capul 92.0 94.1 8.0 5.9 57 58 87.4 53.3 12.6 46.7 32 119Catarman 96.0 90.3 4.0 9.7 29 96 49.6 62.3 50.4 37.8 129 96Catubig I and II 93.0 83.4 7.0 16.6 50 163 54.2 67.4 45.8 32.6 117 83Gamay 95.8 95.1 4.2 4.9 30 49 60.3 52.7 39.7 47.3 102 121Laoang 90.3 90.8 9.7 9.2 69 90 44.6 61.1 - 38.9 - 99Lapinig 96.7 96.7 3.3 3.3 24 33 79.9 79.9 20.1 20.1 51 51Las Navas 89.7 90.7 10.3 9.3 74 92 70.4 64.7 29.6 35.3 76 90Lavezares 92.0 94.0 8.0 6.0 57 59 83.3 73.0 16.7 27.0 43 69Lope de Vega 89.8 90.3 10.2 9.7 72 96 61.5 64.6 38.5 35.4 98 91Mapanas 80.1 - 19.9 - 142 - 81.2 73.0 18.8 27.0 48 69Mondragon 88.9 87.6 11.1 12.4 79 122 37.0 37.5 63.0 62.5 161 160Palapag 94.0 94.3 6.0 5.7 43 56 73.8 63.0 26.2 37.0 67 95Pambujan 91.7 91.7 8.3 8.3 59 81 44.4 44.4 55.7 55.7 142 142Rosario 85.8 - 14.2 - 101 - 59.4 - 40.6 - 104 -San Antonio 85.5 100.0 14.5 0.0 103 0 46.6 70.4 53.4 29.6 137 76San Isidro 90.6 - 9.4 - 67 - 56.6 - 43.4 - 111 -San Jose 92.5 92.0 7.6 8.0 54 78 59.0 60.8 41.1 39.2 105 100San Roque 89.3 82.8 10.7 17.2 76 169 68.7 56.8 31.3 43.2 80 110San Vicente 97.4 93.2 2.6 6.8 19 67 58.0 72.0 42.0 28.0 107 72Silvino Lobos 52.1 57.0 47.9 43.0 341 424 16.2 86.5 83.8 13.5 214 34Victoria 93.8 - 6.2 - 44 - 59.4 - 40.6 - 104 -Northern Samar 86.0 89.9 14.0 10.1 100 100 60.9 60.9 39.1 39.1 100 1001 Ratio between the enrollment in the school-age range to the total population of that age range.2 Percentage of first year entrants in a cycle of education surviving to the end of the cycle.Note: Data for SY 2001-2002 was used for 2000 due to more complete data.
Source of basic data: Department of Education, Division of Northern Samar
Non-CompletionRate Index
Non-CompletionNon-ParticipationRate (%) Rate IndexRate 1(%)Municipality Rate 2 (%) Rate (%)
Participation CompletionNon-Participation
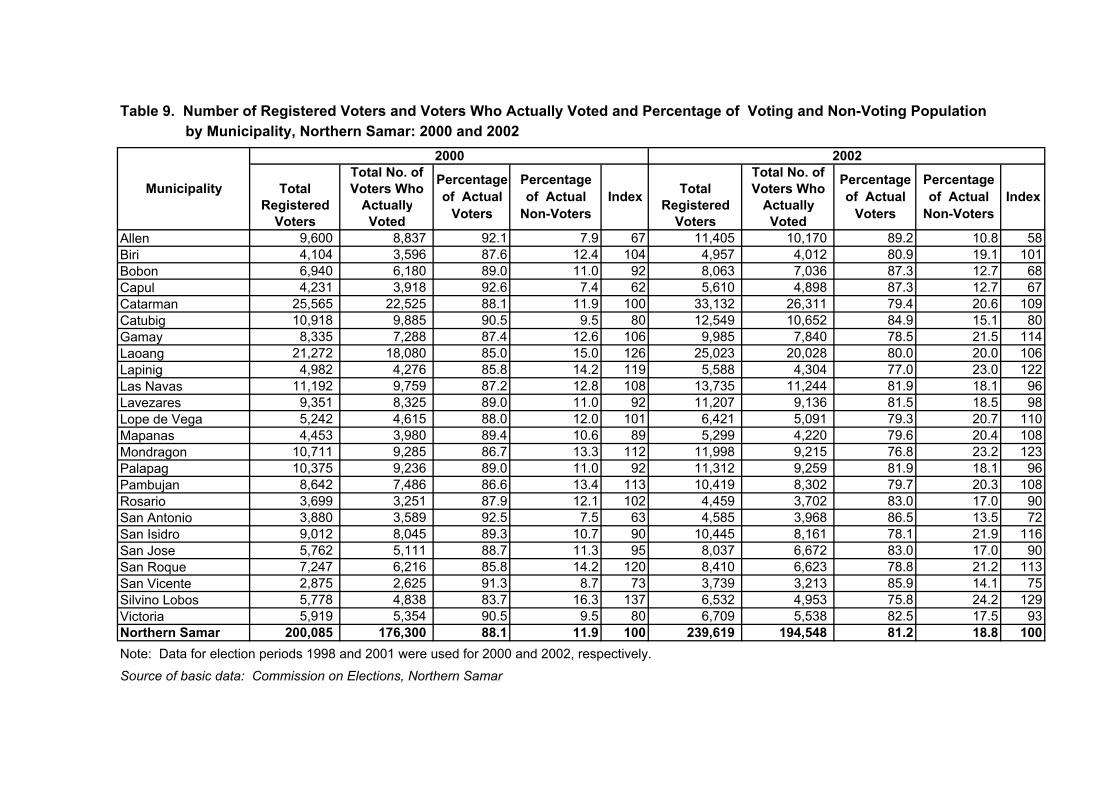
Table 9. Number of Registered Voters and Voters Who Actually Voted and Percentage of Voting and Non-Voting Population
Total No. of Total No. ofTotal Voters Who Total Voters Who
Registered Actually Registered ActuallyVoters Voted Voters Voted
Allen 9,600 8,837 92.1 7.9 67 11,405 10,170 89.2 10.8 58Biri 4,104 3,596 87.6 12.4 104 4,957 4,012 80.9 19.1 101Bobon 6,940 6,180 89.0 11.0 92 8,063 7,036 87.3 12.7 68Capul 4,231 3,918 92.6 7.4 62 5,610 4,898 87.3 12.7 67Catarman 25,565 22,525 88.1 11.9 100 33,132 26,311 79.4 20.6 109Catubig 10,918 9,885 90.5 9.5 80 12,549 10,652 84.9 15.1 80Gamay 8,335 7,288 87.4 12.6 106 9,985 7,840 78.5 21.5 114Laoang 21,272 18,080 85.0 15.0 126 25,023 20,028 80.0 20.0 106Lapinig 4,982 4,276 85.8 14.2 119 5,588 4,304 77.0 23.0 122Las Navas 11,192 9,759 87.2 12.8 108 13,735 11,244 81.9 18.1 96Lavezares 9,351 8,325 89.0 11.0 92 11,207 9,136 81.5 18.5 98Lope de Vega 5,242 4,615 88.0 12.0 101 6,421 5,091 79.3 20.7 110Mapanas 4,453 3,980 89.4 10.6 89 5,299 4,220 79.6 20.4 108Mondragon 10,711 9,285 86.7 13.3 112 11,998 9,215 76.8 23.2 123Palapag 10,375 9,236 89.0 11.0 92 11,312 9,259 81.9 18.1 96Pambujan 8,642 7,486 86.6 13.4 113 10,419 8,302 79.7 20.3 108Rosario 3,699 3,251 87.9 12.1 102 4,459 3,702 83.0 17.0 90San Antonio 3,880 3,589 92.5 7.5 63 4,585 3,968 86.5 13.5 72San Isidro 9,012 8,045 89.3 10.7 90 10,445 8,161 78.1 21.9 116San Jose 5,762 5,111 88.7 11.3 95 8,037 6,672 83.0 17.0 90San Roque 7,247 6,216 85.8 14.2 120 8,410 6,623 78.8 21.2 113San Vicente 2,875 2,625 91.3 8.7 73 3,739 3,213 85.9 14.1 75Silvino Lobos 5,778 4,838 83.7 16.3 137 6,532 4,953 75.8 24.2 129Victoria 5,919 5,354 90.5 9.5 80 6,709 5,538 82.5 17.5 93Northern Samar 200,085 176,300 88.1 11.9 100 239,619 194,548 81.2 18.8 100Note: Data for election periods 1998 and 2001 were used for 2000 and 2002, respectively.Source of basic data: Commission on Elections, Northern Samar
Municipality
2000
by Municipality, Northern Samar: 2000 and 20022002
Percentage of Actual
Voters
Percentage of Actual
Non-VotersIndex
Percentage of Actual
Voters
Percentage of Actual
Non-VotersIndex
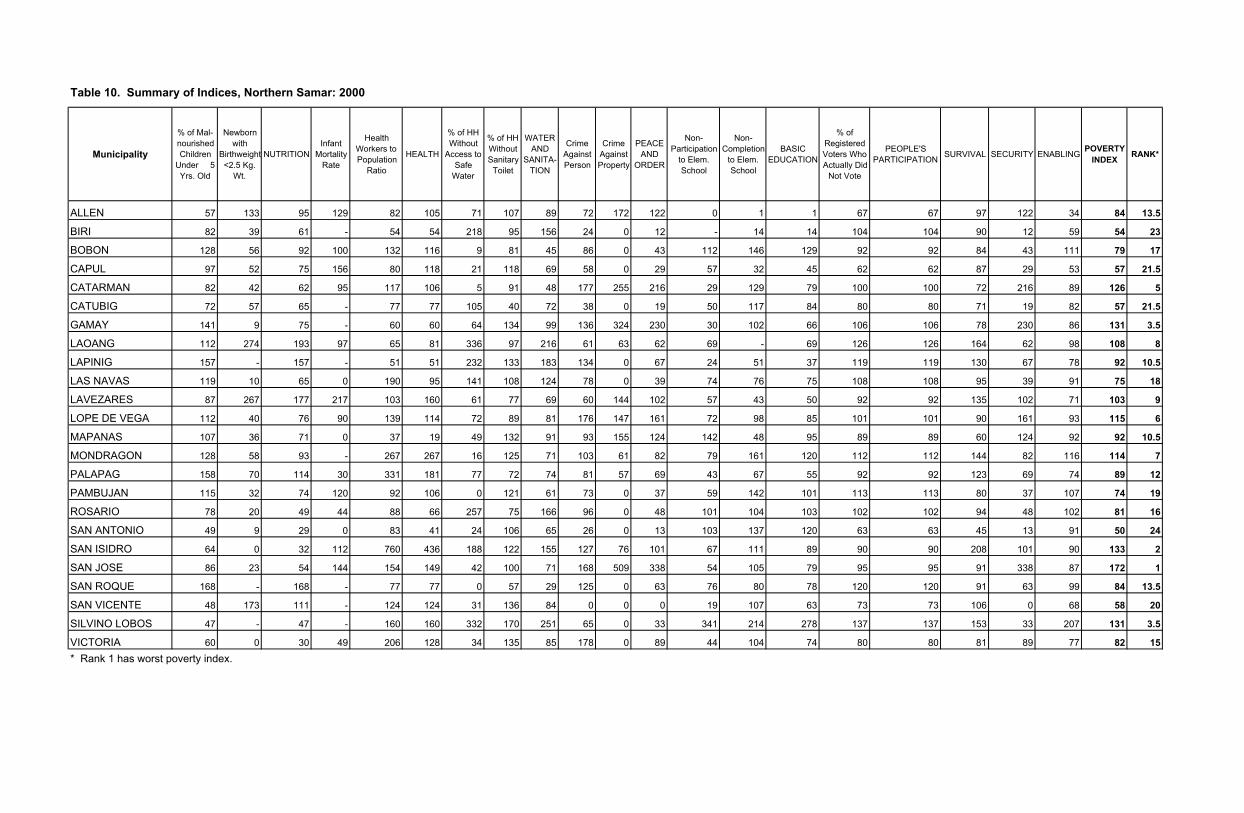
Table 10. Summary of Indices, Northern Samar: 2000
Municipality
% of Mal- nourished Children
Under 5 Yrs. Old
Newborn with
Birthweight<2.5 Kg.
Wt.
NUTRITIONInfant
Mortality Rate
Health Workers to Population
Ratio
HEALTH
% of HH Without
Access to Safe
Water
% of HH Without Sanitary
Toilet
WATER AND
SANITA-TION
Crime Against Person
Crime Against Property
PEACE AND
ORDER
Non-Participation
to Elem. School
Non-Completion
to Elem. School
BASIC EDUCATION
% of Registered Voters Who Actually Did
Not Vote
PEOPLE'S PARTICIPATION SURVIVAL SECURITY ENABLING POVERTY
INDEX RANK*
ALLEN 57 133 95 129 82 105 71 107 89 72 172 122 0 1 1 67 67 97 122 34 84 13.5
BIRI 82 39 61 - 54 54 218 95 156 24 0 12 - 14 14 104 104 90 12 59 54 23
BOBON 128 56 92 100 132 116 9 81 45 86 0 43 112 146 129 92 92 84 43 111 79 17
CAPUL 97 52 75 156 80 118 21 118 69 58 0 29 57 32 45 62 62 87 29 53 57 21.5
CATARMAN 82 42 62 95 117 106 5 91 48 177 255 216 29 129 79 100 100 72 216 89 126 5
CATUBIG 72 57 65 - 77 77 105 40 72 38 0 19 50 117 84 80 80 71 19 82 57 21.5
GAMAY 141 9 75 - 60 60 64 134 99 136 324 230 30 102 66 106 106 78 230 86 131 3.5
LAOANG 112 274 193 97 65 81 336 97 216 61 63 62 69 - 69 126 126 164 62 98 108 8
LAPINIG 157 - 157 - 51 51 232 133 183 134 0 67 24 51 37 119 119 130 67 78 92 10.5
LAS NAVAS 119 10 65 0 190 95 141 108 124 78 0 39 74 76 75 108 108 95 39 91 75 18
LAVEZARES 87 267 177 217 103 160 61 77 69 60 144 102 57 43 50 92 92 135 102 71 103 9
LOPE DE VEGA 112 40 76 90 139 114 72 89 81 176 147 161 72 98 85 101 101 90 161 93 115 6
MAPANAS 107 36 71 0 37 19 49 132 91 93 155 124 142 48 95 89 89 60 124 92 92 10.5
MONDRAGON 128 58 93 - 267 267 16 125 71 103 61 82 79 161 120 112 112 144 82 116 114 7
PALAPAG 158 70 114 30 331 181 77 72 74 81 57 69 43 67 55 92 92 123 69 74 89 12
PAMBUJAN 115 32 74 120 92 106 0 121 61 73 0 37 59 142 101 113 113 80 37 107 74 19
ROSARIO 78 20 49 44 88 66 257 75 166 96 0 48 101 104 103 102 102 94 48 102 81 16
SAN ANTONIO 49 9 29 0 83 41 24 106 65 26 0 13 103 137 120 63 63 45 13 91 50 24
SAN ISIDRO 64 0 32 112 760 436 188 122 155 127 76 101 67 111 89 90 90 208 101 90 133 2
SAN JOSE 86 23 54 144 154 149 42 100 71 168 509 338 54 105 79 95 95 91 338 87 172 1
SAN ROQUE 168 - 168 - 77 77 0 57 29 125 0 63 76 80 78 120 120 91 63 99 84 13.5
SAN VICENTE 48 173 111 - 124 124 31 136 84 0 0 0 19 107 63 73 73 106 0 68 58 20
SILVINO LOBOS 47 - 47 - 160 160 332 170 251 65 0 33 341 214 278 137 137 153 33 207 131 3.5
VICTORIA 60 0 30 49 206 128 34 135 85 178 0 89 44 104 74 80 80 81 89 77 82 15* Rank 1 has worst poverty index.
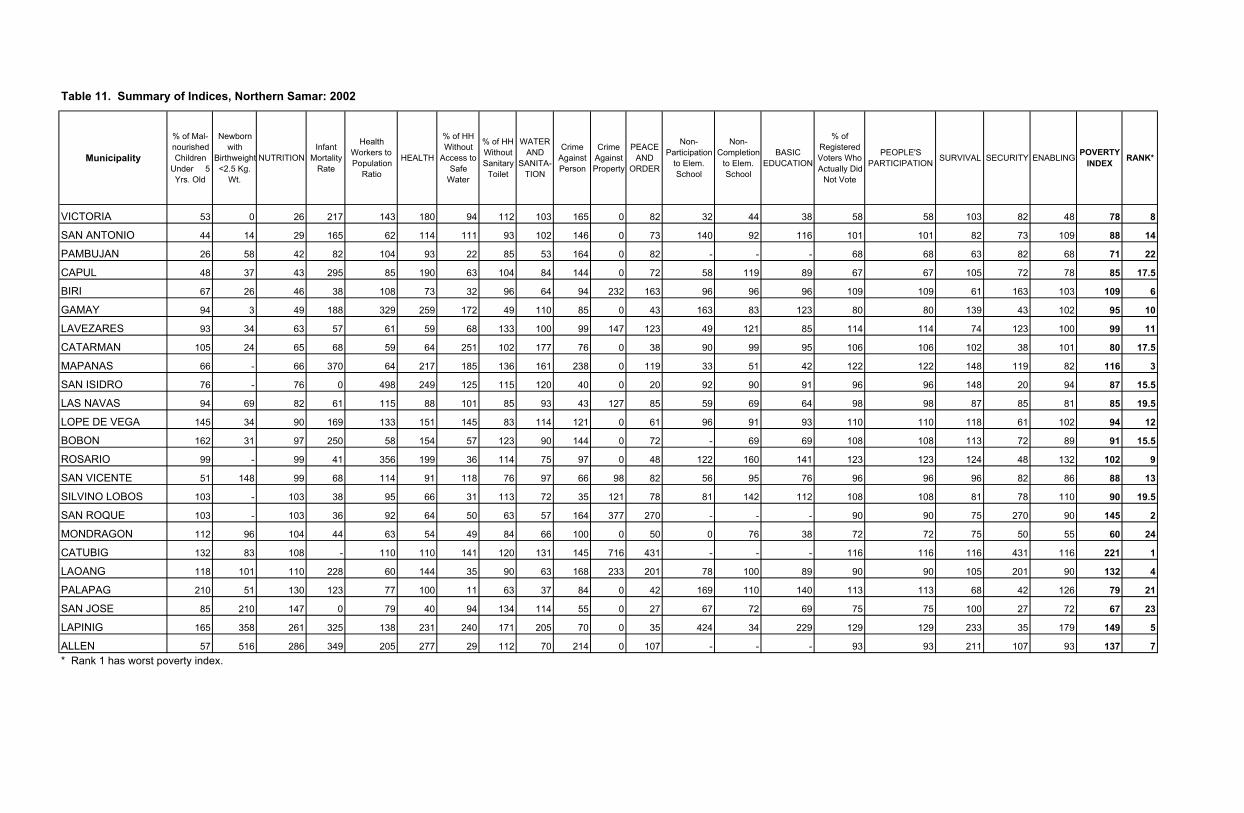
Table 11. Summary of Indices, Northern Samar: 2002
Municipality
% of Mal- nourished Children
Under 5 Yrs. Old
Newborn with
Birthweight<2.5 Kg.
Wt.
NUTRITIONInfant
Mortality Rate
Health Workers to Population
Ratio
HEALTH
% of HH Without
Access to Safe
Water
% of HH Without Sanitary
Toilet
WATER AND
SANITA-TION
Crime Against Person
Crime Against Property
PEACE AND
ORDER
Non-Participation
to Elem. School
Non-Completion
to Elem. School
BASIC EDUCATION
% of Registered Voters Who Actually Did
Not Vote
PEOPLE'S PARTICIPATION SURVIVAL SECURITY ENABLING POVERTY
INDEX RANK*
VICTORIA 53 0 26 217 143 180 94 112 103 165 0 82 32 44 38 58 58 103 82 48 78 8
SAN ANTONIO 44 14 29 165 62 114 111 93 102 146 0 73 140 92 116 101 101 82 73 109 88 14
PAMBUJAN 26 58 42 82 104 93 22 85 53 164 0 82 - - - 68 68 63 82 68 71 22
CAPUL 48 37 43 295 85 190 63 104 84 144 0 72 58 119 89 67 67 105 72 78 85 17.5
BIRI 67 26 46 38 108 73 32 96 64 94 232 163 96 96 96 109 109 61 163 103 109 6
GAMAY 94 3 49 188 329 259 172 49 110 85 0 43 163 83 123 80 80 139 43 102 95 10
LAVEZARES 93 34 63 57 61 59 68 133 100 99 147 123 49 121 85 114 114 74 123 100 99 11
CATARMAN 105 24 65 68 59 64 251 102 177 76 0 38 90 99 95 106 106 102 38 101 80 17.5
MAPANAS 66 - 66 370 64 217 185 136 161 238 0 119 33 51 42 122 122 148 119 82 116 3
SAN ISIDRO 76 - 76 0 498 249 125 115 120 40 0 20 92 90 91 96 96 148 20 94 87 15.5
LAS NAVAS 94 69 82 61 115 88 101 85 93 43 127 85 59 69 64 98 98 87 85 81 85 19.5
LOPE DE VEGA 145 34 90 169 133 151 145 83 114 121 0 61 96 91 93 110 110 118 61 102 94 12
BOBON 162 31 97 250 58 154 57 123 90 144 0 72 - 69 69 108 108 113 72 89 91 15.5
ROSARIO 99 - 99 41 356 199 36 114 75 97 0 48 122 160 141 123 123 124 48 132 102 9
SAN VICENTE 51 148 99 68 114 91 118 76 97 66 98 82 56 95 76 96 96 96 82 86 88 13
SILVINO LOBOS 103 - 103 38 95 66 31 113 72 35 121 78 81 142 112 108 108 81 78 110 90 19.5
SAN ROQUE 103 - 103 36 92 64 50 63 57 164 377 270 - - - 90 90 75 270 90 145 2
MONDRAGON 112 96 104 44 63 54 49 84 66 100 0 50 0 76 38 72 72 75 50 55 60 24
CATUBIG 132 83 108 - 110 110 141 120 131 145 716 431 - - - 116 116 116 431 116 221 1
LAOANG 118 101 110 228 60 144 35 90 63 168 233 201 78 100 89 90 90 105 201 90 132 4
PALAPAG 210 51 130 123 77 100 11 63 37 84 0 42 169 110 140 113 113 68 42 126 79 21
SAN JOSE 85 210 147 0 79 40 94 134 114 55 0 27 67 72 69 75 75 100 27 72 67 23
LAPINIG 165 358 261 325 138 231 240 171 205 70 0 35 424 34 229 129 129 233 35 179 149 5
ALLEN 57 516 286 349 205 277 29 112 70 214 0 107 - - - 93 93 211 107 93 137 7* Rank 1 has worst poverty index.
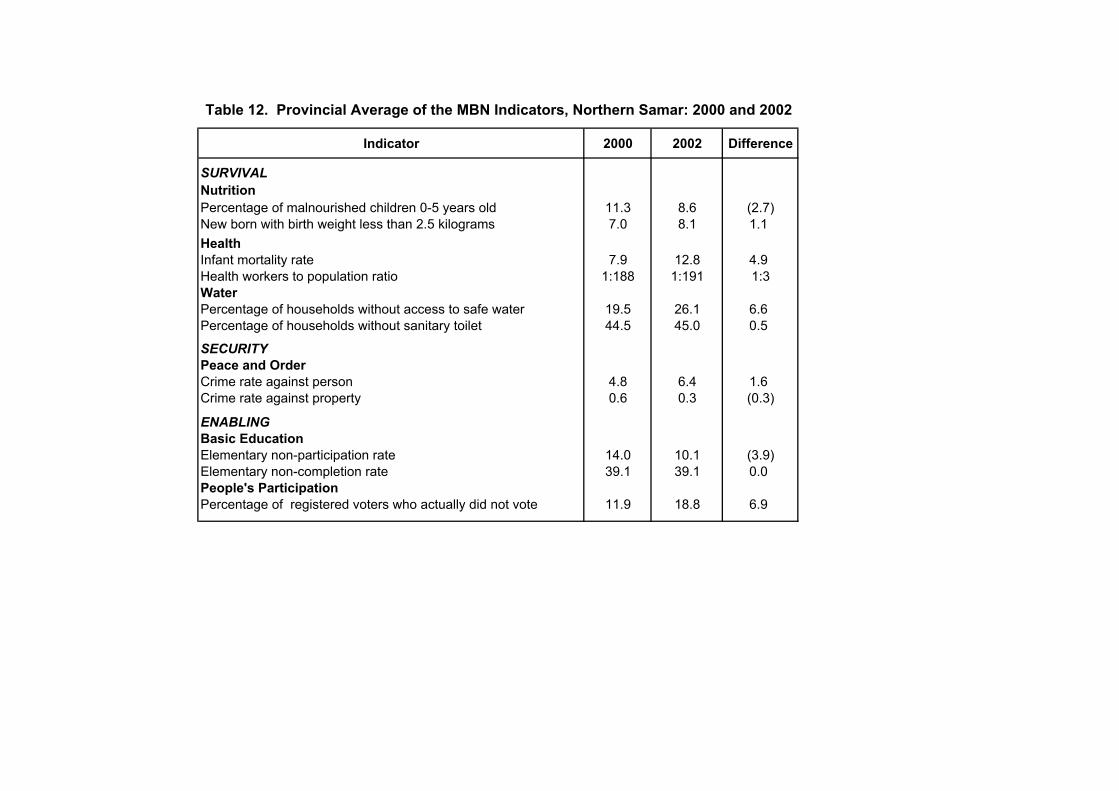
Indicator 2000 2002 Difference
SURVIVALNutritionPercentage of malnourished children 0-5 years old 11.3 8.6 (2.7)New born with birth weight less than 2.5 kilograms 7.0 8.1 1.1HealthInfant mortality rate 7.9 12.8 4.9Health workers to population ratio 1:188 1:191 1:3WaterPercentage of households without access to safe water 19.5 26.1 6.6Percentage of households without sanitary toilet 44.5 45.0 0.5
SECURITYPeace and OrderCrime rate against person 4.8 6.4 1.6Crime rate against property 0.6 0.3 (0.3)
ENABLINGBasic EducationElementary non-participation rate 14.0 10.1 (3.9)Elementary non-completion rate 39.1 39.1 0.0People's ParticipationPercentage of registered voters who actually did not vote 11.9 18.8 6.9
Table 12. Provincial Average of the MBN Indicators, Northern Samar: 2000 and 2002
HIGHLIGHTS
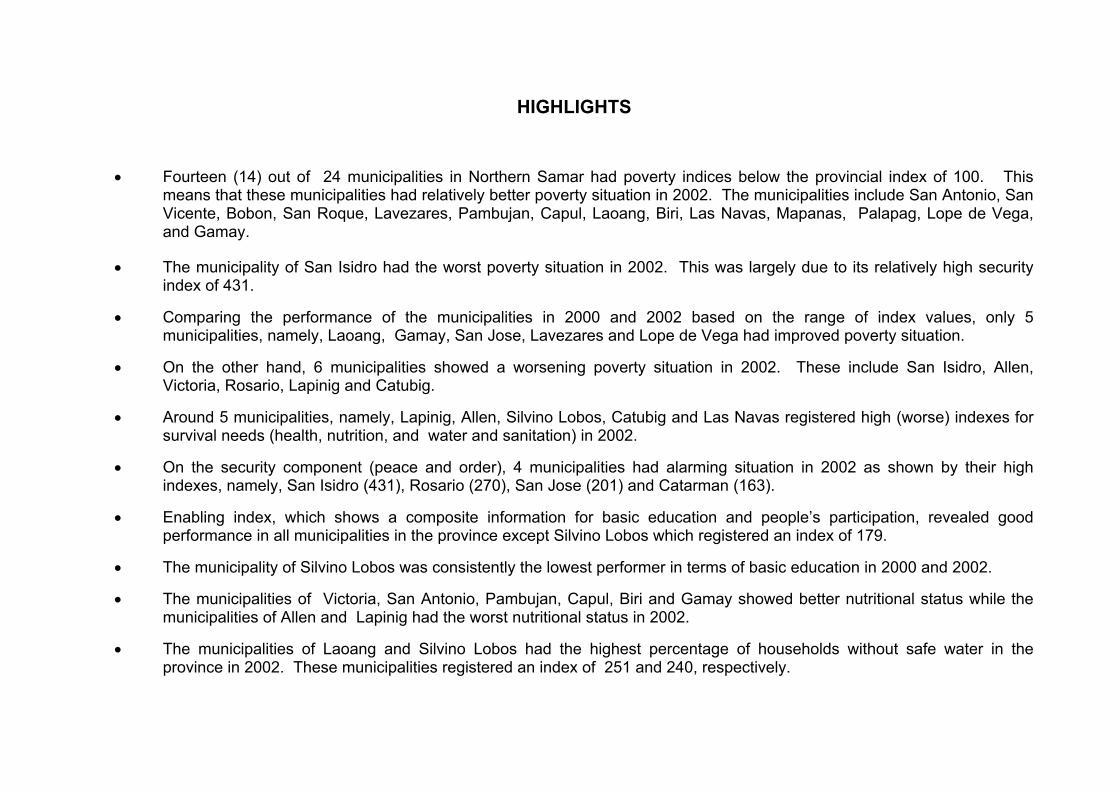
• Fourteen (14) out of 24 municipalities in Northern Samar had poverty indices below the provincial index of 100. This means that these municipalities had relatively better poverty situation in 2002. The municipalities include San Antonio, San Vicente, Bobon, San Roque, Lavezares, Pambujan, Capul, Laoang, Biri, Las Navas, Mapanas, Palapag, Lope de Vega, and Gamay.
• The municipality of San Isidro had the worst poverty situation in 2002. This was largely due to its relatively high security index of 431.
• Comparing the performance of the municipalities in 2000 and 2002 based on the range of index values, only 5 municipalities, namely, Laoang, Gamay, San Jose, Lavezares and Lope de Vega had improved poverty situation.
• On the other hand, 6 municipalities showed a worsening poverty situation in 2002. These include San Isidro, Allen, Victoria, Rosario, Lapinig and Catubig.
• Around 5 municipalities, namely, Lapinig, Allen, Silvino Lobos, Catubig and Las Navas registered high (worse) indexes for survival needs (health, nutrition, and water and sanitation) in 2002.
• On the security component (peace and order), 4 municipalities had alarming situation in 2002 as shown by their high indexes, namely, San Isidro (431), Rosario (270), San Jose (201) and Catarman (163).
• Enabling index, which shows a composite information for basic education and people’s participation, revealed good performance in all municipalities in the province except Silvino Lobos which registered an index of 179.
• The municipality of Silvino Lobos was consistently the lowest performer in terms of basic education in 2000 and 2002.
• The municipalities of Victoria, San Antonio, Pambujan, Capul, Biri and Gamay showed better nutritional status while the municipalities of Allen and Lapinig had the worst nutritional status in 2002.
• The municipalities of Laoang and Silvino Lobos had the highest percentage of households without safe water in the province in 2002. These municipalities registered an index of 251 and 240, respectively.
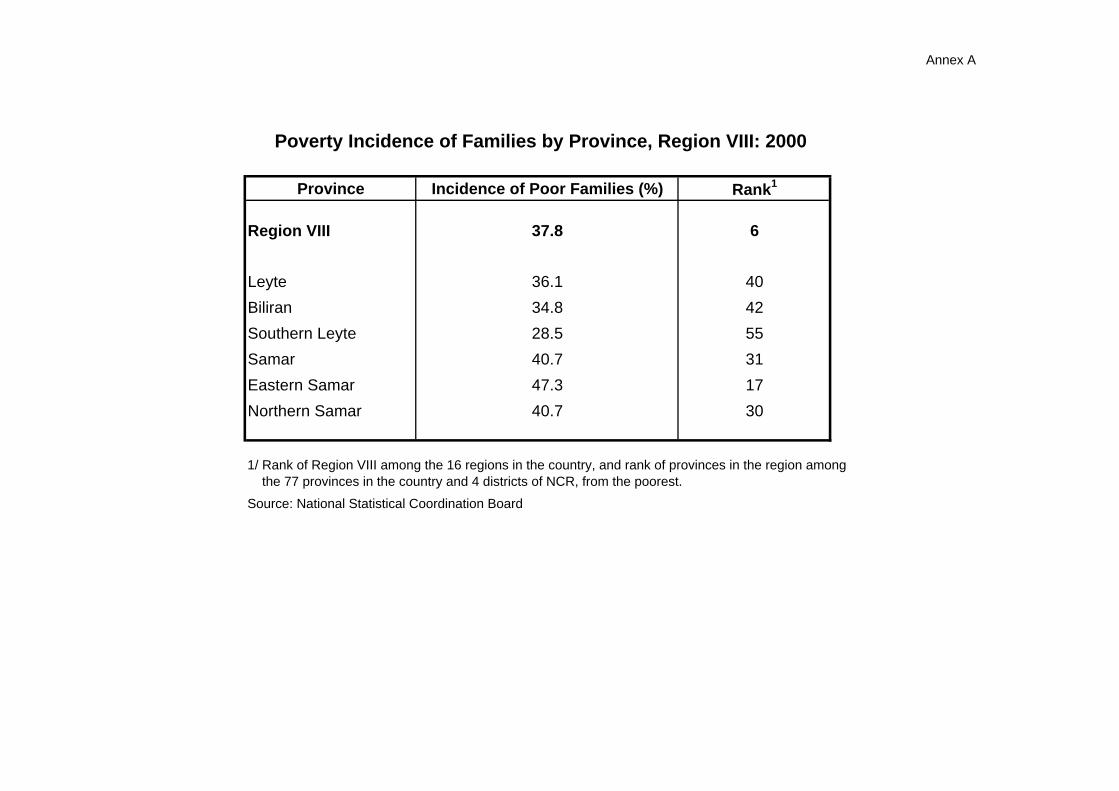
Annex A
Province Incidence of Poor Families (%) Rank1
Region VIII 37.8 6
Leyte 36.1 40
Biliran 34.8 42
Southern Leyte 28.5 55
Samar 40.7 31
Eastern Samar 47.3 17
Northern Samar 40.7 30
1/ Rank of Region VIII among the 16 regions in the country, and rank of provinces in the region among the 77 provinces in the country and 4 districts of NCR, from the poorest.
Source: National Statistical Coordination Board
Poverty Incidence of Families by Province, Region VIII: 2000