
Elastin degradation products in acute lung injury induced ...
Potential Induced Degradation of Photovoltaic Modules:
Influence of Temperature and Surface Conductivity
By
Faraz Ebneali
April 2012
Overview
Goals
Introduction to Photovoltaic Reliability
Why PID?
PID Definition
IEC standard
Parameters influencing PID High Voltage in the String
Project Setup
Characterization of samples and diagnostic tools
Findings Positive Bias
Negative Bias
Regeneration Bias
Conclusion and Recommendation
2
Goals Study High voltage, Temperature and humidity (surface conductivity) effects on
crystalline silicon modules (Poly -Si and Mono-Si)
To compare the effect of temperature on reaction rate and degradation level
To find out the correlation between leakage current and power reduction
To compare and evaluate the rate of degradation among Fresh, Thermal Cycling
(TC) and Damp Heat (DH) samples
To understand what type of samples are suitable for PID test
Level of Electrochemical Corrosion and shunting within the interface
To analyze the power reversibility of the samples after degradation
To estimate the internal series resistance (Rs) of the samples before and after PID
stress test
To verify and confirm previous PRL PID studies
3
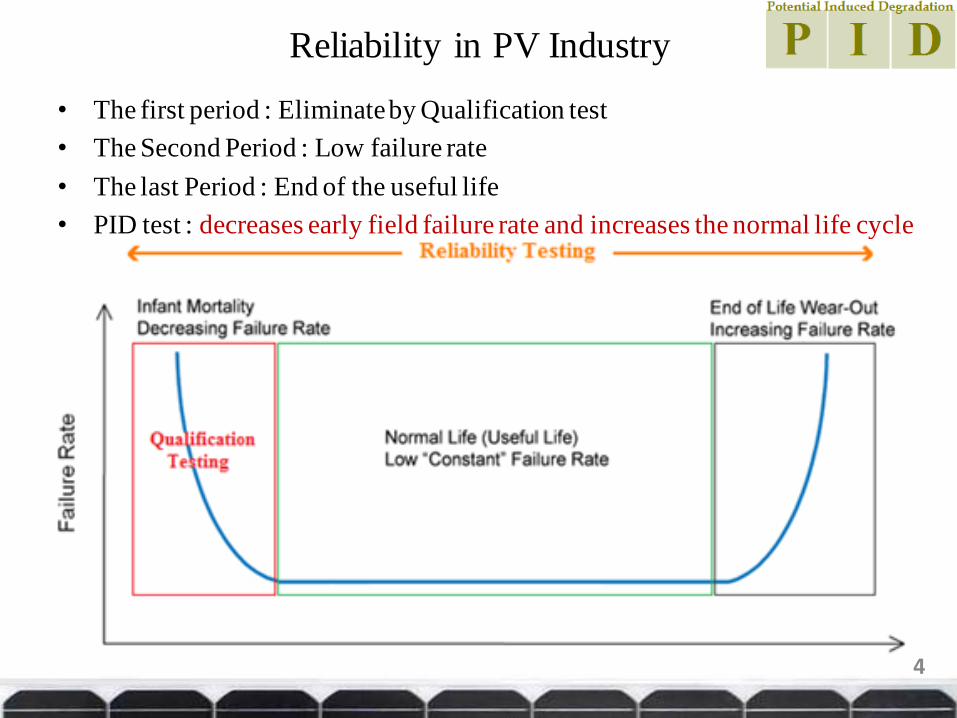
Reliability in PV Industry
• The first period : Eliminate by Qualification test
• The Second Period : Low failure rate
• The last Period : End of the useful life
• PID test : decreases early field failure rate and increases the normal life cycle
4
Why PID?
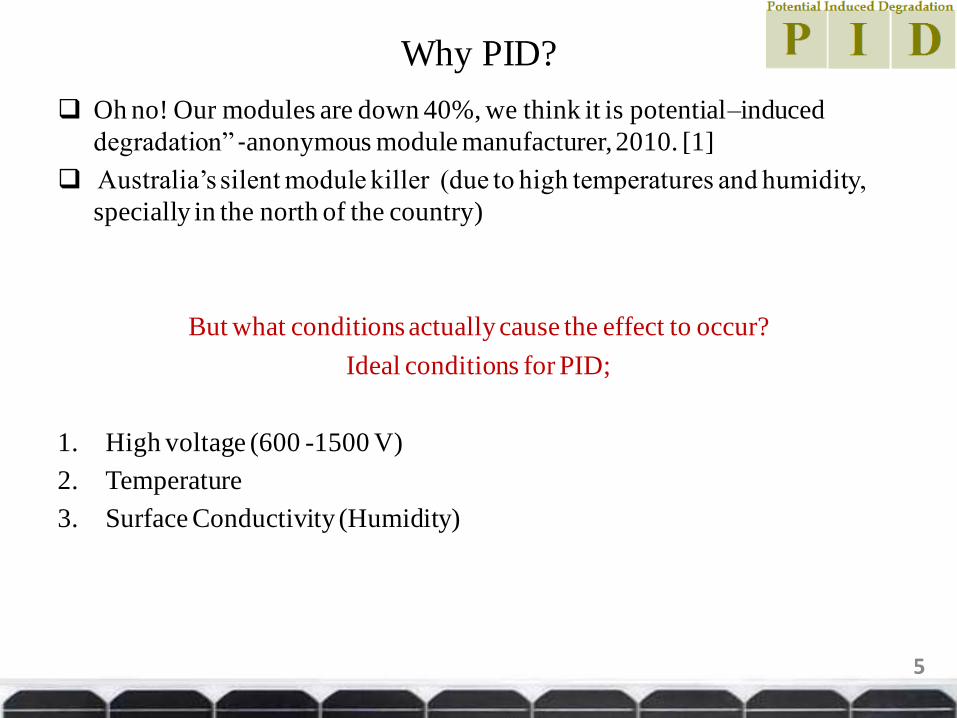
Oh no! Our modules are down 40%, we think it is potential–induced
degradation” ‐anonymous module manufacturer, 2010. [1]
Australia’s silent module killer (due to high temperatures and humidity,
specially in the north of the country)
But what conditions actually cause the effect to occur?
Ideal conditions for PID;
1. High voltage (600 -1500 V)
2. Temperature
3. Surface Conductivity (Humidity)
5
PID free modules!
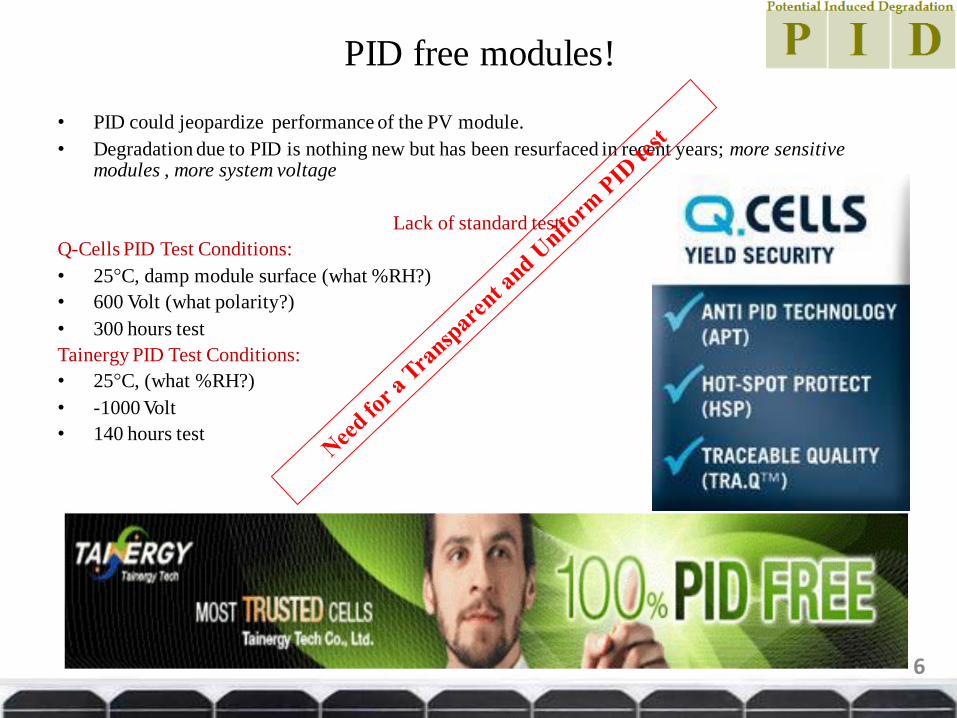
• PID could jeopardize performance of the PV module.
• Degradation due to PID is nothing new but has been resurfaced in recent years; more sensitive modules , more system voltage
Lack of standard test
Q-Cells PID Test Conditions:
• 25°C, damp module surface (what %RH?)
• 600 Volt (what polarity?)
• 300 hours test
Tainergy PID Test Conditions:
• 25°C, (what %RH?)
• -1000 Volt
• 140 hours test
6
IEC61215 standard
Current Standard !
• Qualification tests like Thermal Cycling, Damp Heat and …
• Require testing for safety issues at high voltage conditions.
Inclusion of PID in IEC standard
• Need to standardize the PID test that completely evaluate the durability of
the modules under stressed conditions.
• Early detection of damage with applying both negative and positive
potential and other conditions.
• Reasonable PID test in case of cost, time and stress level.
7
PID Definition
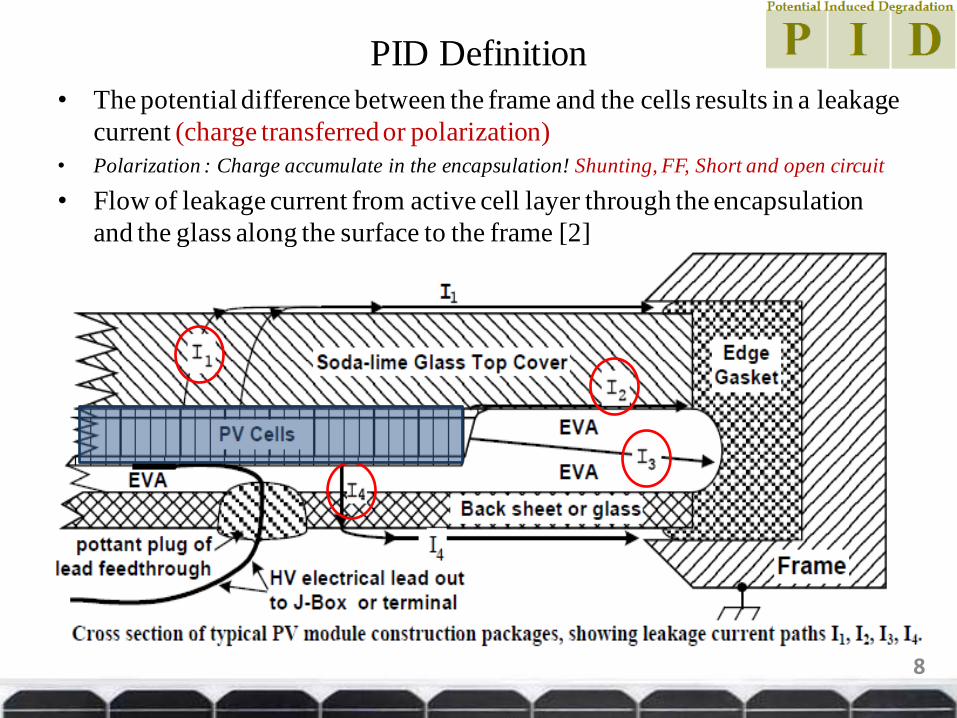
• The potential difference between the frame and the cells results in a leakage
current (charge transferred or polarization)
• Polarization : Charge accumulate in the encapsulation! Shunting, FF, Short and open circuit
• Flow of leakage current from active cell layer through the encapsulation
and the glass along the surface to the frame [2]
8
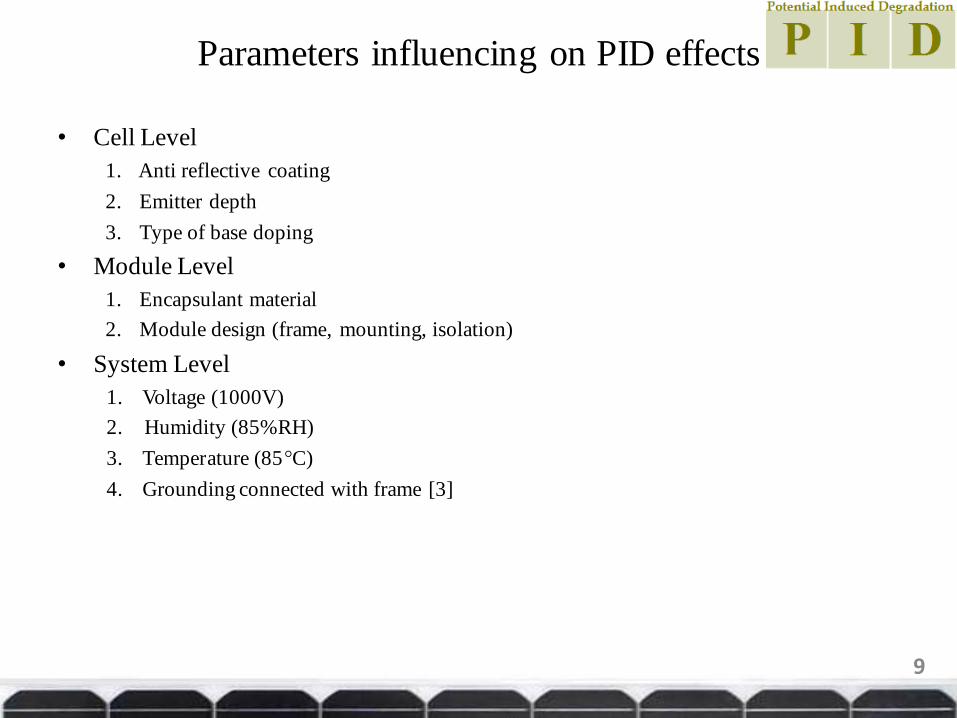
Parameters influencing on PID effects
• Cell Level
1. Anti reflective coating
2. Emitter depth
3. Type of base doping
• Module Level
1. Encapsulant material
2. Module design (frame, mounting, isolation)
• System Level
1. Voltage (1000V)
2. Humidity (85%RH)
3. Temperature (85°C)
4. Grounding connected with frame [3]
9
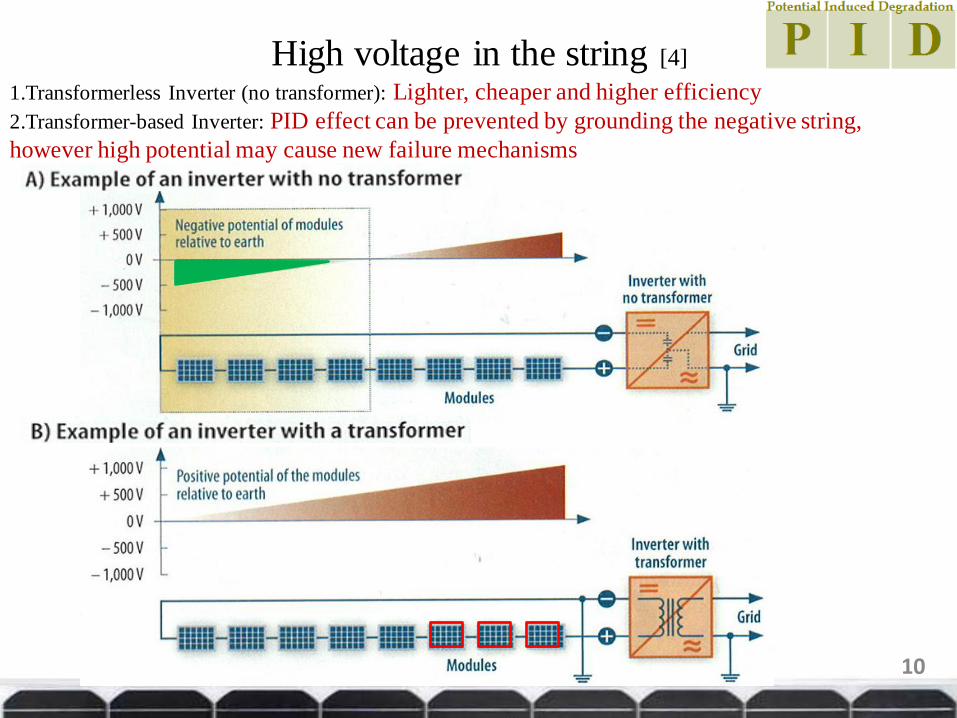
High voltage in the string [4]
1.Transformerless Inverter (no transformer): Lighter, cheaper and higher efficiency
2.Transformer-based Inverter: PID effect can be prevented by grounding the negative string,
however high potential may cause new failure mechanisms
10
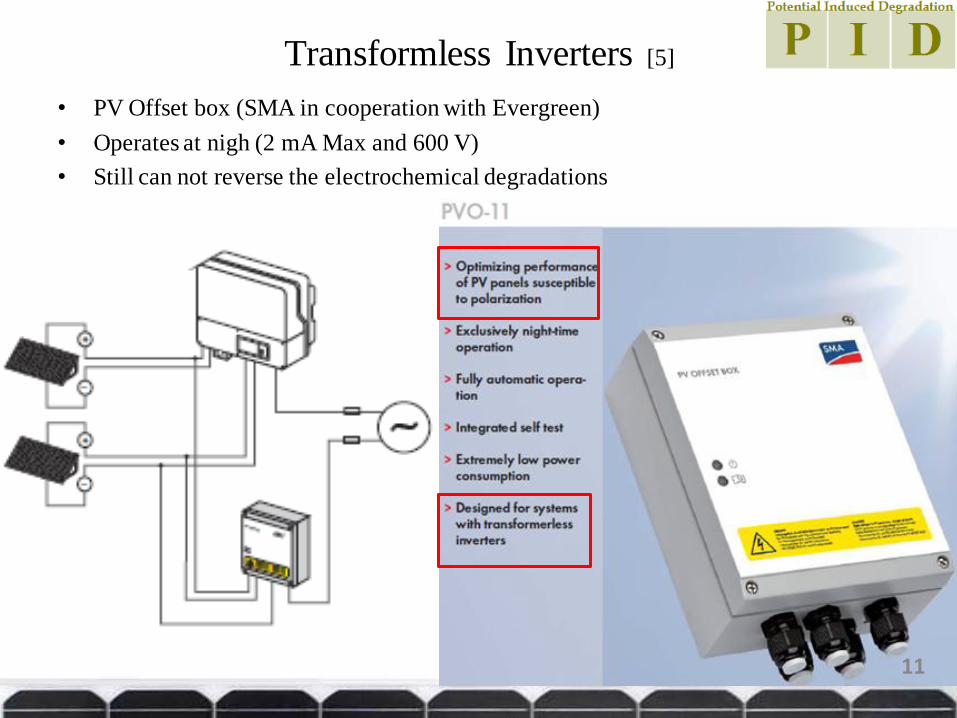
Transformless Inverters [5]
• PV Offset box (SMA in cooperation with Evergreen)
• Operates at nigh (2 mA Max and 600 V)
• Still can not reverse the electrochemical degradations
11
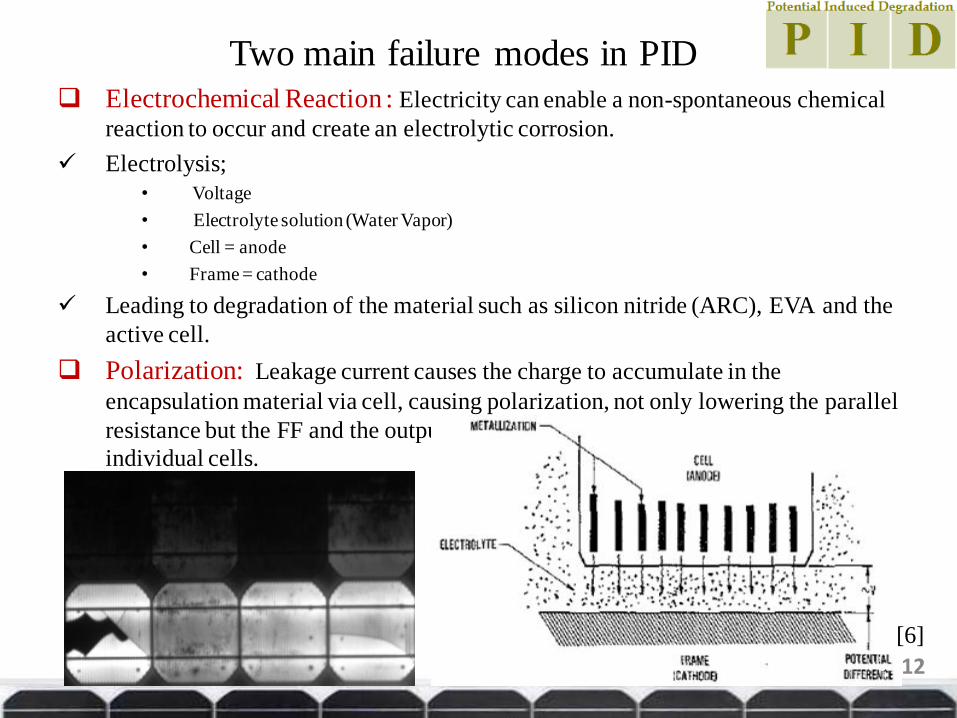
Two main failure modes in PID Electrochemical Reaction : Electricity can enable a non-spontaneous chemical
reaction to occur and create an electrolytic corrosion.
Electrolysis;
• Voltage
• Electrolyte solution (Water Vapor)
• Cell = anode
• Frame = cathode
Leading to degradation of the material such as silicon nitride (ARC), EVA and the
active cell.
Polarization: Leakage current causes the charge to accumulate in the
encapsulation material via cell, causing polarization, not only lowering the parallel
resistance but the FF and the output. This is associated with significant shunting of
individual cells.
12
[6]
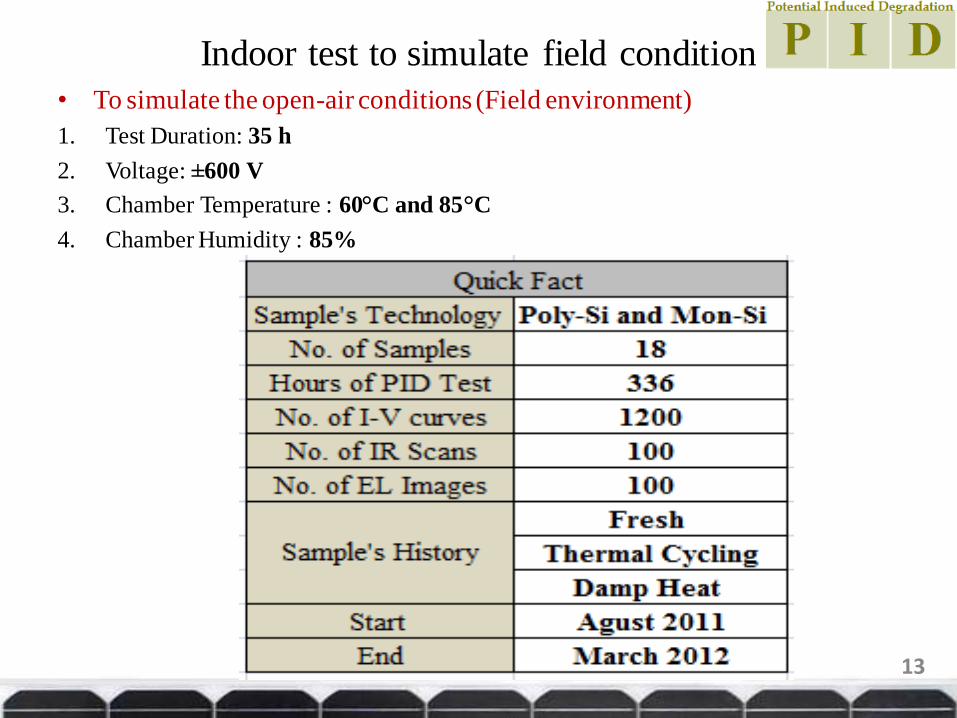
Indoor test to simulate field condition
• To simulate the open-air conditions (Field environment)
1. Test Duration: 35 h
2. Voltage: ±600 V
3. Chamber Temperature : 60°C and 85°C
4. Chamber Humidity : 85%
13
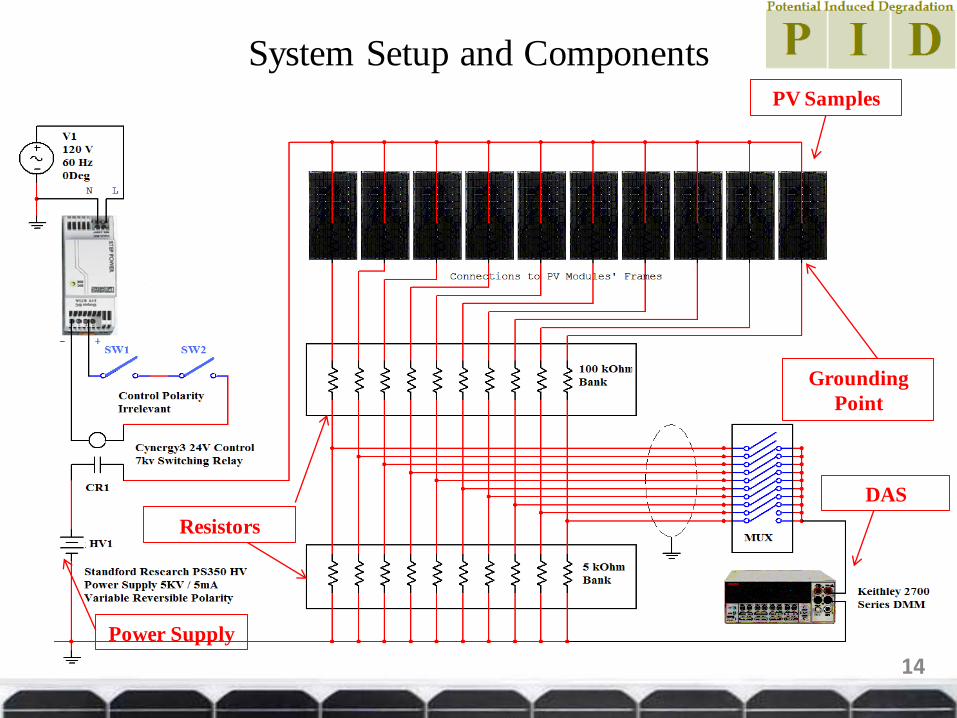
System Setup and Components
PV Samples
DAS
Grounding
Point
Resistors
Power Supply
14
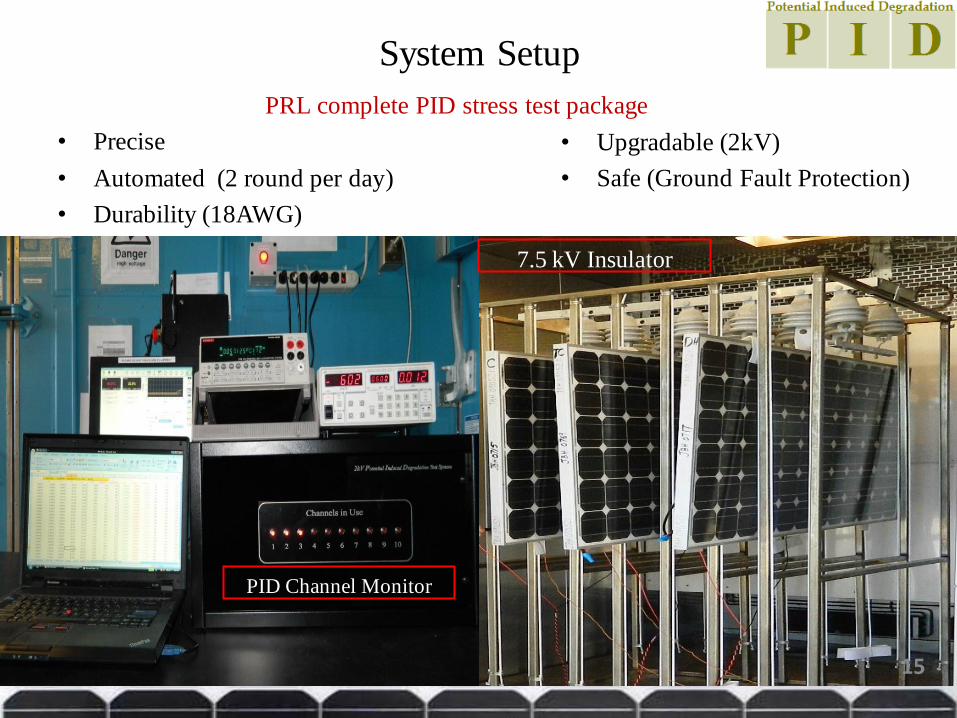
System Setup
PRL complete PID stress test package
• Precise
• Automated (2 round per day)
• Durability (18AWG)
• Upgradable (2kV)
• Safe (Ground Fault Protection)
PID Channel Monitor
15
7.5 kV Insulator
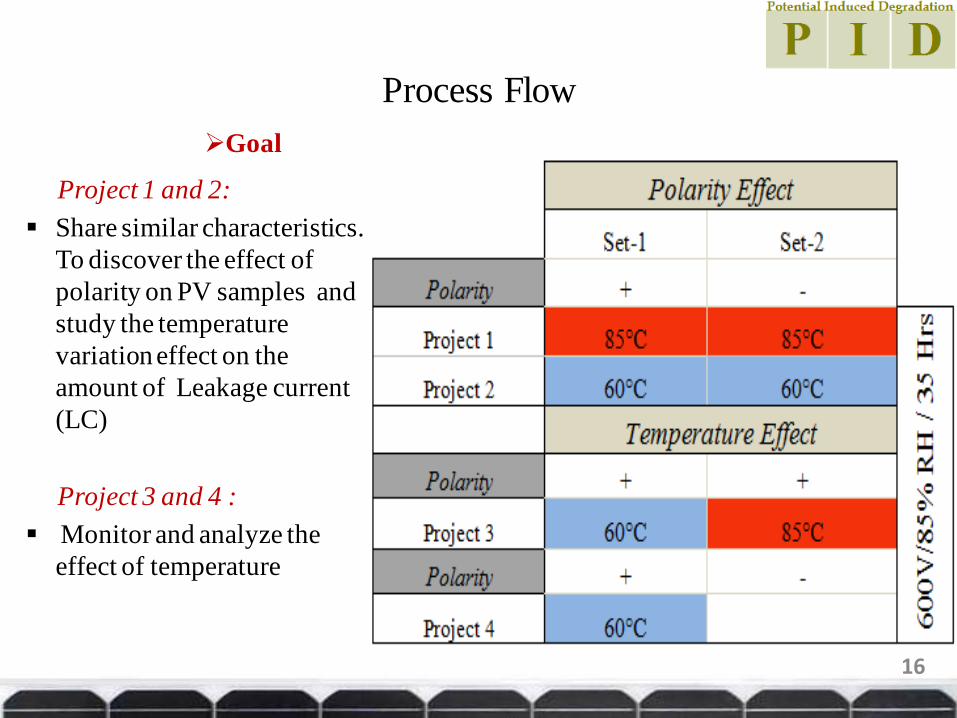
Process Flow
Goal
Project 1 and 2:
Share similar characteristics.
To discover the effect of
polarity on PV samples and
study the temperature
variation effect on the
amount of Leakage current
(LC)
Project 3 and 4 :
Monitor and analyze the
effect of temperature
16
Procedure Description
I. Phase-I Positive Bias (Negatively grounded): +600V
Apply +600V to cell active layer 5h intervals at 85°C or 60°C and 85%RH (excluding 1 hour ramp rate) 35hours ( 7-PID cycles-Characterization after 2nd ,4th and 7th cycle )
II. Phase-II Negative Bias (Positively Grounded): −600V
Apply -600V to cell active layer 5hours at 85°C or 60°C and 85%RH (excluding 1 hour ramp rate)
Phase-III: Regeneration Process
+600V is applied to the active layer of Phase-II modules
17
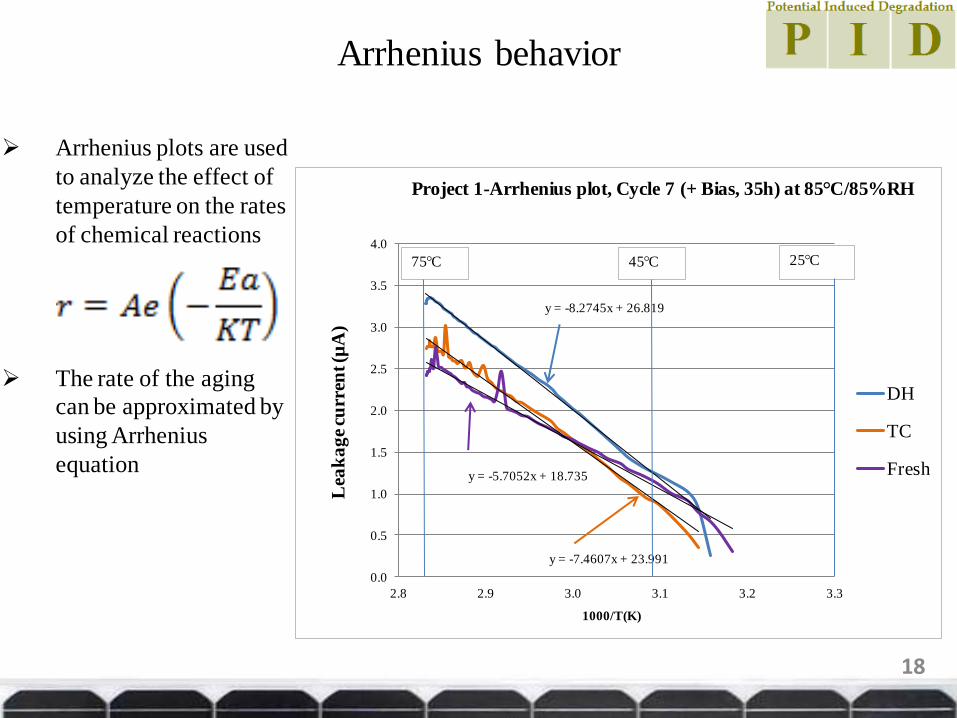
Arrhenius behavior
Arrhenius plots are used
to analyze the effect of
temperature on the rates
of chemical reactions
The rate of the aging
can be approximated by
using Arrhenius
equation
y = -8.2745x + 26.819
y = -7.4607x + 23.991
y = -5.7052x + 18.735
0.0
0.5
1.0
1.5
2.0
2.5
3.0
3.5
4.0
2.8 2.9 3.0 3.1 3.2 3.3
Lea
ka
ge
curr
ent (µ
A)
1000/T(K)
Project 1-Arrhenius plot, Cycle 7 (+ Bias, 35h) at 85°C/85%RH
DH
TC
Fresh
25°C
45°C
75°C
18
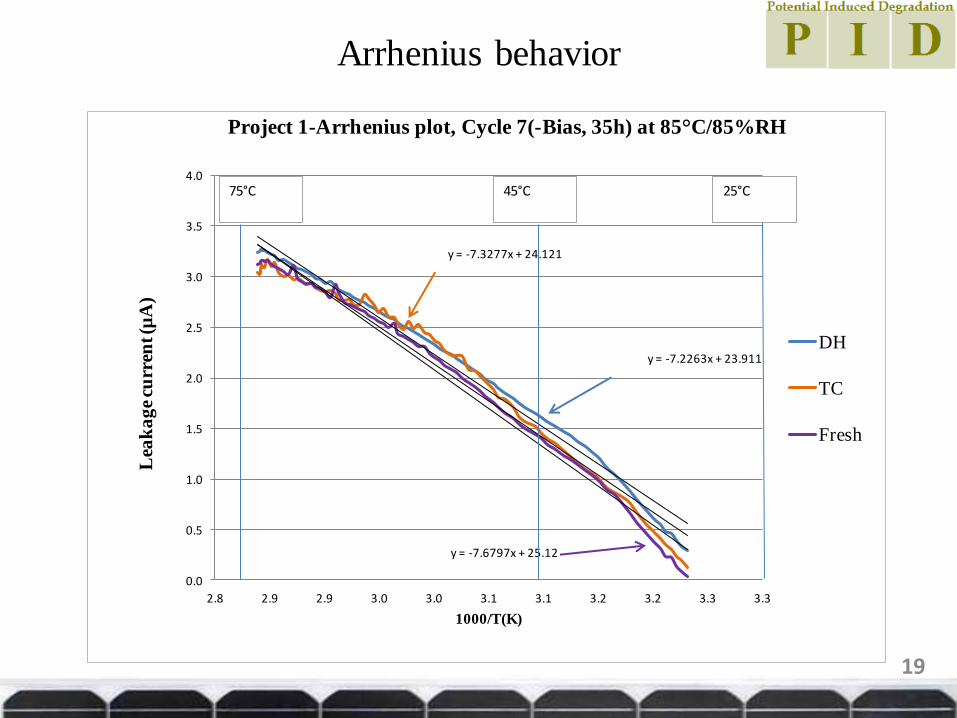
Arrhenius behavior
y = -7.2263x + 23.911
y = -7.3277x + 24.121
y = -7.6797x + 25.12
0.0
0.5
1.0
1.5
2.0
2.5
3.0
3.5
4.0
2.8 2.9 2.9 3.0 3.0 3.1 3.1 3.2 3.2 3.3 3.3
Lea
ka
ge
curr
ent (µ
A)
1000/T(K)
Project 1-Arrhenius plot, Cycle 7(-Bias, 35h) at 85°C/85%RH
DH
TC
Fresh
25°C 45°C 75°C
19
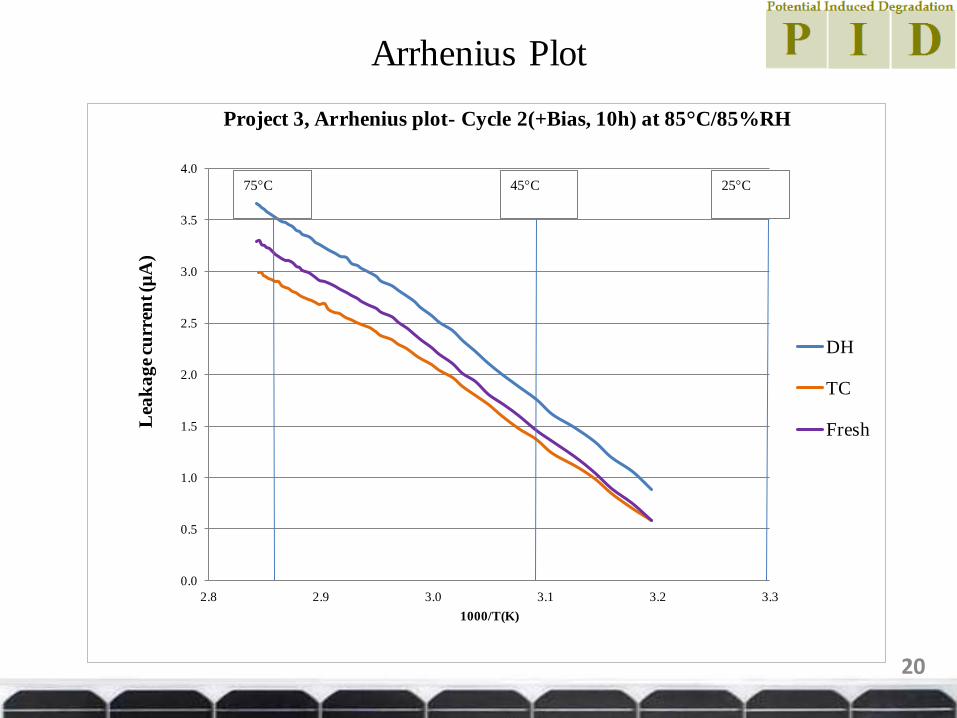
Arrhenius Plot
0.0
0.5
1.0
1.5
2.0
2.5
3.0
3.5
4.0
2.8 2.9 3.0 3.1 3.2 3.3
Lea
ka
ge
curr
ent (µ
A)
1000/T(K)
Project 3, Arrhenius plot- Cycle 2(+Bias, 10h) at 85°C/85%RH
DH
TC
Fresh
25°C 75°C 45°C
20
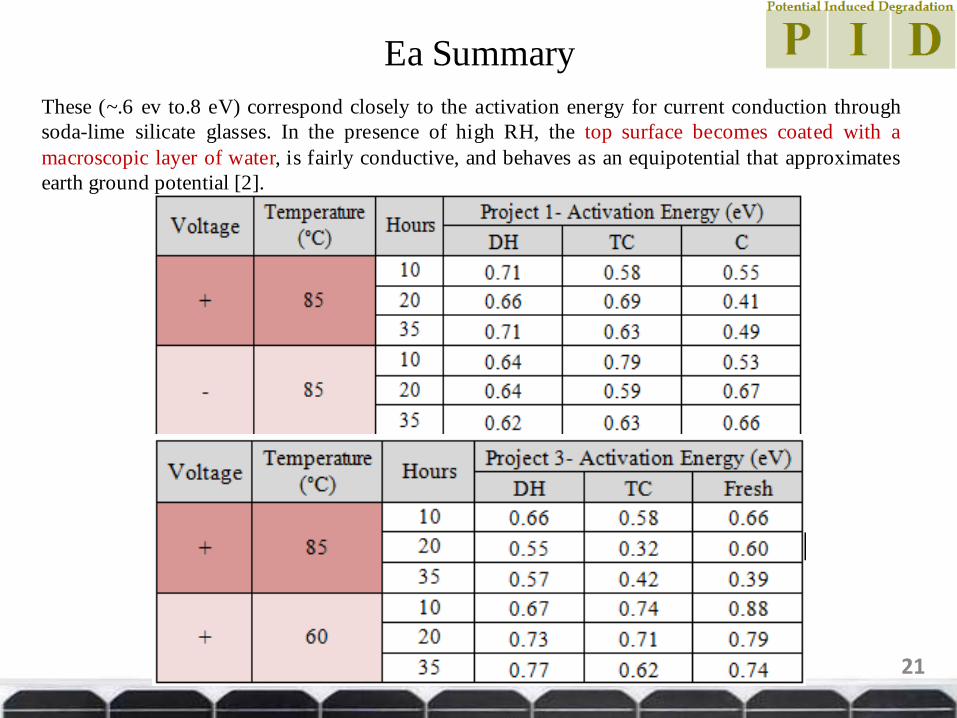
Ea Summary
21
These (~.6 ev to.8 eV) correspond closely to the activation energy for current conduction through
soda-lime silicate glasses. In the presence of high RH, the top surface becomes coated with a
macroscopic layer of water, is fairly conductive, and behaves as an equipotential that approximates
earth ground potential [2].
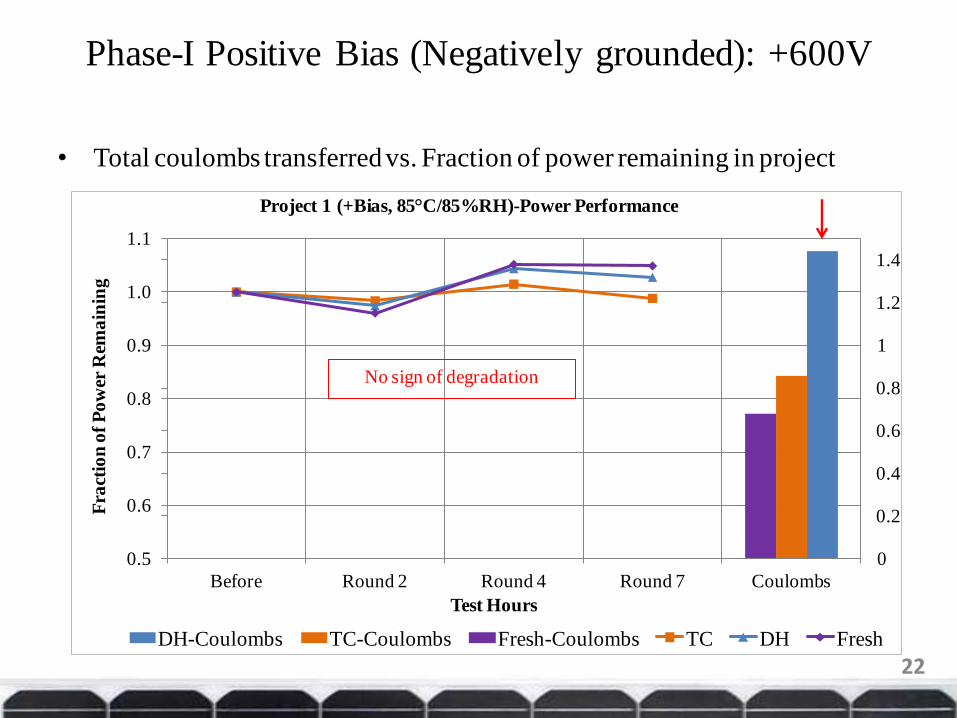
Phase-I Positive Bias (Negatively grounded): +600V
• Total coulombs transferred vs. Fraction of power remaining in project
0
0.2
0.4
0.6
0.8
1
1.2
1.4
0.5
0.6
0.7
0.8
0.9
1.0
1.1
Before Round 2 Round 4 Round 7 Coulombs
Fra
ctio
n o
f P
ow
er R
ema
inin
g
Test Hours
Project 1 (+Bias, 85°C/85%RH)-Power Performance
DH-Coulombs TC-Coulombs Fresh-Coulombs TC DH Fresh
No sign of degradation
22
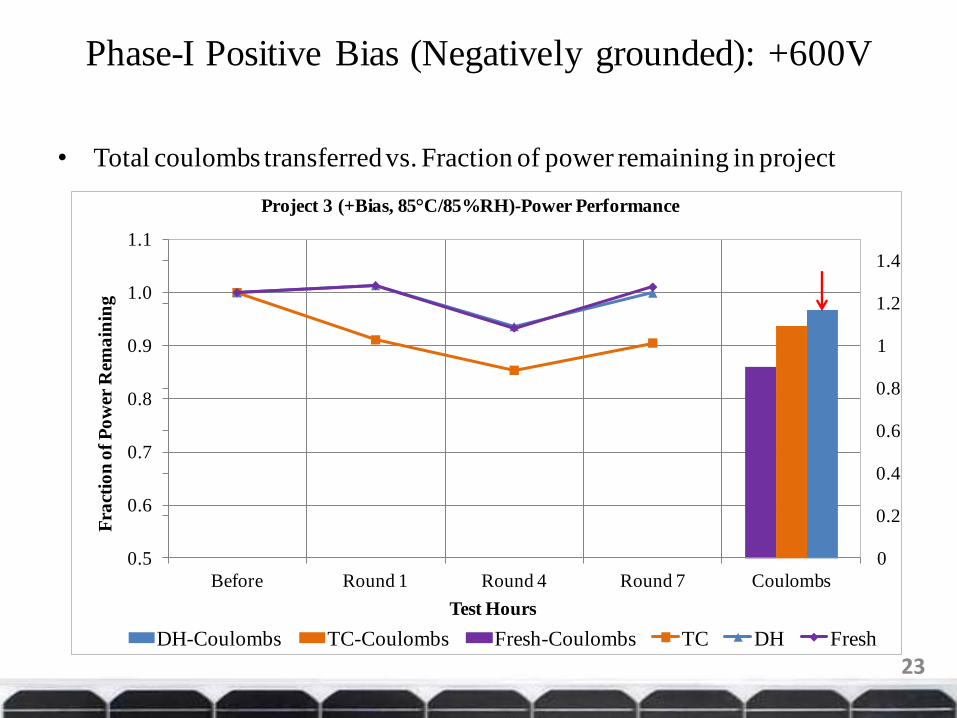
Phase-I Positive Bias (Negatively grounded): +600V
• Total coulombs transferred vs. Fraction of power remaining in project
0
0.2
0.4
0.6
0.8
1
1.2
1.4
0.5
0.6
0.7
0.8
0.9
1.0
1.1
Before Round 1 Round 4 Round 7 Coulombs
Fra
ctio
n o
f P
ow
er R
ema
inin
g
Test Hours
Project 3 (+Bias, 85°C/85%RH)-Power Performance
DH-Coulombs TC-Coulombs Fresh-Coulombs TC DH Fresh
23
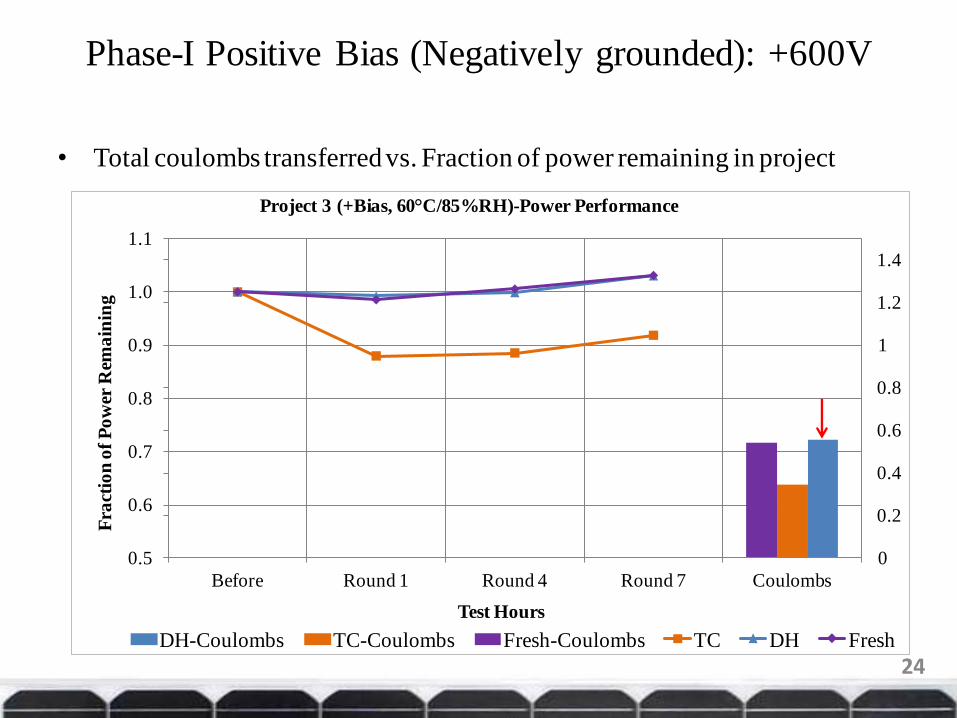
Phase-I Positive Bias (Negatively grounded): +600V
• Total coulombs transferred vs. Fraction of power remaining in project
0
0.2
0.4
0.6
0.8
1
1.2
1.4
0.5
0.6
0.7
0.8
0.9
1.0
1.1
Before Round 1 Round 4 Round 7 Coulombs
Fra
ctio
n o
f P
ow
er R
ema
inin
g
Test Hours
Project 3 (+Bias, 60°C/85%RH)-Power Performance
DH-Coulombs TC-Coulombs Fresh-Coulombs TC DH Fresh
24
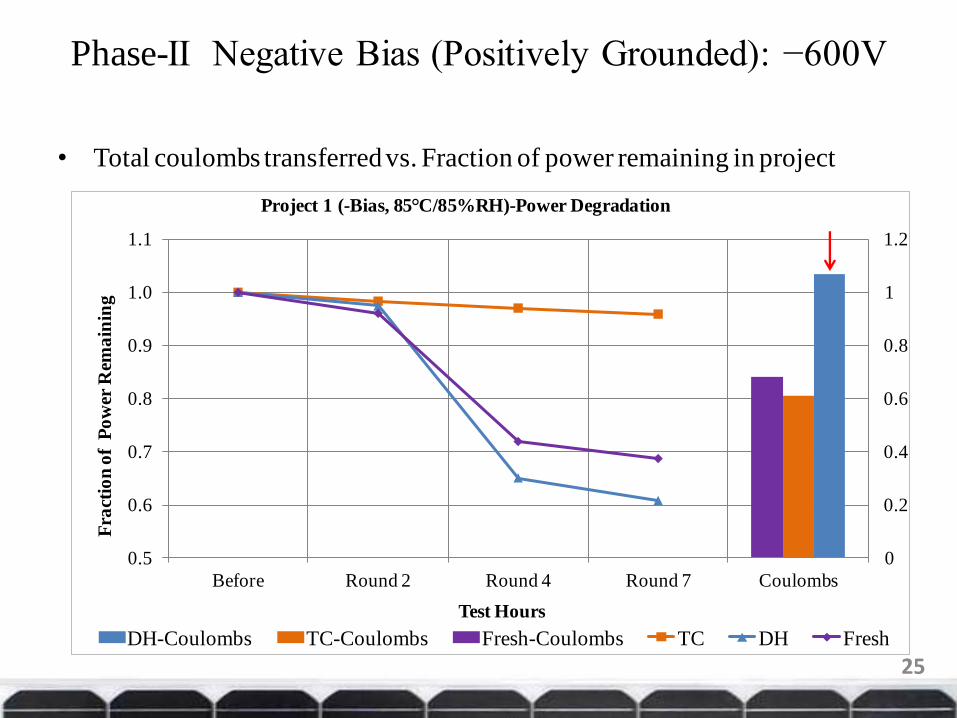
Phase-II Negative Bias (Positively Grounded): −600V
• Total coulombs transferred vs. Fraction of power remaining in project
0
0.2
0.4
0.6
0.8
1
1.2
0.5
0.6
0.7
0.8
0.9
1.0
1.1
Before Round 2 Round 4 Round 7 Coulombs
Fra
ctio
n o
f P
ow
er R
ema
inin
g
Test Hours
Project 1 (-Bias, 85°C/85%RH)-Power Degradation
DH-Coulombs TC-Coulombs Fresh-Coulombs TC DH Fresh
25
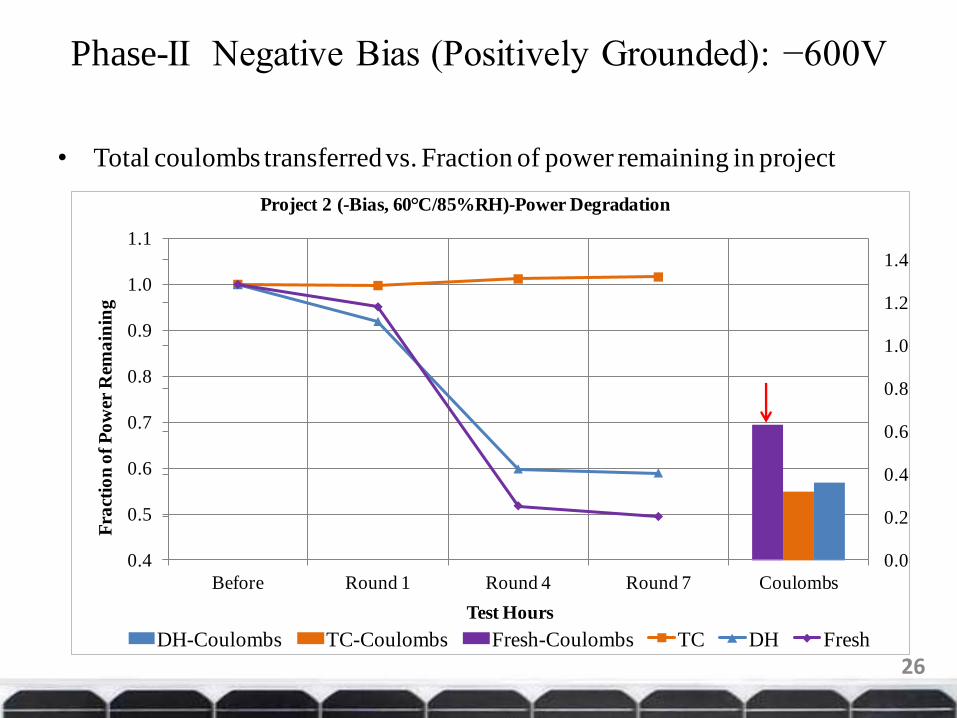
Phase-II Negative Bias (Positively Grounded): −600V
• Total coulombs transferred vs. Fraction of power remaining in project
0.0
0.2
0.4
0.6
0.8
1.0
1.2
1.4
0.4
0.5
0.6
0.7
0.8
0.9
1.0
1.1
Before Round 1 Round 4 Round 7 Coulombs
Fra
ctio
n o
f P
ow
er R
ema
inin
g
Test Hours
Project 2 (-Bias, 60°C/85%RH)-Power Degradation
DH-Coulombs TC-Coulombs Fresh-Coulombs TC DH Fresh
26
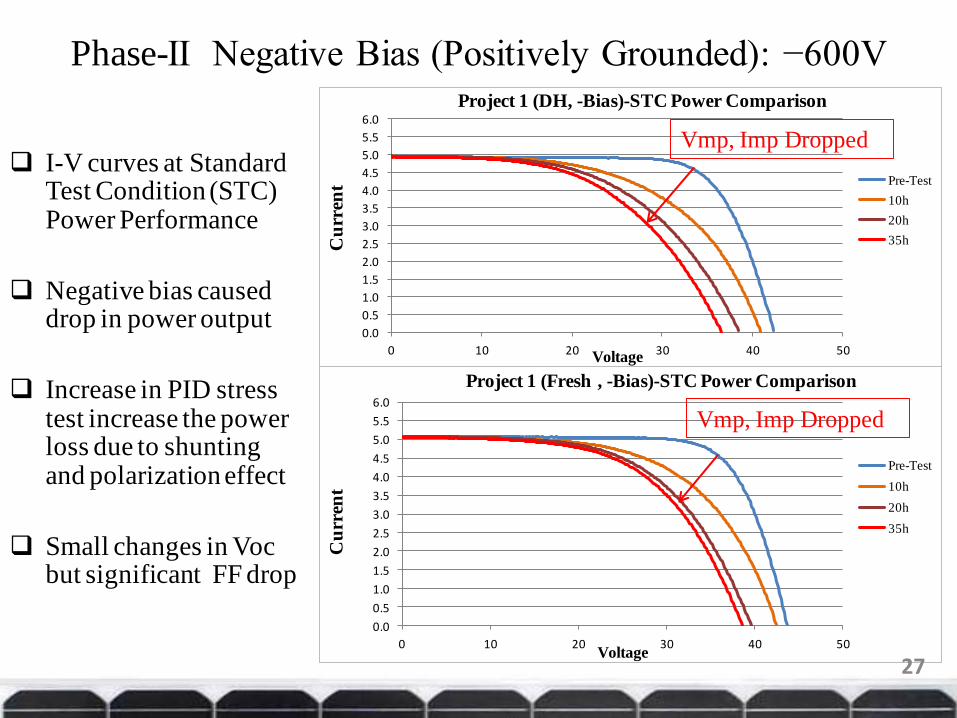
Phase-II Negative Bias (Positively Grounded): −600V
I-V curves at Standard Test Condition (STC) Power Performance
Negative bias caused drop in power output
Increase in PID stress test increase the power loss due to shunting and polarization effect
Small changes in Voc but significant FF drop
0.0
0.5
1.0
1.5
2.0
2.5
3.0
3.5
4.0
4.5
5.0
5.5
6.0
0 10 20 30 40 50 C
urr
ent
Voltage
Project 1 (DH, -Bias)-STC Power Comparison
Pre-Test
10h
20h
35h
0.0
0.5
1.0
1.5
2.0
2.5
3.0
3.5
4.0
4.5
5.0
5.5
6.0
0 10 20 30 40 50
Cu
rren
t
Voltage
Project 1 (Fresh , -Bias)-STC Power Comparison
Pre-Test
10h
20h
35h
Vmp, Imp Dropped
Vmp, Imp Dropped
27
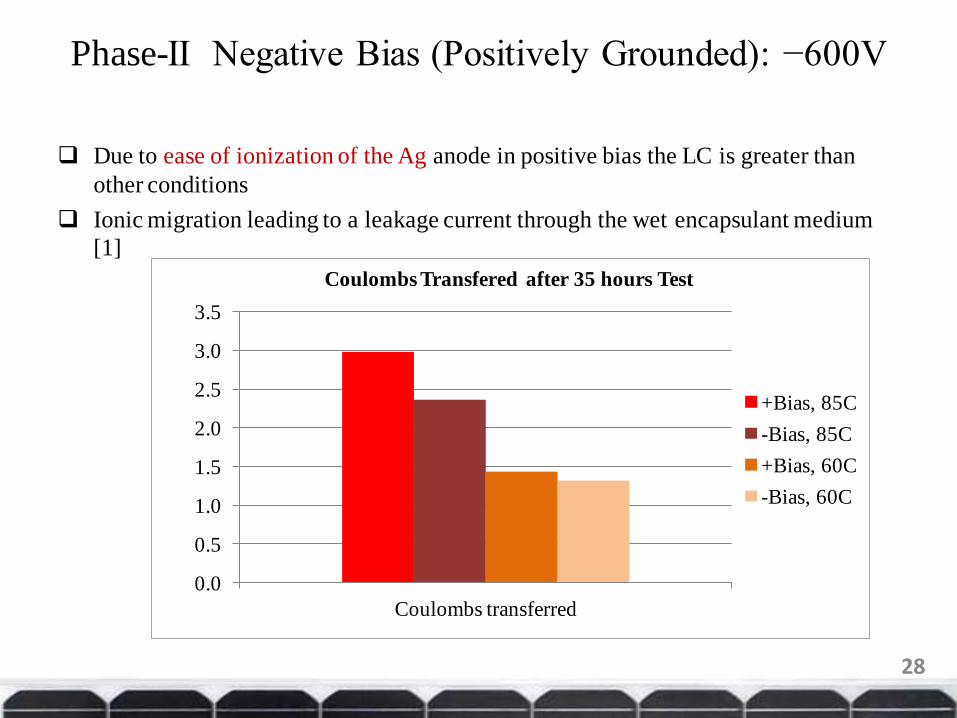
Phase-II Negative Bias (Positively Grounded): −600V
Due to ease of ionization of the Ag anode in positive bias the LC is greater than
other conditions
Ionic migration leading to a leakage current through the wet encapsulant medium
[1]
28
0.0
0.5
1.0
1.5
2.0
2.5
3.0
3.5
Coulombs transferred
Coulombs Transfered after 35 hours Test
+Bias, 85C
-Bias, 85C
+Bias, 60C
-Bias, 60C
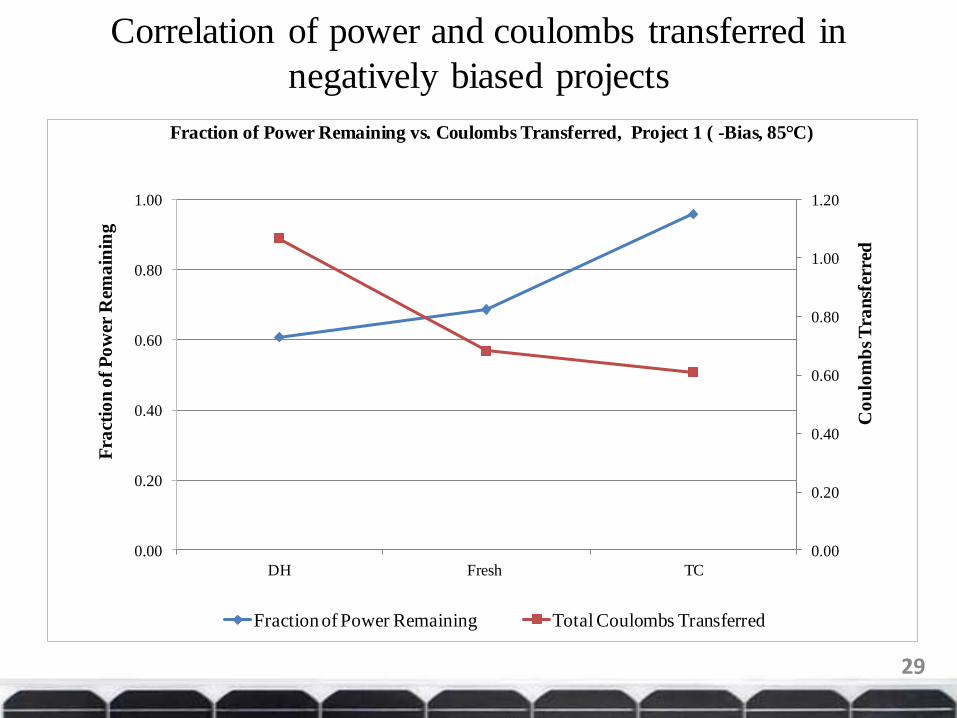
Correlation of power and coulombs transferred in
negatively biased projects
0.00
0.20
0.40
0.60
0.80
1.00
1.20
0.00
0.20
0.40
0.60
0.80
1.00
DH Fresh TC
Co
ulo
mb
s T
ran
sfer
red
Fra
ctio
n o
f P
ow
er R
ema
inin
g
Fraction of Power Remaining vs. Coulombs Transferred, Project 1 ( -Bias, 85°C)
Fraction of Power Remaining Total Coulombs Transferred
29
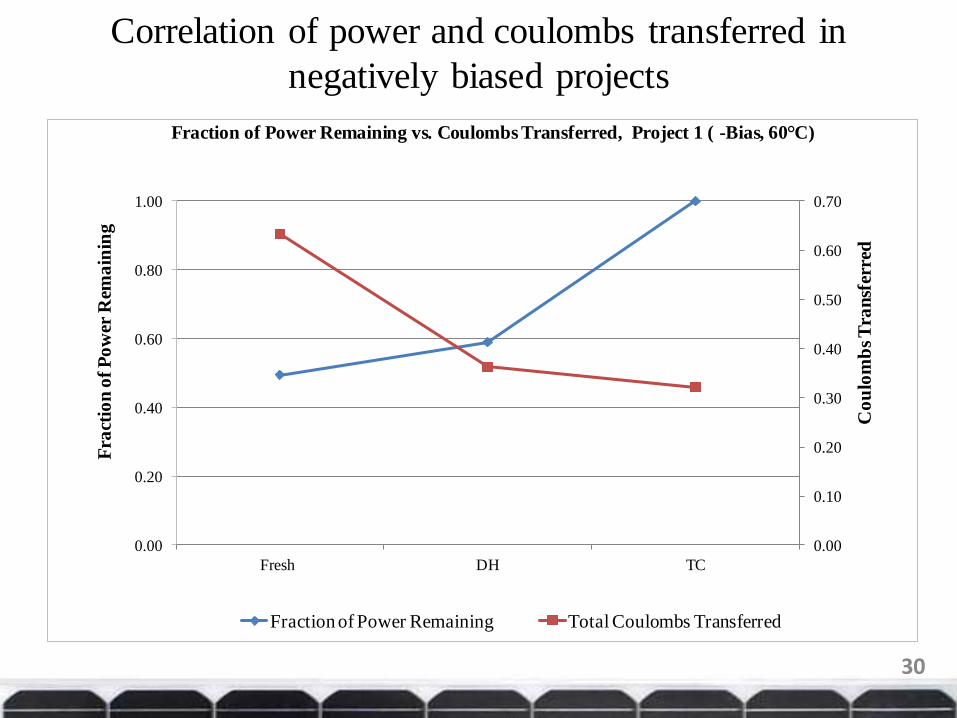
Correlation of power and coulombs transferred in
negatively biased projects
0.00
0.10
0.20
0.30
0.40
0.50
0.60
0.70
0.00
0.20
0.40
0.60
0.80
1.00
Fresh DH TC
Co
ulo
mb
s T
ran
sfer
red
Fra
ctio
n o
f P
ow
er R
ema
inin
g
Fraction of Power Remaining vs. Coulombs Transferred, Project 1 ( -Bias, 60°C)
Fraction of Power Remaining Total Coulombs Transferred
30
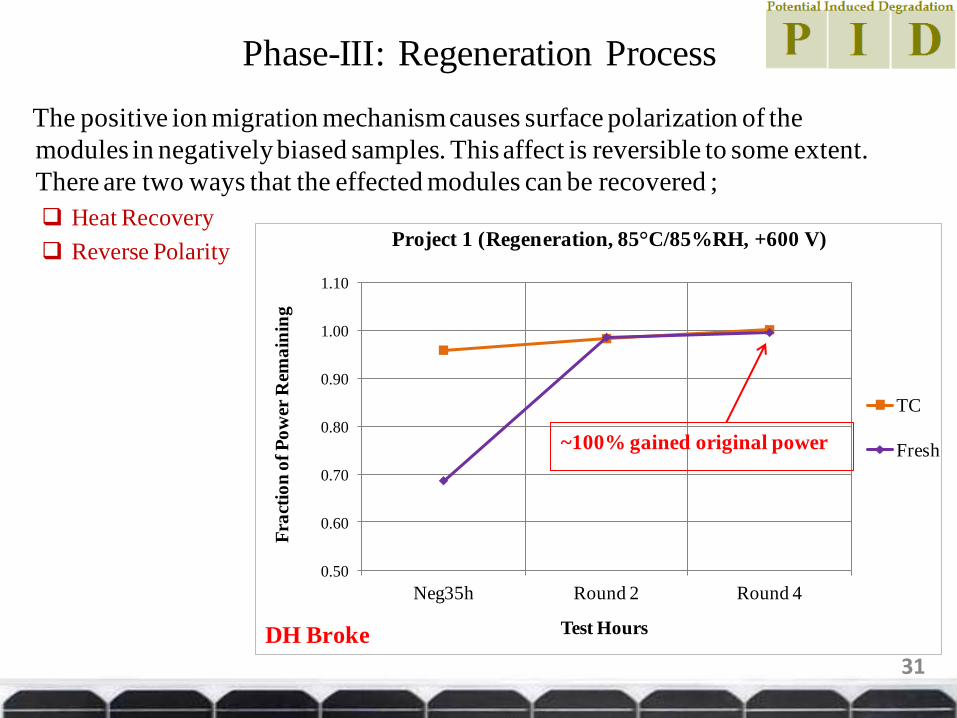
Phase-III: Regeneration Process
The positive ion migration mechanism causes surface polarization of the
modules in negatively biased samples. This affect is reversible to some extent.
There are two ways that the effected modules can be recovered ;
Heat Recovery
Reverse Polarity
0.50
0.60
0.70
0.80
0.90
1.00
1.10
Neg35h Round 2 Round 4
Fra
ctio
n o
f P
ow
er R
ema
inin
g
Test Hours
Project 1 (Regeneration, 85°C/85%RH, +600 V)
TC
Fresh ~100% gained original power
DH Broke
31
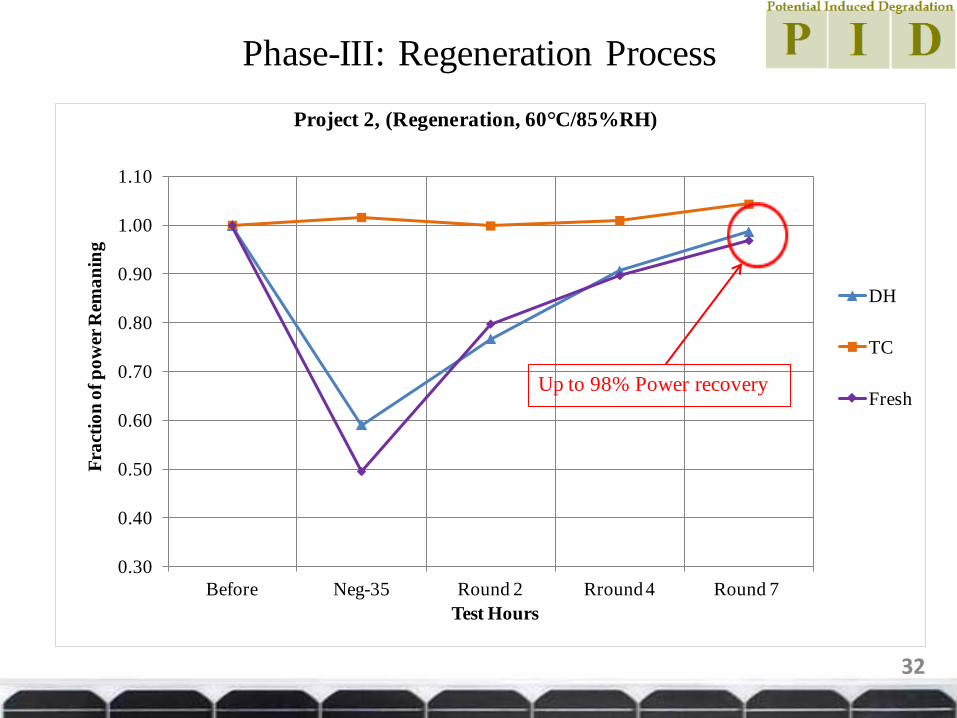
Phase-III: Regeneration Process
0.30
0.40
0.50
0.60
0.70
0.80
0.90
1.00
1.10
Before Neg-35 Round 2 Rround 4 Round 7
Fra
ctio
n o
f p
ow
er R
ema
nin
g
Test Hours
Project 2, (Regeneration, 60°C/85%RH)
DH
TC
Fresh Up to 98% Power recovery
32
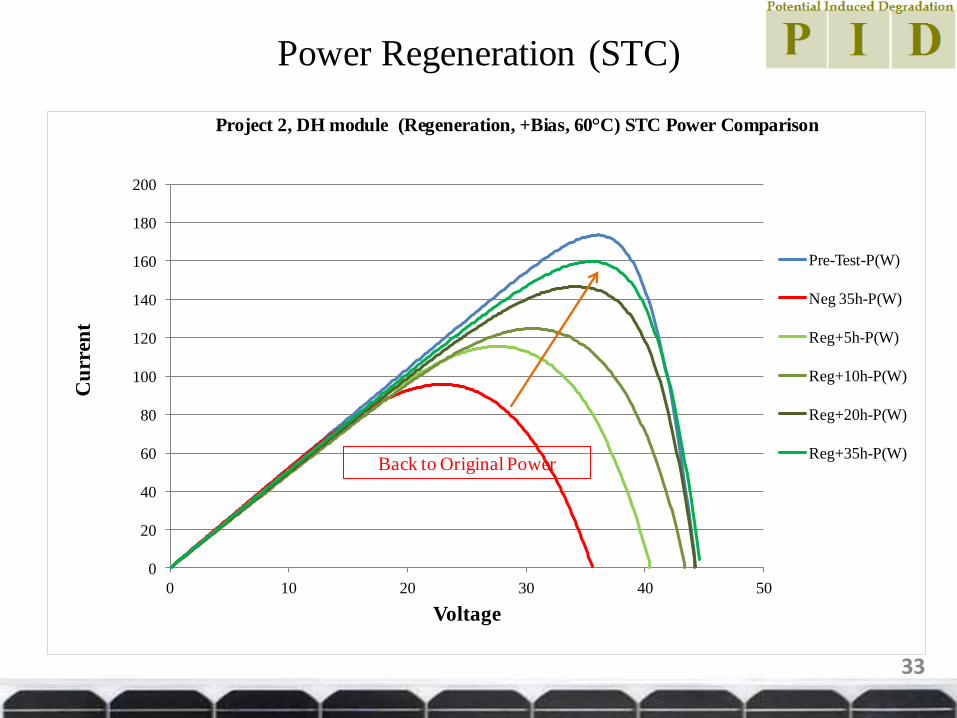
Power Regeneration (STC)
0
20
40
60
80
100
120
140
160
180
200
0 10 20 30 40 50
Cu
rren
t
Voltage
Project 2, DH module (Regeneration, +Bias, 60°C) STC Power Comparison
Pre-Test-P(W)
Neg 35h-P(W)
Reg+5h-P(W)
Reg+10h-P(W)
Reg+20h-P(W)
Reg+35h-P(W)
33
Back to Original Power
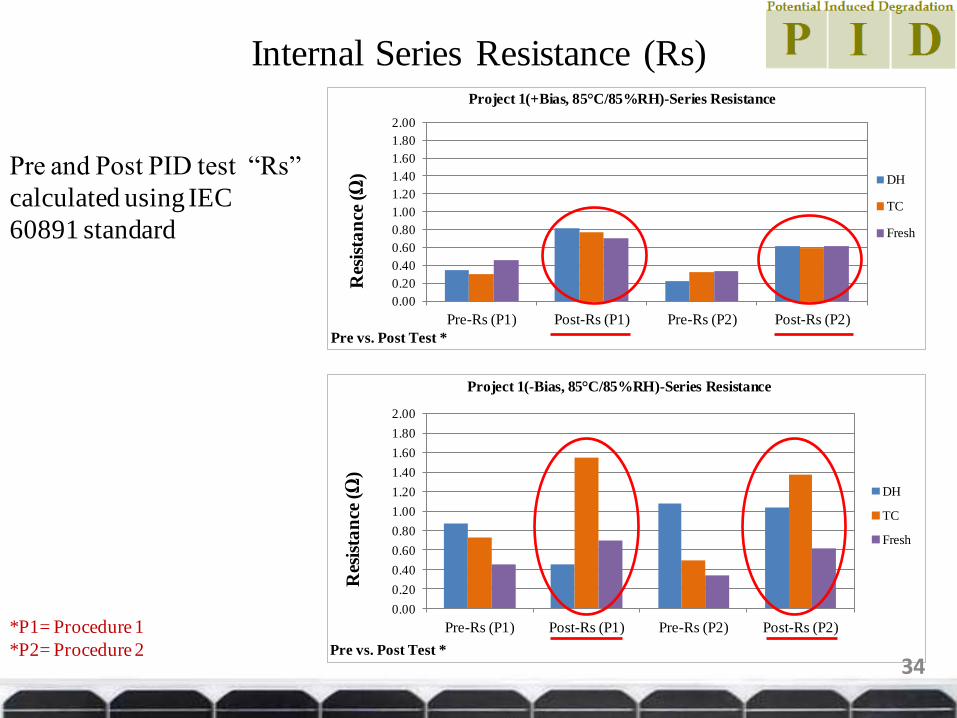
Internal Series Resistance (Rs)
0.00
0.20
0.40
0.60
0.80
1.00
1.20
1.40
1.60
1.80
2.00
Pre-Rs (P1) Post-Rs (P1) Pre-Rs (P2) Post-Rs (P2)
Res
ista
nce
(Ω
)
Pre vs. Post Test *
Project 1(+Bias, 85°C/85%RH)-Series Resistance
DH
TC
Fresh
0.00
0.20
0.40
0.60
0.80
1.00
1.20
1.40
1.60
1.80
2.00
Pre-Rs (P1) Post-Rs (P1) Pre-Rs (P2) Post-Rs (P2)
Res
ista
nce
(Ω
)
Pre vs. Post Test *
Project 1(-Bias, 85°C/85%RH)-Series Resistance
DH
TC
Fresh
Pre and Post PID test “Rs”
calculated using IEC
60891 standard
*P1= Procedure 1
*P2= Procedure 2 34
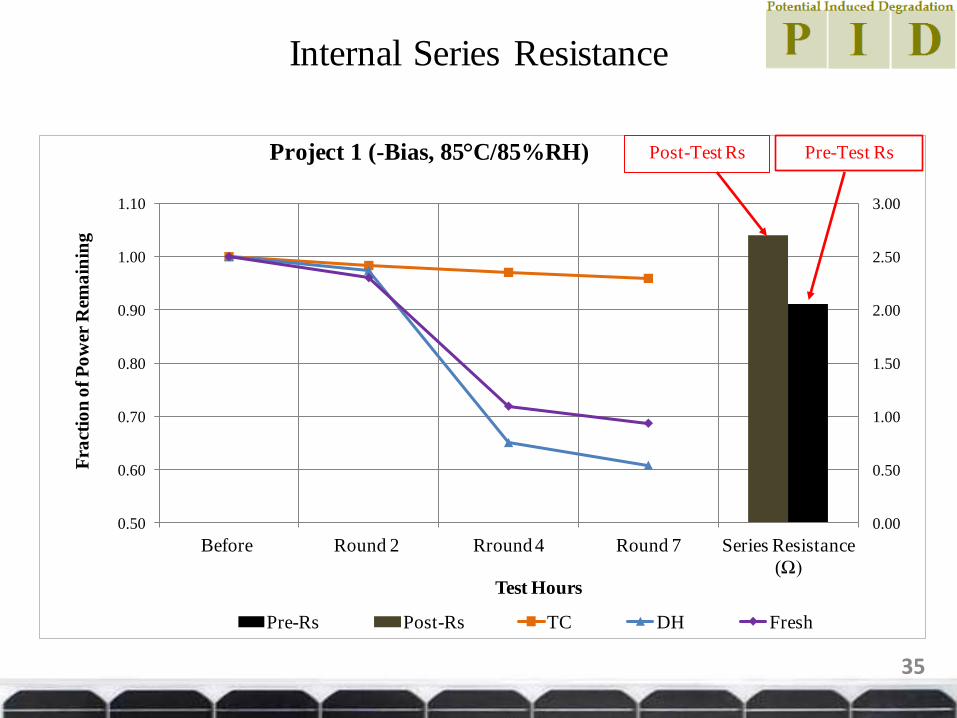
Internal Series Resistance
0.00
0.50
1.00
1.50
2.00
2.50
3.00
0.50
0.60
0.70
0.80
0.90
1.00
1.10
Before Round 2 Rround 4 Round 7 Series Resistance
(Ω)
Fra
ctio
n o
f P
ow
er R
ema
inin
g
Test Hours
Project 1 (-Bias, 85°C/85%RH)
Pre-Rs Post-Rs TC DH Fresh
Post-Test Rs Pre-Test Rs
35
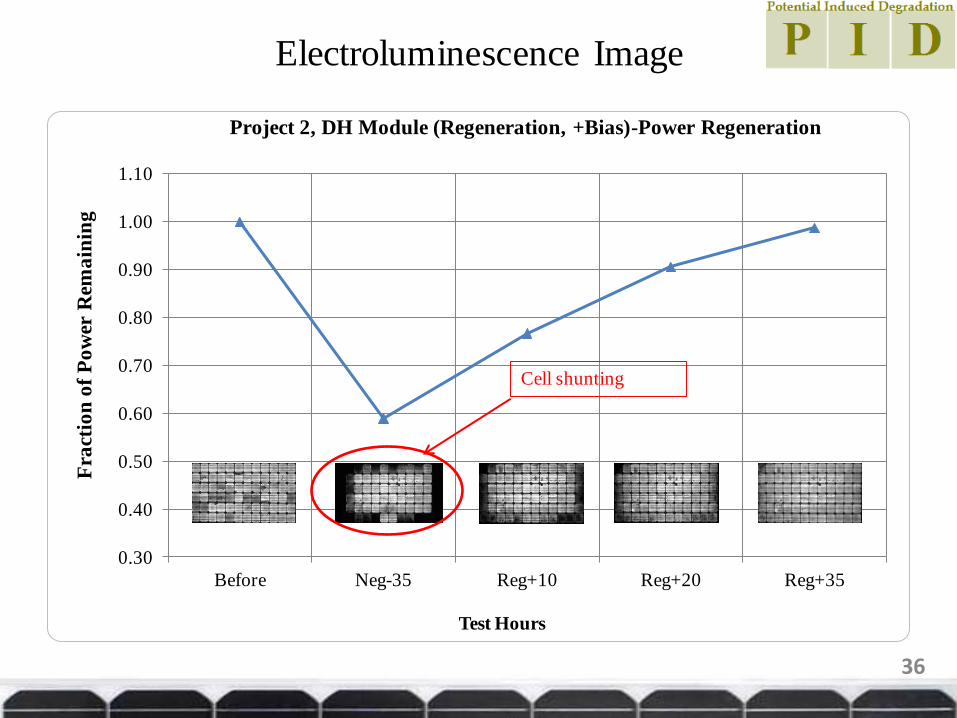
Electroluminescence Image
0.30
0.40
0.50
0.60
0.70
0.80
0.90
1.00
1.10
Before Neg-35 Reg+10 Reg+20 Reg+35
Fra
ctio
n o
f P
ow
er R
ema
inin
g
Test Hours
Project 2, DH Module (Regeneration, +Bias)-Power Regeneration
Cell shunting
36
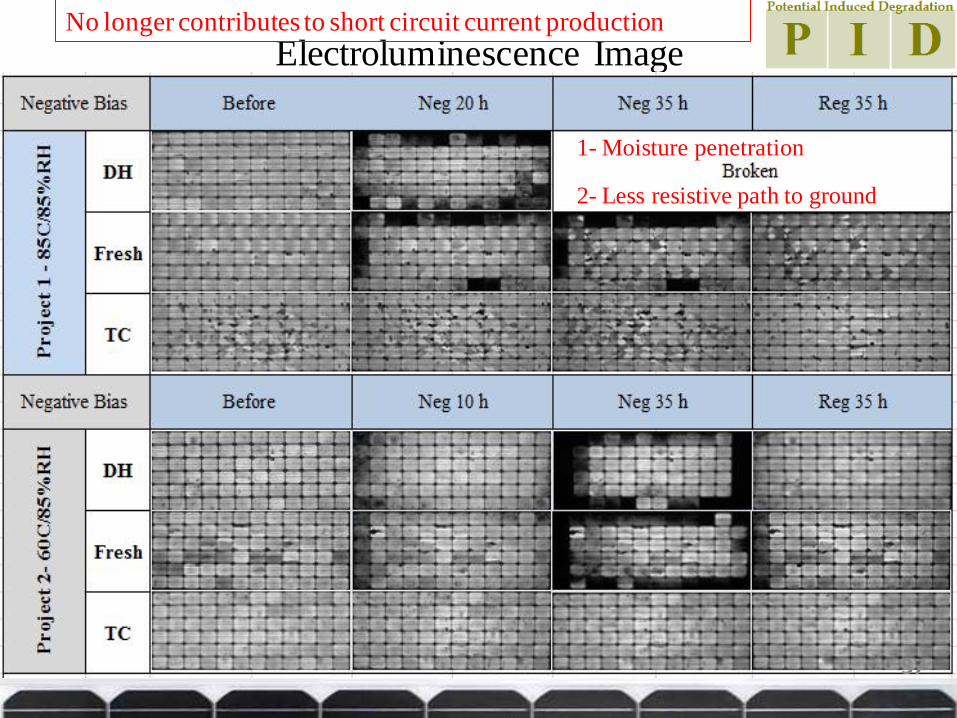
Electroluminescence Image
1- Moisture penetration
2- Less resistive path to ground
37
No longer contributes to short circuit current production
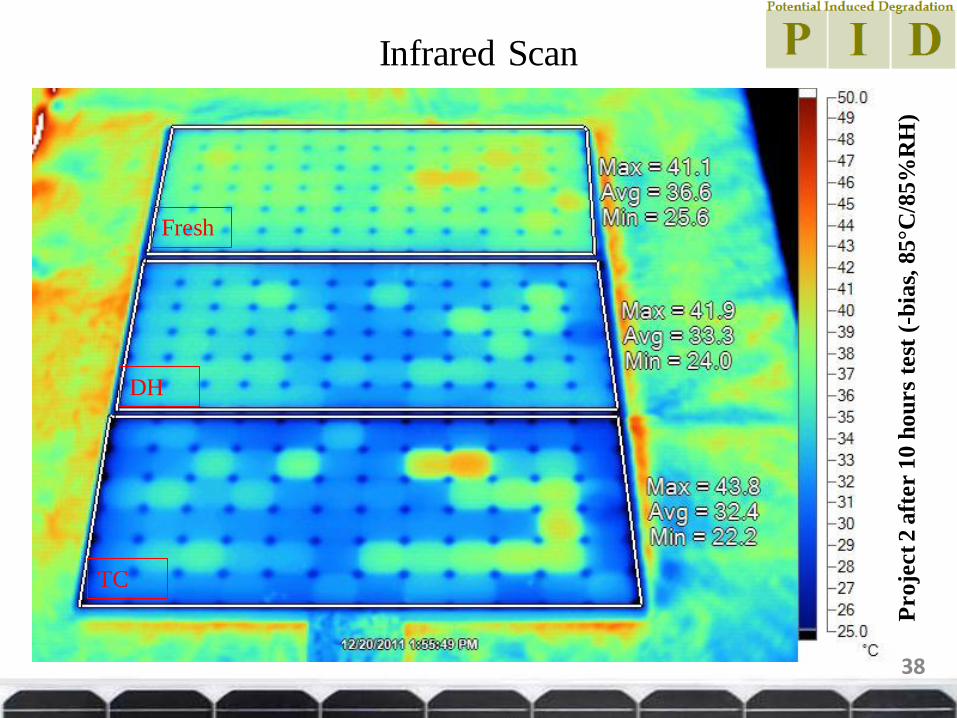
Infrared Scan
38
Fresh
DH
TC
Proje
ct 2 a
fter 1
0 h
ou
rs
test
(-b
ias,
85
°C/8
5%
RH
)
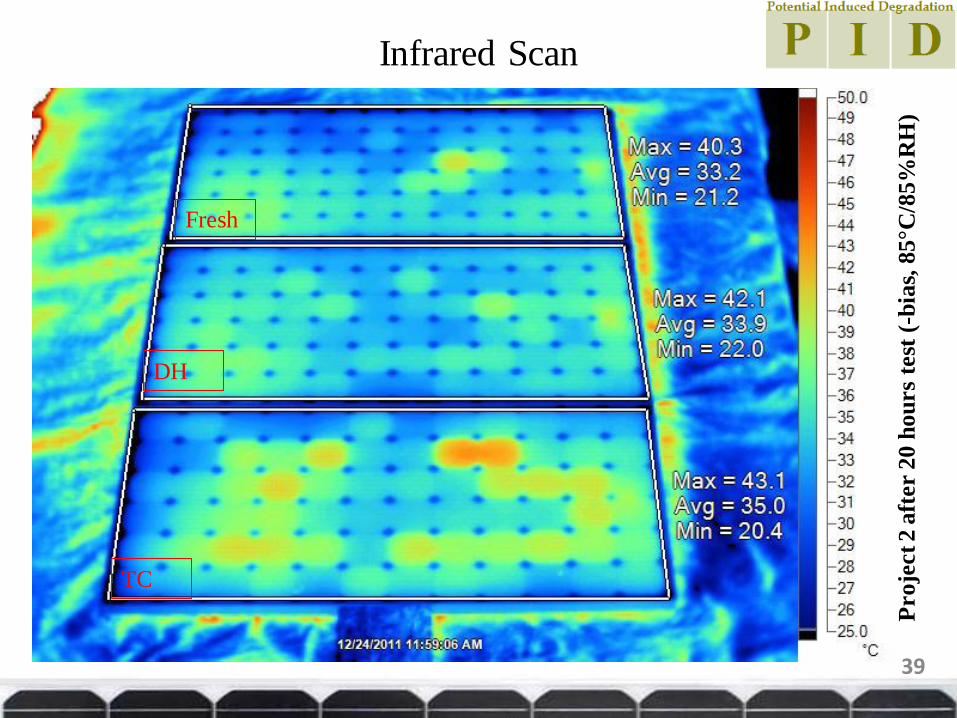
Infrared Scan
39
Fresh
DH
TC
Proje
ct 2 a
fter 2
0 h
ou
rs
test
(-b
ias,
85
°C/8
5%
RH
)
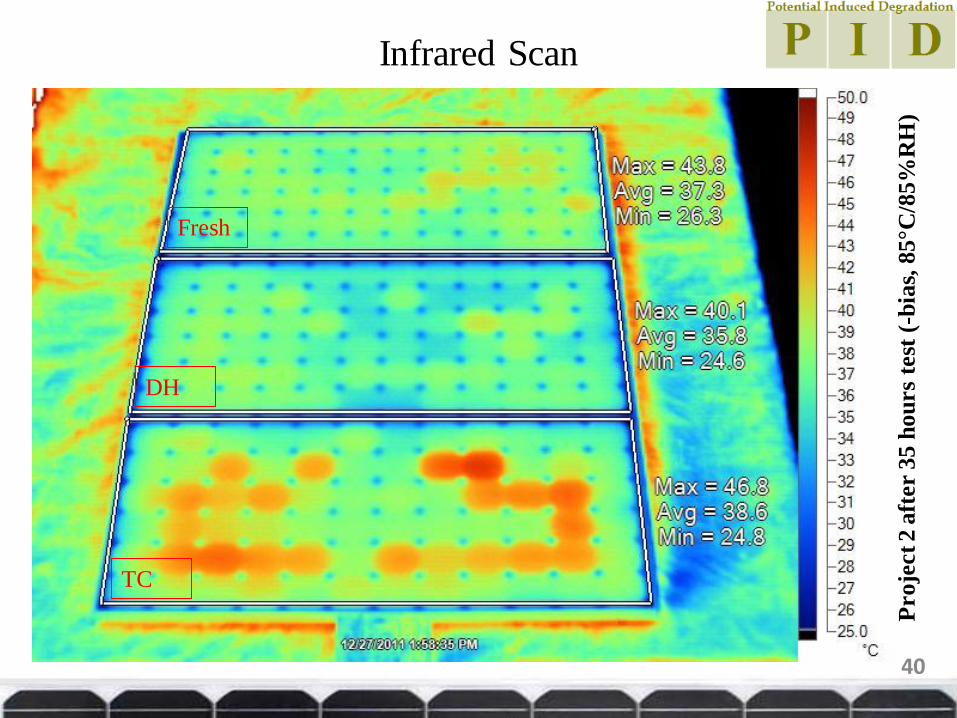
Infrared Scan
40
Fresh
DH
TC
Proje
ct 2 a
fter 3
5 h
ou
rs
test
(-b
ias,
85
°C/8
5%
RH
)
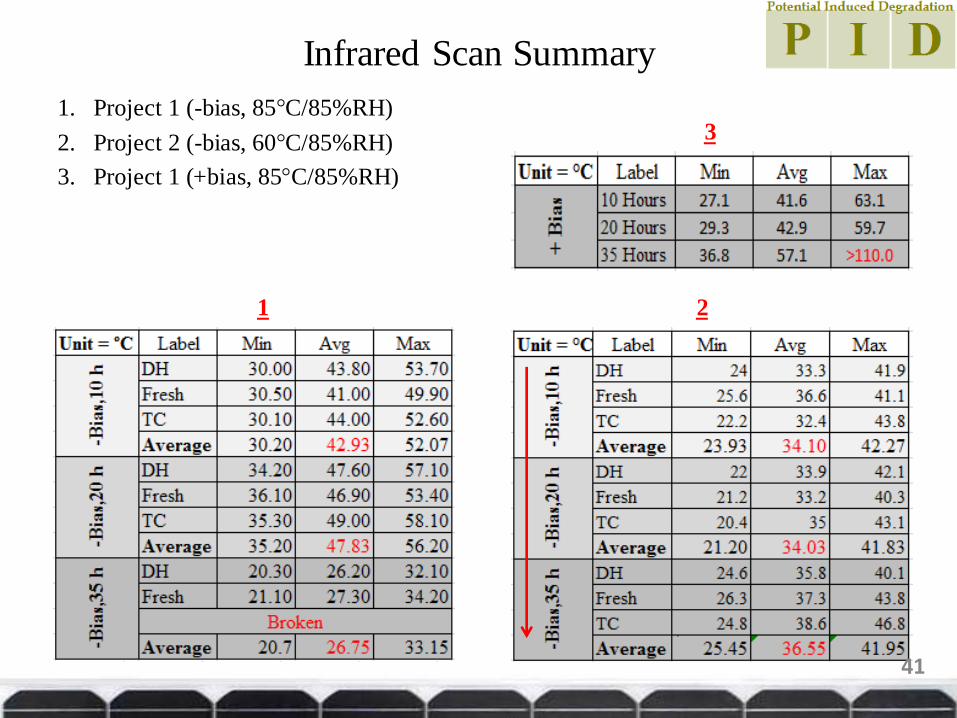
Infrared Scan Summary
1. Project 1 (-bias, 85°C/85%RH)
2. Project 2 (-bias, 60°C/85%RH)
3. Project 1 (+bias, 85°C/85%RH)
1
3
2
41
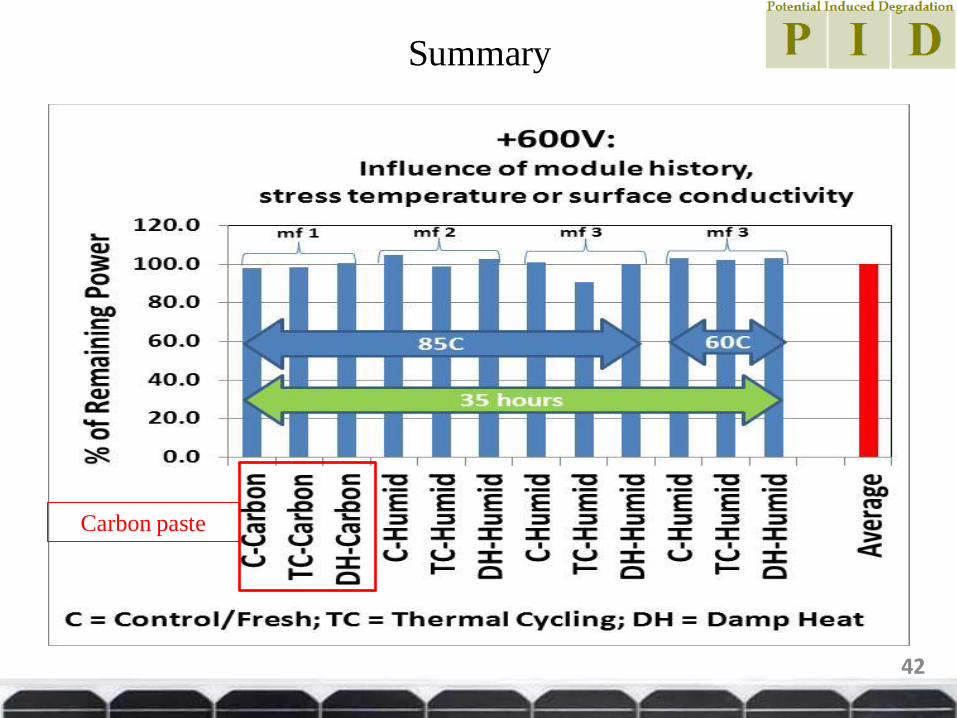
Summary
42
Carbon paste
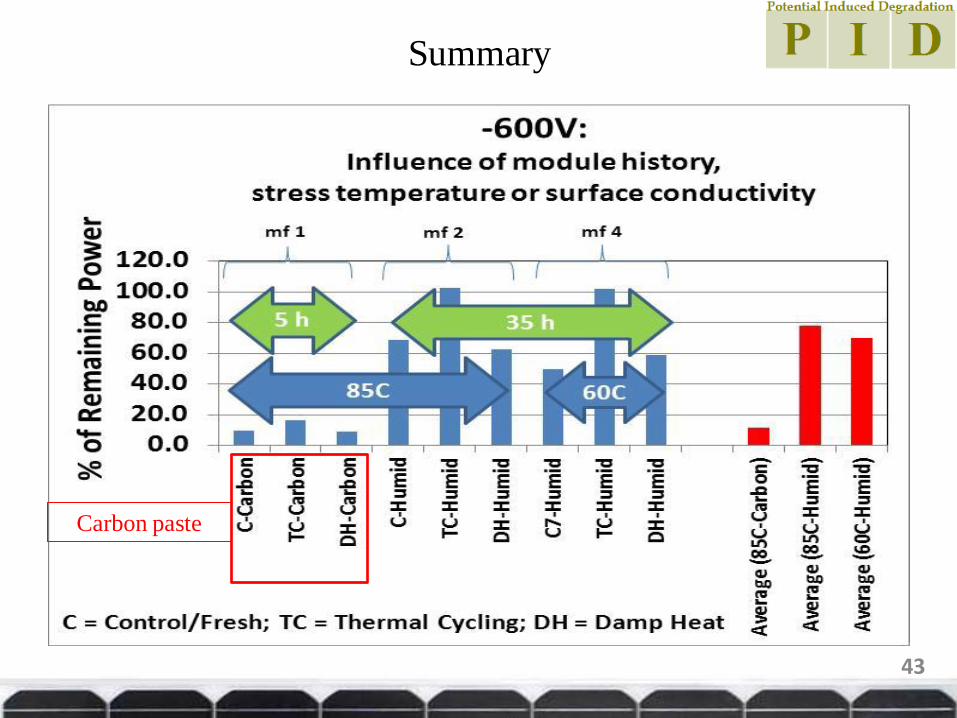
Summary
43
Carbon paste
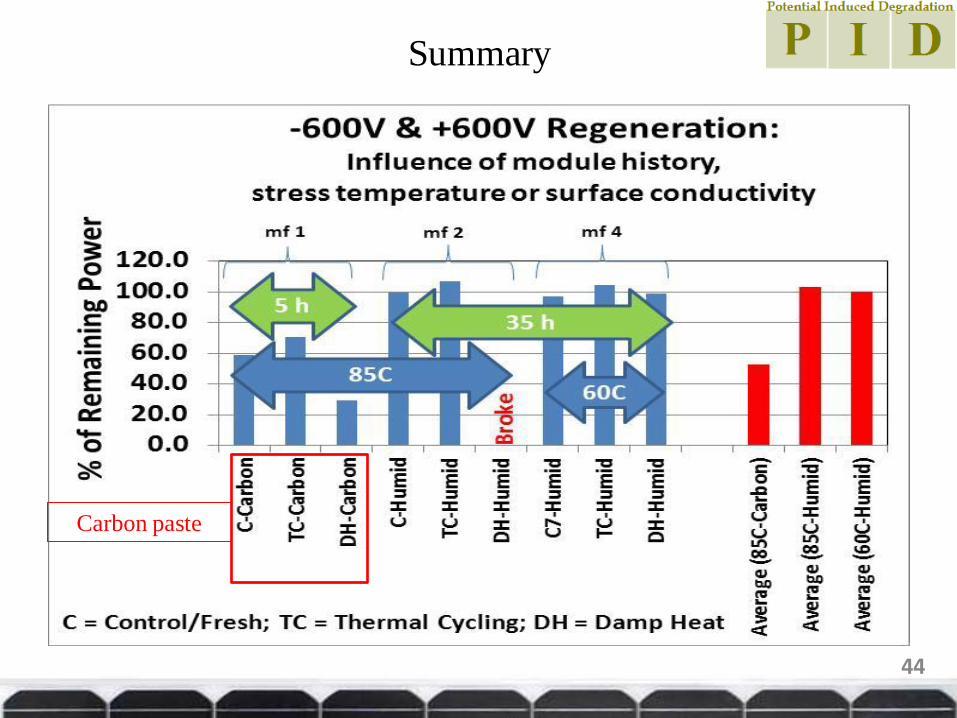
Summary
44
Carbon paste
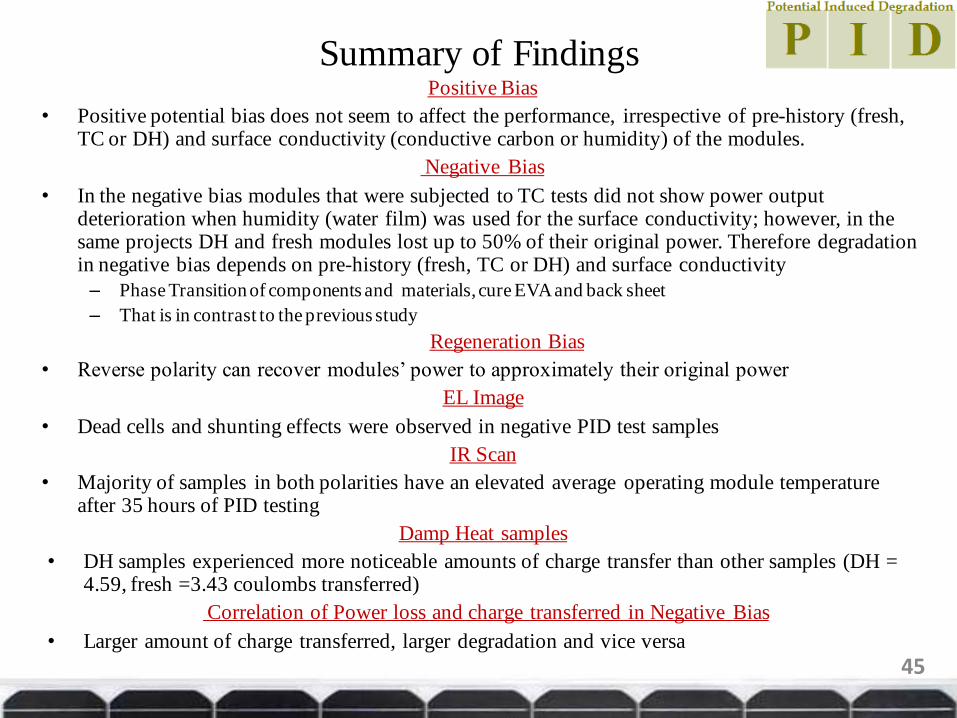
Summary of Findings Positive Bias
• Positive potential bias does not seem to affect the performance, irrespective of pre-history (fresh, TC or DH) and surface conductivity (conductive carbon or humidity) of the modules.
Negative Bias
• In the negative bias modules that were subjected to TC tests did not show power output deterioration when humidity (water film) was used for the surface conductivity; however, in the same projects DH and fresh modules lost up to 50% of their original power. Therefore degradation in negative bias depends on pre-history (fresh, TC or DH) and surface conductivity
– Phase Transition of components and materials, cure EVA and back sheet
– That is in contrast to the previous study
Regeneration Bias
• Reverse polarity can recover modules’ power to approximately their original power
EL Image
• Dead cells and shunting effects were observed in negative PID test samples
IR Scan
• Majority of samples in both polarities have an elevated average operating module temperature after 35 hours of PID testing
Damp Heat samples
• DH samples experienced more noticeable amounts of charge transfer than other samples (DH = 4.59, fresh =3.43 coulombs transferred)
Correlation of Power loss and charge transferred in Negative Bias
• Larger amount of charge transferred, larger degradation and vice versa
45
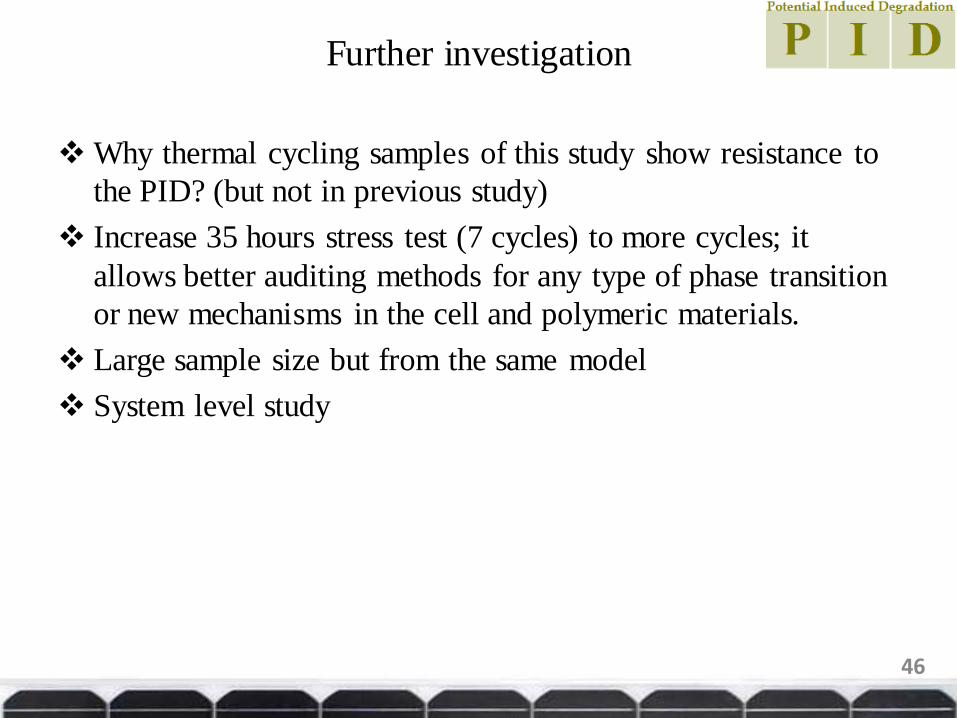
Further investigation
Why thermal cycling samples of this study show resistance to
the PID? (but not in previous study)
Increase 35 hours stress test (7 cycles) to more cycles; it
allows better auditing methods for any type of phase transition
or new mechanisms in the cell and polymeric materials.
Large sample size but from the same model
System level study
46
Acknowledgements
• Thankful to my advisor Dr. Govindasamy Tamizhmani for introducing me to
the world of Photovoltaic industry and specifically reliability of photovoltaic.
His encouragements and supports in various ways. And thanks to Joseph
Kuitche for discussing valuable information with me in relevance to the study.
• I gratefully thank Dr. Narcio F. Macia and Dr. Bradely Rogers for their time and
constructive comments on this paper.
• Thanks to Dr.Peter Hacke, NERL, for sharing his experiences regarding this
study.
• Regards and blessings to my parents, who without them it was impossible to
make it to this point. Their kind and unconditional support in all aspects during
the completion of my master’s studies.
And to all my PRL students (current and previous) specially;
Sandyha Goranti
Sai Tatapudi
Kolapo Olakonu
Meena Vemula
Annie
Jose Cano
Saurabh
Surya Narayana
End
References
[1] Peter Hacke “Considerations for a Standardized Test for Potential‐Induced
Degradation of Crystalline SiliconPV Modules” February 29, 2012 NREL/PR-5200-
54581
[2] J.A. del Cueto and S.R. Rummel “ Degradation of Photovoltaic Modules Under High
Voltage Stress in the Field” 2010
[3] Simon Koch “Potential Induced Degradation (PID) effects on crystalline solar
modules” 2011
[4] Ivo Kastle “Dealing with high voltage stress “ PV Magazin , 2011
[5] www.SMA.de “PV OFFSET BOX Night-time discharging of PV panels” SMA Solar
Technology
[6] P. B. Ghate “Electromigration-induced failures in VLSI interconnects” texas
instruments incorporated, “Thin Film Electromigration" Workshop, International
Reliability Physics Symposium, March 30, 1982.


![Degradation of Photovoltaic Conference Paperoriginally the group at JPL [1, 7] addressed the issue of HV-induced electrochemical corrosion and the impacts that encapsulants, moisture,](https://static.fdocuments.us/doc/165x107/5f3575016f3a2b5f1b0a6fae/degradation-of-photovoltaic-conference-originally-the-group-at-jpl-1-7-addressed.jpg)


