Post Graduate Diploma in Agricultural Extension Management ... · Course -201 Market Led Extension...
237
Post Graduate Diploma in Agricultural Extension Management (PGDAEM) AEM-201 Market Led Extension (4 Credits) National Institute of Agricultural Extension Management (An Organization of the Ministry of Agriculture, Govt. of India) Rajendranagar, Hyderabad – 500 030, Andhra Pradesh, India www.manage.gov.in
Transcript of Post Graduate Diploma in Agricultural Extension Management ... · Course -201 Market Led Extension...
Market Led Agricultural Extension – Challenges and Opportunities
1
Post Graduate Diploma in Agricultural Extension Management (PGDAEM)
AEM-201
Market Led Extension
(4 Credits)
National Institute of Agricultural Extension Management
(An Organization of the Ministry of Agriculture, Govt. of India)
Rajendranagar, Hyderabad – 500 030, Andhra Pradesh, India www.manage.gov.in
Course -201 Market Led Extension
2
Published by
National Institute of Agricultural Extension Management, Rajendranagar, Hyderabad – 500 030, Andhra Pradesh, India First Published: 2008 Revised 2013 © MANAGE, 2008 All rights reserved. No part of this work may be reproduced in any form, by mimeograph or any other means without permission in writing from the MANAGE. Shri. B. Srinivas, IAS Director General National Institute of Agricultural Extension Management(MANAGE), Rajendranagar, Hyderabad – 500 030, Andhra Pradesh, India
Programme Coordinators
Dr. S. Senthil Vinayagam, Director (Agril. Extn.) & Principal Coordinator (PGDAEM) Dr. K. Uma Rani, Deputy Director (Extn) Dr. M.A. Kareem, Deputy Director (Agri. Extn) Contributors (2008)
Dr. M.N. Reddy, Director (AE&C), MANAGE, Hyderabad Dr. N. Balasubramani, Assistant Director, MANAGE, Hyderabad Dr. N. Raveendaran, Professor, Agricultural Economics, Domestic & Export Market Intelligence cell, (DEMIC), CARDS, TNAU, Coimbatore Dr. K.A. Ponnusamy, Professor & Head, (Training) National Consultant, Extension Reforms, TNAU, Coimbatore Dr. S. Selvam, Associate Professor, Agricultural Economics, DEMIC, CARDS, TNAU, Coimbatore Shri. Uday Rao, Peyyala, PGDBM, IIM-B Dr.M.Chandrasekaran, Professor & Head, Dept. of Agricultural Economics; CARDS, TNAU, Coimbatore Mr. C. Muralidharan, Assistant Professor, Dept. of Agricultural and Rural Management, CARDS, TNAU, Coimbatore Dr. J. Dilip Babu, Principal Scientist, Horticulture, VBS, Post Harvest Technology, ARI, APHU, Hyderabad. Contributors (2013)
Dr. V.K.J. Rao, Principal Scientist, NAARM, Rajendranagar, Hyderabad. Dr. B.V. Dupare, Sr. Scientist, Directorate of Soybean Research (ICAR), INDORE, M.P.
Market Led Agricultural Extension – Challenges and Opportunities
3
AEM-201: Market Led Extension (4 Credits)
Block I: Dynamics of Market Led Extension
Unit-1 Market Led Agricultural Extension-Challenges and Opportunities 5 – 17
Unit-2 Market Intelligence 18 – 37
Unit-3 Market Information Service 38 – 43
Unit-4 Effectiveness of existing marketing channels and networking 44 – 67
Unit-5 Contract Farming 68 – 80
Unit-6 Primary Processing and Value Addition 81 – 106
Unit-7 Supply Chain Management 107 –144
Unit-8 Market development for Organic Products 145 – 151
Block II: Legal Framework for Agricultural Marketing
Unit-1 National Agricultural Policy 153 – 154
Unit-2 Model Act on Agricultural Marketing 155 – 165
Unit-3 Futures Trading and Commodity Marketing 166 – 189
Unit-4 Crop Insurance 190 – 216
Unit-5 WTO and its implications on Agriculture 217 – 237
Course -201 Market Led Extension
4
AEM-201
Market Led Extension
(4 Credits)
Block-I
Dynamics of Market Led Extension
Unit – 1 Market Led Agricultural Extension-Challenges and Opportunities
Unit – 2 Market Intelligence
Unit – 3 Market Information Service
Unit – 4 Effectiveness of existing marketing channels and networking
Unit – 5 Contract Farming
Unit – 6 Primary Processing and Value Addition
Unit – 7 Supply Chain Management
Unit – 8 Market development for Organic Products
Market Led Agricultural Extension – Challenges and Opportunities
5
Unit- 1
Market Led Agricultural Extension - Challenges and Opportunities
Structure
1.0 Objectives
1.1 Links between agriculture and the food industry
1.2 Challenges in agricultural marketing system
1.3 Enhanced Roles of Agricultural Extension Personnel in Light of
Market-Led Extension
1.4 Paradigm shift from Production-led Extension to Market-led Extension
1.5 Let us sum up
1.0 Objectives
After going through this unit you will be able to understand
• The need for Market Led Extension
• The role of agricultural extension personal in market led extension
• The differentiate production led extension and market led extension
1.1 Links between agriculture and the food industry
The link between agriculture and food continually evolves. In primitive societies,
the farmer and consumer were either the same family or close neighbors who bartered
their products and services, but as societies develop other linkages are added.
Commodity traders, processors, manufacturers who convert produce into food items
and retailers, among others, are interposed between the producer and consumer. A
Course -201 Market Led Extension
6
more recently introduced link into the chain is the scientist. As the link between food
and agriculture continues to evolve, we see emergence of an agribusiness i.e. where
agriculture and food become a continuum. Multinational companies are vertically
integrated organization with links all the way through from agricultural production to
etailing. There is a line of argument, which says that it makes sense that those who are
closest should the consumer, should assess his /her needs and interprets them back to
the primary producer.
As disposable incomes increase, the food industry will increase the quality and
diversity of the products it produces. Food manufactures will have particular
expectations of agriculture as a supplier of their raw materials, including:
To build a profitable business, food manufactures seek to establish a preference for
their products by differentiating those products in some way which is meaningful to
consumers. Then, in order to enable consumers to recognise the differentiated product,
manufacturers brand that product. Manufacturers can then work on building consumer
loyalty to these brands. Brand loyalty is normally only established by delivering high
quality consistently. As disposable incomes rise, the market tends to develop more
sophisticated needs and the quality of the raw material becomes even more critical.
Where agriculture is seeking to serve a food industry, that itself is seeking to meet these
more sophisticated needs and wants, it can expect to face increasing emphasis on
quality. Equally well, agriculture can expect to share in the better return for innovative
improvements in quality.
Next to quality will come cost. With an increased capability to search the world for
raw materials, the food industry is able to find the lowest cost source for any given level
of quality. For the food manufacturer, the country in which he/she manufactures, or
markets, need no longer be the source of agricultural produce. Improved transportation
and communications mean that the world is becoming his/her source of supply. This is
a significant change in the competitive environment of agriculture, which the farming
community has to realise, because they have, hitherto, been largely cocooned in their
respective domestic markets.
Market Led Agricultural Extension – Challenges and Opportunities
7
Agricultural products were traditionally seasonal in their production and supply.
Modern technology and cultural practices mean that food manufacturers need not have
their production schedules dictated by the seasons. Indeed the capital-intensive food
industry cannot afford to incur the high costs of under utllising its capacity. This means
that farmers will have to complete in terms of reducing seasonality or fitting into a
pattern of social competitiveness.
A manufacturer who has invested heavily in building up his brand will be very
keen to get reliable supplies in terms of quality, timing and cost. Producers of
agricultural produce will be increasingly judged on their reliability in all of these
respects.
Ease of processing will become an increasingly important expectation of the food
industry. Like all industries, reductions in the costs of capital equipment, wages and
inventories are important objectives. For example, farmers who can deliver on the ‘just-
in-time’ principle will contribute towards reducing a manufacturer’s working capital
and space requirements. Farmers who can do part of the secondary processing and /or
performing functions such as the post harvest treatment of the crop or transporting will
be adding another advantage. Crops that are specially bred or designed to facilitate
processing are another type of advantage that the food industry could expect from
agriculture. In short, the competitive advantage will rest with those able to add most
value and can differentiate what they are offering from that of other suppliers.
In competitive brand marketing, the food industry has to innovate continuously to
create new products that are different from and superior to existing ones of their own or
competitors. The scope of innovation has traditionally been at the processing stage.
Whilst this will continue to be an important area for innovation, manufacturers will
increasingly tend to look for innovative changes in the agricultural produce itself. This
may be in terms of novel tastes, improved texture, more attractive shapes, etc.
In the more sophisticated food markets, healthy eating can become a priority
among consumers. Therefore, farmers will have to consider the health connotations of
what they choose to grow. There are two aspects of health to be taken into account.
Course -201 Market Led Extension
8
First, consumers may be interested in the food itself i.e. low/no sugar or low/no salt.
Nutrition is important in all segments of the market. Thus farmers have to be concerned
about the nutritional value of the produce they grow. Second, the consumer may be
more, or equally, concerned about the food production methods i.e. the avoidance of
chemicals like herbicides, pesticides etc. This may mean a change to the farmer’s
cultivation practices with implications for the costs of production. The consumer and
the food industry will expect the farmer to produce without potentially dangerous
chemicals, but at no extra cost to them. This will be another challenge for agriculture.
1.2 Challenges in agricultural marketing system
Market size is large and continuously expanding, but marketing system not kept
pace
Private trade is 80% marketed surplus
Direct marketing “farmer – consumer “ is negligible
85% of the 27,294 rural periodic market, facilities for efficient trade is still almost
absent
7161 market yards/sub yards is inadequate, ill equipped and mismanaged
Due to lack of proper handling at farm gate lead to 30 % F&V, 7% grains, 10%
spices loss before reaching market
Rs 50,000 crores /year lost due to poor marketing chain
Risk bearing: In both the production and marketing of produce the possibility of
incurring losses is always present. Market risks are those of adverse change in
the value of the produce between the processes of production and consumption.
Storage of farm produce: Whether storage takes place on the farm or in silos off
the farm, increases in the value of products due to their time utility must be
sufficient to compensate for costs at this stage, or else storage will not be
profitable. These costs will include heating, lighting, chemical treatments, store
management and labour, capital investment in storage and handling equipment,
interest charges and opportunity costs relating to the capital tied up in stocks.
Market Led Agricultural Extension – Challenges and Opportunities
9
Among the less tangible costs is the risks attached to storage. These include
shrinkage due to piferage, pests, fungal growths and loss of quality due to
ageing. Another risk is that demand could fall with adverse effects on prices.
Grading : It is important to have a grading system, which accurately describes
products in a uniform and meaningful manner. Grades and standards contribute
to operational and pricing efficiency by providing buyers and sellers with a
system of communicating price and product information. By definition,
commodities are indistinguishable from one another. However, there are
differences between grades and this has to be communicated to the market. By
the same measure, buyers require a mechanism to signal which grades they are
willing to purchase and at what premium or discount. Prices vary among the
grades depending upon the relative supply of and demand for each grade. Since
the value of a commodity is directly by its grade, disputes can and do arise.
The absence of grades and standards restricts the development of effective and
efficient marketing systems.
Standardization: is concerned with the establishment and maintenance of
uniform measurements of produce quality and /or quantity. This function
simplifies buying and selling as well as reducing marketing costs by enabling
buyers to specify precisely what they want and suppliers to communicate what
they are able and willing to supply with respect to both quantity and quality of
product. In the absence of standard weights and measures trade either becomes
more expensive to conduct or impossible altogether
Processing: Most agriculture produce is not in a form suitable for direct delivery
to the consumer when it is first harvested. Rather it needs to be changed in some
way before it can be used. Of course, processing is not the only way of adding
value to a product. Storing products until such time as they are needed adds
utility and therefore adds value. Similarly, transporting commodities to
purchasing points convenient to the consumer adds value. In short, any action,
Course -201 Market Led Extension
10
which increases the utility of the good or service to prospective buyers, also adds
value to that product or service.
Quality differences in agricultural products arise for several reasons. Quality
differences may be due to production methods and /or because of the quality of
inputs used. Technological innovation can also give rise to quality differences.
In addition, a buyer’s assessment of a product’s quality is often an expression of
personal preference. Thus, for example, in some markets a small banana is
judged to be in some sense ‘better’ than a large banana; white sugar is considered
‘superior’ to yellow sugar; long stemmed carnations are of ‘higher quality’ than
short stemmed carnations. It matters not whether the criteria used in making
such assessments are objective or subjective since they have the same effect in the
marketplace. What does matter in marketing is to understand how the buyer
assesses ‘quality’.
Sporadic success stories of using information technology by farmers are
publicized. Internet technology has percolated down up to taluq level and in
some states up to village level. Search engines and the present websites furnish
general information presently. Agricultural Market related information on the
internet is inadequate. Hence, a whole network of skilled personnel need to be
engaged in collection of current information and creation of relevant websites
pertaining to / serving specific needs of farmers. Creation of websites should be
mandatory in different languages to equip the farmers with information. These
websites should contain information like market networks, likely price trends,
current prices, demand status options for sale, storage facilities etc.
Information technology should be able to provide answers to questions like what
and how much to produce, when to produce, in what form to sell, at what price
to sell, when to sell and where to sell. This kind of information to the farmers
with ‘press a button’ on the computer on a continuous updated basis. Then and
only then, the much talked about IT revolution would be beneficial to farmers.
Market Led Agricultural Extension – Challenges and Opportunities
11
Market intelligence: As far as is possible marketing decisions should be based on
sound information. The process of collecting, interpreting, and disseminating
information relevant to marketing decisions is known as market intelligence. The
role of market intelligence is to reduce the level of risk in decision-making.
Through market intelligence the seller finds out what the customer needs and
wants. The alternative is to find out through sales, or the lack of them.
Marketing research helps establish what products are right for the market, which
channels of distribution are most appropriate, how best promote products and
what process are acceptable to the market.
Generation of data on the market intelligence would be a huge task by itself.
Departments of market already possess much of the data. Hence, establishment
of linkages between agriculture line departments and Departments of Market
strengthens the market-led extension.
Financing: In almost any production system there are inevitable lags between
investing in the necessary raw materials (e.g. machinery, seeds, fertilizers,
packaging, flavorings, stocks etc.) and receiving payment for the sale of produce.
During these lag periods some individual or institution must finance the
investment. The question of where the funding of the investment is to come
from, at all points between production and consumption, is one that marketing
must address.
Facilitating Functions: it includes product standardization, financing, risk bearing
and market intelligence. Facilitating functions are those activities which enable
the exchange process to take place.
The gigantic size / mechanism of the public extension system in the country is
heavily burdened with performance of multi-farious activities in the field.
Extension system acts as liaison between the researcher and farmer. They are
endowed with the responsibility of conveying research findings from the
scientists to the farmers and feeding back the impressions of the farmers to the
Course -201 Market Led Extension
12
scientists. The new dimension of ‘marketing’ may overburden and become an
agenda beyond their comprehension and capability.
The public extension system is already under severe criticism for its inability to
deliver the services. In the light of this, the challenge remains to motivate the
extension personnel to learn the new knowledge and skills of marketing before
assigning them marketing extension jobs to establish their credibility and
facilitate significant profits for the farming community.
Extension cadre development poses a new challenge to the newly designed role.
The present extension system suffers from several limitations of stationery,
mobility, travel allowances, personnel development, etc. There is a dire need to
upgrade these basic facilities and free the extension cadres from the shackles of
the hygiene factors and enthuse them to look forward for the motivating factors
like achievement, job satisfaction, recognition etc
1.3 Enhanced roles of Agricultural Extension personnel in light of
Market-led Extension
* SWOT analysis of the market: Strengths (demand, high marketability, good price etc.), Weaknesses (the reverse of the above), Opportunities (export to other places, appropriate time of selling etc.) and Threats (imports and perishability of the products etc.) need to be analyzed about the markets. Accordingly, the farmers need to be made aware of this analysis for planning production and marketing.
* Organization of Farmers’ Interest Groups (FIGs) on commodity basis and building their capabilities with regard to management of their farm enterprise.
* Supporting and enhancing the capacities of locally established groups under various schemes / programmers like watershed committees, users groups, SHGs, water users’ associations, thrift and credit groups. These groups need to be educated on the importance, utility and benefit of self-help action.
* Enhancing the interactive and communication skills of the farmers to exchange their views with customers and other market forces (middlemen)
Market Led Agricultural Extension – Challenges and Opportunities
13
for getting feedback and gain the bargaining during direct marketing ex. Rythu Bazars, Agri-mandi and Uzavar Santhaigal etc.
* Establishing marketing and agro-processing linkages between farmers’ groups, markets and private processors
* Advice on product planning: selection of crops to be grown and varieties suiting the land holding and marketability of produce will be the starting point of agri-enterprise. Extension system plays an important role in providing information in this regard
* Educating the farming community: to treat agriculture as an entrepreneurial activity and accordingly plan various phases of crop production and marketing
* Direct marketing: farmers need to be informed abut the benefits of direct marketing. In some of the states, Rytu Bazars in AP, Apni Mandis in Punjab and Haryan and Uzavar Santhaigal in Tamilnadu have shown success
* Capacity building of FIGs in terms of improved production, post harvest operations, storage and transport and marketing
* Acquiring complete market intelligence regularly on various aspects of markets
* Regular usage of internet facility through computers to get updated on market intelligence
* Publication of agricultural market information in news papers, radio and Television besides internet
* Organization of study tours of FIGS: to the successful farmers/ FIGs for various operations with similar socio-economic and farming systems as the farmers learn more from each other
* Production of video films of success stories of commodity specific farmers
* Creation of websites of successful FIGs in the field of agribusiness management with all the information to help other FIGs achieve success
Required information to extension system and farmers
Present agricultural scenario and land use pattern
Suitability of land holding to various crops/enterprises
Crops in demand in near future
Course -201 Market Led Extension
14
Market prices of crops
Availability of inputs
Usage of inputs
Credit facilities
Desired qualities of the products by consumers
Market network of the local area and the price differences in various
markets
Network of storage and warehouse facilities available
Transport facilities
Regular updating of market intelligence
Production technologies like improved varieties, organic farming, usage of
bio-fertilizers and bio-pesticides, IPM, INM, and right methods of
harvesting etc.
Post-harvest management like processing, grading, standardization of
produce, value addition, packaging, storage, certification, etc. with
reference to food grains, fruits and vegetables, eggs, poultry, fish, etc.
Contract farming
Private modern terminal markets
Food retail chains
Food safety and quality standard
Certification
WTO regulations
Market Led Agricultural Extension – Challenges and Opportunities
15
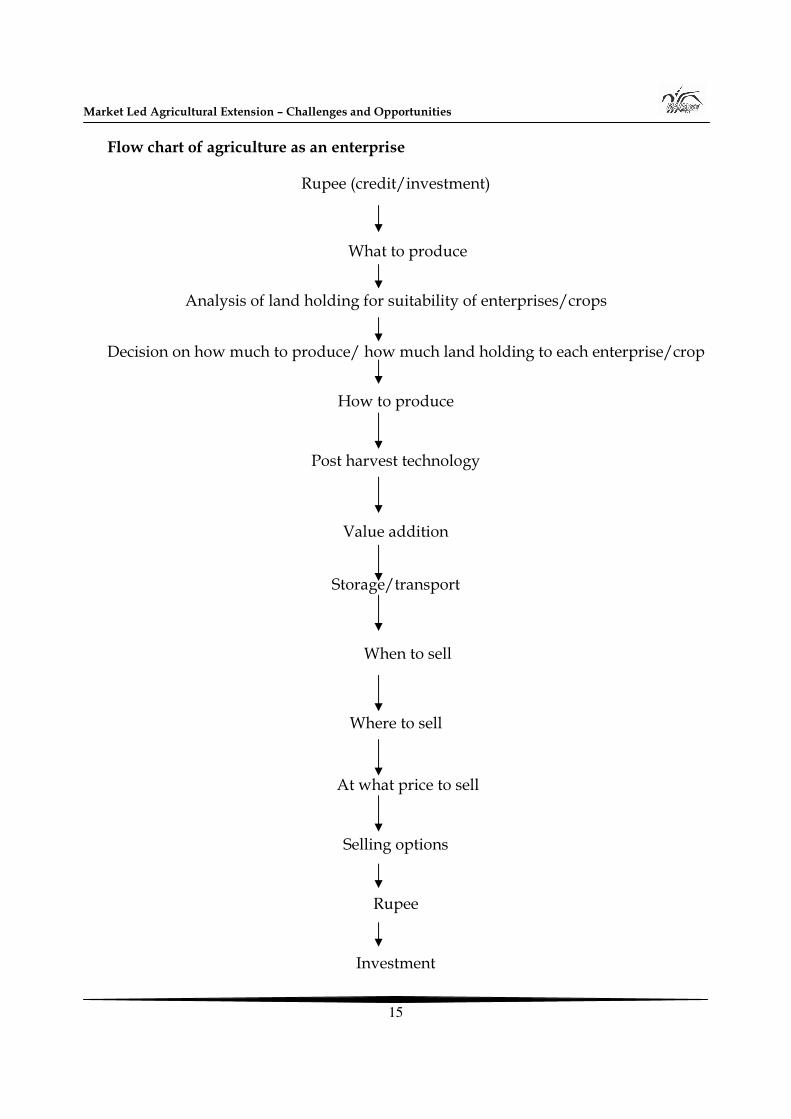
Flow chart of agriculture as an enterprise
Rupee (credit/investment)
What to produce
Analysis of land holding for suitability of enterprises/crops
Decision on how much to produce/ how much land holding to each enterprise/crop
How to produce
Post harvest technology
Value addition
Storage/transport
When to sell
Where to sell
At what price to sell
Selling options
Rupee
Investment
Course -201 Market Led Extension
16
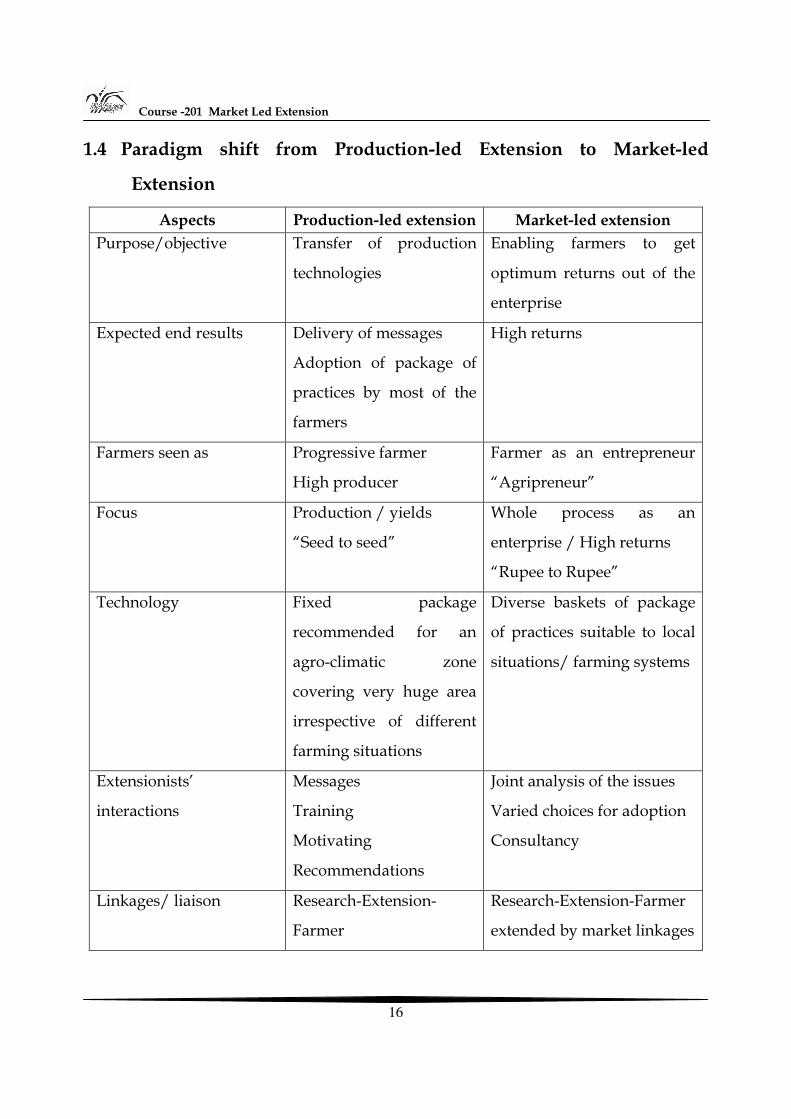
1.4 Paradigm shift from Production-led Extension to Market-led
Extension
Aspects Production-led extension Market-led extension Purpose/objective Transfer of production
technologies
Enabling farmers to get
optimum returns out of the
enterprise
Expected end results Delivery of messages
Adoption of package of
practices by most of the
farmers
High returns
Farmers seen as Progressive farmer
High producer
Farmer as an entrepreneur
“Agripreneur”
Focus Production / yields
“Seed to seed”
Whole process as an
enterprise / High returns
“Rupee to Rupee”
Technology Fixed package
recommended for an
agro-climatic zone
covering very huge area
irrespective of different
farming situations
Diverse baskets of package
of practices suitable to local
situations/ farming systems
Extensionists’
interactions
Messages
Training
Motivating
Recommendations
Joint analysis of the issues
Varied choices for adoption
Consultancy
Linkages/ liaison Research-Extension-
Farmer
Research-Extension-Farmer
extended by market linkages
Market Led Agricultural Extension – Challenges and Opportunities
17
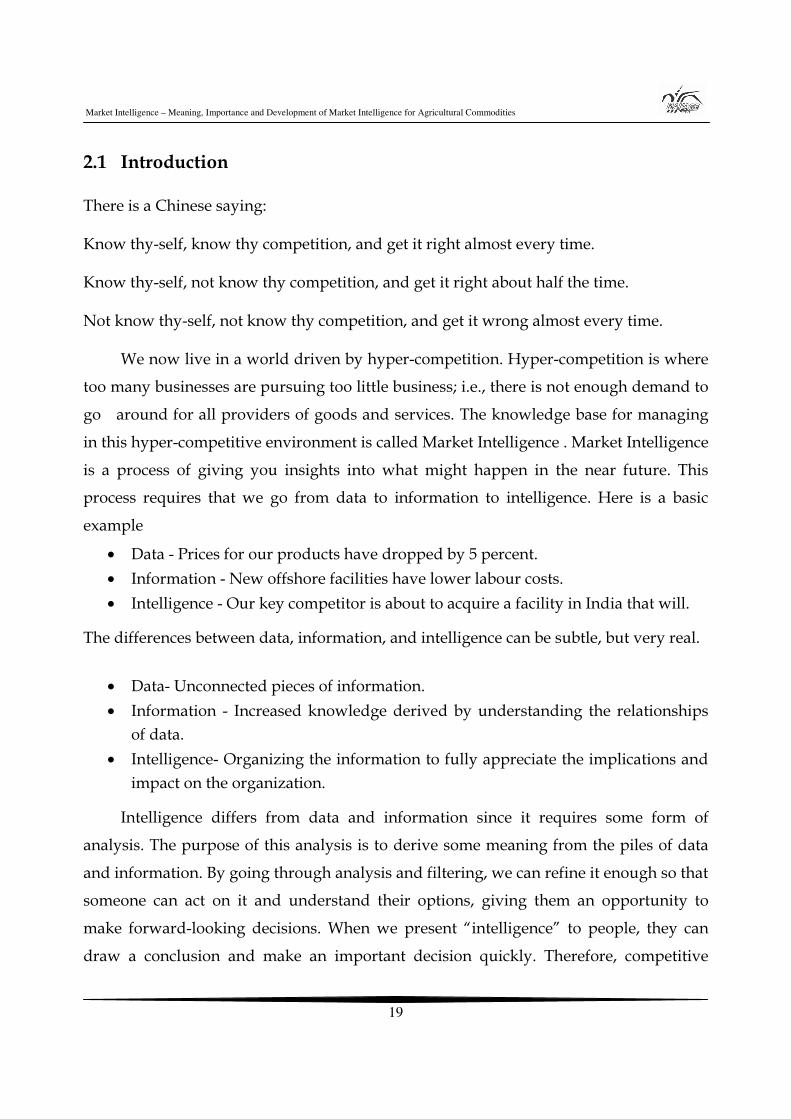
Extensionists’ role Limited to delivery mode
and feedback to research
system
Enriched with market
intelligence besides the TOT
function
Establishment of marketing
and agro-processing
linkages between farmer
groups, markets and
processors
Contact with farmers Individual Farmers’ Interest Groups
Commodity Interest Groups
/SHG’s
Maintenance of Records Not much importance as
the focus was on
production
Very important as
agriculture viewed as an
enterprise to understand the
cost benefit ratio and the
profits generated
Information Technology
support
Emphasis on production
technologies
Market intelligence
including likely price trends,
demand position, current
prices, market practices,
communication net work,
etc besides production
technologies
1.5 Let us Sum Up
The focus of the extension functionaries need to be extended beyond production. Farmers should be sensitized on various aspects on quality, consumer’s preference, market intelligence, processing and value addition and other marketing information. This will help the farming community to realize high returns for the produce, minimize the production costs, and improve the product value and marketability

Course -201 Market Led Extension
18
Unit- 2
Market Intelligence – Meaning, Importance and Development of Market Intelligence for Agricultural
Commodities Structure 2.0 Objectives
2.1 Introduction
2.2 Importance of Market Intelligence
2.3 Process of Market Intelligence
2.4 Steps in Market Intelligence
2.5 Analytical Models used in Market Intelligence
2.6 Best practices
2.7 Agricultural Market Intelligence System in India
2.8 Domestic and Export Market Intelligence Cell (DEMIC)
2.9 Case studies
2.10 Let us sum up
2.0 Objectives
After going through this unit, you will be able to:
Explain the importance of Market Intelligence in dynamic decision making
Describe the different issues to be considered in development of Market
Intelligence
Analyse important initiatives of Market Intelligence in India through DEMIC case
Choose the relevant topics and formats for Market Intelligence project.
Market Intelligence – Meaning, Importance and Development of Market Intelligence for Agricultural Commodities
19
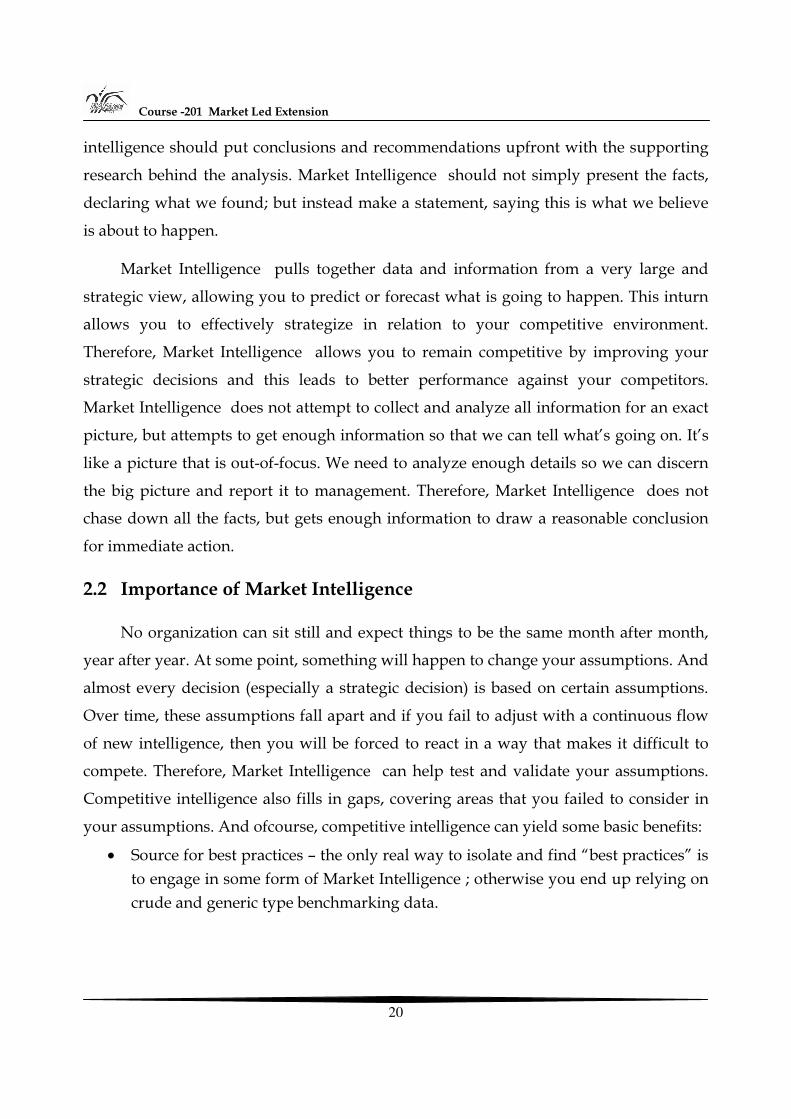
2.1 Introduction
There is a Chinese saying:
Know thy-self, know thy competition, and get it right almost every time.
Know thy-self, not know thy competition, and get it right about half the time.
Not know thy-self, not know thy competition, and get it wrong almost every time.
We now live in a world driven by hyper-competition. Hyper-competition is where
too many businesses are pursuing too little business; i.e., there is not enough demand to
go around for all providers of goods and services. The knowledge base for managing
in this hyper-competitive environment is called Market Intelligence . Market Intelligence
is a process of giving you insights into what might happen in the near future. This
process requires that we go from data to information to intelligence. Here is a basic
example
• Data - Prices for our products have dropped by 5 percent. • Information - New offshore facilities have lower labour costs. • Intelligence - Our key competitor is about to acquire a facility in India that will.
The differences between data, information, and intelligence can be subtle, but very real.
• Data- Unconnected pieces of information. • Information - Increased knowledge derived by understanding the relationships
of data. • Intelligence- Organizing the information to fully appreciate the implications and
impact on the organization.
Intelligence differs from data and information since it requires some form of
analysis. The purpose of this analysis is to derive some meaning from the piles of data
and information. By going through analysis and filtering, we can refine it enough so that
someone can act on it and understand their options, giving them an opportunity to
make forward-looking decisions. When we present “intelligence” to people, they can
draw a conclusion and make an important decision quickly. Therefore, competitive
Course -201 Market Led Extension
20
intelligence should put conclusions and recommendations upfront with the supporting
research behind the analysis. Market Intelligence should not simply present the facts,
declaring what we found; but instead make a statement, saying this is what we believe
is about to happen.
Market Intelligence pulls together data and information from a very large and
strategic view, allowing you to predict or forecast what is going to happen. This inturn
allows you to effectively strategize in relation to your competitive environment.
Therefore, Market Intelligence allows you to remain competitive by improving your
strategic decisions and this leads to better performance against your competitors.
Market Intelligence does not attempt to collect and analyze all information for an exact
picture, but attempts to get enough information so that we can tell what’s going on. It’s
like a picture that is out-of-focus. We need to analyze enough details so we can discern
the big picture and report it to management. Therefore, Market Intelligence does not
chase down all the facts, but gets enough information to draw a reasonable conclusion
for immediate action.
2.2 Importance of Market Intelligence
No organization can sit still and expect things to be the same month after month,
year after year. At some point, something will happen to change your assumptions. And
almost every decision (especially a strategic decision) is based on certain assumptions.
Over time, these assumptions fall apart and if you fail to adjust with a continuous flow
of new intelligence, then you will be forced to react in a way that makes it difficult to
compete. Therefore, Market Intelligence can help test and validate your assumptions.
Competitive intelligence also fills in gaps, covering areas that you failed to consider in
your assumptions. And ofcourse, competitive intelligence can yield some basic benefits:
• Source for best practices – the only real way to isolate and find “best practices” is to engage in some form of Market Intelligence ; otherwise you end up relying on crude and generic type benchmarking data.
Market Intelligence – Meaning, Importance and Development of Market Intelligence for Agricultural Commodities
21
• Helps formulate strategy through an understanding of your industry, yourself, and your competitors. Market Intelligence is the essence of strategic business analysis.
• Helps identify areas for improvement as well as risks and opportunities. • Isolates performance gaps in relation to the competition.
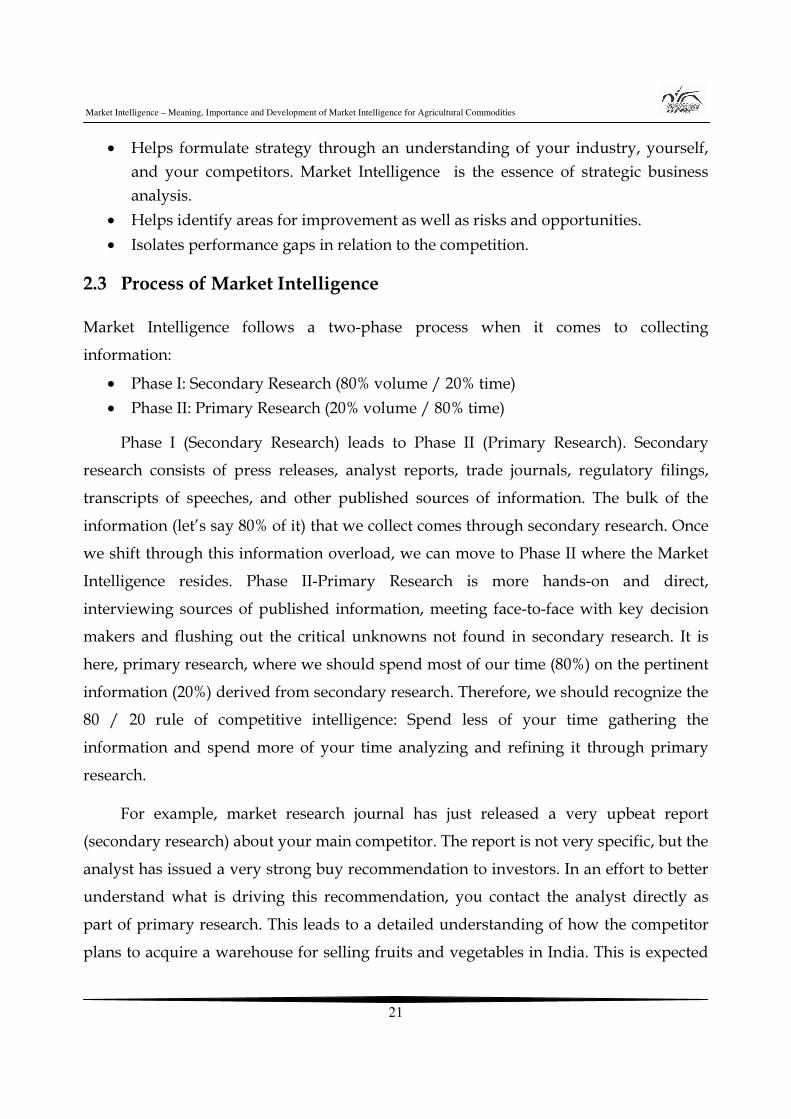
2.3 Process of Market Intelligence
Market Intelligence follows a two-phase process when it comes to collecting
information:
• Phase I: Secondary Research (80% volume / 20% time) • Phase II: Primary Research (20% volume / 80% time)
Phase I (Secondary Research) leads to Phase II (Primary Research). Secondary
research consists of press releases, analyst reports, trade journals, regulatory filings,
transcripts of speeches, and other published sources of information. The bulk of the
information (let’s say 80% of it) that we collect comes through secondary research. Once
we shift through this information overload, we can move to Phase II where the Market
Intelligence resides. Phase II-Primary Research is more hands-on and direct,
interviewing sources of published information, meeting face-to-face with key decision
makers and flushing out the critical unknowns not found in secondary research. It is
here, primary research, where we should spend most of our time (80%) on the pertinent
information (20%) derived from secondary research. Therefore, we should recognize the
80 / 20 rule of competitive intelligence: Spend less of your time gathering the
information and spend more of your time analyzing and refining it through primary
research.
For example, market research journal has just released a very upbeat report
(secondary research) about your main competitor. The report is not very specific, but the
analyst has issued a very strong buy recommendation to investors. In an effort to better
understand what is driving this recommendation, you contact the analyst directly as
part of primary research. This leads to a detailed understanding of how the competitor
plans to acquire a warehouse for selling fruits and vegetables in India. This is expected
Course -201 Market Led Extension
22
to take place in six months. Based on this intelligence, your company goes into action,
partnering with a nationwide super market chain and within three months you have out
maneuvored the competition to solidify your market share.
Secondary research tends to be easier than primary research since secondary
sources of information are public knowledge. Primary research is more difficult because
you are on a detective hunt, trying to track down loose ends. Primary research is often
done through a interview, such as contacting suppliers, customers, business writers, and
Government agencies. Surveys are sometimes used where several sources are involved.
There are several fine points to both secondary and primary research. Here are
some basic guidelines:
• Among the secondary sources of information; local sources are more revealing than national or global. For example, suppose we are analyzing Hudson Agro (ARUN ICE CREAM) and Hudson Agro is headquartered in Chennai, the local newspaper in Chennai will most likely carry more stories about Hudson Agro since it is a major employer in town. On the other hand, a nationwide publication like Business Week will rarely carry stories about Hudson Agro. Market Intelligence is the savvy art of knowing where to get the information.
• Secondary sources should be varied so that you collect different viewpoints. This helps reduce bias in your research.
• Internet related sources of information are often opinionated. Opinion related information is usually subjective and unreliable. Try to find sources of information that are based on solid investigative research as opposed to someone giving an opinion that turns out to be wrong.
• Your competitor’s will release an abundance of information – regulatory filings, credit reports, company newsletters, press releases, executive speeches, and other sources of information.
• Secondary research consists mainly of printed type sources of information. The most valuable sources of information are not published at all; but reside in those people who created the published materials.
You should also consider the 80 / 20 rule in relation to internal vs. external sources
of information. For example, most of what you need to know about your competition
can be found somewhere within your own organization. Sales people mingle with other
Market Intelligence – Meaning, Importance and Development of Market Intelligence for Agricultural Commodities
23
sales people within the industry. Many employees have experience from competing
companies. Procurement personnel will have a complete listing of suppliers for your
industry. Senior managers, research personnel, and others may have published reports,
given speeches pertinent to developments in your industry. Call center personnel are
always engaged in listening to customer complaints and suggestions. Legal personnel
can help define regulatory risks unique to your industry. All of these internal sources
can represent great sources of intelligence. The external sources represent the general
body of information at large, easy to obtain, and widely distributed. Also, by spending
more time upfront on internal sources, you are led to the appropriate external sources
(both published and human).
2.4 Steps in Market Intelligence
Market Intelligence is a logical approach to resolving critical marketing issues. A
typical Market Intelligence project gets organized around certain steps which are as
follows.
1. What critical question(s) must get answered? 2. What is the time frame for meeting the competitive intelligence objective? 3. Define the Market Intelligence Project, allocate resources, establish a scope, and
issue a quick plan for execution. 4. Launch secondary research – collect and organize data. 5. Analyze appropriate information, conduct primary research, and enlist others in
developing the deliverable. 6. Draft findings and recommendations; circulate for review. 7. Approve and distribute final report.
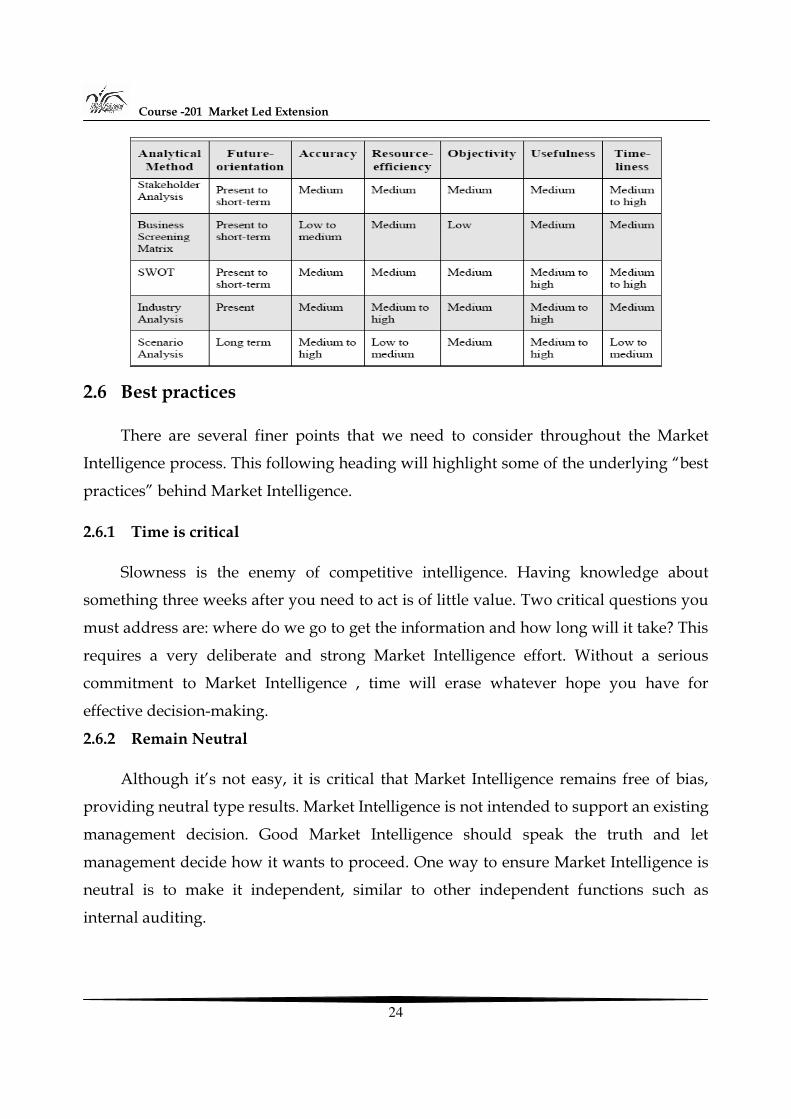
2.5 Analytical Models used in Market Intelligence
Craig Fuller and Bensoussan have Described in detail numerous analytical models
and how they should be applied. The authors referred as FAROUT (Forward Oriented,
Accurate, Resource Efficient, Objective, Useful, and Timely), for determining the overall
effectiveness of an analytical models.
Course -201 Market Led Extension
24
2.6 Best practices
There are several finer points that we need to consider throughout the Market
Intelligence process. This following heading will highlight some of the underlying “best
practices” behind Market Intelligence.
2.6.1 Time is critical
Slowness is the enemy of competitive intelligence. Having knowledge about
something three weeks after you need to act is of little value. Two critical questions you
must address are: where do we go to get the information and how long will it take? This
requires a very deliberate and strong Market Intelligence effort. Without a serious
commitment to Market Intelligence , time will erase whatever hope you have for
effective decision-making.
2.6.2 Remain Neutral
Although it’s not easy, it is critical that Market Intelligence remains free of bias,
providing neutral type results. Market Intelligence is not intended to support an existing
management decision. Good Market Intelligence should speak the truth and let
management decide how it wants to proceed. One way to ensure Market Intelligence is
neutral is to make it independent, similar to other independent functions such as
internal auditing.
Market Intelligence – Meaning, Importance and Development of Market Intelligence for Agricultural Commodities
25
2.6.3 Go where the information is
Sometimes competitive intelligence can be highly effective through casual and
obvious sources of information. One of the more time consuming activities within
competitive intelligence can be collecting and categorizing information. So knowing
where to look can be half the battle. The useful sources for Market Intelligence include
commercial databases, trade publications, research reports from analyst, and regulatory
reports.
2.6.4 Challenge conventional thinking
Great Market Intelligence will challenge management to think in new ways. There
are too many changes taking place in the World today. There is no way management
should be comfortable with the status quo. Therefore, Market Intelligence should
deliberately test and validate critical management decisions. Likewise, management
should welcome and encourage Market Intelligence to challenge both tactical and
strategic decision-making.
2.6.5 Act ethically
Market Intelligence should not engage in illegal acts. Additionally, Market
Intelligence should not jeopardize the reputation of a company.
2.7 Agricultural Market Intelligence System in India
Rural Markets (about 21731) are the first contact points of farmers with the market
economy, both for selling and buying. As there have been high price differentials many
times between the Wholesale Markets and the Rural Markets, there is room for arbitrage
which is being exploited by the traders to their advantage. Therefore, it is imperative to
make the Wholesale Markets as the price discovery point and the Rural Markets as the
price takers with due consideration for transport and other costs. As the Rural Markets
have few traders, the tendency to collude among them is high. In the Wholesale
Markets, as traders are many, one can expect a fair price. In a country like India with 70
per cent of its population living in about 6.25 lakh villages and depending on agriculture
Course -201 Market Led Extension
26
as their main occupation, accurate and timely Market Intelligence about the market
prices of the agricultural commodities is of extreme significance.
Market information and intelligence are crucial to enable farmers and traders to
make informed decisions about what to grow, when to harvest, to which markets
produce should be sent, and whether to store it or not. The most important marketing
intelligence need of the farmer is price intelligence. Agricultural price data are based on
thousands or millions of transactions, many of them on a small scale, that are taking
place every day all over the country. Collecting an adequate sample and making sure
that these are representative enough to be useful is not an easy task. As farmers become
more market oriented, extension workers need to be in a position to advise them not
only on how to grow crops but also on how to market them. Knowledge of produce
handling, storage and packaging is also essential. An understanding of costs and
margins is essential for all those involved with agricultural marketing. Before any agro-
processing venture is started, or before an existing venture decides to expand it’s
product line, an understanding of the market for the planned products is essential.
Market research can never guarantee success but it can certainly increase the likelihood
that the new business will turn out to be profitable. It can identify at an early stage those
processing ideas that are unlikely to lead to profitable operations.
The Central Government and it’s agencies, the State Governments and their
agencies and the private sector have undertaken some path-breaking initiatives (e.g.
AGMARKNET – www.agmarket.nic.in) by the Union Ministry of Agriculture, the e-
Vipnan initiative by the Madhya Pradesh State Government, ITC’s e-CHOUPAL, DCM
SHRIRAM’s Hariyali Kisan Bazar, etc) besides strengthening traditional information
sources such as individual State Agricultural Marketing Boards, Commodity Boards,
and Commodity Exchanges.
AGMARKNET is, the NICNET based Agricultural Marketing Information System
Network in the country, under its Central Sector Scheme titled “Marketing Research
and Information Network” (MRIN). This AGMARKNET project networked 735
Agricultural Produces Wholesale Markets (APWMs), during 2000-02 and embarked
Market Intelligence – Meaning, Importance and Development of Market Intelligence for Agricultural Commodities
27
upon additional 2,000 markets during the Tenth Plan Period (2002-2007). With about
2700 markets already covered under the project, AGMARKNET is well on its way to
exceed the target of 2810 networked nodes to be established during the Tenth Plan
Period. The Government initiative of the networking of agricultural produce markets
(AGMARKNET) and the AGMARKNET portal would facilitate the development of B2B
and B2C e-Commerce Model in the country. This project has the potential of expansion
to about 7557 Wholesale Markets located through out the country and further to about
22,000 markets in India. This ICT Project is a 'farmer-centric" project to put the farmers
on "global free trade zone on Internet".
The AGMARKNET project has led to a nation-wide information network for
speedy collection and diffusion of market information, computerization of market
related information such as market fees, and market charges, ensuring regularity and
reliability of data and increasing the efficiency in agricultural markets. AGMARKNET
project has also been designated as one of the Mission Mode Projects of the Department
of Information Technology (DIT), Government of India, and has won recognition
nationally and internationally, for effectively fulfilling the objective of speedy collection
and dissemination of agricultural marketing information for better market access and
price realization by the farming community. The AGMARKNET portal has, among the
others, details on:
• Commodities and varieties for 300+ commodities and 2,000+ varieties • Daily mandi-wise/commodity-wise prices and arrivals • e-Directory of markets of over 7,000 APMCs, 48 Marketing Boards
The advantages of this database accrue to the farmers, as they are not forced to sell
their produce in the nearest market at uneconomical prices. The challenge, if the full
potential of such ventures have utilized, is to take IT to rural India in a big way.
Constraints/Challenges are (a) connectivity in rural areas, (b) training of the
stakeholders and (c) ensuring data updation in real time frame.
Course -201 Market Led Extension
28
2.8 Domestic and Export Market Intelligence Cell (DEMIC)
Market information is an important aspect of agricultural production and
marketing. The importance of sound agricultural marketing policies for ensuring fair
returns to the farmers cannot be overemphasized. There are wide differences between
the prices realized by the farmers and the prices paid by the consumers for most of the
crops. Almost all States and Union Territories are providing market information in one
form or the other for the benefits of market users like producers, traders, and
consumers. However, the information is collected and disseminated by use of
conventional methods causing inordinate delay in communicating to different groups
and this, inturn, adversely affects the farmers in taking proper marketing decisions i.e,
whether to sell immediately or store the produce, whether to market the produce inland
or overseas, where to sell in domestic markets, during which part of the year he can get
remunerative prices etc. Globalization of agriculture has also opened up opportunities
for export of agricultural commodities for which demand by importing countries and
their quality specification and standards should be made available to domestic exporters
to pave for export led growth. The farmers should also be made aware of the
consequences of imports on domestic prices. All the above emphasized the need for
establishing the Domestic and Export Market Intelligence Cell (DEMIC).
2.8.1 Objectives
The main objective of DEMIC is to disseminate timely, comprehensive, current and
future price intelligence on agricultural commodities for better scientific decision-
making by farming community, traders, firms and researchers. More specifically,
• to forecast the supply and demand of important agricultural commodities in Tamil Nadu;
• to forecast future prices of major agricultural commodities; • to study the State and National market situation related to important
commodities; • to disseminate the market and price information to the farmers for planning,
production and holding stocks; and • to suggest policy measures to the Government of Tamil Nadu.
Market Intelligence – Meaning, Importance and Development of Market Intelligence for Agricultural Commodities
29
2.8.2 Activities
The major activities of the cell is to collect real time data on arrivals, prices and
transaction of important agricultural commodities from Regulated Markets in Tamil
Nadu, conducting market surveys, compiling commodity reports and assessing export
opportunities of agricultural commodities. Using these data, the cell forecasts the prices
of different commodities on a regular basis and the same is transmitted to the farmers
through Radio, Television and Newspapers and web developed for this purpose.
(www.tnagmark.tn.nic.in). Now all the stakeholders can access the real time price of
agricultural commodities varietywise, gradewise from all the major market centres of
India in English and Tamil covering more than 500 markets. Apart from price
information, other useful information available in the website are export procedures,
export standards for various agricultural commodities, infrastructure facilities (ports, air
cargo, railways, rural godowns, etc.), agri-export zones, food processing, post - harvest
technology and other useful links to various related websites.
An e-mail newsletter focussing on technical and market related information at
domestic and international levels has been developed by DEMIC in the banner of
“DEMIC Info Series” to sensitize the stakeholders and scientists.
2.8.3 Commodities and forecast schedule
• Turmeric - June 1st week • Cotton - June 2nd week • Onion - July 1st or 2nd week • Maize - August, September
Course -201 Market Led Extension
30
• Banana - August, September • Chillies - August • Groundnut - September • Gingelly - October • Tapioca - October, November • Potato - December • Black gram - May • Green gram – May
Price forecasts are done with the help of various statistical methods by utilizing
historical data and market surveys. Validation is important for measuring goodness of
any forecast. The forecast validation percentage of DEMIC scheduled crops was above
90 per cent. This shows the core strength of DEMIC.
2.8.4 Collaborating institutes
The collaborating institutes are Centre for Agricultural and Rural Development
Studies in Tamil Nadu Agricultural University, Department of Agricultural Marketing
and Agri-business, Government of Tamil Nadu and National Informatics Centre (NIC),
Government of India, Chennai Office.
2.9 Case studies
2.9.1 Price forecastcotton
Market Intelligence is a logical approach to resolving critical marketing issues. The
first Market intelligence report of DEMIC : Cotton gets organized around following
steps
Market Intelligence – Meaning, Importance and Development of Market Intelligence for Agricultural Commodities
31
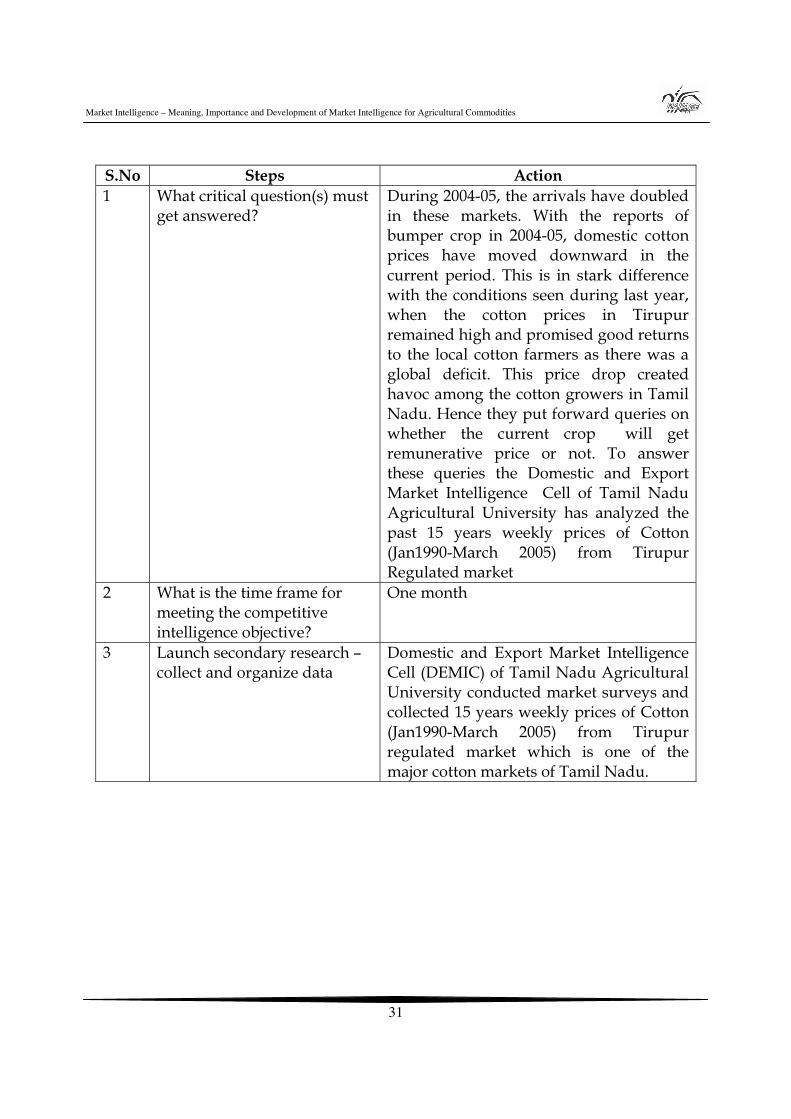
S.No Steps Action 1 What critical question(s) must
get answered?
During 2004-05, the arrivals have doubled in these markets. With the reports of bumper crop in 2004-05, domestic cotton prices have moved downward in the current period. This is in stark difference with the conditions seen during last year, when the cotton prices in Tirupur remained high and promised good returns to the local cotton farmers as there was a global deficit. This price drop created havoc among the cotton growers in Tamil Nadu. Hence they put forward queries on whether the current crop will get remunerative price or not. To answer these queries the Domestic and Export Market Intelligence Cell of Tamil Nadu Agricultural University has analyzed the past 15 years weekly prices of Cotton (Jan1990-March 2005) from Tirupur Regulated market
2 What is the time frame for meeting the competitive intelligence objective?
One month
3 Launch secondary research – collect and organize data
Domestic and Export Market Intelligence Cell (DEMIC) of Tamil Nadu Agricultural University conducted market surveys and collected 15 years weekly prices of Cotton (Jan1990-March 2005) from Tirupur regulated market which is one of the major cotton markets of Tamil Nadu.
Course -201 Market Led Extension
32
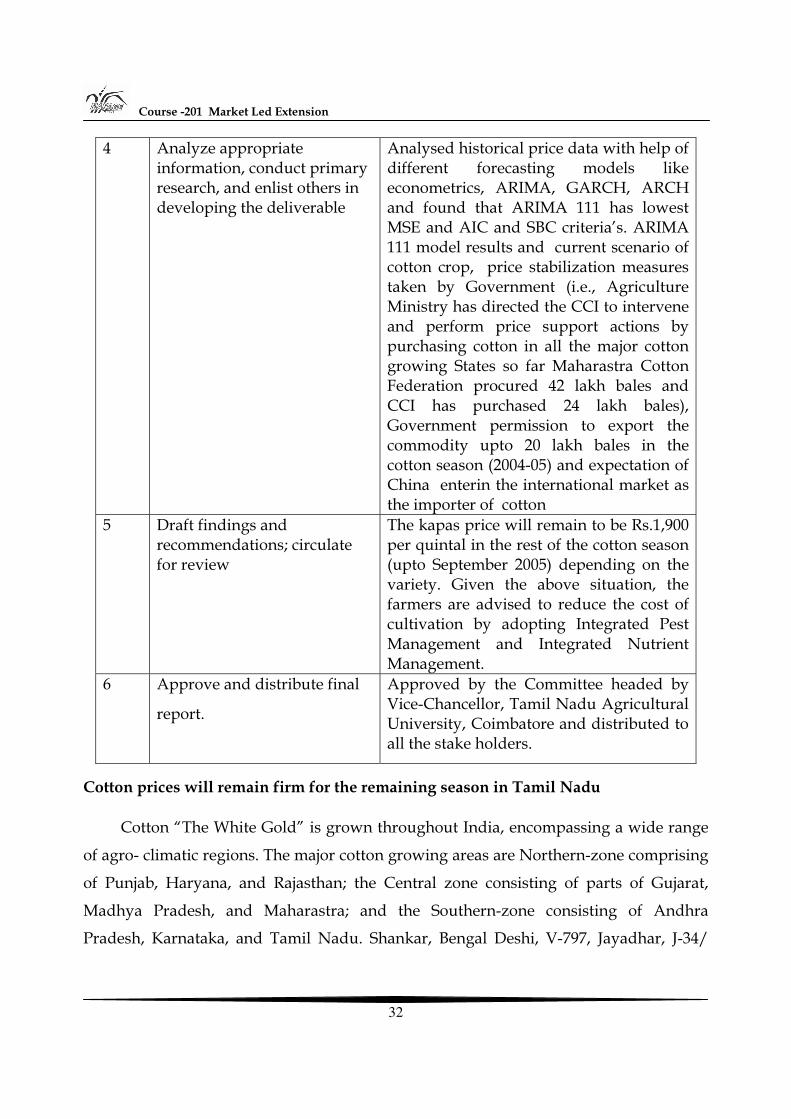
4 Analyze appropriate information, conduct primary research, and enlist others in developing the deliverable
Analysed historical price data with help of different forecasting models like econometrics, ARIMA, GARCH, ARCH and found that ARIMA 111 has lowest MSE and AIC and SBC criteria’s. ARIMA 111 model results and current scenario of cotton crop, price stabilization measures taken by Government (i.e., Agriculture Ministry has directed the CCI to intervene and perform price support actions by purchasing cotton in all the major cotton growing States so far Maharastra Cotton Federation procured 42 lakh bales and CCI has purchased 24 lakh bales), Government permission to export the commodity upto 20 lakh bales in the cotton season (2004-05) and expectation of China enterin the international market as the importer of cotton
5 Draft findings and recommendations; circulate for review
The kapas price will remain to be Rs.1,900 per quintal in the rest of the cotton season (upto September 2005) depending on the variety. Given the above situation, the farmers are advised to reduce the cost of cultivation by adopting Integrated Pest Management and Integrated Nutrient Management.
6 Approve and distribute final
report.
Approved by the Committee headed by Vice-Chancellor, Tamil Nadu Agricultural University, Coimbatore and distributed to all the stake holders.
Cotton prices will remain firm for the remaining season in Tamil Nadu
Cotton “The White Gold” is grown throughout India, encompassing a wide range
of agro- climatic regions. The major cotton growing areas are Northern-zone comprising
of Punjab, Haryana, and Rajasthan; the Central zone consisting of parts of Gujarat,
Madhya Pradesh, and Maharastra; and the Southern-zone consisting of Andhra
Pradesh, Karnataka, and Tamil Nadu. Shankar, Bengal Deshi, V-797, Jayadhar, J-34/
Market Intelligence – Meaning, Importance and Development of Market Intelligence for Agricultural Commodities
33
Bikaneri Narmasg, Y-1, NHH-44, LRA-5166, H-4/MECH-1, S-6/4, MCU-5, DCH-32, are
the major varieties/hybrids of cotton cultivated across the country.
Current level of production
With the revival of the monsoon in August, 2004, the predominantly rainfed States
of Central and Southern India resumed cotton cultivation energetically. The ability of
the crop to withstand late sowing conditions as compared to competing crops led to
larger area than anticipated planting in the States of Gujarat, Maharastra, and Andhra
Pradesh. The provisional planting estimates for 2004-05 and field sources confirmed that
area under cotton was 8.97 million hectares (accounting 20 percent of World area), a 12
per cent increase over last year. Market reports also confirmed the increase in planting
of the new improved hybrids and Bt cotton varieties. According to trade sources, about
40 per cent of the farmers cultivated Bt cotton. Adoption of Bt cotton, also improved the
yield prospectus for the 2004-05 cotton crop.
Cotton production is estimated to be 240-245 lakh bales each bale-170 kg in the
cotton season from October 2004 – September 2005 which is record cotton crop in India
(previous record was 17.8 million bales in 1996/97). Total inflows have already touched
195 lakh bales.
International scenario
According to the recent forecast made by the International Cotton Advisory
Committee (ICAC), global cotton production is expected to reach 25.43 million tons in
2004-2005 from 20.66 million tons in 2003-2004. Cotton consumption in the World is
likely to remain lower at around 22.85 million tons. An unprecedented 16 per cent
expansion in global cotton output forecast for 2004-05 combined with a modest rise of
2.5 per cent in World cotton consumption is set to play havoc in the market. The excess
production would contribute to further increase of stock. The international demand
estimates suggests that Cotlook A index will average 47 cents per pound this season, 21
cents (31 per cent) below the six year high in 2003-04. Thus world cotton prices are going
to rule rather weak over the next several months.
Course -201 Market Led Extension
34
Cotton Import and Export during 2004-05
Increased domestic production in India has however, lowered the estimate for the
2004-05 imports to 0.7 million bales as against 0.8 million bales during the last year.
Most imports are likely to be linked to extra long staple and specific purpose cotton.
Although import volumes depend on the relative prices of Indian versus International
cotton , anticipated lower prices and the improved quality of local cotton are expected
to limit cotton imports during the forthcoming season. So far in the last six seasons,
India has been a net importer of cotton, but exports has picked up in the last year to
recent months to neighbouring countries like Pakistan, Bangladesh and Far East
countries. Considering the higher domestic output, Indian cotton would wield the
advantage of being the cheapest fibre in the international market and export subsidy
would further facilitate it’s price advantage. Trade sources confirmed that the countries
that would evince interest on importing cotton are Korea, Taiwan and Indonesia,
besides some international shippers. The cotton varieties that will get importers'
enquiries are Shankar-6, Bunny, Brahma, Mech-1 and MCU-5. With cotton price fall
continuing in tandem with the international cotton futures, a price offer of 44-45 cents
per lb (on f.o.b.) for domestic cotton by the Indian exporters is possible this time and
invited appreciable trade enquiries from international shippers. Government to give
shape to its offer of an export subsidy for raw cotton may force some international
cotton shippers and specific cotton consuming countries in the Far-East to seriously
consider sourcing Indian cotton. The Cotton Corporation of India (CCI) has estimated
trade volume committed for export range up to four lakh bales.
Cotton Crop in Tamil Nadu
In Tamil Nadu, cotton is one of the important cash crops and the area started
declining from 2.39 lakh hectares in 90s to 0.75 lakh hectares in 2002-03. The major
markets for cotton are Tirupur, Villupuram and Theni. Regulated Markets and Co-
operative Marketing Societies act as facilitative organizations for cotton marketing in
Tamil Nadu. This year the arrivals have doubled in these markets. With the reports of
bumper crop in 2004-05, domestic cotton prices have moved downward in the current
Market Intelligence – Meaning, Importance and Development of Market Intelligence for Agricultural Commodities
35
period. This is in stark difference with the conditions seen during last year, when the
cotton prices in Tirupur remained high and promised good returns to the local cotton
farmers as there was a global deficit.
This price drop created havoc among the cotton growers in Tamil Nadu. Domestic
and Export Market Intelligence Cell (DEMIC) of Tamil Nadu Agricultural University
conducted market surveys and collected 15 years weekly prices of Cotton (Jan1990-
Marh 2005) from Tirupur regulated market which is one of the major cotton markets of
Tamil Nadu. Analysed historical price data with help of different forecasting models
like econometrics, ARIMA, GARCH, ARCH and found that ARIMA 111 has lowest MSE
and AIC and SBC criteria’s. ARIMA 111 model results and current scenario of cotton
crop, price stabilization measures taken by Government (i.e., Agriculture Ministry has
directed the CCI to intervene and perform price support actions by purchasing cotton in
all the major cotton growing States so far Maharastra Cotton Federation procured 42
lakh bales and CCI has purchased 24 lakh bales), Government permission to export the
commodity up to 20 lakh bales in the cotton season (2004-05) and expectation of China
entering the international market as the importer of cotton leads to the conclusion that
the kapas price will remain to be Rs.1900 per quintal in the rest of the cotton season
(upto September 2005) depending on the variety. Given the above situation, the farmers
are advised to reduce the cost of cultivation by adopting Integrated Pest Management
and Integrated Nutrient Management.
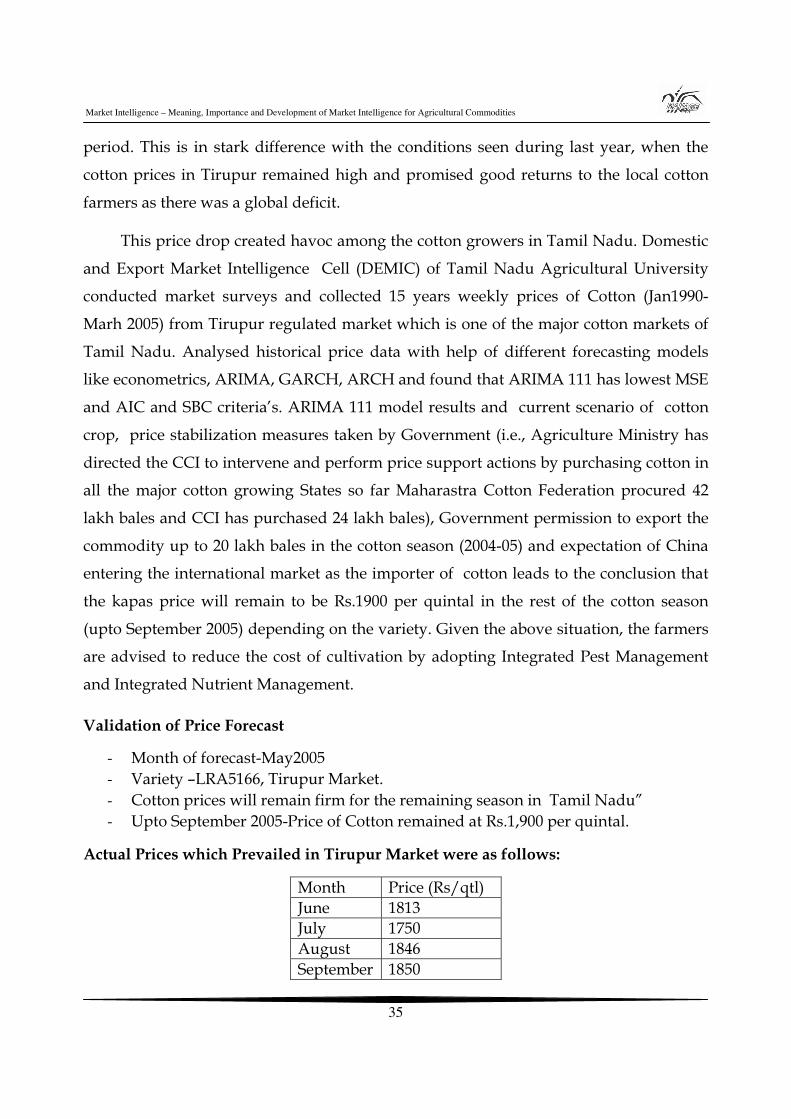
Validation of Price Forecast
- Month of forecast-May2005 - Variety –LRA5166, Tirupur Market. - Cotton prices will remain firm for the remaining season in Tamil Nadu” - Upto September 2005-Price of Cotton remained at Rs.1,900 per quintal.
Actual Prices which Prevailed in Tirupur Market were as follows:
Month Price (Rs/qtl) June 1813 July 1750 August 1846 September 1850
Course -201 Market Led Extension
36
2.9.2 Threat of New Competition
J & J Candy Company is a well-established maker of high volume, low cost candies
in India. Some of J & J’s products include chocolate covered peanuts, bubble gum, and
hard candies (mints, lolli-pops, etc.). J & J has strong market presence through wide
wholesale and retail distribution. At a recent luncheon, the Marketing Manager
discovered that XYZ has plans to introduce its candy products in India. The Marketing
Manager is not familiar with XYZ. However, in the interest of making sure nothing
happens, he informed the Market Intelligence (MI) Analyst about what he learned,
asking him to get back with management on the possible threat.
1. How should the Market Intelligence Analyst treat this information? 2. What analytical tools should the MI Analyst consider using?
Possible Solutions to Case
1. Confirm and verify the information directly to the source that informed the Marketing Manager. Find out who has this knowledge and where did he obtain it. The Marketing Manager can provide the name and perhaps the phone number for primary research. The MI Analyst can continue to confirm back to other sources, picking up more bits of insight into the intentions of XYZ. If the information is well collaborated and confirmed, then further MI should be conducted. For example, MI should find out more about the products XYZ will sell, when will XYZ move into the market space, and other information that puts J & J into action mode. MI continues to push until there is a clear threat and action must be taken. For example, suppose XYZ will market high premium candies that do not compete with J & J. The impact is now substantially less and warrants monitoring, but perhaps not immediate action. MI is the fine art of getting “enough” hard evidence to paint a clear picture of what will happen and how and when it will impact your company.
2. If the threat is confirmed as real, the MI Analyst needs to conduct competitive analysis directly against XYZ. Find out who buys their products, what products are they likely to introduce, where will they sell them, etc. The MI Analyst needs to issue a MI Alert, providing insights and possible action on how J & J can counter XYZ. For example, maybe J & J should launch similar products ahead of time in the same outlets where XYZ sells its candies. MI should help you out guess the moves of XYZ, minimizing the impact of the new competitor.
Market Intelligence – Meaning, Importance and Development of Market Intelligence for Agricultural Commodities
37
2.10 Let us sum up
We are in the hyper-competitive market environment. Market intelligence play a
curtail role to face this hyper competition to take appropriate marketing decision.
Market information and intelligence are crucial to enable farmers an traders to make
informed decisions about what to grow, when to grow, when to harvest, to which
markets produce should be sent and weather to store it or not. There are wide
differences between the prices realized by the farmers and price paid by the consumers
for most of the crops. Price forecasts are done with the help of various statistical
methods by utilizing historical data and market surveys. A validation is important for
measuring goodness of any forecdast.
Course -201 Market Led Extension
38
Unit- 3
Market Information Services Structure 3.0 Objectives
3.1 Introduction
3.2 Market Information Services
3.3 Defining Market Information Services
3.4 Significance of Market Information Services
3.5 Impact of Market Information Services
3.6 MIS Scenario
3.7 Agmarknet
3.8 Agriculture Extension Services
3.9 Essentials of MIS
3.10 Let us sum Up
3.0 Objectives
After going through this unit, you will be able to:
• Understand the value of information and role of Market Information Services • Appreciate the impact of Market Information Services in the context of
agriculture and • The role and significance of Agricultural Extension Services
3.1 Introduction
Market information is crucial to effective marketing management. Often,
marketing excellence of an organization has a relationship with the way in which
information is managed. Marketing excellence is the result of correct marketing
Market Information Services
39
decisions. Validity of the decisions depends on the information available to a manager.
The way a business firm handles marketing information causes the difference between
winning and losing the business game.
3.2 Market Information Services
Market Information Service (MIS) is a means of increasing the efficiency of
marketing systems and promoting improved price formation. Improved information
enables farmers to plan their production more in line with market demand, schedule
their harvests at the most profitable times, decide to which markets they should send
their produce and negotiate on a more even footing with traders.
Other benefits have been seen for traders. Improved information should enable
traders to move produce profitably from a surplus to a deficit market and to make
decisions about the viability of storage of produce during peak season.
A large percentage of MIS are primarily data-gathering exercises, and even this is
done inadequately. MIS suffer of lack a commercial approach and significant resource
constraints.
In designing a service, sustainability and commercial utility should be the prime
considerations. This implies detailed research into the needs of those involved in the
marketing system. It also implies tailoring the service to meet the resources available
and only expanding operations when additional funds can be obtained on a long-term
basis.
3.3 Defining Market Information Service
Market Information Service may operationally be defined as a service, usually
operated by the public sector, which involves the collection on a regular basis of
information on prices and, in some cases, quantities of widely traded agricultural
products from rural assembly markets, wholesale and retail markets, as appropriate,
and dissemination of this information on a timely and regular basis through various
Course -201 Market Led Extension
40
media to farmers, traders, government officials, policymakers and others, including
consumers.
3.4 Significance of Market Information Services
A Market Information Service is seen as providing “transparency,” i.e. a full
awareness of all parties of prevailing market prices and other relevant information. This,
in turn, can contribute to “arbitrage,” i.e. the act of buying at a lower price and selling at
a higher price. In theory, when a marketing system functions efficiently prices at
different markets are influenced by arbitrage activities of traders, i.e. “spatial arbitrage.”
takes place. Traders take advantage of price differences until these differences decrease
to the level of transaction costs. “Temporal arbitrage” is the storing of products in order
to take advantage of expected higher prices later in the season or, in some cases, in
subsequent years.
3.5. Impact of Market Information Services
1. They can facilitate efficient allocation of productive resources 2. The bargaining position of farmers with traders can be improved 3. Information reduces transaction costs (i.e. the costs of selling the produce) by
reducing risks. Farmers with timely and reliable information and the ability to interpret it, can decide to which market they should send their produce to maximize returns or, indeed, whether to send their produce to market at all
4. Lack of information is an entry barrier to both production and trade. Where farmers have had access to information, shifts in cropping patterns to higher value produce have been noted. In the area of trade, individuals find it difficult to begin trading without information, so reducing competition within markets
5. Market information can be particularly valuable where countries are changing over from a state-controlled marketing system to one of private enterprise, in that farmers and small traders are made more aware of market opportunities
6. By contributing to more efficient marketing, particularly improved spatial distribution, market information should be beneficial for consumers as well as farmers and traders. Information on retail prices may also, under certain circumstances, assist consumers to bargain
Market Information Services
41
7. The essence of a good Market Information Service is that it should provide commercially useful information on a timely basis. Information is also useful to policy makers. This improves policy formulation as the functioning of markets comes to be better understood
8. Market information is also an important component of Early Warning systems for food security as it can assist in identifying areas of possible shortages and can highlight whether prices are above or below normal seasonal trends
3.6 MIS Scenario
The Governments of several developing countries undertook the organization of
national development but without promoting decisive actions to foster, at the same
time, an adequate level of awareness about the use and value of information.
A problem with many MIS is that they become obsessed with processing and
analyzing the data and tend to ignore the end use of gathering it in the first place, i.e. to
provide speedy and useful information to farmers and traders. This is often a reflection
of the lack of a commercial orientation among Ministry officials, particularly those from
formerly centrally planned economies, who see data primarily in terms of its use for
planning and control purposes.
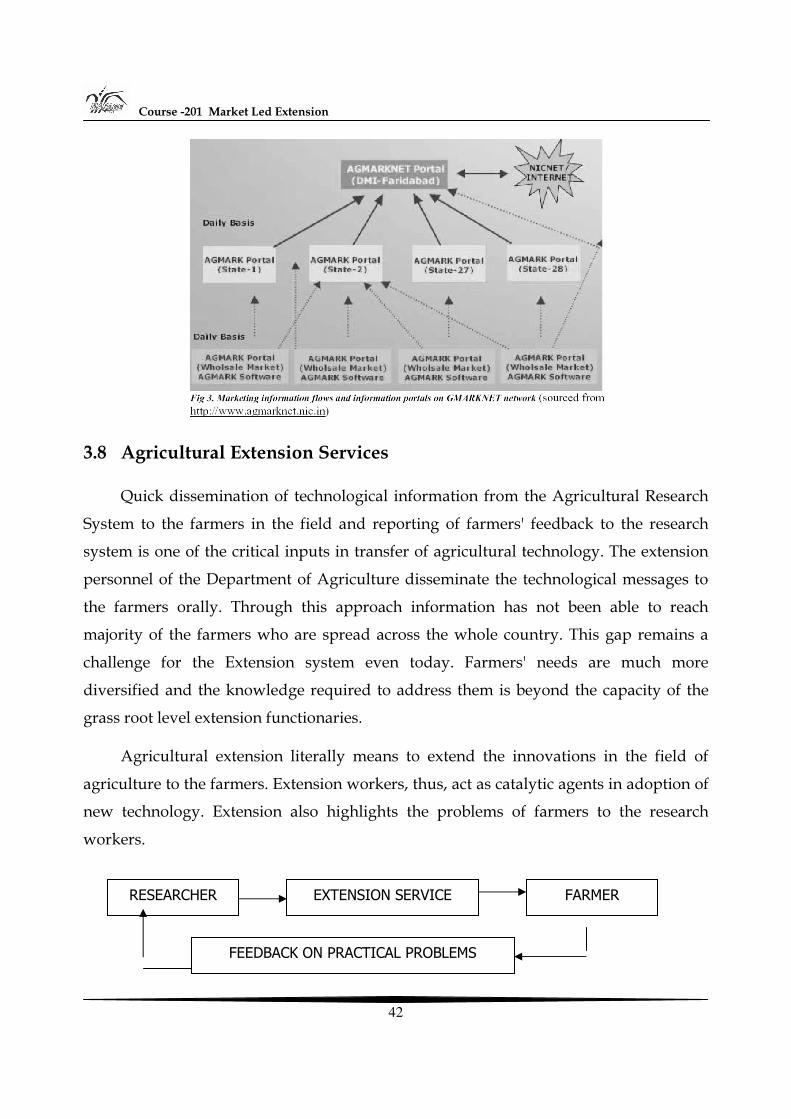
3.7 Agmarknet
The Indian government’s agriculture marketing system, AGMARKNET, heavily
uses information and communication technologies (ICT). It links wholesales markets,
states, national marketing information center through ICT based network. The
information collected from wholesale markets is consolidated, analyzed and
disseminated to various agriculture offices and organizations to support their
agriculture commodities planning and extension work. The fertilizer MIS of Ministry of
Agriculture, Bangladesh monitors demand, supply, and distribution system of select
fertilizers. The information comes from farmers, traders, importers, dealers, and big
users. The analytical reports are prepared daily, monthly and yearly, and disseminated
to the government policy makers, companies, and other organizations.
Course -201 Market Led Extension
42
3.8 Agricultural Extension Services
Quick dissemination of technological information from the Agricultural Research
System to the farmers in the field and reporting of farmers' feedback to the research
system is one of the critical inputs in transfer of agricultural technology. The extension
personnel of the Department of Agriculture disseminate the technological messages to
the farmers orally. Through this approach information has not been able to reach
majority of the farmers who are spread across the whole country. This gap remains a
challenge for the Extension system even today. Farmers' needs are much more
diversified and the knowledge required to address them is beyond the capacity of the
grass root level extension functionaries.
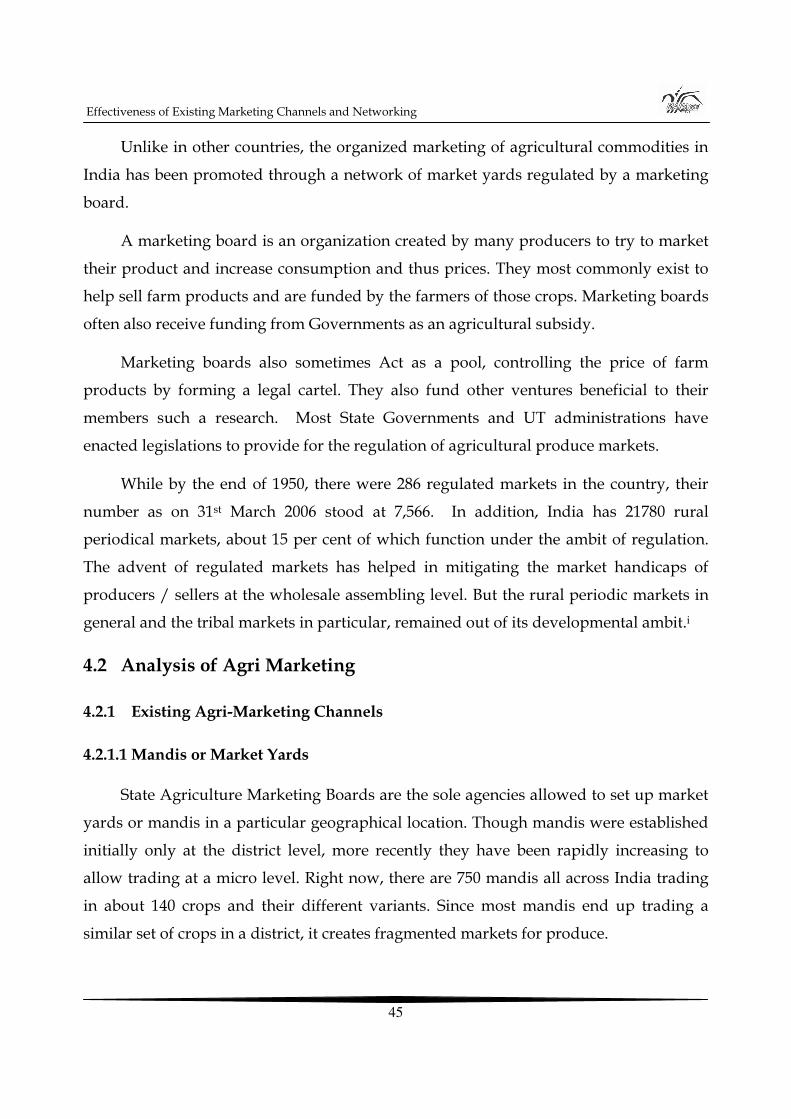
Agricultural extension literally means to extend the innovations in the field of
agriculture to the farmers. Extension workers, thus, act as catalytic agents in adoption of
new technology. Extension also highlights the problems of farmers to the research
workers.
RESEARCHER EXTENSION SERVICE FARMER
FEEDBACK ON PRACTICAL PROBLEMS
Market Information Services
43
3.9 Essentials of MIS
• The Institutional Structure • Ensuring Sustainability • Analyzing the Marketing System and its Information Needs • Focus on Products and Market Needs • Market Information for Consumers • Frequency of Collection of Information
3.10 Let Us Sum Up
A Market Information Service with the necessary commercial focus should initially
concentrate on just one or a few principle wholesale and assembly markets. Product
coverage should be limited to those crops which have a sizeable number of producers,
are seasonally important and which have much demand. Specialty crops, such as herbs,
where demand is relatively small and where measurement of the price is complicated
due to lack of standard units, should be avoided. The MIS should plan to provide
information on a daily basis, even if this necessitates staff working outside normal office
hours. The need to provide up-to-date price information is particularly essential in the
case of perishable produce and where prices change continuously. Only when a service
is able to carry out these limited activities on a visibly sustainable basis should
expansion be contemplated.
Whichever method of information provision is adopted in a particular country, it is
important that regular, timely and reliable market information is collected and made
available and that the users, particularly farmers, are assisted with interpretation of the
data. Mistakes have undoubtedly been made in the past; it is hoped that this publication
will mean that some of those mistakes can be avoided in the future.
Course -201 Market Led Extension
44
Unit- 4
Effectiveness of Existing Marketing Channels and Networking
Structure
4.0 Objectives
4.1 What is Agri-Marketing
4.2 Analysis of Agri-Marketing
4.3 The legal framework for Agri Marketing
4.4 Retail Industry in India
4.5 Study of Safal
4.6 Let us sum up
4.0 Objectives
After going through this unit, you will be able to understand:
• Role of various stakeholders in Agricultural Activity • The mechanism of Agriculture Marketing in India • What are the agricultural marketing channels and their effectiveness • The system of retail marketing of agricultural products
4.1 Agriculture Marketing
Agri – Marketing in India refers to the mechanism and infrastructure prevalent to
ensure that the produce grown by farmers is efficiently and effectively supplied to end
customers, while in the process ensuring that farmers get a fair deal out of their sale,
and that customers obtain the necessary produce at fair prices.
Effectiveness of Existing Marketing Channels and Networking
45
Unlike in other countries, the organized marketing of agricultural commodities in
India has been promoted through a network of market yards regulated by a marketing
board.
A marketing board is an organization created by many producers to try to market
their product and increase consumption and thus prices. They most commonly exist to
help sell farm products and are funded by the farmers of those crops. Marketing boards
often also receive funding from Governments as an agricultural subsidy.
Marketing boards also sometimes Act as a pool, controlling the price of farm
products by forming a legal cartel. They also fund other ventures beneficial to their
members such a research. Most State Governments and UT administrations have
enacted legislations to provide for the regulation of agricultural produce markets.
While by the end of 1950, there were 286 regulated markets in the country, their
number as on 31st March 2006 stood at 7,566. In addition, India has 21780 rural
periodical markets, about 15 per cent of which function under the ambit of regulation.
The advent of regulated markets has helped in mitigating the market handicaps of
producers / sellers at the wholesale assembling level. But the rural periodic markets in
general and the tribal markets in particular, remained out of its developmental ambit.i
4.2 Analysis of Agri Marketing
4.2.1 Existing Agri-Marketing Channels
4.2.1.1 Mandis or Market Yards
State Agriculture Marketing Boards are the sole agencies allowed to set up market
yards or mandis in a particular geographical location. Though mandis were established
initially only at the district level, more recently they have been rapidly increasing to
allow trading at a micro level. Right now, there are 750 mandis all across India trading
in about 140 crops and their different variants. Since most mandis end up trading a
similar set of crops in a district, it creates fragmented markets for produce.
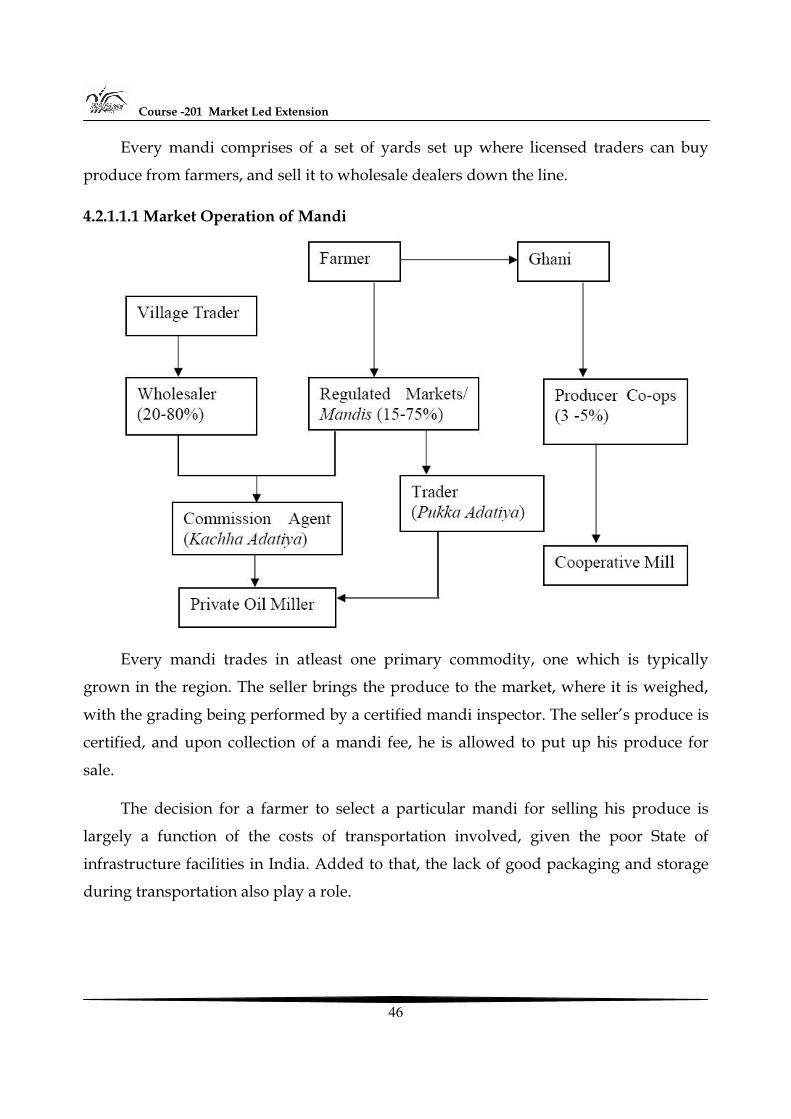
Course -201 Market Led Extension
46
Every mandi comprises of a set of yards set up where licensed traders can buy
produce from farmers, and sell it to wholesale dealers down the line.
4.2.1.1.1 Market Operation of Mandi
Every mandi trades in atleast one primary commodity, one which is typically
grown in the region. The seller brings the produce to the market, where it is weighed,
with the grading being performed by a certified mandi inspector. The seller’s produce is
certified, and upon collection of a mandi fee, he is allowed to put up his produce for
sale.
The decision for a farmer to select a particular mandi for selling his produce is
largely a function of the costs of transportation involved, given the poor State of
infrastructure facilities in India. Added to that, the lack of good packaging and storage
during transportation also play a role.
Effectiveness of Existing Marketing Channels and Networking
47
In addition to the buyers and sellers, the market consists of traders or
intermediaries between the two parties, the farmers and the wholesale dealers. Traders
are licensed, and have to pay two different types of mandi fees to operate viz.
A transaction fee which is a percentage value of the trader’s daily volumes. This
fee is levied by the market yard
Taxes and levies, which are also typically a percentage of the daily volume
traded. These taxes are collected by the State, and can vary widely across
different States.
The taxes and levies are usually passed on by the traders to the farmers
themselves. Currently, the fees and taxes to be paid by mandi traders have been fixed at
4% cumulatively.
Within the mandi, two types of trading are prevalent. One is the open outcry
method, where the commodity is sold using the auction process and the other where
sellers approach traders for a price quote, and search for a favourable one. The auction
process is more popular and is run sequentially, going from one lot of the commodity to
another.
As and when each lot is auctioned, a new price is set. There is a limited mechanism
for central dissemination of prices.
Disputes with regard to the quality of produce, between the farmer and the trader
are resolved by the mandi inspector who is empowered to certify the produce.
At the close of the day, traders report their prices and volumes to the mandi
authorities. Since taxes have to be paid on the reported trade value, there is incentive for
the traders to under report volumes, and consequently prices as well. This has
undesirable consequences for the farmers within the mandi.
Mandis are monitored by the mandi board, a committee with representation from
the farmers, the traders and the Government. Operations are conducted by staff hired
by the mandi board, with atleast one qualified inspector present to certify produce
quality.
Course -201 Market Led Extension
48
How effective is the channel?
On analyzing the points in the procurement chain of any agricultural produce, we
see that most wastage occurs while the crop is being put for sale in a market yard.
Inefficient facilities for packaging and transport of the produce en route to the market
yard create the first significant amount of wastage.
Subsequently during the sale process itself, the lack of adequate cold storage facilities at
many of the market yards cause further wastage to the crop. All these losses add up to
an amount significant enough to prevent a farmer from a fair return on his investment,
lest alone cover his costs. Upon analyzing mandis, the most common mechanism for
agriculture marketing in India, we see that in reality, most of them are really highly
inefficient markets.
The idea for a market is essentially for the buyers and sellers to involve in price
discovery, the Activity of finding the right price at which the market clears, or demand
and supply for a particular product balances out with a minimal amount of wastage.
The mandi however is influenced by the interests of not only the buyers and the
sellers, but also of the traders and the commission agents. Chiefly involved in finding
arbitrage opportunities, middlemen ideally are involved in information dissemination,
providing vital linkage between the buyer and seller in a market with limited
information
On observation, we see that almost every market yard in the country possesses a
strong cartel of traders and commission agents, with the sole aim of benefitting from the
sale.
In order to gain, these agents resort to Activities which may be detrimental to
either the farmer or the buyer or both. An example in this regard would be how price
discovery is manipulated by agents, by either suppressing or inflating the demand for a
particular produce.
Effectiveness of Existing Marketing Channels and Networking
49
In many village markets, many a times, there is no open auction. The price is fixed
by the commission agent and the retailers (purchaser) under the cover of cloth by
making signs on the palm (hatta system). Thus, even though the farmer is present there,
he cannot know the real price at which his produce is sold. The commission agents
exploit the farmers by using many fraudulent means. They charge heavy commission,
use faulty weights and measures and have number of deductions. The following
narrative gives a good example of how commission agents bring inefficiency into the
system:
“Basavaraju of Jakkur, who had come to the Yeshwantpur market yard to sell his
cabbage had no option but to sell it at Rs 2 per kg. Within a few hours, his produce
fetched prices varying from Rs 4 to 6, thanks to the "efforts" made by retailers and
commission agents, except that only he had no share of this increased price. “
The inefficiency is created for the sole fact that the commission agent causes an
increase in the price of the good without actually adding any value to it. The level of
manipulation, when multiplied over a number of transactions occurring in the market
yard severely affect the market’s ability to accurately discover the right price for the
produce, thus affecting the prospects of both the farmers and the buyers.
The APMC Acts place certain restrictions on where agricultural produce can be
sold. For instance, the earlier version of the Act restricts movement of produce across
State boundaries under any possible circumstances.
Farmers are compelled to bring their produce to specific market yards, places
where the demand for the produce may not be high. This compulsion also arises due to
the lack of proper transport infrastructure which could enable farmers to transport their
produce to the market yard having demand for it and thereby, ensure a fair return.
Thus, we see that a vacuum between the supply and demand for an agricultural
produce is created, due to the following factors:
Limited connectivity among market yards and thus, preventing efficient interaction between buyers and sellers
Course -201 Market Led Extension
50
Lack of adequate infrastructure to enable farmers to transport produce form one market yard to another
Inadequate gauging of demand due to the limitation of forward markets or future markets, which may be either too high or too low, and thus result in either gluts or shortages in agriculture produce.
4.2.1.2 Direct procurement
The direct procurement model refers to the practice of institutions establishing
their procurement centers and allowing farmers to sell their farmers directly,
eliminating the middleman or agent. The institution here can be the Government, an
agro-processing firm or a big retail chain.
Considered to be one of the most beneficial of all agrimarketing models, direct
procurement eliminates the middle man between the buyer and the seller, thereby
allowing the farmer to get a fair worth for his produce. In this case, the institutions enjoy
benefits by eliminating trader margins. Direct procurement models run in direct
opposition to the traditional mandis, and provide to the farmer a much needed
alternative when it comes to a marketplace.
Some of the benefits that direct purchase models accrue are as follows:
These models bring the buyer closer to the farmer. This would help the farmer in accurately identifying the need of his buyer, changing his farming behaviour accordingly and enable him to reap a profit
Most direct procurement models peg their procurement prices competitively to major markets of the same produce all over India, and in some cases, to major World markets as well. Information disseminated to the farmers and price discovery is fair
Since the purchase requirements of the buyer are known before hand by the farmer, a call can be taken as to which produce would have to be sold at which point, either at the mandi or at the institutional buyer. This eliminates wastage of produce
The absence of any kind of middleman allows the buyer to transfer a portion of the margins saved to the farmers themselves
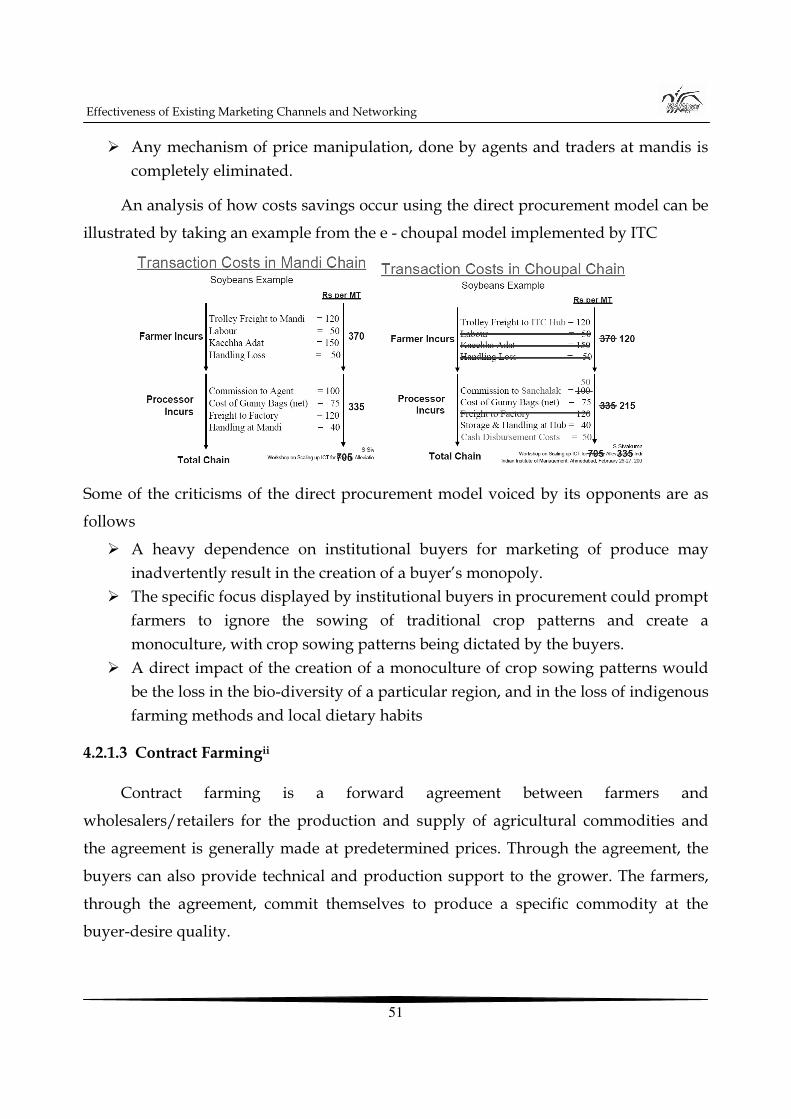
Effectiveness of Existing Marketing Channels and Networking
51
Any mechanism of price manipulation, done by agents and traders at mandis is completely eliminated.
An analysis of how costs savings occur using the direct procurement model can be
illustrated by taking an example from the e - choupal model implemented by ITC
Some of the criticisms of the direct procurement model voiced by its opponents are as
follows
A heavy dependence on institutional buyers for marketing of produce may inadvertently result in the creation of a buyer’s monopoly.
The specific focus displayed by institutional buyers in procurement could prompt farmers to ignore the sowing of traditional crop patterns and create a monoculture, with crop sowing patterns being dictated by the buyers.
A direct impact of the creation of a monoculture of crop sowing patterns would be the loss in the bio-diversity of a particular region, and in the loss of indigenous farming methods and local dietary habits
4.2.1.3 Contract Farmingii
Contract farming is a forward agreement between farmers and
wholesalers/retailers for the production and supply of agricultural commodities and
the agreement is generally made at predetermined prices. Through the agreement, the
buyers can also provide technical and production support to the grower. The farmers,
through the agreement, commit themselves to produce a specific commodity at the
buyer-desire quality.
Course -201 Market Led Extension
52
4.2.1.3.1 Need for Contract Farmingiii
Since the Government is a major stakeholder in the contract farming (since most of
the produce today is procured by the Government, it is equivalent to farmers producing
only for the Government, a variation of contract farming), it is essential to reduce the
load on the central and State level procurement system. Contract farming also paves
way for private investment which has the potential to boost the entire sector. Contract
farming also brings about a market focus in terms of the selection of crops so that
farmers could grow that crop and benefit from it immensely. Farmers get a stable,
consistent income through contract farming and this Acts as on incentive for the farmer
to produce quality produce and also add value to it (like removing the husk and selling
only the pulse inside). Contract farming also generates employment in the sense that for
an landless agricultural farmers, contract farming might prove to be a source of
sustenance. Contract farming also promotes rural self-reliance by utilizing the local
resources to meet the challenges.
4.2.1.3.2 Challenges of Contract Farming in India
Outdates laws and regulations Vote bank politics Strong attachment to the existing system Conflicting Central and State policies Lack of cross sectoral interactions Government crowding out the fields
The contractual agreement encompasses three areas viz., market (grower and
buyer agree for future sale and purchase), resource (buyer agrees to supply inputs and
technical advice) and management specifications (grower agrees to follow the
recommended practices for the crop cultivation).
One of the reasons for contract farming coming into existence in India was the
Land Ceilings Act which stipulated that “agribusiness firms cannot own and cultivate
land for their raw materials requirements, to overcome the difficulties encountered in
Effectiveness of Existing Marketing Channels and Networking
53
procuring from the open market, especially in perishables”. Therefore, the only option
for agribusiness firms was to go in for contract farming to safeguard their interests.
4.3 The Legal Framework for Agri Marketing
4.3.1 APMC Act – Analysis
The Agricultural Produce Marketing Committee Act is a State specific Act of law
promulgated by the respective State Governments to regulate the marketing of
agriculture produce. The Act chiefly imposes restrictions on who can buy produce from
farmers, and where farmers can sell their produce as well. Conceived in an age when
marketing of agriproducts was haphazard, the APMC Acts regulated the establishment
of independent market yards in specific geographic areas. The intention of State
regulation of agricultural markets was to protect farmers from the exploitation of
intermediaries and traders and also to ensure better prices and timely payment for their
produce.
Exporters, processors and retail chain operators cannot procure directly from the
farmers as the produce is required to be channelized through regulated markets and
licensed traders. There is, in the process, an enormous increase in the cost of marketing
and farmers end up getting a low price for their produce.
Enacted in almost all the States by the end of the 60s, the APMC Act was primarily
enacted at a time when agricultural marketing was in the initial stages of being
formalized and standardized. The existing market yards were largely unregulated,
independent entities with only a local presence. These pre APMC yards were dominated
by trader cartels, which manipulated price discovery and prevented the farmer from
obtaining the right price for his produce.
The APMC Act prohibited cartelization, initiated the creation of market boards
with representation from all the stakeholders, the farmers, traders and the buyers. With
Government oversight in the form of constant monitoring and financial support, an
attempt was made to make the market yards fairer and transparent.
Course -201 Market Led Extension
54
From the farmer’s side as well, the APMC Act placed restrictions on how the
farmer could sell his produce. Direct selling to either traders or private institutional
buyers was prohibited, except on special approval from the Government. Produce could
be sold only at a market yard in the geographical area where the produce was grown.
Special approval was required for transporting produce across different market yards in
different States as well.
Over a period of time, the APMC Act proved to be both a blessing and a curse.
Market yards, in a way were forced to isolate themselves, and due to the woeful
infrastructure present, farmers were forced to stick to one single market yard and to a
single set of traders and buyers, something which prevented efficient price discovery.
The isolation among market yards also lead to demand supply inefficiencies,
wherein one market yard could be having a huge unsatisfied demand for a particular
crop, while another could be looking at a glut of the same product. Prices would vary
wildly, and traders pounced upon arbitrage opportunities prevalent.
Crop productivity and wastage was another issue. Farmers began to sow only
those crops which they could get a fair price for at their nearest market yard. With all
the farmers in the region under the market yard following the same practice, crop
diversity was severely affected. The mismatch between demand and supply lead to
farmers getting lower prices for their produce, and resulting in huge wastages to the
order of 5 to 7 % for food grains and 25 to 30% for fruits and vegetables.
In the new, transformed economy, private institutions have stepped up their
linkages with agriculture, a major source of production inputs for many firms.
Significant investments have been made by private entities into establishing efficient
supply linkages, warehousing, post harvest and cold chain infrastructure as close as
possible to the farmers’ fields themselves.
The APMC Act, however severely constrained private participation in
agrimarketing and was being looked upon by most of the stakeholders to be regressive
in nature.
Effectiveness of Existing Marketing Channels and Networking
55
4.3.2 Model Act – Amendments to The Existing APMC Act
In recent times, it has been clearly observed that agriculture, an important
economic sector having vital socioeconomic implications has been lagging behind in
growth when compared to the other sectors. Given the dependence of almost 60% of the
population’s workforce on this single Activity, it was decided by the Government to
improve agricultural growth on a war footing.
Upon close analysis, it was observed that the lack of efficient private participation
and the presence of inefficient markets for agricultural produce were the hurdles
preventing growth in agriculture, apart from input resource constraints like limited
irrigation, soil inefficiency and improper crop usage.
Accordingly, the State Governments were requested to suitably amend their
respective APMC Acts for deregulation of the marketing system in India, to promote
investment in marketing infrastructure, thereby motivating the corporate sector to
undertake direct marketing and to facilitate a national integrated market.
The Department of Agriculture and Co-operation also formulated a model law on
agricultural marketing for guidance and adoption by the State Governments. The model
legislation provides for the establishment of private markets/yards, direct purchase
centers, consumer/farmers’ markets for direct sale and promotion of Public-Private
Partnership (PPP) in the management and development of agricultural markets in India.
Provision has also been made in the Act for constitution of State Agricultural Produce
Marketing Standards Bureau for the promotion of grading, standardization and quality
certification of agricultural produce. This would facilitate pledge financing, direct
purchasing, forward/future trading and exports.
4.3.3 Features of the Model Act
Establishment of private markets, market yards, direct purchase centers, consumer/farmer markets for direct sale to private institutions
Promotion of public/private partnership in management and development of agricultural markets
Setting up of special markets for commodities like fruits, vegetables and flowers
Course -201 Market Led Extension
56
Regulation of contract farming and promotion of alternative marketing systems Provides for prohibition of a commission agency in any transAction of
agricultural commodities with the producers Empowering State Agricultural Marketing Boards to promote standardization,
grading, quality certification, market led extension and training of farmers and market functionaries
Constitution of State Agricultural Produce Marketing Standards Bureau Enable pledge financing, e-trading, direct purchasing, export, forward/futures
trading Introduction of negotiable warehousing receipt system with respect to
agricultural commodities
4.4 Retail Industry in India
4.4.1 What comes under the ambit of Modern Retail?
The private investment in the agricultural sector in the recent years got a boost
from the Government by opening up the sector for private investment. This enables
large business conglomerates to enter the sector and the investment in this sector is
believed to have a cascading effect across the food and agriculture space.iv
Much has been spoken about the retail industry in India. But the categories of retail
which directly affect the farmers are only the following
Food Companies like PepsiCo, McDonald’s and ITC which compete to procure the best quality produce from the farmers. For e.g., McDonald’s “Cold Chain” concept in India has benefited the farmers and other business people immensely.v
The fresh retail outlets like ITC Choupal Fresh and Reliance Fresh which directly procures the vegetables and grains from the farmers and sells them in their outlets.
The entry of big retailers has led to an increased demand for quality produce and
this necessitates an increased supply chain by the private players. This could ultimately
lead to reduction in marketing costs which could be passed on to the consumers and
higher realization for farmers.
Effectiveness of Existing Marketing Channels and Networking
57
4.4.2 Analysis of major players
4.4.2.1 Reliance
With a targeted sales of Rs 90,000 crore by 2010 and with a planned investment of
Rs 30,000 crore over the next five years, Reliance retail entered into the retail space by
opening up retail outlets in multiple formats with world-class shopping environment,
State of the art technology and a seamless supply chain infrastructure. Reliance retail
plans to expand its business to around 800 cities and towns in India within a record
time. It is only because of Reliance retail that so many other players developed the
interest of looking up to retail and consider Greenfield investments in retail ventures.
The integral feature of Reliance’s retail venture is to ensure better returns to
farmers and greater value for the consumer. By opening up stores in multiple formats,
Reliance is aiming to cater to people of all strata of the society.vi With reliance entry, the
till-then lukewarm approach to the retail industry by big corporate including Tata and
ITC got completely changed. Reliance Industries by starting up Reliance retail has
clearly positioned itself in to the role of redefining the entire landscape of Indian retail.vii
Going by its forecasts, Reliance would be making around Rs. 3 crores/store which
translates to revenue per sq. ft. of around Rs. 12,500. So Reliance retail could easily rake
in about Rs. 9000 crores if everything goes by its plan to open up 3000 outlets.
The risk taking nature of Reliance is also revealed in its retail entry. The format of
Reliance Fresh is untested and is quite different from what other retailers in India have
offered so far. Reliance retail, unlike other retails who operate on volumes and thin-
margins is trying for a at a fairly high-margin business mode. Reliance retail has
stopped short of being a full-fledged supermarket which is a tried and tested model in
India.
Reliance Fresh, unlike other retailers like Big Bazaar and Nilgiris, only stocks
plenty of fruits and vegetables, juice bar, and even a large counter for puja flowers. But
the drawback of this is that consumers might to shop everything under one roof and
Reliance retail in that case would miss on that opportunity.
Course -201 Market Led Extension
58
Reliance retail procures the fruits and vegetables directly from the farmers and it
has its own supply chain. With an efficient supply chain, margins can be increased and
the savings could be shared with customers. There are very few external brands in
Reliance retail’s shelves and the store is stocked completely with its private labels, the
reason being that private labels offer better profit margin than external brands.
Reliance’s stores are also smaller compared to other retailers as it brings down the
cost of real estate. It is also much easier to find a tiny plot of land in the neighbourhood
area as against the supermarkets which could only be located in commercial areas. By
being smaller, Reliance could literally flood the cities by locating its stores in several
areas where it can be easily accessed by the consumers.
Having smaller stores also has high inventory turnover since consumers visit the
store more often as they are easily accessible.
4.4.2.2 ITC
ITC, the country’s largest tobacco company, made an entry into retail with the
main objectives of increasing its non-tobacco revenues. It has opened fruit and vegetable
outlets under the brand name “Choupal Fresh” and hypermarket chain under the name
“Choupal Sagar”. Choupal Fresh store stocks fresh fruit and vegetable procured directly
from the farmers. It has around 18 Choupal Sagar outlets and is mainly targeted at rural
people whose income levels are lower. Apart from the retail customers, even kiranas
and other small retailers could source from Choupal Sagar. To enable this, Choupal
Sagar follows a different pricing model for retail customers and bulk purchasers.
Choupal Sagar also provides various services such as soil testing, banking, insurance
and medical facilities to the farmers in rural areas.viii
The company is also looking at an increase in the number of e-Choupals from the
current 6,400 in 130 districts, to 20,000 across 350 districts, in the next 5-6 years. ITC is
also focussing on strengthening health services in rural India. ITC which is 32 per cent
owned by British American Tobacco has also entered the retail clothing business under
Effectiveness of Existing Marketing Channels and Networking
59
the “Will Lifestyle” brand and its hospitality business under the “ITC Sheraton brand”
is also thriving. ix
ITC is also planning to start Choupal Carts after Choupal Sagar and Choupal
Fresh. ITC will provide the vegetable vendors with an ITC branded push cart and will
follow the pricing and service levels set by ITC.
Choupal Fresh currently follows a two-way model with presence in both front end
as well as in back end. ITC along with its logistics partners plans to invest about Rs 800
crore in cold chain and logistical supply.x
Interestingly, Kirana stores and other small retailers from the small towns will also
be able to purchase goods from these outlets. Choupal Sagar will provide different
prices to retailers and ordinary consumers.
4.4.2.3 Pepsico
PepsiCo entered India in 1989 by setting up it’s beverages and foods division on
the pre-condition from the Government of India that it should invest in horticulture
processing plant in Punjab. To make the business viable, PepsiCo then identified
processing of tomatoes in Punjab as a suitable option. It imported Rs 22-crore tomato
processing plant from Italy and to pursue this, PepsiCo introduced the concept of
Contract farming to India. But unfortunately, PepsiCo had to close down its tomato
production and recently it has revived its plan of growing tomatoes again.
PepsiCo recently offered its services to procure wheat for National Agricultural
Marketing Federation (NAFED) and it also has a program are running for procurement
of rice and barley.
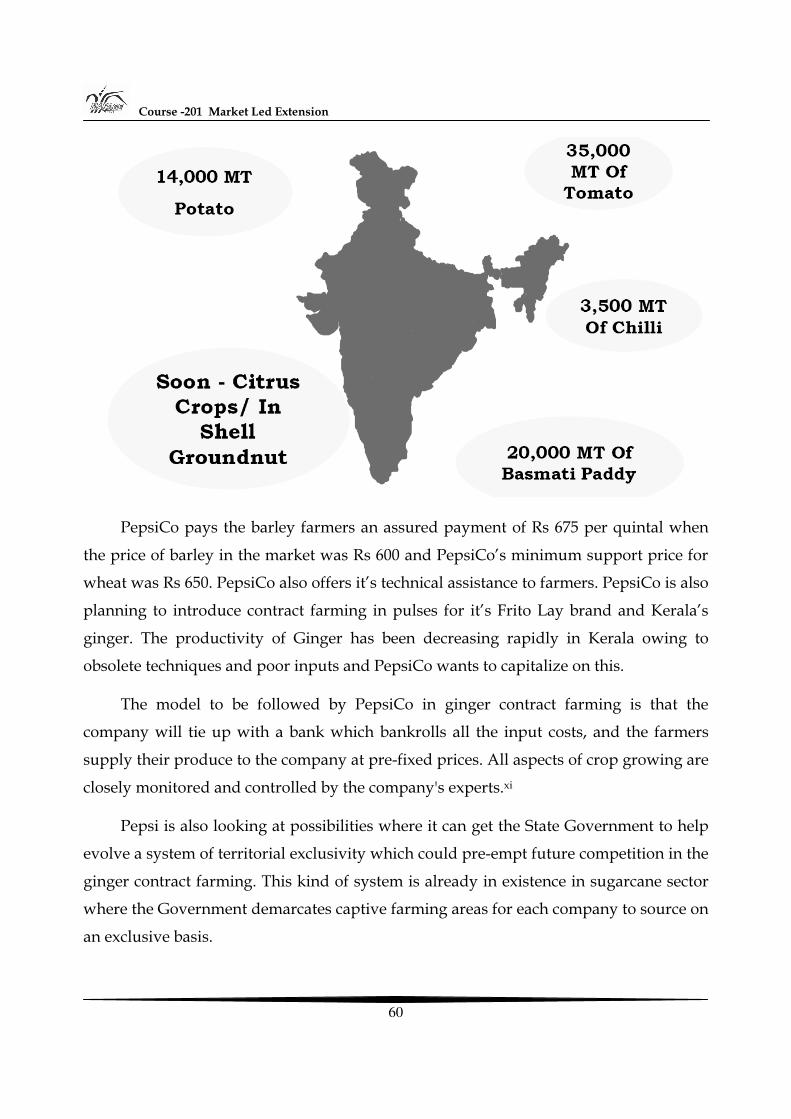
Course -201 Market Led Extension
60
PepsiCo pays the barley farmers an assured payment of Rs 675 per quintal when
the price of barley in the market was Rs 600 and PepsiCo’s minimum support price for
wheat was Rs 650. PepsiCo also offers it’s technical assistance to farmers. PepsiCo is also
planning to introduce contract farming in pulses for it’s Frito Lay brand and Kerala’s
ginger. The productivity of Ginger has been decreasing rapidly in Kerala owing to
obsolete techniques and poor inputs and PepsiCo wants to capitalize on this.
The model to be followed by PepsiCo in ginger contract farming is that the
company will tie up with a bank which bankrolls all the input costs, and the farmers
supply their produce to the company at pre-fixed prices. All aspects of crop growing are
closely monitored and controlled by the company's experts.xi
Pepsi is also looking at possibilities where it can get the State Government to help
evolve a system of territorial exclusivity which could pre-empt future competition in the
ginger contract farming. This kind of system is already in existence in sugarcane sector
where the Government demarcates captive farming areas for each company to source on
an exclusive basis.
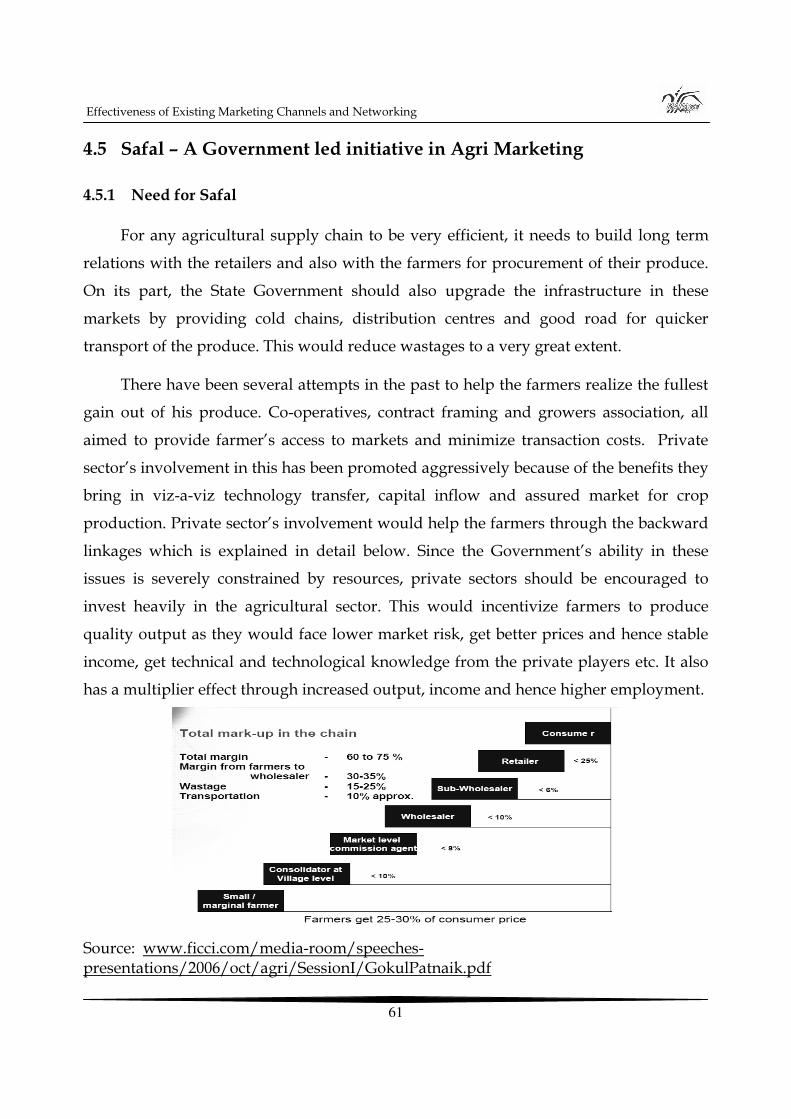
Effectiveness of Existing Marketing Channels and Networking
61
4.5 Safal – A Government led initiative in Agri Marketing
4.5.1 Need for Safal
For any agricultural supply chain to be very efficient, it needs to build long term
relations with the retailers and also with the farmers for procurement of their produce.
On its part, the State Government should also upgrade the infrastructure in these
markets by providing cold chains, distribution centres and good road for quicker
transport of the produce. This would reduce wastages to a very great extent.
There have been several attempts in the past to help the farmers realize the fullest
gain out of his produce. Co-operatives, contract framing and growers association, all
aimed to provide farmer’s access to markets and minimize transaction costs. Private
sector’s involvement in this has been promoted aggressively because of the benefits they
bring in viz-a-viz technology transfer, capital inflow and assured market for crop
production. Private sector’s involvement would help the farmers through the backward
linkages which is explained in detail below. Since the Government’s ability in these
issues is severely constrained by resources, private sectors should be encouraged to
invest heavily in the agricultural sector. This would incentivize farmers to produce
quality output as they would face lower market risk, get better prices and hence stable
income, get technical and technological knowledge from the private players etc. It also
has a multiplier effect through increased output, income and hence higher employment.
Source: www.ficci.com/media-room/speeches-presentations/2006/oct/agri/SessionI/GokulPatnaik.pdf
Course -201 Market Led Extension
62
SAFAL was first started as fruit and vegetable unit in Delhi by National Dairy
Development Board (NDDB) and Mother Dairy Foods Processing Ltd. SAFAL Mumbai
is a 100 percent export oriented unit and these provide direct link between the vegetable
growers and consumers. SAFAL Bangalore follows a complete different model as it is a
wholesale market compared to Delhi’s retail model. The APMC Act has been amended
according by enable SAFAL Bangalore market to operate outside the purview of the Act.
4.5.2 Safal Bangalore
SAFAL Bangalore was set up by Mother Diary Foods Processing Ltd in order to
overcome the infrastructural inefficiencies in the traditional Indian market. The
traditional Indian markets do not have any infrastructure for packaging, grading and
sorting and cold storages. Apart from addressing the infrastructural issues, SAFAL also
aims to eliminate the role of commission agents and traders who set the prices which
most of the time are not beneficial to the farmers. This incentivizes the farmers to
produce a quality product. SAFAL aims to eliminate these issues by having an efficient
supply chain with strong backward linkages with the farmers and forward linkages
with the wholesale purchasers. SAFAL also aims to prevent the huge amount of
wastages that is infecting the Indian agricultural industry since ages. SAFAL procures
fruit and vegetables through a reverse Dutch auction at an electronic auction centre
located inside the market. SAFAL also boasts of a huge humidity and temperature
controlled storage and ripening chamber and the forklifts used inside the market are all
battery operated.
Around 10% of non-perishable items and 30% of perishable items produced in
India gets wasted and hence there is an urgent need to invest in processes such as post-
harvest management, efficient post-harvest handling and warehouses to prevent the
wastages.
So, apart from procuring the produces form the farmers, SAFAL also offers post-
harvest services to the farmers which results in getting a higher quality produce, reduce
wastages all of which ultimately results in quality product for the consumers at a lower
price.
Effectiveness of Existing Marketing Channels and Networking
63
The Karnataka Government has setup a SAFAL market in Bangalore and it has
amended the APMC Act accordingly so that farmers could reap the benefits of selling
their produce through SAFAL. The amendments made in the APMC Act ensures the
smooth movement, storage and marketing of agricultural produce and also enables
setting up of commodity exchanges for futures trading.
SAFAL Bangalore in collaboration with Multi-commodity Exchange of India
(MCX) has started a SAFAL National Exchange and has promoted spot trading and
futures trading of horticultural products in a big way. This would lead to an efficient
price discovery by the farmers for their produce and hence result in higher profits for
them. Bangalore, because of its growth due to the IT boom, has seen a number of retail
players entering the market in recent years. But SAFAL stands apart from them as a
terminal wholesale market and the impact of it on farmers and retailers is slowly
beginning to be seen.
The following section highlights the structure and functioning, backward and
forward linkages of SAFAL Bangalore.
4.5.2.1 Structure and functioning
SAFAL Bangalore has an electronic auction system through reverse Dutch auction,
backward linkage through grower association and forward linkages through cash and
carry wholesale and retail stores. SAFAL Bangalore has the capability of handling
around 1600 tons/day which translates to almost 30% of Bangalore’s fruit and vegetable
demand. SAFAL Bangalore also boasts of cold storage, grading and sorting and
distribution and all the processes here are transparent and competitive. This resulted in
wholesalers taking more time to get associated to SAFAL for a long time whereas the
farmers associated themselves very quickly. The demand of the produce is informed to
the farmers before hand by SAFAL and this ensures consistent supply of the produce in
line with the market’s quantity and quality specifications.
Course -201 Market Led Extension
64
4.5.2.2 Backward linkages
SAFAL Bangalore is supported by more than 250 farmers’ associations with more
than 20,000 members. These associations are directly connected to the 40 collection
centers and are required to meet the requirements of buyers, in terms of quality, packing
and weight. Small farmers are trained in quality management aspects, pre- and post-
harvest management. The support for logistics, for transporting the produce from the
farm to the market is also provided by SAFAL on a pre-fixed charge.
The wholesale purchasers and farmers before buying/selling the produce through
SAFAL have to register themselves as a member for a nominal fee and this enables
SAFAL to predict the future demand and supply fairly accurately. SAFAL reduces
farmers cost by almost 5% ( in traditional system, farmers used to pay 8-10% as
commission to agents whereas in SAFAL, they only pay 4.5% as transaction cost). The
payment to farmers is based on credit basis where in a weekly account payee cheques
are issued to them. The profits gained by the farmers by selling their produce through
SAFAL are as high as 10-15% as compared with traditional channels. This is achieved by
proper weighing of the produce, lower transaction cost, less waste, accurate price and
efficient transportation of the produce. All these enabled farmers to have a strong loyal
association towards SAFAL.
4.5.2.3 Forward linkages
The wholesaler procures the fruits and vegetable from the SAFAL through an
auction system. The auction system is completely electronic wherein the bid can be put
even through a remote electronic system. SAFAL is forward linked to the retailers and
wholesale purchasers through 10-12 cash and carry stores which are owned by the
auction market. These stores are located strategically throughout the city in order to
cater to local buyers. SAFAL also provides cold storage facilities to the retailers and
wholesalers on a payment basis. SAFAL grades and packs the fruits and vegetable for
easy handling and transport and thus the wholesalers are ensured a quality produced.
SAFAL also disseminates online prices information of all the items so that the farmers
Effectiveness of Existing Marketing Channels and Networking
65
and wholesalers can make their own decisions regarding when to buy/sell their
produce.
4.5.2.4 Constraints
There are still some hurdles that SAFAL has to cross in order to make it’s supply
chain more efficient. The backward integrating though received appreciation from the
farmer’s community is still facing stiff resistance by the wholesale traders. In order to
combat this problem, SAFAL has established SAFAL National Exchange (SNX), the
country’s first spot exchange for trading perishable commodities. SNX enables farmers
to trade their produce online to buyers from across the country.
4.5.2.5 Challenges
Currently SAFAL procures only the produce which meets certain grades and the farmers are still dependent on traders and commission agents to buy the left-overs. So, if SAFAL procures even the low quality produce from the farmers, it would not only prove beneficial to the farmers but also improve their loyalty towards SAFAL.
Farmers are still doubtful about the SAFAL model and as a safe option, they still maintain relationship with the traders and commission agents in case the SAFAL model doesn’t click.
Traders buy only perishable produce from the SAFAL (since SAFAL has cold storage facilities) but for non-perishable commodities, they still go the regulated market.
Location disadvantages, inconvenient auction timings and more grading procedures prevent trades from enthusiastically approach the SAFAL.
SAFAL’s biggest challenge is to breaking the strong link of commission agents as this system affects their income considerably. Hence it is very difficult to completely eliminate the agents from the supply chain.
4.5.2.6 Scope for improvement
To operate at maximum capacity, SAFAL needs to approach the canteens in IT
companies, educational institutions, and hotel chains and persuade them to make their
purchase through SAFAL. Brand building will give SAFAL a huge push in this regard.
Course -201 Market Led Extension
66
SAFAL has been very successful in integrating growers with wholesalers and retailers
within a short amount of time though the above mentioned challenges could be tackled
to make it even more successful.
4.6 Let us sum up
Agriculture assumes importance not for it’s overall contribution to the GDP of the
country, but for the fact that almost 58% of the country’s workforce are dependent on
agriculture and allied Activities. Seventy percent of the populace living in rural areas
depends on agricultural activity for their livelihood, and 46% of India’s geographical
area is under agricultural cultivation.
The stakeholders in agriculture system are the farmer, the Government, the traders
& retailers and the customers. The lack of an efficient market system for his produce
has made the farmer dependent on the local buyer or trader, who influences the price
discovery process, to the disadvantage of the farmer. Agriculture is essentially a state
subject in India. The central Government's role is in formulating policy and providing
financial resources for agriculture to the States. At the State level, the Government is
responsible for providing inputs to the agricultural Activity, helping in marketability of
the products through co-ordination with market yards and ensuring profitability to the
farmer through minimum support prices and procurement. Trading Activity is
dominated by specific interest groups and this leads to collusion and price
manipulation. Traditional retail Activity has been largely dependent on the traders for
their requirements. This has been changing in the recent years, with institutional buyers
setting up direct linkages with farmers, bypassing the traders. Typically a farmer gets a
return of upto 14% on his produce, the trader adds his 12% to it, and the retailer charges
the consumer an additional commission of 12-15%. By the end of this 3-step series, the
consumer ends up paying over 40 per cent extra for the produce, without any value
addition. Existing marketing channels are: Mandis, Direct Marketing and Contract
Farming. Mandi trades in atleast one primary commodity, one which is typically grown
in the region. The seller brings the produce to the market, where it is weighed, with the
grading being performed by a certified mandi inspector. The seller’s produce is certified,
Effectiveness of Existing Marketing Channels and Networking
67
and upon collection of a mandi fee, he is allowed to put up his produce for sale. The
direct procurement model refers to the practice of institutions establishing their
procurement centers and allowing farmers to sell their farmers directly, eliminating the
middleman or agent. The institution here can be the Government, an agro processing
firm or a big retail chain. Contract farming paves way for private investment which has
the potential to boost the entire sector and brings about a market focus in terms of the
selection of crops so that farmers could grow that crop and benefit from it immensely.
Farmers get a stable, consistent income through contract farming.
The Department of Agriculture and Co-operation also formulated a model law on
agricultural marketing for guidance and adoption by the State Governments. The model
legislation provides for the establishment of private markets/yards, direct purchase
centers, consumer/farmers’ markets for direct sale and promotion of Public-Private
Partnership (PPP) in the management and development of agricultural markets in India.
For any agricultural supply chain to be very efficient, it needs to build longterm
relations with the retailers and also with the farmers for procurement of their produce.
On its part, the State Government should also upgrade the infrastructure in these
markets by providing cold chains, distribution centres and good road for quicker
transport of the produce. SAFAL was first started as fruit and vegetable unit in Delhi by
National Dairy Development Board (NDDB) and Mother Dairy Foods Processing Ltd.
SAFAL Mumbai is a 100 percent export oriented unit and it provides direct link between
the vegetable growers and consumers. SAFAL Bangalore follows a completely different
model as it is a wholesale market compare do to Delhi’s retail model. The APMC Act
has been amended accordingly to enable SAFAL Bangalore market to operate outside
the purview of the Act.
Course -201 Market Led Extension
68
Unit- 5
Contract Farming
Structure
5.0 Objectives
5.1 Introduction
5.2 Concept and Definition
5.3 Its Application in India
5.4 Effectiveness of Contract Farming
5.5 Let Us Sum Up
5.0 Objectives
After going through this unit, you will be able to:
• The concepts and models of contract farming, • Its application for effectively generating supplies for processing industries,
exports and organized retailing, • Legal difficulties in enforcing contracts, and • How farmer’s cooperatives like Amul and cooperative sugar factories have
successfully followed the principles of contract farming. • Advantages and disadvantages to farmers and sponsors
5.1 Introduction
Contract farming is a means of encouraging production of agricultural
commodities used as inputs to processing, such as sugarcane, milk, oilseeds, fruits and
vegetables and plantation crops. The processing facility is fed by a large number of
outlying suppliers who are independent producers under contract to the processor. The
Contract Farming
69
quantum of production, its quality and purchase price as well as timing, are all
governed by a mutually agreed contract. Ideally such an arrangement should benefit
both the producer and the processor. The former is assured of raw materials of
stipulated quality and quantity at fixed prices, so as to permit effective and economic
processing. The latter is assured of fixed prices and does not have to depend upon the
vagaries of market. Often he is also provided basic inputs such as planting material,
fertilizers and pesticides as also advance against the crop he has contracted to deliver.
Thus, contract farming reduces the risk factor substantially since the off take of the
produce is assured and prices are known to the farmers.
5.2 Concept and definition
5.2.1 Concept
In India, where land laws do not permit private ownership of agriculture land by a
company, contract farming provides an acceptable via media for corporate ownership –
a boon to processing industry, exporters and organized retailers.
This concept and method is applicable not only to processing of food but also to
exports and organized retailing of fresh fruits and vegetables.
In international markets, often importing companies are particular about the
quality of imported products. For example, countries of European Union have very
strict standards / quality parameters such as pesticide residues or permitted colors etc.
When such problems arise the exporting company loses heavily. Contract farming
ensures traceability and tractability of a particular lot/source for processing/marketing
when marketed product is found substandard by the importer.
5.2.2 Definition
A contract is an agreement between two parties. It could be oral or written on
ordinary or legal (stamp) paper. A farming contract generally spells out in detail the
responsibilities and obligations of the buyer of farm produce and of the producer
farmer.
Course -201 Market Led Extension
70
Roy (1963) defines contract farming as those contractual agreements between
farmers and companies whether oral or written specifying one or more conditions of
production and / or marketing of an agricultural product.
According to Davis (1979), contract farming entails relations between growers and
private or state enterprises that substitute for open market exchange by linking
normally independent family farmers of widely variant assets with a central processing,
export or purchasing unit that regulates in advance price, production practices, product
quality and credit.
Gurdev singh (2005) provides a more universal definition of contract farming.
“Contract farming is a form of vertical coordination between the producers (farmers)
and the contractor (processor or marketing firm or a third party such as input
manufacturer or service provider) where the latter directly influences the production
decisions and exercises some control at the production point under the obligation of
purchasing certain quantity of produce at specific price from the producer. The quantity
and price relate to delivery of specific quality produce at designated location and for a
period of time.”
According to him, “Contract farming is an intermediate institutional arrangement
that allows firms to participate in production and exert control over the production
process without owning or operating the farms. Contract farming is a system in which
agricultural commodities are produced and supplied to particular buyers, mostly
processors under pre-negotiated arrangements about price, quality and quantity. It
brings producers and processors closer on mutually beneficial terms. The firm is assured
of steady supply of quality and material at a stable price. The producer gets a ready
market and remunerative price under the arrangement.”
In respect of contract farming. There are two schools of thought: One school views
it as a dynamic partnership between agri-business firms and small farmers that benefits
both without sacrificing the rights of either. The other considers it as a tool for agri-
business firms to exploit an unequal power relationship with the small growers, “a form
of disguised proleterisation” as it secures the farmers’ land and labor while leaving him
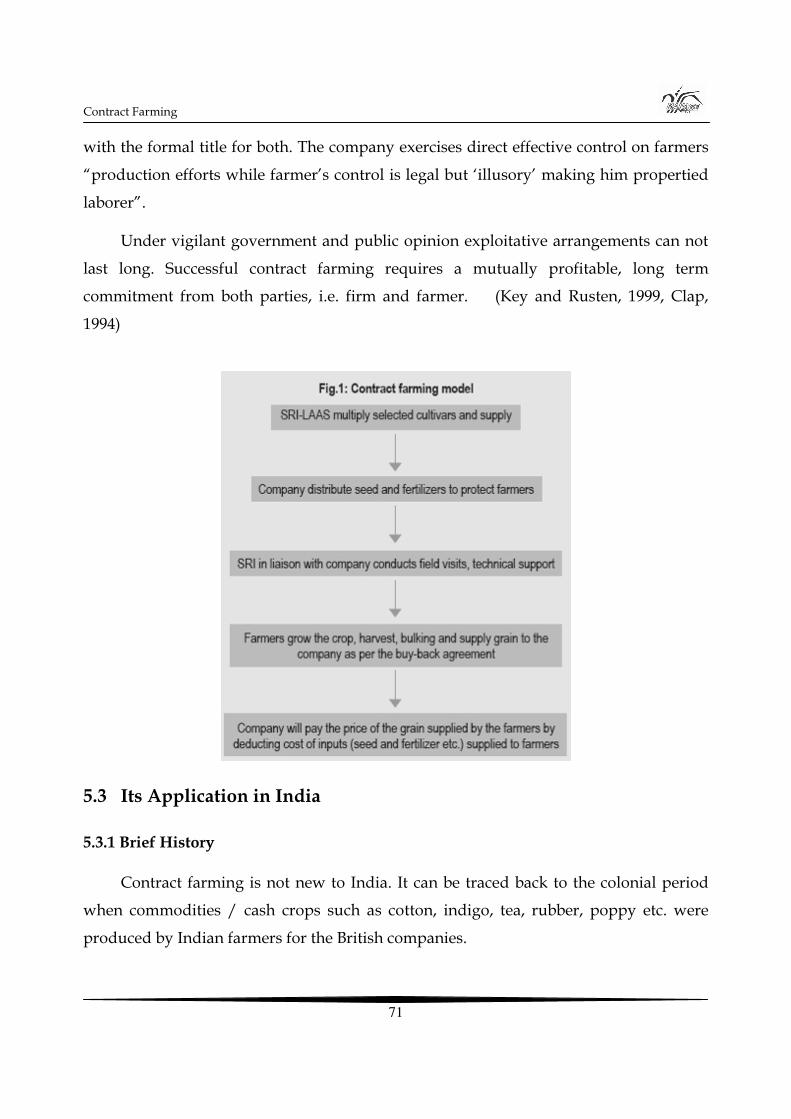
Contract Farming
71
with the formal title for both. The company exercises direct effective control on farmers
“production efforts while farmer’s control is legal but ‘illusory’ making him propertied
laborer”.
Under vigilant government and public opinion exploitative arrangements can not
last long. Successful contract farming requires a mutually profitable, long term
commitment from both parties, i.e. firm and farmer. (Key and Rusten, 1999, Clap,
1994)
5.3 Its Application in India
5.3.1 Brief History
Contract farming is not new to India. It can be traced back to the colonial period
when commodities / cash crops such as cotton, indigo, tea, rubber, poppy etc. were
produced by Indian farmers for the British companies.
Course -201 Market Led Extension
72
Often such arrangements exploited small peasantry and resulted in indenture and
alienation in some instances.
Imperial Tobacco Company (now known as Indian Tobacco Company ITC)
introduced cultivation of Virginia tobacco in coastal Andhra Pradesh in the 1920s
incorporating most elements of a fair contract system and met with good farmer
response. This was replaced by auctions by Tobacco Board in 1984.
Organized public and private seed companies, which emerged in 1960s, had to
adopt contract farming from the start since these did not own any land for
multiplication of seeds. The seed business could only survive on explicit and formal
contracts with farmers covering all relevant factors. Earlier, contracts were with
individual farmers. Now contracts are with groups of farmers. This not only ensured
supplies, but also helped in meeting quality standards and avoiding disputes.
In 1970s, WIMCO, a Swedish multinational company involved in mechanized
match manufacturing, initiated contract farming for Poplar, an exotic plant variety in
Punjab, Haryana and Uttar Pradesh. It received good farmer response. (For details, see
WIMCO case).
In 1990s, Pepsico set up a tomato processing plant as joint venture with Haryana
Agro Industries Corporation. It needed about 40,000 MT of tomato per season. It
introduced tomato on a large scale in a non-traditional area, Punjab and Haryana with
purchase contracts backed by research and extension support. The scheme met with
enthusiastic farmer response and Punjab is now a major tomato growing area.
In 1950, enlightened farmer leaders in Maharashtra integrated cane growing and
processing through establishment of sugar cooperatives. These societies provide inputs,
extension, advances and supervise/manage harvesting as well as cane delivery to
society’s factory. These also undertake development work such as link roads, lift
irrigation, cane research etc., as well as contribute to social development through
establishment of schools, colleges, hospitals etc. Farmers believe their prices to be
Contract Farming
73
remunerative and bonus and other social services offered by the society as added
incentives for their loyalty to the society.
Many large and more concerned private companies elsewhere in the country,
especially in Tamil Nadu and Uttar Pradesh, have taken the cooperative as models and
now offer similar, though not all, services to their growers.
The New Agricultural Policy of 2000 of the Govt. of India promoted private sector
participation in agribusiness through contract farming. Several agricultural and
horticultural crops such as tomatoes, potatoes, chilies, gherkins, cotton, wheat, basmati
paddy, flowers, and medicinal plants are being produced under some form of
contractual arrangements. Big corporate houses such as Hindustan Lever, Pepsi food,
A.V. Thomas, Dabur, Thapers, Marico, Godrej, Mahindras, Wimco etc adopted contract
farming on pilot basis. Broiler production in Tamil Nadu was entirely under contract
arrangement. Godrej also entered in the boiler business on contract basis.
Niggar in Punjab and Bhilai Engineering in Madhya Pradesh (now in Chattisgarh
State) also took up tomato contract cultivation programs shortly after Pepsico.
In recent years, Punjab Govt. promoted contract farming for bulk production of
subsistence crops such as paddy-rice, maize and wheat. Punjab government has actively
encouraged it as a means of crop diversification. Most such contracts now have
specialized contract agencies as interface between farmers and input suppliers/crop
purchasers.
“Commodity cooperatives (dairies in Gujarat, sugarcane in Maharashtra) which
emerged in 1950s provided most services envisaged under ideal contract farming to
their members and bought back the supplies offered at contracted price, although these
were not strictly contract arrangements. They succeeded enormously, leading to their
replication and compelling private companies also to adopt similar approaches.
Contract farming is now considered to be a corrective to market imperfections and
serving a useful purpose in India in its own limited sphere.”
Course -201 Market Led Extension
74
In some pockets, especially non-food crops in Punjab and floriculture in the South
and West, farmers have already shown considerable adaptability in accepting new crops
and methods of cultivation. While formal contract farming prevails in only some of
these instances, many of its desirable features, such as appropriate market intelligence
and quality considerations are provided by various agencies, including the intended
buyers themselves. Some notable instances are:
• Seed multiplication in Marathawada and Andhra Pradesh. • Tea and coffee in Karnataka, Kerala and Tamil Nadu. • Rubber and Pepper in Kerala. • Poplars in Uttar Pradesh, Haryana and Punjab. • Medicinal plants in Uttar Pradesh. • Castor, Isabgol, cumin and aniseed in North Gujarat. • Jute in West Bengal. • Tomato and chilies in Punjab, Andhra Pradesh and Karnataka. • Mangoes in Andhra Pradesh, Tamil Nadu and Maharashtra.
Professor Mathur found that in five samples states, crops covered under contract
farming varied from fruits and vegetables, medicinal and aromatic plants to cereals.
Different companies initiated contract farming in various states. Mathur’s findings are
summarized below:
States
karnataka Maharashtra Madhya Pradesh
-Ashwagandha -Soybean -Wheat, maize,
-Dhavana -Several fruits and -Soybean
-Marigold -vegetables, cereals, -Several fruits and
-Capsica Chilly -spices and pulses -vegetables, cereals,
-Coleus -spices and pulses
-Gherkins
Punjab Tamil Nadu
-Tomato, chilly -Cotton
-Barley -Maize
Contract Farming
75
-Basmati Rice -Paddy
-Maize
-Groundnut
-Potato
You will thus see that contract farming has been tried in various states and
covered a variety of crops. Different agro-climate zones produce different specialized
crops. For example, tea in North Bengal, and Nilgiri in South, coffee in South, apples in
Kashmir and Himachal Pradesh, grapes in Nasik and around Hyderabad.
Main features of the scheme were
(a) Wimco would establish nurseries, undertake R&D, organize extension service and give adequate publicity to the scheme;
(b) Wimco nurseries would produce entire transplants (ETPs) and sell them to the farmers;
(c) Contract farmers would be identified by Wimco and the respective banks; (d) At the end of 8 years of growing period, Wimco will buy the trees at a
guarantee price or the prevailing market price, whichever is higher; (e) The scheme was restricted to Tarai region of Uttar Pradesh and some
districts of Punjab and Haryana which showed favorable condition to grow poplars; and
(f) The scheme would be implemented in two phases, first between 1984 and 1988, and second between 1988 and 1992.
This program had several strong features
a) A thorough research based approach and excellent extension approach; b) Involvement of NABARD to provide refinance for farmer loans from lead
banks, and risk cover; c) Clearly stated prices and purchase procedures; d) Specially recruited and trained extension staff; e) Solid backing from not just Indian sponsors, but also its foreign parent.
It was spread over two phases, between 1984 and 1995. It succeeded in meeting or
exceeding targets and creating great enthusiasm not only among contract farmers but
Course -201 Market Led Extension
76
also among other farmers leading to high supply situation in the region. There was also
increasing demand from other users such as plywood manufacturers. So from third
phase 1995 onwards Wimco started purchasing the material in competitive open
markets.
Thus, we see that company’s success in introducing a new product (poplar)
through contract farming which resulted in high production in the region led to
competitive market replacing contract purchase.
Elements of Contract Farming
There are 17 elements of contract farming:
1. Purpose / Reason
(a) Quantity of material needed by the company not available in open market. (b) Required quality not available in open market. (c) Need for bulk and cost-effective procurement. (d) Easy market access to farmers.
2. Time of Contract
(a) Pre-harvest (b) Post-harvest
3. Minimum Size of Contractual Acreage
(May vary from commodity to commodity. The unit of measurement may vary from area/acreage for crops to quantity say number of animals in case of dairy).
4. Registration Process
(a) Registration fees
(b) Signing a simple document
5. Partners in the Consortium
(a) State government / board (in case of plantation crops such as spices board, tea board etc.
(b) Financial Institutes
Contract Farming
77
-NABARD -Banks (c) Input providers (d) Service providers (e) Insurance providers
6. Insurance supplied
(a) Life insurance (b) Crop insurance
7. Inputs Provided
(a) Fertilizers (b) Seeds (c) Pesticides
8. Services Provided
(a) Extension services (b) Monitoring quality
9. Quantity Specifications
(a) Main products (b) By products
10. Harvesting Time
(a) Decided by corporate (b) Decided by producer
11. Price Fixation Criteria
(a) Prefixed (including or excluding cost of handling, packaging, transport, taxes and octroi).
(b) Market base (c) Pre-fixed with market link component
Course -201 Market Led Extension
78
12. Procurement Strategy
(a) Delivery taken at farm gate (b) Delivery taken at factory/god own gate (c) Delivery at designated mandis
13. Packaging
(a) Provided by the buyer at his cost (b) Provided by the producer at his cost
14. Handling
(a) Cost borne by the producer (b) Cost borne by the buyer
15. Transport
(a) Arranged and paid by the producer up to delivery point (b) Arranged and paid by the buyer up to delivery point (c) Arranged by producer but paid by the buyer at delivery point (d) Transport subsidy paid by company /government / board
16. Mode of Payment
(a) Cash (b) Cheque
17. Time of Payment
(a) Part or full payment immediately (b) Remaining part or full payment in a given time period (week, fortnight,
month) (c) As per specified payment schedule
5.4 Effectiveness of Contract Farming
5.4.1 Prerequisites for Contract Farming
From the history of contract farming we learn that acceptance or rejection of
contract farming methods depend upon several agricultural and socio-economic factors
such as:
Contract Farming
79
• Resource endowment of the region. • Resource base of the farmer, including alternative or additional sources of
income. • Physical and marketing risks involved in the production and disposal of the
crops in question, and their perception by growers. • Extent of infrastructure facilities required for efficient and effective disposal of
crops and their actual availability. • Market structures and their efficiency. • Farmers’ awareness of the ultimate form and use of the commodity and value
addition. • Nature of contact and assurances, finance and facilities provided and penalties
stipulated. • Track record of contract buyer. • Length of relationship under contract. • Farmers’ previous experience of contracts.
A company intending to follow contract farming system should, at the stage of
planning itself, critically examine the above factors.
5.4.2 When Does Contract Farming Work Well?
Contract Farming Generally Works Quite Well When
(a) The contracted commodity does not have significant direct consumption
market, as in case of plantation crops (tea, coffee etc.), sugarcane or seeds. (b) Company offers fair price and adequate risk cover; (c) Company ensures timely payment since “farmers are loyal to money”. (d) The produce is new, exclusive, unique, not normally cultivated in the region
(for example poplar in case of WIMCO; Gharkin production). (e) Company provides needed planting materials and inputs; (f) Both parties believe in mutually beneficial relations. (g) Trust relationship is built up over a long period of time. (h) There is a strong self regulatory social systems (social control) among the
growers. (i) Contract is properly designed, clearly understood by grower farmers and
sincerely implemented.
Course -201 Market Led Extension
80
5.5 Let us sum up
Over the years some enlightened farmers have discovered a solution for their
problems. They started looking at their economy from a wider perspective of market
forces. They realized that credit and money lenders were not their only problems The
control of market produce determined their net income. They started looking beyond
credit business and realized that cooperatives could be a ‘poor man’s company’ and, as
any other private company, could be involved in processing and marketing businesses
that would add substantial value to their produce and increase each member’s net
income. These cooperative entrepreneurs became the originators of farmer-oriented
post-harvest management enterprises in India.
Primary Processing and Value additions
81
Unit- 6
Primary Processing and Value additions
Structure
6.0 Objectives
6.1 Introduction
6.2 Agro processing- Meaning, Importance
6.3 Value addition of Grains
6.4 Value addition of Pulses
6.5 Value addition of Fruits
6.6 Value addition of Vegetables
6.7 Value Addition in Dairy Industry
6.8 Let us Sum Up
6.0 Objectives
After through this unit, you will be able to understand:
• Explain the importance of agro processing and value addition of Indian agricultural sector
• Describe different sectors of Indian food processing industry • List out and analyse different processing operations for the value addition of
grains, pulses, fruits and vegetables and dairy • Evolve a feed back mechanism for evaluating and assessing the strength
weakness and opportunities of agro processing sector and different value addition technologies
6.1 Introduction
India is the second largest producer of food next to China. It has the potential of
being the biggest in food and agricultural sector contributing around 18 percent of the

Course -201 Market Led Extension
82
Gross Domestic Product (GDP). Key to giving a fillip to India's food production would
be minimization of all the wastages from the field to till plate level. India with arable
land of 184 million hectares produces annually 90 million tonnes of milk (highest in the
world), 150 million tonnes of fruits & vegetables (second largest), 485 million livestock
(largest), 215 million tonnes food grain (third largest), 6.3 million tonnes fish (3rd
largest), 489 million Poultry and 45,200 million eggs.
India’s agricultural production base is quite strong but at the same time wastage of
agricultural produce is massive. Level of processing is very low i.e. around 2.20% in
fruits & vegetables, 35% in milk, 21% in meat and 6% in poultry products etc. Value
addition is 20%. India’s share in world trade in respect of processed food is about 1.6%.
Food Processing Industry is of enormous significance for India’s development
because of its linkages and synergies that it promotes between the two pillars of the
economy, namely Industry and Agriculture. India is world’s second largest producer of
food and has the potential to become number one in due course of time with sustained
efforts. This growth of the Food Processing Industry will bring immense benefits to the
economy, raising agricultural yields, meeting productivity, creating employment and
raising the standard of very large number of people through out the country, specially,
in the rural areas. Food processing involves any type of value addition to the
agricultural produce starting at the post harvest level. It includes even primary
processing like grading, sorting, cutting, seeding, shelling packaging etc.
The food processing industry is one of the largest industries in India. It is ranked
fifth in terms of production, consumption, export and expected growth. The industry
size has been estimated at US$ 70 billion by the Ministry of Food Processing,
Government of India. The food processing industry contributed 6.3 per cent to India’s
GDP in 2003 and had a share of 6 per cent in total industrial production. The industry
employs 1.6 million workers directly. Food processing is a large sector that covers
activities such as agriculture, horticulture, plantation, animal husbandry poultry and
fisheries. It also includes other industries that use agricultural inputs for manufacturing
of edible products.
Primary Processing and Value additions
83
6.2 Agro processing- Meaning, Importance
6.2.1 Agro Processing and Value Addition – Definition Agro Processing
Agro processing could be defined as set of techno economic activities carried out
for conservation and handling of agricultural produce and to make it usable as food,
feed, fibre, fuel or industrial raw material. Hence, the scope of the agro-processing
industry encompasses all operations from the stage of harvest till the material reaches
the end users in the desired form, packaging, quantity, quality and price.
Value addition
Value addition is a term frequently mentioned when discussing the future
profitability of agriculture. Its popularity rose substantially during the 1990s to the point
that it has become one of today’s buzzwords. What does it really mean, why it has
become so importants, and how can agricultural producers and agribusinesses
participate in value-added business ventures?
In general, adding value is the process of changing or transforming a product from
its original state to a more valuable state. Many raw commodities have intrinsic value in
their original state. For example, field corn grown, harvested, and stored on a farm and
then fed to livestock on that farm has value. In fact, value usually is added by feeding it
to an animal, which transforms the corn into animal protein or meat. The value of a
changed product is added value, such as processing wheat into flour, processing, bakery
product and marketing. The application of biotechnology, the engineering of food from
raw products to the consumers, and the restructuring of the distribution system to and
from the producer all provide opportunities for adding value. The produce-and-then-
sell mentality of the commodity business is being replaced by the strategy of first
determining what attributes consumers want in their food products and then creating or
manufacturing products with those attributes. With the continuous shifting to a global
economy, the international market for value-added products is growing. Market forces
have led to greater opportunities for product differentiation and added value to raw
commodities because of
Course -201 Market Led Extension
84
1) Increased consumer demands regarding health, nutrition, and convenience; 2) Efforts by food processors to improve their productivity; 3) Technological advances that enable producers to produce what consumers and processors desire.
Producers involved with adding value will become more than commodity
producers absorbing all the shocks brought about by global markets in this transitional
period of agriculture. They will think of themselves as producing products for end
users, instead of producing only raw commodities. No longer content to sell raw
commodities, some producers are striving for a larger share of the food dollar. These
projects range from adding value to hogs, cattle, bison, fish, and eggs to marketing crops
like organically grown grains, potatoes, carrots, beans, tomatoes, and corn for
sweeteners and fuels, to producing specialty cheeses and as farmers struggle to find
ways to increase farm income, interest in “adding value” to raw agricultural products
has grown tremendously.
The value of farm products can be increased in endless ways: by cleaning and
cooling, packaging, processing, distributing, cooking, combining, churning, culturing,
grinding, hulling, extracting, drying, smoking, handcrafting, spinning, weaving,
labeling, or packaging. (1) Today, more than ever, adding value means, “selling the
sizzle, not the steak.” The “sizzle” comes from information, education, entertainment,
image, and other intangible attributes. Because of the many regulations involved with
food processing, some people may choose to add value in other ways. On a larger scale,
producer-controlled processing for energy, fiber, and other non-food uses are options.
On a smaller scale, items such as flower arrangements, garlic braids, grapevine wreaths,
willow baskets, wheat straw weavings, sheep and goat milk soaps, and wool mulch are
a few examples. In addition, ideas for providing entertainment, information, and other
services associated with direct marketing are abundant. Besides offering a higher return,
value-added products can open new markets, create recognition for a farm, expand the
market season, and make a positive contribution to the community. It requires the
Primary Processing and Value additions
85
willingness and ability to take on risk, as well as adequate capital, management skills,
and personal skills—such as the ability to interact with the public— to succeed
6.2.2 Sectors of Food Processing Industry
The Ministry of Food Processing, Government of India indicates the following
Segments within the Food Processing industry
1. Grain processing 2. Dairy 3. Fruits & vegetable processing 4. Meat & poultry processing 5. Fisheries and 6. Consumer foods including packaged foods, beverages and packaged drinking
water.
While the industry is large in size, it is still at a nascent stage in terms of
development. Of the country’s total agriculture and food produce, only 2 per cent is
processed. The highest share of processed food is in the dairy sector, where 37 per cent
of the total produce is processed; of this only15 percent is processed by the organized
sector.
Food products of different sectors in food processing industry
Sectors Products
Grains & Cereals
Flour, Bakeries, Starch Glucose, Cornflakes, Malted Foods,Vermicelli, Beer and Malt extracts, Grain based Alcohol
Dairy
Whole Milk Powder, Skimmed milk powder, Condensed milk,Ice cream, Butter and Ghee, Cheese
Fruits and vegetables
Beverages, Juices, Concentrates, Pulps, Slices, Frozen &Dehydrated products, Potato Wafers/Chips, etc
Meat & Poultry Frozen and packed - mainly in fresh form, Egg Powder
Fisheries Frozen & Canned products mainly in fresh form
Consumer Foods
Snack food, Namkeens, Biscuits, Ready to eat food, Alcoholicand Non-alcoholic beverages
Course -201 Market Led Extension
86
The industry is estimated to grow at 9-12 per cent, on the basis of an estimated
GDP growth rate of 6-8 per cent, during the tenth five-year plan period. Value addition
of food products is expected to increase from the current 8 per cent to 35 per cent by the
end of 2025. Fruit & vegetable processing, which is currently around 2 per cent of total
production will increase to 10 per cent by 2010 and to 25 per cent by 2025. Given the size
of the industry and the nascent development stage, the food-processing sector is a key
focus area for the Government of India. The importance of the sector is further enhanced
by the fact that over 70 per cent of the population depends upon agricultural activity for
livelihood. The government has therefore been focusing on commercialization and value
addition to agricultural produce, minimizing pre/post harvest wastage, generating
employment and export growth in this sector, through a number of regulatory and fiscal
incentives.
6.2.3 Current Status of Indian Food Processing Industry
In the live stock sector, India has 16% of cattle, 57% of buffalo, 17% of goats and 5
% of sheep population of the world. Agriculture contributes 24.2% to
GDP, 15.2% of total exports and provides employment to 58.4% of country’s work force.
India is the
Second highest fruit and vegetable producer in the world (134.5 million tones) with cold storage facilities available only for 10% of the produce.
Highest producer of milk with a cold storage capacity of 70,000 tonne. Fifth largest producer of eggs. Sixth largest producer of fish with harvesting volumes of 5.2 million tones.
In spite of the vast natural resources and abundant agricultural produce India
ranks below 10th in the export of food products. Conservative estimates put processing
levels in the fruits and vegetables sector at 2%, meat and poultry at 2%, milk by way of
modern dairies at 14%, fish at 4%, bulk meat de-boning is to the tune of 21%. Currently,
the food processing sector, though in the nascent stage, constitutes 14% of
manufacturing GDP amounting to products value of Rs.2, 80,000 Crores. It employs 130
lakh persons and is supposed to increase at an annual rate of 7 percent.
Primary Processing and Value additions
87
6.2.4 Competitive Advantages
India has several competitive advantages in the food processing sector, which have
been analyzed using the framework shown below.
Demand conditions
India offers a huge growth opportunity for the food processing sector due to the
positive impact of demographic trends and expected regulatory changes.
Large target consumer base and rising income levels
India population is nearly 23 per cent of the global population and is one of the
most attractive consumer markets in the world today. Income levels across population
segments have been growing in India. According to NCAER data, the consuming class,
with an annual income of US$ 980(INR 45000) or above, is growing and is expected to
constitute over 80 per cent of the population by 2009-10. The increase in income levels of
the Indian population and the emergence of the consuming class that has higher
propensity to spend, offers great growth opportunities for companies across various
sectors.
Changing age profile of the Indian population
As a consequence of the high birth rates prevalent until the 1990s, a large
proportion of the Indian population is relatively young - in the age group of 20- 59
years. This group is also high in consumption and therefore, this trend is expected to
provide a further boost to the growth of consumption in India.
Changing lifestyles
Urban consumers in India have become more exposed to western lifestyles,
through overseas travel and presence of foreign media in India. For example, more than
5 million Indians traveled abroad last year and this number is expected to increase by 15
per cent to 20 per cent per annum. Increase in the population of working women and
increasing prevalence of nuclear double income families, especially in urban areas, are
Course -201 Market Led Extension
88
other trends shaping lifestyles. The food-processing sector has been impacted by these
trends, as there has been an increase in the demand for processed, ready-to-cook and
ready-to-eat food.
Factor conditions
Due to its diverse agro-climatic conditions, it has a wide-ranging and large raw
material base suitable for food processing industries. Presently a very small percentage
of these are processed into value added products. The semi-processed and ready to eat
packaged food segment is relatively new and evolving. India has the largest irrigated
land in the world. It is also world’s largest producer of milk, tea and pulses. India has
large marine product and processing potential with varied fish resources along the 8,041
km coastline, 28,000 km of rivers and millions of hectares of reservoirs and brackish
water.
India also possesses the largest livestock population in the world with 50 per cent
of world’s buffaloes and 20 per cent of cattle. Also, India is the world’s largest milk
producer. India’s comparatively cheaper workforce can be effectively utilized to set up
large low cost production bases for domestic and export markets. Cost of production in
India is lower by about 40 per cent over a comparable location in EU and 10-15 per cent
over a location in UK. Along with these factor conditions, India has access to significant
investments to facilitate food-processing industry. There have been increasing
investments not only by domestic firms and Indian government, but also foreign
investors.
Related and supporting industries
The Indian food processing industry has significant support from the well-
developed R&D and technical capabilities of Indian firms. India has a large number of
Research institutions like Central Food Technological Research Institute, Central
Institute of Fisheries Technology, National Dairy Research Institute, National Research
and Development Centre etc to support the technology and development in food
processing sector in India
Primary Processing and Value additions
89
6.2.5 SWOT Analysis of Agro-Processing
Industry infrastructure in India
Strengths
Round the year availability of raw materials. Social acceptability of agro-processing as important area and support from the
central government. Vast network of manufacturing facilities all over the country? It is not. Vast domestic market / ready demand. Conversance
Weaknesses
High requirement of working capital Low availability of new reliable and better accuracy instruments and equipments Inadequate automation w.r.t. information management. Remuneration less attractive for talent in comparison to contemporary
disciplines. Inadequately developed linkages between R&D labs and industry. Poor raw material quality Technology up gradation Poor food safety and quality standard
Opportunities
Large crop and material base in the country due to agro-ecological variability offers vast potential for agro processing activities.
Integration of developments in contemporary technologies such as electronics, material science, computer, bio-technology etc. offer vast scope for rapid improvement and progress.
Opening of global markets may lead to export of our developed technologies and facilitate generation of additional income and employment opportunities.
Threats
Competition from global players
Course -201 Market Led Extension
90
Loss of trained manpower to other industries and other professions due to better working conditions prevailing there may lead to further shortage of manpower.
Rapid developments in contemporary and requirements of the industry may lead to fast obsolescence.
6.3 Value Addition of Grains
India produces more than 200 million tonnes of different food grains every year.
All major grains – rice, wheat, maize, barley and millets like jowar (great millet), bajra
(pearl millet) & ragi (finger millet) are produced in the country. About 15 per cent of the
annual production of wheat is converted into wheat products. There are 10,000 pulse
mills in the country with a milling capacity of 14 million tonnes, milling about 75 per
cent of annual pulse production of 14 million tonnes.
The country is self sufficient in grain production and is the second largest rice
producer in the world with a 20 per cent global share. Primary milling of rice, wheat
and pulses is the most important activity in food grains processing. Total investment in
the grain milling sector up to December 2002 was around US$ 1.5 billion, of which US$
253.5 million was foreign investment. Branded rice is becoming popular in both the
domestic as well as the export market. Indian Basmati rice commands a premium in the
international market. This segment thus offers opportunities in marketing of branded
grains, as well as grains processing.
6.3.1 Paddy Processing
Paddy is the most important and extensively grown food crop in the World. It is
the staple food of more than 60 percent of the world population. Rice is mainly
produced and consumed in the Asian region. India has the largest area under paddy in
the world and ranks second in the production after China. Country has also emerged as
a major rice consumer. Paddy is a primary food grain crop of India and occupies about
37 percent of the area under food grains and contributed more than 40 percent of food
grains production in the country. More than 50 percent of country’s population depends
fully or partially on rice as it constitutes the main cereal food crop of the diet.
Primary Processing and Value additions
91
Rice is primarily a high energy calorie food. The major part of rice consists of
carbohydrate in the form of starch, which is about 72-75 percent of the total grain
composition. The protein content of rice is around 7 percent. The protein of rice contains
glutelin, which is also known as oryzenin. The nutritive value of rice protein (biological
value = 80) is much higher than that of wheat (biological value = 60) and maize
(biological value = 50) or other cereals. Rice contains most of the minerals mainly
located in the pericarp and germ and about 4 percent phosphorus. Rice also contains
some enzymes.
In world paddy production, Asia’s share is more than 90 percent. Paddy is a
primary food grain crop of India and occupies about 37 percent of the area under food
grains and contributed more than 40 percent of food grains production in the country
during 2000-01. More than 50 percent of country’s population depends fully or partially
on rice as it constitutes the main cereal food crop of the diet. During 1999-2000, in the
states like Andhra Pradesh, Assam, Kerala, Orissa, Tamil Nadu and West Bengal, rice
consumption accounted for more than 80 percent share in total cereal intake.
6.3.1.1 Post-Harvest Losses
It is estimated that about 10 percent of food grains produced in India, are lost in
processing and storage. It has been reported that about 9 percent of paddy is lost due to
use of old and outdated methods of drying and milling, improper and unscientific
methods of storage, transport and handling. It has been estimated that total post harvest
losses of paddy at producers’ level was about 2.71 percent of total production.
Measures to minimize post harvest losses
1. Timely harvest at optimum moisture percentage (20 to 22 percent). 2. Use of proper method of harvesting. 3. Avoid excessive drying, fast drying and rewetting of grains, which causes more
broken rice 4. Immediate drying the wet grain after harvest, preferably within 24 hours to avoid
heat accumulation 5. Use proper technique of processing i.e. cleaning, parboiling and milling.
Course -201 Market Led Extension
92
6. Adopt the grading practices to get more profit and to avoid the economic losses 7. Use proper scientific technique in storage for maintaining optimum moisture
content i.e. 12 percent for longer period and 14 percent for shorter storage period. 8. Use pest control measures (fumigation) before storage. 9. Provide aeration to stored grain and stir grain bulk occasionally.
6.3.2.1 Flour Milling
The objective of modern flour milling is to obtain the maximum amount of white
flour from the wheat endosperm without any bran or germ content. Conditioning of
wheat by hydrothermal treatment prior to milling helps in the separation of barn and
germ from the endosperm. If wheat is conditioned by hydrothermal treatment, bran
and germ become rubber-like while the endosperm becomes soft. It also eliminates the
difference in grinding characteristics between soft and hard wheat. When the
conditioned wheat is sheared by the corrugations of first break roll during the milling
operation, it splits open releasing small endosperm pieces and thus exposing the
remaining endosperm, which could be carefully scraped off the bran in successive break
rolls. The yield of wheat flour and byproducts (called mill feed) from wheat flour
milling is about 70 percent and 30 per cent by weight, respectively. The mill feed is
composed of 12 per cent bran and 3 per cent germ and 15 per cent shorts. Wheat consists
of bran (12 percent), germ (3 per cent) and endosperm (85 per cent),
Modern flour milling consists of six steps:
1. Receiving, drying and storage of wheat, 2. Cleaning, 3. Conditioning, 4. Milling into flour and byproducts, 5. Packaging and storage of finished products, and 6. Blending of them.
The most important, operations namely, cleaning, conditioning and milling have
been discussed here.
Primary Processing and Value additions
93
Cleaning
Wheat is thoroughly cleaned to remove all fine impurities and the dirt sticking to
the surface of the grain. To remove loose fine impurities a set of cleaners is employed.
Small pieces of sticks, stones, sand, etc., are removed by sieving and the light impurities
like chaff, etc., are removed by aspirations. Then the wheat is allowed to pass over
powerful magnetic separators to remove pieces of ferromagnetic materials. Disc
separators remove the seeds of other food grains, defective grains and weed.
The next step in the cleaning operation is the removal or dirt sticking to the surface
by scouring. Usually, paddles against stationary emery-coated surface move wheat.
Then the dirt and loose outer coating are aspirated off. The scratches and cracks formed
in wheat during scouring help in increasing the rate of moisture absorption at the time
of washing and conditioning.
The final cleaning step is washing by water, which allows the dirt and bits of metal
to sink. The moisture Content of wheat is increased by about one per cent during
washing.
Conditioning/Hydrothermal Treatment
The conditioning of wheat can be done either at room temperature, elevated
temperature or at high temperature. But the temperature of wheat grain- should not be
raised above 47° C otherwise the gluten quality will be affected which deteriorates the
baking quality of the flour.
Generally the moisture contents of soft and hard wheats are increased to 15 to 17
per cent and 16 to 19 per cent respectively by soaking and then tempering for 18 to 72
hours in the tempering bin equilibrates the moisture of the grain.
In a modern system conditioning of wheat is performed in four stages. The
conditioner mainly consists of three sections, namely, preheating section, moistening
section, and cooling section. In the first section wheat is preheated to the proper
temperature, in the second section wheat is moistened to the desired moisture level and
Course -201 Market Led Extension
94
in the third section soaked wheat is cooled to the room temperature. Finally the treated
wheat is kept in a separate tempering bin for 18 to 72 hours.
Hydrothermal treatment of grain by direct steaming has been popular for the last
few years. It has many advantages over heating by air because both moistening and
heating are carried out simultaneously in a single operation. Moreover, the grain is
heated within 20 to 30 seconds to about 47°C. But the grain temperature above 47°C
may adversely affect the quality of the flour. The rapid rate of heating weakens the
intermolecular bonds in various parts of the grain to a considerable extent resulting in
easier separation of bran, more effective grinding of endosperm and stronger action on
proteins and enzymes.
Grinding (Milling)
Milling of wheat is carried out by roller mills. The roller milling system is mainly
divided into the break roll and reduction roll systems. In addition most of the flourmills
keep a stand-by system known as scratch system. The scratch system is nothing but an
extension of the break roll system. The break rolls and the reduction rolls are
differentiated with the variation in their surface conditions. The surface of the reduction
roll is smooth whereas the surface of break roll is corrugated. In the break rolls, the bran
is cracked, the kernel is broken open. The endosperm adhering to bran is milled away
successively in a few steps generally a series of four sets of break rolls are used. Each set
of rolls takes stock from the preceding one. After each break, the mixture of free bran,
free endosperm, free germ and endosperm still adhering to the bran is sifted and
separated. The endosperm adhering to bran is passed through the next break roll while
the middle size endosperms called middlings are sent to the reduction rolls for proper
size reduction to flours. Therefore, the break rolls are mainly used for the production of
middlings and the reduction rolls are used for grinding of free middlings into proper
flour size. After each reduction of endosperm (middlings) the flour is sifted away from
the bigger size middlings and the remaining middlings are passed to the next reduction
rolls. The above operations are continued until the desired products are obtained. As
Primary Processing and Value additions
95
many as 12 to 14 reduction rolls are used in most flourmills. But alt reduction rolls are
not used for all break products.
Storage of Finished Products
The flour and the mill feed (bran, germ and shorts) are bagged in waterproof bags,
stitched and stored in cold dry condition in flat god owns.
6.4 Value Addition of Pulses
Pulses are basically grain legumes. Grain legumes occupy an important place in
human nutrition due to their higher protein content than cereal grains. They are
particularly important for major segment of population in developing countries who
cannot afford animal protein due to high costs. Majority of Indians are vegetarians and
they depend largely, for a major part of their dietary protein, on grain legumes (pulses).
Grain legumes, complement cereals and make an ideal combination to provide protein
quality matching that of animal products .Legumes contributes a major portion of lysine
in the vegetarian diet. They are also fairly good sources of vitamins like thiamine, niacin
and riboflavin and much needed iron, but relatively poor source of calcium and sulphur
containing amino acids. Nutritive studies have shown that inclusion of various legumes
in the cereal-based diet can solve the protein calorie malnutrition and promote growth
especially of the underweight children. To achieve optimum nutritional
complementarily cereals and legumes need to be eaten in an approximate ratio of 3:1 i.e.
75 gm of rice or wheat and 25 gm of legumes Post harvest technology of grain legumes
involves cleaning, storage, milling and packaging operations. Grain legumes are
processed and utilized in a number of ways such as dry seeds, fried seeds, cooked dhal
etc.
India is the largest producer and consumer of pulses in the world (14.2 million
tones), accounting for about 25% of production and 27% consumption. Pulses are the
main source of proteins for vegetarians in India, where about 15 – 30% of daily protein
needs are supplied only from edible pulses. Pulses are mostly consumed in the form of
dhal, dehusked and split kernel.
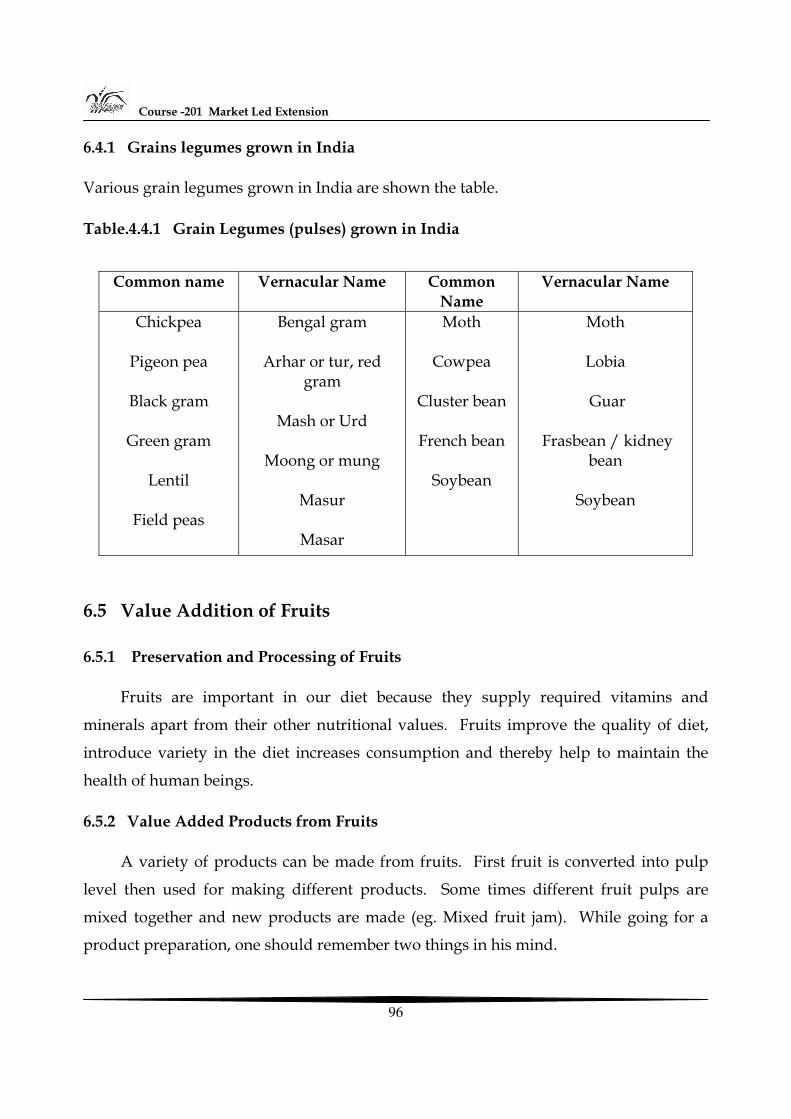
Course -201 Market Led Extension
96
6.4.1 Grains legumes grown in India
Various grain legumes grown in India are shown the table.
Table.4.4.1 Grain Legumes (pulses) grown in India
Common name Vernacular Name Common
Name Vernacular Name
Chickpea
Pigeon pea
Black gram
Green gram
Lentil
Field peas
Bengal gram
Arhar or tur, red gram
Mash or Urd
Moong or mung
Masur
Masar
Moth
Cowpea
Cluster bean
French bean
Soybean
Moth
Lobia
Guar
Frasbean / kidney bean
Soybean
6.5 Value Addition of Fruits
6.5.1 Preservation and Processing of Fruits
Fruits are important in our diet because they supply required vitamins and
minerals apart from their other nutritional values. Fruits improve the quality of diet,
introduce variety in the diet increases consumption and thereby help to maintain the
health of human beings.
6.5.2 Value Added Products from Fruits
A variety of products can be made from fruits. First fruit is converted into pulp
level then used for making different products. Some times different fruit pulps are
mixed together and new products are made (eg. Mixed fruit jam). While going for a
product preparation, one should remember two things in his mind.
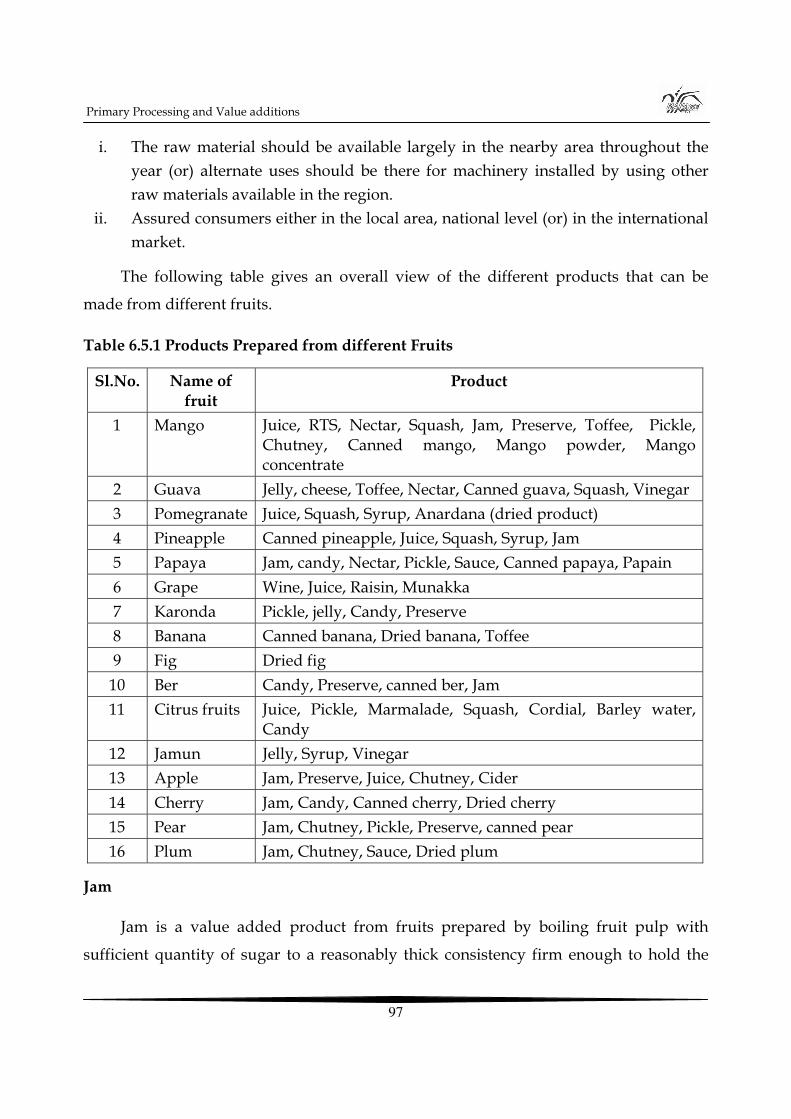
Primary Processing and Value additions
97
i. The raw material should be available largely in the nearby area throughout the year (or) alternate uses should be there for machinery installed by using other raw materials available in the region.
ii. Assured consumers either in the local area, national level (or) in the international market.
The following table gives an overall view of the different products that can be
made from different fruits.
Table 6.5.1 Products Prepared from different Fruits
Sl.No. Name of fruit
Product
1 Mango Juice, RTS, Nectar, Squash, Jam, Preserve, Toffee, Pickle, Chutney, Canned mango, Mango powder, Mango concentrate
2 Guava Jelly, cheese, Toffee, Nectar, Canned guava, Squash, Vinegar 3 Pomegranate Juice, Squash, Syrup, Anardana (dried product) 4 Pineapple Canned pineapple, Juice, Squash, Syrup, Jam 5 Papaya Jam, candy, Nectar, Pickle, Sauce, Canned papaya, Papain 6 Grape Wine, Juice, Raisin, Munakka 7 Karonda Pickle, jelly, Candy, Preserve 8 Banana Canned banana, Dried banana, Toffee 9 Fig Dried fig 10 Ber Candy, Preserve, canned ber, Jam 11 Citrus fruits Juice, Pickle, Marmalade, Squash, Cordial, Barley water,
Candy 12 Jamun Jelly, Syrup, Vinegar 13 Apple Jam, Preserve, Juice, Chutney, Cider 14 Cherry Jam, Candy, Canned cherry, Dried cherry 15 Pear Jam, Chutney, Pickle, Preserve, canned pear 16 Plum Jam, Chutney, Sauce, Dried plum
Jam
Jam is a value added product from fruits prepared by boiling fruit pulp with
sufficient quantity of sugar to a reasonably thick consistency firm enough to hold the
Course -201 Market Led Extension
98
fruit tissue in position – fruit pulps like apple, pear, papaya, carrot, strawberry,
raspberry, mango, tomato, grapes, pineapple etc. are used for making jam. Some times
two or more fruit juices are mixed and mixed fruit jam is prepared. Jam contains 0.5 –
0.6% acid, and invert sugar less than 40%.
Jelly
It is a semisolid product made by boiling a clear, strained solution of pectin
containing fruit extract free from pulp after the addition of sugar and acid. A perfect
jelly is transparent, well set, but not too stiff and has the original flavour of the fruit. It
should have attractive colour, and retain its shape when removed from the mould. It
should not be gummy, sticky, or syrupy or have crystallized sugar. It should be free
from dullness and neither rough nor rubbery.
Guava, sour apple, karonda, wood apple, papaya and gooseberry are generally
used for the preparation of jelly. Pineapple, strawberry, raspberry etc., can be used but
only after addition of pectin powder, because these fruits have low pectin content. Acid
content in jelly is 0.5 – 0.75%.
Vinegar
It is a liquid obtained by alcoholic and acetic acid fermentation containing about
5% acetic acid (50 grain strength)
Cordial
It is a sparking clear, sweetened fruit juice from which pulp and other insoluble
substances have been removed. It contains minimum 25% fruit juice, and 30% TSS 1.5%
and 350 ppm SO2. This is highly suitable for blending with wines.
Squash
It is a type of fruit beverage containing at least 25% fruit juice / pulp, 40 – 50% TSS
1% acid and 350 ppm SO2 or 600 ppm sodium benzoate. It is diluted and serves.
Primary Processing and Value additions
99
Crush
It is similar to squash. It contains minimum 25% fruit juice / pulp, 55% TSS and
1.0 % acid. It is also diluted and served.
Syrup
This is another type of fruit beverage contains at least 25% fruit juice / pulp 65%
TSS and 1.3 to 1.5% acid. It is also diluted before serving.
6.6 Value Addition of Vegetables
Vegetables should be harvested, handled and processed when optimum stage is
reached. The post harvest losses will be more, if harvesting is done later or earlier than
the optimum condition. Vegetables reach the peak of its quantity at a definite time
depending upon varieties, time of planting, location, temperature, soil type, available
water, cultural practice, purpose for which it is harvested. By considering the factors like
chronological age, size, shape, surface characteristics, colour, firmness, soluble solids,
sugars, starch presence, sugar to acid ratio, oil content etc., the maturity of a product can
be judged.
6.6.1 Preparing Vegetables for Preservation and Processing
a) Harvesting:
Harvesting is done at optimum maturity stage before any portion of vegetable
become tough and fibrous. Vegetables harvested at its peak quality are highly
perishable. Hence, “cold chain concept” may be adopted and transported from the site
of harvest to processing center. Cooling of harvested vegetables in the field will remove
the field heat and will increase the keeping quality.
b) Sorting and grading:
This operation helps to remove off colour, off size, insect and mold infected other
variety materials and trashes from required vegetables. Mechanical devices like roller
Course -201 Market Led Extension
100
grader, air blower, rod shaker, sorter, conveyor belt, roller sorter, weight sorter and
image processing and colour sorting technologies are used and the vegetables are
graded.
c) Washing:
It is done to remove adhered field soil, surface microorganisms, pesticides, dust &
dirt, insects and its residue, residues of insecticides and fungicide applied etc. Food
grade detergents can be used when washing root vegetables like potato, carrot, beetroot
etc. and even for tomato, leafy vegetables too. Mechanical washers like watering
sprayers, rotary drum, brushing washers; shaker washer etc may be used. However,
while selecting the washer the fragile nature of vegetables should be borne in mind.
d) Preparation:
Skin removal:
i) Mechanical method:
A machine with abrasive device (all root vegetables). A machine with knives (potato). A machine with rotating sieves drums (root vegetables).
ii) Chemical method:
It is done by immersing the vegetable in lye solution of 0.5 – 3% concentration at
93oC for a short period of 0.5 to 3 minutes. For potato 10% lye solution is recommended
to dissolve the cutin. The skin loosened by the action of lye is removed by water jet. To
overcome the problem of enzymatic browning after skin removal boiling in dilute citric
acid may be followed.
iii) Thermal method:
Wet heat (Steam): Vegetables like potato, carrot, sweet potato etc are heated using
steam under a pressure of 10 kg/cm2 in a vessel for short time. This softens the skin and
the underlying tissue. Then the pressure is suddenly released. The steam under the skin
Primary Processing and Value additions
101
expands and causes the skin to puff and crack, then the skin is washed with high
pressure water jet.
Dry heat (Flame): Pepper and onion are best skin removed by exposing them to
direct flame (100oC, 1 min) or hot gases in a rotary tube flame peelers. Here also due to
puffing action skin is loosened and removed by using high-pressure water jet.
iv) Cutting and trimming:
In some vegetables example Cauliflower, the cover leaves are trimmed and the
center curd portion is processed.
e) Size reduction
This is done based on the vegetables to be processed and purpose for which is
processed.
f) Blanching
Most vegetables that do not receive a high temperature heat treatment must be
heated to a minimal temperature to inactivate natural enzymes before processing or
storing (even when frozen).this special heat treatment to inactivate enzymes is known as
blanching.
Enzymes like catalase, peroxidase, polyphenoloxidase and lipoxygenase are
responsible for change in aroma and development of off flavour in the processed
product. To overcome these problems and to get stable processed product, blanching is
preferred. Blanching process with steam or hot water helps to reduce the microbial load
present on the surface of fresh produce. Blanching also helps to remove harsh flavours
in the collards, snap beans and spinach during freeze preservation.
Fresh Storage
After harvest, the vegetable looses its resistance to any spoiling action.
Microorganisms and others accelerate the spoilage of vegetables
Course -201 Market Led Extension
102
6.7 Value Addition in Dairy Industry
The dairy industry in India is better organized amongst other categories of
processed food industry in India. When the world production of fluid milk stands at
around 613 million tonnes and is growing at a rate of only 1.1 percent India’s milk
production stood around 100 million tonnes growing at around 4 per cent per annum.
This means that 15 % of the world’s milk is produced in India and growing at a rate four
times of global growth rate giving India the status of the largest milk producing nation
in the world. With total output of milk in the country topping 100 million tonnes, valued
at nearly Rs2,00,000 crore, it also remains India's number one commodity, ahead of
wheat and rice. The share of the 'milk group' in the total value of output from
agriculture and livestock during 2004-05 was 17.89 per cent, meaning almost every fifth
rupee generated from agriculture and allied activities in the country comes from
dairying.
There are two important points namely, about 58 percent of this milk is from
buffalo and despite being the highest milk producing nation in the world the per capita
milk consumption in India is still lower (229 gm per day) than the world average (285
gm per day). Our milk production, processing and marketing channel as it exists is
unique in nature. About 70 million rural households are involved in cattle rearing and
milk production, out of which only 11 million farmers are linked with the 0.1 million
dairy cooperative societies generating about 18 million tonnes of the fluid milk daily.
This milk from dairy cooperatives forms the major source of fluid milk supply to cities
and towns across the country.
6.7.1 Value Added Dairy Products
The milk is considered natures almost perfect food. By the same token, it provides
an ideal medium for the growth of microorganisms. As a result, its shelf life is very
short, 5-6 hrs at ambient temperature. The first and most important stage of value
addition takes place by application of heat, i.e. pasteurization when the shelf llife can be
enhanced up to two weeks under refrigeration. The second stage of value addition takes
Primary Processing and Value additions
103
place when higher heat treatment, viz. sterilization and UHT processes are applied.
Thus the shelf life can be enhanced up to months at ambient conditions. These two
processes also provide an avenue for producing variety of fluid milk products, viz. full
cream milk, standardized milk, toned milk, double toned milk, variety of flavoured milk
and beverages, sterilized and UHT milk etc. The third stage of value addition occurs
when precious milk is covered into an array of mouth-watering dairy products. The
value addition does not end here. The milk and milk products provide an ideal medium
for the enhancement of functional nutritional, therapeutic and medicinal value of milk
and milk products.
6.7.2 Milk Processing Sequence
Clarification
The milk is passed through a centrifugal clarifier to remove sediment body cells
from udder and some bacteria. A special machine known as Bactofuge operating under
much greater centrifugal force has been designed for a high degree of bacterial removal.
Pasteurization
The aim of pasteurizing milk is to destroy or remove the disease producing
organisms and to reduce substantially the total bacterial count for improved keeping
quality. Pasteurization temperatures and times are selected to ensure destruction of
Mycobacterium tuberculosis, the highly heat resistant non-spore forming bacteria that can
transmit tuberculosis to humans.
The two accepted methods of milk pasteurization are
1. The batch or holding method of heating every particle of milk to not less than 63 O C and holding at this temperature for not less than 30 min and
2. The High –Temperature- Short –Time (HTST) method of heating every particle of milk to not less than 72 0 C and holding for not less than 15 sec
Course -201 Market Led Extension
104
Homogenization
The purpose of homogenization is to subdivide the fat globules and clumps to
such a small level that they no longer rise to the top of the milk as a distinct layer in the
time before the milk is normally consumed. Homogenization makes the milk more
uniform, gives a richer taste and white appearing colour and prevents the cream from
rising to the top of the container.
6.7.3 Special Milks and Milk Products
Standardized milk
This is milk who’s fat and solids – not – fat content have been adjusted to a certain
pre determined level. Under PFA rules (1976) the standardized milk for liquid
consumption should contain a minimum of 4.5 percent fat and 8.5 percent solids- not-
fat.
Recombined milk
This refers to the product obtained when butter oil, skim milk powder and water
are combined in the correct proportion to yield fluid milk added
Vitaminized milk
Vitaminised milk is the milk to which one or more vitamins are added. Addition of
vitamins (and minerals) to milk is called fortification and such milk is called fortified
milk.
Soft curd milk
The casein of the milk coagulates and forms curd when acted upon by the enzymes
and acid of the stomach. This curd may be harder or softer depending upon the amount
of casein and calcium in the milk and other factors. Soft curd milk may be easier to
digest by infants and young children. Various treatments to produce soft curd milk are
removal of some calcium by ion exchange, treatment of the milk with n enzymes etc.
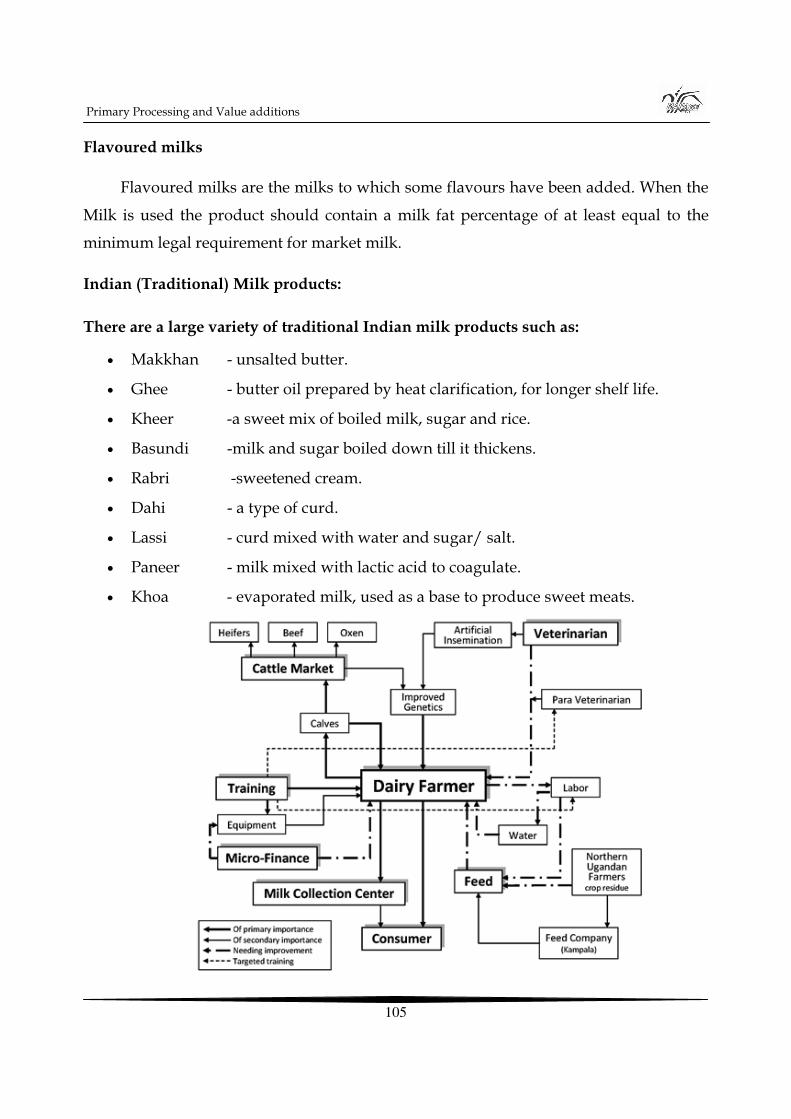
Primary Processing and Value additions
105
Flavoured milks
Flavoured milks are the milks to which some flavours have been added. When the
Milk is used the product should contain a milk fat percentage of at least equal to the
minimum legal requirement for market milk.
Indian (Traditional) Milk products:
There are a large variety of traditional Indian milk products such as:
• Makkhan - unsalted butter.
• Ghee - butter oil prepared by heat clarification, for longer shelf life.
• Kheer -a sweet mix of boiled milk, sugar and rice.
• Basundi -milk and sugar boiled down till it thickens.
• Rabri -sweetened cream.
• Dahi - a type of curd.
• Lassi - curd mixed with water and sugar/ salt.
• Paneer - milk mixed with lactic acid to coagulate.
• Khoa - evaporated milk, used as a base to produce sweet meats.
Course -201 Market Led Extension
106
6.8 Let Us Sum Up
Agro-processing is now regarded as the sunrise sector of the Indian economy in
view of its large potential for growth and likely socio economic impact specifically on
employment and income generation. Some estimates suggest that in developed
countries, up to 14 per cent of the total work force is engaged in agro-processing sector
directly or indirectly. However, in India, only about 3 per cent of the work force finds
employment in this sector revealing its underdeveloped state and vast untapped
potential for employment. Properly developed, agro-processing sector can make India a
major player at the global level for marketing and supply of processed food, feed and a
wide range of other plant and animal products
Supply Chain Management –Resource Material
107
Unit - 7
Supply Chain Management –Resource Material
Structure
7.0 Objectives
7.1 Introduction
7.2 Supply Chain Management – An overview
7.3 Forecasting
7.4 Purchasing &Inventory Management
7.5 Warehouse management
7.6 Transportation
7.7 E- Supply Chain Management
7.8 Agri supply Chain Management
7.9 Case studies
7.10 Let us sum up
7.0 Objectives
After going through this unit you will be in a position to understand.
• The process of supply chain management • How key drivers of supply chain regulates its performance • What are purchase parameters • How can a ware house be managed
7.1 Introduction
Supply chain management (SCM) represents the management of the entire set of
production, manufacturing/transformations, distribution and marketing activities by
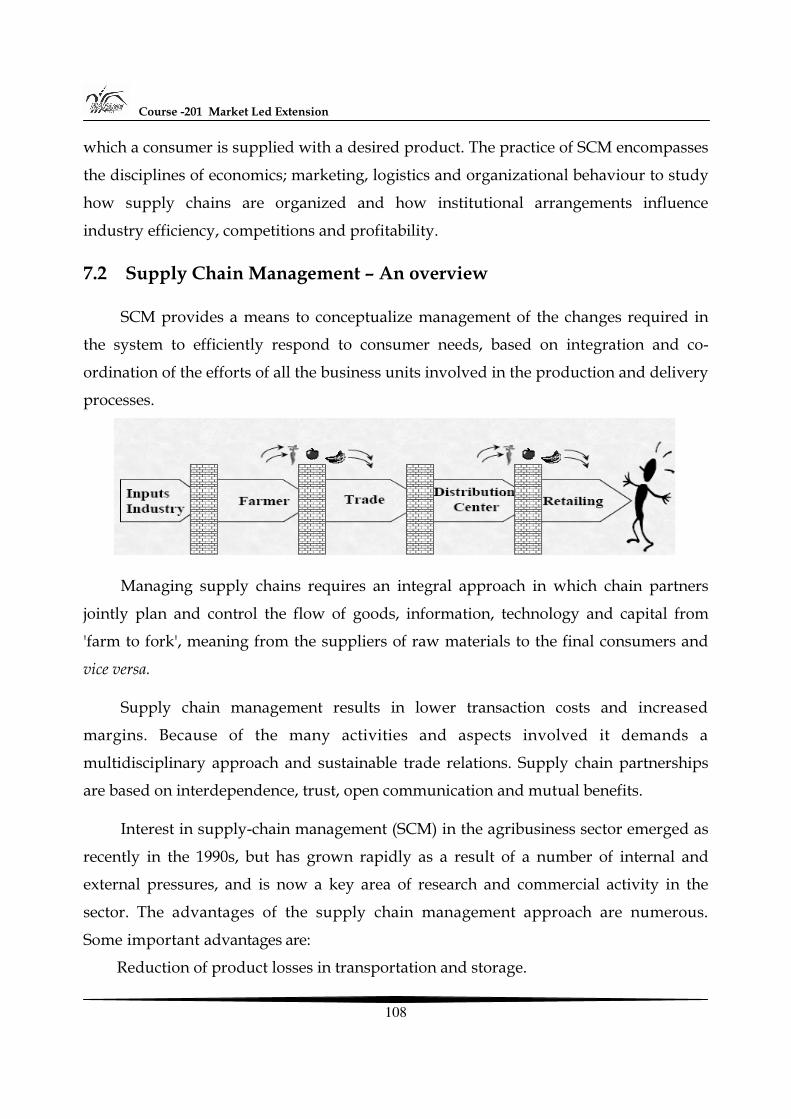
Course -201 Market Led Extension
108
which a consumer is supplied with a desired product. The practice of SCM encompasses
the disciplines of economics; marketing, logistics and organizational behaviour to study
how supply chains are organized and how institutional arrangements influence
industry efficiency, competitions and profitability.
7.2 Supply Chain Management – An overview
SCM provides a means to conceptualize management of the changes required in
the system to efficiently respond to consumer needs, based on integration and co-
ordination of the efforts of all the business units involved in the production and delivery
processes.
Managing supply chains requires an integral approach in which chain partners
jointly plan and control the flow of goods, information, technology and capital from
'farm to fork', meaning from the suppliers of raw materials to the final consumers and
vice versa.
Supply chain management results in lower transaction costs and increased
margins. Because of the many activities and aspects involved it demands a
multidisciplinary approach and sustainable trade relations. Supply chain partnerships
are based on interdependence, trust, open communication and mutual benefits.
Interest in supply-chain management (SCM) in the agribusiness sector emerged as
recently in the 1990s, but has grown rapidly as a result of a number of internal and
external pressures, and is now a key area of research and commercial activity in the
sector. The advantages of the supply chain management approach are numerous.
Some important advantages are:
Reduction of product losses in transportation and storage.
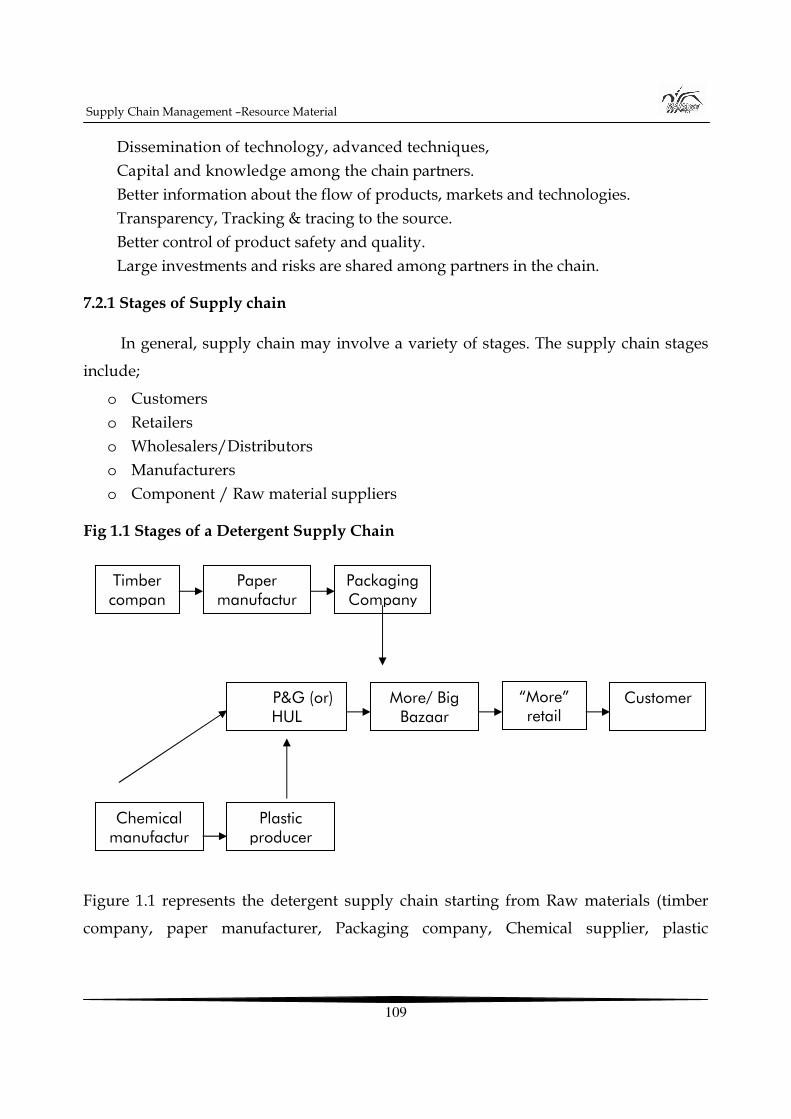
Supply Chain Management –Resource Material
109
Dissemination of technology, advanced techniques, Capital and knowledge among the chain partners. Better information about the flow of products, markets and technologies. Transparency, Tracking & tracing to the source. Better control of product safety and quality. Large investments and risks are shared among partners in the chain.
7.2.1 Stages of Supply chain
In general, supply chain may involve a variety of stages. The supply chain stages
include;
o Customers o Retailers o Wholesalers/Distributors o Manufacturers o Component / Raw material suppliers
Fig 1.1 Stages of a Detergent Supply Chain
Figure 1.1 represents the detergent supply chain starting from Raw materials (timber
company, paper manufacturer, Packaging company, Chemical supplier, plastic
Timber compan
Paper manufactur
PackagingCompany
P&G (or)HUL
More/ Big Bazaar
“More” retail
Chemical manufactur
Plastic producer
Customer
Course -201 Market Led Extension
110
producer), Manufacturer (P&G, HUL), Whole saler (More/ Big bazaar), Retailer(Kannan
departmental store/ More) and finally customer
7.2.2 Process view of a supply chain
A supply chain is a sequence of processes and flows that take place within and
between different stages and combine to fill a customer need for a product. There are
two different ways to view the processes performed in a supply chain.
1. Cycle view : The processes in a supply chain are divided into a series of cycles, each performed at the interface between two successive stages of a supply chain.
2. Push/pull view : The processes in a supply chain are divided into two categories depending on whether they are executed in response to a customer order or in anticipation of customer orders. Pull processes are initiated by a customer order whereas push processes are initiated and performed in anticipation of customer orders.
Cycle view of supply chain processes
All supply chain processes can be broken down into the following four process cycles.
• Customer order cycle • Replenishment cycle • Manufacturing cycle • Procurement cycle
Customer Order Cycle
The customer order cycle occurs at the customer / retailer interface and includes
all processes directly involved in receiving and filling the customer’s order. Typically,
the customer initiates this cycle at a retailer site and the cycle primarily involves filling
customer demand. The retailer’s interaction with the customer starts when the customer
arrives or contact is initiated and ends when the customer receive the order.
• Customer arrival • Customer order entry • Customer order fulfillment • Customer order receiving
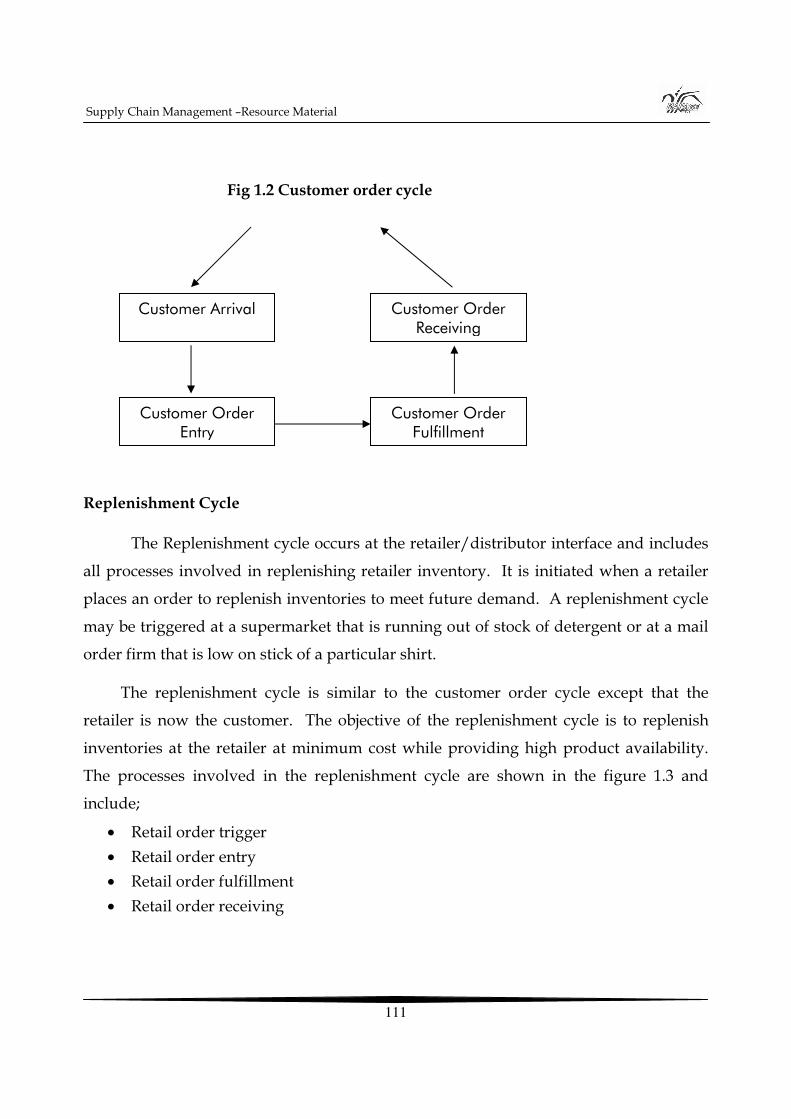
Supply Chain Management –Resource Material
111
Fig 1.2 Customer order cycle
Replenishment Cycle
The Replenishment cycle occurs at the retailer/distributor interface and includes
all processes involved in replenishing retailer inventory. It is initiated when a retailer
places an order to replenish inventories to meet future demand. A replenishment cycle
may be triggered at a supermarket that is running out of stock of detergent or at a mail
order firm that is low on stick of a particular shirt.
The replenishment cycle is similar to the customer order cycle except that the
retailer is now the customer. The objective of the replenishment cycle is to replenish
inventories at the retailer at minimum cost while providing high product availability.
The processes involved in the replenishment cycle are shown in the figure 1.3 and
include;
• Retail order trigger • Retail order entry • Retail order fulfillment • Retail order receiving
Customer Arrival
Customer Order Entry
Customer Order Fulfillment
Customer Order Receiving
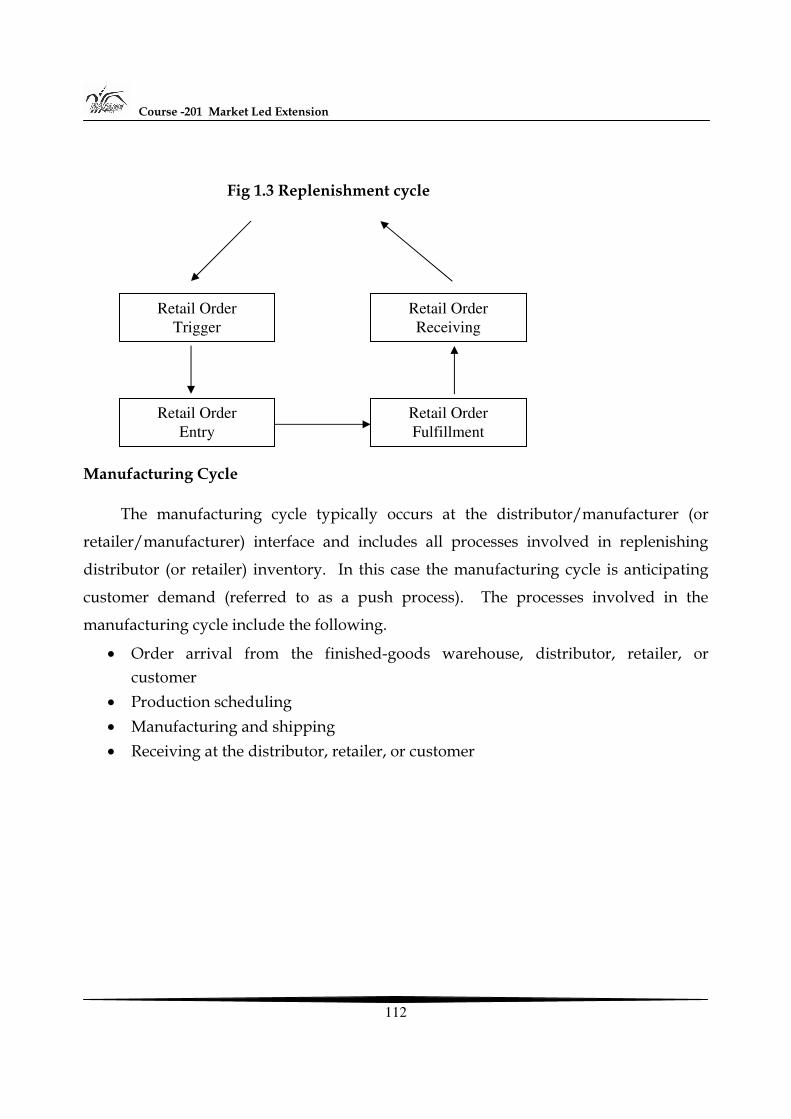
Course -201 Market Led Extension
112
Fig 1.3 Replenishment cycle
Manufacturing Cycle
The manufacturing cycle typically occurs at the distributor/manufacturer (or
retailer/manufacturer) interface and includes all processes involved in replenishing
distributor (or retailer) inventory. In this case the manufacturing cycle is anticipating
customer demand (referred to as a push process). The processes involved in the
manufacturing cycle include the following.
• Order arrival from the finished-goods warehouse, distributor, retailer, or customer
• Production scheduling • Manufacturing and shipping • Receiving at the distributor, retailer, or customer
Retail Order Trigger
Retail Order Entry
Retail Order Fulfillment
Retail Order Receiving
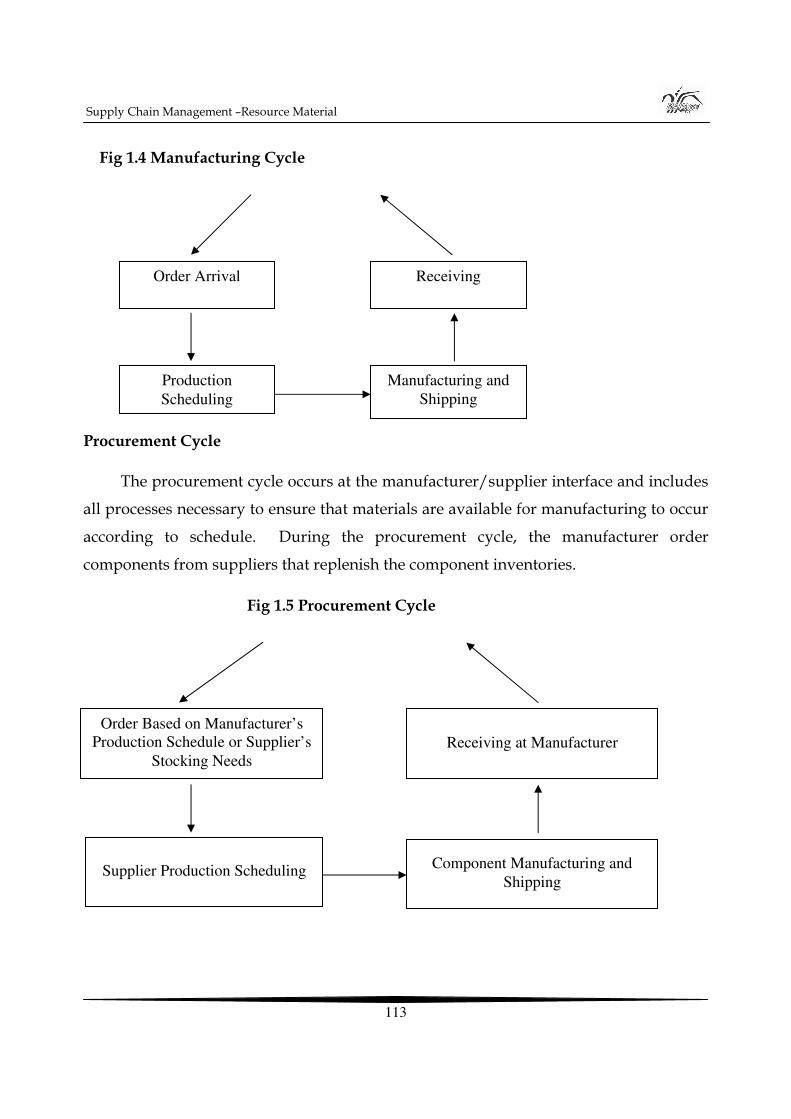
Supply Chain Management –Resource Material
113
Fig 1.4 Manufacturing Cycle
Procurement Cycle
The procurement cycle occurs at the manufacturer/supplier interface and includes
all processes necessary to ensure that materials are available for manufacturing to occur
according to schedule. During the procurement cycle, the manufacturer order
components from suppliers that replenish the component inventories.
Fig 1.5 Procurement Cycle
Order Arrival
Production Scheduling
Manufacturing and Shipping
Receiving
Order Based on Manufacturer’s Production Schedule or Supplier’s
Stocking Needs
Supplier Production Scheduling
Receiving at Manufacturer
Component Manufacturing and Shipping
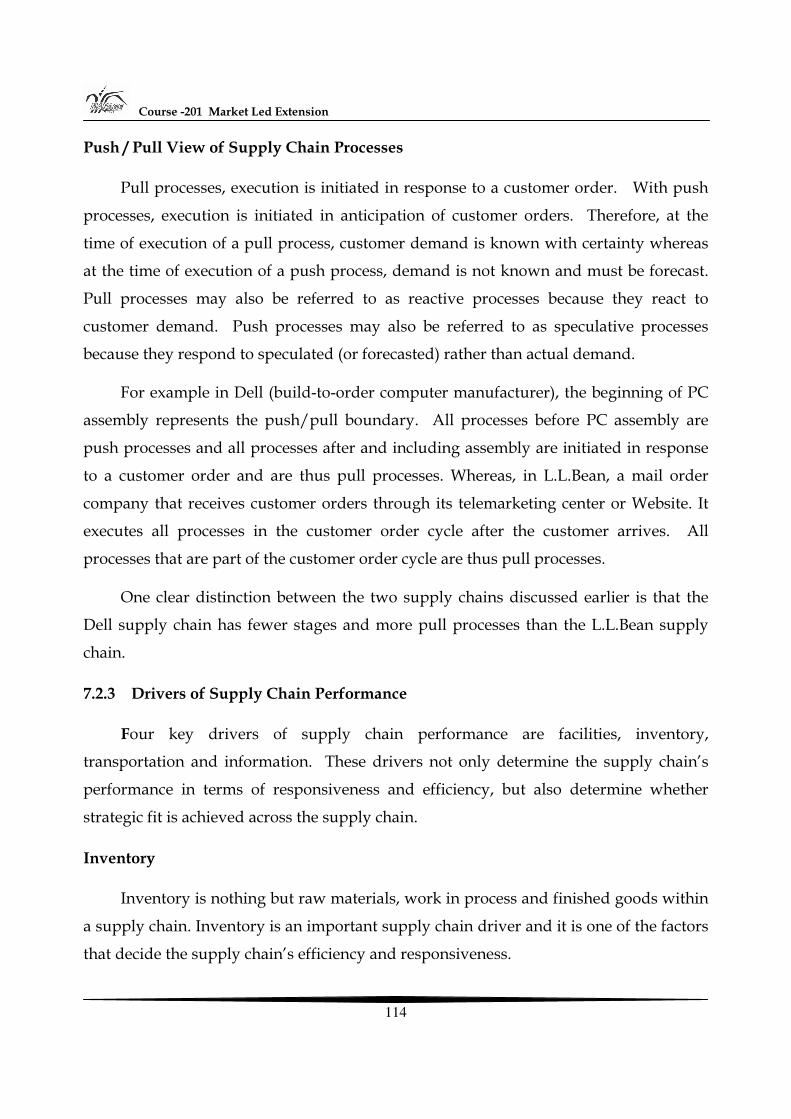
Course -201 Market Led Extension
114
Push / Pull View of Supply Chain Processes
Pull processes, execution is initiated in response to a customer order. With push
processes, execution is initiated in anticipation of customer orders. Therefore, at the
time of execution of a pull process, customer demand is known with certainty whereas
at the time of execution of a push process, demand is not known and must be forecast.
Pull processes may also be referred to as reactive processes because they react to
customer demand. Push processes may also be referred to as speculative processes
because they respond to speculated (or forecasted) rather than actual demand.
For example in Dell (build-to-order computer manufacturer), the beginning of PC
assembly represents the push/pull boundary. All processes before PC assembly are
push processes and all processes after and including assembly are initiated in response
to a customer order and are thus pull processes. Whereas, in L.L.Bean, a mail order
company that receives customer orders through its telemarketing center or Website. It
executes all processes in the customer order cycle after the customer arrives. All
processes that are part of the customer order cycle are thus pull processes.
One clear distinction between the two supply chains discussed earlier is that the
Dell supply chain has fewer stages and more pull processes than the L.L.Bean supply
chain.
7.2.3 Drivers of Supply Chain Performance
Four key drivers of supply chain performance are facilities, inventory,
transportation and information. These drivers not only determine the supply chain’s
performance in terms of responsiveness and efficiency, but also determine whether
strategic fit is achieved across the supply chain.
Inventory
Inventory is nothing but raw materials, work in process and finished goods within
a supply chain. Inventory is an important supply chain driver and it is one of the factors
that decide the supply chain’s efficiency and responsiveness.
Supply Chain Management –Resource Material
115
Transportation
Transportation entails moving inventory from one point to another point in the
supply chain. Transportation choices have a large impact on supply chain
responsiveness and efficiency.
Facility
These are locations where raw materials, finished goods are stored or fabricated
and distributed. The two major types of facilities are production sites and storage sites.
Whatever the function of the facility, decisions regarding location, capacity and
flexibility of facilities have a significant impact on the supply chain’s performance.
Information
Information consists of data and analysis concerning facilities, inventory,
transportation, and customers throughout the supply chain. Information is potentially
the biggest driver of performance in the supply chain as it directly affects each of the
other drivers.
7.2.4 Distribution in the supply chain Management
Distribution refers to the steps taken to move and store a product from the
supplier stage to the customer stage in the supply chain. Distribution occurs between
every pair of stages in the supply chain. Distribution is a key driver of the overall
profitability of a firm because it directly impacts both the supply chain cost and the
customer experience.
Distribution related costs form about 10.5 percent of the U.S. economy and about
20 percent of the cost of manufacturing. For commodity products, distribution forms an
even higher fraction of the product cost. In India, the outbound distribution cost of
cement is about 30 percent of the cost of production and selling cement.
Wal-Mart and 7-Eleven Japan, have built the success of their entire business
around outstanding distribution design and operation. In the case of Wal-Mart,
Course -201 Market Led Extension
116
distribution allows them to provide good availability or relatively common products at
very low cost. In the case of 7-Eleven distribution allows them to provide a very high
level of customer responsiveness at a reasonable cost.
Factors influencing distribution network design
• Customer needs • Cost of meeting customer needs • Response time: It is the time between when a customer places an order and
receives delivery. • Product variety: It is the number of different products/configurations that a
customer desires from the distribution network. • Product availability: Availability is the probability of having a product in stock
when a customer order arrives • Customer experience: It is purely experiential aspects like customer satisfaction
and customer delight. • Order visibility: It is the ability of the customer to track their order from
placement to delivery • Return ability: It is the ease with which a customer can return unsatisfactory
merchandise and the ability of the network to handle such returns.
Case 1 Consumer Goods distribution in India
In India, consumer goods are sold through tens of million of small retail outlets.
Most Indian distributors are one-stop shops stocking everything from cooking oil to
soaps and detergents made by a variety of manufacturers. Besides, the convenience
provided by one-stop shopping, distributors are also able to reduce transportation costs
for outbound delivery to the retailer by aggregating products across multiple
manufacturers during the delivery runs. Distributors are able to replenish retailers
with a much shorter response time than a manufacturer would be able to provide.
The presence of distributors thus improves performance of the consumer goods
supply chain in India by lowering transportation cost and improving replenishment
response time. The major services provided by them are the ability to take in shipments,
break bulk, store inventory, and provide outbound delivery to retailers.
Supply Chain Management –Resource Material
117
7.3 Forecasting in Supply Chain
The forecast of demand forms the basis for all strategic and planning decisions in a
supply chain. Throughout the supply chain, all push processes are performed in
anticipation of customer demand whereas all pull processes are performed in response
to customer demand. For push processes, a manager must plan the level of production.
For pull processes, a manager must plan the level of available capacity and inventory. In
both instances, the first step a manager must take is to forecast what customer demand
will be.
Following are the forecasting of critical factors to be considered for Different
departments in the company
Production : Scheduling, inventory control, aggregate planning, purchasing, Quality Marketing : Sales-force allocation Test market, Target market, market segmenting Finance : Plant/machinery investment, budgetary planning, Personnel : Workforce planning, hiring, layoffs. Retrenchment, Redeployment
• Mature products with stable demand are usually easiest to forecast. Eg, milk or
paper. • Forecasting is difficult during either supply of raw materials or the demand for
the finished product is highly variable. Eg: fashion goods and many high-tech products.
Good forecasting is very important in these cases because the time window for
sales is narrow and if a firm has over or under produced, it has little chance to recover.
For a product with a long life cycle, in contrast, the impact of a forecasting error is less
significant.
7.3.1 Characteristics of Forecasting
Companies and supply chain managers should be aware of the following
characteristics of forecasts:
Course -201 Market Led Extension
118
1. Forecasts are always wrong and should thus include both the expected value of the forecast and a measure of forecast error. To understand the importance of forecast error, consider two car dealers. One of them expects sales to range between 100 and 1900 whereas the other expects sales to range between 900 and 1,100. Even though both dealers anticipate average sales of 1,000 the sourcing policies for each dealer should be very different given the difference in forecast accuracy.
2. Long-term forecasts are usually less accurate than short-term forecasts; that is long-term forecasts have a larger standard deviation of error relative to the mean than short-term forecasts. For example, if a store manager places an order by 10 AM., the order is delivered by 7 PM on the same day. The manger thus has to forecast what will sell that night less than twelve hours before the actual sale. The forecast in this case is likely to be more accurate than if the store manager had to forecast demand one week in advance.
3. Aggregate forecasts are usually more accurate than disaggregate forecasts as they tend to have a smaller standard deviation of error relative to the mean. For example, it is easy to forecast the Gross Domestic Product (GDP) of the United States for a given year with less than a 2 percent error. However, it is much more difficult to forecast yearly revenue for a company with less than a 2 percent error, and it is even harder to forecast revenue for a given product with the same degree of accuracy.
The key difference between the three forecasts is the degree of aggregation. The
GDP is an aggregation across many companies and the earnings of a company are an
aggregation across several product lines. The greater the degree of aggregation, the
more accurate the forecast.
7.3.2 Forecasting Methods
Forecasting methods are classified according to the following four types
Qualitative : Qualitative forecasting methods are primarily subjective and rely on human judgement. They are most appropriate when there is little historical data available or when experts have market intelligence that is critical in making the forecast.
Supply Chain Management –Resource Material
119
Time Series: Time series forecasting methods use historical demand to make a forecast. They are based on the assumption that past demand history is a good indicator of future demand. Casual : Casual forecasting methods assume that the demand forecast is highly correlated with certain factor in the environment (e.g., the state of the economy, interest rates, etc.). For example, product pricing is strongly correlated with demand. Simulation : Simulation forecasting methods imitate the consumer choices that give rise to demand to arrive at a forecast. A company must be knowledgeable about numerous factors that are be related to the demand forecast.
• Past demand • Lead time of product • Planned advertising or marketing efforts • Economic factors • Price discounts • Competitors
7.3.3 Basic approach to demand forecasting
The following basic, six-step approach helps an organization perform effective
forecasting:
1. Understand the objective of forecasting 2. Integrate demand planning and forecasting throughout the supply chain 3. Understand and identify customer segments 4. Identify the major factors that influence the demand forecast 5. Determine the appropriate forecasting techniques 6. Establish performance and error measures for the forecast.
Understand the objective of Forecasting
The objective of every forecast is to support decisions that are based on the
forecast, so an important first step is to clearly identify these decisions. Examples of
such decisions include how much of a particular product to make, how much to
inventory, and how much to order. All parties affected by a supply chain decision
should be aware of the link between the decision and the forecast.
Course -201 Market Led Extension
120
Integrate Demand Planning and Forecasting throughout the Supply Chain
A company should link its forecast to all planning activities throughout the supply
chain. These include capacity planning, production, promotion planning, and
purchasing, among others. This link should exist at both the information system and
the human resource management level.
Understand and Identify Customer Segments
Customers may be grouped by similarities in service requirements, demand
volumes, order frequency, demand volatility, seasonality and so forth. In general,
companies may use different forecasting methods for different segments. A clear
understanding of the customer segments facilitates an accurate and simplified approach
to forecasting.
Identify the Major Factors that influence the Demand Forecast
A firm must identify major factors that influence the demand forecast. A proper
analysis of these factors is central to developing an appropriate forecasting technique.
The main factors influencing forecasts are demand, supply, and product related
phenomena. These estimates must be based on demand – not sales data.
Determine the appropriate Forecasting Techniques
In selecting an appropriate forecasting technique, a company should first
understand the dimensions that will be relevant to the forecast. These dimensions
include geographical area, product groups and customer groups A firm would be wise
to have different forecasts and techniques for each dimension.
Establish Performance and error measures for the Forecast
Companies should establish clear performance measure to evaluate the accuracy
and timeliness of the forecast. These measures should correlate with the objectives of
the business decisions based on these forecasts.
Supply Chain Management –Resource Material
121
7.4 Purchasing & Inventory Management
Purchasing is also known as procurement, is the process by which companies
acquire raw materials, components, products, services and other resources from
suppliers to execute their operations. According to Alford and Beary “Purchasing is the
procuring of materials, supplies, machine tools and services required for the equipment,
maintenance and operation of a manufacturing plant”. Sourcing is the entire set of
business processes required to purchase goods and services. Sourcing processes include
the selection of suppliers, design of supplier contracts, product design collaboration,
procurement of material, and evaluation of supplier performance.
7.4.1 Objectives of purchasing
• To procure needed material at a competitive price of the right quality, quantity and at right time.
• Regular and continuous supply • To suggest better substitute • To assist in fixing probable price and delivery • Create goodwill-dealing with supplier • To render assistance in standardization, make or buy decisions
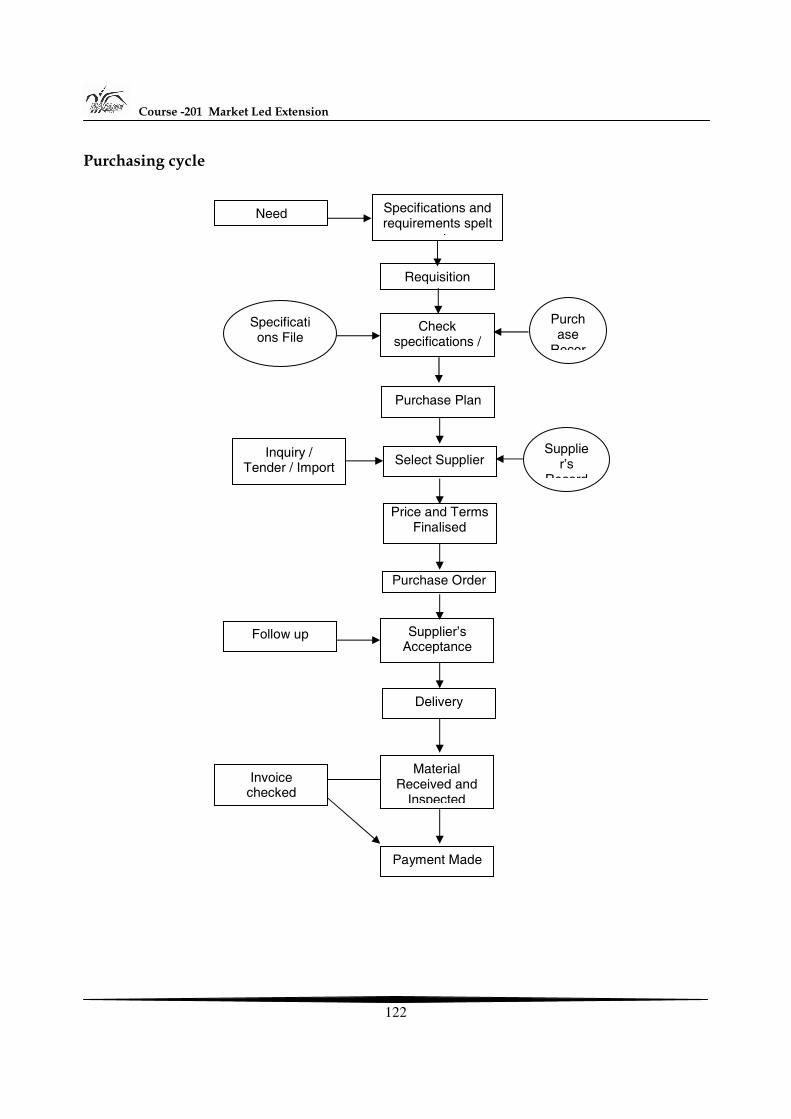
Course -201 Market Led Extension
122
Purchasing cycle
Purchase Order
Supplier’s Acceptance
Delivery
Material Received and
Inspected
Payment Made
Invoice checked
Follow up
Purchase Plan
Select Supplier
Price and Terms Finalised
Inquiry / Tender / Import
Supplier’s
Record
Need Specifications and requirements spelt
t
Requisition
Check specifications /
Specifications File
Purchase
Recor
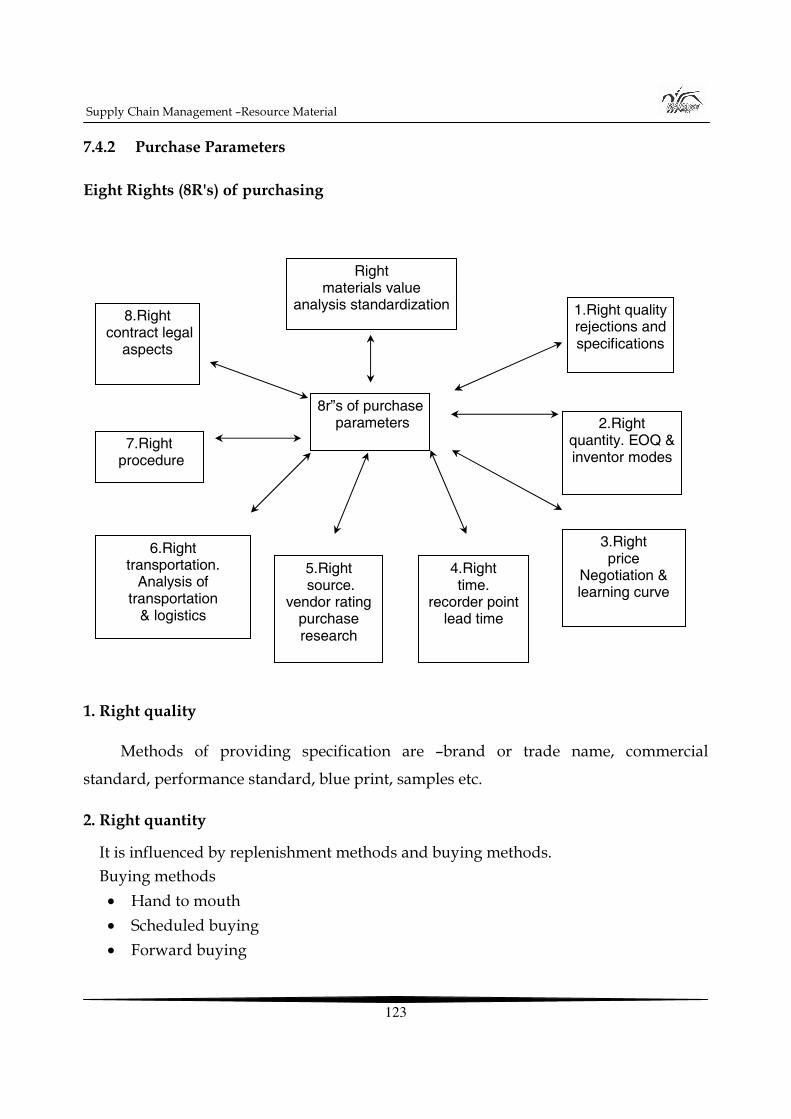
Supply Chain Management –Resource Material
123
7.4.2 Purchase Parameters
Eight Rights (8R's) of purchasing
1. Right quality
Methods of providing specification are –brand or trade name, commercial
standard, performance standard, blue print, samples etc.
2. Right quantity
It is influenced by replenishment methods and buying methods. Buying methods
• Hand to mouth • Scheduled buying • Forward buying
8r”s of purchase parameters
8.Right contract legal
aspects
7.Right procedure
6.Right transportation.
Analysis of transportation
& logistics
Right materials value
analysis standardization 1.Right quality rejections and specifications
2.Right quantity. EOQ & inventor modes
3.Right price
Negotiation & learning curve
4.Right time.
recorder point lead time
5.Right source.
vendor rating purchase research
Course -201 Market Led Extension
124
• Contract buying
3. Right price
• It minimize the overall cost • To arrive at the right price the following techniques are employed :
Negotiation is used Tender system Learning curve
4. Right time
Right time implies that time at which the goods requested should be received
while lead time refers to the time between the communication of the need for an item to
be purchased by the indentor till the item is actually received and is made available for
consumption.
5. Right source
Right source aspect involves decision as to:
• The kind of items to be purchased directly from the manufacturers • From which dealers • From which open market • Also requires the analysis of transportation costs and distance incurred
6. Right place of delivery
• Items have to be supplied directly to the consuming units, which may be located at far distance from the headquarters.
• The place of delivery should be clearly mentioned in the supply order.
7. Right procedure
• Right procedure to be adopted and developed for the pre-purchase, ordering and post purchase systems.
8. Right contract
• It is legal document that binds the selling company with the buying company.
Supply Chain Management –Resource Material
125
• Various terms and conditions about insurance, sales tax, excise, customs, breach of contract, settlement of dispute etc.
7.4.3 Types of purchasing
I) Contract purchasing
All purchases are made under contracts, usually formal of needed material,
frequently spread over a period of time. Ex: Purchasing clocks, air conditioner, and
computer.
Characteristics
• Contract for future requirement • Cycle time may be a week, fortnight, or a month • The buying department usually takes sufficient time to secure competitive bids
and negotiation on other term of contract
Kardex system
This system is widely used by the purchase officers and following information can
be obtained from it.
What should be purchased? From whom purchase should be made? At what rate? When the material to be delivered? Has it been delivered? Whether payment has been made?
For each item of purchase, a separate card is maintained to keep record of a
purchase order till receipt of material. When requisitioner sends an indent it is entered
in the card along with the details of enquiry and quotations and last date of receipt, etc.
When the order is placed, then details of the purchase order are recorded in
another card, such as:
a. Order Number
Course -201 Market Led Extension
126
b. Date c. Quantity d. Rate accepted e. Delivery period f. The name of the supplier
This above information is very useful, if a repeat order is required to be placed.
II) Blanket orders
It refers to the purchase of variety of items from a single source, usually a middle
man. Ex ; Hard ware, electrical supplies, stationery, small cutting tools etc.
III) Tender purchasing
Types of tender
a. Single tender b. Closed tender c. Open tender d. Global tender
IV) Seasonal purchasing
Buying of the annual requirements of an item during its season
Ex : Fruits like orange, apple, and mango
V) Sub-contracting
It is the work placed with outside supplier to manufacturer a particular item as per
the specification of the main contractor for economic reasons or to augment the existing
manufacturing facilities. Sub contracting will play major role during
Big order time Company concentrates on certain items and buys the rest from out side Get certain operations like electro plating, heat treatment, rough blanking etc.
Supply Chain Management –Resource Material
127
VI) Group purchasing
This refers to buying of items of trial value in a single purchase order
• Minimum & maximum levels are fixed for each item • Stocks will be reviewed periodically • Items are classified into few basic groups and these groups are dependent on the
source of purchase.
VII) Purchasing by Requirements
Purchases are made whenever a need arises and that too only the quantity
required is purchased. This method is suitable for made to order jobs goods used
infrequently, etc.
VIII) E-Purchasing
The Internet is a valuable tool for marketing and selling to customers across town
or around the world. It also provides an abundance of buying and cost saving
opportunities.
According to a recent survey of professional purchasers by Purchasing Online
magazine, the web offers a wide range of significant purchasing benefits.
Auction Hubs
Different types of auctions are
• Commodity auctions (oil, natural gas, electricity), • Independent auctions (first-run and surplus manufacturing goods), and • Private auctions (geared toward re-sellers and dealers, rather than end users).
Examples E-Bay at www.ebay.com, www.freemarkets.com
Advantages
• Achieve a dramatically higher level of procurement efficiency and cost savings • Shift employees' focus from paperwork to productivity
Course -201 Market Led Extension
128
• Realize your goal of a completely paperless purchasing environment • Use information more efficiently by integrating enhanced transaction data with
our existing system • Mitigate risk by setting detailed purchasing parameters for individual buyers • Maximize vendor contracts and gain from economies of scale • Achieve faster cycle times throughout the organization
7.4.4 Inventory Management
A lot or batch size is the quantity that a stage of the supply chain either produces
or purchases at a given time. Consider, for example, a computer store that sells an
average of for printers a day. The store manager, however, orders 80 printers from the
manufacturer each time he places an order. The lot or batch size in this case is 80
printers. Given daily sales of four printers, it takes an average of twenty days before the
store sells the entire lot and purchases a replenishment lot. The computer store holds an
inventory of printers because the manager purchased a lot size larger than the store’s
daily sales. Cycle inventory is the average inventory in the supply chain due to either
production or purchases in lot size that are larger than those demanded by the
customer.
Cycle inventory is primarily held to take advantage of economies of scale and
reduce cost within the supply chain. Increasing the lot size or cycle inventory often
decreases the cost incurred by different stages of a supply chain. To understand how
the supply chain achieves these economies of scale, we must first identify supply chain
costs that are influenced by the lot size.
Supplier scoring and assessment
When comparing suppliers, many firms make the fundamental mistake of focusing
only on the quoted price, ignoring the fact that suppliers may differ on other important
dimensions that impact the total cost of using a supplier. The following factors other
than quoted price considered are:
• Replenishment lead time • On-time performance
Supply Chain Management –Resource Material
129
• Supply flexibility • Delivery frequency / minimum lot size • Supply quality • Inbound transportation cost • Pricing terms • Design collaboration capability • Exchange rates, taxes and duties • Supplier viability
Supplier selection and contracts Supplier selection should be based on total cost of using a supplier and not just the
purchase price. Before selecting suppliers, a firm must decide whether it will use single sourcing or will have multiple suppliers from which to source the product.
Single sourcing is used to guarantee the supplier sufficient business when the
supplier has to make a significant buyer-specific investment. The buyer-specific
investment can take the form of plant and equipment designed to produce a part that is
specific to the buyer or could take the form of expertise that needs to be developed.
Single sourcing is also used in the automotive industry for parts such as seats that must
arrive in the sequence of production. Coordinating such sequencing would be
impossible with multiple sources.
7.4.5 Contracts for Product Availability and Supply Chain Profits
Many shortcomings in supply chain performance occur because the buyer and
supplier are two different entities, each trying to optimize their own profits. Actions
taken by the two parties in the supply chain thus result in profits that are lower than
what could be achieved if the supply chain were to coordinate its actions with a
common objective of maximizing supply chain profits.
Three contracts that increase overall profits by making the supplier share some of
the buyer’s demand uncertainty are as follows:
1. Buyback or return contracts 2. Revenue-sharing contracts 3. Quantity flexibility contracts
Course -201 Market Led Extension
130
Buyback Contracts
A buyback or return clause in a contract allows a retailer to return unsold
inventory up to a specified amount, at an agreed upon price. For example, the supplier
to the music store may agree to buy back discs that have not sold at $3 per disc. This
lowers the loss to the retailer for each unsold disc form $5 to $2. The supplier absorbs
the $3 per unsold disc as a reduction in margin. The presence of the buyback clause
makes it optimal for the retailer to order more discs, resulting in higher product
availability and higher profit for both the retailer and the supplier. Buyback contracts
are most effective for products with a low variable cost.
Examples: music, software, books, magazine and newspapers.
Revenue Sharing Contracts
In a revenue sharing contract, the buyer pays a minimal amount for each unit purchased from the supplier but shares a fraction of the revenue for each unit sold. For example, the supplier agrees to sell each disc to the music store at $1 but the music store agrees to share 50 percent of the revenue form each disc sold.
One advantage of revenue sharing contracts over buyback contracts is that no product needs to be returned, thus eliminating the cost of returns. Revenue-sharing contracts are best suited for products with low variable cost and a high cost of return.
Example: Block buster video rentals and movie studios.
Quantity Flexibility Contracts
A quantity flexibility clause allows the buyer to modify the order (within limits agreed to by the supplier) as demand visibility increases closer to the point of sale. For example, the music store would place an initial order for, say, 1,000 discs. Closer to the release date, as the store got a better idea of actual demand; they would be allowed to modify their order to any number between 950 and 1,050. In this contract, the retailer modifies his order as he gains better market intelligence over time. The supplier in turn only sends the modified order quantity. The amount ordered by the retailer will be more in line with actual demand resulting in higher profits for the supply chain.
Purchasing is a function of procuring goods and services from sources external to
the organization. According to Alford and Beary “Purchasing is the procuring of
Supply Chain Management –Resource Material
131
materials, supplies, machine tools and services required for the equipment, maintenance
and operation of a manufacturing plant”.
7.5 Warehouse Management 7.5.1 Storage
Storage is an important marketing function, involves holding & preserving goods from the time they are produced until they are needed for consumption. therefore, storage add the time utility to products.
Traditional storage methods
• Kothi or Mud pots – Unburnt clay mixture with straw and cowdung • Kuthla – Mud brick, straw and cowdung • Thekka – Rectangular made up of gunny or cotton wound around wooden
support • Metal drums – Iron sheets • Gunny bags
7.5.2 Warehouse
A warehouse is a commercial building or premises designed and built for the
purpose of bulk storage of raw materials or finished or partly finished goods which can
be used in future. First commercial warehouse was started in Venice, USA in 1928. In
India, first warehouse was setup in the year 1956 at Bihar
Warehousing Infrastructure Empowering the Agriculture Sector
Warehouses must be designed to accommodate the loads of the materials to be
stored, the associated handling equipment, the receiving and shipping operations and
associated trucking, and the needs of the operating personnel.
India is witnessing a spurt in warehousing infrastructure with the archaic supply
chain management facilities going for a makeover and capacity addition. There is an
element of dynamism and the online commodity futures market is hastening the
change.
Course -201 Market Led Extension
132
Need of Warehousing Infrastructure
• Storage of food grains, fresh vegetables and fruits, meat, seafood and other food stuffs from the farmers to the retailers.
• Moving forward to the macro level, better storage will provide more food security by meting the unseasonal demand, avoiding the import of food grains and other items.
• To preserve, to store and to protect the commodities • Avoid pests and dusts • By producing Warehouse receipts loans can be taken
7.5.3 Types of Warehousing
Different types of agricultural commodities need different storage facilities. While
some need to maintain an optimum temperature and moisture, others may need to be
kept free from insect and pest attacks and so on.
The types of warehousing are as follows (Archarya and Agarwal, 2001)
Based on ownership
• Private : Owned by private parties • Public: Owned by the government, eg. CWC and SWC • Bonded: Licensed by the government and is constructed nearby
airports/seaports. It accepts imported goods till the payment/custom clearance is done by the importer
Based on the type of commodities stored
• General : It is an ordinary warehouse to store general items, e.g. food grains • Special commodities warehousing : It is made to store specific commodities, e.g.,
Tobacco, Cotton, Wool, etc. • Refrigerators: It stores perishable commodities, where the temperature is
maintained between 30-50 degrees or even less. • Cold Storage
Supply Chain Management –Resource Material
133
“Cold storage warehouse” shall mean any place artificially cooled to or below a
temperature above zero of 45 degrees Fahrenheit in which articles of food are placed
and held for thirty days or more
• First cold storage warehouse established in New York in 1865 for fish • In India cold storage order was passed in 1964. In India the first cold storage was
established in 1892 at Calcutta
Criteria for Good Warehousing
Following are the different criteria for good warehousing:
• Maximum utilization of space • Freeze and chilled environment (Preferably) • Sophisticated handling equipment • Light-colored roofs and energy-efficient operational equipments • Wide distribution network and access to nearby roads, ports and railways. • Safety measures for hazardous material.
7.5.4 Agencies Involved
In India, the Central Warehousing Corporations (CWC), State Warehousing
Corporations (SWC) and Food Corporation of India (FCI) are involved in storing the
major agri-commodities (Table 1). The private parties like ITC, Cash and Carry are
coming up in this sector. The government is also encouraging the private parties to
participate in this process.
7.6 Transportation
Transportation refers to the movement of product from one location to another as
it makes its way from the beginning of a supply chain to the customer’s hands.
Transportation plays a key role in every supply chain because products are rarely
produced and consumed in the same location.
With the growth in e-commerce and the associated home delivery of products,
transportation costs have become even more significant in retailing
Course -201 Market Led Extension
134
7.6.1 Factors affecting transportation decisions
There are two key players in any transportation that takes place within a supply
chain.
• The shipper is the party that requires the movement of the product between two points in the supply chain.
• The carrier is the party that moves or transports the product.
For example, when Maruti car(MUL) uses ABT parcel service to ship its cars from
the factory to the customer, Maruti car (MUL) is the shipper and ABT parcel service is
the carrier.
Factors affecting carrier decisions
1. Vehicle related cost 2. Fixed operating cost 3. Trip-related cost 4. Quantity-related cost 5. Overhead cost
Factors affecting shippers’ decisions
1. Transportation cost 2. Inventory cost 3. Facility cost 4. Processing cost 5. Service level cost
7.6.2 Modes of transportation and their performance characteristics
Supply chains use a combination of the following modes of transportation :
o Air o Package carriers o Truck o Rail o Water o Pipeline o Intermodal
Supply Chain Management –Resource Material
135
Design options for a transportation network
Direct Shipping Network
With this option, the retail chain structures, its transportation network to have all
shipments come directly from suppliers to retails stores. With a direct shipment
network, the routing of each shipment is specified and the supply chain manager only
needs to decide on the quantity to ship and the mode of transportation to use.
The major advantage of a direct shipment transportation network is the
elimination of intermediate warehouses and its simplicity of operation and
coordination.
Direct Shipping with Milk Runs
A milk run is a route in which a truck either delivers product from a single
supplier to multiple retailers or goes from multiple suppliers to a single retailers.
Direct shipping provides the benefit of eliminating intermediate warehouses,
whereas milk runs lower transportation cost by consolidating shipments to multiple
stores on a single truck.
For example, Toyota uses milk runs form suppliers to support its just in time
manufacturing system in both Japan and the United States. In Japan, Toyota has many
assembly plants located close together and thus uses milk runs from a single supplier to
many plants. In the United States, however, Toyota uses milk runs from many suppliers
to its assembly plants.
7.6.3 Bullwhip effect
Supply chain coordination improves if all stages of the chain take actions that
together increase total supply chain profits. Supply chain coordination requires each
stage of the supply chain to take into account the impact its actions have on other stages.
A lack of coordination occurs either because different stages of the supply chain
have objectives that conflict or because information moving between stages gets delayed
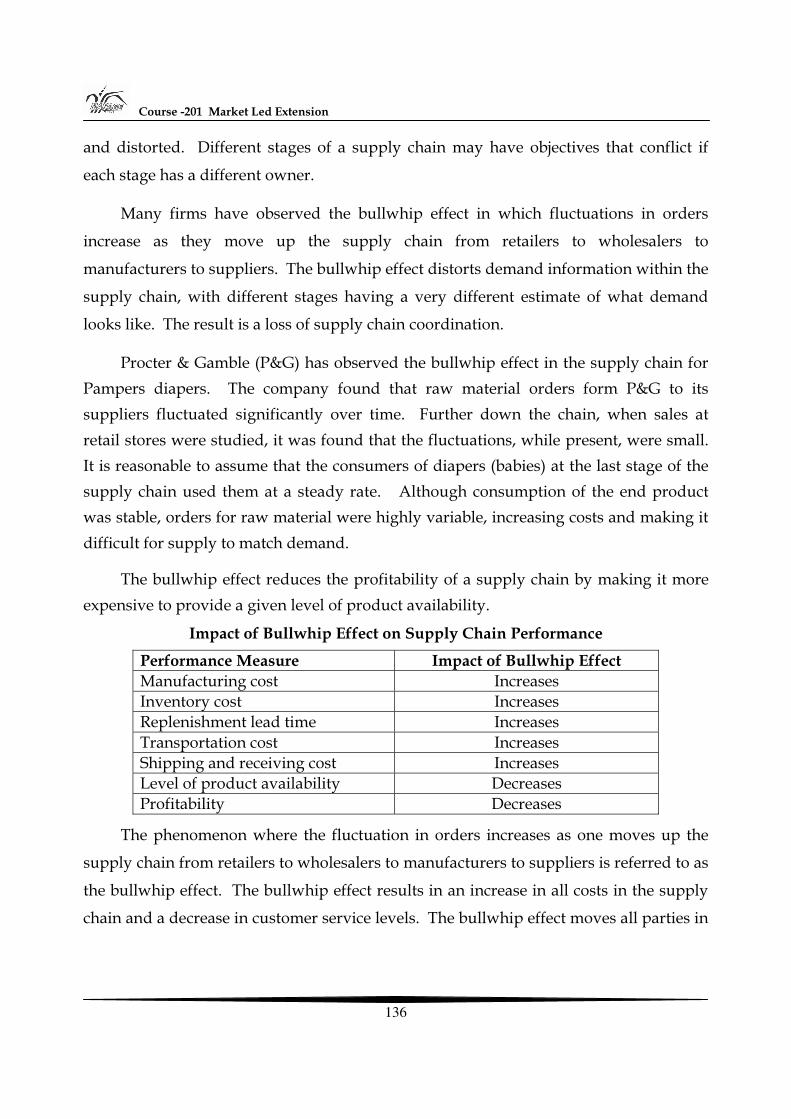
Course -201 Market Led Extension
136
and distorted. Different stages of a supply chain may have objectives that conflict if
each stage has a different owner.
Many firms have observed the bullwhip effect in which fluctuations in orders
increase as they move up the supply chain from retailers to wholesalers to
manufacturers to suppliers. The bullwhip effect distorts demand information within the
supply chain, with different stages having a very different estimate of what demand
looks like. The result is a loss of supply chain coordination.
Procter & Gamble (P&G) has observed the bullwhip effect in the supply chain for Pampers diapers. The company found that raw material orders form P&G to its suppliers fluctuated significantly over time. Further down the chain, when sales at retail stores were studied, it was found that the fluctuations, while present, were small. It is reasonable to assume that the consumers of diapers (babies) at the last stage of the supply chain used them at a steady rate. Although consumption of the end product was stable, orders for raw material were highly variable, increasing costs and making it difficult for supply to match demand.
The bullwhip effect reduces the profitability of a supply chain by making it more expensive to provide a given level of product availability.
Impact of Bullwhip Effect on Supply Chain Performance
Performance Measure Impact of Bullwhip Effect Manufacturing cost Increases Inventory cost Increases Replenishment lead time Increases Transportation cost Increases Shipping and receiving cost Increases Level of product availability Decreases Profitability Decreases
The phenomenon where the fluctuation in orders increases as one moves up the
supply chain from retailers to wholesalers to manufacturers to suppliers is referred to as
the bullwhip effect. The bullwhip effect results in an increase in all costs in the supply
chain and a decrease in customer service levels. The bullwhip effect moves all parties in
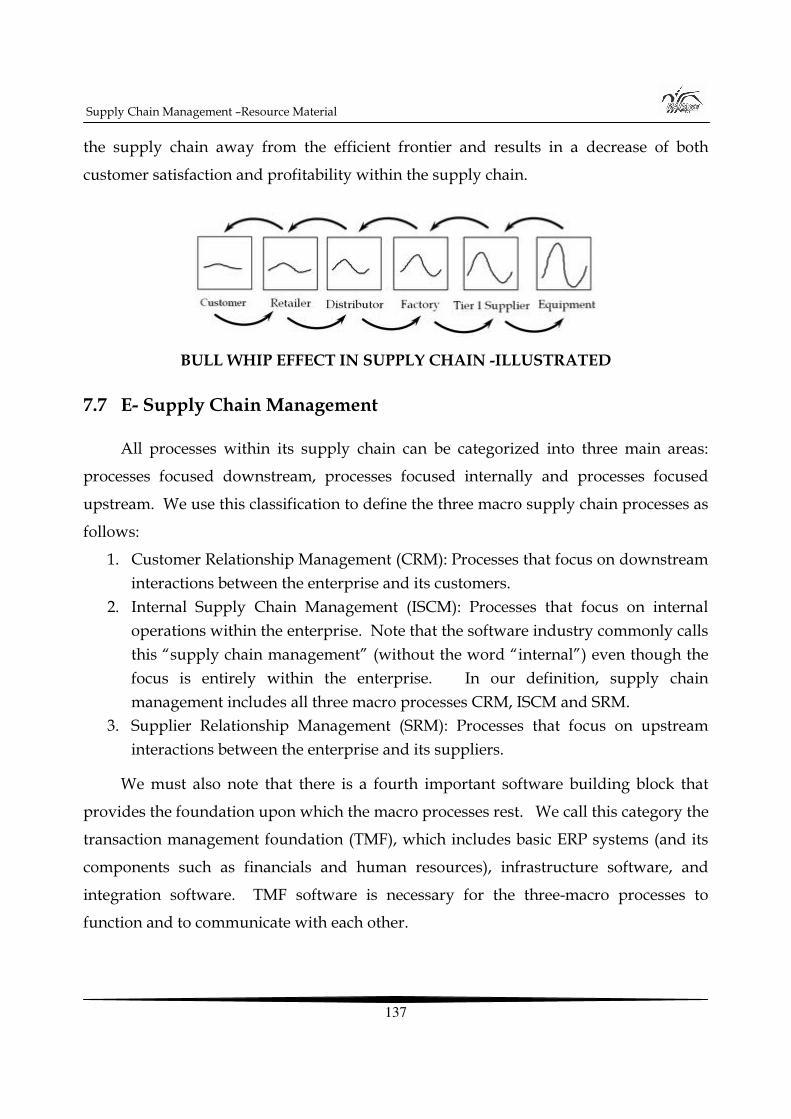
Supply Chain Management –Resource Material
137
the supply chain away from the efficient frontier and results in a decrease of both
customer satisfaction and profitability within the supply chain.
BULL WHIP EFFECT IN SUPPLY CHAIN -ILLUSTRATED
7.7 E- Supply Chain Management
All processes within its supply chain can be categorized into three main areas:
processes focused downstream, processes focused internally and processes focused
upstream. We use this classification to define the three macro supply chain processes as
follows:
1. Customer Relationship Management (CRM): Processes that focus on downstream interactions between the enterprise and its customers.
2. Internal Supply Chain Management (ISCM): Processes that focus on internal operations within the enterprise. Note that the software industry commonly calls this “supply chain management” (without the word “internal”) even though the focus is entirely within the enterprise. In our definition, supply chain management includes all three macro processes CRM, ISCM and SRM.
3. Supplier Relationship Management (SRM): Processes that focus on upstream interactions between the enterprise and its suppliers.
We must also note that there is a fourth important software building block that
provides the foundation upon which the macro processes rest. We call this category the
transaction management foundation (TMF), which includes basic ERP systems (and its
components such as financials and human resources), infrastructure software, and
integration software. TMF software is necessary for the three-macro processes to
function and to communicate with each other.
Course -201 Market Led Extension
138
7.7.1 Customer Relationship Management
The CRM macro process consists of processes that take place between an enterprise
and its customers downstream in the supply chain. The goal of the CRM macro process
is to generate customer demand and facilitate transmission and tracking of orders.
Marketing: Marketing processes involve decisions regarding
• Which customers to target, • How to target customers, • What products to offer, • How to price products, and • How to manage the actual campaigns targeting customers.
Successful software vendors in the marketing area within CRM provide analytics
that improve the marketing decisions on pricing, product profitability and customer
profitability, among other functions.
Sell: The sell process focuses on making an actual sale to a customer (compared to
marketing where processes are more focused on planning who to sell to and what to
sell).
The sell process includes providing the sales force the information they need to
make a sale and then executing the actual sale. Executing the sale may require the sales
person (or the customer) to build and configure orders by choosing among a variety of
options and features.
Order Management : The process of managing customer orders as they flow through an
enterprise is important for the customer to track his order and for the enterprise to plan
and execute order fulfillment.
Call / Service center : A call / service center is often the primary point of contact
between a company and its customers. A call / service center helps customers place
orders, suggests products, solves problems, and provides information on order status.
Supply Chain Management –Resource Material
139
CRM software has been the fastest growing, and is now the largest, category of the
three macro processes. Software providers in the CRM space have focused on
improving CRM processes themselves, but have more work to do to improve
integration between CRM and internal operational processes.
ERP players, such as SAP, Oracle and Peoplesoft, who provide a powerful
integration story and strong ecosystems.
7.8 Agri supply Chain Management
India stands second in Fruit production after Brazil and also second in vegetables
production after China. With increase in per capita income and changing food habits the
demand for fruits and vegetables will increase in the future. Tamil Nadu with its varied
agro climatic regions produces different kinds of fruits and vegetables in large
quantities. Around 4.6 million tonnes of fruits and 4.8 million tonnes of vegetables are
produced in Tamil Nadu.
Post harvest losses and volatile prices
The post harvest loss in fruits and vegetables is estimated to be around 35-40 per cent of the production. Infrastructure facilities for post harvest handling like pre-cooling, refrigerated transport, grading, packing, cold storage etc. are not adequate and results in considerable post harvest losses in horticultural produces. Tamil Nadu Horticulture Development Mission set up in 2003 aims at providing adequate infrastructure for post-harvest management and marketing. Due to inadequate linkages with markets and lack of processing facilities, farmers do not get good price for fruits and vegetables. Presence of large number of intermediaries and absence of linkages lead to loss of value both for farmers and consumers. The farmer’s share in consumer rupee varies from 40-60 per cent in the case of vegetables. Further the degree of perishability, variety and quality, and various market imperfections, market infrastructure etc also influence the marketing costs and price levels of fruits and vegetables. This indicates the need for effective and efficient supply chain management arrangement. Price volatility is a major cause for concern for the farmers. Cold storage facilities were created as a means to overcome some of these problems encountered by the farmers.
Course -201 Market Led Extension
140
Traceability in Food and Agribusiness
The term 'traceability’ has become so widely used in recent times in various
industries that it is timely to examine the concept, particularly in relation to agriculture
and food. Agricultural traceability simply refers to the collection, documentation,
maintenance, and application of information related to all processes in the supply chain
in a manner that provides guarantee to the consumer and other stakeholders on the
origin, location and life history of a product as well as assisting in crises management in
the event of a safety and quality breach.
With respect to a food product, traceability represents the ability to identify the
farm where it was grown and sources of input materials, as well as the ability to conduct
full backward and forward tracking to determine the specific location and life history in
the supply chain by means of records. It contributes to the demonstration of the
transparency of the supply chain through the use of verifiable records and labeling.
Traceability adds value to the overall quality management system by providing the
communication linkage for identifying, verifying and isolating sources of non-
compliance to agreed standards and customer expectations.
Issues in supply chain management
The first issue in supply chain management is the relationship between members
of the chain. This issue is informed by a substantial business and management literature
on strategic alliances, but by relatively little literature on the process in relation to
agriculture and agribusiness. Relationship issues to be considered include:
• Sharing long term development goals and seasonal business planning, • the relationships between operational staff within the businesses on issues such
as timing , amount, ripeness and temperature of deliveries, • the development of shared quality and safety standards and how they will be
measured and monitored; • the information systems to track product and standards. The relationship may
include shared access to inventory control systems and to sales performance data.
Supply Chain Management –Resource Material
141
At the farmer level a key preliminary step is often the development of
relationships between individual farmers to create a trading entity with capacity to
supply sufficient quantity and continuity to be a credible supply chain member. This
may be championed by a farmer, by another member of the chain, or by an external
facilitator or manager. Hence the technical and professional issues in supporting the
operation of supply chains may include facilitating:
• the development of relationships between farmers to allow their participation • the development of relationships between members of the supply chain • information flows between members of the supply chain • establishing common standards between members of the supply chain • optimising performance within each level of the supply chain and in the linkage
processes.
Promotion activities needed in Agri-Chain Development
• Public private partnership in needed. • Investing in transportation, communication and electricity. • Subsidies or co-financing supply for high -risk investments. • Ensure the availability of (production, price, industry) information and statistics
to facilitate market activity and to monitor market progress.
7.9 Case Studies
Case study I Supply Chain Management in Walmart
Wal-Mart emphasizes greater coordination with suppliers and one of its turn-key
supply chain management practices, new to the world of fresh produce, is automatic
inventory replenishment. The performance of suppliers is graded and to be retained
they must meet numerous standards, including a very low stock-out rate.
Suppliers provide services specific to Wal Mart, such as packing in returnable
plastic containers (RPCs) and category management, utilizing the electronically
exchanged sales data shared by Wal-Mart. This vertically streamlined system better
coordinates supply and demand and enables both parties to lower costs. Wal-Mart can
offer lower prices to consumers, often without reducing prices paid to shippers.
Course -201 Market Led Extension
142
Many shippers report that Wal-Mart is one of their most profitable accounts and
that one of the most important things about becoming a Wal-Mart supplier is the lessons
learned on driving out non-value-adding costs, which they can then leverage to other
key accounts. In the US retail industry, Wal-Mart’s willingness to share information
with its suppliers is clearly recognized as distinct from the traditional relationship with
suppliers employed by the majority of conventional retail chains.
Most conventional retailers have not adopted automatic inventory replenishment,
in part due to their lack of investment in the type of technology systems Wal-Mart
developed years ago for real-time electronic information exchange.
As conventional and upscale specialty retailers differentiate themselves from value
retailers, identifying high quality and exotic fresh produce offerings as their competitive
edge, growers and shippers seeking to add value, including by selling unique, ethnic,
organic, or other specialty produce, may find them to be willing partners.
Case 2, Supply Chain Management in McDonalds in India
All suppliers adhere to Indian government regulations on food, health and hygiene
while continuously maintaining McDonald's recognised standards. As the ingredients
move from farms to processing plants to the restaurant, McDonald's Quality Inspection
Programme (QIP) carries out quality checks at over 20 different points in the Cold Chain
system. Setting up of the Cold Chain has also enabled us to cut down on operational
wastage.
Hazard Analysis Critical Control Point (HACCP) is a systematic approach to food
safety that emphasizes prevention within our suppliers' facility and restaurants rather
than detection through inspection of illness or presence of microbiological data. Based
on HACCP guidelines, control points and critical control points for all McDonald's
major food processing plants and restaurants in India have been identified. The limits
have been established for those followed by monitoring, recording and correcting any
deviations. The HACCP verification is done at least twice in a year and certified.
Supply Chain Management –Resource Material
143
The relationship between McDonald's and its Indian suppliers is mutually
beneficial. As McDonald's expands in India, the supplier gets the opportunity to expand
his business, have access to the latest in food technology, exposure to advanced
agricultural practices and the ability to grow or to export. There are many cases of local
suppliers operating out of small towns who have benefited from their association with
McDonald's India.
Trikaya Agriculture -Supplier of Iceberg Lettuce
Implementation of Good agricultural practices has enabled Trikaya to successfully
grow specialty crops like iceberg lettuce, special herbs and many oriental vegetables.
Vegetables are kept in pre-cooling room and transported by refrigerated truck Vista
Processed Foods Pvt. Ltd. Supplier of Chicken and Vegetable range of products
(including Fruit Pies)
A joint venture with OSI Industries Inc., USA, McDonald's India Pvt. Ltd. and
Vista Processed Foods Pvt. Ltd., produces a range of frozen chicken and vegetable
foods. A world class infrastructure at their plant at Taloja, Maharashtra, has separate
processing lines for chicken and vegetable foods, and they are following International
standards, procedures and support services for their customers.
Radhakrishna Foodland
Distribution Centres for Delhi and Mumbai
An integral part of the Radhakrishna Group, Foodland specialises in handling
large volumes, providing the entire range of services including procurement, quality
inspection, storage, inventory management, deliveries, data collection, recording and
reporting. Salient strengths are: Annexure I
• A one-stop shop for all distribution management services. • Dry and cold storage facility to store and transport perishable products at
temperatures up to -22 Degree Cel
Course -201 Market Led Extension
144
7.10 Let Us sum Up
Supply chain management (SCM) represents the management of the entire set of production, manufacturing/transformations, distribution and marketing activities by which a consumer is supplied with a desired product. There are two different ways to view the processes performed in a supply chain. Cycle view: The processes in a supply chain are divided into a series of cycles, each performed at the interface between two successive stages of a supply chain. Push/pull view.
The processes in a supply chain are divided into two categories depending on whether they are executed in response to a customer order or in anticipation of customer orders. Pull processes are initiated by a customer order whereas push processes are initiated and performed in anticipation of customer orders. Four key drivers of supply chain performance are facilities, inventory, transportation and information. The forecast of demand forms the basis for all strategic and planning decisions in a supply chain. Throughout the supply chain, all push processes are performed in anticipation of customer demand whereas all pull processes are performed in response to customer demand.
Purchasing is also known as procurement, is the process by which companies acquire raw materials, components, products, services and other resources from suppliers to execute their operations. Sourcing processes include the selection of suppliers, design of supplier contracts, product design collaboration, procurement of material, and evaluation of supplier performance. Three contracts that increase overall profits by making the supplier share some of the buyer’s demand uncertainty are as follows Buyback or return contracts, Revenue-sharing contracts, Quantity flexibility contracts
A warehouse is a commercial building or premises designed and built for the purpose of bulk storage of raw materials or finished or partly finished goods, which can be used in future. The bullwhip effect distorts demand information within the supply chain, with different stages having a very different estimate of what demand looks like. The result is a loss of supply chain coordination. Transportation refers to the movement of product from one location to another as it makes its way from the beginning of a supply chain to the customer’s hands.
Market Development for Organic Products
145
Unit - 8
Market Development for Organic Products
Structure
8.0 Objectives
8.1 Introduction
8.2 Indian scenario
8.3. Conversion period
8.4 Brief Overview of key Organic Products
8.5 Challenges and Considerations in setting up Organic Bazaars
8.6 Marketing Organic Products
8.7 Major issues in Organic Product Marketing
8.8 Supply chain systems
8.9 Success factors for marketing Organic Food
8.10 Market communications for Organic Products
8.11 Let us sum up
8.0 Objectives
After going through this unit, you will be able to:
• Understand the major issues in organic production, challenges, considerations in setting up organic bazaars and mechanism of marketing organic products
• Understand the supply chain mechanism of organic products
Course -201 Market Led Extension
146
8.1 Introduction
Organic production in India has been growing steadily in the last few years. In
India, there has been a remarkable growth in organic farming and 332 new organic
certifications were issued during 2004. The Research Institute of Organic Agriculture
reports a total 12,000 organic farms operating in the country in 2003. The Agricultural
and Processed Food Products Export Development Authority (APEDA) estimated
200.000 hectares of certified organic land, mainly cultivated by smallholder producers.
Recently, an increasing number of companies, NGOs, farmer organizations, and
Government agencies have been promoting organic agriculture in India. The growth in
organic production has been driven mainly by the increasing international demand, but
the domestic market is also strengthening due to a large population and increasing
wealth (IFAD).
8.2 Indian scenario
In India, the total organic production is about 14,000 tons but domestic sales
account for only 1050 tons (7.5%). However, the domestic market is still growing
through a number of recently launched marketing initiatives and sales are therefore
likely to increase to around 1500 tons by 2006-07.
According to the Indian Competence Centre for Organic Agriculture, the global
market for organically produced foods is $26 billion and is estimated to increase to $102
billion by 2020.
8.3 Conversion Period
In the terminology of organic agriculture, 'conversion' has a very specific meaning.
In order to grasp it one has to keep in mind that organic agriculture, in the modern
sense of the term, is a highly regulated form of ecological agriculture as it adheres to
legally defined standards and norms of production, processing and labelling. The
legalities of organic agriculture are codified in a number of formal standards that define
the regimes that producers (or processors) need to work within in order to claim organic
Market Development for Organic Products
147
status. These organic standards, besides stipulating the prohibition of use of certain
inputs (such as, synthetic fertilizers and pesticides), also demands strict adherence to a
range of practices by the farm to maintain its sustainable productive capacity. In order
to enter the lucrative markets for organic produce, it is not only necessary for farms to
abide by these stipulated norms and regulations but they also require a certification
from an internationally recognized authority on the authenticity of their produce, before
it can be labelled 'organic'.
Globally there are more than 100 different organic standards and certification
systems in place. However, all of them require that a farm undergoing a switchover
from conventional to organic management should go through a transition period,
generally called the 'conversion period'. This is basically an interim phase when all the
requirements of organic standards are to be followed before the resulting product may
be considered as organic. Thus, the conversion period is the time span between the start
of the organic management and the certification of crops or animal husbandry as
organic.
The process of conversion may be hindered due to other transaction costs as well.
Some of them are:
1. Lack of access to relevant knowledge and information 2. Dearth of training facilities and the non-existence of an adequate extension
system 3. Enormous amount of mandatory documentation involved in the process of
inspection and certification, which is too cumbersome to maintain for those small farmers, who are illiterate
4. Difficulties in obtaining reliable information on domestic and international market (say, on suppliers, prices and qualities); more so because the marketing and information services available in the country all relate to conventional products only
5. Lack of demand in the domestic markets 6. Constraints on access to international markets 7. Institutional barriers, such as, scarcity of professional institutions capable of
assisting the farmers throughout production, post-production and marketing processes
Course -201 Market Led Extension
148
8. Inadequate availability of different organic inputs, such as organic seeds, bio-fertilizers, bio pesticides etc.
8.4 Brief overview of key Organic Products
Certified organic produce from India includes tea, rice, bananas, cotton, wheat,
spices (mainly pepper and ginger), coffee, nuts, pulses, and herbal products. Most of
these products are sold in semi-processed or raw forms (IFOAM & FiBL, 2006). Most
organic farms produce are for the international markets, but there is an emerging small
domestic market.
8.5 Challenges and considerations in setting up Organic Bazaars
(Source: IIRD, India)
Initially IIRD’s work relating to local marketing was confined to the development
of market outlet for women organic farmer. Overtime, IIRD has been able to address
larger issues concerning local marketing through organizing organic bazaars. While
operating the system of organic bazaars, the following are the major objectives and
challenges of the organization:
• The marginal and small farmers should gain self-confidence for making their small units viable using organic inputs and practices. This requires intensive education, training and motivational activities. Training of women farmers and enabling them to be resource persons is the strategy adopted by the IIRD for helping farmers to adopt organic agriculture and achieve viability.
• The initial marketing efforts consisting of market outlets and direct distribution systems for organic marketing lacked effectiveness in the local context. The bazaar system was later found not only to be successful, but also consistent with the local culture.
• Expansion of local domestic marketing of organic produce depends upon the availability of infrastructure such as warehouses and storage facilities, market yards and other facilities provided by the State Government. Lobbying for such facilities by voluntary organisations and farmer groups is significant to gaining access to such facilities.
Market Development for Organic Products
149
• Trade liberalisation has also opened up vast opportunities in the export sector through small rural development schemes and their linkages to distant markets. Export marketing involves very high level of documentation on the side of farmers for inspection and certification purposes. This presents a significant challenge for the organisers of farmers. Export-led agricultural production also creates distortions in the village economy because of the volatility of global prices, the emphasis on cash crops and the loss of organic products to foreign markets.
An organization, which promotes the organic bazaar:
• Ensures the flow of products through a supply chain which respects acceptable standards and accountable.
• Organises environmentally conscious consumers by creating awareness about local marketing and facilitates their meeting with producers from whom they could buy products and services or purchases eco-friendly products.
• Develops a supply chain and helps farmers sell to consumers in a public place. • Undertakes the regulation of prices of products in such a manner that it is fair for
the producer and consumer. • Conducts consumer education and publicity programmes with the co-operation
of media managers of the locality. • Receives service charges for the services rendered by it from the producers and
consumers or makes profit in the sale of products and services in order to maintain its operations in a sustainable manner.
8.6 Marketing Organic Products
The mechanism of organic marketing is quite different from that of regular
marketing of produce of conventional farming because of -
• Organic markets are still a niche segment in which specific buyers are targeted • Careful selection and development of target markets and distribution channels is
of utmost importance in case of organic products. Such marketing requires different skills than regular marketing and may call for additional costs in the initial stages
• Reliable market information, which is very often difficult to obtain, may turn out to be another obstacle to marketing of organic produce.
Course -201 Market Led Extension
150
• A farm undergoing conversion cannot even take advantage of the premium prices available for organic products because during this official transition period products cannot be sold as 'Organic'. As a result, they cannot expect to cover for the initial financial expenses of conversion.
• Even though sometimes these products are allowed by the certifying authority to be labelled and sold as 'Organic in Conversion' products, they can at best fetch prices slightly higher than those received by products of chemical farming. Such prices can hardly compensate for the financial burden of conversion. Moreover, even if such labelling and sale is allowed, significant market development costs may be associated with marketing of such produce.
8.7 Major issues in Organic Product Marketing
• When organic farmers and traders are operating in an anonymous market, certification is developed to show and guarantee to consumers that a product has been produced in consistency with organic standards.
• While certification has provided Indian-produced organic products with inroads into foreign markets, domestic bound produce is largely uncertified, owing to the fact that most producers are either small or marginal farmers, small cooperatives or fair trade companies.
• Under current Government policy, it takes approximately three years for a farm in conversion to be certified as organic, and costs are hefty for the small farmer.
8.8 Let Us Sum Up
Marketing organic products is an educational process and it takes many years to
educate people. Marketing efforts are related to both the social and ecological aspects of
the product. In doing so, a lot of effort has to go into capacity building, production
related issues, quality parameters and the logistics of procuring products from
sometimes remote and inaccessible areas. However, in most cases the products sell more
because of their quality and competitive pricing, rather than the social marketing. The
key is quality of produce; it is the fundamental criteria to secure the market position and
product branding
Many consumers express that the taste of organic vegetable is clearly better than that of conventional one, which is an encouragement to organic producers and traders.
Market Development for Organic Products
151
It is suggested that more research be carried out on this issue to find out its theoretic basis to reinforce the purposefulness of the production of organic vegetable. Moreover, the improvement in the taste of the organic vegetable can also be used as a meaningful reference for other organic food. Other organic food should also have a better taste like organic vegetable as long as operators master the rationale and keep on practicing.
The organic market is relatively underdeveloped in terms of value-added products, particularly in the domestic market. Processed products that can combine the above attributes innovation, taste, health, and convenience will also have strong opportunities. In particular, opportunities have been identified for baby foods and semi-processed inputs for manufactured products in EU.
Course-201 Market Led Extension
152
AEM-201
Market Led Extension
(4 Credits)
Block-II
Legal Framework for Agricultural Marketing
Unit – 1 National Agricultural Policy 153 – 154
Unit – 2 Model Act on Agricultural Marketing 155 – 165
Unit – 3 Futures Trading and Commodity Marketing 166 – 189
Unit - 4 Crop Insurance 190 – 216
Unit – 5 WTO and its implications on Agriculture 217 – 237
National Agricultural Policy
153
Unit - 1
National Agricultural Policy
Structure
1.0 Objectives
1.1 Introduction
1.2 Let us sum up
1.0 Objectives
After going through this unit, you will be able to:
• To develop a comprehensive view about the thrust areas emphasised in agricultural policy
• To understand about the Central Sectoral Programmes and Schemes envisaged in the Policy for growth in agriculture
• To help the Extension functionaries to align their thought process to that of agri business development
1.1 Introduction
A Central sector scheme viz. Establishment of Agri-clinics and Agri-business by
Agriculture Graduates is being implemented with the aim of supporting agriculture
extension and development. The scheme is being jointly implemented by National
Institute of Agricultural Extension Management (MANAGE) and National Bank for
Agricultural and Rural Development (NABARD) in association with over 61 training
institutes.
The other such issues including market led extension, effectiveness of farmers
organizations, revitalizing the knowledge system among the farmers, functionaries and
other stakeholders would call for a significant thrust for human resource development.
Course-201 Market Led Extension
154
Efforts in the Eleventh Plan should be made for capacity building of manpower at
different levels through specialised training programmes to be implemented through
ICAR Institutions, KVKs, SAUs, NGOs and institutions like the Indian Institutes of
Management (IIMs), National Institute of Agriculture Extension Management
(MANAGE) etc. The knowledge of personnel employed in State Government
departments will also be upgraded periodically through structured training modules
and programmes.
For this inclusive growth, Govt. of India prepared a comprehensive agriculture
policy in the year 2000 to attain the following objectives;
• A growth rate in excess of 4 per cent per annum in the agriculture sector • Growth that is based on efficient use of resources and conserves our soil, water
and bio-diversity; • Growth with equity, i.e., growth which is widespread across regions and farmers; • Growth that is demand driven and caters to domestic markets and maximises
benefits from exports of agricultural products in the face of the challenges arising from economic liberalization and globalisation;
• Growth that is sustainable technologically, environmentally and economically
In order to realize these objectives, the focused areas as envisaged in the Policy
Document, various state governments have formulated the agricultural policy to suit the
state requirements.
1.2 Let us sum up
Understanding the focused areas of the agricultural policy is very important for an
extension functionary. This gives a direction to plan the extension activities for realising
faster and more inclusive growth in agriculture and allied sectors. The areas focused in
the policy documents for agriculture are sustainable Agriculture, food and nutrithorial
security, generation and transfer of technology, Input management incentives for
Agriculture, Investments in Agriculture, Institutional structure, management reforms
and Cooperative reforms.
Model Act on Agricultural Marketing
155
Unit - 2
Model Act on Agricultural Marketing
The State Agricultural Produce Marketing (Development & Regulation Act, 2003)
Structure 2.0 Objectives
2.1 Introduction
2.2 Definitions
2.3 Establishment of Markets
2.4 Constitution of Market Committee
2.5 Classification of Market and Special Market
2.6 Conduct of Business and Powers and Duties of Market Committee
2.7 Contract Farming
2.8 Regulation of Trading
2.9 Market Committee Fund
2.10 State Agricultural Marketing Board
2.11 Penalty
2.12 Let Us Sum Up
2.0 Objectives
After going through this unit, you will be able to:
• The APMC Model Act and why a separate legislation was needed • Significance and applicability of this Act… • Salient features of the Act
Course-201 Market Led Extension
156
2.1 Introduction
Agricultural Markets in most parts of India are established and regulated under
the State APMC Acts. Agricultural marketing is witnessing major changes worldwide
due to liberalization of trade in agricultural commodities and the agricultural marketing
system in the country needs to be integrated and strengthened to enable the farming
community benefit from new global market access opportunities.
A number of recommendations were made by an Inter-Ministerial Task Force on
Agricultural Marketing Reforms to make the agricultural marketing system more
vibrant and competitive. Major recommendations related to amendment to the State
APMC Act for promotion of direct marketing and contract farming, development of
agricultural markets in private and cooperative sectors, stepping up pledge financing,
expansion of future trading to cover all agricultural markets, introduction of negotiable
warehouse receipt system and use of information technology to provide market led
extension services to the farmers.
As a follow-up measure, the Central Government, drafted a Model Act on
Agricultural Marketing and circulated to all state governments for adopting necessary
changes as Agricultural Marketing is a state subject. The State Agricultural Produce
Marketing (Development and Regulation) Act, 2003, is an Act to provide for improved
regulation in marketing of agricultural produce, development of efficient marketing
system, promotion of agri-processing and agricultural export and the establishment and
proper administration of markets for agricultural produce. The different state
governments have adopted the provisions from the model APMC act from different
states.
The Act provides for establishment of private markets/ yards, direct purchase
centre, consumer/farmers markets for direct sale, systems for putting in place an
effective infrastructure for the marketing of agricultural produce, transparency in the
pricing system, and payment to farmers on the same day, promotion of Public Private
Partnership in the management and development of agricultural markets in the country.
Model Act on Agricultural Marketing
157
Provision is also made for Special Markets for commodities like Onions, Fruits,
Vegetables, Flowers etc.. The role of the present Agricultural Produce Market
Committee is redefined, to promote alternative marketing system, contract farming,
directs marketing and farmers/consumers markets. It also redefines the role of State
Agricultural Marketing Boards to promote standardization, grading, quality
certification, market led extension and training of farmers and market functionaries in
marketing related areas. Provision has also been made in the Act for constitution of
State Agricultural Produce Marketing Standards Bureau for promotion of Grading,
Standardization and Quality Certification of Agricultural Produce. This is expected to
facilitate pledge financing, E-trading, direct purchasing, export, forward/future trading
and introduction of negotiable warehousing receipt system in respect of agricultural
commodities.
An efficient marketing system, promotion of agri-processing and agricultural
exports and establishment and administration of markets for agricultural produce,.
(Section-1)
2.2 Definitions
“Agricultural Produce” means all produce and commodities, whether processed
or unprocessed, of agriculture, horticulture, apiculture, sericulture, livestock and
products of livestock, fleece and skin of animals, forest produce etc. as are specified in
the schedule or declared by the Government by notification from time to time and also
includes a mixture of two or more than two such products. "Bill" means bill issued by
the traders as prescribed “Board” means the State Agricultural Marketing Board,
“Market Committee” means the agricultural produce Market Committee
established under this Act “Market Functionary” means a trader, a commission agent,
buyer, Hamal, Processor, a stockiest, a trader and such other person as may be declared
under the rules or bye-laws to be a market functionary.
Course-201 Market Led Extension
158
The Model Act: Salient Features
2.3 Establishment of Markets
The Model Act on Agricultural Marketing provides for improved regulation in
marketing of agricultural produce, development of an efficient marketing system,
promotion of agri-processing and agricultural exports and establishment and
administration of markets for agricultural produce, procedures and systems for putting
in place an effective infrastructure for the marketing of agricultural produce. (Section-1)
As per section 3 of the Act, legal persons, growers and local authorities are
permitted to apply for the establishment of new markets for agricultural produce in any
area. Under the existing law markets are setup at the initiative of State Governments
alone. Private persons, farmers and consumers, can establish more than one market, in a
market area.
In every market area, there may be: - market yard and sub market yards
managed by the Market Committee, private markets and farmers/ consumer markets
managed by a person other than the Market Committee.
2.4 Constitution of Market Committee
A Market Committee shall be constituted for every market area. Members would
consist of ten agriculturists possessing qualifications as prescribed to be elected by the
Managing Committee members of the primary agricultural cooperative societies
functioning in the market area and by the Sarapanch & members of the village
Panchayats. Seven of them are to be elected from amongst the committee members of
Primary Agricultural Societies. Of the 10 representatives of agriculturist at least one
should be from scheduled Caste/Tribe; one from other Backward Class and one-woman
member,
As per section 14 of the Act, there is no compulsion on the growers to sell their
produce through existing markets administered by the Agricultural Produce Market
Model Act on Agricultural Marketing
159
Committee (APMC). However, an agriculturist who does not bring his produce to the
market area for sale will not be eligible for election to the APMC.
Every Market Committee shall have a Chairman and a Vice-Chairman, elected
from amongst representatives of agriculturists.
2.5 Classification of Market and Special Market
As per section 20 of the Act, separate provision is made for notification of ‘Special
Markets’ or ‘Special Commodities Markets’ in a market area for specified agricultural
commodities to be operated in addition to existing markets.
The State Government may declare any market area to be operated, in addition to
the existing market, as ‘Special Market’ or ‘Special Commodity Market’ keeping in view
aspects such as turnover, area served and special infrastructure requirements of a
particular commodity, Members of the Market Committee for special market shall
consist of: agriculturists, traders, Municipal Commissioner or his nominee of the area
where the Special Market is located, the Collector or his nominee of the District in which
Special Market is located, Chief Town Planner , representative of the Registrar of
Cooperative Societies,. Director of marketing of the State or nominee, Chief Executive
Officer of the State Agricu1tural Marketing Board (ex-officio Member), representative of
other States from where arrivals are received by the special market (to be nominated by
the respective State Government) executive member to be appointed by state
government, and Agricultural Marketing Advisor or nominee the. Market Committee
shall meet at least once in six months.
2.6 Conduct of Business and Powers and Duties of Market Committee
The Market Committee is responsible for implementing the provisions of this Act,
in the market area; providing facilities for marketing of agricultural produce
superintendence, direction and control of market or for regulating marketing of
agricultural produce in any place in the market area.
Course-201 Market Led Extension
160
As per sections 26 and 27 of the Act the APMC have been made responsible for:
ensuring complete transparency in pricing system and transactions taking place in
market area; providing market-led extension services to farmers; ensuring payment for
agricultural produce sold by farmers on the same day; promoting agricultural
processing including activities for value addition in agricultural produce; publicizing
data on arrivals and rates of agricultural produce brought into the market area for sale
and promoting public private partnership in the management of agricultural markets.
The Market Committee may register market functionaries, regulate/ supervise
the auction of notified agricultural produce, agreements of sales, weighment, delivery,
payment etc, provide for the settlement of disputes arising out on any transaction
connected with the marketing of notified agricultural produce; take steps to prevent
adulteration of notified agricultural produce;. Promote public-private partnership for
carrying out extension activities in its area viz., collection, maintenance and
dissemination of information in respect of production, sale storage, processing, prices
and movement of notified agricultural produce; take measures for the prevention of
purchases and sales below the minimum support prices as fixed by the Government
from time to time; levy rates, charges, fees; regulate the entry of traffic into the market
yard; prosecute persons for violating the provisions of this Act, impose penalties for
contravening the provisions of the Act.
The committee may inspect and verify scales, weights and measures in use in a
market area and also the books of accounts and other documents maintained by the
market functionaries; publicize about the benefits of regulation, the system of
transaction, facilities provided in the market yard etc. through poster, pamphlets,
hoardings, cinema slides, film shows, group meetings, electronic media etc.
In order to maintain stability in the market, Market Committee can take suitable
measures to ensure that traders do not buy agricultural produce beyond their capacity
and avoid risk to the sellers in disposing of the produce; and grant licences only after
obtaining necessary security according to the capacity of the buyers;
Model Act on Agricultural Marketing
161
The Market Committee may undertake construction of roads, god owns and other
infrastructure in the market area to facilitate marketing of agricultural produce;
maintain stocks of fertilizer, pesticides, improved seeds, agricultural equipments, inputs
for sale; to provide on rent storage facilities for stocking of agricultural produce to
agriculturists.
To promote and encourage e trading, market committee may establish regulatory
system, create infrastructure and undertake other activities and steps needed.
As per section 36 of the Act, provision is made for the appointment of Chief
Executive Officer of the Market Committee. The Chief Executive officer shall be the chief
executive of the market and the custodian of all the records and properties of the
market.
2.7 Contract Farming
A Chapter on ‘Contract Farming’ (Chapter-VII) is added to provide for
compulsory registration of all contract farming sponsors, recording of contract farming
agreements, resolution of disputes, if any, arising out of such agreement, exemption
from levy of market fee on produce covered by contract farming agreements and to
provide for indemnity to producers’ title/ possession over his land from any claim
arising out of the agreement.
The Model specification of contract farming agreements is provided in the
Addendum to the model Act.
Provision is made for direct sale of farm produce to contract farming sponsor from
farmers’ field without the necessity of routing it through notified markets.
2.8 Regulation of Trading
As per section 39, except in accordance with the provisions of this Act, no person
shall use any place in the market area for the marketing of notified agricultural produce
or operate in the market area as a market functionary.
Course-201 Market Led Extension
162
All notified agricultural produce shall ordinarily be sold in the market yards/ sub
market yards or in the private yards of the license holder. The price of the notified
agricultural produce brought in the market yard shall be paid on the same day to the
seller in market yard.
Provision is made for imposition of single point levy of market fee on the sale of
notified agricultural commodities in any market area and discretion provided to the
State Government to fix graded levy of market fee on different types of sales. (Section
42)
As per section 44, licensing of market functionaries is dispensed with and a time
bound procedure for registration is laid down for market functionaries to operate in one
or more than one market areas.
Every person who, in respect of notified agricultural produce, desires to operate in
the market area as trader, commission agent, Weigh men, hamal, surveyor,
warehouseman, contract farming buyer, owner or occupier of processing factory or such
other market functionary, shall apply to the Market Committee for registration/
renewal of registration.
As per section 44(6) of the Act, Commission agency in any transaction relating to
notified agricultural produce involving an agriculturist is prohibited and there will be
no deduction towards commission from the sale precedes payable to the agriculturist
seller.
Provision is made for the purchase of agricultural produce through private yards
or directly from agriculturists in one or more than one market area. (Section-45)
The Director/Managing Director/ Prescribed authority may grant licence to
purchase agricultural produce by establishing private yard or direct from agriculturist
for process, trade, export of notified agricultural produce; grading, packing and
transaction by value addition of notified agricultural produce.
Model Act on Agricultural Marketing
163
As per section 46 of the Act, provision is made for the establishment of
consumers’/ farmers’ market to facilitate direct sale of agricultural produce to
consumers. (Section-46)
License for establishment of consumer/farmer market shall be granted by the State
Govt. / Director/Managing Director.
As per section 50 of the Act, provision is made for resolving of disputes, if any,
arising between private market/ consumer market and Market Committee.
No trade allowance or deduction, other than prescribed by or under this Act , shall be
made or received by any person in any market area in any transaction in respect of the
notified agricultural produce.
The Chief Executive Officer of the Market Committee or any officer of the State
Government or the Board, may require any person carrying on business in notified
agricultural produce to produce the accounts and other documents and furnish any
information relating to stocks of such agricultural produce or purchase, sale, processing,
value addition and delivery of such agricultural produce by such person and also to
furnish any other information relating to payment of market fees by such person.
The State Governments is conferred power to exempt any agricultural produce
brought for sale in the market area, from payment of market fee. (Section-56)
2.9 Market Committee Fund
Money received by a Market Committee shall be paid into a Market Committee
Fund" and all expenditure incurred by the Market Committee defrayed out of the fund.
Any money received by the Market Committee by way of arbitration fee or as security
for costs in arbitration proceedings relating to disputes or received by way of security
deposit, contribution to provident fund or for payment in respect of any notified
agricultural produce, or charges payable to Wight man and other functionaries shall not
form part of Market Committee fund,.
Course-201 Market Led Extension
164
Market Committee may use its funds to create facilities like grading,
standardization and quality certification; to create infrastructure on its own or through
public private partnership for post harvest handling of agricultural produce and
development of modern marketing system. (Section-59)
2.10 State Agricultural Marketing Board: Functions and Powers
In order to coordinate market activities and for development, promotion and
regulation of agricultural marketing the State Government may, establish and constitute
a State Agricultural Marketing Board.
The State Agricultural Marketing Board would be responsible for: setting up of a
separate marketing extension cell in the Board to provide market-led extension services
to farmers; (ii) promoting grading, standardization and quality certification of notified
agricultural produce and to set up a separate Agricultural Produce Marketing Standards
Bureau. (Section-73).
The Board would be responsible for Coordination of the working of the Market
Committees; planning of the development of Agricultural Produce Markets; administer
the State Market Development Fund; give direction and guide the Market Committees.
Money received by or on behalf of the Board shall be credited to a Marketing
Development fund, which could be utilized for: market survey, research, grading,
standardization, quality certification, etc.; development of quality testing and
communication infrastructure. development of media, cyber and long distance
infrastructure relevant to marketing of agricultural and allied commodities. (Section-79)
2.11 Penalty
Penalty is imposed for contravention of any provision of this Act, with simple
imprisonment which may extend to six months or with fine which may extend to one
thousand rupees or with both.
Model Act on Agricultural Marketing
165
Whenever any person is convicted of any offence punishable under this Act, the
Magistrate shall in addition to any fine which may be imposed, recover and pay over to
the Market Committee the amount of fees or any other amount due from him under this
Act and may, also recover and pay over to the Market Committee costs of the
prosecution.
2.12 Let Us Sum Up
Agricultural Marketing is witnessing changes due to liberalization of trade and
marketing system needs to be revamped in order to enable the farming community
benefit from new global market opportunities. A Task Force on Agricultural Marketing
Reforms recommended amendment of the State APMC Act for promotion of direct
marketing and contract farming, developing agricultural markets in private and
cooperative sectors, stepping up pledge financing, expansion of future trading,
introducing negotiable warehouse receipt use of information technology to provide
market led extension services to farmers. The Central Government drafted a Model Act
on Agricultural Marketing. The State Agricultural Produce Marketing (Development
and Regulation) Act, 2003, is an Act to provide better regulation in marketing of
agricultural produce, development of an efficient marketing system, promotion of agri-
processing and agri export and establishment and administration of markets for
agricultural produce. The Act provides for establishment of private markets/ yards,
direct purchase centres, consumer/farmers markets for direct sale, transparency in
pricing, payment to farmers on the same day, promotion of Public Private Partnership
in management and development of agricultural markets in the country, and also for
Special Markets. The role of State Agricultural Marketing Boards is redefined to
promote standardization, grading, quality certification, market led extension and
human resource development.
Course-201 Market Led Extension
166
Unit - 3
Futures Trading and Commodity Marketing
Structure
3.0 Objectives
3.1 Introduction
3.2 Definition of a Commodity
3.3 The Physical Market
3.4 Inherent Limitations Of The Physical Market
3.5 Value Chain
3.6 Intermediaries
3.7 Key Features of Physical Agricultural Commodity Markets in India
3.8 Electronic Spot Exchange
3.9 Cash Forward Transactions
3.10 Forward Contracts
3.11 Features of Forward Contracts
3.12 Difference Between Spot and Forward Transactions
3.13 Limitations of Forward Contracts
3.14 The Need for Futures
3.15 Benefits of Futures Trading to Market Participants
3.16 Evolution of Commodity Futures & Indian Commodity and Derivatives
Exchanges
3.17 Structure of Indian Commodity Exchanges
3.18 Major Indian Exchanges
3.19 Benefits of Futures Markets to Farmers
3.20 Let us sum Up
Futures Trading and Commodity Marketing
167
3.0 Objectives
After going through this unit, you will be able to:
• Define commodities • Know the working of the physical markets and value chain • Understand the various features of the physical markets • Know the problems of the physical markets • Understand the need and objectives of Electronic Spot Exchanges • Understand the features and the limitations of Cash Forward transactions • Understand the need for an Organized Exchange for Futures Trading • Know the difference between Forwards and Futures • Understand the role of various market participants • Identify the various types of traders • Know about the evolution of Indian commodity exchanges • Understand the role and limitations of the futures market in India • Understand how the cropping pattern could be decided by futures prices • Understand as to how the farmers could hedge their price risk • Understand how various entities could help the farmers to use futures markets
3.1 Introduction
Organized commodity markets have existed in India for centuries. The more easily
understood markets are those that trade in agricultural commodities. For example,
grains such as wheat, paddy and maize; or oilseeds such as mustard, groundnut and
soybean. Other markets that trade in non-agricultural commodities include markets for
metals such as iron ore, and markets for energy products such as crude oil and natural
gas.
3.2 Definition of a Commodity
A commodity refers to any good, merchandise or produce of land that can be
bought and sold. A “commodity” is an article or product that:
• Is used for commerce • Is movable
Course-201 Market Led Extension
168
• Has value • Can be bought and sold • Is produced or used as a subject in a barter or sale.
Goods or products have economic value. Producers produce goods and sell them
to processors who in turn process and market the final product. Sometimes, traders buy
the goods, store and sell them later. In this process, the goods or products pass through
many hands before they reach the end consumer.
For example, a farmer produces cotton and sells the produce to a yarn
manufacturer. The yarn manufacturer sells the finished yarn to a cloth manufacturer,
who again sells the finished cloth to a cloth merchant. Ultimately, consumers buy
clothes for their use from the cloth merchant. From cotton to cloth, all intermediary
products are commodities that are bought or held with the intention of sale. When the
commodity reaches the final consumer and is not held for further sale, it ceases to be a
commodity. It is important to note that the term “commodity” relates to the intention of
the person who produces or holds it for further sale.
3.3 The Physical Market
The physical market is the traditional market and is usually referred to as the “cash
and carry market” or the “spot market”. In this market, the seller agrees to deliver the
commodity and the buyer agrees to make the payment on the “spot”. This agreement
between the buyer and the seller is termed as “spot contract”. Purchases are settled in
cash at mutually agreed prices. In other words, in the physical market, trades are
executed through party-to-party contracts. The advantage of this market is that the
buyer can select and buy the specific commodity required.
3.4 Inherent Limitations of the Physical Market
The inherent characteristic of the physical market is that the transactions in this
market are subject to price risk. For example, consider a biscuit manufacturing
company. The basic raw materials required by this company are wheat and sugar. The
price of these basic raw materials depends on the demand-supply situation. Demand
Futures Trading and Commodity Marketing
169
and supply are a function of price and several other factors. The company needs
continuous supply of wheat and therefore needs to plan procurement and storage of
wheat in such a manner that the production of biscuits does not face any problem. For
this, the company could enter into a contract with a farmer to purchase wheat.
However, if the wheat production falls, then the company may have to pay a higher
price for the wheat to keep up its biscuit production.
The farmer, who is the other party to the contract, faces price uncertainty from the
time wheat is sown till it is harvested. The farmer may get attractive prices for wheat in
times of scarcity. However, when there is a very good yield and consequently over
supply of wheat, he would have to sell off his perishable harvest at a low price. Thus,
both sellers and buyers face price risk in the physical market.
3.5 Value Chain
A value chain comprises all activities and services undertaken along a commodity
chain - from the primary producer to the final consumer. As products move from one
stage of the value chain to another, value gets added. A typical value chain includes
producers, assemblers, traders, processors, distributors, retailers and of course,
consumers. Producers use inputs such as seeds, fertilizers, labour, and implements to
produce raw materials. Assemblers and traders purchase these materials in bulk.
Processors or manufacturers, then convert these raw materials into finished goods.
Distributors who are generally wholesalers procure these goods. From them, the goods
reach consumers through retailers.
We can analyze the value chain by examining all activities and observing where
further value is added to the product and also by examining business needs. This
analysis of the value chain helps players at various stages of the chain to increase their
profitability.
Course-201 Market Led Extension
170
3.6 Intermediaries
The major participants of this market are producers, traders and brokers,
processors, distributors, packagers, wholesalers and retailers. The relationship between
various participants and the structure of the market is illustrated below. Traders,
brokers and commission agents act as “intermediaries” connecting the other
participants and the various segments of the value chain.
3.7 Key Features of Physical Agricultural Commodity Markets in India
In India, agricultural commodities are traded in wholesale markets called mandis,
where the prices of commodities traded therein are determined on an ongoing basis, on
the basis of supply and demand. The physical markets that trade in agricultural
commodities function under the control of the respective State Governments.
3.7.1 Setting up Mandis
A mandi can be set up only with the permission of the respective State
Government. Each state has a State Agricultural Marketing Board, which sets up Mandi
Boards at the district level. Mandi Boards give permission to set up mandis. After a
mandi is set up, it builds one or more yards with platforms. Farmers sell their produce
at these yards to licensed traders who in turn sell it to wholesale dealers.
3.7.2 Participants
Key market participants in the mandi are farmers, licensed traders, brokers and
wholesale dealers. Traders and brokers are the intermediaries between the farmers,
wholesale dealers and mill owners. Only licensed traders are allowed to be the
intermediaries.
Arthiyas are important intermediaries in the agricultural commodities markets. An
Arthiya acts as both a commission agent and as a financier to the farmers. The Mandi
Board Committee allots specific yards to each of the Arthiyas and the farmers unload
Futures Trading and Commodity Marketing
171
their grain in these yards. The Arthiyas get the grains weighed and packed and help to
organize the auction. For these services, they are paid “dami”, or a commission fee.
Traders have to pay mandi fees, which include:
• Basic transaction fee, varying from 4% to 12% of the monetary value of the trader’s volume
• Other fees/taxes, also linked to the volume.
3.7.3 Regulation
The state governments through the State Agricultural Marketing Boards regulate
the physical markets in India. As on 31st March 2007, agricultural production in the
country was serviced through 27,131 rural primary/periodic agricultural markets of
which 7465 functioned under the ambit of regulation. The regulatory framework is
provided by the Agricultural Produce Marketing Acts (APMC Acts) of various States.
Agricultural Produce Market Committees (APMCs) are set up to implement the
provisions of the Act for regulating the marketing of agricultural produce for
designated market areas within a state. These APMCs are responsible for the
development and maintenance of market yards and for enhancing trading facilities.
Currently, in most states, the APMC Acts place restrictions on the farmers from
entering into direct marketing or contract with any processor/manufacturer/bulk
purchaser. The Act specifies that the produce must be channelised only through the
regulated market. Several states including Maharashtra, Punjab, Karnataka, Andhra
Pradesh and Rajasthan have amended their APMC acts along the lines of the Model
APMC Act, 2003 of the Central government. This model Act permits farmers to sell their
produce directly to buyers offering them the best price. Several state governments have
also enacted legislation to permit contract farming. The Karnataka government has
taken the initiative in facilitating the establishment of an “Integrated Produce Market”
(Safal market) owned and managed by the National Dairy Development Board (NDDB)
for marketing of fruits, vegetables and flowers in the State.
Course-201 Market Led Extension
172
3.8 Electronic Spot Exchange
To overcome the problems of the physical market, an electronic spot exchange has
been recently established by the National Commodity & Derivatives Exchange Ltd.
(NCDEX) and is called the NCDEX Spot Exchange Ltd. (NCDEX Spot). This is a national
level, institutionalized and transparent electronic exchange. This exchange, when fully
operational, is expected to help solve the various problems faced by farmers, traders,
processors and other players in the physical markets. The need for an electronic spot
exchange arose in the context of a wide gap existing between the prices paid by end-
consumers and the prices received by the farmers in physical markets. This happens
mainly due to the following reasons:
1. Very high costs of intermediation. 2. The farmers’ ignorance about the spot prices of commodities in mandis before
they reach there to sell their produce. 3. Farmers’ inability to predict the market accurately. 4. Lack of an effective mechanism to eliminate price risk. The risk arises due to
variations in demand and supply and also due to uncertainties in economic and market conditions
The electronic exchange, with its high level of sophistication and connectivity with
local panchayats, has the potential to overcome the current problems of the mandi
trading system. This exchange would provide real-time price information to farmers
thus, enabling them to take informed decisions.
3.9 Cash Forward Transactions
Cash transactions in the physical markets involve two types of contracts that require:
1. Immediate delivery in the spot market, or 2. Delivery of a specific commodity to the buyer sometime in the future
The second type of contract that specifies delivery of a commodity to the buyer at a
future date is called a “cash forward contract”. For example, a farmer enters into a
forward contract with a flourmill in December 2007 to deliver 15,000 tonnes of wheat
during June 2008. While entering the contract, both parties agree upon the quality,
Futures Trading and Commodity Marketing
173
quantity, delivery time, location and price. At the time of delivery, price adjustments are
made depending on whether the stipulated factors have been met or not.
3.10 Forward Contracts
A forward contract is a bilateral agreement in which a buyer and seller agree upon
the delivery of a specified quality and quantity of an asset on a specified future date at a
pre-determined price. One of the parties to the forward contract assumes a long position
and agrees to buy the underlying asset on a certain specified future date for a specified
price. The other party assumes a short position and agrees to sell the asset on the same
date at the same specified price. In simple terms, long and short positions indicate
whether the party to the contract has a buy position (long) or sell position (short). Other
contract details like delivery date, the parties to the contract negotiate delivery price and
quantity bilaterally. Forward contracts are customized contracts normally traded
outside the exchanges.
3.11 Features of Forward Contracts
The salient features of forward contracts are:
• Forward contracts are over the counter (OTC) contracts. They are bilateral contracts and hence are exposed to counter–party risk.
• Each contract is custom designed and hence unique in terms of contract size, expiration date and the asset type and quality.
• Generally, only parties to the contract know the contract price. • On the expiration date, the contract has to be settled by delivery of the asset. If
the party wishes to reverse the contract, it has to compulsorily go to the same counter party, which often results in high prices being charged.
3.12 Differences between spot and forward transactions
There are three processes involved in any market transaction:
1. Trading 2. Clearing 3. Settlement.
Course-201 Market Led Extension
174
In the trading process, the buyer with the demand for the product interacts with
the seller of the product. The buyer and the seller negotiate and arrive at an agreement
regarding the quantity, quality and price.
In the clearing process, the buyer and the seller decide on the quantum of goods
and the amount of cash that would be exchanged between them.
The actual exchange happens in the settlement process.
In a spot transaction, trading, clearing and settlement happen simultaneously and
instantaneously - that is, “on the spot”. For example, consider a mill owner interested in
buying cotton. He approaches a farmer on 1st July 2007 who quotes Rs. 4,500 per quintal.
They agree upon this price and the mill owner buys 1,000 quintals. He pays the farmer
Rs. 45 lakh and leaves with the cotton. This is a spot transaction. However, if the mill
owner is interested in buying the cotton only two months later, he can contact the
farmer, who quotes Rs. 4,520 per quintal for 1,000 quintals for delivery after two
months. Two months later, the mill owner will pay the farmer Rs. 45.20 lakh and take
delivery of the cotton. This is a forward contract.
In a forward transaction, cash does not change hands on the date of entering into
the contract. While the trading happens on the current day, clearing and settlement
happen at the end of the specified period. Hence, in a forward contract, the trading,
clearing and settlement do not happen simultaneously as in a spot contract.
3.13 Limitations of Forward Contracts
While the forward transactions have the advantage of being customized, they have
the following limitations:
• The contracts are private and negotiated bilaterally between two parties. Therefore, there are no exchange guarantees.
• The prices are not transparent as there is no reporting requirement. • There are no regulations for establishing market stability and protection of
market players. • Lack of standardization leads to illiquidity in the absence of a secondary market.
Futures Trading and Commodity Marketing
175
• The profit or loss is realized only on the maturity date. • Settlement is only through actual delivery or offsetting by cash delivery.
3.14 The Need for Futures
Compared to the forward market for commodities, which is highly customized,
other forward markets, say the Foreign Exchange market, can be highly standardized.
This process of standardization reaches its limit in the organized futures market, in
which the above limitations get addressed. Future contracts have evolved out of
forward contracts. These contracts are exchange-traded versions of forward contracts.
These contracts are an agreement to buy or sell a specified quantity of a commodity
during a designated month in the future, at a price agreed upon by the buyer and seller
at the time of entering into the contract. Future contracts contain standard specifications
of the underlying asset, its quality and quantity and the date and time of expiry of the
contract. A futures contract need not be settled through physical delivery. It can be
closed by entering into an equal and opposite contract.
3.15 Benefits of Futures Trading to Market Participants
Futures contracts provide several benefits to market participants. These are:
• Price discovery and price dissemination
Futures markets enable various players to discover the price of commodities and
make informed decisions. Prices get disseminated instantaneously to everybody as the
contract prices are available on the centralized trading screen of the exchange. The
producer can access the prices and get an idea of what the future prices are likely to be.
This information helps the producer to decide among various commodities. The
consumer gets an idea of prices that would be charged to him at points in the future.
Exporters also find it easier to quote realistic prices and face competition better.
Course-201 Market Led Extension
176
• Price risk management
The larger, more frequent and more unforeseen price variability in a commodity,
the greater is its price risk. The risk mitigation or “hedging” mechanism provided by the
futures market provides an efficient and effective mechanism for management of price
risks. A farmer can lock in the price at which he would sell his produce when it is ready
for harvesting. An exporter can “hedge” his price risk on the export contract by using
the futures market. Or, a manufacturer can hedge the risk inherent in the cash market.
• Price stability
The futures market mechanism helps prevent rampant fluctuations in prices
leading to price stabilization. Efficient price discovery helps in preventing seasonal
price volatility.
• Common platform for all traders
A centralized trading platform gives access to all players, unlike the bilateral
forward market, which has only restricted access.
• Low transaction costs
Low brokerage costs and a smaller bid-ask spread lead to low impact costs. In
addition, there is no need to get into any time-consuming negotiations as in the forward
markets. These factors help to reduce the transaction costs.
• Absence of counter party credit risk
In a futures contract, the ‘clearing house’ becomes a counter party to each
transaction. This act of the clearinghouse is called ‘novation’ and this removes the
counter party risk. This is possible because of the standardized and centralized nature of
all transactions.
Futures Trading and Commodity Marketing
177
• Lower credit risk
The use of various types of margins helps in guaranteeing the performance of future
contracts, thereby bringing down the credit risk.
• Liquidity
The standardization of contracts enables participants to come out of their positions
easily. The large number of market participants trading on an exchange further
enhances liquidity.
3.16 Evolution of Commodity Futures & Indian Commodity Derivatives
Exchanges
In India, organized trading in commodity derivatives started in 1875 with the
setting up of the Bombay Cotton Trade Association Ltd. However, very soon leading
cotton mill owners and merchants expressed discontent over its functioning. This led to
the establishment of the Bombay Cotton Exchange Ltd. in 1893.
Following cotton, trading was introduced in other agricultural commodities. In
1900, the Gujarati Vyapari Mandali was established to carry out futures trading in
oilseeds, groundnut, castor seed and cotton. The states of Punjab and Uttar Pradesh
were also trading futures on wheat. The Hapur Chamber of Commerce established the
futures exchange for wheat in 1913 at Hapur.
Futures trading in raw jute and other jute goods began at Kolkata with the setting
up of the Calcutta Hessian Exchange Ltd. in 1919. However, organized futures trading
in raw jute started only in 1927 with the establishment of the East Indian Jute
Association Ltd. These two associations merged in 1945 to form the East India Jute and
Hessian Ltd. to conduct organized trading in both raw jute and jute goods.
Futures trading in bullion began in Mumbai in 1920 and were later introduced at
Rajkot, Jaipur, Jamnagar, Kanpur, Delhi and Kolkata.
Course-201 Market Led Extension
178
The Second World War proved detrimental to futures trading, as the then Union
Government prohibited it. After independence, stock exchanges and futures markets
were brought under the Union List in the Constitution of India. The responsibility for
the regulation of commodity futures markets hence came under the Central
Government.
In December 1952, the Forward Contracts (Regulation) Act (FCRA) was enacted.
This Act continues to regulate forward contracts in commodities in the country. The
Forward Markets Commission (FMC) was set up in 1953 and functions under the
Ministry of Consumer Affairs, Food and Public Distribution. In due course, several
exchanges and registered associations were set up to trade in a range of commodities.
However, during the 1960s, most of these exchanges and associations became inactive
because trading in futures and forwards of commodities was either suspended or totally
prohibited.
In 1980, the Khusro Committee recommended the reintroduction of futures trading
in major commodities. As a result, the government initiated trading in potato in the
latter half of 1980 in Punjab and Uttar Pradesh. Subsequent to the introduction of
economic reforms in 1991, the government appointed the Kabra Committee in 1993
under the Chairmanship of Prof K. N. Kabra. Subsequent to receipt of the committee’s
report in 1994, futures trading was permitted in several commodities. A few small steps
were taken during the following years to permit futures trading in certain other
commodities. In the Budget speech made in February 2002, the Finance Minister
announced expansion of futures trading to cover all agricultural commodities, following
which notifications were issued in on April 1, 2003. Due to mistaken apprehensions,
however that futures trading contributes to inflation futures trading in rice, wheat, urad
and tur was suspended in early 2007.
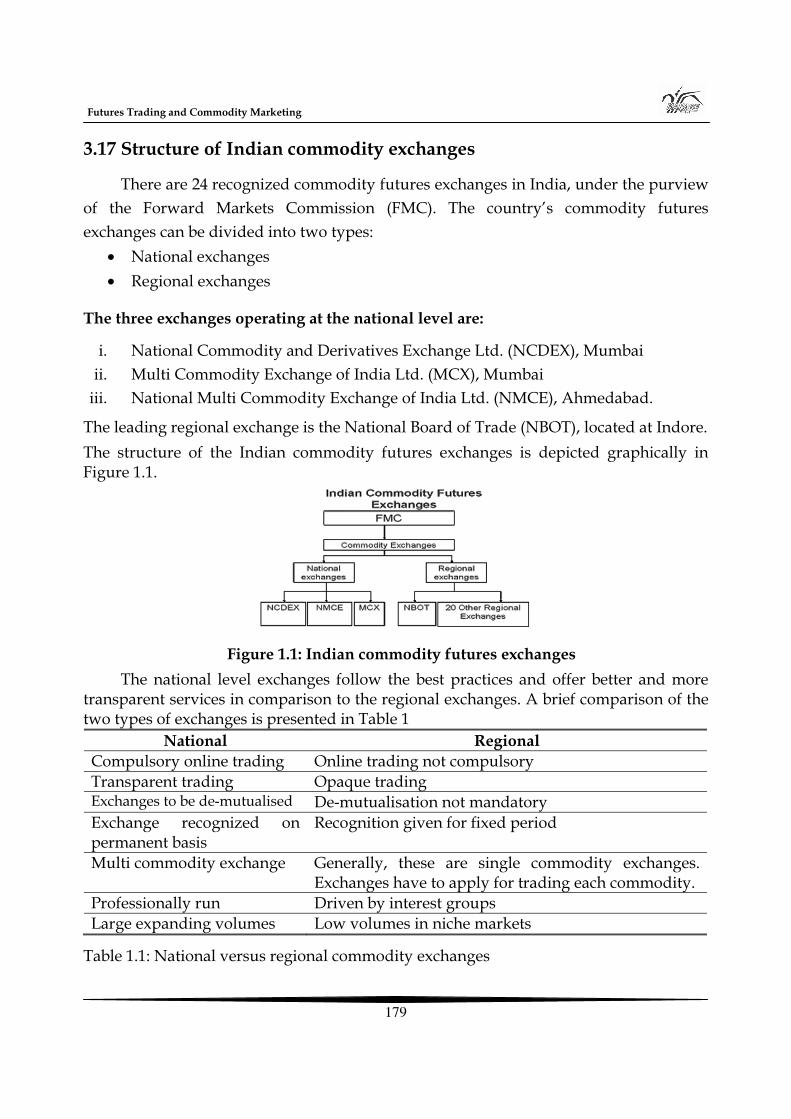
Futures Trading and Commodity Marketing
179
3.17 Structure of Indian commodity exchanges
There are 24 recognized commodity futures exchanges in India, under the purview of the Forward Markets Commission (FMC). The country’s commodity futures exchanges can be divided into two types:
• National exchanges • Regional exchanges
The three exchanges operating at the national level are:
i. National Commodity and Derivatives Exchange Ltd. (NCDEX), Mumbai ii. Multi Commodity Exchange of India Ltd. (MCX), Mumbai
iii. National Multi Commodity Exchange of India Ltd. (NMCE), Ahmedabad.
The leading regional exchange is the National Board of Trade (NBOT), located at Indore. The structure of the Indian commodity futures exchanges is depicted graphically in Figure 1.1.
Figure 1.1: Indian commodity futures exchanges
The national level exchanges follow the best practices and offer better and more transparent services in comparison to the regional exchanges. A brief comparison of the two types of exchanges is presented in Table 1
National Regional Compulsory online trading Online trading not compulsory Transparent trading Opaque trading Exchanges to be de-mutualised De-mutualisation not mandatory Exchange recognized on permanent basis
Recognition given for fixed period
Multi commodity exchange Generally, these are single commodity exchanges. Exchanges have to apply for trading each commodity.
Professionally run Driven by interest groups Large expanding volumes Low volumes in niche markets
Table 1.1: National versus regional commodity exchanges
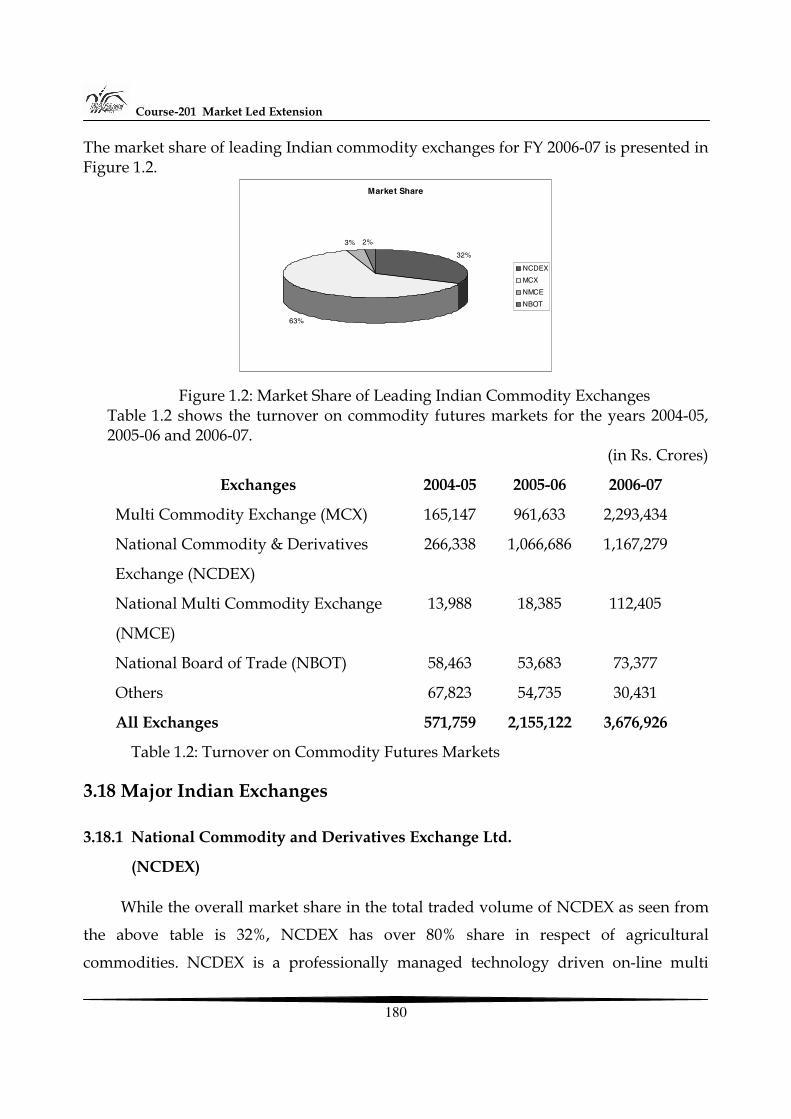
Course-201 Market Led Extension
180
The market share of leading Indian commodity exchanges for FY 2006-07 is presented in Figure 1.2.
Market Share
32%
63%
3% 2%
NCDEX
MCX
NMCE
NBOT
Figure 1.2: Market Share of Leading Indian Commodity Exchanges
Table 1.2 shows the turnover on commodity futures markets for the years 2004-05, 2005-06 and 2006-07.
(in Rs. Crores)
Exchanges 2004-05 2005-06 2006-07
Multi Commodity Exchange (MCX) 165,147 961,633 2,293,434
National Commodity & Derivatives
Exchange (NCDEX)
266,338 1,066,686 1,167,279
National Multi Commodity Exchange
(NMCE)
13,988 18,385 112,405
National Board of Trade (NBOT) 58,463 53,683 73,377
Others 67,823 54,735 30,431
All Exchanges 571,759 2,155,122 3,676,926
Table 1.2: Turnover on Commodity Futures Markets
3.18 Major Indian Exchanges
3.18.1 National Commodity and Derivatives Exchange Ltd.
(NCDEX)
While the overall market share in the total traded volume of NCDEX as seen from
the above table is 32%, NCDEX has over 80% share in respect of agricultural
commodities. NCDEX is a professionally managed technology driven on-line multi
Futures Trading and Commodity Marketing
181
commodity exchange. The shareholders are Life Insurance Corporation of India (LIC),
National Bank for Agriculture and Rural Development (NABARD), National Stock
Exchange of India Limited (NSE), Canara Bank, CRISIL Limited (formerly the Credit
Rating Information Services of India Limited), Goldman Sachs, Intercontinental
Exchange (ICE), Indian Farmers Fertilizer Cooperative Limited (IFFCO) and Punjab
National Bank (PNB).
NCDEX is the only commodity exchange in the country promoted by national level
institutions. This unique parentage enables it to offer a bouquet of benefits, which are
currently in short supply in the commodity markets. The institutional promoters and
shareholders of NCDEX are prominent players in their respective fields and bring with
them institution building experience, trust, nationwide reach, technology and risk
management skills. NCDEX is a de-mutualised exchange with an independent Board of
Directors and professional management - both not having any vested interest in
commodity markets.
NCDEX commenced its operations on December 15, 2003.
The exchange is headquartered in Mumbai and offers facilities to its members at
about 550 centres throughout India. It currently facilitates trading of 58 commodities
including a large number of agricultural commodities. The commodities traded in the
exchange are listed hereunder.
Agricultural commodities
Barley, Cashew, Castor Seed, Chana, Chilli, Coffee - Arabica, Coffee - Robusta,
Crude Palm Oil, Cotton Seed Oilcake, Expeller Mustard Oil, Groundnut (in shell),
Groundnut Expeller Oil, Guar gum, Guar Seeds, Gur, Jeera, Jute sacking bags, Indian
Parboiled Rice, Indian Pusa Basmati Rice, Indian Traditional Basmati Rice, Indian Raw
Rice, Indian 28.5 mm Cotton, Indian 31 mm Cotton, Masoor Grain Bold, Medium Staple
Cotton, Mentha Oil, Mulberry Green Cocoons, Mulberry Raw Silk, Mustard Seed,
Pepper, Potato, Raw Jute, Rapeseed-Mustard Seed Oilcake, RBD Palmolein, Refined Soy
Oil, Rubber, Sesame Seeds, Soyabean, Sugar, Yellow Soybean Meal, Tur, Turmeric,
Course-201 Market Led Extension
182
Urad, V-797 Kapas, Wheat, Yellow Peas, Yellow Red Maize.
Precious, base and ferrous metals
Aluminium Ingot, Electrolytic Copper Cathode, Gold, Mild Steel Ingots, Nickel
Cathode, Silver, Sponge Iron, Zinc Ingot.
Energy, polymers and carbon credits
Brent Crude Oil, Furnace Oil, Linear LDPE, Polypropylene, polyvinyl Chloride, carbon
credits
3.18.2 Multi Commodity Exchange (MCX)
Set up in 2003, MCX is an independent and de-mutualised commodity exchange. It
has been promoted by Financial Technologies (I) Ltd. The other shareholders of the
company include:
• FID Funds (Mauritius) Ltd • State Bank of India • National Bank for Agriculture and Rural Development (NABARD) • Citigroup Strategic Holdings Mauritius Limited • Merrill Lynch Holdings (Mauritius), and • IL & FS Trust Company Ltd.
Products traded include gold, silver, oil and oil seeds, spices, metals, fibre, pulses,
cereals, energy, plantations and petrochemicals. Of more than 60 commodities traded on
MCX, 4 commodities, viz. gold, energy and base metals account for more than 80% of
the total trade volume. As most of the commodities on the MCX are also traded in
international markets, prices on the MCX largely reflect international trends.
3.19 Benefits of Futures Markets to Farmers
The commodity price risk must be well-managed at the farmers’ level in order to
improve farmer’s income and ensure adequate investments in agriculture. This
management of price risk is very crucial for developing countries like India.
Overcoming the problem of inadequate credit is linked to price risk management. This
is because a person who is able to manage price risk will have better access to credit.
Futures Trading and Commodity Marketing
183
Future markets, facilitated by commodity exchanges, address most of the above
concerns of farmers and promote flexible and profitable agriculture. The major benefits
to farmers are described hereunder in detail.
3.19.1 Price Discovery
Trading in futures takes place through the electronic trading platforms of the
various commodity exchanges that have a wide-reaching membership network. These
platforms enable direct participation by farmers and purchasers all over the country.
This, in turn, reduces the number of intermediaries involved in the supply chain. Even
small farmers can take advantage of the commodity exchanges through the Aggregator
Model. Agencies like ITC e-Choupal, HAFED etc. collect the produce from many small
farmers and participate in the commodity exchanges.
The most important benefit of futures trading is price discovery. The commodity
exchanges provide a forum for bringing demand and supply together and thereby
establishing long-term benchmark prices. Prices of futures markets enable farmers to
judge what price the market will pay now for a future delivery. In other words, the
futures price predicts the future supply and demand as estimated by the market.
Prices of spot and futures market move in tandem and the national price signal
links all spot market prices. Therefore, price discovery and long term price signals lead
to integrated price structure throughout the country.
Even in the case of physical delivery of agricultural commodities, use of objective
system of grades and standards ensures that the trade is efficient and fast. It also makes
the exchange the benchmark point for pricing.
3.19.2 Price information
The commodity exchanges act as the key source of price information. Besides the
prices of futures contracts traded in the respective exchanges, these exchanges also help
receive information about transparent, near real time pan-geographic spot prices. At
frequent intervals, the exchanges collect spot prices of agricultural commodities from
Course-201 Market Led Extension
184
nearly 7,000 local mandis all over the country, collate the figures and instantaneously
disseminate the information.
In fact, many mandis now begin functioning only after the commodity exchanges
start trading, as everyone is interested in knowing current market conditions.
Such price information is made available to the whole of India through various
channels like TV, ‘Kisan’ call centres, price ticker boards kept in mandis, warehouses,
rural bank branches, agriculture-based organisations etc. Most farmers can access such
information on a real-time basis in their respective villages. Price information is also
published in newspapers and journals, especially vernacular.
3.19.3 Empowering farmers
With the knowledge of the futures prices (long term price signals), farmers can
make a better decision on what crops to plant during the ensuing season. They can
analyze the prices likely to prevail at a future point of time and hence decide the best
crop that suits them among various competing commodities. Farmers can thus avoid
taking unproductive decisions based on current spot prices.
Based on future prices, farmers can decide between selling their produce now or
storing and selling at a later date at better prices. In fact, a survey indicates that many
farmers nowadays stop selling when they see that futures prices are far higher than the
prices that traders offer them. Even when the farmers decide to sell later, they can also
choose the time at which they want to dispose off their produce.
3.19.4 Promoting Efficiency
Futures trading take place on a transparent electronic exchange with nationwide
access. This environment encourages participation of several new players, thereby
promoting liquidity and competition. For example, the participation of corporates like
Cargill, Britannia, Reliance, Pantaloon and agencies such as Australian Wheat Board,
Markfed etc. in the commodity exchanges enhances the chances of direct procurement
from farmers and shortening the value chain. Moreover, as physical proximity to the
Futures Trading and Commodity Marketing
185
market is no longer an issue, farmers now have the opportunity to sell anywhere in the
country through online trading.
The dissemination of price information by commodity exchanges, by acting as a
price barometer to farmers, is an efficient way of improving commodities marketing for
farmers. Farmers can bargain better with traders and get higher prices for their stocks.
Over the last two years, farmers have actually received prices much higher than the
Minimum Support Price (MSP).
The fact that prices are disseminated to the whole of India almost instantaneously
through multiple channels reduces the possibility of traders cheating the producers.
Therefore, the futures market is a powerful tool for breaking the market power of
monopolistic traders.
3.19.5 Risk Management
Another important benefit of futures market is that it enables farmers to hedge
against price risk. In case farmers want to store their harvest and sell at later date, they
can protect themselves from adverse impact of potential decline in commodity prices,
by buying futures contracts and locking the prices at today’s rates.
The commodity exchange, thus, serves as a risk transfer platform and helps the
farmers to take control of uncertainty. They can concentrate on their core activity, which
is production, without worrying over potential loss of income due to fall in prices.
Moreover, as futures contracts are traded in commodity exchanges with robust
clearing and settlement systems, farmers are assured of trade and payment guarantee
with no counterparty risk. In a nutshell, as the exchanges maintain neutrality, conflict of
interest is always avoided.
3.19.6 Higher Returns and Reduced Price Volatility
Futures in commodities help farmers not only in hedging their price exposure but
also in getting higher returns. Table 1.3 illustrates how futures trading helped wheat
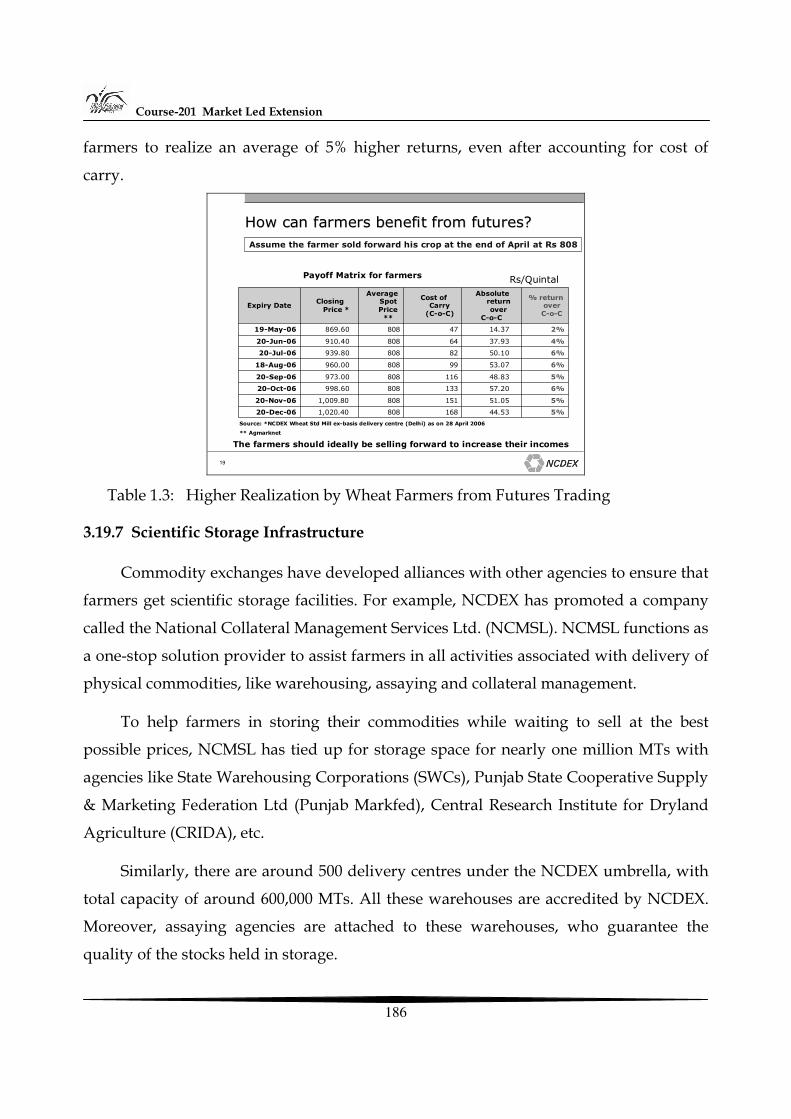
Course-201 Market Led Extension
186
farmers to realize an average of 5% higher returns, even after accounting for cost of
carry.
19
How can farmers benefit from futures?How can farmers benefit from futures?
Rs/Quintal
5%44.53 1688081,020.40 20-Dec-06
5%51.05 1518081,009.80 20-Nov-06
6%57.20 133808998.60 20-Oct-06
5%48.83 116808973.00 20-Sep-06
6%53.07 99808960.00 18-Aug-06
6%50.10 82808939.80 20-Jul-06
4%37.93 64808910.40 20-Jun-06
2%14.37 47808869.60 19-May-06
% return over C-o-C
Absolute return over
C-o-C
Cost of Carry
(C-o-C)
Average Spot Price
**
Closing Price *
Expiry Date
Source: *NCDEX Wheat Std Mill ex-basis delivery centre (Delhi) as on 28 April 2006
** Agmarknet
The farmers should ideally be selling forward to increase their incomes
Assume the farmer sold forward his crop at the end of April at Rs 808
Payoff Matrix for farmers
Table 1.3: Higher Realization by Wheat Farmers from Futures Trading
3.19.7 Scientific Storage Infrastructure
Commodity exchanges have developed alliances with other agencies to ensure that
farmers get scientific storage facilities. For example, NCDEX has promoted a company
called the National Collateral Management Services Ltd. (NCMSL). NCMSL functions as
a one-stop solution provider to assist farmers in all activities associated with delivery of
physical commodities, like warehousing, assaying and collateral management.
To help farmers in storing their commodities while waiting to sell at the best
possible prices, NCMSL has tied up for storage space for nearly one million MTs with
agencies like State Warehousing Corporations (SWCs), Punjab State Cooperative Supply
& Marketing Federation Ltd (Punjab Markfed), Central Research Institute for Dryland
Agriculture (CRIDA), etc.
Similarly, there are around 500 delivery centres under the NCDEX umbrella, with
total capacity of around 600,000 MTs. All these warehouses are accredited by NCDEX.
Moreover, assaying agencies are attached to these warehouses, who guarantee the
quality of the stocks held in storage.
Futures Trading and Commodity Marketing
187
3.19.8 Commodity Financing
Banks are generally not willing to lend against agricultural commodities held in
warehouses, since they are not sure of the quantity, quality, grades and shelf life of the
produce stored. Less than 1% of total bank credit is allocated for commodity finance.
This problem is expected to be overcome soon.
The chain of warehouses empanelled by NCMSL and other such companies are
accredited and assigned ratings, based on certain specific parameters, to ensure
standardization in their practices. Moreover, the goods kept in the warehouse are
examined prior to storage and certified by reputed assayers/certification agencies. The
details of certification are incorporated in the warehouse receipts.
Once the collateral management company certifies a warehouse receipt, the receipt
becomes a reliable marketable lending instrument for banks. The lending bank
consequently feels confident about the dependability of the produce stored in the
warehouse and is in a better position to extend loans to the farmer, that too at a lower
interest rate.
For example, NCMSL has made arrangements with ICICI Bank, HDFC Bank and
others for financing against commodities. A farmer can get an advance of about 70-75
percent of the current price of the commodity stored in the warehouse. During 2007,
loans worth Rs. 450 crore were facilitated by NCMSL.
3.20 Let us Sum Up
A commodity refers to any good, merchandise or produce of land that can be
bought and sold.
Organized commodity markets have existed in India for centuries. The more easily
understood markets are those that trade in agricultural commodities.
The physical market is the traditional market and is usually referred to as the “cash
and carry market” or the “spot market”. In this market, the seller agrees to deliver the
commodity and the buyer agrees to make the payment on the “spot”.
Course-201 Market Led Extension
188
Cash transactions in the physical market involve two types of contracts that require:
• Immediate delivery in the spot market • Delivery of a specific commodity to the buyer sometime in the future
The second type of contract that specifies delivery of a commodity to the buyer at a
future date is called a “cash forward contract”.
While the cash forward transactions have the advantage of being customized, they
have the following limitations:
• The contracts are private and negotiated bilaterally between two parties. Therefore, there are no exchange guarantees.
• The prices are not transparent as there is no reporting requirement. • There are no regulations for establishing market stability and protection of
market players. • Lack of standardization leads to illiquidity in the absence of a secondary market.
A forward contract is a bilateral agreement in which a buyer and a seller agree
upon the delivery of a specified quality and quantity of an asset on a specified future
date at a pre-determined price.
In India, organized trading in commodity derivatives started in 1875 with the
setting up of the Bombay Cotton Trade Association Ltd. In December 1952, the Forward
Contracts (Regulation) Act (FCRA) was enacted. This Act continues to regulate forward
contracts in commodities in the country. The Forward Markets Commission (FMC) was
set up in 1953 and functions under the Ministry of Consumer Affairs, Food and Public
Distribution. In due course, several exchanges and registered associations were set up to
trade in a range of commodities. However, during the 1960s, most of these exchanges
and associations became inactive because trading in futures and forwards of
commodities was either suspended or totally prohibited. After a long gap, the
Government started permitting futures trading to resume in 1990s. In 2003, the
Government issued comprehensive notifications and permitted futures trading in most
commodities. Due to apprehensions however that futures trading contributes to
Futures Trading and Commodity Marketing
189
inflation, futures trading in rice, wheat, urad and tur was temporarily suspended in
2007.
Futures contracts provide several benefits to market participants. These are:
• Price discovery and price dissemination • Price risk management • Price stability • Common platform for all traders • Low transaction costs • Absence of counter party credit risk • Lower credit risk • Liquidity
Course-201 Market Led Extension
190
Unit - 4
Crop Insurance
Structure
4.0 Objectives
4.1 Crop Insurance
4.2 Evolution
4.3 Approaches in Crop Insurance
4.4 Types of Insurance
4.5 Crop Insurance Products
4.6 New Crop Insurance Products
4.7 Let us sum up
4.0 Objectives
After going through this unit, you will be able to:
• Know the meaning and importance of crop insurance • Understand various crop insurance products • Explain the World Trade Organization regulations
4.1 Crop Insurance
In a country like India, where crop production has been subjected to vagaries of
weather and large-scale damages due to attack of pests and diseases, crop insurance
assumes a vital role in the stable growth of the sector. An All-Risk Comprehensive Crop
Insurance Scheme (CCIS) for major crops was introduced in 1985, coinciding with the
introduction of the Seventh-Five-year Plan and subsequently replaced by National
Agricultural Insurance Scheme (NAIS) w.e.f. 1999-2000. These Schemes have been
Crop Insurance
191
preceded by years of preparation, studies, planning, experiments and trials on a pilot
basis.
4.2 Evolution
The question of introduction of a crop insurance scheme was taken up for
examination soon after the Indian independence in 1947. Following an assurance given
in this regard by the Ministry of Food and Agriculture in the Central Legislature to
introduce crop and cattle insurance in the country, a special study was commissioned in
1947-48. The first aspect regarding the modalities of crop insurance considered was
whether the same should be on an Individual approach or on Homogenous area
approach.
4.3 Approaches in Crop Insurance
4.3.1 Individual Approach
The former seeks to indemnify the farmer to the full extent of the losses and the
premium to be paid by him is determined with reference to his own past yield and loss
experience. The 'individual approach' basis necessitates reliable and accurate data of
crop yields of individual farmers for a sufficiently long period, for fixation of premium
on actuarially sound basis.
4.3.2 Homogenous Area Approach
The 'homogenous area' approach envisages that in the absence of reliable data of
individual farmers and in view of the moral hazards involved in the 'individual
approach', a homogenous area comprising villages that are homogenous from the point
of view of crop production and whose annual variability of crop production would be
similar, would form the basic unit, instead of an individual farmer.
The 'homogenous area' approach even as varies, agro-climatically homogenous
areas treated as a single unit and the individual farmers in such cases pay the same rate
of premium and receive the same benefits, irrespective of their individual fortunes. The
Course-201 Market Led Extension
192
Ministry of Agriculture circulated the scheme, for adoption by the State governments,
but the States did not accept.
In 1965, the Government introduced a Crop Insurance Bill and circulated a model
scheme of crop insurance on compulsory basis to constituent State governments for
their views. The bill provided for the Central Government for framing a reinsurance
scheme to cover indemnity obligations of the States. However, none of the States was in
favour of the scheme because of very high financial obligations. On receiving the
reactions of the State governments, the subject was considered in detail by an Expert
Committee headed by the then Chairman, Agricultural Price Commission in July, 1970
for full examination of the economic, administrative, financial and actuarial implications
of the subject.
4.4 Types of Insurance
Crop insurance for major field crops comes in two types: yield-based coverage that
pays an indemnity (covers losses) for low yields; and revenue plans that insure a level of
crop income, based both on yields and the prices that determine a crop's value. Here are
features of the main ones. Descriptions of policies for fresh produce and pilot programs
are based on the USDA's Risk Management Agency (RMA).
4.4.1 Revenue Insurance Plans
Crop Revenue Coverage (CRC): CRC provides revenue protection based on
expected prices and yields by paying for losses below a guarantee purchased by the
grower. Losses are calculated using the higher of two prices, an early-season price or a
harvest price. The early-season price in the Midwest is the February average of
December corn and November soybean futures. CRC is used by growers who
aggressively sell those crops on spring rallies. The harvest price for both crops is now
determined by new crop futures in October.
4.4.2 Revenue Assurance (RA): RA provides dollar-denominated coverage by the
producer selecting a dollar amount of target revenue from a range defined by 65% to
Crop Insurance
193
75% of expected revenue. If you buy the Harvest Price Option (HPO) it becomes much
like CRC. RA with HPO has no upside limit on harvest price protection. CRC does. If
yields are average or above and prices don't rise, standard RA is your best value. CRC
or RA-HPO is a better value if yields are low and prices rise.
4.4.3 Group Revenue Insurance Policy (GRIP): GRIP makes indemnity payments
only when the average county revenue of the insured crop falls below the revenue
chosen by the farmer.
4.4.4 Income Protection (IP): IP protects against low gross income from low yield,
price or a combination.
4.4.5 Group Risk Plan (GRP): These policies use a country yield index to determine a
loss, instead of a grower's actual production history (APH). When the country yield for
the insured crop, as determined by the National Agricultural Statistics Service (NASS),
falls below the trigger level chosen by the farmer, an indemnity is paid. Yield levels are
available for up to 90% of the expected county yield. It's fairly simple to buy, but you'll
wait longer to be paid an indemnity on corn or soybean losses up to six months after
harvest due to delays in calculating county yields.
4.5 Crop Insurance Products
These crop insurance products account for by far the bulk of all crop insurance
written globally. There are two main types, damage-based and yield-based products
respectively. These are introduced below.
4.5.1 Damage-Based Insurance Products (e.g. Hail/Named-peril Products)
Insurance against crop losses from hail have been insured for more than 200 years.
This type of crop insurance still accounts for a considerable proportion of crop insurance
worldwide. Hail policies are based on a measure of the actual damage which results. It
usually provides coverage for the full crop value and there are in general deductibles of
8 per cent of sum insured per field apply, though higher deductibles can be agreed to
lower the premium. With the exception of a few countries (e.g. Italy and Canada), hail
Course-201 Market Led Extension
194
insurance is delivered successfully without subsidies by specialized private insurance
companies.Fire, crop hail, and named peril crop insurance products are the accident
insurance products for plant production. But they only cover a specific fraction of the
entire production risk.
The key features are:
• Damage resulting from the peril is localised; • Low degree of correlation of risk over a given area; • Sum insured is agreed when the policy is purchased; • Loss adjustment and eventual indemnity based on measurement of the
percentage of damage after the incidence of the loss event.
This type of insurance is not suitable for perils which can impact over wide areas (e.g.
drought, pest, disease).
4.5.2 Yield-Based Insurance Products
Multi-Peril Crop Insurance ( MPCI) Since 1985 Multi-peril crop insurance (MPCI)
has - due to increased Government subsidies - rapidly developed in the United States,
Canada, Spain, Portugal, and Israel, whilst in Argentina, Brazil, Mexico, and South
Africa no support or very limited public support is granted. MPCI products provide - in
general - a very wide coverage for crop yields with only very few risk exclusions and
typically carry relative high deductibles, varying between 15 per cent and 50 per cent of
the insured crop value. Banks very often securitize agriculture loans through crop
insurance. Farmers are requested to protect their future harvest with comprehensive
crop insurance policies, if loans for crop input cost have been granted. MPCI products
have the defining characteristic that insurance is geared to a level of expected yield,
rather to the damage that is measured after a defined loss event. Other features are:
• MPCI policies are suited to perils which their individual contribution to a crop
loss is difficult to measure; • Similarly these yield-based policies are suited to perils which impact over a
period of time;
Crop Insurance
195
• Establishing a farmer's yield history provides the basis for determining the percentage of shortfall after a loss event;
• The yield is measured at harvest; insured yield may typically be in the range of 50 to 70 percent of historic average yield;
• Yield shortfall may be determined on either an area or individual farmer basis.
However, the dynamic research and development of new methods of managing
risk through insurance mechanisms has lead to two fairly new products: (i) products
based on insuring a level of crop revenue, and (ii) products where insurable damage is
determined in the basis of an index derived from data external to the insured farm itself.
4.5.3 Crop-Revenue Insurance Products
This insurance product provides a new approach in agricultural insurance. This
approach defines the insurable interest as an income flow rather than as the intrinsic
value (or expected value) of the biological item at risk. This redefinition leads straight
away to the link between farm loans and insurance, since the servicing of interest and
principal payments on an agricultural loan depend on the flow of income produced.
Some crop insurance programmes have been administratively arranged so that the
insurance element is made a part of the loan, with the bank being the first recipient of
any indemnity paid by the insurer, while the premium is a working capital item that is
packaged with the loan itself. A more recent development is that some banks are
believed to be interested in direct coverage of portions of their loan portfolios, more
particularly for catastrophic losses following a systemic peril. The crop-revenue
insurance product combines production and price risk. The combination of production
and price gives the gross revenue of a given crop. Under normal supply/demand
conditions a production shortfall might be expected to result in a rise in price. To some
extent such a rise will cancel the financial loss for the grower who suffers a production
shortfall. But this will only be the case if the farmer harvest sufficient crop and sells it at
a price that is sufficient over the expected price.
Crop-revenue products are well-developed in North America, where their use is
facilitated by commodity markets being highly developed and by related information
Course-201 Market Led Extension
196
being reliable and readily available. In this connection it is important that the price
element of the policy be market based, that is, on futures prices for the coming season.
The extent to which crop-revenue products could be applied in Ukraine will
depend on the development of local crop futures markets, as well as on the availability
of the necessary local expertise. However, these changes are really only a matter of time.
Given the advantages to both grower and insurer, this type of insurance product is
likely to grow in importance, though for smaller crop areas, as with yield assurance, it
will always suffer from the problem of high administrative cost per unit of value.
4.5.4 Index-Based Insurance Products
In a classic crop insurance policy, evidence of damage to the crop or in the area of
the farm is needed before an indemnity is paid. However, verifying that such a damage
has occurred is expensive, and making an accurate measurement of the loss on each
individual insured farm is even more costly. With the index policy, a meteorological
measurement is used as the initiate the indemnity payments. These damaging weather
events might be, for example:
• A certain minimum temperature for a minimum period of time; • A certain amount of rainfall in a certain time period - this can be used for excess
rain and also for lack of rain (drought) cover.
With index based insurance, the classic insurance policy is replaced with a simple
coupon. This coupon is a monetary sum which becomes payable on certification that the
named weather event, of specified severity, has occurred. The face value of the coupon
may be standard, to be initiated once the weather event has taken place for the area
covered. Alternatively it could be graduated, with the value of the coupon then being
proportional to the severity of the event. Clearly this type of trigger operates over an
area, encompassing many insured farms. This product is suited to weather perils which
impact over a wide area (e.g. drought), but it cannot be used for certain perils, such as
hail, where the adverse event normally impacts on a very limited area of land.
Crop Insurance
197
Since there is no direct connection between a farming operation and the insurance
product, even those without crops at risk could theoretically purchase risk cover of this
type. This is not a disadvantage. On the contrary, there are many persons besides
farmers who stand to suffer financial losses from adverse weather events. Fishermen,
tourist operators, outdoor vendors are among the many categories making up the
potential clientele for index insurance products.
4.5.5 Project Complex Crop-Insurance
This insurance contract was designed to improve the contractual conditions of
current agro-insurances policies used in Ukraine as well as to increase farmer's access to
the agro-insurance market. The Spanish agro-insurances contracts, provided within the
Spanish Agro insurance System, were proved to be a suitable model for Ukraine.
In this proposed contract, all crops should be insured under three groups: a) winter
grain, b) sunflower and c) maize. The policy premium will be paid in two installments.
The contract allows modifications of the insured sum on the initial insured crops in case
some plots would not have been sown or not germinated and surfaced: winter sowing
cereals until the 15th of November; spring sowing cereals until 30th of April; sunflower
and maize until 1st of June. The yield or insurance productivity would be guaranteed in
a 70% over insured harvest. The yield is based on the average farm's yields in the last
five years (or the region average if farm data is not available). The contract includes
insurance rules and assets application.
An example of crop insurance premium is given below
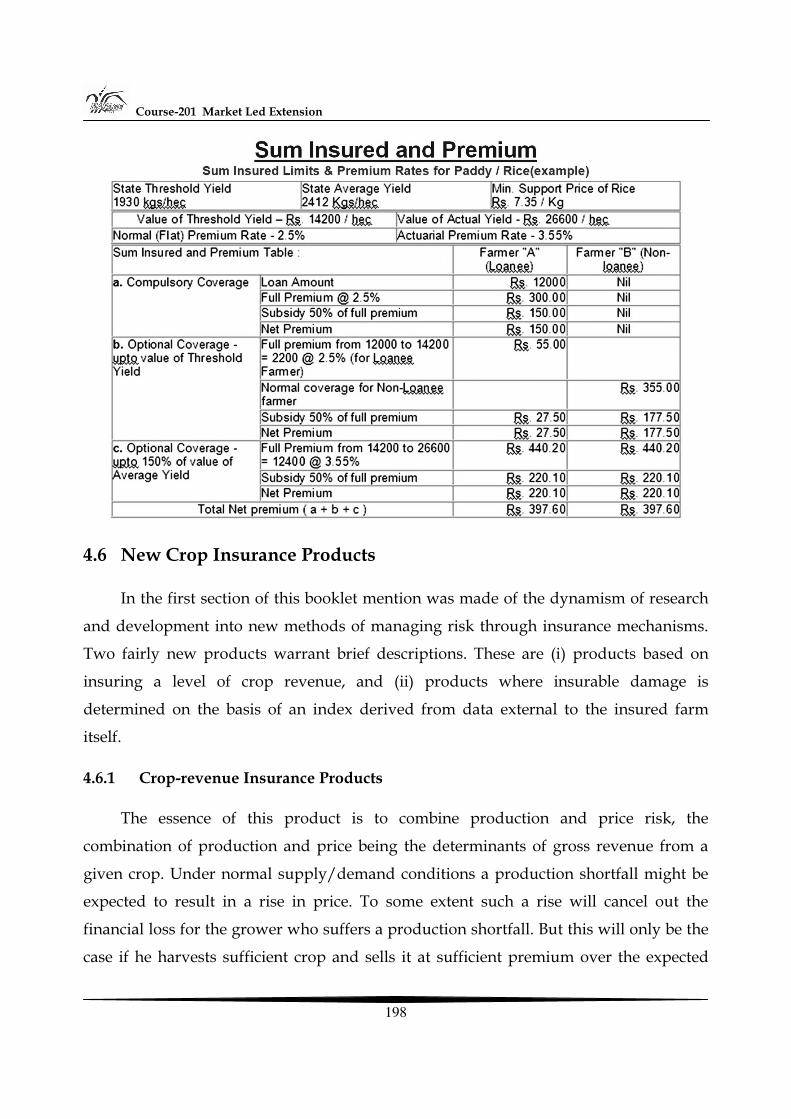
Course-201 Market Led Extension
198
4.6 New Crop Insurance Products
In the first section of this booklet mention was made of the dynamism of research
and development into new methods of managing risk through insurance mechanisms.
Two fairly new products warrant brief descriptions. These are (i) products based on
insuring a level of crop revenue, and (ii) products where insurable damage is
determined on the basis of an index derived from data external to the insured farm
itself.
4.6.1 Crop-revenue Insurance Products
The essence of this product is to combine production and price risk, the
combination of production and price being the determinants of gross revenue from a
given crop. Under normal supply/demand conditions a production shortfall might be
expected to result in a rise in price. To some extent such a rise will cancel out the
financial loss for the grower who suffers a production shortfall. But this will only be the
case if he harvests sufficient crop and sells it at sufficient premium over the expected
Crop Insurance
199
price. Crop-revenue insurance is designed to meet any remaining shortfall in revenue
from crop sales. Frequently, too, crop-revenue products involve the determination of
loss on an area basis, introducing important economies in the loss assessment process.
At present crop-revenue products are marketed mainly in North America, where
they first became available to all corn and soybean growers in Iowa and Nebraska in
1996.[13] Here their use is facilitated by commodity markets being highly developed and
by related information being reliable and readily available. In this connection it is
important that the price element of the policy be market based, that is, on futures prices
for the coming season. The alternative, to use some sort of target price, could lead to a
distortion of supply. Furthermore, it is unlikely that a crop revenue product based on a
target (i.e. non-market price) would find underwriting support.
Crop-revenue products have now (2002) spread beyond North America. The extent
to which they could apply to developing countries will depend on the development of
local crop futures markets, as well as on the availability of the necessary local expertise.
However, these changes are really only a matter of time. Given the advantages to the
grower and to the insurer, this type of insurance product is likely to grow in
importance, though for smaller crop areas, as with yield assurance, it will always suffer
from the problem of high administrative cost per unit of value.
The crop revenue approach follows from a new trend in agricultural insurance.
This is to define the insurable interest as an income stream rather than as the intrinsic
value (or expected value) of the biological item at risk. This redefinition leads readily to
a consideration of farm loan and insurance linkages, since the servicing of interest and
principal payments on an agricultural loan depend on the income stream produced. As
already noted, some crop insurance programmes have been administratively arranged
so that the insurance element is made a part of the loan, with the bank being the first
recipient of any indemnity paid by the insurer, while the premium is a working capital
item that is packaged with the loan itself.
A more recent development is that some banks are believed to be interested in
direct coverage of portions of their loan portfolios, more particularly for catastrophic
Course-201 Market Led Extension
200
losses following a systemic peril. At the time of writing this development must be noted
as an area where much future development is likely.
4.6.2 Index-based Insurance Products
The Concept
In a classic crop insurance policy, evidence of damage to the actual crop on the
farm, or in the area of the farm, is needed before an indemnity is paid. But verifying that
such damage has occurred is expensive, and making an accurate measurement of the
loss on each individual insured farm is even more costly.
An index (also known as ‘coupon’) policy operates differently. With an index
policy a meteorological measurement is used as the trigger for indemnity payments.
These damaging weather events might be:
• a certain minimum temperature for a minimum period of time; • a certain amount of rainfall in a certain time period - this can be used for excess
rain and also for lack of rain (drought) cover; • attainment of a certain wind speed - for hurricane insurance.
The classic insurance policy is replaced with a simple coupon. Instead of the usual
policy wording, which would give the indemnity, or range of indemnity levels, on say a
per hectare basis for a given crop, for losses from specific causes, the coupon merely
gives a monetary sum which becomes payable on certification that the named weather
event, of specified severity, has occurred. The face value of the coupon may be standard,
to be triggered once the weather event has taken place for the area covered.
Alternatively it could be graduated, with the value of the coupon then being
proportional to the severity of the event.
Clearly this type of trigger operates over an area, encompassing many insured
farms. Again, a trigger such as this cannot be used for certain perils, such as hail, where
the adverse event normally impacts on a very limited area of land. On the other hand, it
is suited to weather perils which impact over a wide area, for example drought. Since
there is no direct connection between a farming operation and the coupon, even those
Crop Insurance
201
without crops at risk could theoretically purchase risk cover of this type. This is not a
disadvantage. On the contrary, there are many persons besides farmers who stand to
suffer financial losses from adverse weather events. Fishermen, tourist operators,
outdoor vendors are among the many categories making up the potential clientele for
index insurance products.
Examples of Index Products
Index-based crop insurance is a very new product. It has only started recently in a
small way in a few parts of the developed world and it is still too early to be able to
report much useful experience.
Examples to date include index insurance against drought on pasture land in the
provinces of Alberta and Ontario, in Canada. Some preparatory work has been done for
another coupon scheme, for drought in Morocco. This exercise, funded by the World
Bank, is understood to be still at the stage of consideration by the Moroccan authorities
and by insurers.
Key Perils/Risks
A listing of key perils and risks for agriculture across the world would be long. For
the present purposes it is useful to focus on those which are of major concern to
developing countries. Further, they can be clustered into a number of groups. One such
clustering would produce a list as follows:
• Production risks • natural resource risks • financial risks • Marketing and price risks
Production and natural resource risks are relevant to this discussion of crop
insurance, and are discussed in greater detail below. Financial and marketing/price
risks fall outside the scope of the present publication, except in the case of crop/revenue
insurance products, as discussed above.
Course-201 Market Led Extension
202
Production Risk Perils
This is the main category of insurable risks. Both quantity and quality losses can
result. Perils included are:
• Adverse climate conditions: drought, excessive rain, flood, windstorm, frost, hail, sunburn, snow;
• pest and disease attack; • Fire.
These warrant separate discussion, under the headings below.
Drought
Drought is both a major concern of many developing countries, and the natural
weather event which causes most problems for insurers. The reasons for this are many.
Firstly, insurers feel most confidence when an adverse event has a clearly defined time
of impact, coupled with a clearly defined geographical area. The classic example is hail,
which may do its damage in a matter of a few minutes, or even seconds, and will
typically impact an area confined to a few hundred square metres up to a few square
kilometres. Hail damage is clearly attributable to the adverse weather event, and is
readily verified as such provided that a field inspection is undertaken.
By contrast drought has a vague beginning, its effects linger for a very long time,
and can extend over more than one growing season. Moreover it typically impacts a
very wide land area. Production loss caused by drought can be aggravated by the
incidence of other problems, e.g. diseases attacking plants weakened by water stress.
From a purely underwriting point of view drought poses great difficulties for a
standard crop insurer offering what is in effect a yield guarantee. Firstly, because
drought affects a large number of growers in the same season - perhaps the whole of a
country - the production losses are very large. This systemic or catastrophe exposure
means there are problems in mobilising sufficient insurance capacity to cover the sum at
risk, even with recourse to substantial reinsurance. Secondly, droughts in recent years,
at least in many parts of Africa, have tended to extend over more than one year. This
Crop Insurance
203
experience means that it is extremely hard for insurance companies to obtain
reinsurance for crop insurance portfolios which carry drought risk. Thirdly, the
magnitude of the risk in most developing countries means that actuarially calculated
premiums would be very high - too high perhaps to attract all but the most at-risk
growers. No insurer wants to build a portfolio based entirely on such a clientele.
For these reasons insurers are very wary of covering drought as an inclusion in
standard crop insurance policies. This is particularly the case in those parts of the
developing world where drought is the major weather constraint to crop production:
Southern and Eastern Africa, Sahelian Africa, Horn of Africa, North Africa/Near East,
Eastern Europe, Central and East Asia, South Asia, Central and South America. The list
illustrates the key role which drought plays in the lives of much of the developing
world’s rural population.
Given the almost insurmountable problems involved in including drought in
standard crop insurance policies for developing areas, attention in recent years has
turned to examining whether index (coupon) policies could provide a useful measure of
security. Initial developmental work in this field is promising.
As described in Section 2.5.2 above, index insurance involves using a
meteorological measurement as the trigger for indemnity payments. In the case of an
index policy covering drought, the most likely form would be a series of indemnity
steps, each step corresponding to a given level of rainfall deficit. The assumption is that
growers could select a level of indemnity suited to individual circumstances. Thus the
indemnity payable would increase as the rainfall shortfall increased from a defined
“drought trigger” amount. At the time of writing, index policies covering drought or
other climate risks cannot be described as being a standard product for developing
countries. Rather they are in the nature of a promising new insurance technique,
attracting much interest among risk management professionals.
Course-201 Market Led Extension
204
Excessive rain
Crops need water, and much of the developing world’s arable and horticultural
production relies on rainfall. Too much rain at any time can damage a crop, but there
are periods of special vulnerability, described below.
The first danger point is excessive rain just after germination and emergence.
Entire crops can be washed out of the ground, necessitating resowing. This is an
insurable risk, where the indemnity which would be written into the policy would be
the costs of re-sowing, plus a possible additional amount in those cropping situations
(common in tropical, rainfed agriculture) where a delay in sowing means that the
eventual harvested crop is smaller than would have been the case had the crop been
able to take advantage of the whole of the normal growing season.
The next common point of vulnerability is at or near to harvest. Maize and other
grains can sprout prematurely while still growing in the field. Various fruits (e.g.
cherries) can be damaged by excessive rain or even any rain just prior to harvest. Other
crops can be lost when excessive rain prevents harvest. An example is a crop such as
tomatoes grown for processing. The processing factory schedule of crops for harvesting
means that the date of harvest is fixed. Moreover, it is now common practice with
commercial tomato crops to spray with ethrel (telephone) in order to accelerate the
ripening (reddening) of fruit which are still green, in order to allow once-over
harvesting. If excessive rainfall is experienced just when the critical readiness for harvest
is achieved, then harvest may be prevented, and the crop lost.
Flood
Flood damage may be due to on-site excessive rainfall, but it can also be caused by
excessive precipitation elsewhere, and the subsequent rise of river and lake levels, to
cause flooding of crop land. The risk is usually insurable. Exceptions would be crop
land which is insufficiently drained or where existing drains are not maintained, and
also flood plains exposed to a very high risk of flooding.
Crop Insurance
205
Flood is sometimes one of the results of severe storms. Examples are the frequent
tropical cyclones experienced in the Bay of Bengal. These usually cause flooding of low-
lying farmland along the affected coastal zone. Records indicate that although the
fundamental peril is windstorm, the actual losses on farms - to livestock as well as to
crops, have been due to flood damage resulting in turn from wind-induced high sea
levels, which are known as storm surges.
Windstorm
Crop insurance programmes in the Windward Islands (bananas) and in Mauritius
(sugar cane) have already been mentioned. Both were set up to assist in managing the
losses from excessive wind - cyclones in Mauritius and hurricanes in the Caribbean.
High wind speeds affects nearly all crops - and can cause serious damage in forests. As
with other weather perils, the first move in risk management lies in appropriate farm
management - correct attention to plant density (for mutual support), to the provision of
shelter belts for those crops highly sensitive to wind (e.g. kiwifruit), and care with
harvesting in the case of forests. It is not uncommon for problems to arise when partial
harvesting takes place in forests. Those trees that are too immature to harvest are
suddenly exposed, and may be blown over by high winds.
In writing wind-storm insurance, insurers take these sorts of management
practices into account. They make certain that it is only exceptional events that will
trigger the insurance, when normal practices are insufficient to prevent damage.
Windstorm is associated with catastrophic losses to life and property, as well as to
crops. Hurricane Andrew, one of the most destructive storms ever recorded, hit Florida
and Louisiana on 25 August, 1992. Storms of this magnitude, and lesser but still serious
weather events of this nature are believed to be increasing in frequency.
Frost
Although not at all common in developing countries generally, there are some
regions where this is an occasional risk, especially to vegetable and fruit crops. This
applies especially to Eastern Europe and the Middle East. Frost causes damage by the
Course-201 Market Led Extension
206
freezing of the water content of plant cells, and their subsequent rupture. It will be
evident that it is not only the temperature which matters; it is also the time when the
temperature is below a certain minimum level which causes a damaging event. Crop
insurers write policies accordingly, sometimes constructing a damage point (i.e.
insurance trigger) curve which plots temperature against time.
Frost conditions can impact a wide area, causing extensive damage. However, the
micro-climate in a given site can increase the likelihood of frost damage. For example,
fruit and vegetable production often takes place in valleys because of the presence of
deep topsoil, washed down from surrounding hills, together with the availability of
water from surface or groundwater sources. These same valleys can also be ‘frost-
pockets’ because freezing, still air accumulates readily in this type of topography.Again,
an insurer may expect growers to take normal precautions against frost damage,
through the use of devices to move the air (burning frost pots as commonly used in
Eastern Europe, propellers mounted on towers, as being introduced in some of the
fertile fruit growing valleys in Syria). Perhaps the most effective preventative of frost
damage for horticultural crops especially is the use of sprinkler irrigation.
It will be clear to the reader that all of these measures involve a cost. Design of an
insurance policy to respond to frost damage will take into account the inevitable trade-
off between the costs of physical and financial measures of managing the risk. Usually
the most cost-effective approach is a blend of the two, with insurance acting as a final
safety net, to be triggered if the physical devices fail to prevent damage.
Hail
Hail holds a special place in the history and also the current practice of crop
insurance. It was the first crop peril to be insured by a modern insurance company - the
first policies being issued, in Germany, in 1791. It is also the simplest of weather perils to
handle from an insurance point of view. Its incidence is readily confirmed by
observation of damage, and compensatory growth factors are reasonably well
understood for most major insured crops (see also under Loss Assessment below).
Crop Insurance
207
Moreover, over time, the likelihood of hail events in any given agricultural area
can be estimated in a manner that permits actuaries to confidently set premium levels at
values which both sides, insured and insurer, find reasonable. This is due also to its long
history, and the manner by which records of damage have been prepared and retained
over the years. This means that there is a wealth of data on the incidence of the peril,
and of the crop damage which has been caused as a result.Again, when hail strikes it is
usually very confined in terms of the damage zone. This can be just a few square metres,
a few hundred square metres, or, more rarely a few square kilometres. It is seldom
larger than this.
There is little that a grower can do against hail damage. Lengthy research has
proven that injecting hail clouds with silver iodide via rockets or planes is not very
effective. Areas with very high hail exposure and expensive crops can resort to hail nets.
Sunburn (sunscald)
Sunscald, under exceptionally adverse conditions, causes damage to fruits such as
pip and stone fruit, grapes and nuts. It is associated with the premature loss of foliage
from the plant. The risk is insurable, often as an extra-cost option under multi-risk
policies.
Snow
Snow can damage all types of crops, including fruit trees and it also a peril of note
in forests, where excessive weight loading can cause breakage of parts of trees, or even
toppling of the whole tree. Developing countries vulnerable include those in Central
Asia, Eastern Europe and the Middle East regions. Snow is an insurable peril in many
circumstances. In forests damaged by breakage through snow loading, the presence of
broken tree parts can facilitate the build up of pest and disease organisms.
Course-201 Market Led Extension
208
Pest and disease attack
Insurance cannot substitute for sound management of the risk of pests, parasites
and diseases. Indeed, this is a significant area of modern farm and forest management,
with very substantial losses resulting from failures in this area.
Moreover the growing importance of international trade in agricultural commodities
impacts on the pest and disease issue in developing country farming in several ways:
• Phytosanitary regulations mean that any evidence of pest or disease in a consignment may disqualify produce from entry to the country of destination;
• similarly, pesticide residues are subject to very tight limits under the standards for international trade;
• Competition in the market is fierce, and even if produce is allowed to enter, blemishes on fruit etc. mean the produce is unlikely to find a buyer.
Insurance implications can similarly be summarised in a brief list:
• It is sometimes possible for growers to obtain cover against pests and diseases where there is no generally accepted management control;
• in an attempt to reduce the adverse environmental impact of some well-established chemical spray routines for pest and disease control (e.g. certain chlorinated hydrocarbons) alternative, benign regimes have been developed. Insurance may be utilised in the future in order to provide temporary risk assurance to growers using the new routines;
• Frequently damage to fruit and other crop products provides an entry point for disease organisms. Perforation of the skin due to hail damage is a common example. In this case any hail policy needs to be clear as to whether the consequential loss from disease is also covered.
Fire
One of the oldest perils to be covered in property insurance, fire is a major peril for
many crops (especially broad field crops such as grains) and for virtually all forests. It is
commonly included in multi-peril crop insurance, and is frequently the key peril under
forestry covers (which may also include wind and snow damage).
Crop Insurance
209
Fires are caused by human action (and carelessness) and also by lightning strikes
during electrical storms. Whatever the cause, there are control measures to reduce any
losses. These may be through early detection and the subsequent means to take action
and/or through the use of cleared firebreaks. Insurance policies will normally state the
expectations under the policy of the means to control fire losses. Again this is an
example of insurance being just a part of a cluster of measures used to control risk.
Natural Resource Risks
These include:
• Adverse soil conditions, e.g. salinity, erosion of topsoil and loss of soil nutrients; • deterioration in water quality e.g. due to pollution of the water table or natural
water courses; • Lack of water from the irrigation source.
In the main these risks are best addressed by farm management practices.
However, some of the underlying causes of these problems may themselves be
insurable. For example, soil erosion may follow excessive rainfall and/or wind.
Pollution of water may be beyond the control of the farmer drawing from wells or
rivers.
Related to this is the risk that a water source used for irrigation may fail. Prolonged
drought means that water tables fall, necessitating the boring of deeper wells. Similarly
rivers and streams can dry up, due again to drought, or to an increase in uptake of
water upstream. Where this involves another country then this falls into the political
risk zone, something that many insurance policies specifically exclude.
Which Crops can be insured?
Benefit/cost issues
As with most assets or production processes, virtually any crop can be insured,
against virtually any peril, but only at a price. At the time of writing, with squeezed
profit margins on the production of many crop commodities, a paradoxical situation
Course-201 Market Led Extension
210
arises. The tight margins highlight the need for risk management, including insurance,
but also reduce the ability of growers to buy the desired level of protection.
The discussion below will focus on four main groups of crops, annual field crops,
perennial crops (including horticultural tree crops), glasshouse crops and finally, forests.
The focus will be on identifying those areas of risk which the nature of the crop, and of
its common perils, could predispose it for insurance as part of a risk management
strategy. In this discussion, ‘crop insurance’ relates to the various types of contract
which make up the more traditional type of cover, as opposed to index policies. With
the latter, the nature of the crop is not an issue, since the insurance contract relates just
to a given weather event.
Insurance of crops and forests involves insurance of an expected future value. This
sets this type of insurance apart from other property covers (e.g. motor vehicle,
buildings, machinery) when the value (frequently maximum value) exists at the
commencement of the insurance.One of the factors which can determine whether or not
a particular crop/peril combination is suitable for insurance is the ease and economy by
which losses can be satisfactorily assessed. This will be touched on below, with some of
the more general loss assessment issues discussed in greater detail under the section,
Loss Assessment.
Annual field crops
Wheat, maize, rice, soybeans, sorghums, cotton, beans etc. are all insured in
various parts of the world. As annuals, any loss or damage is just to one season’s crop -
unlike for perennial crops and forests. This simplifies loss assessment, in contrast with
the situation of Perennial Crops, taken up below. As a general rule, the more
commercial the nature of the crop, the greater will be both the potential demand for
insurance, and the likelihood of a cost-effective role for crop insurance in risk
management. Crops of the high value input - high value output variety are often
financed with the assistance of banks, and lenders increasingly insist on insurance
coverage, when this is available.
Crop Insurance
211
Another important issue in commercial crop production is the marketing chain.
With crops such as sugar cane, coffee, tea and cotton, virtually all of the harvested
production enters the commercial market, and requires processing. This means that
there is control over quantities produced, year after year, together with an opportunity
for establishing a strong database of producers and of details of production enterprises.
Information management of this sort is vital to creating the climate of confidence
necessary for efficient and economical insurance transactions. It will be evident from the
above that food crops, especially those for which there is an active, unrecorded local
market, are difficult to trace after harvest. This means that insurance assessments are
similarly difficult for this type of crop.
Perennial crops
Perennial crops pose a special problem. In the event of a loss event, should the loss
be calculated solely on the basis of the current season’s expected production, or should
reduced production levels for the next season(s) be included? The difficulty of making
accurate assessments for future years will be evident, and crop insurers in Chile and
Cyprus, for example, include only the current season’s lost production.
On the other hand, when a peril such as windstorm causes serious damage to tree
crops such as oil palm, coconut, rubber, and mango or to temperate fruit crops such as
pip and stone fruit, growers naturally expect the longer term loss to be indemnified.
Technically, when losses are severe, it is possible to make assessments. These could even
include the costs of replanting and/or regrafting. Paradoxically, the problem is greater
when the damage to the wooded parts of the plants is less severe, but still sufficiently
serious to mean a diminution in the following season’s crop. In such cases the approach
taken by Chile and Cyprus appear to be appropriate. An alternative is to formulate
wording such that fruit and trees are separate parts of the same policy. This is done in
the British Columbia Ministry of Agriculture crop insurance programme.
Course-201 Market Led Extension
212
Glasshouse crops
Crops grown under glass, plastic or other coverings generally fall into the “high
value input - high value output” category. As such, risk management planning is very
important, since loss of the crop and/or the structures can mean a heavy financial blow.
In fact in those countries where glasshouse and plastic house cultivation is important,
insurance is usually an integral part of the production financial plan, and the potential
liability for insurers is very substantial. Sometimes insurers offer policies which cover
the structure together with the growing crop. Generally these also specify minimum
standards for construction and the materials used in the structure.
Forests
The economic role of forests is undergoing a partial change. This change affects
risk management, and also insurance as part of risk management. The transition of
national economies from a commodity to a service orientation, and stream of products,
also affects forestry. This is because a forest today is not just a source of timber, for
paper, for building and for furniture, but is also a provider of environmental services.
Increasingly it is becoming possible for forest owners to generate income from the sale
of carbon credits. This opens up forestry to a new, more commercially oriented class of
investor, and this change will affect developing and developed countries similarly.
A further change is the move towards the certification of forests as
environmentally sound entities, under some sort of recognised certification system. The
implications for forest managers are twofold. Firstly, such certification opens up access
to markets which will only accept timber from forests certified as being sustainably
managed. Secondly, when insurance is involved, such certification, since it is based on
the achievement of a high standard of management, including risk management, could
lead to substantial reductions in insurance premiums.
The major risks to forests, namely fire and windstorm, will affect virtually all
species of timber trees, although some are more at risk than others. For example, in
recent years there have been extensive commercial plantings, in many parts of the word,
Crop Insurance
213
of various types of Eucalyptus species. This tree type is popular because it is very fast
growing and has considerable drought resistance. However, it also has a high content of
oily, volatile sap, meaning that it burns readily.When forests are insured against fire risk
then considerable attention is given to management procedures to reduce the
possibilities of loss in the event of a fire outbreak. Some of these points have been made
above, under the heading, Fire.
In summary, the changes to the forestry scene, worldwide, mean greater
commercialisation of tree cultivation, and therefore greater opportunities for
introducing insurance as a risk management device.
Weather based Crop Insurance
Weather Based Crop Insurance aims to mitigate the hardship of the insured
farmers against the likelihood of financial loss on account of anticipated crop loss
resulting from incidence of adverse conditions of weather parameters like rainfall,
temperature, frost, humidity etc.
Weather Insurance different from crop insurance
While Crop Insurance specifically indemnifies the cultivator against shortfall in
crop yield, Weather based Crop Insurance is based on the fact that weather conditions
affect crop production even when a cultivator has taken all the care to ensure good
harvest. Historical correlation studies of crop yield with weather parameters help us in
developing weather thresholds (triggers) beyond which crop starts getting affected
adversely. Payout structures are developed to compensate cultivators to the extent of
losses deemed to have been suffered by them using the weather triggers. In other
words, Weather based Crop Insurance uses weather parameters as 'proxy' for crop
yields in compensating the cultivators for deemed crop losses.
Weather Insurance has been piloted in the country since Kharif 2003 season. Some
of the States where it's piloted are Andhra Pradesh, Chattisgarh, Gujarat, Haryana,
Karnataka, Madhya Pradesh, Maharashtra, Punjab, Rajasthan etc.
Course-201 Market Led Extension
214
Comparison between National Agricultural Insurance Scheme (NAIS) and
Weather Based Crop Insurance Scheme (WBCIS)
S.No. National Agricultural Insurance Scheme (NAIS)
Weather Based Crop Insurance Scheme (WBCIS)
1 Practically all risks covered(drought, excess rainfall, flood, hail, pest infestation, etc.)
Parametric weather related risks like rainfall, frost, heat (temperature), humidity etc.) are covered. However, these parametric weather parameters appear to account for majority of crop losses
2 Easy-to-design if historical yield data upto 10 years' is available
Technical challenges in designing weather indices and also correlating weather indices with yield losses. Needs upto 25 years' historical weather data
3 High basis risk [difference between the yield of the Area (Block I Tehsil) and the individual farmers]
Basis risk with regard to weather couldbe high for rainfall and moderate for others like frost, heat, humidity etc.
4 Objectivity and trans[parencyis relatively less
Objectivity and transparency is relatively high
5 Quality losses are beyondconsideration
Quality losses to some extent gets reflected through weather index
6 High loss assessment costs(crop cutting experiments)
No loss assessment costs
7 Delays in claims settlement Faster claims settlement 8 Government's financial
liabilities are open ended, as it supports the claims subsidy
Government's financial liabilities couldbe budgeted up-front and close ended, asit supports the premium subsidy
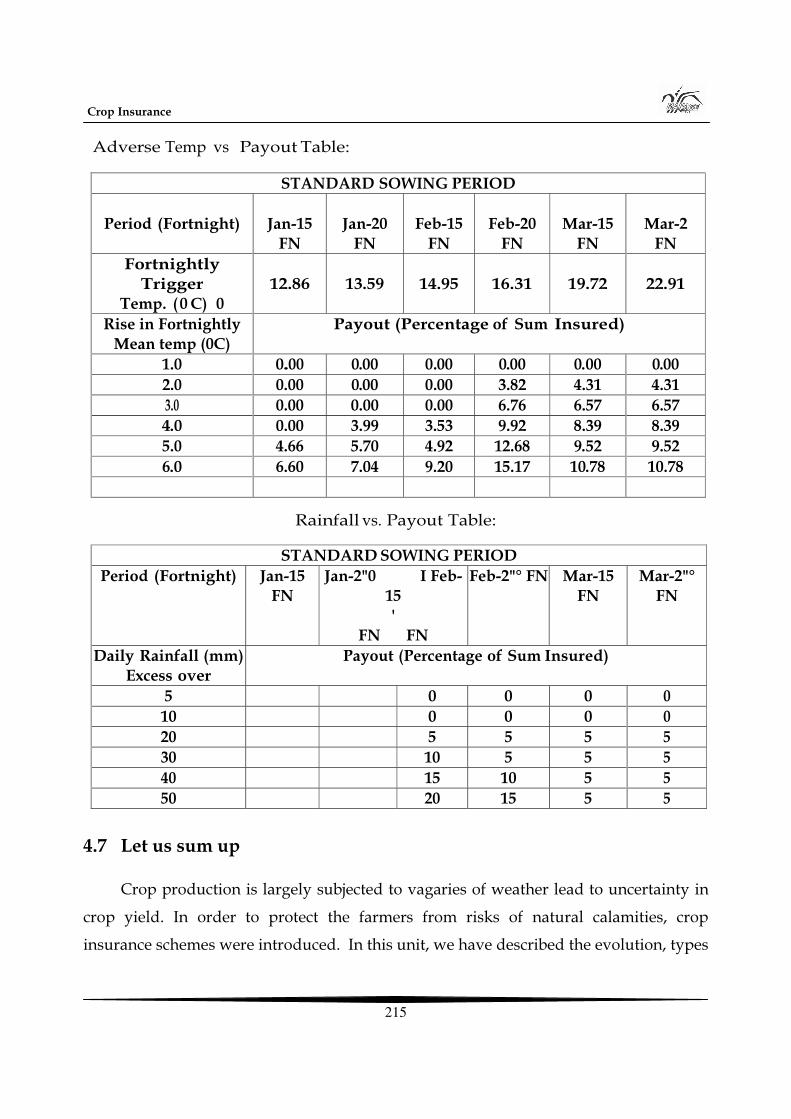
Crop Insurance
215
Adverse Temp vs Payout Table:
STANDARD SOWING PERIOD
Period (Fortnight)
Jan-15 FN
Jan-20
FN
Feb-15
FN
Feb-20
FN
Mar-15
FN
Mar-2
FN Fortnightly
Trigger Temp. ( 0 C) 0
12.86
13.59
14.95
16.31
19.72
22.91
Rise in Fortnightly Mean temp (0C)
Payout (Percentage of Sum Insured)
1.0 0.00 0.00 0.00 0.00 0.00 0.00 2.0 0.00 0.00 0.00 3.82 4.31 4.31 3.0 0.00 0.00 0.00 6.76 6.57 6.57 4.0 0.00 3.99 3.53 9.92 8.39 8.39 5.0 4.66 5.70 4.92 12.68 9.52 9.52 6.0 6.60 7.04 9.20 15.17 10.78 10.78
Rainfall vs. Payout Table:
STANDARD SOWING PERIOD Period (Fortnight) Jan-15
FN Jan-2"0 I Feb-
15 '
FN FN
Feb-2"° FN Mar-15 FN
Mar-2"° FN
Daily Rainfall (mm)Excess over
Payout (Percentage of Sum Insured)
5 0 0 0 0 10 0 0 0 0 20 5 5 5 5 30 10 5 5 5 40 15 10 5 5 50 20 15 5 5
4.7 Let us sum up
Crop production is largely subjected to vagaries of weather lead to uncertainty in
crop yield. In order to protect the farmers from risks of natural calamities, crop
insurance schemes were introduced. In this unit, we have described the evolution, types
Course-201 Market Led Extension
216
of insurance and various crop insurance products. We have seen the several types of
uncertainties by which government can facilitate the crop insurance. As an extension
functionary we have to empower the farmers to avail the facility of insurance scheme.
So that the production risks of farmers can be avoided to certain extent.
WTO and its Implications on Agriculture
217
Unit – 5
WTO and its Implications on Agriculture
Structure 5.0 Objectives
5.1 Introduction
5.2 World Trade Organization (WTO)
5.3 WTO Agreements
5.4 Agreement on Agriculture (AoA)
5.5 Implications on Agriculture
5.6 WTO and Indian Experience
5.7 Impact of WTO
5.8 Conclusion
5.9 Abbreviations
5.0 Objectives
After going through this unit, you will be able to:
• Introduce the readers about the WTO and its role in International trade • Functions and principles of WTO • Implications for Agriculture and • Sensitization of readers on impact of WTO on Indian Agriculture
5.1 Introduction
The WTO came in being in 1995. The WTO is the successor to GATT established in
1948.The WTO deals with the rules of trade between nations at a global or near-global
level. The WTO has a larger membership than GATT, and covers more subjects.
Nevertheless, it was GATT that established, multilaterally, the principles underlying the
Course-201 Market Led Extension
218
trading system. The WTO is both an institution and a set of rules, called the “WTO law”.
All the 151 WTO members are required to implement these rules, and to provide other
members with the specific trade benefits to which they have committed themselves.
The main body of WTO law is composed of over sixty individual agreements and
decisions. All of these are overseen by councils and committees at the WTO’s
headquarters in Geneva; the WTO doesn’t have any local or regional offices. Large-scale
negotiations, like the Doha Round, require their own special negotiating forum. WTO
members meet at the ministerial level at least once in two years
5.1 World Trade Organization (WTO)
5.1.1 Origin of WTO
The GATT was the only multilateral instrument governing international trade
from 1948 until the WTO was established in 1995. Despite attempts in the mid 1950s and
1960s to create some form of institutional mechanism for international trade, the GATT
continued to operate for almost half a century as a semi-institutionalized multilateral
treaty regime on a provisional basis. Seven rounds of negotiations occurred under the
GATT. The first GATT trade rounds concentrated on further reducing tariffs. The
second round(Kennedy Round) in the mid-sixties brought about a GATT anti-dumping
Agreement and a section on development. The Tokyo Round during the seventies was
the first major attempt to tackle trade barriers that do not take the form of tariffs, and to
improve the system, adopting a series of agreements on non-tariff barriers, which in
some cases interpreted existing GATT rules, and in others broke entirely new ground.
Because these plurilateral agreements were not accepted by the full GATT membership,
they were often informally called "codes". Several of these codes were amended in the
Uruguay Round, and turned into multilateral commitments accepted by all WTO
members. Only four remained plurilateral (those on government procurement, bovine
meat, civil aircraft and dairy products), but in 1997 WTO members agreed to terminate
the bovine meat and dairy agreements, leaving only two.
WTO and its Implications on Agriculture
219
The GATT still exists as the WTO's umbrella treaty for trade in goods, updated as a
result of the Uruguay Round negotiations. The GATT 1994 is not however the only
legally binding agreement included in the Final Act; a long list of about 60 agreements,
annexes, decisions and understandings was adopted. The agreements fall into a
structure with six main parts:
• The Agreement Establishing the WTO • Goods and investment — the Multilateral Agreements on Trade in Goods
including the GATT 1994 and the Trade Related Investment Measures • Services — the General Agreement on Trade in Services • Intellectual property — the Agreement on Trade-Related Aspects of Intellectual
Property Rights (TRIPS) • Dispute settlement (DSU) • Reviews of governments' trade policies (TPRM)
5.1.1 Functions and Principles
5.2.2.1 Functions of WTO
The WTO's goal is to improve the welfare of the peoples of its member countries,
specifically by lowering trade barriers and providing a platform for negotiation of trade.
The WTO overriding objective is to help trade flow smoothly, freely, fairly and
predictably. Its main mission is "to ensure that trade flows as smoothly, predictably and
freely as possible". This main mission is further specified in certain core functions
serving and safeguarding five fundamental principles, which are the foundation of the
multilateral trading system.
Among the various functions of the WTO, these are regarded by analysts as the
most important:
• It oversees the implementation, administration and operation of the covered agreements.
• It provides a forum for negotiations and for settling disputes. • To review the national trade policies, and to ensure the coherence and
transparency of trade policies through surveillance in global economic policy-making.
Course-201 Market Led Extension
220
• Assistance to least-developed and low-income countries in transition to adjust to WTO rules and disciplines through technical cooperation and training.
• To act as a center of economic research and analysis • To cooperate closely with the IMF and the World Bank.
5.2.2.2 Principles of the trading system
The WTO establishes a framework for trade policies; it does not define or specify
outcomes. That is, it is concerned with setting the rules of the trade policy games. Five
principles are of particular importance in understanding both the pre-1994 GATT and
the WTO:
• Non-Discrimination. It has two major components: the most favoured nation (MFN) rule, and the national treatment policy. Under the WTO agreement countries cannot normally descriminate between their trading practices. This principle is known as MFN. National treatment means that imported and locally-produced goods should be treated equally and was introduced to tackle non-tariff barriers to trade.
• Reciprocity. It reflects both a desire to limit the scope of free-riding that may arise because of the MFN rule, and a desire to obtain better access to foreign markets. A related point is that for a nation to negotiate, it is necessary that the gain from doing so be greater than the gain available from unilateral liberalization; reciprocal concessions intend to ensure that such gains will materialize.
• Binding and enforceable commitments. The tariff commitments made by WTO members in a multilateral trade negotiation and on accession are enumerated in schedules (list) of concessions. These schedules establish "ceiling bindings": a country can change its bindings, but only after negotiating with its trading partners, which could mean compensating them for loss of trade. If satisfaction is not obtained, the complaining country may invoke the WTO dispute settlement procedures.
• Transparency. The WTO members are required to publish their trade regulations, to maintain institutions allowing for the review of administrative decisions affecting trade, to respond to requests for information by other members, and to notify changes in trade policies to the WTO. These internal transparency requirements are supplemented and facilitated by periodic country-
WTO and its Implications on Agriculture
221
specific reports (trade policy reviews) through the Trade Policy Review Mechanism (TPRM). The WTO system also tries to improve predictability and stability, discouraging the use of quotas and other measures to set limits on quantities of imports.
• Safety valves. In specific circumstances, governments are able to restrict trade. There are three types of provisions in this direction: allowing the use of trade measures to attain noneconomical objectives; ensuring "fair competition"; and permitting intervention in trade.
5.2.3 Formal Structure (Organisation)
According to WTO rules, all WTO members may participate in all councils,
committees, etc., except the Appellate Body, Dispute Settlement panels, and plurilateral
committees.
Highest Authority: The Ministerial Conference
The WTO is ruled by its member governments. All major decisions are made by
the membership as a whole either by Ministry or by their ambassadors or delegates.
The topmost decision-making body of the WTO is the Ministerial Conference, which has
to meet at least every two years. It brings together all members of the WTO, all of which
are countries or separate customs territories. The Ministerial Conference can make
decisions on all matters under any of the multilateral trade agreements.
Second level: General Council
The daily work of the ministerial conference is handled by three groups: the
General Council, the Dispute Settlement Body, and the Trade Policy Review Body. All
three consist of the same membership — representatives of all WTO members — but
each meet under different rules.
1. The General Council, the WTO’s highest-level decision-making body in Geneva, meets regularly to carry out the functions of the WTO. It has representatives (usually ambassadors or equivalent) from all member governments and has the authority to act on behalf of the ministerial
Course-201 Market Led Extension
222
conference which meets every two years. The council acts on behalf on the Ministerial Council on the entire WTO affairs.
2. The Dispute Settlement Body is made up of all member governments, usually represented by ambassadors or equivalent.
3. The Trade Policy Review Body (TPRB) to undertake trade policy reviews of Members under the TRPM. The TPRB is open to all WTO Members.
Third level: Councils for Trade
The Councils for Trade work under the General Council. There are three councils
— Council for Trade in Goods, Council for Trade-Related Aspects of Intellectual
Property Rights, and Council for Trade in Services — working in different fields. Apart
from these three councils, six other bodies report to the General Council reporting on
issues such as trade and development, the environment, regional trading arrangements
and administrative issues
1. Council for Trade in Goods — The workings of the General Agreement on Tariffs and Trade (GATT) which covers international trade in goods, is the responsibility of the Council for Trade in Goods. It is made up of representatives of all WTO member countries.
2. Council for Trade-Related Aspects of Intellectual Property Rights — Information on intellectual property in the WTO, news and official records of the activities of the TRIPS Council, and details of the WTO’s work with other international organizations in the field.
3. Council for Trade in Services — Council for Trade in Services operates under the guidance of the General Council and is responsible for overseeing the functioning of the General Agreement on Trade in Services (GATS). It is open to all WTO members, and can create subsidiary bodies as required.
Fourth level: Subsidiary Bodies
There are subsidiary bodies under each of the three councils.
1. The Goods Council — subsidiary under the Council for Trade in Goods. It has 11 committees consisting of all member countries, dealing with specific subjects such as agriculture, market access, subsidies, anti-dumping measures and so on. Committees include the following:
WTO and its Implications on Agriculture
223
• Information Technology Agreement (ITA) Committee • State Trading Enterprises • Textiles Monitoring Body — consists of a chairman and 10 members acting
under it. • Groups dealing with notifications — process by which governments inform
the WTO about new policies and measures in their countries. 2. The Services Council — subsidiary under the Council for Trade in Services which
deals with financial services, domestic regulations and other specific commitments.
3. Dispute Settlement panels and Appellate Body- subsidiary under the Dispute Settlement Body to resolve disputes and the Appellate Body to deal with appeals.
Other committees
• Committees on Trade and Environment o Trade and Development (Subcommittee on Least-Developed Countries) o Regional Trade Agreements o Balance of Payments Restrictions o Budget, Finance and Administration
• Working parties on • Accession
• Working groups on o Trade, debt and finance o Trade and technology transfer
The WTO operates on a one country, one vote system, but actual votes have never
been taken. Decisionmaking is generally by consensus, and relative market size is the
primary source of bargaining power. The advantage of consensus decision-making is
that it encourages efforts to find the most widely acceptable decision. Main
disadvantages include large time requirements and many rounds of negotiation to
develop a consensus decision, and the tendency for final agreements to use ambiguous
language on contentious points that makes future interpretation of treaties difficult.
In reality, WTO negotiations proceed not by consensus of all members, but by a
process of informal negotiations between small groups of countries. Such negotiations
Course-201 Market Led Extension
224
are often called "Green Room" negotiations or "Mini-Ministerials", when they occur in
other countries. These processes have been regularly criticized by many of the WTO's
developing country members who are often totally excluded from the negotiations.
5.2.4 Dispute Settlement
The WTO members agreed on the Understanding on Rules and Procedures
Governing the Settlement of Disputes (DSU) annexed to the "Final Act" signed in
Marrakesh in 1994. Dispute settlement is regarded by the WTO as the central pillar of
the multilateral trading system, and as a "unique contribution to the stability of the
global economy". WTO members have agreed that, if they believe fellow-members are
violating trade rules, they will use the multilateral system of settling disputes instead of
taking action unilaterally.
The operation of the WTO dispute settlement process involves the DSB panels, the
Appellate Body, the WTO Secretariat, arbitrators, independent experts and several
specialized institutions. The General Council discharges its responsibilities under the
DSU through the Dispute Settlement Body (DSB). Like the General Council, the DSB is
composed of representatives of all WTO Members. The DSB is responsible for
administering the DSU, i.e. for overseeing the entire dispute settlement process. If a
member state considers that a measure adopted by another member state has deprived
it of a benefit accruing to it under one of the covered agreements, it may call for
consultations with the other member state. If consultations fail to resolve the dispute
within 60 days after receipt of the request for consultations, the complainant state may
request the establishment of a panel. The respondent state cannot prevent or delay the
establishment of a panel, unless the DSB by consensus decides otherwise. The panel,
normally consists of three members appointed ad hoc by the Secretariat, sits to receive
written and oral submissions of the parties, on the basis of which it is expected to make
findings and conclusions for presentation to the DSB. The proceedings are confidential,
and even when private parties are directly concerned, they are not permitted to attend
or make submissions separate from those of the state in question.
WTO and its Implications on Agriculture
225
The final version of the panel's report is distributed first to the parties, and two
weeks later it is circulated to all the members of the WTO. The report must be adopted
at a meeting of the DSB within 60 days of its circulation, unless the DSB by consensus
decides not to adopt the report or a party to the dispute gives notice of its intention to
appeal. A party may appeal a panel report to a standing Apellate Body, but only on
issues of law, and legal interpretations developed by the panel. Members may express
their views on the report of the Appellate Body, but they cannot derail it: an Apellate
Body report shall be adopted by the DSB and unconditionally accepted by the parties,
unless the DSB decides by consensus within thirty days of its circulation not to adopt
the report.
Within thirty days of the adoption of the report, the member concerned is to
inform the DSB of its intentions; if the member explains that it is impracticable to
comply immediately with the recommendations and rulings, it is to have a "reasonable
period of time" to comply. If no agreement is reached about the reasonable period for
compliance, that issue is to be the subject of binding arbitration. If there is a
disagreement as to the satisfactory nature of the measures adopted by the respondent
state to comply with the report, that disagreement is to be decided by a panel, if possible
the same panel that heard the original dispute, but apparently without the possibility of
appeal from its decision.
If all else fails, two more possibilities are set out in the DSU:
• If a member fails within the "reasonable period" to carry out the recommendations and rulings, it may negotiate with the complaining state for a mutually acceptable compensation.
• If no agreement on compensation is reached within twenty days of the expiry of the "reasonable period", the prevailing state may request authorization from the DSB to suspend application to the member concerned of concessions or other obligations under the covered agreements. In contrast to prior GATT practice, authorization to suspend concessions in this context is semi-automatic, in that the DSB "shall grant the authorization [...] within thirty days of the expiry of the reasonable period", unless it decides by consensus to reject the request.
Course-201 Market Led Extension
226
5.2.5 Accession and Membership
The process of becoming a WTO member is unique to each applicant country, and
the terms of accession are dependent upon the country's stage of economic development
and current trade regime. The process takes about five years, on average, but it can last
more if the country is less than fully committed to the process or if political issues
interfere. As is typical of WTO procedures, an offer of accession is only given once
consensus is reached among interested parties.
5.2.5.1 Accession process
A country wishing to accede to the WTO submits an application to the General
Council, and has to describe all aspects of its trade and economic policies that have a
bearing on WTO agreements. The application is submitted to the WTO in a
memorandum which is examined by a working party open to all interested WTO
Members. After all necessary background information has been acquired, the working
party focuses on issues of discrepancy between the WTO rules and the applicant's
international and domestic trade policies and laws. The working party determines the
terms and conditions of entry into the WTO for the applicant nation, and may consider
transitional periods to allow countries some leeway in complying with the WTO rules.
The final phase of accession involves bilateral negotiations between the applicant nation
and other working party members regarding the concessions and commitments on tariff
levels and market access for goods and services. The new member's commitments are to
apply equally to all WTO members under normal non-discrimination rules, even though
they are negotiated bilaterally.
When the bilateral talks conclude, the working party sends to the General Council
or Ministerial Conference an accession package, which includes a summary of all the
working party meetings, the Protocol of Accession (a draft membership treaty), and lists
("schedules") of the member-to-be's commitments. Once the General Council or
Ministerial Conference approves of the terms of accession, the applicant's parliament
must ratify the Protocol of Accession before it can become a member.
WTO and its Implications on Agriculture
227
5.2.5.2 Membership
The WTO has 151 members as on July 2007. The European Union representing 27
states is also members of WTO. WTO members do not have to be full sovereign nation-
members. Instead, they must be a customs territory with full autonomy in the conduct
of their external commercial relations. A number of non-members have been observers
(32) at the WTO and are currently negotiating their membership.
5.3 WTO Agreements
5.3.1 Agreement on Agriculture (AoA)
The WTO oversees about 60 different agreements which have the status of
international legal texts. Member countries must sign and ratify all WTO agreements on
accession. The AoA came into effect with the establishment of the WTO at the beginning
of 1995. The AoA has three central concepts, or "pillars": domestic support, market
access and export subsidies.
5.3.2 General Agreement on Trade in Services (GATS)
Before the WTO's Uruguay Round negotiations began in 1986, services were not
included in international trade agreements. Most services have traditionally been
classed as domestic activities difficult to trade across borders. Some service categories
have been viewed as domains for government ownership and control, given their
infrastructural importance and susceptibility to national monopolies. A third important
group of sectors, including health, education and water services are considered in many
countries as governmental responsibilities to be regulated and not left to the vagaries of
markets.
Nevertheless, some service sectors—in particular, international finance and
maritime transport—have been largely open for centuries, as necessary components of
merchandise trade. Other large sectors have undergone fundamental technical and
regulatory changes in recent decades, opening them to private commercial participation
and reducing barriers to entry. The development of information technology and the
Course-201 Market Led Extension
228
internet have expanded the range of internationally tradeable service products which
include e-banking, 'telemedicine', distance learning, as well as international remote
gambling, 'spam' and pornography. Governments are increasingly being influenced to
expose former monopoly services to international competition. At the same time,
powerful countervailing arguments and civil-society movements have been pressing for
fuller accountability and legislative restriction of potentially unethical market and
corporate behaviours .
5.3.3 Trade Related Intellectual Property Rights (TRIPS)
The Agreement on Trade Related Aspects of Intellectual Property Rights (TRIPS) is
an international agreement administered by the World Trade Organization (WTO) that
sets down minimum standards for many forms of intellectual property (IP) regulation. It
was negotiated at the end of the Uruguay Round of the General Agreement on Tariffs
and Trade (GATT) in 1994. Specifically, TRIPS contains requirements that nations' laws
must meet for: copyright rights, including the rights of performers, producers of sound
recordings and broadcasting organizations; geographical indications, including
appellations of origin; industrial designs; integrated circuit layout-designs; patents;
monopolies for the developers of new plant varieties; trademarks; trade dress; and
undisclosed or confidential information. TRIPS also specify enforcement procedures,
remedies, and dispute resolution procedures.
The TRIPS agreement introduced intellectual property law into the international
trading system for the first time, and remains the most comprehensive international
agreement on intellectual property to date.
5.3.4 Sanitary and Phyto-Sanitary (SPS) Agreements
The Agreement on the Application of Sanitary and Phytosanitary Measures - also
known as the SPS Agreement is an international treaty of the World Trade Organization.
It was negotiated during the Uruguay Round of the General Agreement on Tariffs and
Trade, and entered into force with the establishment of the WTO at the beginning of
1995.
WTO and its Implications on Agriculture
229
Under the SPS agreement, the WTO sets constraints on member-states' policies
relating to food safety (bacterial contaminants, pesticides, inspection and labelling) as
well as animal and plant health (phytosanitary) about imported pests and diseases.
The SPS agreement gives the WTO the power to override a country's use of the
precautionary principle – a principle which allows them to act on the side of caution if
there is no scientific certainty about potential threats to human health and the
environment. Under SPS rules, the burden of proof is on countries to demonstrate
scientifically that something is dangerous before it can be regulated, even though
scientists agree that it is impossible to predict all forms of damage posed by insects or
pest plants. Quarantine policies play an important role in ensuring the protection of
human, animal and plant health. Yet under the SPS agreement, quarantine barriers can
be a 'technical trade barrier' used to keep out foreign competitors.
5.3.5 Genetically Modified Organisms (GMO)
A genetically modified organism (GMO) or genetically engineered organism
(GEO) is an organism whose genetic material has been altered using genetic engineering
techniques. These techniques are generally known as recombinant DNA technology.
With recombinant DNA technology, DNA molecules from different sources are
combined in vitro into one molecule to create a new gene. This DNA is then transferred
into an organism and causes the expression of modified or novel traits.
The general principle of producing a GMO is to add a lot of genetic material into
an organism's genome to generate new traits - Genetic engineering - was made possible
through a series of scientific advances including the discovery of DNA and the creation
of the first recombinant bacteria in 1973, i.e., E .coli expressing a salmonella gene. This
led to concerns in the scientific community about potential risks from genetic
engineering.
The generation and use of GMOs has many reasons, chief among them are their
use in research that addresses fundamental or applied questions in biology or medicine,
for the production of pharmaceuticals and industrial enzymes, and for direct, and often
Course-201 Market Led Extension
230
controversial, applications aimed at improving human health (e.g., gene therapy) or
agriculture (e.g., golden rice).
Since GM plants are grown on open fields, there is often a perception that there
could be associated environmental risks. Therefore, most countries require biosafety
studies prior to the approval of a new GM plant event, usually followed by a monitoring
programme to detect environmental impacts. Currently, there is a lot of international
consensus regarding the acceptability and effective role of modified "complete"
organisms such as plants or animals.
5.3.6 Technical Barriers to Trade (TBT)
The Agreement on Technical Barriers to Trade - also known as the TBT Agreement
is an international treaty of the World Trade Organization. It was negotiated during the
Uruguay Round of the General Agreement on Tariffs and Trade, and entered into force
with the establishment of the WTO at the beginning of 1995. The object of the TBT
Agreement is "to ensure that technical negotiations and standards, as well as testing and
certification procedures, do not create unnecessary obstacles to trade"
5.4 Agreement on Agriculture (AoA)
The Agreement on Agriculture is an international treaty of the World Trade
Organization. It was negotiated during the Uruguay Round of the General Agreement
on Tariffs and Trade, and entered into force with the establishment of the WTO on
January 1, 1995. The AoA has three central concepts, or "pillars": domestic support,
market access and export subsidies.
5.4.1 Domestic Support
The first pillar of the AoA is "domestic support". The AoA structures domestic
support (subsidies) into three categories or "boxes": a Green Box, an Amber Box and a
Blue Box. The Green Box contains fixed payments to producers for environmental
programmes, so long as the payments are "decoupled" from current production levels.
The Amber Box contains domestic subsidies that governments have agreed to reduce
WTO and its Implications on Agriculture
231
but not eliminate. The Blue Box contains subsidies which can be increased without limit,
so long as payments are linked to production-limiting programmes.
The AoA's domestic support system currently allows Europe and the USA to
spend $380 billion annually on agricultural subsidies alone. "It is often still argued that
subsidies are needed to protect small farmers but, according to the World Bank, more
than half of EU support goes to 1% of producers while in the US 70% of subsidies go to
10% of producers, mainly agri-businesses". The effect of these subsidies is to flood
global markets with below-cost commodities, depressing prices and undercutting
producers in poor countries – a practice known as dumping.
5.4.2 Market Access
Market access" is the second pillar of the AoA, and refers to the reduction of tariff
(or non-tariff) barriers to trade by WTO members. The 1995 AoA required tariff
reductions of:
• 36% average reduction by developed countries, with a minimum per tariff line reduction of 15% over five years.
• 24% average reduction by developing countries with a minimum per tariff line reduction of 10% over nine years.
Least Developed Countries (LDCs) were exempted from tariff reductions, but
either had to convert non–tariff barriers to tariffs—a process called tariffication—or
"bind" their tariffs, creating a "ceiling" which could not be increased in future.
5.4.3 Export Subsidies
Export subsidies" is the third pillar of the AoA. The 1995 AoA required developed
countries to reduce export subsidies by at least 35% (by value) or by at least 21% (by
volume) over the five years to 2000.
5.5 Implications on Agriculture
The Uruguay Round agreement sought to bring order and fair competition to this
highly distorted sector of world trade by establishment of a fair and market oriented
Course-201 Market Led Extension
232
agricultural trading sector. The root cause of distortion of international trade in
agriculture has been the massive domestic subsidies given by the industrialised
countries to their agricultural sector over many years. This in turn led to excessive
production and its dumping in international markets as well as import restrictions to
keep out foreign agricultural products from their domestic markets. Hence, the starting
point for the establishment of a fair agricultural trade regime has to be the reduction of
domestic production subsidies given by industrialised countries, reduction in the
volume of subsidised exports and minimum market access opportunities for
agricultural producers world-wide.
5.5.1. Product coverage
The Agreement defines agricultural products by reference to the harmonised
system of product classification. The definition covers not only basic agricultural
products such as wheat, milk and live animals, but the products derived from them
such as bread, butter, other dairy products and meat, as well as all processed
agricultural products such as chocolates and sausages. The coverage includes wines,
spirits and tobacco products, fibres such as cotton, wool and silk, and raw animal skins
destined for leather production. Fish and fish products are not included nor are forestry
products.
5.5.2. Implementation period
The implementation period for the country-specific commitments is the six-year
period commencing in 1995. However, developing countries have the flexibility to
implement their reduction and other specific commitments over a period of upto 10
years. Members had the choice of implementing their concessions and commitments on
the basis of calendar, marketing (crop) or fiscal years. A WTO Member’s
implementation year for tariff reduction may thus differ from the one applied to export
subsidy reductions. For the purpose of the ‘peace clause’ the implementation period is
the nine-year period commencing in 1995.
WTO and its Implications on Agriculture
233
5.5.3. Committee on Agriculture
The Agreement on Agriculture is overseen by the Committee on Agriculture which
reviews progress in the implementation of commitments mentioned above. The
Agreement also calls for further negotiations to be initiated before the end of the fifth
year of implementation. The Agreement is thus coming up for review at the end of 1999.
India has not undertaken any commitments under the Uruguay Round Agreement
on Agriculture (AoA) which constrain us from following our developmental policy with
regard to agriculture or which entail any action on our side immediately. We would,
however, need to study the implications of removal of quantitative restrictions on
market access, subsidy to farmers and tariffs on imports. The structure of the Agreement
on Agriculture as it exists today seems to be slightly imbalanced, since it enables
countries subsidising the agriculture sector heavily to retain a substantial portion of
their subsidies upto the end of the implementation period while those countries which
were not using these measures earlier are prohibited to use these measures in future
beyond the de-minimis limit. We have to find ways to bring about more equity into the
structure of the Agreement.
5.6 WTO and Indian experience
Implications of the Agreement would differ from country to country and would
depend largely on the overall agricultural scenario in the country. Indian agriculture is
characterised by a preponderant majority of small and marginal farmers holding less
than two hectares of land, with less than 36 per cent of the land, without any assured
irrigation and for the large majority of farmers, the gains from the application of the
science & technology in agriculture are yet to be realised. Farmers, therefore, require
support in terms of development of infrastructure as well as extension of improved
technologies and provisions of requisite inputs at reasonable cost. India’s share of
world’s agricultural trade is of the order of One percent. There is no doubt that during
the last 30 years, Indian agriculture has grown at a reasonable pace, but with stagnant
and declining net cropped area it is indeed going to be a formidable task to maintain the
Course-201 Market Led Extension
234
growth in agricultural production. Implications of the Agreement on Agriculture for
India should thus be gauged from the impact it will have on the following:
i) Whether the Agreement has opened up markets and facilitated exports of our
products; and ii) Whether we would be able to continue with our domestic policy aimed at
improving infrastructure and provision of inputs at subsidised prices for achieving increased agricultural production.
5.6.1 Implications - Short Term
As far as opening of markets and impact on trade in agriculture is concerned, it
may be noted that the share of developing countries in world exports of food remained
static but agricultural raw materials increased marginaly. No tangible opening up of the
markets has thus been noticed in the post-Agreement period so far. Regarding freedom
to pursue our domestic policies, it is quite evident that in the short term India will not
be affected by the WTO Agreement on Agriculture.
The safeguards provided for developing countries give enough manoeuvres to
insulate ourselves from any major impact of trade liberalisation in agricultural
commodities. At present, India has been maintaining quantitative restrictions (QRs) on
import of 825 agricultural products and are proposed to be eliminated within the overall
time frame of six years in three phases – from 1.4.97 to 31.3.2003. In India, for the
present, the minimum support price provided to commodities is less than the fixed
external reference price determined under the Agreement. Therefore, the AMS is
negative. Theoretically, therefore, we could increase the product-specific support upto
10%, the only restraint being the fiscal sustainability in the country’s context.
5.6.2. Implications - Long Term
Indian agriculture enjoys the advantage of cheap labour. Therefore, despite the
lower productivity, a comparison with world prices of agricultural commodities would
reveal that domestic prices in India are considerably less with the exceptions of a few
commodities. Hence, imports to India would not be attractive in the case of rice, tea,
WTO and its Implications on Agriculture
235
sunflower oil and cotton. On the whole, large scale import of agricultural commodities
as a result of trade liberalisation is ruled out. Even the exports of those foodgrains which
are cheaper in the domestic market, but are sensitive from the point of view of
consumption by the economically weaker sections are not likely to rise to unacceptable
levels because of high inland transportation cost and inadequate export infrastructure in
India. Through proper tariffication, however, we will have to strike a balance between
the competing interest of 10 per cent farmers who generate marketable surpluses and
consumers belonging to the economically poor sections of the society.
It is also argued that because of increasing price of domestic agricultural
commodities following improved export prospects, farmers would get benefits which in
turn would encourage investment in the resource scarce agricultural sector. With the
decrease in production subsidies as well as export subsidies, the international prices of
agricultural commodities will rise and this will help in making our exports more
competitive in world market. Both the pattern of production and price expectations will
increasingly be influenced by the demands and trends in world markets. On the one
hand, the price incentive could be the best incentive and could give a strong boost to
investment in agriculture as well as adoption of modern technologies and thereby to the
raising of agricultural production and productivity. On the other hand, the rise in
domestic prices would put pressure on the public distribution system and accentuate
the problem of food subsidy. Furthermore, freedom to export agricultural products
without restrictions will also need shedding the long-nurtured inhibition against their
imports. India should not negotiate with the mindset of perpetual importer but should
also think of export opportunities for technology arising in agricultural sector.
5.7 Impact of WTO
Indian agriculture has undergone significant changes and transformation during
the last fifty years. The decade of 1990s has shown significant improvement in terms of
trade for agriculture. The process of trade reforms has been further intensified since
1995 following implementation of WTO Agreement on Agriculture (AoA). These
concerns related to food security, nutrition, growth of agriculture sector, regional equity,
Course-201 Market Led Extension
236
price stability, farm income, welfare of consumers and producers, sustainability and
associated effects.
The impact of trade liberalization on Indian farmers have been felt through various
channels such as volatile prices, problems in imports and exports, impact on livelihood
and other employment opportunities. While output volatility increased especially with
new seeds and other inputs, the prices of most non-food grain crops such as those of
cotton and oilseeds, plummeted for prolonged periods. This reflected not only domestic
demand conditions but also the growing role played by international prices consequent
upon greater integration with world markets in this sector.
Since Indian farmers are known to have very elastic responses to relative price
signals in terms of changing acreage, this caused large and often undesirable shifts in
cropping pattern which ultimately rebounded on the farmers themselves. The pattern of
lower prices accompanying relatively lower output reflected the effect of growing
integration of Indian agriculture with world markets, resulting from trade liberalization.
As both exports and imports of agricultural products are progressively freed,
international price movements are more closely reflected in domestic trends in prices.
5.8 Conclusion
The awareness about WTO and its implications for Indian agriculture will help in
understanding the need for explicit recognition of farmer’s privileges and farmer’s
rights in the sui-generis system, protecting the interests of small and marginal farmers,
safeguarding the interests of the vast consumers, gaining from international trade
through comparative advantage the need to harmonise the implications of CBD,
international undertaking on plant genetic resources, the environmental implications of
international trade which holds tremendous challenge in agriculture, , patenting the
products and services of India etc.
WTO and its Implications on Agriculture
237
5.9 Abbreviations
AMS Aggregate Measurement of Support AoA Agreement on Agriculture BP Biosafety Protocol (BP)
CBD Convention on Bio-Diversity FTR Foreign Trade Regime
GATT General Agreement on Tariffs and Trade GATS General Agreement on Trade in Services GMO Genetically Modified Organisms ITA Information Technology Agreement IPR Intellectual Property Rights
UPOV International Union of Plant Variety LMO Living Modified Organisms MFN Most Favoured Nation PFRB Plant Variety and Farmers’ Right Bill SPS Sanitary and Phyto-Sanitary agreements DSU Settlement of Disputes TBT Technical Barriers to Trade
TPRM Trade Policy Review Mechanism TRIPS Trade Related Intellectual Property Rights WTO World Trade Organization