PORTLAND CEMENT CONCRETE PAVEMENT … CEMENT CONCRETE PAVEMENT REVIEW OF QC/QA DATA ... compressive...
79
Report No. CDOT-DTD-R-2006-5 Final Report PORTLAND CEMENT CONCRETE PAVEMENT REVIEW OF QC/QA DATA 2000 THROUGH 2004 Eric Chavez, CDOT Pavement Design Unit January 2006 COLORADO DEPARTMENT OF TRANSPORTATION RESEARCH BRANCH
Transcript of PORTLAND CEMENT CONCRETE PAVEMENT … CEMENT CONCRETE PAVEMENT REVIEW OF QC/QA DATA ... compressive...
Report No. CDOT-DTD-R-2006-5 Final Report PORTLAND CEMENT CONCRETE PAVEMENT REVIEW OF QC/QA DATA 2000 THROUGH 2004 Eric Chavez, CDOT Pavement Design Unit
January 2006
COLORADO DEPARTMENT OF TRANSPORTATION RESEARCH BRANCH

i
The contents of this report reflect the views of
the author(s), who is(are) responsible for the
facts and accuracy of the data presented
herein. The contents do not necessarily reflect
the official views of the Colorado Department of
Transportation or the Federal Highway
Administration. This report does not constitute
a standard, specification, or regulation.
ii
Technical Report Documentation Page 1. Report No. CDOT-DTD-R-2006-5
2. Government Accession No.
3. Recipient's Catalog No.
5. Report Date January 2006
4. Title and Subtitle PORTLAND CEMENT CONCRETE PAVEMENT REVIEW OF QC/QA DATA 2000 THROUGH 2004 6. Performing Organization Code
7. Author(s) Eric Chavez
8. Performing Organization Report No. CDOT-DTD-R-2006-5
10. Work Unit No. (TRAIS)
9. Performing Organization Name and Address Colorado Department of Transportation 4201 E. Arkansas Ave. Denver, Colorado 80222
11. Contract or Grant No.
13. Type of Report and Period Covered
12. Sponsoring Agency Name and Address Colorado Department of Transportation - Research 4201 E. Arkansas Ave. Denver, CO 80222 14. Sponsoring Agency Code
15. Supplementary Notes Prepared in cooperation with the US Department of Transportation, Federal Highway Administration
16. Abstract
This report analyzes the Quality Control/Quality Assurance (QC/QA) data for Portland Cement Concrete Pavement (PCCP) constructed in the years 2000 through 2004. Analysis of the overall performance of the projects was accomplished by reviewing the Calculated Pay Factor Composite (CPFC) and Incentive/Disincentive Payments (I/DP). Analysis of each of the test elements: thickness, compressive strength, sand equivalent, and flexural strength has been completed. The results of the evaluation are presented in tables, figures, and reports.
The PCCP on the projects evaluated from 2000 through 2004 have shown good test results. The average incentive payment is above 3.8% in each of the years. Over the five-year time period the average is above 3.9%, maximum incentive being 5%. All projects evaluated received some amount of incentive payment for the PCCP. Of the 36 projects evaluated 19 received incentive payments greater than 4%. Two of these projects received the maximum incentive of 5%. Over the five-year time period the CPFC has remained at a constant level. When evaluating each of the test elements we find that of the twenty data groupings used, year and test element, only two of these have an average quality level that is less than 98% within specification limits. All of the average pay factors for the elements are above the 1.0 mark signifying that on average incentives have been paid on those elements. Many of the pay factors for the individual elements are approaching the maximum allowable values. Two factors affect the quality level calculations, the mean for the process in relationship to the target value and the standard deviation of the process in comparison to the V value. The mean to TV calculations shows that the material being produced is above the target value for the elements. When analyzing the standard deviations for the test elements we find that most of the material being produced is below the variation of the historical data. All of the element quality levels are essentially remaining at a constant level. The percent within specification limits is at a very high percentage, above 98%. 17. Keywords Quality Control/Quality Assurance (QC/QA), quality levels, percent within limits, Incentive/Disincentive Payments (I/DP) compressive strength, flexural strength, thickness, sand equivalent
18. Distribution Statement No restrictions. This document is available to the public through the National Technical Information Service Springfield, VA 22161
19. Security Classif. (of this report) Unclassified
20. Security Classif. (of this page) Unclassified
21. No. of Pages 79
22. Price
Form DOT F 1700.7 (8-72) Reproduction of completed page authorized


iii
Portland Cement Concrete Pavement Review of QC/QA Data
2000 Through 2004
by
Eric Chavez
Report No. CDOT-DTD-R-2006-5
Prepared by Colorado Department of Transportation
Research Branch
Sponsored by the Colorado Department of Transportation
In Cooperation with the U.S. Department of Transportation
Federal Highway Administration
January 2006
Colorado Department of Transportation Research Branch
4201 E. Arkansas Ave. Denver, CO 80222
(303) 757-9266

iv
TABLE OF CONTENTS 1.0 INTRODUCTION AND COMMENTS .............................................................1
2.0 SPECIFICATIONS .........................................................................................2
3.0 CALCULATIONS AND DEFINITIONS...........................................................4
4.0 CONVERSION OF TEST UNITS ...................................................................8 5.0 DESCRIPTION OF REPORTS ......................................................................8
6.0 DISCUSSION OF DATA ..............................................................................11
6.1 Projects Evaluated............................................................................11
6.2 Calculated Pay Factor Composite ..................................................14
6.3 Incentive/Disincentive Payments ....................................................17
6.4 Recap of Data by Test Element - 2000 through 2004 ....................17
6.5 Test Element Quality Levels 2000 through 2004 ............................25
6.6 Process Information by Year Reports, 2000 through 2004 ...........29
6.7 Project Data for 2004 ........................................................................29
7.0 SUMMARY .................................................................................................30
8.0 UPDATES AND CONTACT .........................................................................31
REFERENCES .................................................................................................32
URLs .................................................................................................32
Appendix A Reports for Project Data 2000 through 2004
Appendix B Project Data Report for 2004 Projects
v
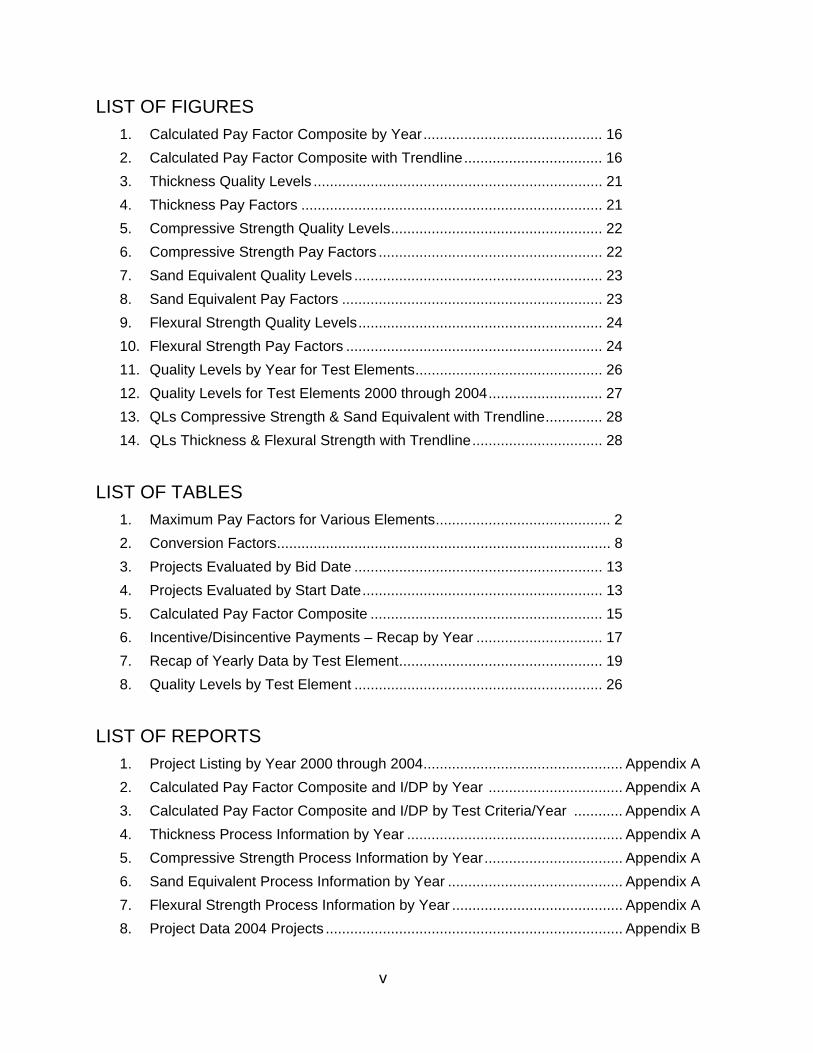
LIST OF FIGURES 1. Calculated Pay Factor Composite by Year............................................ 16 2. Calculated Pay Factor Composite with Trendline.................................. 16 3. Thickness Quality Levels ....................................................................... 21 4. Thickness Pay Factors .......................................................................... 21 5. Compressive Strength Quality Levels.................................................... 22 6. Compressive Strength Pay Factors ....................................................... 22 7. Sand Equivalent Quality Levels ............................................................. 23 8. Sand Equivalent Pay Factors ................................................................ 23 9. Flexural Strength Quality Levels............................................................ 24 10. Flexural Strength Pay Factors ............................................................... 24 11. Quality Levels by Year for Test Elements.............................................. 26 12. Quality Levels for Test Elements 2000 through 2004............................ 27 13. QLs Compressive Strength & Sand Equivalent with Trendline.............. 28 14. QLs Thickness & Flexural Strength with Trendline................................ 28
LIST OF TABLES 1. Maximum Pay Factors for Various Elements........................................... 2 2. Conversion Factors.................................................................................. 8 3. Projects Evaluated by Bid Date ............................................................. 13 4. Projects Evaluated by Start Date........................................................... 13 5. Calculated Pay Factor Composite ......................................................... 15 6. Incentive/Disincentive Payments – Recap by Year ............................... 17 7. Recap of Yearly Data by Test Element.................................................. 19 8. Quality Levels by Test Element ............................................................. 26
LIST OF REPORTS 1. Project Listing by Year 2000 through 2004................................................. Appendix A 2. Calculated Pay Factor Composite and I/DP by Year ................................. Appendix A 3. Calculated Pay Factor Composite and I/DP by Test Criteria/Year ............ Appendix A 4. Thickness Process Information by Year ..................................................... Appendix A 5. Compressive Strength Process Information by Year.................................. Appendix A 6. Sand Equivalent Process Information by Year ........................................... Appendix A 7. Flexural Strength Process Information by Year .......................................... Appendix A 8. Project Data 2004 Projects ......................................................................... Appendix B
1
1.0 INTRODUCTION AND COMMENTS The Colorado Department of Transportation (CDOT) began Quality Control/Quality
Assurance (QC/QA) construction of portland cement concrete pavement (PCCP) in
1997 with the release of Revision to Sections 105, & 106 Quality of Portland Cement
Concrete Pavement as a pilot specification. In 1998 additional projects were awarded
under revised pilot specifications. The specification became a Standard Special
Provision in 2000 with the release of “Revision to Sections 105, 106, & 412 Quality of
Portland Cement” and “Revision to Sections 105, 106, & 412 Quality of Portland
Cement Concrete Pavement (Alternative Strength Criteria).”
This report analyzes the PCCP data for the years 2000 through 2004. The projects are
evaluated by analyzing the Calculated Pay Factor Composite (CPFC) and
Incentive/Disincentive Payment (I/DP). Each of the test elements: thickness,
compressive strength, sand equivalent, & flexural strength is also evaluated. The data
is evaluated by year and yearly reports are presented in this report. Charts comparing
the quality level and pay factor information for the years 2000 through 2004 are
displayed for each of the test elements. A detailed report containing project data for the
year 2004 is presented.
Two major changes were made in this report as compared to the previous report,
“Portland Cement Concrete Pavement Review of QC/QA Data 2000 to 2003.” The first
change is that the major data grouping is now by start date instead of bid date as in the
previous report. The start date is defined as the date the paving process began. The
bid date, also the award date, is the day on which the project was awarded to contract.
On numerous projects the paving did not began in the same year as the project was
awarded. In a couple of cases the paving began in the second year after the project
was awarded. The new data grouping more accurately groups the projects together
according to the time frame in which the paving began. The second change is that in
some of the reports the data for the metric projects, SI, has been converted to the USA
unit. The evaluations are now completed using all of the projects instead of splitting the
projects into the two different data groupings, USA and SI.

2
2.0 SPECIFICATIONS Specifications – “Revision of Sections 105, 106, and 412 Quality of Portland Cement
Concrete Pavement” and “Revision of Sections 105, 106, and 412 Quality of Portland
Cement Concrete Pavement (Alternate Strength Criteria).” These specifications govern
all of the QC/QA calculations used for portland cement concrete pavements. The
material is grouped into processes for evaluation. Processes group like material or
construction techniques together. As long as the material being evaluated remains
unchanged it will be added to the current process. New processes will be created if the
material changes or if the construction technique is changed. See the Revision to
Sections 105, 106, and 412 for details on processes. An Incentive/Disincentive
Payment (I/DP) is calculated for each process. I/DPs on processes that contain one
and two tests are calculated using the small quantity equation. Quality levels (Percent
within limits) are calculated on all processes that contain more than two tests. The
calculations for quality level follow Colorado Procedure 71, see the procedure for
details.
When compressive strength criteria is used the calculations for I/DP will be based on
the results of three elements: thickness, compressive strength, and sand equivalent.
When flexural strength criteria is used the calculations for I/DP will be based on two
elements: thickness and flexural strength. The maximum incentive payment for the
PCCP is 5% under either of the testing criteria. The maximum pay factor for each of the
test elements is listed in Table 1.
Table 1. Maximum Pay Factor for Various Elements
Element Maximum Pay Factor
Thickness 2%
Compressive Strength 2%
Sand Equivalent 1%
Flexural Strength 3%

3
Pay factors will be calculated for each process using the following equations:
A. For compressive strength and pavement thickness: When 3 ≤ Pn ≤ 5 If QL ≥ 85, then PF = 1.00 + (QL - 85)0.001333 If QL < 85, then PF = 1.00 + (QL - 85)0.005208 When 6 ≤ Pn ≤ 9 If QL ≥ 90, then PF = 1.00 + (QL - 90)0.002000 If QL < 90, then PF = 1.00 + (QL - 90)0.005682 When 10 ≤ Pn ≤ 25 If QL ≥ 93, then PF = 1.00 + (QL - 93)0.002857 If QL < 93, then PF = 1.00 + (QL - 93)0.006098 When Pn ≥ 26 If QL ≥ 95, then PF = 1.00 + (QL - 95)0.004000 If QL < 95, then PF = 1.00 + (QL - 95)0.006757
B. For flexural strength: When 3 ≤ Pn ≤ 5 If QL ≥ 85, then PF = 1.00 + (QL - 85)0.002000 If QL < 85, then PF = 1.00 + (QL - 85)0.005208 When 6 ≤ Pn ≤ 9 If QL ≥ 90, then PF = 1.00 + (QL - 90)0.003000 If QL < 90, then PF = 1.00 + (QL - 90)0.005682 When 10 ≤ Pn ≤ 25 If QL ≥ 93, then PF = 1.00 + (QL - 93)0.004286 If QL < 93, then PF = 1.00 + (QL - 93)0.006098 When Pn ≥ 26 If QL ≥ 95, then PF = 1.00 + (QL - 95)0.006000 If QL < 95, then PF = 1.00 + (QL - 95)0.006757 C. For sand equivalent: When 3 ≤ Pn ≤ 5 If QL ≥ 85, then PF = 1.00 + (QL - 85)0.000667 If QL < 85, then PF = 1.00 + (QL - 85)0.005208 When 6 ≤ Pn ≤ 9 If QL ≥ 90, then PF = 1.00 + (QL - 90)0.001000 If QL < 90, then PF = 1.00 + (QL - 90)0.005682 When 10 ≤ Pn ≤ 25 If QL ≥93, then PF = 1.00 + (QL - 93)0.001429 If QL < 93, then PF = 1.00 + (QL - 93)0.006098 When Pn ≥ 26 If QL ≥ 95, then PF = 1.00 + (QL - 95)0.002000 If QL < 95, then PF = 1.00 + (QL - 95)0.006757
4
The I/DP for the process is calculated using the following equation: I/DP = (PF-1)(QR)(UP) where: QR = Quantity Represented by the process. UP = Unit Price bid for the Item. The total I/DP for an element shall be computed by accumulating the individual I/DP for each process of that element.
The I/DP for the project will be the summation of all calculated I/DPs.
The calculations for pay factor and Incentive/Disincentive Payment have remained
unchanged since the release of the Standard Special Provisions in 2000. The
calculation for quality levels has remained unchanged since the beginning. Use of
CDOT’s QC/QA computer program is a requirement of the specification. The computer
program is based on this specification.
3.0 CALCULATIONS AND DEFINITIONS Process Quantities – Process quantities are used for all calculations in this report
except for the calculation of the Calculated Pay Factor Composite. In general,
processes group like material or construction techniques together. As long as the
material being evaluated remains unchanged it will be added to the current process. If
a change to the material or the construction technique occurs then a new process will
be created. Please see the Revision to Sections 105, 106, and 412 Quality of Portland
Cement Concrete Pavement for details on processes.
Award Date – The date on which the project was awarded to contract.
Bid Date – Same as Award Date.
Calculated Pay Factor Composite (CPFC) – The Calculated Pay Factor Composite is a
way to evaluate the overall quality of the PCCP used on the project. The CPFC

5
represents the percentage increase or decrease to the unit price for PCCP paid on the
project. Projects with a CPFC greater than 1.0 will have received an incentive payment.
Projects with a CPFC less than 1.0 will have received a disincentive payment. The
CPFC is back calculated from the project’s Final Incentive/Disincentive Payment (I/DP).
This calculation is used rather than an overall quality level calculation since a project
can contain processes in which no quality level is calculated, processes with less than
three tests. The calculation used also addresses the problem which occurred in some
of the reported projects in which the final element quantities were not equal. This
calculation is used in order to avoid the problems associated with averaging of the data.
The original testing unit and quantities are used in the calculation. The calculation is as
follows:
1 )))(QR * )((UP /(I/DP CPFC PP +=
Where: CPFC = Calculated Pay Factor Composite.
I/DP = Incentive/Disincentive Payment for the project.
UPP = Calculated Unit Price for the project.
QRP = Quantity Represented Project, average of the reported element quantities.
∑ ∑= nnnP Q / ))Q * (UP ( UP
Where: UPn = Unit Price for the process.
Qn = Quantity represented by the process, thickness element only.
I/DP (Incentive/Disincentive Payment) - The amount of increase or decrease paid for a
quantity of material within a test element. The I/DP for a project is the summation of all
calculated element I/DPs.
LSL (Lower Specification Limit) – The lower limit of the specification range. All of the
test elements used in testing PCCP only have a LSL. The LSL used in the thickness
element is plan thickness minus 4 tenths of an inch or 10 mm.
Mean to TV - The difference between the mean for the process and the target value for
the test element. Negative numbers indicate that the mean for the process is below the
6
target value for the element. Positive numbers indicate that the mean for the process is
above the target value. A mean above the target value, positive values, indicates that
the mean is moving farther away from the lower specification limit on lower specification
limit only tests. All of the PCCP test elements have only a lower specification test limit.
Positive values, and the higher that value is, increase the likelihood that more of the test
results will be in specification. The mean for the process in relationship to the
specification limits is one of the two factors that affect the calculation for quality level.
The other factor is the standard deviation for the process.
Pay Factor - The amount of increase or decrease, displayed as a percentage, applied to
the unit price for the quantity of material represented by the process for a test element.
Project Code – An alpha-numeric identifier unique to each project.
PT (Plan Thickness) – The planned thickness of the pavement. The lower tolerance
limit (TL) used in the thickness element is PT minus 0.4 inches (10 mm). TL is used in
the calculations for quality level and Incentive/Disincentive Payment.
Quality Level – Quality levels (Percent within limits) are calculated in accordance with
Colorado Procedure 71. Quality level analysis is a statistical procedure for estimating
the percent compliance to specification limits and is affected by shifts in the arithmetic
mean and by the sample standard deviation. Analysis of both factors is essential
whenever evaluating quality level results.
Slope of the regression line equation: ∑
∑−
−−= 2)(
))((xx
yyxxb
Slope shows both steepness and direction. With positive slope the line moves
upward when going from left to right. With negative slope the line moves down
when going from left to right. The higher the value the steeper the line.

7
Start Date – The date on which the paving process first began on the project.
Std. Dev. (Standard Deviation) equation: 1 - nX - (X
s ∑=2)
Std. Dev. – V (Standard Deviation minus the V Factor) - A comparison of the standard
deviation for the process to the historical standard deviation for the element, the V
Factor. Negative values indicate that the process has a smaller standard deviation than
historically reported. The lower this calculated value the better. The standard deviation
for the process is one of the two factors that affect the calculation for quality level. The
other factor is the mean for the process in relationship to the specification limits.
Subaccount – A five digit numeric identifier unique to each project.
Trendline equation: bmxy +=
Where: m = slope of the line.
b = y-intercept.
TV (Target Value) - A calculated value for the mean of a process which would result in
85% of the material being within specification limits if it was produced at the same
standard deviation as historical data, the V factor. The target value for the compressive
strength, sand equivalent, and flexural strength elements is the lower specification limit
plus V times 1.65. For the thickness element the target value is plan thickness plus V
times 0.65. The lower specification limit in the thickness element is plan thickness
minus 0.4 of an inch or 10 mm.
V (V Factor) - One standard deviation for the test element based on historical data.
Weighted Average – The weighted average calculation used in this report is calculated
based on the amount of material represented.
8
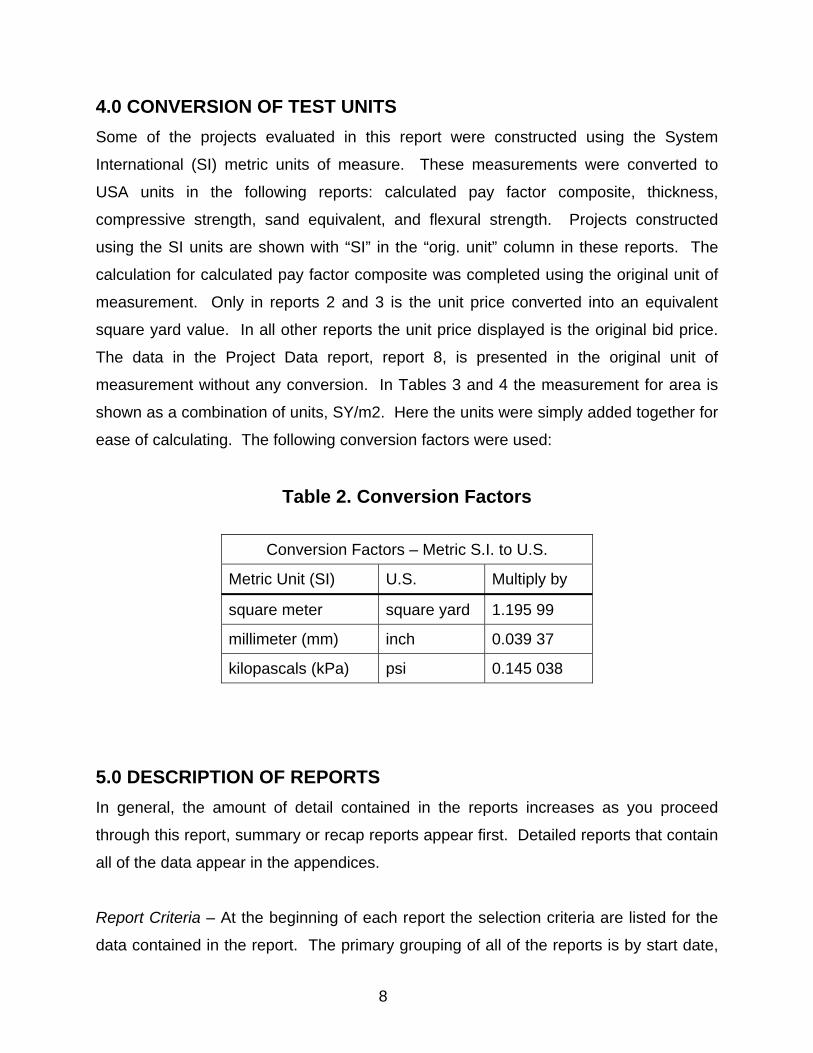
4.0 CONVERSION OF TEST UNITS Some of the projects evaluated in this report were constructed using the System
International (SI) metric units of measure. These measurements were converted to
USA units in the following reports: calculated pay factor composite, thickness,
compressive strength, sand equivalent, and flexural strength. Projects constructed
using the SI units are shown with “SI” in the “orig. unit” column in these reports. The
calculation for calculated pay factor composite was completed using the original unit of
measurement. Only in reports 2 and 3 is the unit price converted into an equivalent
square yard value. In all other reports the unit price displayed is the original bid price.
The data in the Project Data report, report 8, is presented in the original unit of
measurement without any conversion. In Tables 3 and 4 the measurement for area is
shown as a combination of units, SY/m2. Here the units were simply added together for
ease of calculating. The following conversion factors were used:
Table 2. Conversion Factors
Conversion Factors – Metric S.I. to U.S.
Metric Unit (SI) U.S. Multiply by
square meter square yard 1.195 99
millimeter (mm) inch 0.039 37
kilopascals (kPa) psi 0.145 038
5.0 DESCRIPTION OF REPORTS In general, the amount of detail contained in the reports increases as you proceed
through this report, summary or recap reports appear first. Detailed reports that contain
all of the data appear in the appendices.
Report Criteria – At the beginning of each report the selection criteria are listed for the
data contained in the report. The primary grouping of all of the reports is by start date,
9
the date on which the actual paving began. Quality levels are not calculated on
processes that contain less than three test results. Therefore, these processes are
excluded from the reports that contain quality level calculations. Other justifications as
to why a project or process is excluded from the report are detailed in the report criteria.
Sample Size – Not too many conclusions should be drawn when the number of
observations, sample size, is small. Generally speaking, an evaluation of five or less
samples is not considered very reliable. Always check the number of samples included
in the evaluation when doing comparisons of the data. Most of the reports presented
here will indicate the number of samples included in the various data groupings.
Figures in this report will have associated tables that will give the number of samples
included.
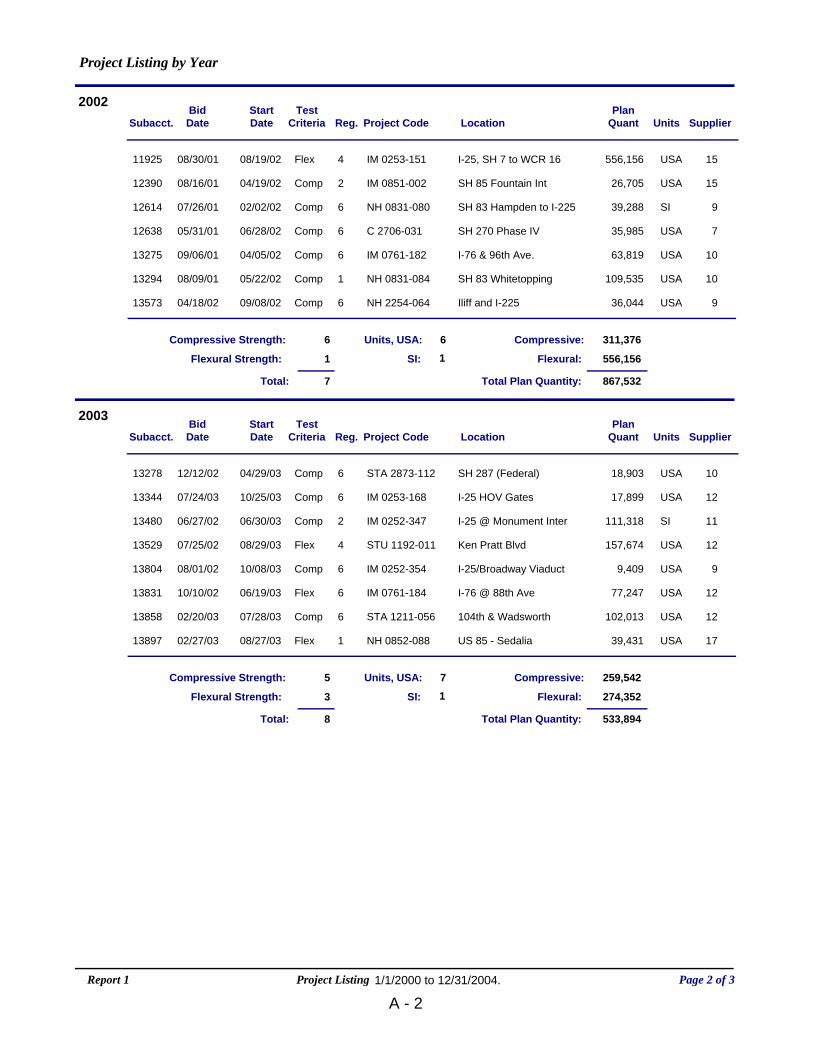
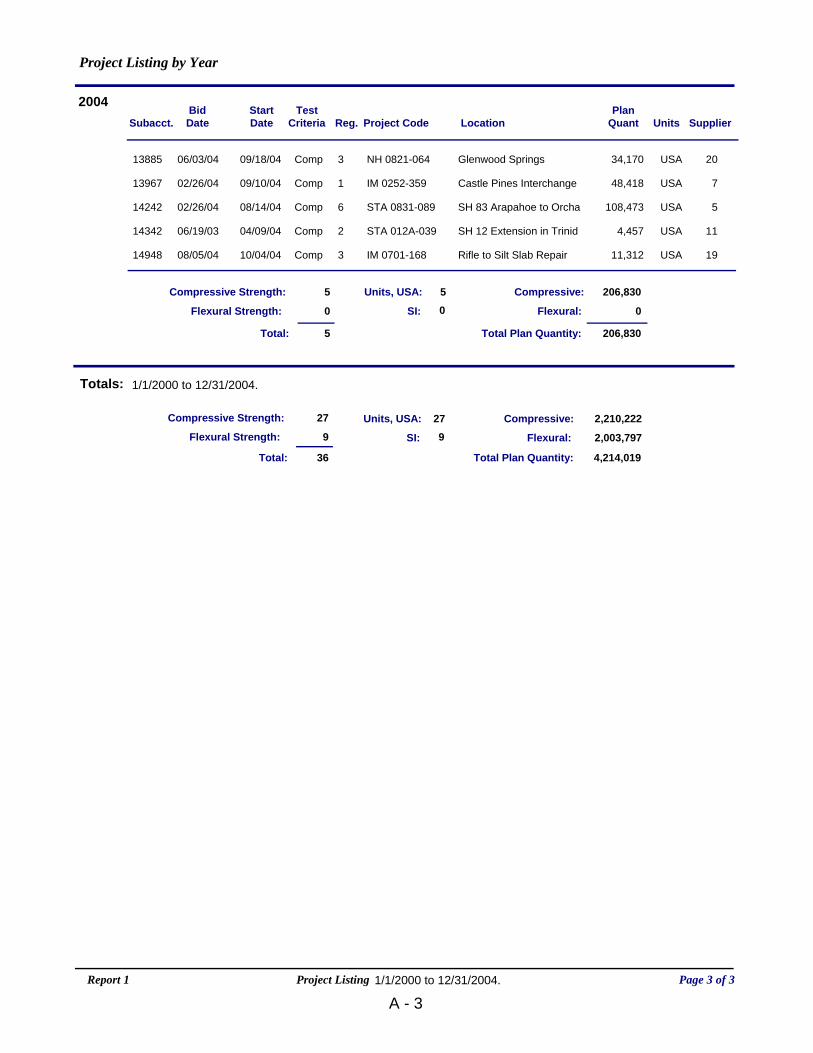
Project Listing, report 1. This report contains project information for the projects
included in the evaluation with start dates from 1/1/2000 through 12/31/2004. The
report is grouped by year and is sorted by subaccount. The subaccount, start date, bid
date, test criteria, region, project code, location, total plan quantity, testing units, and
supplier ID are listed for each project. Totals are calculated for each of the testing
criteria and for the test unit.
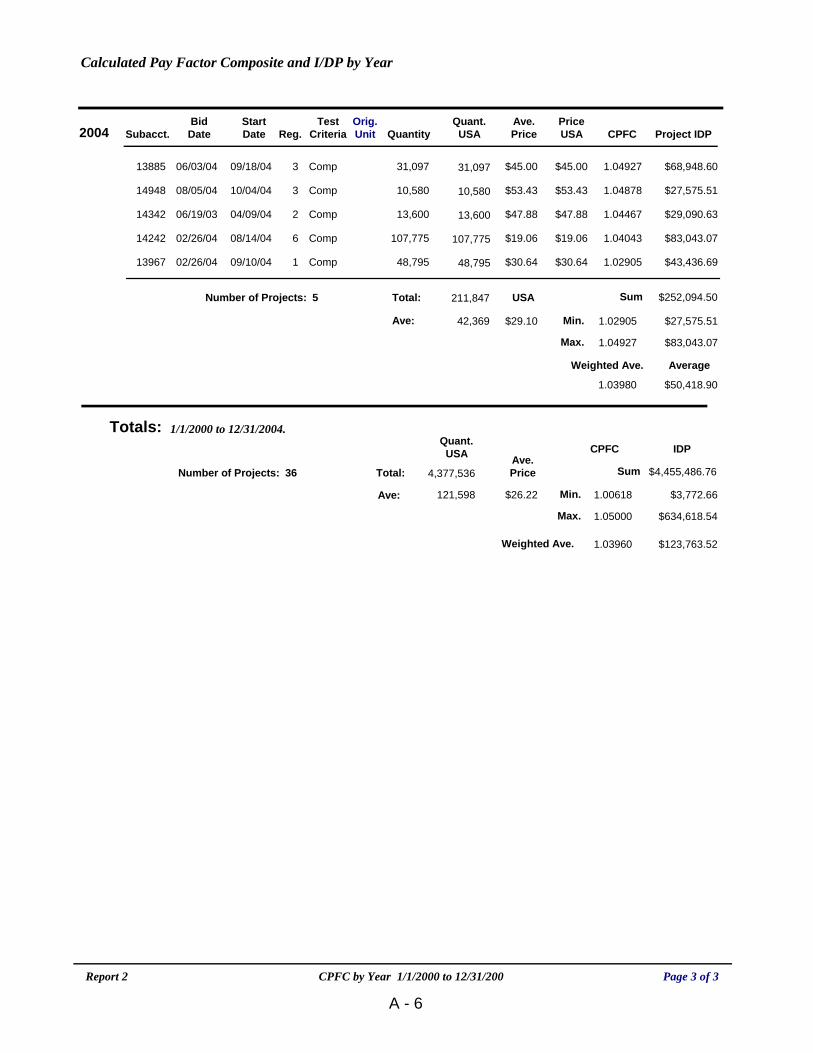
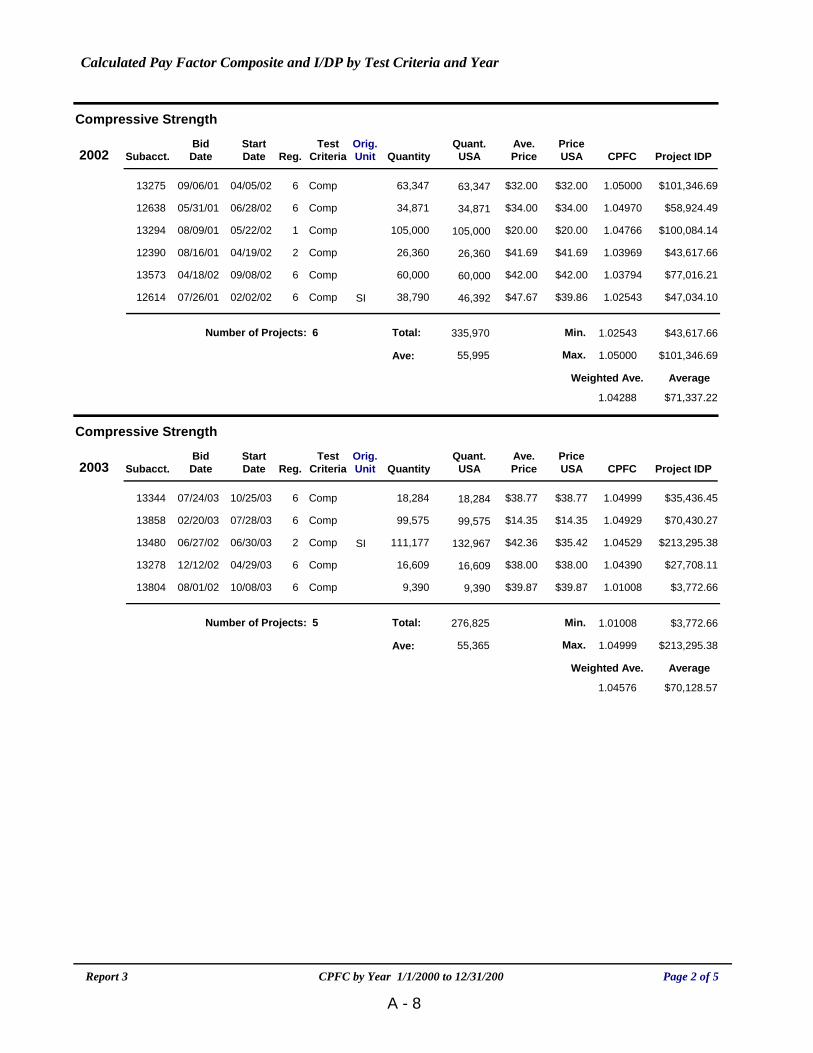
Calculated Pay Factor Composite and I/DP, reports 2 & 3. These reports evaluate
two key calculations for each project, the Calculated Pay Factor Composite (CPFC) and
the project Incentive/Disincentive Payment (I/DP). The Calculated Pay Factor
Composite gives an index of the overall quality of the PCCP; see Calculations and
Definitions for details on the calculation of the CPFC. The I/DP is the incentive or
disincentive amount the project received for the PCCP. Report 2 groups the projects by
year. For each year the total and average quantities are displayed in USA units. A
calculated average price in USA units is also displayed. The maximum and minimum
values for CPFC and I/DP are given for each year. A weighted average is calculated for
CPFC. A non-weighted average is calculated for I/DP for each year. At the end of the
report the maximum, minimum, and weighted averages are given for the start date

10
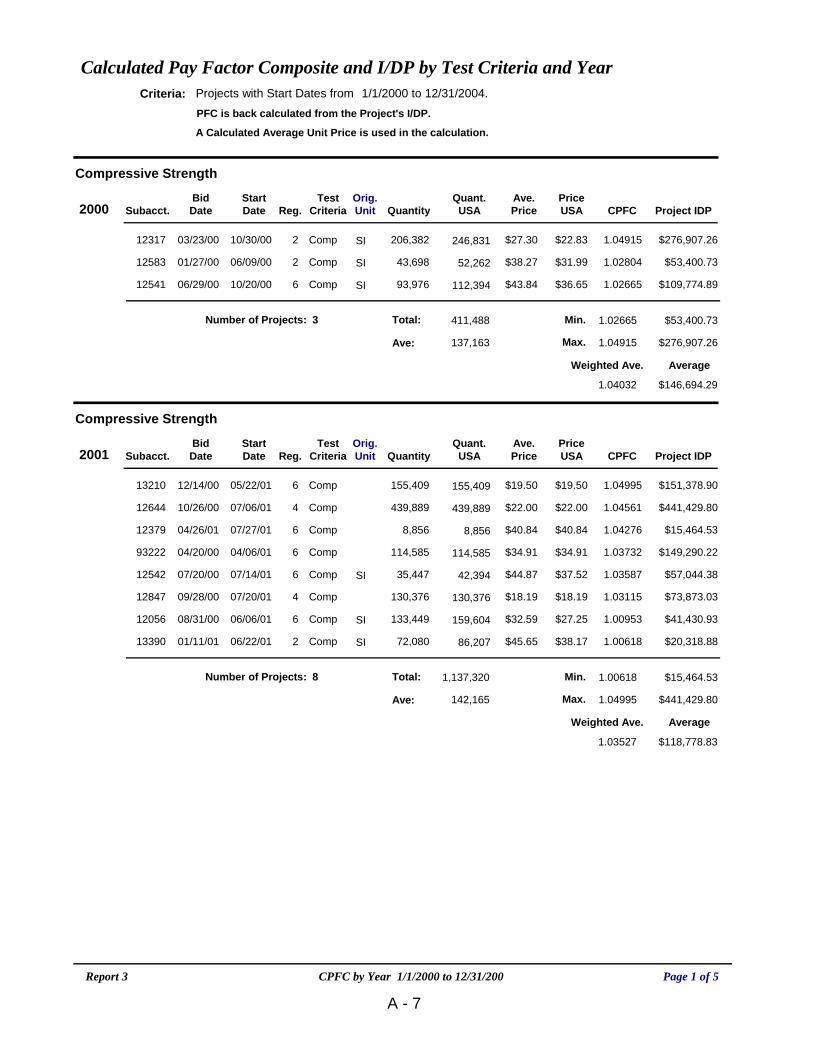
range contained in the report. Report 3 contains the same data and calculations as
report 2 except that the projects are first grouped by test criteria, compressive strength
or flexural strength, and then by year. This allows an easier comparison of the projects
that were constructed using that type of testing criteria.
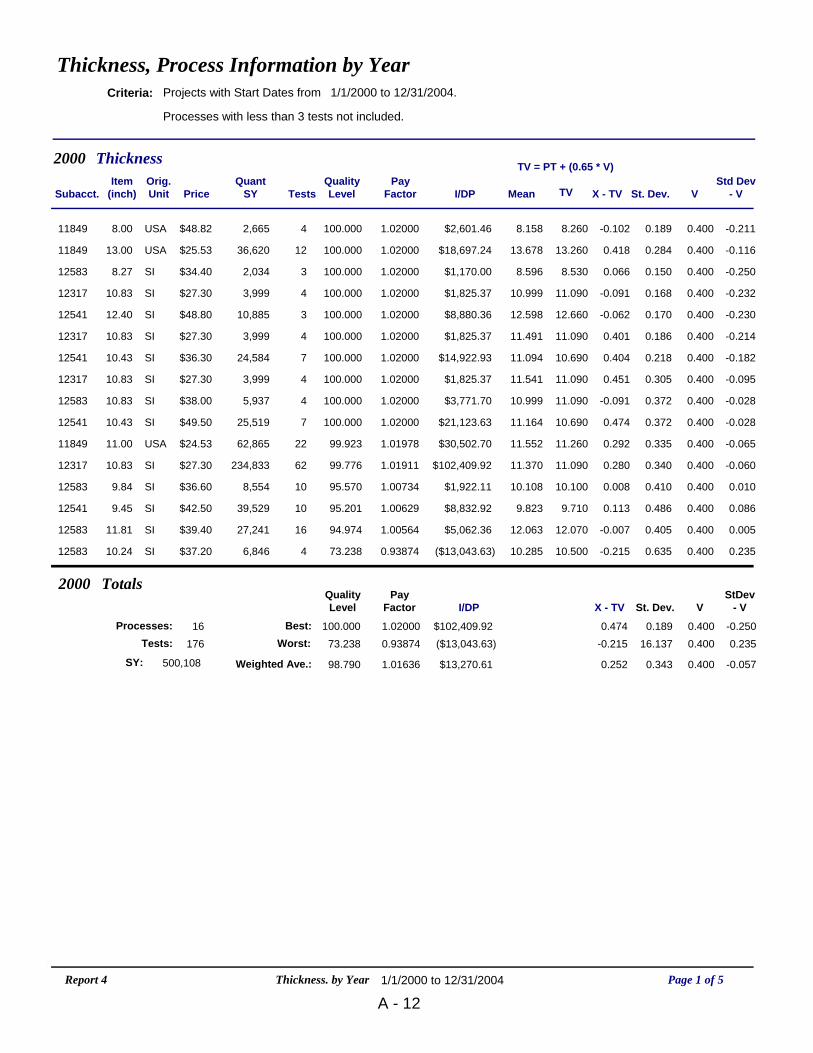
Process Information by Year: Thickness, Compressive Strength, Sand Equivalent,
& Flexural Strength reports 4, 5, 6, & 7. These reports detail each of the test
elements by year and list all of the process information. The criteria for each report are
listed in the report header. Processes with less than three tests are excluded from
these reports since no quality levels are calculated on these processes. For each year,
the best, worst, and weighted average are given for quality level, pay factor, I/DP, mean
minus target value, standard deviation, and standard deviation minus the V factor. The
mean to target value and standard deviation minus V factor calculations are important
whenever evaluating the quality level for the process, see calculations.
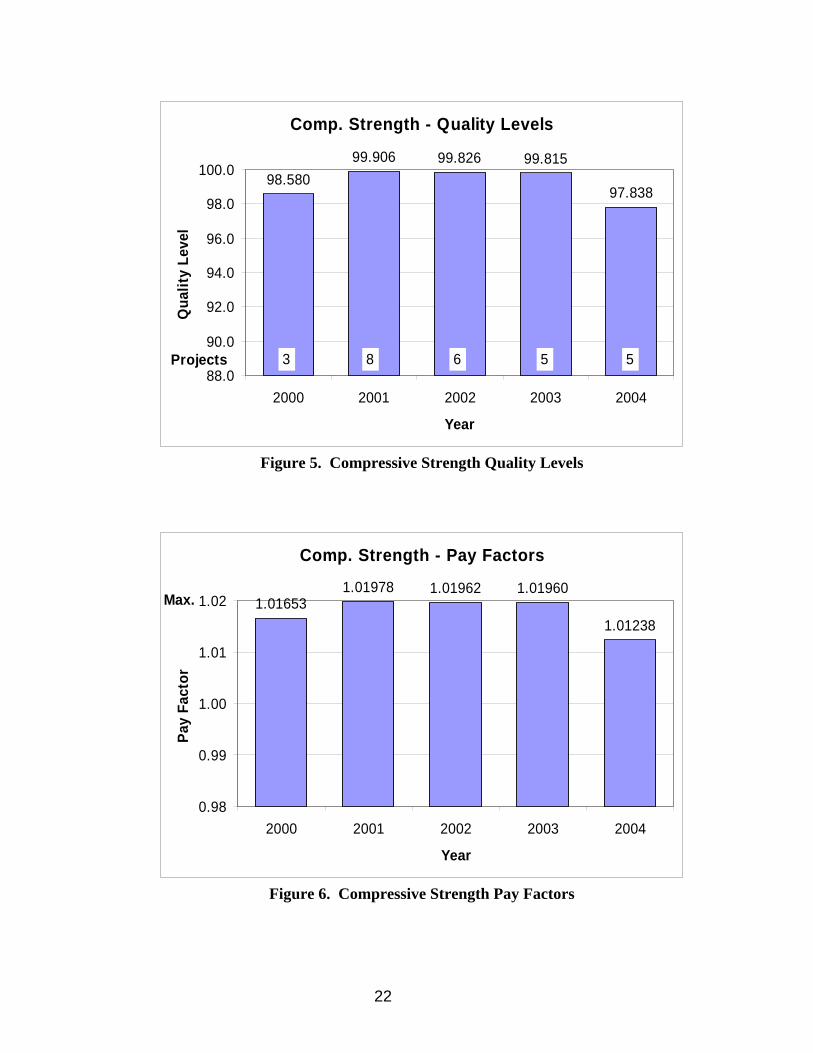
Note – There were no flexural strength projects evaluated in 2004.
Note - There is not a direct correlation between quality level and pay factor. The
calculations for pay factors are dependent on the number of tests and the quantity of
material associated with each process. A difference in the number of tests in two
processes can result in a different calculation for pay factor even if the quality levels are
the same. Please refer to the Revision to Sections 105, 106, and 412 for details on the
calculations.
Note - The best or worst results displayed do not necessarily come from the same
process. The calculations for quality level and pay factor are dependent on the number
of test results included in the process and vary slightly as the number of tests are
changed. Also, the calculation for quality level is dependent on both the standard
deviation of the process and the mean for the process as it relates to the specification
limits. A small standard deviation does not necessarily mean a high quality level.
Likewise, a larger standard deviation does not necessarily mean a lower quality level.
11
Project Data, report 8. The Project Data report displays all of the QC/QA data
reported for each project which had a start date in 2004. The projects are sorted by
subaccount. Each project’s data is detailed by test element and then process. For
each process the item, price, quantity, number of tests, quality level, pay factor, I/DP,
mean, target value, mean minus target value, standard deviation, V factor, and standard
deviation minus the V factor are given. Project totals are given for each project. For
each element the number of tests, quantity, and I/DP are calculated. The calculation for
CPFC is detailed for each project. This report contains all of the project’s data and is
the best report to review when concerned about an individual project. All of a project’s
data may not be contained in other reports if that data does not meet that report’s
individual criteria.
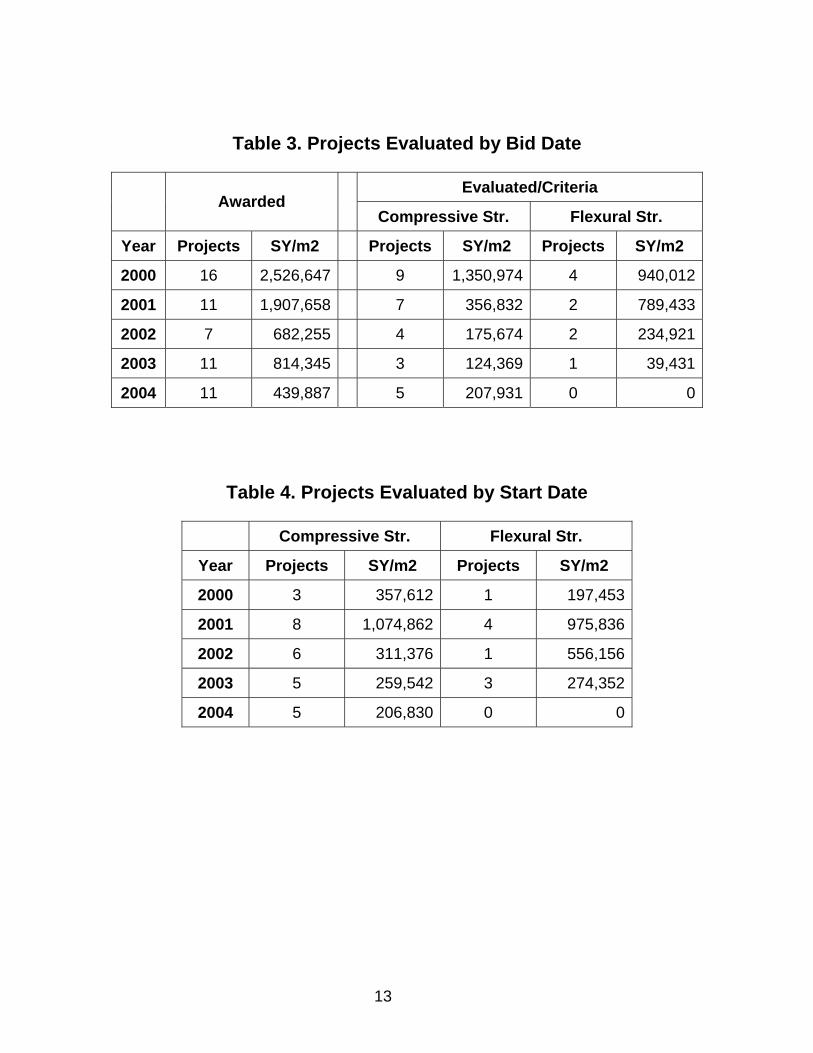
6.0 DISCUSSION OF THE DATA 6.1 Projects Evaluated Table 3 displays the number of projects and amount of material awarded and evaluated
by bid date. Table 4 displays the number of projects and amount of material evaluated
by start date. The start date is defined as the date on which the paving process began
and is not the date the project was awarded to contract, bid date. The paving on many
of the projects began in the year after they were awarded to contract. In a couple of
instances the paving began in the second year. Grouping the projects according to start
date more accurately groups the projects together as to when they were constructed.
The start date is used as the primary data grouping throughout this report.
Some of the projects included in this evaluation were constructed using SI metric units.
In Tables 3 and 4 the amount of material is shown as a combination of units. This was
done to quickly present the quantity without having to do a conversion or display two
separate values. The data was converted to USA units in the calculated pay factor
composite, thickness, compressive strength, sand equivalent, and flexural strength
reports.

12
A relatively small number of projects are included in some of the data groupings. In
three of the yearly evaluations only one project was included in the evaluation. Not too
many conclusions should be made when the number of projects is small, less than five
being a general rule. None of the yearly groupings for flexural strength contained more
than four projects. In the years 2000 and 2002 only one project is evaluated. No
flexural strength projects have been evaluated for 2004. Even though there is a
somewhat limited amount of data for flexural strength a good evaluation of the
specifications can be conducted. Additional project data will be added to the database
as they are received by the Pavement Design Unit.
13
Table 3. Projects Evaluated by Bid Date
Evaluated/Criteria Awarded
Compressive Str. Flexural Str.
Year Projects SY/m2 Projects SY/m2 Projects SY/m2
2000 16 2,526,647 9 1,350,974 4 940,012
2001 11 1,907,658 7 356,832 2 789,433
2002 7 682,255 4 175,674 2 234,921
2003 11 814,345 3 124,369 1 39,431
2004 11 439,887 5 207,931 0 0
Table 4. Projects Evaluated by Start Date
Compressive Str. Flexural Str.
Year Projects SY/m2 Projects SY/m2
2000 3 357,612 1 197,453
2001 8 1,074,862 4 975,836
2002 6 311,376 1 556,156
2003 5 259,542 3 274,352
2004 5 206,830 0 0
14
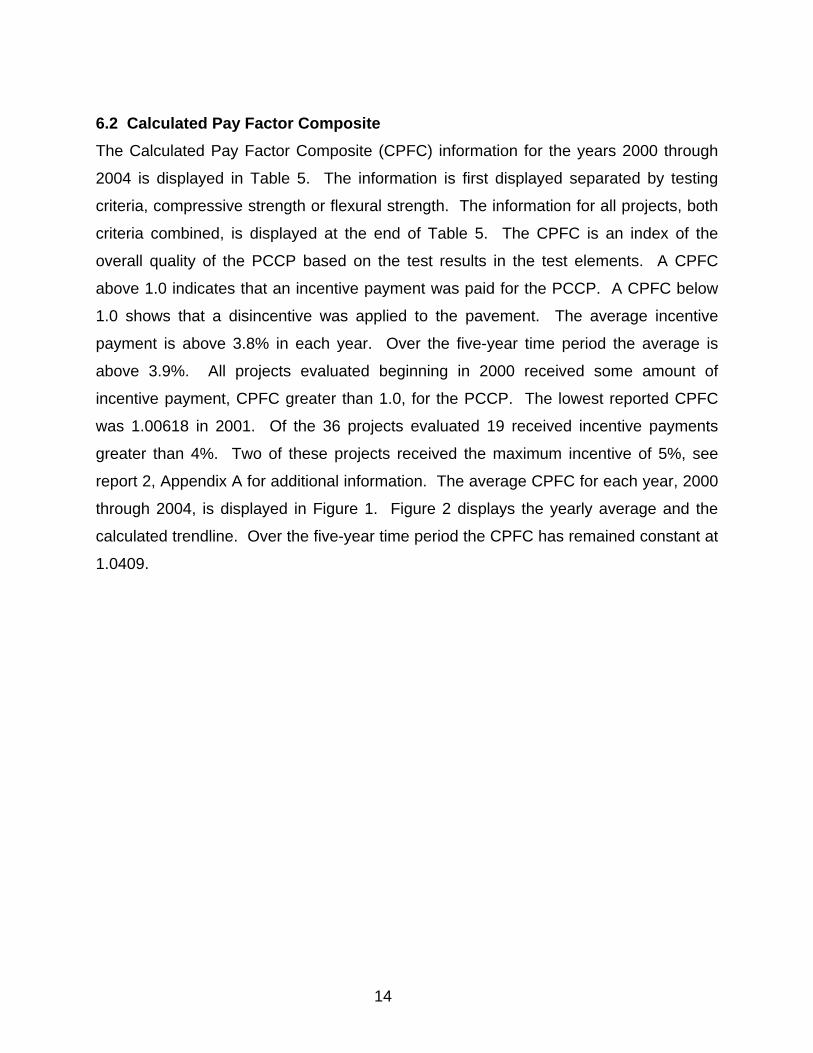
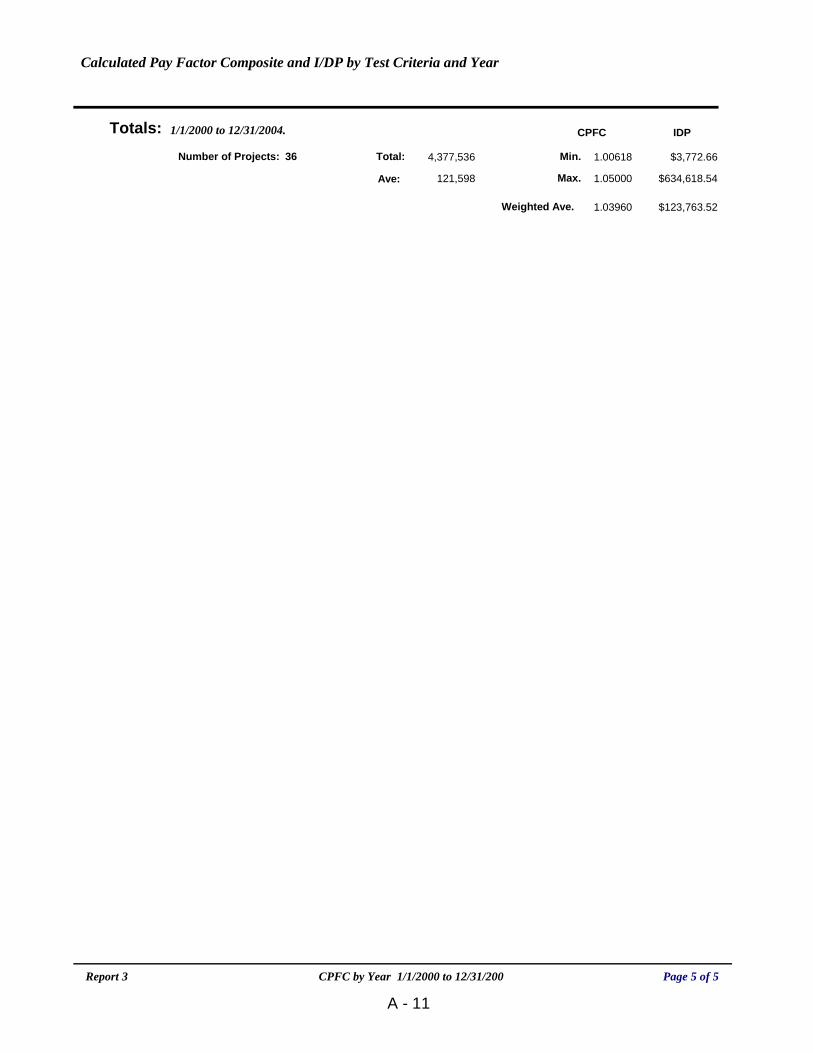
6.2 Calculated Pay Factor Composite The Calculated Pay Factor Composite (CPFC) information for the years 2000 through
2004 is displayed in Table 5. The information is first displayed separated by testing
criteria, compressive strength or flexural strength. The information for all projects, both
criteria combined, is displayed at the end of Table 5. The CPFC is an index of the
overall quality of the PCCP based on the test results in the test elements. A CPFC
above 1.0 indicates that an incentive payment was paid for the PCCP. A CPFC below
1.0 shows that a disincentive was applied to the pavement. The average incentive
payment is above 3.8% in each year. Over the five-year time period the average is
above 3.9%. All projects evaluated beginning in 2000 received some amount of
incentive payment, CPFC greater than 1.0, for the PCCP. The lowest reported CPFC
was 1.00618 in 2001. Of the 36 projects evaluated 19 received incentive payments
greater than 4%. Two of these projects received the maximum incentive of 5%, see
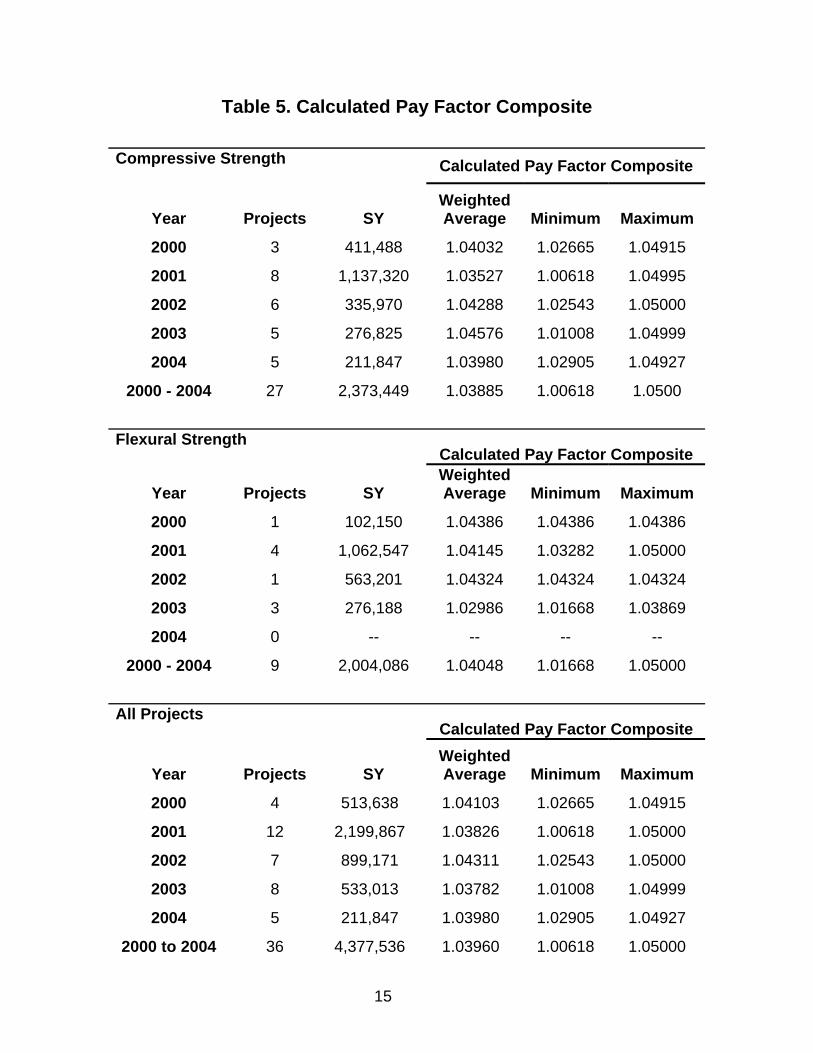
report 2, Appendix A for additional information. The average CPFC for each year, 2000
through 2004, is displayed in Figure 1. Figure 2 displays the yearly average and the
calculated trendline. Over the five-year time period the CPFC has remained constant at
1.0409.
15
Table 5. Calculated Pay Factor Composite
Compressive Strength Calculated Pay Factor Composite
Year Projects SY Weighted Average Minimum Maximum
2000 3 411,488 1.04032 1.02665 1.04915
2001 8 1,137,320 1.03527 1.00618 1.04995
2002 6 335,970 1.04288 1.02543 1.05000
2003 5 276,825 1.04576 1.01008 1.04999
2004 5 211,847 1.03980 1.02905 1.04927
2000 - 2004 27 2,373,449 1.03885 1.00618 1.0500
Flexural Strength
Calculated Pay Factor Composite
Year Projects SY Weighted Average Minimum Maximum
2000 1 102,150 1.04386 1.04386 1.04386
2001 4 1,062,547 1.04145 1.03282 1.05000
2002 1 563,201 1.04324 1.04324 1.04324
2003 3 276,188 1.02986 1.01668 1.03869
2004 0 -- -- -- --
2000 - 2004 9 2,004,086 1.04048 1.01668 1.05000
All Projects
Calculated Pay Factor Composite
Year Projects SY Weighted Average Minimum Maximum
2000 4 513,638 1.04103 1.02665 1.04915
2001 12 2,199,867 1.03826 1.00618 1.05000
2002 7 899,171 1.04311 1.02543 1.05000
2003 8 533,013 1.03782 1.01008 1.04999
2004 5 211,847 1.03980 1.02905 1.04927
2000 to 2004 36 4,377,536 1.03960 1.00618 1.05000
16
Figure 1. Calculated Pay Factor Composite by Year
Figure 2. Calculated Pay Factor Composite with Trendline
Calculated Pay Factor CompositeAll Projects
1.041031.03826
1.043111.03782 1.03980
0.98
0.99
1.00
1.01
1.02
1.03
1.04
1.05
2000 2001 2002 2003 2004Year
CPF
C
4 12 7 8 5Projects
Calculated Pay Factor CompositeAll Projects
y = -0.0003x + 1.0409
0.98
0.99
1.00
1.01
1.02
1.03
1.04
1.05
2000 2001 2002 2003 2004
Year
CPF
C
CPFCLinear (CPFC)
17
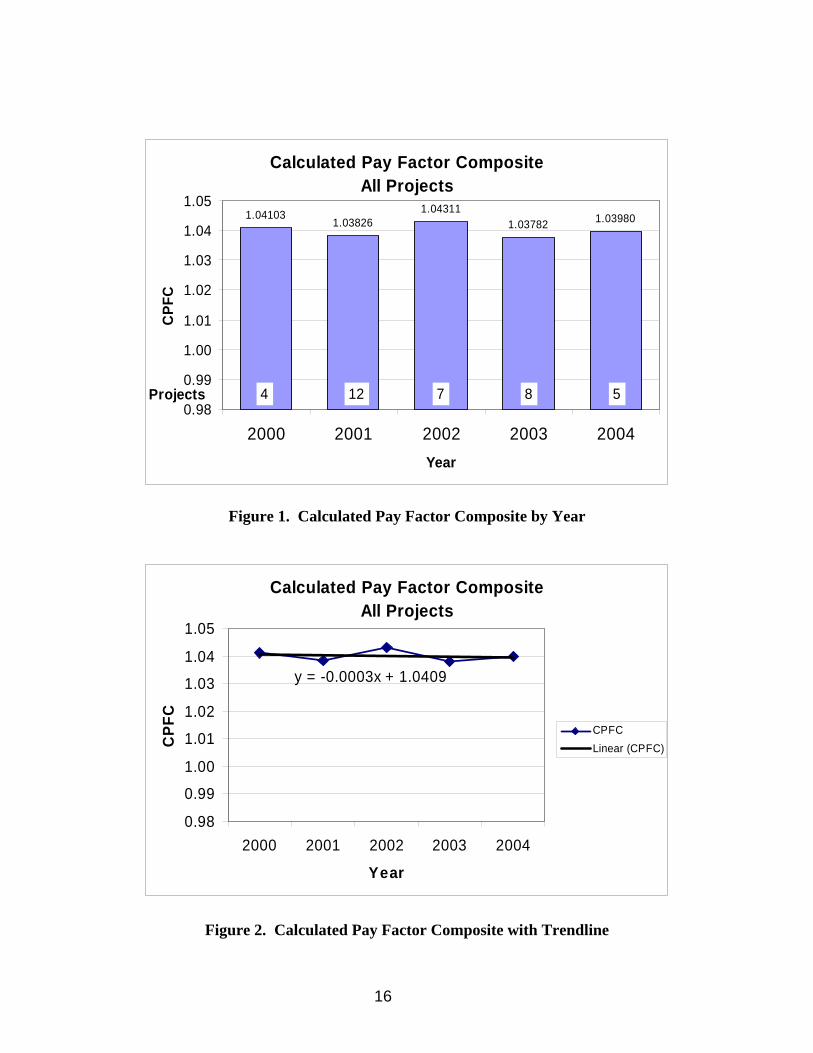
6.3 Incentive/Disincentive Payments A recap of the Incentive/Disincentive Payments for the years 2000 through 2004 is
presented in Table 6; additional information is presented in report 2, Appendix A. Every
project evaluated received some amount of incentive payment. The average incentive
has been just slightly under 4% over the five-year time period. The average size of the
projects reported in 2003 and 2004 is significantly smaller than those reported in the
first three years. The calculation for I/DP is directly tied to the size of the project, CPFC
times quantity. This accounts for the smaller I/DPs reported in 2003 and 2004. The
I/DP is important when evaluating the projects but a better way to evaluate the quality of
the PCCP is to evaluate the CPFC and element quality levels.
Table 6. Incentive/Disincentive Payments – Recap by Year
Square Yards Incentive/Disincentive Payment
Year Projects Total Average Summation Average Minimum Maximum
2000 4 513,638 128,409 $554,571.76 $138,642.94 $53,400.73 $276,907.26
2001 12 2,199,867 183,322 $2,036,956.43 $169,746.37 $15,464.53 $441,429.80
2002 7 899,171 128,453 $1,062,641.83 $151,805.98 $43,617.66 $634,618.54
2003 8 553,013 69,127 $549,222.24 $68,652.78 $3,772.66 $213,295.38
2004 5 211,847 42,369 $252,094.50 $50,418.90 $27,575.51 $83,043.07
‘00 to ‘04 36 4,377,536 121,598 $4,455,486.76 $123,763.52 $3,772.66 $634,618.54
6.4 Recap of Data 2000 through 2004 - Thickness, Compressive Strength, Sand Equivalent, & Flexural Strength The results for each of the test elements for the years 2000 through 2004 are listed in
Table 7. The quality level, pay factor, and standard deviation are shown for each
element. The mean to target value and standard deviation minus V factor are also
calculated. The mean to target value calculation shows the relationship between the
mean for the test results in comparison to the target value for the element. Negative
numbers indicate that the mean is below the target value. Positive values show that the
18
mean is above the target value. The higher the calculated value the better as it shows
that the mean is moving farther away from the lower specification limit increasing the
likelihood that more of the material will be within specification limits. The standard
deviation minus V factor shows the comparison of the standard deviation for the test
results to the historical standard deviation, the V factor. A negative number indicates
that the standard deviation for the test results is smaller than the historical values.
Positive values show that the process standard deviations have exceeded the historical
values.
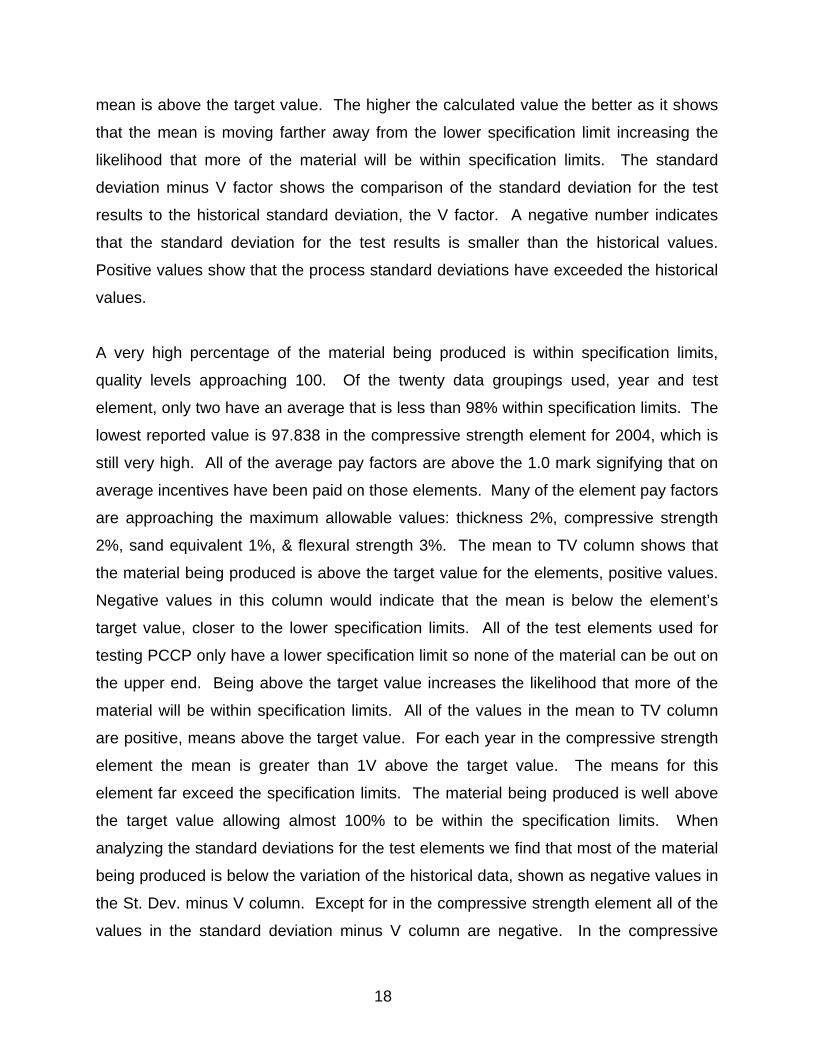
A very high percentage of the material being produced is within specification limits,
quality levels approaching 100. Of the twenty data groupings used, year and test
element, only two have an average that is less than 98% within specification limits. The
lowest reported value is 97.838 in the compressive strength element for 2004, which is
still very high. All of the average pay factors are above the 1.0 mark signifying that on
average incentives have been paid on those elements. Many of the element pay factors
are approaching the maximum allowable values: thickness 2%, compressive strength
2%, sand equivalent 1%, & flexural strength 3%. The mean to TV column shows that
the material being produced is above the target value for the elements, positive values.
Negative values in this column would indicate that the mean is below the element’s
target value, closer to the lower specification limits. All of the test elements used for
testing PCCP only have a lower specification limit so none of the material can be out on
the upper end. Being above the target value increases the likelihood that more of the
material will be within specification limits. All of the values in the mean to TV column
are positive, means above the target value. For each year in the compressive strength
element the mean is greater than 1V above the target value. The means for this
element far exceed the specification limits. The material being produced is well above
the target value allowing almost 100% to be within the specification limits. When
analyzing the standard deviations for the test elements we find that most of the material
being produced is below the variation of the historical data, shown as negative values in
the St. Dev. minus V column. Except for in the compressive strength element all of the
values in the standard deviation minus V column are negative. In the compressive

19
strength element the values are just slightly above the V value. The variation in this
element is slightly above the historical values. However, this element has the best
results in the mean to target value calculation, which allows a high percentage of the
material to be within specification limits even with a slightly greater variance. Figures 3
through 10 display the quality levels and pay factors for each of the elements.
Table 7. Recap of Yearly Data by Test Element
Thickness
Year Proj. SY TestsQuality Level
Pay Factor
Mean to TV St. Dev. V
St. Dev. - V
2000 4 500,108 176 98.790 1.01636 0.252 0.343 0.400 -0.057
2001 12 2,136,138 764 97.899 1.01139 0.155 0.350 0.400 -0.050
2002 7 873,914 339 98.745 1.01662 0.235 0.362 0.400 -0.038
2003 8 551,015 255 98.509 1.01430 0.231 0.354 0.400 -0.046
2004 5 211,847 88 99.727 1.01922 0.376 0.302 0.400 -0.098 Max 1.02
Compressive Strength
Year Proj. SY TestsQuality Level
Pay Factor
Mean to TV St. Dev. V
St. Dev. - V
2000 3 391,323 72 98.580 1.01653 1,050 421 400 21
2001 8 1,124,612 433 99.906 1.01978 936 426 400 26
2002 6 340,823 127 99.826 1.01962 1,133 518 400 118
2003 5 262,087 145 99.815 1.01960 893 363 400 -37
2004 5 211,847 105 97.838 1.01238 536 465 400 65 Max 1.02
Sand Equivalent
Year Proj. SY TestsQuality Level
Pay Factor
Mean to TV St. Dev. V
St. Dev. - V
2000 3 376,434 81 99.999 1.01000 2.77 2.360 4.000 -1.640
2001 8 1,120,825 415 98.861 1.00711 4.74 2.114 4.000 -1.886
2002 6 270,823 101 99.818 1.00974 7.08 2.062 4.000 -1.938
2003 5 273,401 150 99.765 1.00975 4.07 2.093 4.000 -1.907
2004 5 211,847 115 99.147 1.00847 2.11 2.046 4.000 -1.954 Max 1.01

20
Flexural Strength
Year Proj. SY TestsQuality Level
Pay Factor
Mean to TV St. Dev. V
St. Dev. - V
2000 1 99,735 51 99.089 1.02524 16.1 39.966 50.000 -10.034
2001 4 1,029,489 161 99.596 1.02827 45.2 38.340 50.000 -11.660
2002 1 546,334 237 99.982 1.02991 59.1 38.279 50.000 -11.721
2003 3 261,650 103 98.452 1.02077 11.2 44.446 50.000 -5.554
2004 0 -- -- -- -- -- -- -- --
Max 1.03

21
Figure 3. Thickness Quality Levels
Figure 4. Thickness Pay Factors
Thickness - Quality Levels
98.79097.899
98.745 98.50999.727
88.0
90.0
92.0
94.0
96.0
98.0
100.0
2000 2001 2002 2003 2004
Year
Qua
lity
Leve
l
4 12 7 8 5Projects
Thickness - Pay Factors
1.01636
1.01139
1.016621.01430
1.01922
0.98
0.99
1.00
1.01
1.02
2000 2001 2002 2003 2004
Year
Pay
Fact
or
Max.
22
Figure 5. Compressive Strength Quality Levels
Figure 6. Compressive Strength Pay Factors
Comp. Strength - Quality Levels
98.58099.906 99.826 99.815
97.838
88.0
90.0
92.0
94.0
96.0
98.0
100.0
2000 2001 2002 2003 2004
Year
Qua
lity
Leve
l
3 8 6 5 5Projects
Comp. Strength - Pay Factors
1.016531.01978 1.01962 1.01960
1.01238
0.98
0.99
1.00
1.01
1.02
2000 2001 2002 2003 2004
Year
Pay
Fact
or
Max.

23
Figure 7. Sand Equivalent Quality Levels
Figure 8. Sand Equivalent Pay Factors
Sand Equivalent - Quality Levels99.999
98.86199.818 99.765
99.147
88.0
90.0
92.0
94.0
96.0
98.0
100.0
2000 2001 2002 2003 2004
Year
Qua
lity
Leve
l
3 8 6 5 5Projects
Sand Equivalent - Pay Factors1.01000
1.007111.00974 1.00975 1.00847
0.98
0.99
1.00
1.01
2000 2001 2002 2003 2004
Year
Pay
Fact
or
Max.
24
Note: No flexural strength projects have been reported for 2004.
Figure 9. Flexural Strength Quality Levels
Figure 10. Flexural Strength Pay Factors
Flexural Strength - Quality Levels
99.089 99.596 99.982
98.452
88.0
90.0
92.0
94.0
96.0
98.0
100.0
2000 2001 2002 2003 2004
Year
Qua
lity
Leve
l
1 4 1 3Projects 0
Flexural Strength - Pay Factors
1.025241.02827 1.02991
1.02077
0.98
0.99
1.00
1.01
1.02
1.03
2000 2001 2002 2003 2004
Year
Pay
Fact
or
Max.

25
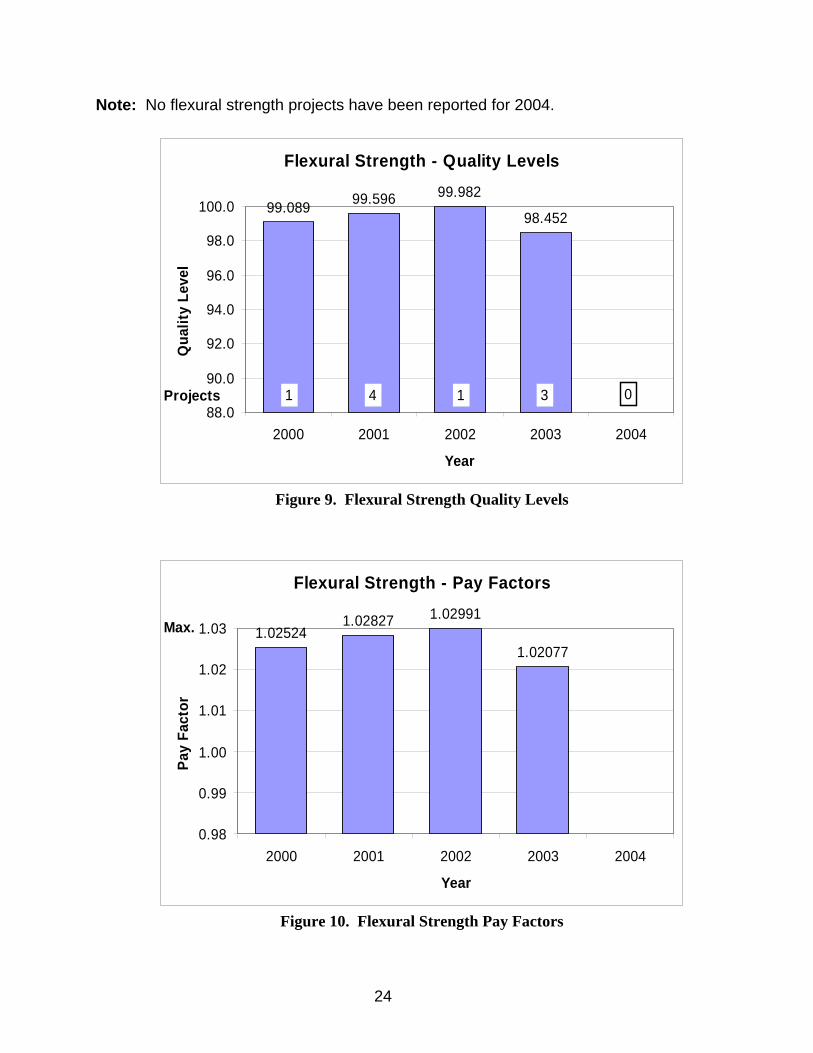
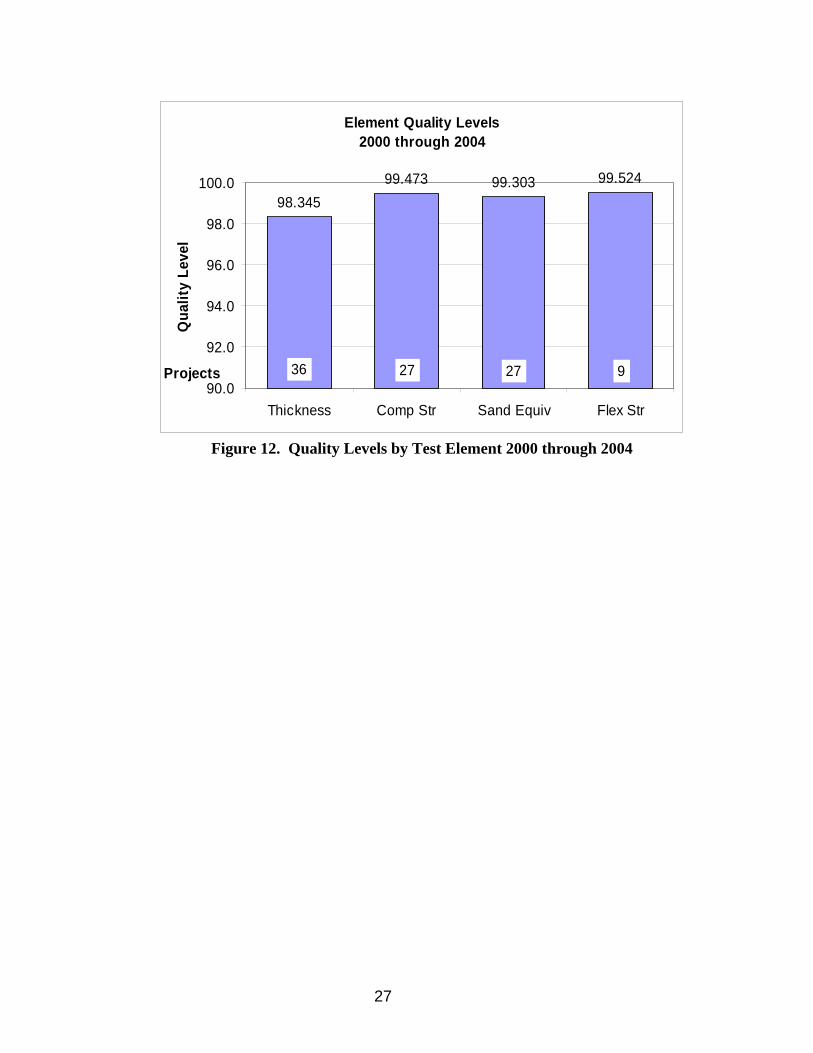
6.5 Test Element Quality Levels 2000 through 2004 Table 8 displays the average quality levels for each year for each of the test elements. The
five-year average is also calculated for each of the elements. Figure 11 plots the yearly
results for each of the elements. No unique distinguishing patterns can be found for any of
the elements when reviewing this graph. The element quality levels overlap each other and
cross other elements numerous times. The difference between the quality levels of the
individual elements is very small. All of the quality levels are within a small range of values
at a very high level, slightly below 98% to almost 100% in specification limits. The quality
levels of the elements are not distinctly gapped. No one test element has significantly lower
quality levels than any of the others. The five-year average for each of the elements is
displayed in Figure 12. Again we see that the quality levels are at very high levels. The
lowest reported value is 98.345 in the thickness element. All of the other elements have an
average quality level above 99% within specification limits. The yearly quality levels and the
calculated trendlines are displayed for the elements in Figures 13 and 14. The calculated
slopes for the sand equivalent and compressive strength elements are negative but the
value is quite small. The slope indicates a slight decrease but is essentially flat. The slope
for the thickness element at 0.25 is the steepest of any of the elements and shows a slight
improvement. A limited number of projects comprise the flexural strength element. Only
one project is included in the evaluations for 2000 and 2002. No projects have been
evaluated for 2004. Three and four projects were evaluated in 2001 and 2003 respectively.
The limited number of projects is not good for trend predictions. The quality levels in this
element are maintaining very acceptable levels with an average above 99.5% within
specification. All of the test element quality levels are essentially at a constant level, only
showing slight movement. The percent within specification limits is at a very high
percentage, above 98%.
26
Table 8. Quality Levels by Test Element
Thickness Comp. Str. Sand Equiv. Flex. Str.
Year Projects QL Projects QL Projects QL Projects QL
2000 4 98.790 3 98.580 3 99.999 1 99.089
2001 12 97.899 8 99.906 8 98.861 4 99.596
2002 7 98.745 6 99.826 6 99.818 1 99.982
2003 8 98.509 5 99.815 5 99.765 3 98.452
2004 5 99.727 5 97.838 5 99.147 0 --
00-04 36 98.345 27 99.473 27 99.303 9 99.524
Figure 11. Quality Levels by Test Element
Element Quality Levels
90.0
92.0
94.0
96.0
98.0
100.0
2000 2001 2002 2003 2004
Year
Qua
lity
Leve
l
ThicknessComp. Str.Sand Equiv.Flex. Str.
27
Figure 12. Quality Levels by Test Element 2000 through 2004
Element Quality Levels2000 through 2004
98.34599.473 99.303 99.524
90.0
92.0
94.0
96.0
98.0
100.0
Thickness Comp Str Sand Equiv Flex Str
Qua
lity
Leve
l
36 27 27 9Projects

28
Figure 13. Compressive Strength & Sand Equivalent with Trendline
Figue 14. Thickness & Flexural Strength with Trendline
Element Quality LevelsComp. Str. & Sand Equiv. Sand Equiv.
y = -0.080x + 99.758
Comp. Str.y = -0.158x + 99.666
90.0
92.0
94.0
96.0
98.0
100.0
2000 2001 2002 2003 2004
Year
Qua
lity
Leve
l
Sand Equiv.Comp. Str.Linear (Sand Equiv.)Linear (Comp. Str.)
Element Quality LevelsFlex. Str. & Thickness
Thicknessy = 0.2484x + 97.989
Flex. Str.y = -0.1525x + 99.661
90.0
92.0
94.0
96.0
98.0
100.0
2000 2001 2002 2003 2004
Year
Qua
lity
Leve
l
Flex. Str.Thic knessLinear (Thic kness)Linear (Flex. Str.)
29
6.6 Process Information by Year Reports, 2000 through 2004 Additional information on the calculations presented previously in this report can be found in
the reports contained in Appendix A. A listing of projects for each year is contained in report
1. Additional project information can be found in this report. The Calculated Pay Factor
Composite and Incentive/Disincentive Payment information for each project is detailed in
reports 2 and 3. The weighted average is calculated for CPFC and the average I/DP for all
of the projects are displayed. The maximum and minimum values are also shown. The
totals for each year are also calculated. A detailed report for each of the test elements is
also contained in Appendix A, reports 4 to 7. The process information for each of the test
elements used in the evaluation is detailed by year. The weighted average is calculated for
quality level, pay factor, I/DP, mean to target value, standard deviation, and standard
deviation minus V factor. The best and worst result is also given for each of the evaluations.
Note - The best or worst results displayed in the reports do not necessarily come from the
same process. The calculations for quality level and pay factor are dependent on the
number of test results included in the process and vary slightly depending on the number of
tests. Also, the calculation for quality level is dependent on both the standard deviation of
the process and the mean for the process as it relates to the specification limits. A small
standard deviation does not necessarily mean a high quality level. Likewise, a larger
standard deviation does not necessarily mean a lower quality level.
6.7 Project Data for 2004 Appendix B contains report 8, Project Data, which details all of the test data for each project
with a start date of 2004. The projects are sorted by subaccount. Each project’s data is
sorted by test element and then by process number. This is the only report which contains
all of a project’s data. All of a project’s data may not be contained in other reports if that
data does not meet that report’s individual criteria. The calculation of CPFC is detailed for
each project in the Project Data report. This report is the best report to review when
concerned about any single project.
30
7.0 SUMMARY The PCCP on the projects evaluated from 2000 through 2004 have shown good test results.
The average incentive payment is above 3.8% in each of the years. Over the five-year time
period the average is above 3.9%, maximum incentive being 5%. All projects evaluated
received some amount of incentive payment for the PCCP. The lowest reported CPFC was
1.00618 in 2001. Of the 36 projects evaluated 19 received incentive payments greater than
4%. Two of these projects received the maximum incentive of 5%. Over the five-year time
period the CPFC has remained at a constant level.
When evaluating each of the test elements we find that of the twenty data groupings used,
year and test element, only two of these have an average quality level that is less than 98%
within specification limits. The lowest reported value is 97.838 in the compressive strength
element for 2004, which is still very high. All of the average pay factors for the elements are
above the 1.0 mark signifying that on average incentives have been paid on those elements.
Many of the pay factors for the individual elements are approaching the maximum allowable
values: thickness 2%, compressive strength 2%, sand equivalent 1%, & flexural strength
3%. The five year averages being: thickness 1.0138, compressive strength 1.0185, sand
equivalent 1.0084, & flexural strength 1.0276. Two factors affect the quality level
calculations, the mean for the process in relationship to the target value and the standard
deviation of the process in comparison to the V value. The mean to TV calculations show
that the material being produced is above the target value for the elements. Having a mean
above the target value increases the likelihood that more of the material will be within
specification limits. All of the average values in the mean to TV calculations are positive.
For each year in the compressive strength element the mean is greater than 1V above the
target value. The means for this element far exceed the specification limits. Overall the
material being produced is well above the target value allowing almost 100% to be within the
specification limits. When analyzing the standard deviations for the test elements we find
that most of the material being produced is below the variation of the historical data,
negative values in the standard deviation minus V calculations. The exception to this is in
the compressive strength element which has values just slightly above the V values. The
variation in this element is slightly above the historical values. However, this element has

31
the best results in the mean to target value calculation which allows a high percentage of the
material to be within specification limits even with a slightly greater variance.
All of the average yearly quality levels for the elements are within a small range of values at
a very high level, just slightly below 98% to almost 100% within specification. The results for
all of the test elements are tightly grouped. The elements’ five-year average quality levels
are at very high levels. The lowest reported value is 98.345 in the thickness element. All of
the other elements have an average quality level above 99% within specification. The
results for each of the elements show that the quality levels are at a constant level as shown
by the calculated trendlines. There is only a slight calculated decrease in the sand
equivalent and compressive strength elements. The slope for these elements is essentially
flat. The slope for the thickness element at 0.25 does show a slight improvement. A limited
number of projects comprise the flexural strength element. Only one project is included in
the evaluations for 2000 and 2002. No projects have been evaluated for 2004. Three and
four projects were evaluated in 2001 and 2003 respectively. The quality levels in this
element are maintaining very acceptable levels with an average above 99.5% within
specification. All of the element quality levels are essentially remaining at constant levels,
only sight movement indicated. The percent within specification limits is at a very high
percentage, above 98%.
8.0 UPDATES AND CONTACT The QC database will be updated as additional project data is received. Project data that
was received after the cut-off date was not able to be included in this report. If you have any
questions concerning this report please contact Eric Chavez at 303 757-9308,
[email protected]. If you find any errors in the project data please report them to
Eric Chavez.

32
REFERENCES Standard Recommended Practice for Acceptance Sampling Plans for Highway Construction, AASHTO Designation: R9-97 (2000) Colorado Procedure 71-01, Standard Practice for Determining Quality Level (Percent Within Tolerance Limits). Portland Cement Concrete Pavement Review of QC/QA Data 2000 through 2003, (January 2005, Eric Chavez, Colorado Department of Transportation, 4201 East Arkansas Ave, Denver, CO 80222), Report No. CDOT-DTD-R-2005-9. URLs CDOT Library: http://www.dot.state.co.us/Publications/Library.htm CDOT Standard Special Provisions: http://www.dot.state.co.us/DesignSupport/Construction/2005SpecsBook/2005SSP/2005_SSP_Index.htm CDOT Field Materials Manual: http://www.dot.state.co.us/DesignSupport/Field%20Materials%20Manual/2006/Field%20Material%20Manual.htm CDOT Application Software: http://www.dot.state.co.us/ecsu/Products.asp

Appendix A Reports for Project Data 2000 through 2004
Report 1 Project Listing by Year 2000 through 2004........................................... A - 1 Report 2 Calculated Pay Factor Composite and I/DP by Year ........................... A - 4 Report 3 Calculated Pay Factor Composite and I/DP by Test Criteria/Year ...... A - 7 Report 4 Thickness Process Information by Year ............................................... A - 12 Report 5 Compressive Strength Process Information by Year............................ A - 17 Report 6 Sand Equivalent Process Information by Year ..................................... A - 22 Report 7 Flexural Strength Process Information by Year .................................... A - 27

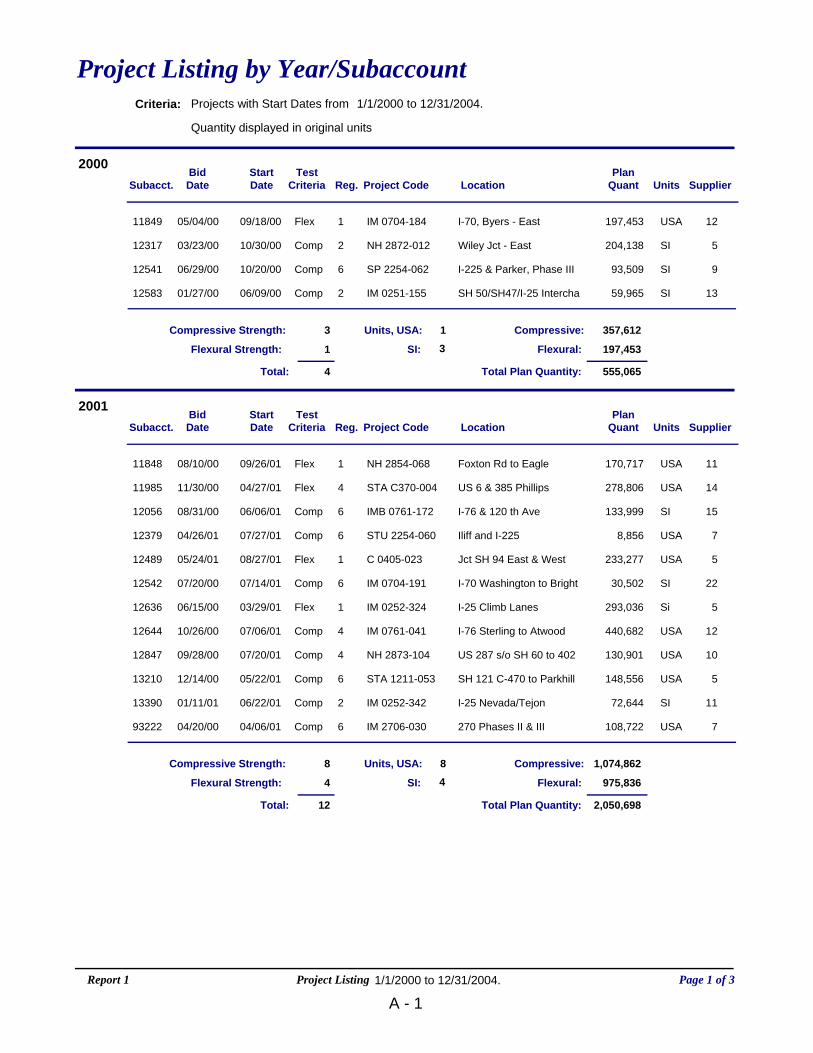
Project Listing by Year/SubaccountProjects with Start Dates from 1/1/2000 to 12/31/2004.Criteria:
Quantity displayed in original units
2000Subacct.
BidDate Reg. Project Code Location
PlanQuant Supplier
TestCriteria Units
StartDate
11849 05/04/00 1 IM 0704-184 I-70, Byers - East 197,453Flex 12USA09/18/00
12317 03/23/00 2 NH 2872-012 Wiley Jct - East 204,138Comp 5SI10/30/00
12541 06/29/00 6 SP 2254-062 I-225 & Parker, Phase III 93,509Comp 9SI10/20/00
12583 01/27/00 2 IM 0251-155 SH 50/SH47/I-25 Intercha 59,965Comp 13SI06/09/00
Compressive Strength: 3
Flexural Strength: 1
Total: 4 Total Plan Quantity: 555,065
SI: 3Units, USA: 1 Compressive: 357,612
Flexural: 197,453
2001Subacct.
BidDate Reg. Project Code Location
PlanQuant Supplier
TestCriteria Units
StartDate
11848 08/10/00 1 NH 2854-068 Foxton Rd to Eagle 170,717Flex 11USA09/26/01
11985 11/30/00 4 STA C370-004 US 6 & 385 Phillips 278,806Flex 14USA04/27/01
12056 08/31/00 6 IMB 0761-172 I-76 & 120 th Ave 133,999Comp 15SI06/06/01
12379 04/26/01 6 STU 2254-060 Iliff and I-225 8,856Comp 7USA07/27/01
12489 05/24/01 1 C 0405-023 Jct SH 94 East & West 233,277Flex 5USA08/27/01
12542 07/20/00 6 IM 0704-191 I-70 Washington to Bright 30,502Comp 22SI07/14/01
12636 06/15/00 1 IM 0252-324 I-25 Climb Lanes 293,036Flex 5Si03/29/01
12644 10/26/00 4 IM 0761-041 I-76 Sterling to Atwood 440,682Comp 12USA07/06/01
12847 09/28/00 4 NH 2873-104 US 287 s/o SH 60 to 402 130,901Comp 10USA07/20/01
13210 12/14/00 6 STA 1211-053 SH 121 C-470 to Parkhill 148,556Comp 5USA05/22/01
13390 01/11/01 2 IM 0252-342 I-25 Nevada/Tejon 72,644Comp 11SI06/22/01
93222 04/20/00 6 IM 2706-030 270 Phases II & III 108,722Comp 7USA04/06/01
Compressive Strength: 8
Flexural Strength: 4
Total: 12 Total Plan Quantity: 2,050,698
SI: 4Units, USA: 8 Compressive: 1,074,862
Flexural: 975,836
Page 1 of 3Project ListingReport 1 1/1/2000 to 12/31/2004.
A - 1
Project Listing by Year
2002Subacct.
BidDate Reg. Project Code Location
PlanQuant Supplier
TestCriteria Units
StartDate
11925 08/30/01 4 IM 0253-151 I-25, SH 7 to WCR 16 556,156Flex 15USA08/19/02
12390 08/16/01 2 IM 0851-002 SH 85 Fountain Int 26,705Comp 15USA04/19/02
12614 07/26/01 6 NH 0831-080 SH 83 Hampden to I-225 39,288Comp 9SI02/02/02
12638 05/31/01 6 C 2706-031 SH 270 Phase IV 35,985Comp 7USA06/28/02
13275 09/06/01 6 IM 0761-182 I-76 & 96th Ave. 63,819Comp 10USA04/05/02
13294 08/09/01 1 NH 0831-084 SH 83 Whitetopping 109,535Comp 10USA05/22/02
13573 04/18/02 6 NH 2254-064 Iliff and I-225 36,044Comp 9USA09/08/02
Compressive Strength: 6
Flexural Strength: 1
Total: 7 Total Plan Quantity: 867,532
SI: 1Units, USA: 6 Compressive: 311,376
Flexural: 556,156
2003Subacct.
BidDate Reg. Project Code Location
PlanQuant Supplier
TestCriteria Units
StartDate
13278 12/12/02 6 STA 2873-112 SH 287 (Federal) 18,903Comp 10USA04/29/03
13344 07/24/03 6 IM 0253-168 I-25 HOV Gates 17,899Comp 12USA10/25/03
13480 06/27/02 2 IM 0252-347 I-25 @ Monument Inter 111,318Comp 11SI06/30/03
13529 07/25/02 4 STU 1192-011 Ken Pratt Blvd 157,674Flex 12USA08/29/03
13804 08/01/02 6 IM 0252-354 I-25/Broadway Viaduct 9,409Comp 9USA10/08/03
13831 10/10/02 6 IM 0761-184 I-76 @ 88th Ave 77,247Flex 12USA06/19/03
13858 02/20/03 6 STA 1211-056 104th & Wadsworth 102,013Comp 12USA07/28/03
13897 02/27/03 1 NH 0852-088 US 85 - Sedalia 39,431Flex 17USA08/27/03
Compressive Strength: 5
Flexural Strength: 3
Total: 8 Total Plan Quantity: 533,894
SI: 1Units, USA: 7 Compressive: 259,542
Flexural: 274,352
Page 2 of 3Project ListingReport 1 1/1/2000 to 12/31/2004.
A - 2
Project Listing by Year
2004Subacct.
BidDate Reg. Project Code Location
PlanQuant Supplier
TestCriteria Units
StartDate
13885 06/03/04 3 NH 0821-064 Glenwood Springs 34,170Comp 20USA09/18/04
13967 02/26/04 1 IM 0252-359 Castle Pines Interchange 48,418Comp 7USA09/10/04
14242 02/26/04 6 STA 0831-089 SH 83 Arapahoe to Orcha 108,473Comp 5USA08/14/04
14342 06/19/03 2 STA 012A-039 SH 12 Extension in Trinid 4,457Comp 11USA04/09/04
14948 08/05/04 3 IM 0701-168 Rifle to Silt Slab Repair 11,312Comp 19USA10/04/04
Compressive Strength: 5
Flexural Strength: 0
Total: 5 Total Plan Quantity: 206,830
SI: 0Units, USA: 5 Compressive: 206,830
Flexural: 0
Compressive Strength: 27
Flexural Strength: 9
Total: 36 Total Plan Quantity: 4,214,019
Totals: 1/1/2000 to 12/31/2004.
SI: 9Units, USA: 27 Compressive: 2,210,222
Flexural: 2,003,797
Page 3 of 3Project ListingReport 1 1/1/2000 to 12/31/2004.
A - 3

Calculated Pay Factor Composite and I/DP by YearProjects with Start Dates from 1/1/2000 to 12/31/2004.Criteria:PFC is back calculated from the Project's I/DP.
A Calculated Average Unit Price is used in the calculation.
Subacct.BidDate Reg.
TestCriteria Project IDPCPFCQuantity2000
Ave.Price
StartDate
Orig.Unit
Quant.USA
PriceUSA
12317 03/23/00 2 Comp $276,907.261.04915206,382 $27.3010/30/00 SI 246,831 $22.83
11849 05/04/00 1 Flex $114,488.881.04386102,150 $25.5209/18/00 102,150 $25.52
12583 01/27/00 2 Comp $53,400.731.0280443,698 $38.2706/09/00 SI 52,262 $31.99
12541 06/29/00 6 Comp $109,774.891.0266593,976 $43.8410/20/00 SI 112,394 $36.65
Number of Projects: 4
$276,907.26
$53,400.73
1.04915
1.02665
Max.
Min.
513,638Total:
1.04103 $138,642.94
Weighted Ave. Average
128,409Ave:
$554,571.76Sum
$27.32
USA
Subacct.BidDate Reg.
TestCriteria Project IDPCPFCQuantity2001
Ave.Price
StartDate
Orig.Unit
Quant.USA
PriceUSA
12489 05/24/01 1 Flex $305,316.231.05000232,911 $26.2208/27/01 232,911 $26.22
13210 12/14/00 6 Comp $151,378.901.04995155,409 $19.5005/22/01 155,409 $19.50
11848 08/10/00 1 Flex $244,413.181.04921171,047 $29.0409/26/01 171,047 $29.04
12644 10/26/00 4 Comp $441,429.801.04561439,889 $22.0007/06/01 439,889 $22.00
12379 04/26/01 6 Comp $15,464.531.042768,856 $40.8407/27/01 8,856 $40.84
11985 11/30/00 4 Flex $230,921.841.04103288,305 $19.5204/27/01 288,305 $19.52
93222 04/20/00 6 Comp $149,290.221.03732114,585 $34.9104/06/01 114,585 $34.91
12542 07/20/00 6 Comp $57,044.381.0358735,447 $44.8707/14/01 SI 42,394 $37.52
12636 06/15/00 1 Flex $306,074.511.03282309,605 $30.2503/29/01 SI 370,284 $25.29
12847 09/28/00 4 Comp $73,873.031.03115130,376 $18.1907/20/01 130,376 $18.19
12056 08/31/00 6 Comp $41,430.931.00953133,449 $32.5906/06/01 SI 159,604 $27.25
13390 01/11/01 2 Comp $20,318.881.0061872,080 $45.6506/22/01 SI 86,207 $38.17
Number of Projects: 12
$441,429.80
$15,464.53
1.05000
1.00618
Max.
Min.
2,199,867Total:
1.03826 $169,746.37
Weighted Ave. Average
183,322Ave:
$2,036,956.43Sum
$24.88
USA
Page 1 of 31/1/2000 to 12/31/200CPFC by YearReport 2
A - 4

Calculated Pay Factor Composite and I/DP by Year
Subacct.BidDate Reg.
TestCriteria Project IDPCPFCQuantity2002
Ave.Price
StartDate
Orig.Unit
Quant.USA
PriceUSA
13275 09/06/01 6 Comp $101,346.691.0500063,347 $32.0004/05/02 63,347 $32.00
12638 05/31/01 6 Comp $58,924.491.0497034,871 $34.0006/28/02 34,871 $34.00
13294 08/09/01 1 Comp $100,084.141.04766105,000 $20.0005/22/02 105,000 $20.00
11925 08/30/01 4 Flex $634,618.541.04324563,201 $26.0608/19/02 563,201 $26.06
12390 08/16/01 2 Comp $43,617.661.0396926,360 $41.6904/19/02 26,360 $41.69
13573 04/18/02 6 Comp $77,016.211.0379460,000 $42.0009/08/02 60,000 $42.00
12614 07/26/01 6 Comp $47,034.101.0254338,790 $47.6702/02/02 SI 46,392 $39.86
Number of Projects: 7
$634,618.54
$43,617.66
1.05000
1.02543
Max.
Min.
899,171Total:
1.04311 $151,805.98
Weighted Ave. Average
128,453Ave:
$1,062,641.83Sum
$28.31
USA
Subacct.BidDate Reg.
TestCriteria Project IDPCPFCQuantity2003
Ave.Price
StartDate
Orig.Unit
Quant.USA
PriceUSA
13344 07/24/03 6 Comp $35,436.451.0499918,284 $38.7710/25/03 18,284 $38.77
13858 02/20/03 6 Comp $70,430.271.0492999,575 $14.3507/28/03 99,575 $14.35
13480 06/27/02 2 Comp $213,295.381.04529111,177 $42.3606/30/03 SI 132,967 $35.42
13278 12/12/02 6 Comp $27,708.111.0439016,609 $38.0004/29/03 16,609 $38.00
13831 10/10/02 6 Flex $97,410.141.0386992,389 $27.2506/19/03 92,389 $27.25
13529 07/25/02 4 Flex $82,355.031.02834137,704 $21.1008/29/03 137,704 $21.10
13897 02/27/03 1 Flex $18,814.201.0166846,095 $24.4708/27/03 46,095 $24.47
13804 08/01/02 6 Comp $3,772.661.010089,390 $39.8710/08/03 9,390 $39.87
Number of Projects: 8
$213,295.38
$3,772.66
1.04999
1.01008
Max.
Min.
553,013Total:
1.03782 $68,652.78
Weighted Ave. Average
69,127Ave:
$549,222.24Sum
$26.05
USA
Page 2 of 31/1/2000 to 12/31/200CPFC by YearReport 2
A - 5
Calculated Pay Factor Composite and I/DP by Year
Subacct.BidDate Reg.
TestCriteria Project IDPCPFCQuantity2004
Ave.Price
StartDate
Orig.Unit
Quant.USA
PriceUSA
13885 06/03/04 3 Comp $68,948.601.0492731,097 $45.0009/18/04 31,097 $45.00
14948 08/05/04 3 Comp $27,575.511.0487810,580 $53.4310/04/04 10,580 $53.43
14342 06/19/03 2 Comp $29,090.631.0446713,600 $47.8804/09/04 13,600 $47.88
14242 02/26/04 6 Comp $83,043.071.04043107,775 $19.0608/14/04 107,775 $19.06
13967 02/26/04 1 Comp $43,436.691.0290548,795 $30.6409/10/04 48,795 $30.64
Number of Projects: 5
$83,043.07
$27,575.51
1.04927
1.02905
Max.
Min.
211,847Total:
1.03980 $50,418.90
Weighted Ave. Average
42,369Ave:
$252,094.50Sum
$29.10
USA
Totals:IDPCPFC
1/1/2000 to 12/31/2004.
Number of Projects: 36
$634,618.54
$3,772.66
1.05000
1.00618
Max.
Min.
4,377,536Total:
Weighted Ave. 1.03960 $123,763.52
121,598Ave:
$4,455,486.76Sum
$26.22
Ave.Price
Quant.USA
Page 3 of 31/1/2000 to 12/31/200CPFC by YearReport 2
A - 6
Calculated Pay Factor Composite and I/DP by Test Criteria and YearProjects with Start Dates from 1/1/2000 to 12/31/2004.Criteria:PFC is back calculated from the Project's I/DP.
A Calculated Average Unit Price is used in the calculation.
Subacct.BidDate Reg.
TestCriteria Project IDPCPFCQuantity2000
Ave.Price
StartDate
Orig.Unit
Quant.USA
PriceUSA
Compressive Strength
12317 03/23/00 2 Comp $276,907.261.04915206,382 $27.3010/30/00 SI 246,831 $22.83
12583 01/27/00 2 Comp $53,400.731.0280443,698 $38.2706/09/00 SI 52,262 $31.99
12541 06/29/00 6 Comp $109,774.891.0266593,976 $43.8410/20/00 SI 112,394 $36.65
Number of Projects: 3
$276,907.26
$53,400.73
1.04915
1.02665
Max.
Min.411,488Total:
1.04032 $146,694.29
Weighted Ave. Average
137,163Ave:
Subacct.BidDate Reg.
TestCriteria Project IDPCPFCQuantity2001
Ave.Price
StartDate
Orig.Unit
Quant.USA
PriceUSA
Compressive Strength
13210 12/14/00 6 Comp $151,378.901.04995155,409 $19.5005/22/01 155,409 $19.50
12644 10/26/00 4 Comp $441,429.801.04561439,889 $22.0007/06/01 439,889 $22.00
12379 04/26/01 6 Comp $15,464.531.042768,856 $40.8407/27/01 8,856 $40.84
93222 04/20/00 6 Comp $149,290.221.03732114,585 $34.9104/06/01 114,585 $34.91
12542 07/20/00 6 Comp $57,044.381.0358735,447 $44.8707/14/01 SI 42,394 $37.52
12847 09/28/00 4 Comp $73,873.031.03115130,376 $18.1907/20/01 130,376 $18.19
12056 08/31/00 6 Comp $41,430.931.00953133,449 $32.5906/06/01 SI 159,604 $27.25
13390 01/11/01 2 Comp $20,318.881.0061872,080 $45.6506/22/01 SI 86,207 $38.17
Number of Projects: 8
$441,429.80
$15,464.53
1.04995
1.00618
Max.
Min.1,137,320Total:
1.03527 $118,778.83
Weighted Ave. Average
142,165Ave:
Page 1 of 51/1/2000 to 12/31/200CPFC by YearReport 3
A - 7
Calculated Pay Factor Composite and I/DP by Test Criteria and Year
Subacct.BidDate Reg.
TestCriteria Project IDPCPFCQuantity2002
Ave.Price
StartDate
Orig.Unit
Quant.USA
PriceUSA
Compressive Strength
13275 09/06/01 6 Comp $101,346.691.0500063,347 $32.0004/05/02 63,347 $32.00
12638 05/31/01 6 Comp $58,924.491.0497034,871 $34.0006/28/02 34,871 $34.00
13294 08/09/01 1 Comp $100,084.141.04766105,000 $20.0005/22/02 105,000 $20.00
12390 08/16/01 2 Comp $43,617.661.0396926,360 $41.6904/19/02 26,360 $41.69
13573 04/18/02 6 Comp $77,016.211.0379460,000 $42.0009/08/02 60,000 $42.00
12614 07/26/01 6 Comp $47,034.101.0254338,790 $47.6702/02/02 SI 46,392 $39.86
Number of Projects: 6
$101,346.69
$43,617.66
1.05000
1.02543
Max.
Min.335,970Total:
1.04288 $71,337.22
Weighted Ave. Average
55,995Ave:
Subacct.BidDate Reg.
TestCriteria Project IDPCPFCQuantity2003
Ave.Price
StartDate
Orig.Unit
Quant.USA
PriceUSA
Compressive Strength
13344 07/24/03 6 Comp $35,436.451.0499918,284 $38.7710/25/03 18,284 $38.77
13858 02/20/03 6 Comp $70,430.271.0492999,575 $14.3507/28/03 99,575 $14.35
13480 06/27/02 2 Comp $213,295.381.04529111,177 $42.3606/30/03 SI 132,967 $35.42
13278 12/12/02 6 Comp $27,708.111.0439016,609 $38.0004/29/03 16,609 $38.00
13804 08/01/02 6 Comp $3,772.661.010089,390 $39.8710/08/03 9,390 $39.87
Number of Projects: 5
$213,295.38
$3,772.66
1.04999
1.01008
Max.
Min.276,825Total:
1.04576 $70,128.57
Weighted Ave. Average
55,365Ave:
Page 2 of 51/1/2000 to 12/31/200CPFC by YearReport 3
A - 8
Calculated Pay Factor Composite and I/DP by Test Criteria and Year
Subacct.BidDate Reg.
TestCriteria Project IDPCPFCQuantity2004
Ave.Price
StartDate
Orig.Unit
Quant.USA
PriceUSA
Compressive Strength
13885 06/03/04 3 Comp $68,948.601.0492731,097 $45.0009/18/04 31,097 $45.00
14948 08/05/04 3 Comp $27,575.511.0487810,580 $53.4310/04/04 10,580 $53.43
14342 06/19/03 2 Comp $29,090.631.0446713,600 $47.8804/09/04 13,600 $47.88
14242 02/26/04 6 Comp $83,043.071.04043107,775 $19.0608/14/04 107,775 $19.06
13967 02/26/04 1 Comp $43,436.691.0290548,795 $30.6409/10/04 48,795 $30.64
Number of Projects: 5
$83,043.07
$27,575.51
1.04927
1.02905
Max.
Min.211,847Total:
1.03980 $50,418.90
Weighted Ave. Average
42,369Ave:
IDPCPFC
Number of Projects: 27
$441,429.80
$3,772.66
1.05000
1.00618
Max.
Min.2,373,449Total:
Weighted Ave. 1.03885 $89,669.42
87,906Ave:
Compressive Strength Totals
Subacct.BidDate Reg.
TestCriteria Project IDPCPFCQuantity2000
Ave.Price
StartDate
Orig.Unit
Quant.USA
PriceUSA
Flexural Strength
11849 05/04/00 1 Flex $114,488.881.04386102,150 $25.5209/18/00 102,150 $25.52
Number of Projects: 1
$114,488.88
$114,488.88
1.04386
1.04386
Max.
Min.102,150Total:
1.04386 $114,488.88
Weighted Ave. Average
102,150Ave:
Page 3 of 51/1/2000 to 12/31/200CPFC by YearReport 3
A - 9

Calculated Pay Factor Composite and I/DP by Test Criteria and Year
Subacct.BidDate Reg.
TestCriteria Project IDPCPFCQuantity2001
Ave.Price
StartDate
Orig.Unit
Quant.USA
PriceUSA
Flexural Strength
12489 05/24/01 1 Flex $305,316.231.05000232,911 $26.2208/27/01 232,911 $26.22
11848 08/10/00 1 Flex $244,413.181.04921171,047 $29.0409/26/01 171,047 $29.04
11985 11/30/00 4 Flex $230,921.841.04103288,305 $19.5204/27/01 288,305 $19.52
12636 06/15/00 1 Flex $306,074.511.03282309,605 $30.2503/29/01 SI 370,284 $25.29
Number of Projects: 4
$306,074.51
$230,921.84
1.05000
1.03282
Max.
Min.1,062,547Total:
1.04145 $271,681.44
Weighted Ave. Average
265,637Ave:
Subacct.BidDate Reg.
TestCriteria Project IDPCPFCQuantity2002
Ave.Price
StartDate
Orig.Unit
Quant.USA
PriceUSA
Flexural Strength
11925 08/30/01 4 Flex $634,618.541.04324563,201 $26.0608/19/02 563,201 $26.06
Number of Projects: 1
$634,618.54
$634,618.54
1.04324
1.04324
Max.
Min.563,201Total:
1.04324 $634,618.54
Weighted Ave. Average
563,201Ave:
Subacct.BidDate Reg.
TestCriteria Project IDPCPFCQuantity2003
Ave.Price
StartDate
Orig.Unit
Quant.USA
PriceUSA
Flexural Strength
13831 10/10/02 6 Flex $97,410.141.0386992,389 $27.2506/19/03 92,389 $27.25
13529 07/25/02 4 Flex $82,355.031.02834137,704 $21.1008/29/03 137,704 $21.10
13897 02/27/03 1 Flex $18,814.201.0166846,095 $24.4708/27/03 46,095 $24.47
Number of Projects: 3
$97,410.14
$18,814.20
1.03869
1.01668
Max.
Min.276,188Total:
1.02986 $66,193.12
Weighted Ave. Average
92,063Ave:
IDPCPFC
Number of Projects: 9
$634,618.54
$18,814.20
1.05000
1.01668
Max.
Min.2,004,086Total:
Weighted Ave. 1.04048 $226,045.84
222,676Ave:
Flexural Strength Totals
Page 4 of 51/1/2000 to 12/31/200CPFC by YearReport 3
A - 10
Calculated Pay Factor Composite and I/DP by Test Criteria and Year
Totals: IDPCPFC1/1/2000 to 12/31/2004.
Number of Projects: 36
$634,618.54
$3,772.66
1.05000
1.00618
Max.
Min.4,377,536Total:
Weighted Ave. 1.03960 $123,763.52
121,598Ave:
Page 5 of 51/1/2000 to 12/31/200CPFC by YearReport 3
A - 11
Thickness, Process Information by YearProjects with Start Dates from 1/1/2000 to 12/31/2004.
Processes with less than 3 tests not included.
Criteria:
QualityLevelSubacct.
QuantSY Tests
PayFactor St. Dev.Mean
Item(inch) Price
TV = PT + (0.65 * V)
TV X - TVI/DP VStd Dev
- V
Thickness2000Orig.Unit
100.0002,665 4 1.02000 0.1898.15811849 8.00 $48.82 8.260 -0.102$2,601.46 0.400 -0.211USA
100.00036,620 12 1.02000 0.28413.67811849 13.00 $25.53 13.260 0.418$18,697.24 0.400 -0.116USA
100.0002,034 3 1.02000 0.1508.59612583 8.27 $34.40 8.530 0.066$1,170.00 0.400 -0.250SI
100.0003,999 4 1.02000 0.16810.99912317 10.83 $27.30 11.090 -0.091$1,825.37 0.400 -0.232SI
100.00010,885 3 1.02000 0.17012.59812541 12.40 $48.80 12.660 -0.062$8,880.36 0.400 -0.230SI
100.0003,999 4 1.02000 0.18611.49112317 10.83 $27.30 11.090 0.401$1,825.37 0.400 -0.214SI
100.00024,584 7 1.02000 0.21811.09412541 10.43 $36.30 10.690 0.404$14,922.93 0.400 -0.182SI
100.0003,999 4 1.02000 0.30511.54112317 10.83 $27.30 11.090 0.451$1,825.37 0.400 -0.095SI
100.0005,937 4 1.02000 0.37210.99912583 10.83 $38.00 11.090 -0.091$3,771.70 0.400 -0.028SI
100.00025,519 7 1.02000 0.37211.16412541 10.43 $49.50 10.690 0.474$21,123.63 0.400 -0.028SI
99.92362,865 22 1.01978 0.33511.55211849 11.00 $24.53 11.260 0.292$30,502.70 0.400 -0.065USA
99.776234,833 62 1.01911 0.34011.37012317 10.83 $27.30 11.090 0.280$102,409.92 0.400 -0.060SI
95.5708,554 10 1.00734 0.41010.10812583 9.84 $36.60 10.100 0.008$1,922.11 0.400 0.010SI
95.20139,529 10 1.00629 0.4869.82312541 9.45 $42.50 9.710 0.113$8,832.92 0.400 0.086SI
94.97427,241 16 1.00564 0.40512.06312583 11.81 $39.40 12.070 -0.007$5,062.36 0.400 0.005SI
73.2386,846 4 0.93874 0.63510.28512583 10.24 $37.20 10.500 -0.215($13,043.63) 0.400 0.235SI
176
Processes: 16
QualityLevel
PayFactor St. Dev.
SY: 500,108 98.790 1.01636 0.343Weighted Ave.:
100.00073.238Worst:
Best: 1.020000.93874
0.18916.137
-0.2500.235
StDev- V
-0.057
0.400
V
0.400
0.400
Totals
Tests:$102,409.92($13,043.63)
$13,270.61
I/DP
0.474-0.215
0.252
X - TV
2000
Page 1 of 5Thickness. by YearReport 4 1/1/2000 to 12/31/2004
A - 12
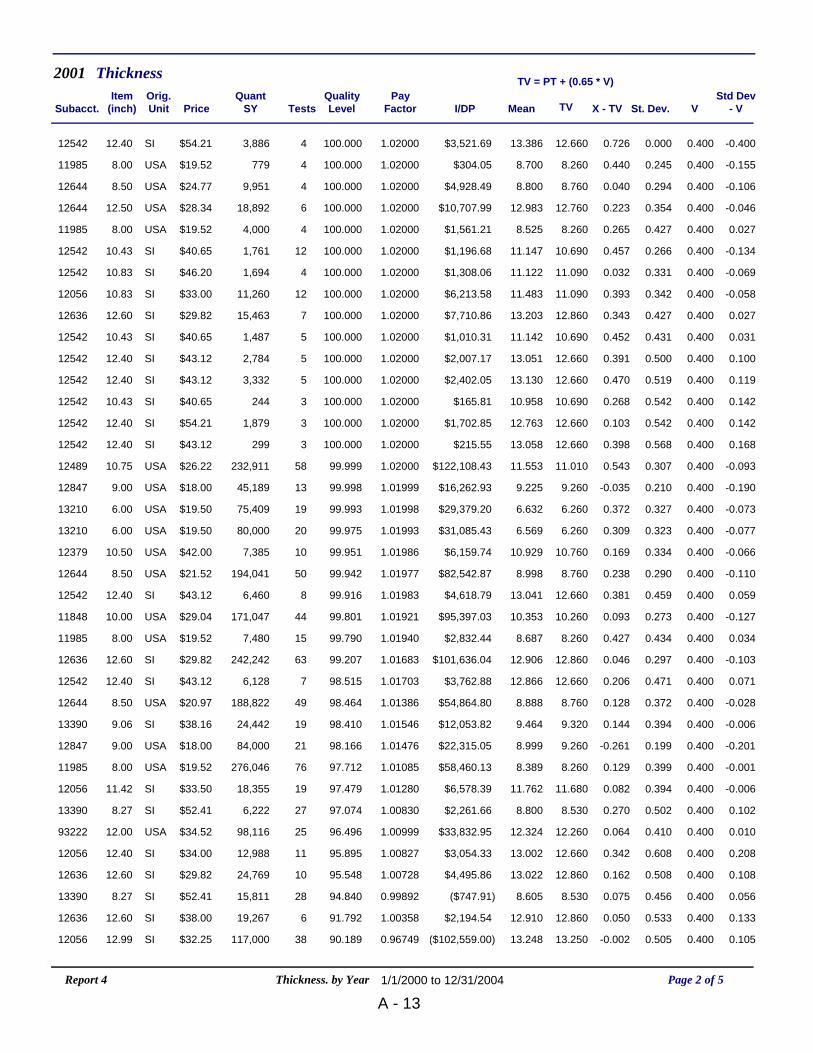
QualityLevelSubacct.
QuantSY Tests
PayFactor St. Dev.Mean
Item(inch) Price
TV = PT + (0.65 * V)
TV X - TVI/DP VStd Dev
- V
Thickness2001Orig.Unit
100.0003,886 4 1.02000 0.00013.38612542 12.40 $54.21 12.660 0.726$3,521.69 0.400 -0.400SI
100.000779 4 1.02000 0.2458.70011985 8.00 $19.52 8.260 0.440$304.05 0.400 -0.155USA
100.0009,951 4 1.02000 0.2948.80012644 8.50 $24.77 8.760 0.040$4,928.49 0.400 -0.106USA
100.00018,892 6 1.02000 0.35412.98312644 12.50 $28.34 12.760 0.223$10,707.99 0.400 -0.046USA
100.0004,000 4 1.02000 0.4278.52511985 8.00 $19.52 8.260 0.265$1,561.21 0.400 0.027USA
100.0001,761 12 1.02000 0.26611.14712542 10.43 $40.65 10.690 0.457$1,196.68 0.400 -0.134SI
100.0001,694 4 1.02000 0.33111.12212542 10.83 $46.20 11.090 0.032$1,308.06 0.400 -0.069SI
100.00011,260 12 1.02000 0.34211.48312056 10.83 $33.00 11.090 0.393$6,213.58 0.400 -0.058SI
100.00015,463 7 1.02000 0.42713.20312636 12.60 $29.82 12.860 0.343$7,710.86 0.400 0.027SI
100.0001,487 5 1.02000 0.43111.14212542 10.43 $40.65 10.690 0.452$1,010.31 0.400 0.031SI
100.0002,784 5 1.02000 0.50013.05112542 12.40 $43.12 12.660 0.391$2,007.17 0.400 0.100SI
100.0003,332 5 1.02000 0.51913.13012542 12.40 $43.12 12.660 0.470$2,402.05 0.400 0.119SI
100.000244 3 1.02000 0.54210.95812542 10.43 $40.65 10.690 0.268$165.81 0.400 0.142SI
100.0001,879 3 1.02000 0.54212.76312542 12.40 $54.21 12.660 0.103$1,702.85 0.400 0.142SI
100.000299 3 1.02000 0.56813.05812542 12.40 $43.12 12.660 0.398$215.55 0.400 0.168SI
99.999232,911 58 1.02000 0.30711.55312489 10.75 $26.22 11.010 0.543$122,108.43 0.400 -0.093USA
99.99845,189 13 1.01999 0.2109.22512847 9.00 $18.00 9.260 -0.035$16,262.93 0.400 -0.190USA
99.99375,409 19 1.01998 0.3276.63213210 6.00 $19.50 6.260 0.372$29,379.20 0.400 -0.073USA
99.97580,000 20 1.01993 0.3236.56913210 6.00 $19.50 6.260 0.309$31,085.43 0.400 -0.077USA
99.9517,385 10 1.01986 0.33410.92912379 10.50 $42.00 10.760 0.169$6,159.74 0.400 -0.066USA
99.942194,041 50 1.01977 0.2908.99812644 8.50 $21.52 8.760 0.238$82,542.87 0.400 -0.110USA
99.9166,460 8 1.01983 0.45913.04112542 12.40 $43.12 12.660 0.381$4,618.79 0.400 0.059SI
99.801171,047 44 1.01921 0.27310.35311848 10.00 $29.04 10.260 0.093$95,397.03 0.400 -0.127USA
99.7907,480 15 1.01940 0.4348.68711985 8.00 $19.52 8.260 0.427$2,832.44 0.400 0.034USA
99.207242,242 63 1.01683 0.29712.90612636 12.60 $29.82 12.860 0.046$101,636.04 0.400 -0.103SI
98.5156,128 7 1.01703 0.47112.86612542 12.40 $43.12 12.660 0.206$3,762.88 0.400 0.071SI
98.464188,822 49 1.01386 0.3728.88812644 8.50 $20.97 8.760 0.128$54,864.80 0.400 -0.028USA
98.41024,442 19 1.01546 0.3949.46413390 9.06 $38.16 9.320 0.144$12,053.82 0.400 -0.006SI
98.16684,000 21 1.01476 0.1998.99912847 9.00 $18.00 9.260 -0.261$22,315.05 0.400 -0.201USA
97.712276,046 76 1.01085 0.3998.38911985 8.00 $19.52 8.260 0.129$58,460.13 0.400 -0.001USA
97.47918,355 19 1.01280 0.39411.76212056 11.42 $33.50 11.680 0.082$6,578.39 0.400 -0.006SI
97.0746,222 27 1.00830 0.5028.80013390 8.27 $52.41 8.530 0.270$2,261.66 0.400 0.102SI
96.49698,116 25 1.00999 0.41012.32493222 12.00 $34.52 12.260 0.064$33,832.95 0.400 0.010USA
95.89512,988 11 1.00827 0.60813.00212056 12.40 $34.00 12.660 0.342$3,054.33 0.400 0.208SI
95.54824,769 10 1.00728 0.50813.02212636 12.60 $29.82 12.860 0.162$4,495.86 0.400 0.108SI
94.84015,811 28 0.99892 0.4568.60513390 8.27 $52.41 8.530 0.075($747.91) 0.400 0.056SI
91.79219,267 6 1.00358 0.53312.91012636 12.60 $38.00 12.860 0.050$2,194.54 0.400 0.133SI
90.189117,000 38 0.96749 0.50513.24812056 12.99 $32.25 13.250 -0.002($102,559.00) 0.400 0.105SI
Page 2 of 5Thickness. by YearReport 4 1/1/2000 to 12/31/2004
A - 13
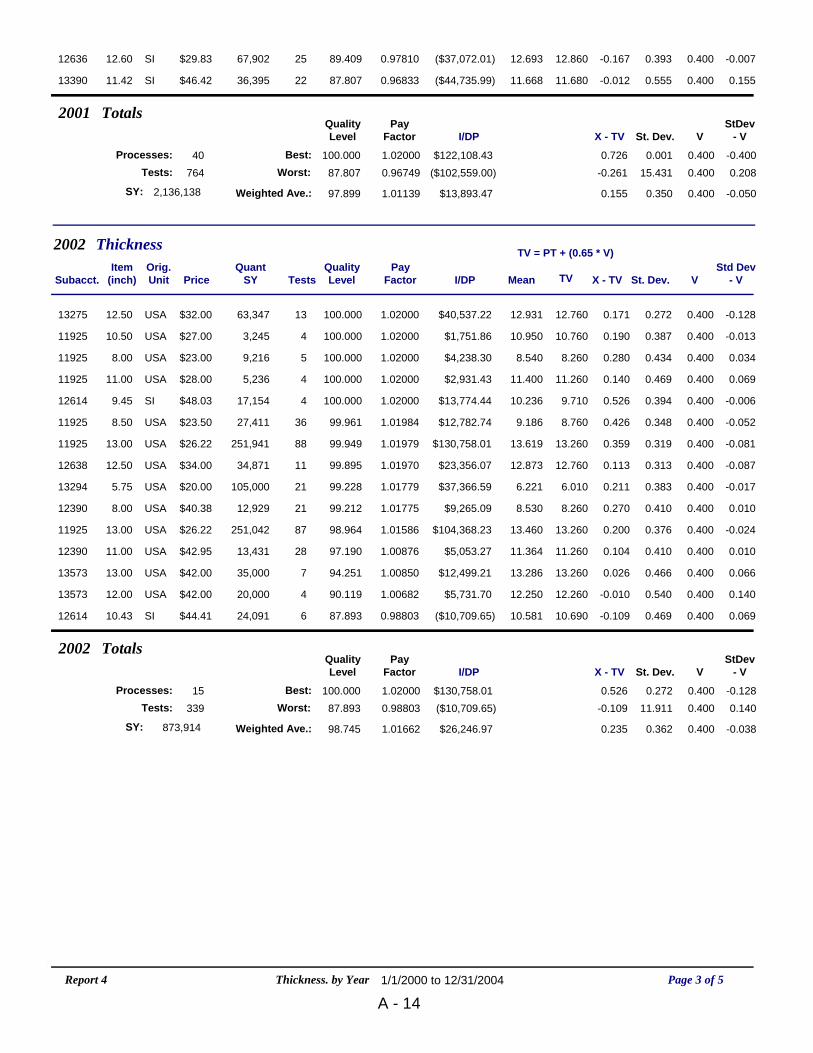
89.40967,902 25 0.97810 0.39312.69312636 12.60 $29.83 12.860 -0.167($37,072.01) 0.400 -0.007SI
87.80736,395 22 0.96833 0.55511.66813390 11.42 $46.42 11.680 -0.012($44,735.99) 0.400 0.155SI
764
Processes: 40
QualityLevel
PayFactor St. Dev.
SY: 2,136,138 97.899 1.01139 0.350Weighted Ave.:
100.00087.807Worst:
Best: 1.020000.96749
0.00115.431
-0.4000.208
StDev- V
-0.050
0.400
V
0.400
0.400
Totals
Tests:$122,108.43
($102,559.00)
$13,893.47
I/DP
0.726-0.261
0.155
X - TV
2001
QualityLevelSubacct.
QuantSY Tests
PayFactor St. Dev.Mean
Item(inch) Price
TV = PT + (0.65 * V)
TV X - TVI/DP VStd Dev
- V
Thickness2002Orig.Unit
100.00063,347 13 1.02000 0.27212.93113275 12.50 $32.00 12.760 0.171$40,537.22 0.400 -0.128USA
100.0003,245 4 1.02000 0.38710.95011925 10.50 $27.00 10.760 0.190$1,751.86 0.400 -0.013USA
100.0009,216 5 1.02000 0.4348.54011925 8.00 $23.00 8.260 0.280$4,238.30 0.400 0.034USA
100.0005,236 4 1.02000 0.46911.40011925 11.00 $28.00 11.260 0.140$2,931.43 0.400 0.069USA
100.00017,154 4 1.02000 0.39410.23612614 9.45 $48.03 9.710 0.526$13,774.44 0.400 -0.006SI
99.96127,411 36 1.01984 0.3489.18611925 8.50 $23.50 8.760 0.426$12,782.74 0.400 -0.052USA
99.949251,941 88 1.01979 0.31913.61911925 13.00 $26.22 13.260 0.359$130,758.01 0.400 -0.081USA
99.89534,871 11 1.01970 0.31312.87312638 12.50 $34.00 12.760 0.113$23,356.07 0.400 -0.087USA
99.228105,000 21 1.01779 0.3836.22113294 5.75 $20.00 6.010 0.211$37,366.59 0.400 -0.017USA
99.21212,929 21 1.01775 0.4108.53012390 8.00 $40.38 8.260 0.270$9,265.09 0.400 0.010USA
98.964251,042 87 1.01586 0.37613.46011925 13.00 $26.22 13.260 0.200$104,368.23 0.400 -0.024USA
97.19013,431 28 1.00876 0.41011.36412390 11.00 $42.95 11.260 0.104$5,053.27 0.400 0.010USA
94.25135,000 7 1.00850 0.46613.28613573 13.00 $42.00 13.260 0.026$12,499.21 0.400 0.066USA
90.11920,000 4 1.00682 0.54012.25013573 12.00 $42.00 12.260 -0.010$5,731.70 0.400 0.140USA
87.89324,091 6 0.98803 0.46910.58112614 10.43 $44.41 10.690 -0.109($10,709.65) 0.400 0.069SI
339
Processes: 15
QualityLevel
PayFactor St. Dev.
SY: 873,914 98.745 1.01662 0.362Weighted Ave.:
100.00087.893Worst:
Best: 1.020000.98803
0.27211.911
-0.1280.140
StDev- V
-0.038
0.400
V
0.400
0.400
Totals
Tests:$130,758.01($10,709.65)
$26,246.97
I/DP
0.526-0.109
0.235
X - TV
2002
Page 3 of 5Thickness. by YearReport 4 1/1/2000 to 12/31/2004
A - 14

QualityLevelSubacct.
QuantSY Tests
PayFactor St. Dev.Mean
Item(inch) Price
TV = PT + (0.65 * V)
TV X - TVI/DP VStd Dev
- V
Thickness2003Orig.Unit
100.00018,284 5 1.02000 0.00113.00013344 13.00 $38.77 13.260 -0.260$14,173.87 0.400 -0.399USA
100.000932 3 1.02000 0.00111.00013804 10.00 $41.40 10.260 0.740$771.50 0.400 -0.399USA
100.0006,043 3 1.02000 0.17613.98713804 13.50 $41.92 13.760 0.227$5,065.18 0.400 -0.224USA
100.00011,489 4 1.02000 0.2396.81313858 6.00 $14.35 6.260 0.553$3,296.52 0.400 -0.161USA
100.00065,107 17 1.02000 0.2726.76513858 6.00 $14.35 6.260 0.505$18,684.77 0.400 -0.128USA
100.00022,979 5 1.02000 0.3266.55013858 6.00 $14.35 6.260 0.290$6,593.32 0.400 -0.074USA
100.00087 4 1.02000 0.3548.75013804 8.00 $34.16 8.260 0.490$59.42 0.400 -0.046USA
100.0003,072 6 1.02000 0.4828.70013897 8.00 $31.00 8.260 0.440$1,904.64 0.400 0.082USA
99.97492,389 19 1.01993 0.29412.97413831 12.50 $27.25 12.760 0.214$50,163.59 0.400 -0.106USA
99.87430,616 15 1.01964 0.33310.70913480 10.24 $41.85 10.500 0.209$21,041.12 0.400 -0.067SI
99.78180,946 30 1.01912 0.34312.33613480 11.81 $42.06 12.070 0.266$54,439.94 0.400 -0.057SI
99.53916,609 50 1.01815 0.41511.64913278 11.00 $38.00 11.260 0.389$11,458.30 0.400 0.015USA
98.15819,407 20 1.01474 0.44910.34413480 9.84 $41.93 10.100 0.244$10,026.46 0.400 0.049SI
98.09643,023 23 1.01456 0.38710.37213897 10.00 $24.00 10.260 0.112$15,031.89 0.400 -0.013USA
95.896137,704 48 1.00358 0.4698.40613529 8.00 $21.10 8.260 0.146$10,413.78 0.400 0.069USA
53.9192,328 3 0.83813 1.0587.75013804 8.00 $34.16 8.260 -0.510($12,872.77) 0.400 0.658USA
255
Processes: 16
QualityLevel
PayFactor St. Dev.
SY: 551,015 98.509 1.01430 0.354Weighted Ave.:
100.00053.919Worst:
Best: 1.020000.83813
0.00111.410
-0.3990.658
StDev- V
-0.046
0.400
V
0.400
0.400
Totals
Tests:$54,439.94
($12,872.77)
$13,140.72
I/DP
0.740-0.510
0.231
X - TV
2003
Page 4 of 5Thickness. by YearReport 4 1/1/2000 to 12/31/2004
A - 15
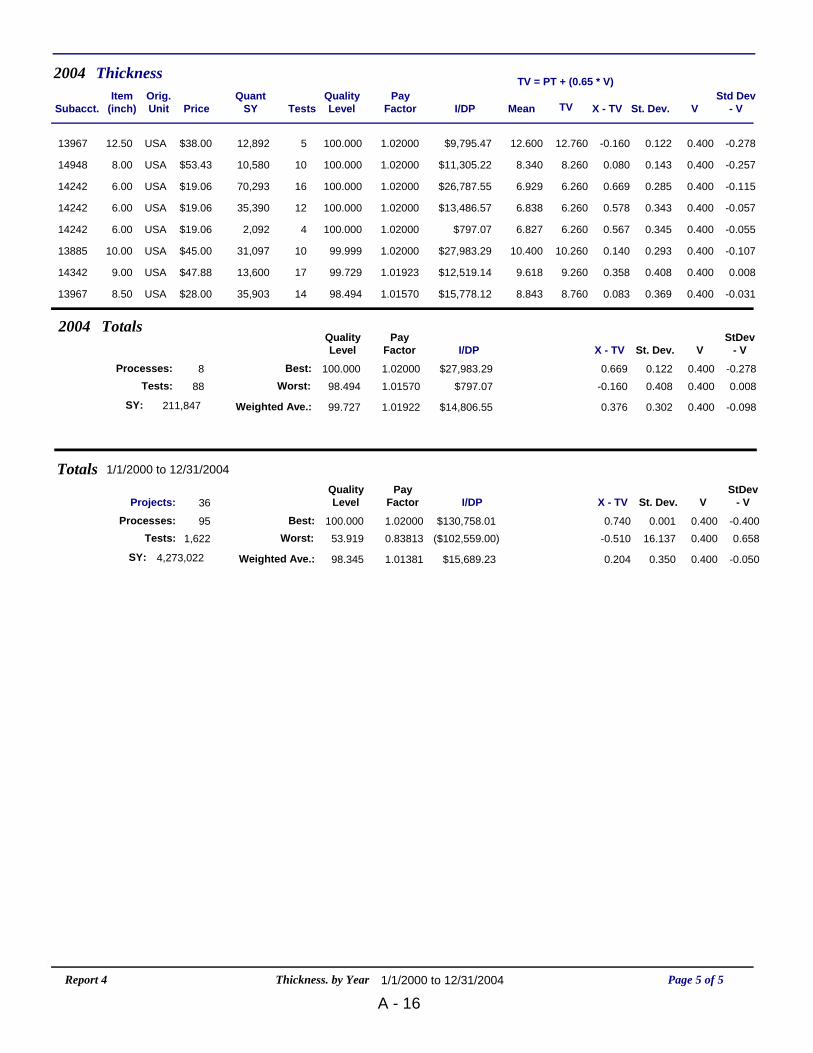
QualityLevelSubacct.
QuantSY Tests
PayFactor St. Dev.Mean
Item(inch) Price
TV = PT + (0.65 * V)
TV X - TVI/DP VStd Dev
- V
Thickness2004Orig.Unit
100.00012,892 5 1.02000 0.12212.60013967 12.50 $38.00 12.760 -0.160$9,795.47 0.400 -0.278USA
100.00010,580 10 1.02000 0.1438.34014948 8.00 $53.43 8.260 0.080$11,305.22 0.400 -0.257USA
100.00070,293 16 1.02000 0.2856.92914242 6.00 $19.06 6.260 0.669$26,787.55 0.400 -0.115USA
100.00035,390 12 1.02000 0.3436.83814242 6.00 $19.06 6.260 0.578$13,486.57 0.400 -0.057USA
100.0002,092 4 1.02000 0.3456.82714242 6.00 $19.06 6.260 0.567$797.07 0.400 -0.055USA
99.99931,097 10 1.02000 0.29310.40013885 10.00 $45.00 10.260 0.140$27,983.29 0.400 -0.107USA
99.72913,600 17 1.01923 0.4089.61814342 9.00 $47.88 9.260 0.358$12,519.14 0.400 0.008USA
98.49435,903 14 1.01570 0.3698.84313967 8.50 $28.00 8.760 0.083$15,778.12 0.400 -0.031USA
88
Processes: 8
QualityLevel
PayFactor St. Dev.
SY: 211,847 99.727 1.01922 0.302Weighted Ave.:
100.00098.494Worst:
Best: 1.020001.01570
0.1220.408
-0.2780.008
StDev- V
-0.098
0.400
V
0.400
0.400
Totals
Tests:$27,983.29
$797.07
$14,806.55
I/DP
0.669-0.160
0.376
X - TV
2004
1,622
Processes: 95
QualityLevel
PayFactor St. Dev.
SY: 4,273,022 98.345 1.01381 0.350Weighted Ave.:
100.00053.919Worst:
Best: 1.020000.83813
0.00116.137
-0.4000.658
StDev- V
-0.050
0.400
V
0.400
0.400
Totals
Tests:$130,758.01
($102,559.00)
$15,689.23
I/DP
0.740-0.510
0.204
X - TVProjects: 36
1/1/2000 to 12/31/2004
Page 5 of 5Thickness. by YearReport 4 1/1/2000 to 12/31/2004
A - 16
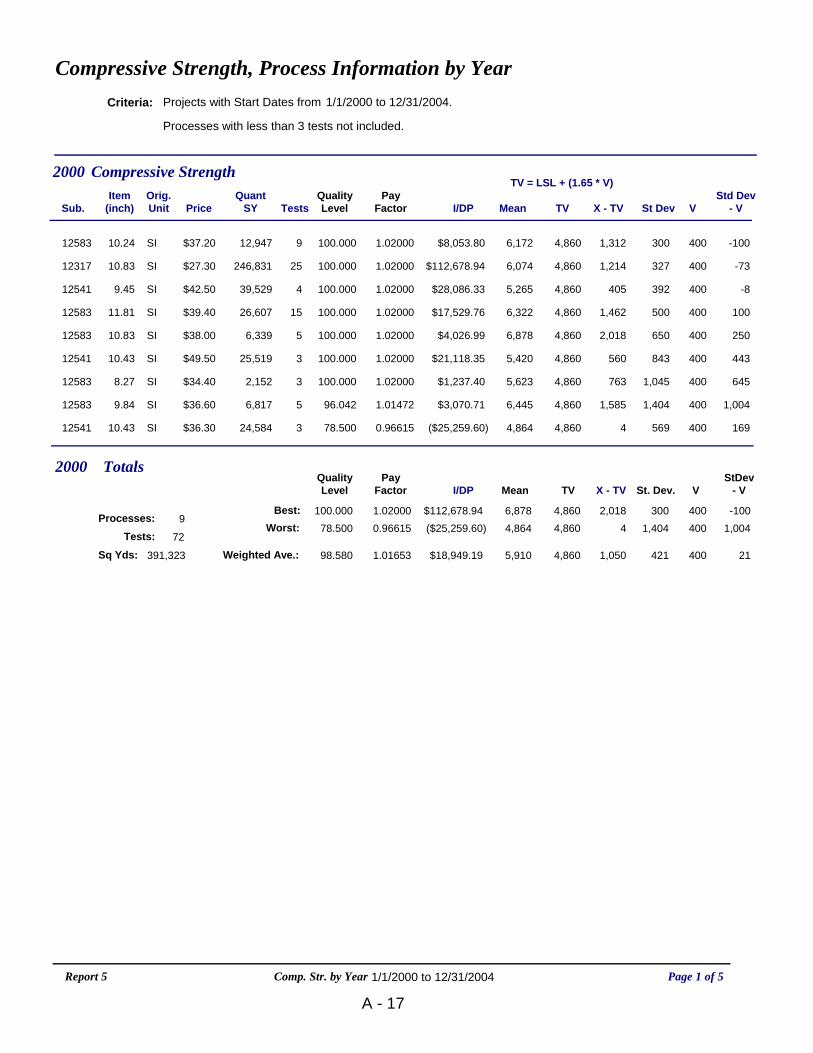
Compressive Strength, Process Information by YearProjects with Start Dates from 1/1/2000 to 12/31/2004.
Processes with less than 3 tests not included.
Criteria:
Item(inch) Price
QuantSY Tests St DevMeanI/DP
Std Dev- VVX - TV
TV = LSL + (1.65 * V)
TVSub.QualityLevel
PayFactor
Orig.Unit
Compressive Strength2000
$37.20 12,947 9 100.000 1.02000 $8,053.80 -1001,31212583 10.24 6,172 300SI 4,860 400
$27.30 246,831 25 100.000 1.02000 $112,678.94 -731,21412317 10.83 6,074 327SI 4,860 400
$42.50 39,529 4 100.000 1.02000 $28,086.33 -840512541 9.45 5,265 392SI 4,860 400
$39.40 26,607 15 100.000 1.02000 $17,529.76 1001,46212583 11.81 6,322 500SI 4,860 400
$38.00 6,339 5 100.000 1.02000 $4,026.99 2502,01812583 10.83 6,878 650SI 4,860 400
$49.50 25,519 3 100.000 1.02000 $21,118.35 44356012541 10.43 5,420 843SI 4,860 400
$34.40 2,152 3 100.000 1.02000 $1,237.40 64576312583 8.27 5,623 1,045SI 4,860 400
$36.60 6,817 5 96.042 1.01472 $3,070.71 1,0041,58512583 9.84 6,445 1,404SI 4,860 400
$36.30 24,584 3 78.500 0.96615 ($25,259.60) 169412541 10.43 4,864 569SI 4,860 400
72
Processes: 9
QualityLevel
PayFactor St. Dev.
Sq Yds: 391,323 98.580 1.01653 421Weighted Ave.:
100.00078.500Worst:
Best: 1.020000.96615
3001,404
6,8784,864
-1001,004
MeanStDev
- V
5,910 21
400
V
400
400
Tests:
$112,678.94($25,259.60)
$18,949.19
I/DP
4,8604,860
4,860
TV
2,0184
1,050
X - TV
Totals2000
Page 1 of 5Comp. Str. by YearReport 5 1/1/2000 to 12/31/2004
A - 17
Item(inch) Price
QuantSY Tests St DevMeanI/DP
Std Dev- VVX - TV
TV = LSL + (1.65 * V)
TVSub.QualityLevel
PayFactor
Orig.Unit
Compressive Strength2001
$19.50 75,409 7 100.000 1.02000 $29,409.51 -267-9613210 6.00 4,764 133USA 4,860 400
$39.00 1,187 3 100.000 1.02000 $925.63 -221-24712847 7.00 4,613 179USA 4,860 400
$43.12 2,819 5 100.000 1.02000 $2,032.17 -18095912542 12.40 5,819 220SI 4,860 400
$43.12 1,458 7 100.000 1.02000 $1,051.27 -1171,08912542 12.40 5,949 283SI 4,860 400
$42.00 7,385 11 100.000 1.02000 $6,203.09 -951,14612379 10.50 6,006 305USA 4,860 400
$46.81 2,251 10 100.000 1.02000 $1,761.84 -801,29412542 11.42 6,154 320SI 4,860 400
$43.12 7,036 13 100.000 1.02000 $5,073.25 -731,63912542 12.40 6,499 328SI 4,860 400
$20.97 188,822 22 100.000 1.02000 $79,188.51 -5484212644 8.50 5,702 346USA 4,860 400
$33.00 11,260 12 100.000 1.02000 $6,213.59 -121,19612056 10.83 6,056 388SI 4,860 400
$33.50 18,355 25 100.000 1.02000 $10,281.98 -91,16512056 11.42 6,025 391SI 4,860 400
$34.52 98,116 11 100.000 1.02000 $67,735.90 201,43893222 12.00 6,298 420USA 4,860 400
$40.65 244 4 100.000 1.02000 $165.81 2251012542 10.43 5,370 422SI 4,860 400
$43.12 6,460 8 100.000 1.02000 $4,657.82 251,27112542 12.40 6,131 425SI 4,860 400
$24.77 9,951 4 100.000 1.02000 $4,928.49 3267012644 8.50 5,530 432USA 4,860 400
$24.77 10,699 5 100.000 1.02000 $5,298.96 631,23412644 8.50 6,094 463USA 4,860 400
$19.50 80,000 8 100.000 1.02000 $31,200.00 6888613210 6.00 5,746 468USA 4,860 400
$46.42 36,395 22 100.000 1.02000 $28,250.73 741,77913390 11.42 6,639 474SI 4,860 400
$21.52 168,010 25 100.000 1.02000 $72,309.24 761,18412644 8.50 6,044 476USA 4,860 400
$47.43 3,337 6 100.000 1.02000 $2,646.59 931,70513390 7.48 6,565 493SI 4,860 400
$46.20 1,694 3 100.000 1.02000 $1,308.06 10796112542 10.83 5,821 507SI 4,860 400
$43.12 3,332 9 100.000 1.02000 $2,402.65 1141,12012542 12.40 5,980 514SI 4,860 400
$21.52 26,031 5 100.000 1.02000 $11,201.16 14788612644 8.50 5,746 547USA 4,860 400
$28.34 18,892 6 100.000 1.02000 $10,707.99 1631,36312644 12.50 6,223 563USA 4,860 400
$40.14 1,166 3 100.000 1.02000 $782.53 18356912542 5.91 5,429 583SI 4,860 400
$38.16 24,442 19 100.000 1.02000 $15,596.37 2121,64813390 8.86 6,508 612SI 4,860 400
$54.21 3,886 5 100.000 1.02000 $3,521.69 2841,73612542 12.40 6,596 684SI 4,860 400
$40.65 1,487 4 100.000 1.02000 $1,010.31 2921,99312542 10.43 6,853 692SI 4,860 400
$54.21 1,879 3 100.000 1.02000 $1,702.85 3491,78312542 12.40 6,643 749SI 4,860 400
$38.00 12,156 3 100.000 1.02000 $9,236.25 4151,35393222 11.00 6,213 815USA 4,860 400
$32.25 117,000 42 99.983 1.01993 $62,883.80 2791412056 12.99 5,774 427SI 4,860 400
$52.41 15,908 29 99.965 1.01986 $13,843.19 2841,59913390 8.27 6,459 684SI 4,860 400
$34.00 12,988 14 99.962 1.01989 $7,344.17 12091912056 12.40 5,779 520SI 4,860 400
$18.00 45,189 13 99.938 1.01982 $16,122.51 2646212847 9.00 5,322 426USA 4,860 400
$18.00 84,000 22 99.579 1.01880 $28,419.74 -3623212847 9.00 5,092 364USA 4,860 400
$40.65 1,761 14 99.505 1.01858 $1,112.00 21390112542 10.43 5,761 613SI 4,860 400
Page 2 of 5Comp. Str. by YearReport 5 1/1/2000 to 12/31/2004
A - 18

$52.41 6,125 26 97.941 1.01176 $3,157.17 34095413390 8.27 5,814 740SI 4,860 400
$28.34 17,484 5 97.071 1.01609 $7,972.68 47369012644 12.50 5,550 873USA 4,860 400
433
Processes: 37
QualityLevel
PayFactor St. Dev.
Sq Yds: 1,124,61 99.906 1.01978 426Weighted Ave.:
100.00097.071Worst:
Best: 1.020001.01176
133873
6,8534,613
-267473
MeanStDev
- V
5,796 26
400
V
400
400
Tests:
$79,188.51$165.81
$15,071.88
I/DP
4,8604,860
4,860
TV
1,993-247
936
X - TV
Totals2001
Item(inch) Price
QuantSY Tests St DevMeanI/DP
Std Dev- VVX - TV
TV = LSL + (1.65 * V)
TVSub.QualityLevel
PayFactor
Orig.Unit
Compressive Strength2002
$42.00 25,000 5 100.000 1.02000 $20,994.75 -461,21213573 12.00 6,072 354USA 4,860 400
$48.03 17,154 4 100.000 1.02000 $13,774.44 3463712614 9.45 5,497 434SI 4,860 400
$42.00 25,000 5 100.000 1.02000 $20,994.75 451,72213573 13.00 6,582 445USA 4,860 400
$34.00 34,871 8 100.000 1.02000 $23,712.28 821,82512638 12.50 6,685 482USA 4,860 400
$42.00 20,000 4 100.000 1.02000 $16,795.80 9583313573 13.00 5,693 495USA 4,860 400
$32.00 1,307 3 100.000 1.02000 $836.27 19635013275 12.50 5,210 596USA 4,860 400
$32.00 62,040 22 100.000 1.02000 $39,702.16 3551,97713275 12.50 6,837 755USA 4,860 400
$42.95 13,431 28 99.963 1.01985 $11,452.18 1451,00812390 11.00 5,868 545USA 4,860 400
$20.00 105,000 21 99.953 1.01987 $41,717.55 2758413294 5.75 5,444 427USA 4,860 400
$40.38 12,929 21 99.507 1.01859 $9,705.63 25190212390 8.00 5,762 651USA 4,860 400
$44.41 24,091 6 98.027 1.01605 $14,360.42 18949212614 10.43 5,352 589SI 4,860 400
127
Processes: 11
QualityLevel
PayFactor St. Dev.
Sq Yds: 340,823 99.826 1.01962 518Weighted Ave.:
100.00098.027Worst:
Best: 1.020001.01605
354755
6,8375,210
-46355
MeanStDev
- V
5,993 118
400
V
400
400
Tests:
$41,717.55$836.27
$19,458.75
I/DP
4,8604,860
4,860
TV
1,977350
1,133
X - TV
Totals2002
Page 3 of 5Comp. Str. by YearReport 5 1/1/2000 to 12/31/2004
A - 19

Item(inch) Price
QuantSY Tests St DevMeanI/DP
Std Dev- VVX - TV
TV = LSL + (1.65 * V)
TVSub.QualityLevel
PayFactor
Orig.Unit
Compressive Strength2003
$14.35 22,979 6 100.000 1.02000 $6,594.97 -2688513858 6.00 4,945 132USA 4,860 400
$42.06 9,140 3 100.000 1.02000 $6,426.84 -1821,67113480 11.81 6,531 218SI 4,860 400
$14.35 11,489 3 100.000 1.02000 $3,296.52 -168-7313858 6.00 4,787 232USA 4,860 400
$38.00 246 3 100.000 1.02000 $186.91 -1342,26313278 11.00 7,123 266USA 4,860 400
$42.06 30,428 10 100.000 1.02000 $21,400.57 -8885213480 11.81 5,712 312SI 4,860 400
$41.93 1,458 3 100.000 1.02000 $1,021.91 -612,11613480 9.84 6,976 339SI 4,860 400
$41.85 26,058 14 100.000 1.02000 $18,235.64 -441,50913480 10.24 6,369 357SI 4,860 400
$42.06 29,962 12 100.000 1.02000 $21,073.03 21,59513480 11.81 6,455 402SI 4,860 400
$41.93 7,682 9 100.000 1.02000 $5,386.33 81,38313480 9.84 6,243 408SI 4,860 400
$42.06 7,867 4 100.000 1.02000 $5,532.03 182,04413480 11.81 6,904 418SI 4,860 400
$38.00 1,582 4 100.000 1.02000 $1,202.02 591,87013278 11.00 6,730 459USA 4,860 400
$41.92 6,043 3 100.000 1.02000 $5,065.18 591,22013804 13.50 6,080 459USA 4,860 400
$38.77 18,284 5 100.000 1.02000 $14,173.87 821,27613344 13.00 6,136 482USA 4,860 400
$34.16 2,415 3 100.000 1.02000 $1,649.52 50185713804 8.00 5,717 901USA 4,860 400
$14.35 65,107 17 99.985 1.01996 $18,645.62 -2047713858 6.00 5,337 380USA 4,860 400
$38.00 4,867 10 99.963 1.01989 $3,679.26 14871513278 11.00 5,575 548USA 4,860 400
$38.00 8,488 27 99.195 1.01678 $5,412.08 -2919113278 11.00 5,051 371USA 4,860 400
$41.93 7,060 6 95.510 1.01102 $2,727.73 8723113480 9.84 5,091 487SI 4,860 400
$41.40 932 3 90.650 1.00753 $290.59 85272313804 10.00 5,583 1,252USA 4,860 400
145
Processes: 19
QualityLevel
PayFactor St. Dev.
Sq Yds: 262,087 99.815 1.01960 363Weighted Ave.:
100.00090.650Worst:
Best: 1.020001.00753
1321,252
7,1234,787
-268852
MeanStDev
- V
5,753 -37
400
V
400
400
Tests:
$21,400.57$186.91
$7,473.72
I/DP
4,8604,860
4,860
TV
2,263-73
893
X - TV
Totals2003
Page 4 of 5Comp. Str. by YearReport 5 1/1/2000 to 12/31/2004
A - 20
Item(inch) Price
QuantSY Tests St DevMeanI/DP
Std Dev- VVX - TV
TV = LSL + (1.65 * V)
TVSub.QualityLevel
PayFactor
Orig.Unit
Compressive Strength2004
$19.06 2,092 4 100.000 1.02000 $797.07 -14032014242 6.00 5,180 260USA 4,860 400
$19.06 21,656 6 100.000 1.02000 $8,253.17 -11716814242 6.00 5,028 283USA 4,860 400
$53.43 10,580 10 100.000 1.02000 $11,305.22 131,68414948 8.00 6,544 413USA 4,860 400
$19.06 5,672 4 100.000 1.02000 $2,161.08 27959014242 6.00 5,450 679USA 4,860 400
$45.00 31,097 10 100.000 1.02000 $27,985.90 2892,05213885 10.00 6,912 689USA 4,860 400
$19.06 32,552 8 99.852 1.01970 $12,221.47 2427514242 6.00 5,135 424USA 4,860 400
$19.06 32,558 6 99.763 1.01953 $12,114.02 -135-15014242 6.00 4,710 265USA 4,860 400
$28.00 35,903 23 98.550 1.01586 $15,938.84 6430913967 8.50 5,169 464USA 4,860 400
$47.88 13,600 17 98.407 1.01545 $10,059.81 19253714342 9.00 5,397 592USA 4,860 400
$38.00 12,892 10 91.539 0.99109 ($4,363.69) 57564813967 12.50 5,508 975USA 4,860 400
$19.06 13,245 7 80.160 0.94409 ($14,111.64) -204-49014242 6.00 4,370 196USA 4,860 400
105
Processes: 11
QualityLevel
PayFactor St. Dev.
Sq Yds: 211,847 97.838 1.01238 465Weighted Ave.:
100.00080.160Worst:
Best: 1.020000.94409
196975
6,9124,370
-204575
MeanStDev
- V
5,396 65
400
V
400
400
Tests:
$27,985.90($14,111.64)
$7,487.39
I/DP
4,8604,860
4,860
TV
2,052-490
536
X - TV
Totals2004
882
Processes: 87
QualityLevel
PayFactor St. Dev.
Sq Yds: 2,330,69 99.473 1.01852 435Weighted Ave.:
100.00078.500Worst:
Best: 1.020000.94409
1321,404
7,1234,370
-2681,004
MeanStDev
- V
5,803 35
400
V
400
400
Totals:
Tests:
$112,678.94($25,259.60)
$13,409.31
I/DP
4,8604,860
4,860
TV
2,263-490
943
X - TVProjects: 27
1/1/2000 to 12/31/2004.
Page 5 of 5Comp. Str. by YearReport 5 1/1/2000 to 12/31/2004
A - 21
Sand Equivalent, Process Information by YearProjects with Bid Dates from 1/1/2000 to 12/31/2004.
Processes with less than 3 tests not included.
Criteria:
Item(inch) Price
QuantSY Tests QL PF I/DP St DevMean X - TV V
St Dev- VSub.
TV = LSL + (1.65 * V)
TVOrig.Unit
Sand Equivalent2000
10.43 $49.50 25,519 3 100.000 1.01000 $10,561.82 0.57795.30 -3.4234.0008.7086.6012541 SI
8.27 $34.40 3,295 6 100.000 1.01000 $947.72 1.32987.80 -2.6714.0001.2086.6012583 SI
10.83 $38.00 6,812 6 100.000 1.01000 $2,164.48 1.51788.50 -2.4834.0001.9086.6012583 SI
10.24 $37.20 12,212 7 100.000 1.01000 $3,798.49 1.71887.60 -2.2824.0001.0086.6012583 SI
10.83 $27.30 246,831 25 100.000 1.01000 $56,342.29 2.06889.10 -1.9324.0002.5086.6012317 SI
9.84 $36.60 9,365 10 100.000 1.01000 $2,865.78 2.71087.70 -1.2904.0001.1086.6012583 SI
9.45 $42.50 39,529 4 100.000 1.01000 $14,046.68 5.50089.30 1.5004.0002.7086.6012541 SI
11.81 $39.40 32,872 20 99.994 1.00999 $10,823.06 2.57388.30 -1.4274.0001.7086.6012583 SI
81
Processes: 8
QualityLevel
PayFactor St. Dev.
SY: 376,434 99.999 1.01000 2.360Weighted Ave.:
100.00099.994Worst:
Best: 1.010001.00999
0.5775.500
95.3087.60
-3.4231.500
MeanStDev
- V
89.37 -1.640
4.000
V
4.000
4.000
SE Totals:
Tests:
$56,342.29$947.72
$12,693.79
I/DP
86.6086.60
86.60
TV
8.701.00
2.77
X - TV
2000
Page 1 of 5SE by YearReport 6 1/1/2000 to 12/31/2004
A - 22
Item(inch) Price
QuantSY Tests QL PF I/DP St DevMean X - TV V
St Dev- VSub.
TV = LSL + (1.65 * V)
TVOrig.Unit
Sand Equivalent2001
12.40 $43.12 2,819 5 100.000 1.01000 $1,016.34 0.54892.60 -3.4524.0006.0086.6012542 SI
7.00 $39.00 1,187 3 100.000 1.01000 $462.93 0.57781.70 -3.4234.000-4.9086.6012847 USA
12.50 $28.34 17,484 5 100.000 1.01000 $4,954.97 0.89498.60 -3.1064.00012.0086.6012644 USA
11.00 $38.00 12,146 3 100.000 1.01000 $4,615.48 1.15593.70 -2.8454.0007.1086.6093222 USA
12.40 $54.21 1,879 3 100.000 1.01000 $851.64 1.15589.30 -2.8454.0002.7086.6012542 SI
8.50 $24.77 10,699 5 100.000 1.01000 $2,650.14 1.30497.20 -2.6964.00010.6086.6012644 USA
8.50 $21.52 194,041 26 100.000 1.01000 $41,758.42 1.31797.80 -2.6834.00011.2086.6012644 USA
8.50 $20.97 188,822 25 100.000 1.01000 $39,596.24 1.34494.20 -2.6564.0007.6086.6012644 USA
8.50 $24.77 9,951 4 100.000 1.01000 $2,464.86 1.41494.00 -2.5864.0007.4086.6012644 USA
10.83 $46.20 1,694 3 100.000 1.01000 $654.19 1.52894.70 -2.4724.0008.1086.6012542 SI
10.43 $40.65 244 3 100.000 1.01000 $82.93 1.73295.00 -2.2684.0008.4086.6012542 SI
12.50 $28.34 18,892 4 100.000 1.01000 $5,353.99 1.89396.30 -2.1074.0009.7086.6012644 USA
10.50 $42.00 7,385 11 100.000 1.01000 $3,101.70 2.07191.10 -1.9294.0004.5086.6012379 USA
7.48 $47.43 3,337 6 100.000 1.01000 $1,323.30 2.13788.20 -1.8634.0001.6086.6013390 SI
10.83 $33.00 11,260 12 100.000 1.01000 $3,106.95 2.27690.50 -1.7244.0003.9086.6012056 SI
10.43 $40.65 1,761 13 100.000 1.01000 $598.37 2.33291.50 -1.6684.0004.9086.6012542 SI
11.42 $33.50 18,355 25 100.000 1.01000 $5,141.25 2.61090.70 -1.3904.0004.1086.6012056 SI
12.00 $34.52 98,116 11 100.000 1.01000 $33,869.64 2.64992.30 -1.3514.0005.7086.6093222 USA
6.00 $19.50 155,409 15 100.000 1.01000 $30,304.76 2.66789.60 -1.3334.0003.0086.6013210 USA
12.40 $43.12 6,460 8 100.000 1.01000 $2,328.91 2.82591.40 -1.1754.0004.8086.6012542 SI
10.43 $40.65 1,487 4 100.000 1.01000 $505.28 3.10990.50 -0.8914.0003.9086.6012542 SI
11.42 $46.81 2,251 10 100.000 1.01000 $880.96 3.55391.20 -0.4474.0004.6086.6012542 SI
12.40 $54.21 3,886 5 100.000 1.01000 $1,761.28 3.78288.60 -0.2184.0002.0086.6012542 SI
12.99 $32.25 117,000 43 99.977 1.00995 $31,404.72 2.73489.00 -1.2664.0002.4086.6012056 SI
12.40 $43.12 3,332 5 99.560 1.00971 $1,166.13 4.76488.20 0.7644.0001.6086.6012542 SI
9.00 $18.00 45,189 13 99.235 1.00891 $7,247.26 0.95482.10 -3.0464.000-4.5086.6012847 USA
11.42 $46.42 36,395 22 99.168 1.00881 $12,450.63 3.68288.30 -0.3184.0001.7086.6013390 SI
315.00 $43.12 5,883 13 98.213 1.00745 $1,889.75 3.12186.10 -0.8794.000-0.5086.6012542 USA
12.40 $34.00 12,988 14 96.349 1.00479 $1,767.17 4.25087.30 0.2504.0000.7086.6012056 SI
8.27 $52.41 6,222 27 94.413 0.99604 ($1,080.76) 3.71185.80 -0.2894.000-0.8086.6013390 SI
8.86 $38.16 24,442 19 91.455 0.99058 ($7,347.09) 4.43586.00 0.4354.000-0.6086.6013390 SI
9.00 $18.00 84,000 22 90.960 0.98756 ($18,808.65) 1.81782.40 -2.1834.000-4.2086.6012847 USA
8.27 $52.41 15,811 28 90.728 0.97113 ($19,999.42) 4.34585.70 0.3454.000-0.9086.6013390 SI
Page 2 of 5SE by YearReport 6 1/1/2000 to 12/31/2004
A - 23
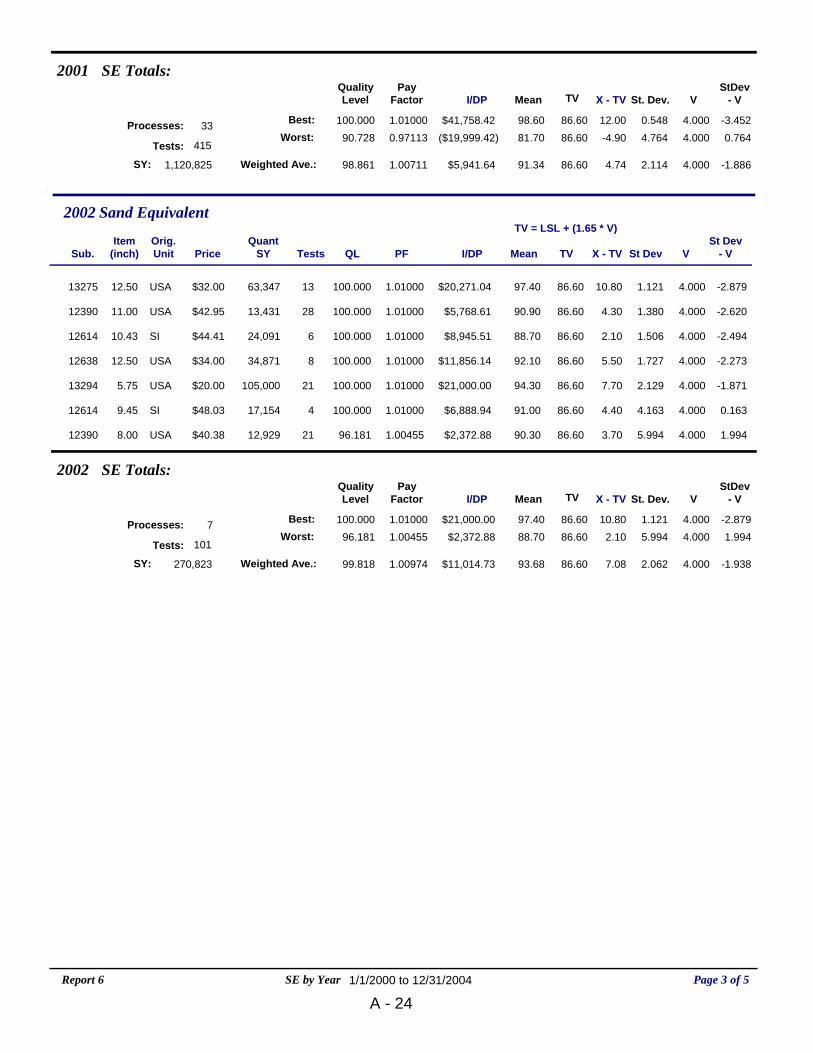
415
Processes: 33
QualityLevel
PayFactor St. Dev.
SY: 1,120,825 98.861 1.00711 2.114Weighted Ave.:
100.00090.728Worst:
Best: 1.010000.97113
0.5484.764
98.6081.70
-3.4520.764
MeanStDev
- V
91.34 -1.886
4.000
V
4.000
4.000
SE Totals:
Tests:
$41,758.42($19,999.42)
$5,941.64
I/DP
86.6086.60
86.60
TV
12.00-4.90
4.74
X - TV
2001
Item(inch) Price
QuantSY Tests QL PF I/DP St DevMean X - TV V
St Dev- VSub.
TV = LSL + (1.65 * V)
TVOrig.Unit
Sand Equivalent2002
12.50 $32.00 63,347 13 100.000 1.01000 $20,271.04 1.12197.40 -2.8794.00010.8086.6013275 USA
11.00 $42.95 13,431 28 100.000 1.01000 $5,768.61 1.38090.90 -2.6204.0004.3086.6012390 USA
10.43 $44.41 24,091 6 100.000 1.01000 $8,945.51 1.50688.70 -2.4944.0002.1086.6012614 SI
12.50 $34.00 34,871 8 100.000 1.01000 $11,856.14 1.72792.10 -2.2734.0005.5086.6012638 USA
5.75 $20.00 105,000 21 100.000 1.01000 $21,000.00 2.12994.30 -1.8714.0007.7086.6013294 USA
9.45 $48.03 17,154 4 100.000 1.01000 $6,888.94 4.16391.00 0.1634.0004.4086.6012614 SI
8.00 $40.38 12,929 21 96.181 1.00455 $2,372.88 5.99490.30 1.9944.0003.7086.6012390 USA
101
Processes: 7
QualityLevel
PayFactor St. Dev.
SY: 270,823 99.818 1.00974 2.062Weighted Ave.:
100.00096.181Worst:
Best: 1.010001.00455
1.1215.994
97.4088.70
-2.8791.994
MeanStDev
- V
93.68 -1.938
4.000
V
4.000
4.000
SE Totals:
Tests:
$21,000.00$2,372.88
$11,014.73
I/DP
86.6086.60
86.60
TV
10.802.10
7.08
X - TV
2002
Page 3 of 5SE by YearReport 6 1/1/2000 to 12/31/2004
A - 24
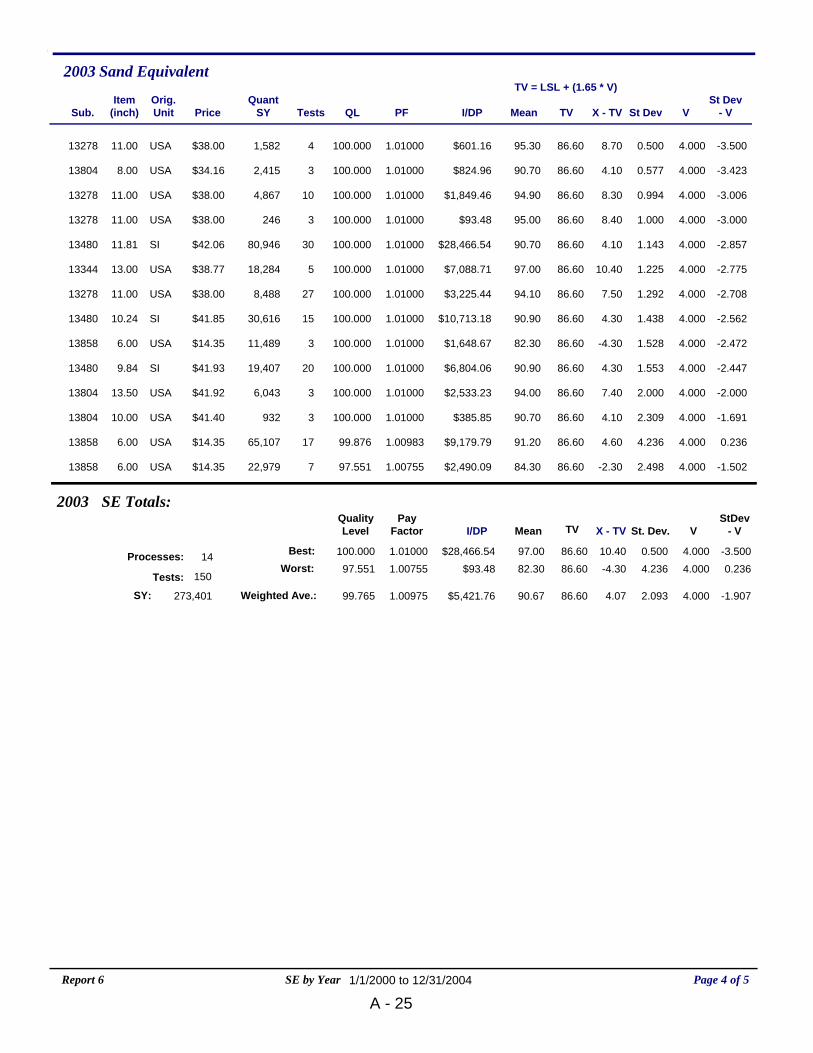
Item(inch) Price
QuantSY Tests QL PF I/DP St DevMean X - TV V
St Dev- VSub.
TV = LSL + (1.65 * V)
TVOrig.Unit
Sand Equivalent2003
11.00 $38.00 1,582 4 100.000 1.01000 $601.16 0.50095.30 -3.5004.0008.7086.6013278 USA
8.00 $34.16 2,415 3 100.000 1.01000 $824.96 0.57790.70 -3.4234.0004.1086.6013804 USA
11.00 $38.00 4,867 10 100.000 1.01000 $1,849.46 0.99494.90 -3.0064.0008.3086.6013278 USA
11.00 $38.00 246 3 100.000 1.01000 $93.48 1.00095.00 -3.0004.0008.4086.6013278 USA
11.81 $42.06 80,946 30 100.000 1.01000 $28,466.54 1.14390.70 -2.8574.0004.1086.6013480 SI
13.00 $38.77 18,284 5 100.000 1.01000 $7,088.71 1.22597.00 -2.7754.00010.4086.6013344 USA
11.00 $38.00 8,488 27 100.000 1.01000 $3,225.44 1.29294.10 -2.7084.0007.5086.6013278 USA
10.24 $41.85 30,616 15 100.000 1.01000 $10,713.18 1.43890.90 -2.5624.0004.3086.6013480 SI
6.00 $14.35 11,489 3 100.000 1.01000 $1,648.67 1.52882.30 -2.4724.000-4.3086.6013858 USA
9.84 $41.93 19,407 20 100.000 1.01000 $6,804.06 1.55390.90 -2.4474.0004.3086.6013480 SI
13.50 $41.92 6,043 3 100.000 1.01000 $2,533.23 2.00094.00 -2.0004.0007.4086.6013804 USA
10.00 $41.40 932 3 100.000 1.01000 $385.85 2.30990.70 -1.6914.0004.1086.6013804 USA
6.00 $14.35 65,107 17 99.876 1.00983 $9,179.79 4.23691.20 0.2364.0004.6086.6013858 USA
6.00 $14.35 22,979 7 97.551 1.00755 $2,490.09 2.49884.30 -1.5024.000-2.3086.6013858 USA
150
Processes: 14
QualityLevel
PayFactor St. Dev.
SY: 273,401 99.765 1.00975 2.093Weighted Ave.:
100.00097.551Worst:
Best: 1.010001.00755
0.5004.236
97.0082.30
-3.5000.236
MeanStDev
- V
90.67 -1.907
4.000
V
4.000
4.000
SE Totals:
Tests:
$28,466.54$93.48
$5,421.76
I/DP
86.6086.60
86.60
TV
10.40-4.30
4.07
X - TV
2003
Page 4 of 5SE by YearReport 6 1/1/2000 to 12/31/2004
A - 25
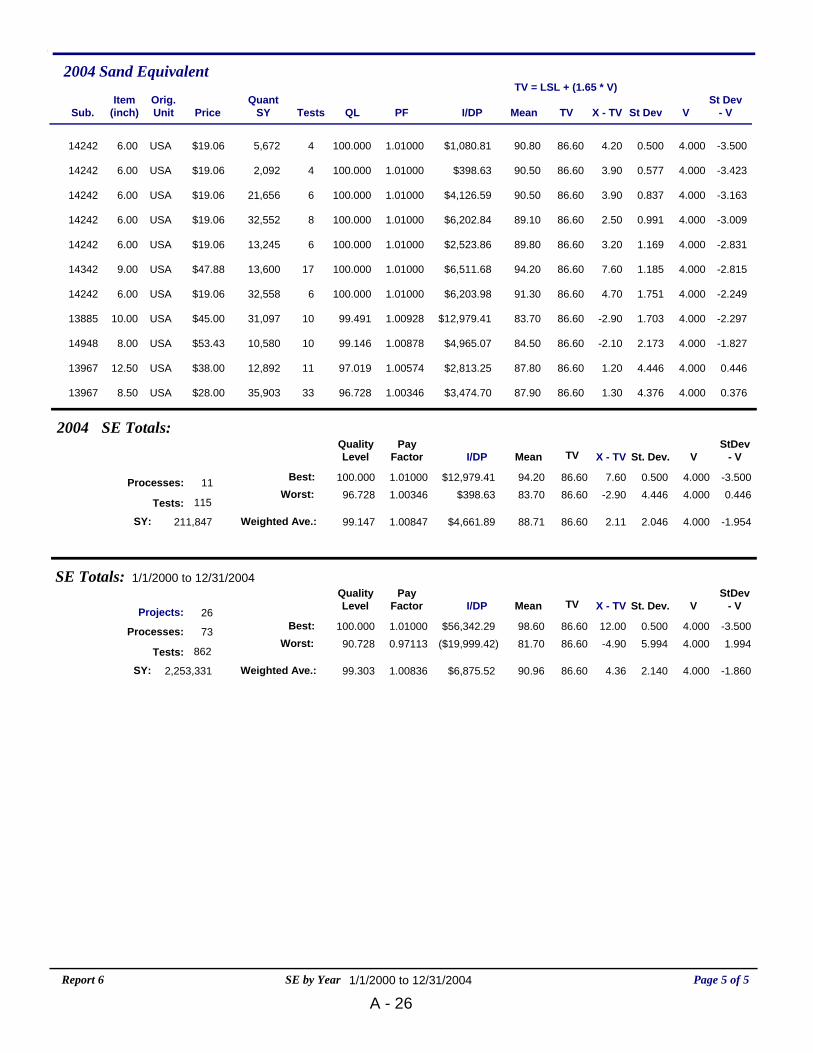
Item(inch) Price
QuantSY Tests QL PF I/DP St DevMean X - TV V
St Dev- VSub.
TV = LSL + (1.65 * V)
TVOrig.Unit
Sand Equivalent2004
6.00 $19.06 5,672 4 100.000 1.01000 $1,080.81 0.50090.80 -3.5004.0004.2086.6014242 USA
6.00 $19.06 2,092 4 100.000 1.01000 $398.63 0.57790.50 -3.4234.0003.9086.6014242 USA
6.00 $19.06 21,656 6 100.000 1.01000 $4,126.59 0.83790.50 -3.1634.0003.9086.6014242 USA
6.00 $19.06 32,552 8 100.000 1.01000 $6,202.84 0.99189.10 -3.0094.0002.5086.6014242 USA
6.00 $19.06 13,245 6 100.000 1.01000 $2,523.86 1.16989.80 -2.8314.0003.2086.6014242 USA
9.00 $47.88 13,600 17 100.000 1.01000 $6,511.68 1.18594.20 -2.8154.0007.6086.6014342 USA
6.00 $19.06 32,558 6 100.000 1.01000 $6,203.98 1.75191.30 -2.2494.0004.7086.6014242 USA
10.00 $45.00 31,097 10 99.491 1.00928 $12,979.41 1.70383.70 -2.2974.000-2.9086.6013885 USA
8.00 $53.43 10,580 10 99.146 1.00878 $4,965.07 2.17384.50 -1.8274.000-2.1086.6014948 USA
12.50 $38.00 12,892 11 97.019 1.00574 $2,813.25 4.44687.80 0.4464.0001.2086.6013967 USA
8.50 $28.00 35,903 33 96.728 1.00346 $3,474.70 4.37687.90 0.3764.0001.3086.6013967 USA
115
Processes: 11
QualityLevel
PayFactor St. Dev.
SY: 211,847 99.147 1.00847 2.046Weighted Ave.:
100.00096.728Worst:
Best: 1.010001.00346
0.5004.446
94.2083.70
-3.5000.446
MeanStDev
- V
88.71 -1.954
4.000
V
4.000
4.000
SE Totals:
Tests:
$12,979.41$398.63
$4,661.89
I/DP
86.6086.60
86.60
TV
7.60-2.90
2.11
X - TV
2004
862
Processes: 73
QualityLevel
PayFactor St. Dev.
SY: 2,253,331 99.303 1.00836 2.140Weighted Ave.:
100.00090.728Worst:
Best: 1.010000.97113
0.5005.994
98.6081.70
-3.5001.994
MeanStDev
- V
90.96 -1.860
4.000
V
4.000
4.000
SE Totals:
Tests:
$56,342.29($19,999.42)
$6,875.52
I/DP
86.6086.60
86.60
TV
12.00-4.90
4.36
X - TVProjects: 26
1/1/2000 to 12/31/2004
Page 5 of 5SE by YearReport 6 1/1/2000 to 12/31/2004
A - 26
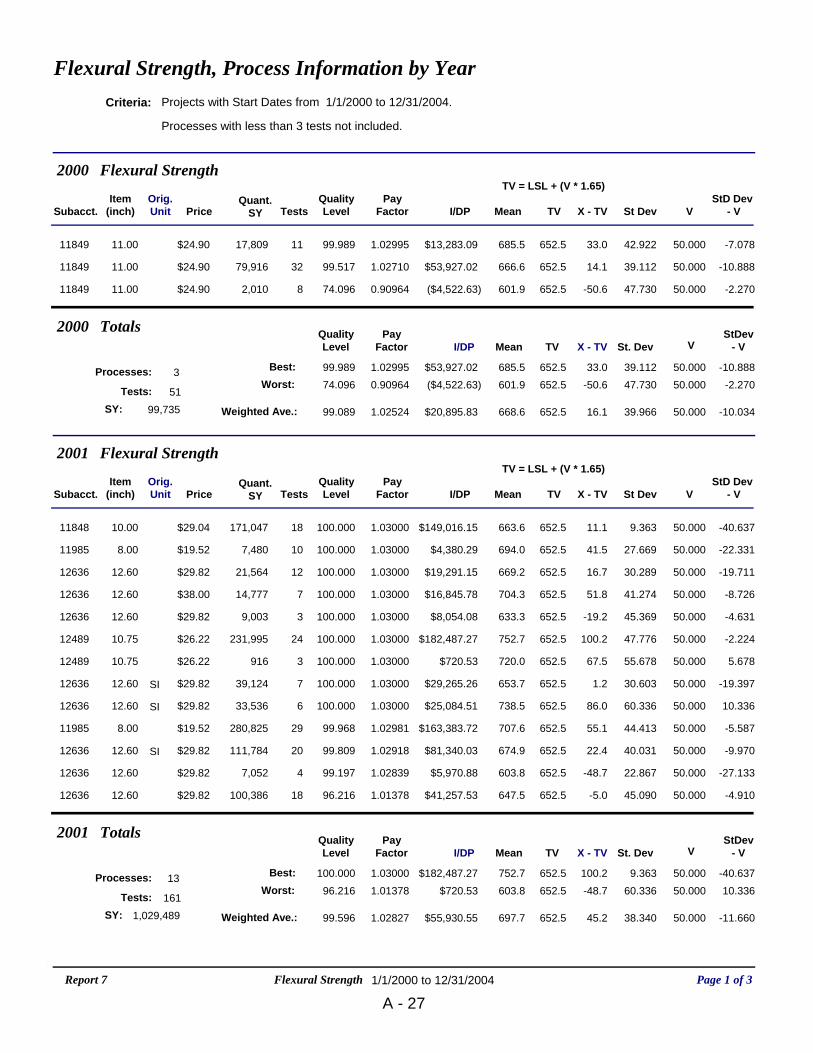
Flexural Strength, Process Information by YearProjects with Start Dates from 1/1/2000 to 12/31/2004.
Processes with less than 3 tests not included.
Criteria:
Subacct.Item
(inch) PriceQuant.
SY TestsQualityLevel
PayFactor I/DP Mean
TV = LSL + (V * 1.65)
TV X - TV St Dev VStD Dev
- VOrig.Unit
Flexural Strength2000
11849 11.00 $24.90 17,809 11 99.989 1.02995 $13,283.09 685.5 652.5 33.0 42.922 50.000 -7.078
11849 11.00 $24.90 79,916 32 99.517 1.02710 $53,927.02 666.6 652.5 14.1 39.112 50.000 -10.888
11849 11.00 $24.90 2,010 8 74.096 0.90964 ($4,522.63) 601.9 652.5 -50.6 47.730 50.000 -2.270
51
Processes: 3
QualityLevel
PayFactor St. Dev
SY: 99,735 99.089 1.02524 39.966Weighted Ave.:
99.98974.096Worst:
Best: 1.029950.90964
39.11247.730
685.5601.9
-10.888-2.270
MeanStDev
- V
668.6 -10.034
50.000
V
50.000
50.000
Tests:
$53,927.02($4,522.63)
$20,895.83
I/DP
652.5652.5
652.5
TV
33.0-50.6
16.1
X - TV
Totals2000
Subacct.Item
(inch) PriceQuant.
SY TestsQualityLevel
PayFactor I/DP Mean
TV = LSL + (V * 1.65)
TV X - TV St Dev VStD Dev
- VOrig.Unit
Flexural Strength2001
11848 10.00 $29.04 171,047 18 100.000 1.03000 $149,016.15 663.6 652.5 11.1 9.363 50.000 -40.637
11985 8.00 $19.52 7,480 10 100.000 1.03000 $4,380.29 694.0 652.5 41.5 27.669 50.000 -22.331
12636 12.60 $29.82 21,564 12 100.000 1.03000 $19,291.15 669.2 652.5 16.7 30.289 50.000 -19.711
12636 12.60 $38.00 14,777 7 100.000 1.03000 $16,845.78 704.3 652.5 51.8 41.274 50.000 -8.726
12636 12.60 $29.82 9,003 3 100.000 1.03000 $8,054.08 633.3 652.5 -19.2 45.369 50.000 -4.631
12489 10.75 $26.22 231,995 24 100.000 1.03000 $182,487.27 752.7 652.5 100.2 47.776 50.000 -2.224
12489 10.75 $26.22 916 3 100.000 1.03000 $720.53 720.0 652.5 67.5 55.678 50.000 5.678
12636 12.60 $29.82 39,124 7 100.000 1.03000 $29,265.26 653.7 652.5 1.2 30.603 50.000 -19.397SI
12636 12.60 $29.82 33,536 6 100.000 1.03000 $25,084.51 738.5 652.5 86.0 60.336 50.000 10.336SI
11985 8.00 $19.52 280,825 29 99.968 1.02981 $163,383.72 707.6 652.5 55.1 44.413 50.000 -5.587
12636 12.60 $29.82 111,784 20 99.809 1.02918 $81,340.03 674.9 652.5 22.4 40.031 50.000 -9.970SI
12636 12.60 $29.82 7,052 4 99.197 1.02839 $5,970.88 603.8 652.5 -48.7 22.867 50.000 -27.133
12636 12.60 $29.82 100,386 18 96.216 1.01378 $41,257.53 647.5 652.5 -5.0 45.090 50.000 -4.910
161
Processes: 13
QualityLevel
PayFactor St. Dev
SY: 1,029,489 99.596 1.02827 38.340Weighted Ave.:
100.00096.216Worst:
Best: 1.030001.01378
9.36360.336
752.7603.8
-40.63710.336
MeanStDev
- V
697.7 -11.660
50.000
V
50.000
50.000
Tests:
$182,487.27$720.53
$55,930.55
I/DP
652.5652.5
652.5
TV
100.2-48.7
45.2
X - TV
Totals2001
Page 1 of 3Flexural StrengthReport 7 1/1/2000 to 12/31/2004
A - 27
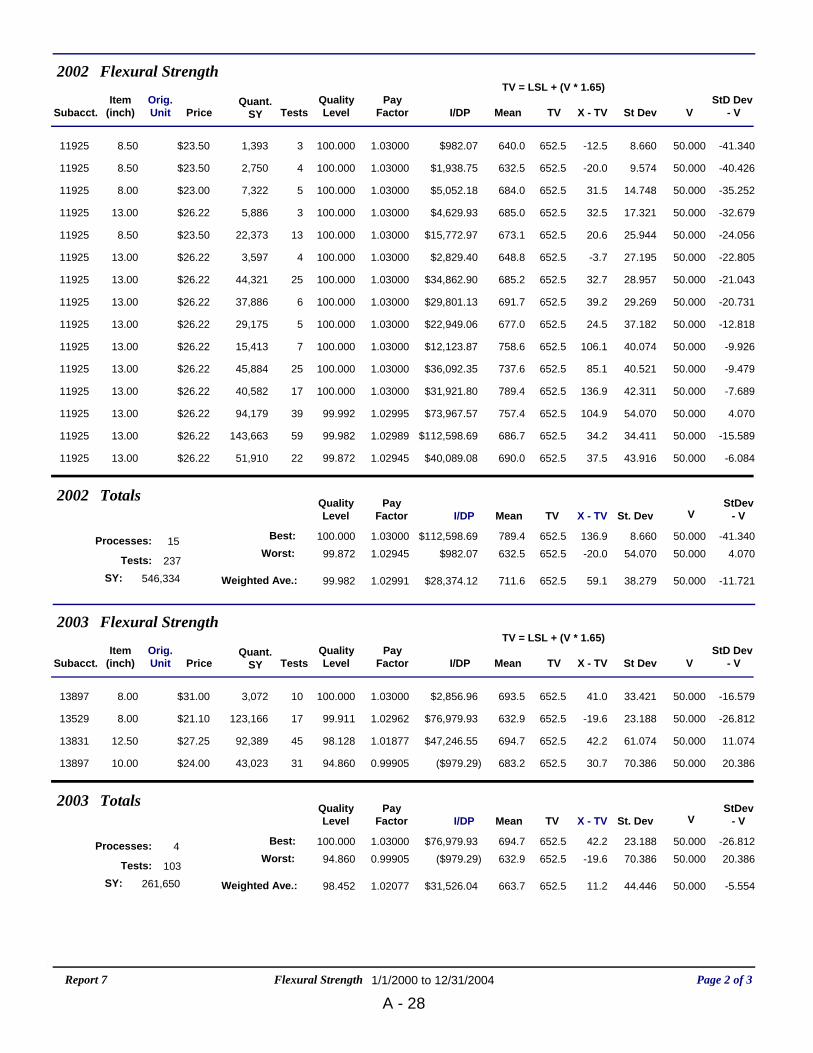
Subacct.Item
(inch) PriceQuant.
SY TestsQualityLevel
PayFactor I/DP Mean
TV = LSL + (V * 1.65)
TV X - TV St Dev VStD Dev
- VOrig.Unit
Flexural Strength2002
11925 8.50 $23.50 1,393 3 100.000 1.03000 $982.07 640.0 652.5 -12.5 8.660 50.000 -41.340
11925 8.50 $23.50 2,750 4 100.000 1.03000 $1,938.75 632.5 652.5 -20.0 9.574 50.000 -40.426
11925 8.00 $23.00 7,322 5 100.000 1.03000 $5,052.18 684.0 652.5 31.5 14.748 50.000 -35.252
11925 13.00 $26.22 5,886 3 100.000 1.03000 $4,629.93 685.0 652.5 32.5 17.321 50.000 -32.679
11925 8.50 $23.50 22,373 13 100.000 1.03000 $15,772.97 673.1 652.5 20.6 25.944 50.000 -24.056
11925 13.00 $26.22 3,597 4 100.000 1.03000 $2,829.40 648.8 652.5 -3.7 27.195 50.000 -22.805
11925 13.00 $26.22 44,321 25 100.000 1.03000 $34,862.90 685.2 652.5 32.7 28.957 50.000 -21.043
11925 13.00 $26.22 37,886 6 100.000 1.03000 $29,801.13 691.7 652.5 39.2 29.269 50.000 -20.731
11925 13.00 $26.22 29,175 5 100.000 1.03000 $22,949.06 677.0 652.5 24.5 37.182 50.000 -12.818
11925 13.00 $26.22 15,413 7 100.000 1.03000 $12,123.87 758.6 652.5 106.1 40.074 50.000 -9.926
11925 13.00 $26.22 45,884 25 100.000 1.03000 $36,092.35 737.6 652.5 85.1 40.521 50.000 -9.479
11925 13.00 $26.22 40,582 17 100.000 1.03000 $31,921.80 789.4 652.5 136.9 42.311 50.000 -7.689
11925 13.00 $26.22 94,179 39 99.992 1.02995 $73,967.57 757.4 652.5 104.9 54.070 50.000 4.070
11925 13.00 $26.22 143,663 59 99.982 1.02989 $112,598.69 686.7 652.5 34.2 34.411 50.000 -15.589
11925 13.00 $26.22 51,910 22 99.872 1.02945 $40,089.08 690.0 652.5 37.5 43.916 50.000 -6.084
237
Processes: 15
QualityLevel
PayFactor St. Dev
SY: 546,334 99.982 1.02991 38.279Weighted Ave.:
100.00099.872Worst:
Best: 1.030001.02945
8.66054.070
789.4632.5
-41.3404.070
MeanStDev
- V
711.6 -11.721
50.000
V
50.000
50.000
Tests:
$112,598.69$982.07
$28,374.12
I/DP
652.5652.5
652.5
TV
136.9-20.0
59.1
X - TV
Totals2002
Subacct.Item
(inch) PriceQuant.
SY TestsQualityLevel
PayFactor I/DP Mean
TV = LSL + (V * 1.65)
TV X - TV St Dev VStD Dev
- VOrig.Unit
Flexural Strength2003
13897 8.00 $31.00 3,072 10 100.000 1.03000 $2,856.96 693.5 652.5 41.0 33.421 50.000 -16.579
13529 8.00 $21.10 123,166 17 99.911 1.02962 $76,979.93 632.9 652.5 -19.6 23.188 50.000 -26.812
13831 12.50 $27.25 92,389 45 98.128 1.01877 $47,246.55 694.7 652.5 42.2 61.074 50.000 11.074
13897 10.00 $24.00 43,023 31 94.860 0.99905 ($979.29) 683.2 652.5 30.7 70.386 50.000 20.386
103
Processes: 4
QualityLevel
PayFactor St. Dev
SY: 261,650 98.452 1.02077 44.446Weighted Ave.:
100.00094.860Worst:
Best: 1.030000.99905
23.18870.386
694.7632.9
-26.81220.386
MeanStDev
- V
663.7 -5.554
50.000
V
50.000
50.000
Tests:
$76,979.93($979.29)
$31,526.04
I/DP
652.5652.5
652.5
TV
42.2-19.6
11.2
X - TV
Totals2003
Page 2 of 3Flexural StrengthReport 7 1/1/2000 to 12/31/2004
A - 28

552
Processes: 35
QualityLevel
PayFactor St. Dev
SY: 1,937,208 99.524 1.02756 39.231Weighted Ave.:
100.00074.096Worst:
Best: 1.030000.90964
8.66070.386
789.4601.9
-41.34020.386
MeanStDev
- V
695.5 -10.769
50.000
V
50.000
50.000
Totals:
Tests:
$182,487.27($4,522.63)
$38,328.59
I/DP
652.5652.5
652.5
TV
136.9-50.6
43.0
X - TVProjects: 9
1/1/2000 to 12/31/2004.
Page 3 of 3Flexural StrengthReport 7 1/1/2000 to 12/31/2004
A - 29


Appendix B 2004 Projects
Report 8 Project Data 2004 Projects..................................................................... B - 1

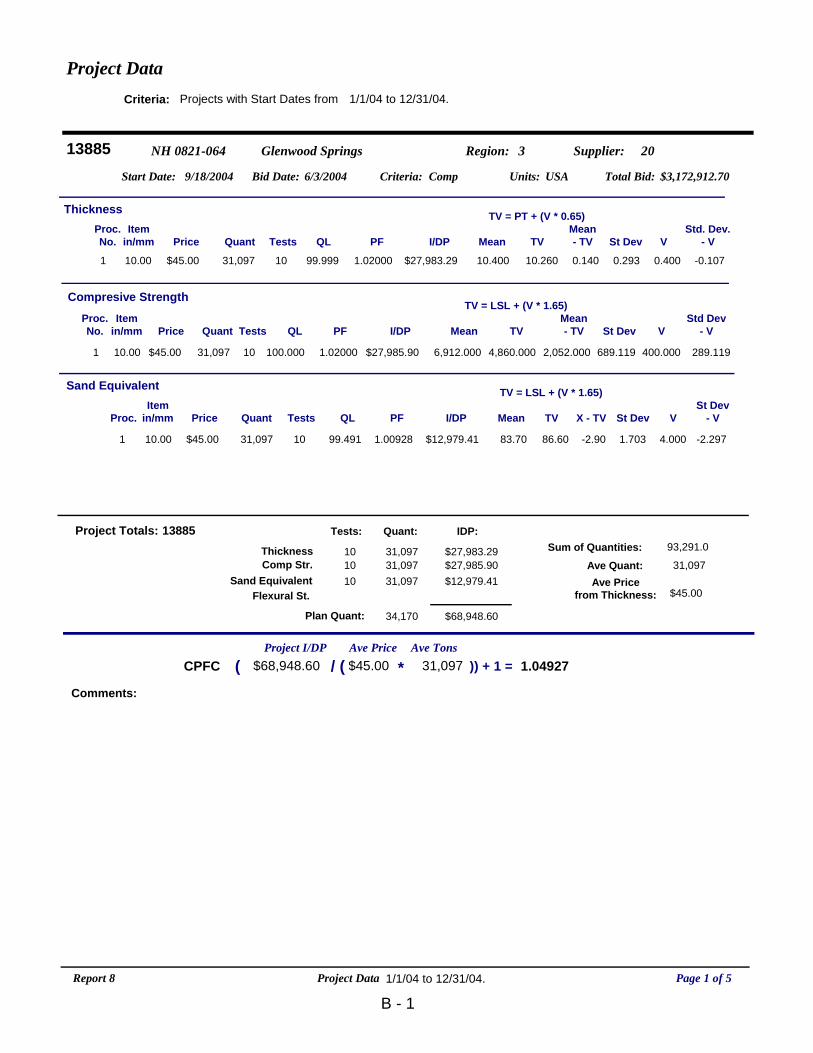
Project DataProjects with Start Dates from 1/1/04 to 12/31/04.Criteria:
13885 NH 0821-064 Glenwood Springs Region: 3
Bid Date: 6/3/2004 Total Bid: $3,172,912.70Criteria: Comp Units: USA
Supplier: 20
Start Date: 9/18/2004
Itemin/mm PriceProc. Quant Tests QL PF I/DP St DevMean
Sand Equivalent TV = LSL + (V * 1.65)
TV X - TV VSt Dev
- V
10.00 $45.001 31,097 10 99.491 1.00928 $12,979.41 1.70383.70 -2.2974.000-2.9086.60
Itemin/mm Price
Proc.No. Quant Tests QL PF St DevMean
Compresive Strength
I/DPStd Dev
- VVMean- TV
TV = LSL + (V * 1.65)
TV
10.00 $45.001 31,097 10 100.000 1.02000 689.1196,912.000$27,985.90 289.119400.0002,052.0004,860.000
Itemin/mm Price
Proc.No. Quant Tests QL PF St DevMean
Thickness
I/DPMean- TV V
Std. Dev.- V
TV = PT + (V * 0.65)
TV
10.00 $45.001 31,097 10 99.999 1.02000 0.29310.400$27,983.29 0.140 0.400 -0.10710.260
Comments:
$27,985.9010 31,097 $27,983.29
10 31,097 $12,979.4110 31,097
ThicknessComp Str.
Sand Equivalent
Tests: Quant: IDP:Project Totals:
$68,948.60
Flexural St.Ave Price
from Thickness: $45.00
Sum of Quantities: 93,291.0
Project I/DP Ave TonsAve PriceCPFC / ( )) + 1 =*( $45.00
Plan Quant: 34,170
Ave Quant: 31,097
31,097$68,948.60 1.04927
13885
Page 1 of 5Project DataReport 8 1/1/04 to 12/31/04.
B - 1

Project Data
13967 IM 0252-359 Castle Pines Interchange Region: 1
Bid Date: 2/26/2004 Total Bid: $6,773,273.49Criteria: Comp Units: USA
Supplier: 12
Start Date: 9/10/2004
Itemin/mm PriceProc. Quant Tests QL PF I/DP St DevMean
Sand Equivalent TV = LSL + (V * 1.65)
TV X - TV VSt Dev
- V
8.50 $28.001 35,903 33 96.728 1.00346 $3,474.70 4.37687.90 0.3764.0001.3086.60
12.50 $38.002 12,892 11 97.019 1.00574 $2,813.25 4.44687.80 0.4464.0001.2086.60
Itemin/mm Price
Proc.No. Quant Tests QL PF St DevMean
Compresive Strength
I/DPStd Dev
- VVMean- TV
TV = LSL + (V * 1.65)
TV
8.50 $28.001 35,903 23 98.550 1.01586 463.7535,168.700$15,938.84 63.753400.000308.7004,860.000
12.50 $38.002 12,892 10 91.539 0.99109 975.3155,508.000($4,363.69) 575.315400.000648.0004,860.000
Itemin/mm Price
Proc.No. Quant Tests QL PF St DevMean
Thickness
I/DPMean- TV V
Std. Dev.- V
TV = PT + (V * 0.65)
TV
8.50 $28.001 35,903 14 98.494 1.01570 0.3698.843$15,778.12 0.083 0.400 -0.0318.760
12.50 $38.002 12,892 5 100.000 1.02000 0.12212.600$9,795.47 -0.160 0.400 -0.27812.760
Comments:
$11,575.1519 48,795 $25,573.59
44 48,795 $6,287.9533 48,795
ThicknessComp Str.
Sand Equivalent
Tests: Quant: IDP:Project Totals:
$43,436.69
Flexural St.Ave Price
from Thickness: $30.64
Sum of Quantities: 146,385.0
Project I/DP Ave TonsAve PriceCPFC / ( )) + 1 =*( $30.64
Plan Quant: 48,418
Ave Quant: 48,795
48,795$43,436.69 1.02905
13967
Page 2 of 5Project DataReport 8 1/1/04 to 12/31/04.
B - 2
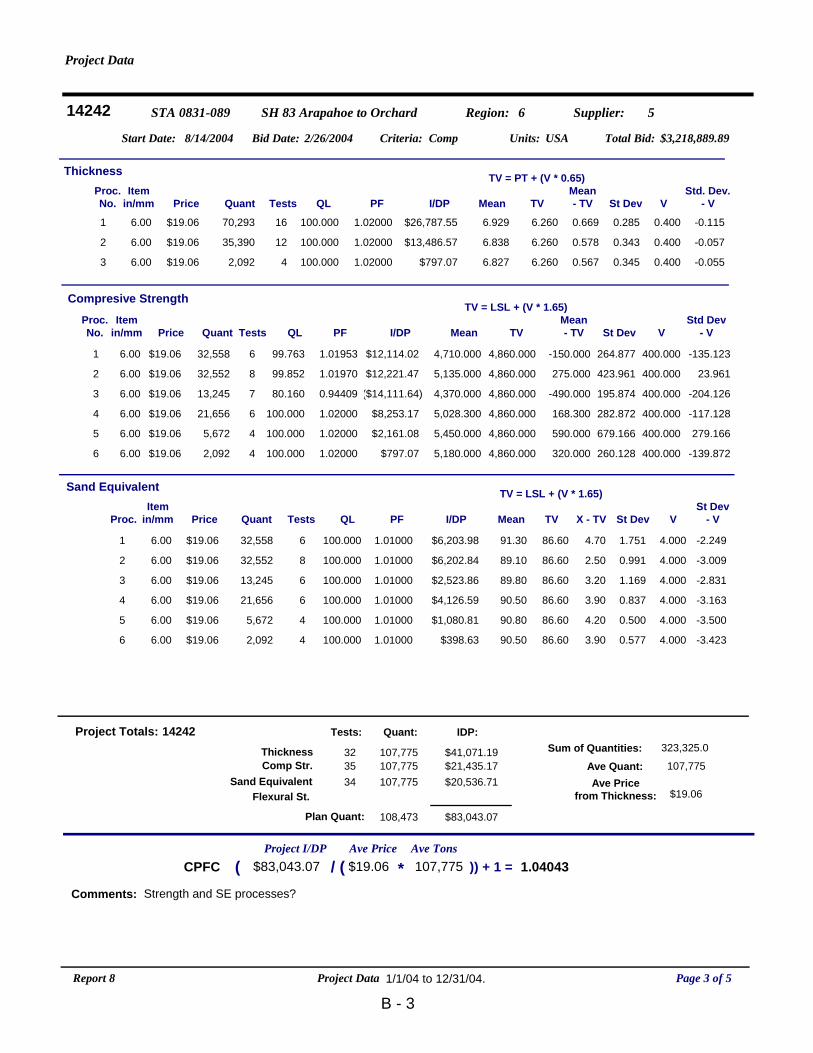
Project Data
14242 STA 0831-089 SH 83 Arapahoe to Orchard Region: 6
Bid Date: 2/26/2004 Total Bid: $3,218,889.89Criteria: Comp Units: USA
Supplier: 5
Start Date: 8/14/2004
Itemin/mm PriceProc. Quant Tests QL PF I/DP St DevMean
Sand Equivalent TV = LSL + (V * 1.65)
TV X - TV VSt Dev
- V
6.00 $19.061 32,558 6 100.000 1.01000 $6,203.98 1.75191.30 -2.2494.0004.7086.60
6.00 $19.062 32,552 8 100.000 1.01000 $6,202.84 0.99189.10 -3.0094.0002.5086.60
6.00 $19.063 13,245 6 100.000 1.01000 $2,523.86 1.16989.80 -2.8314.0003.2086.60
6.00 $19.064 21,656 6 100.000 1.01000 $4,126.59 0.83790.50 -3.1634.0003.9086.60
6.00 $19.065 5,672 4 100.000 1.01000 $1,080.81 0.50090.80 -3.5004.0004.2086.60
6.00 $19.066 2,092 4 100.000 1.01000 $398.63 0.57790.50 -3.4234.0003.9086.60
Itemin/mm Price
Proc.No. Quant Tests QL PF St DevMean
Compresive Strength
I/DPStd Dev
- VVMean- TV
TV = LSL + (V * 1.65)
TV
6.00 $19.061 32,558 6 99.763 1.01953 264.8774,710.000$12,114.02 -135.123400.000-150.0004,860.000
6.00 $19.062 32,552 8 99.852 1.01970 423.9615,135.000$12,221.47 23.961400.000275.0004,860.000
6.00 $19.063 13,245 7 80.160 0.94409 195.8744,370.000($14,111.64) -204.126400.000-490.0004,860.000
6.00 $19.064 21,656 6 100.000 1.02000 282.8725,028.300$8,253.17 -117.128400.000168.3004,860.000
6.00 $19.065 5,672 4 100.000 1.02000 679.1665,450.000$2,161.08 279.166400.000590.0004,860.000
6.00 $19.066 2,092 4 100.000 1.02000 260.1285,180.000$797.07 -139.872400.000320.0004,860.000
Itemin/mm Price
Proc.No. Quant Tests QL PF St DevMean
Thickness
I/DPMean- TV V
Std. Dev.- V
TV = PT + (V * 0.65)
TV
6.00 $19.061 70,293 16 100.000 1.02000 0.2856.929$26,787.55 0.669 0.400 -0.1156.260
6.00 $19.062 35,390 12 100.000 1.02000 0.3436.838$13,486.57 0.578 0.400 -0.0576.260
6.00 $19.063 2,092 4 100.000 1.02000 0.3456.827$797.07 0.567 0.400 -0.0556.260
Comments: Strength and SE processes?
$21,435.1732 107,775 $41,071.19
34 107,775 $20,536.7135 107,775
ThicknessComp Str.
Sand Equivalent
Tests: Quant: IDP:Project Totals:
$83,043.07
Flexural St.Ave Price
from Thickness: $19.06
Sum of Quantities: 323,325.0
Project I/DP Ave TonsAve PriceCPFC / ( )) + 1 =*( $19.06
Plan Quant: 108,473
Ave Quant: 107,775
107,775$83,043.07 1.04043
14242
Page 3 of 5Project DataReport 8 1/1/04 to 12/31/04.
B - 3
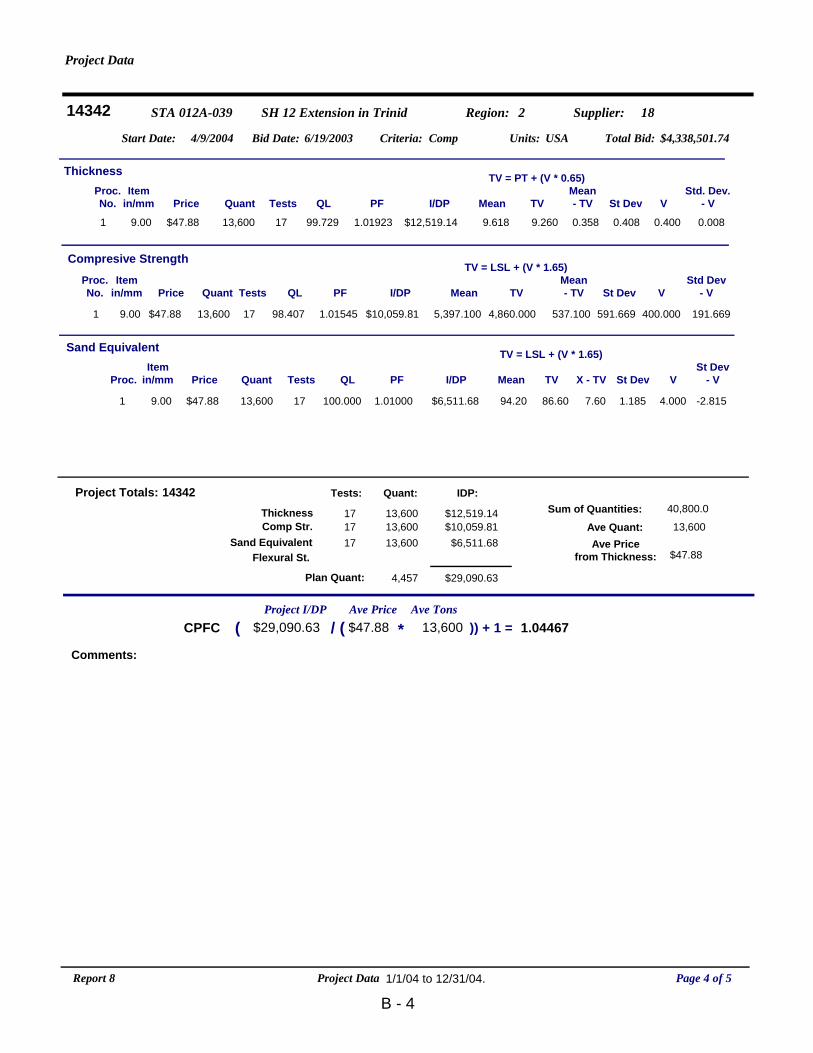
Project Data
14342 STA 012A-039 SH 12 Extension in Trinid Region: 2
Bid Date: 6/19/2003 Total Bid: $4,338,501.74Criteria: Comp Units: USA
Supplier: 18
Start Date: 4/9/2004
Itemin/mm PriceProc. Quant Tests QL PF I/DP St DevMean
Sand Equivalent TV = LSL + (V * 1.65)
TV X - TV VSt Dev
- V
9.00 $47.881 13,600 17 100.000 1.01000 $6,511.68 1.18594.20 -2.8154.0007.6086.60
Itemin/mm Price
Proc.No. Quant Tests QL PF St DevMean
Compresive Strength
I/DPStd Dev
- VVMean- TV
TV = LSL + (V * 1.65)
TV
9.00 $47.881 13,600 17 98.407 1.01545 591.6695,397.100$10,059.81 191.669400.000537.1004,860.000
Itemin/mm Price
Proc.No. Quant Tests QL PF St DevMean
Thickness
I/DPMean- TV V
Std. Dev.- V
TV = PT + (V * 0.65)
TV
9.00 $47.881 13,600 17 99.729 1.01923 0.4089.618$12,519.14 0.358 0.400 0.0089.260
Comments:
$10,059.8117 13,600 $12,519.14
17 13,600 $6,511.6817 13,600
ThicknessComp Str.
Sand Equivalent
Tests: Quant: IDP:Project Totals:
$29,090.63
Flexural St.Ave Price
from Thickness: $47.88
Sum of Quantities: 40,800.0
Project I/DP Ave TonsAve PriceCPFC / ( )) + 1 =*( $47.88
Plan Quant: 4,457
Ave Quant: 13,600
13,600$29,090.63 1.04467
14342
Page 4 of 5Project DataReport 8 1/1/04 to 12/31/04.
B - 4
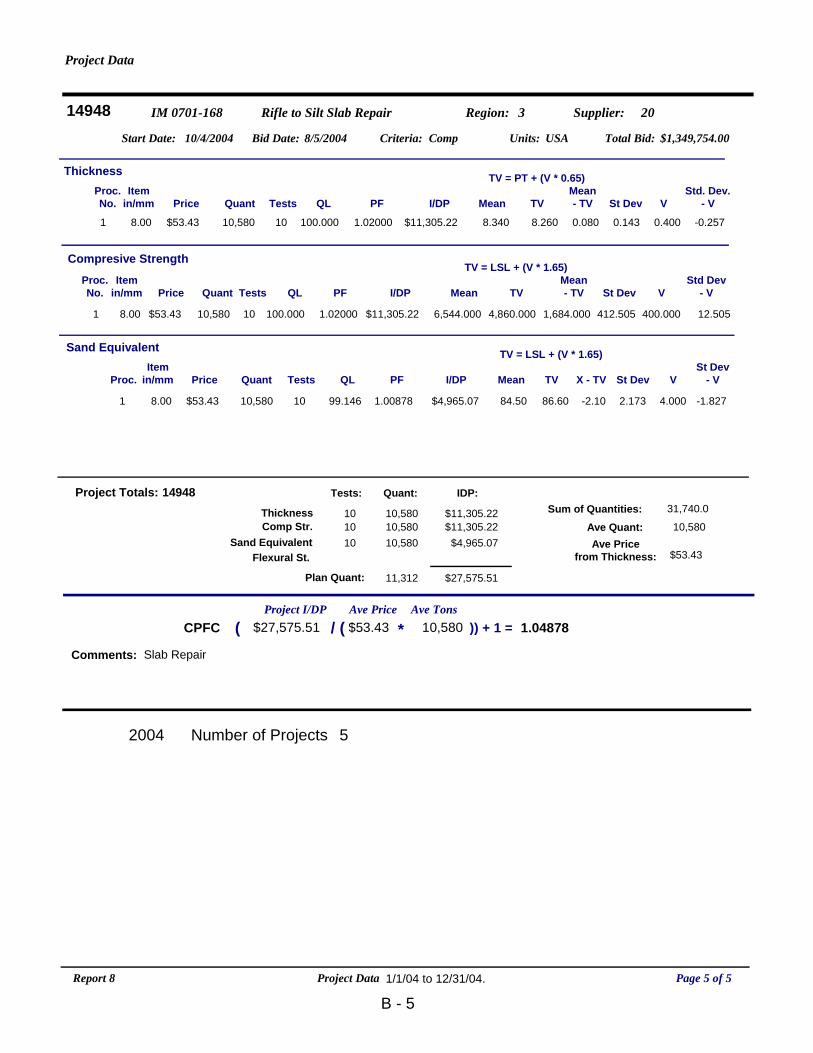
Project Data
14948 IM 0701-168 Rifle to Silt Slab Repair Region: 3
Bid Date: 8/5/2004 Total Bid: $1,349,754.00Criteria: Comp Units: USA
Supplier: 20
Start Date: 10/4/2004
Itemin/mm PriceProc. Quant Tests QL PF I/DP St DevMean
Sand Equivalent TV = LSL + (V * 1.65)
TV X - TV VSt Dev
- V
8.00 $53.431 10,580 10 99.146 1.00878 $4,965.07 2.17384.50 -1.8274.000-2.1086.60
Itemin/mm Price
Proc.No. Quant Tests QL PF St DevMean
Compresive Strength
I/DPStd Dev
- VVMean- TV
TV = LSL + (V * 1.65)
TV
8.00 $53.431 10,580 10 100.000 1.02000 412.5056,544.000$11,305.22 12.505400.0001,684.0004,860.000
Itemin/mm Price
Proc.No. Quant Tests QL PF St DevMean
Thickness
I/DPMean- TV V
Std. Dev.- V
TV = PT + (V * 0.65)
TV
8.00 $53.431 10,580 10 100.000 1.02000 0.1438.340$11,305.22 0.080 0.400 -0.2578.260
Comments: Slab Repair
$11,305.2210 10,580 $11,305.22
10 10,580 $4,965.0710 10,580
ThicknessComp Str.
Sand Equivalent
Tests: Quant: IDP:Project Totals:
$27,575.51
Flexural St.Ave Price
from Thickness: $53.43
Sum of Quantities: 31,740.0
Project I/DP Ave TonsAve PriceCPFC / ( )) + 1 =*( $53.43
Plan Quant: 11,312
Ave Quant: 10,580
10,580$27,575.51 1.04878
14948
52004 Number of Projects
Page 5 of 5Project DataReport 8 1/1/04 to 12/31/04.
B - 5