PORT OF LOS ANGELES (HARBOR DEPARTMENT OF THE CITY …
103
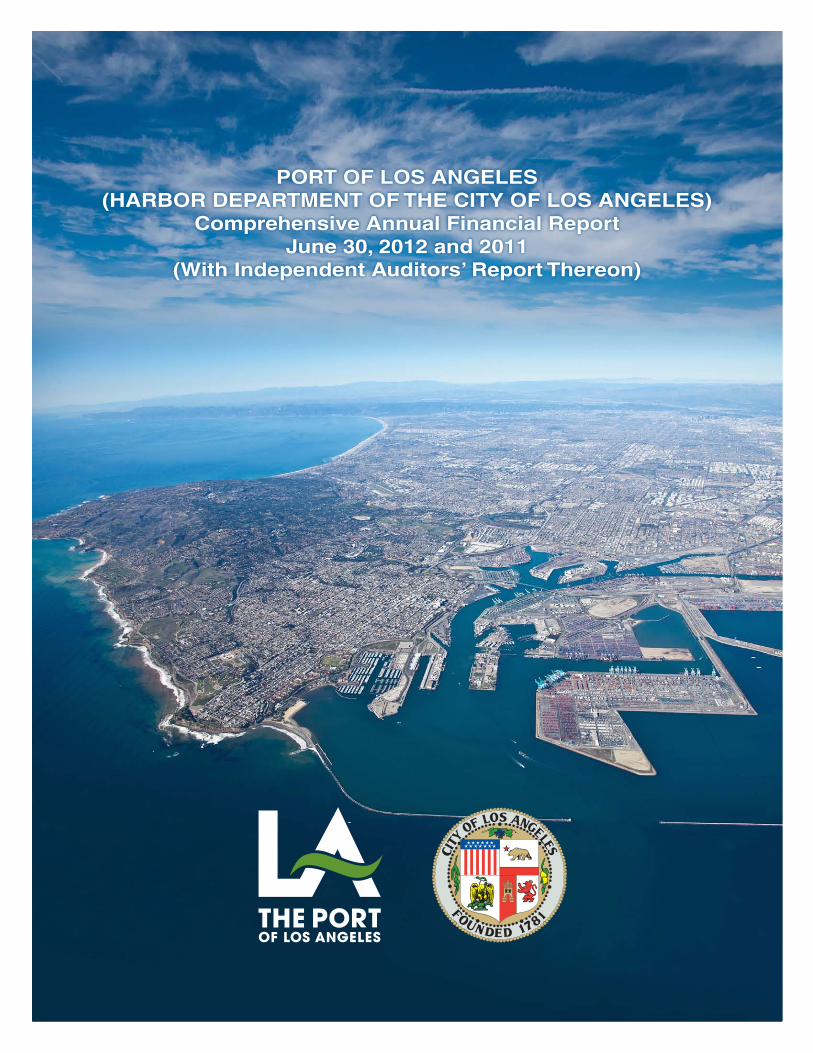
PORT OF LOS ANGELES (HARBOR DEPARTMENT OF THE CITY OF LOS ANGELES) Comprehensive Annual Financial Report June 30, 2012 and 2011 (With Independent Auditors’ Report Thereon)
Transcript of PORT OF LOS ANGELES (HARBOR DEPARTMENT OF THE CITY …
PORT OF LOS ANGELES(HARBOR DEPARTMENT OF THE CITY OF LOS ANGELES)
Comprehensive Annual Financial ReportJune 30, 2012 and 2011
(With Independent Auditors’ Report Thereon)
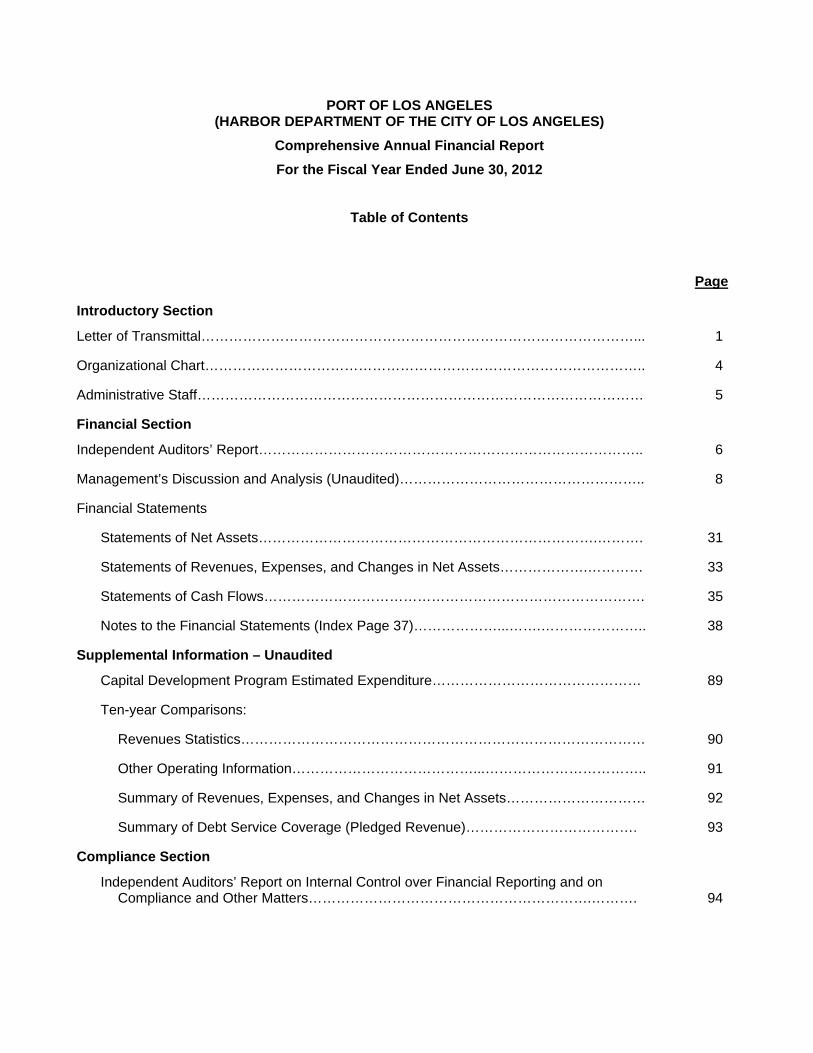
PORT OF LOS ANGELES (HARBOR DEPARTMENT OF THE CITY OF LOS ANGELES)
Comprehensive Annual Financial Report
For the Fiscal Year Ended June 30, 2012
Table of Contents
Page
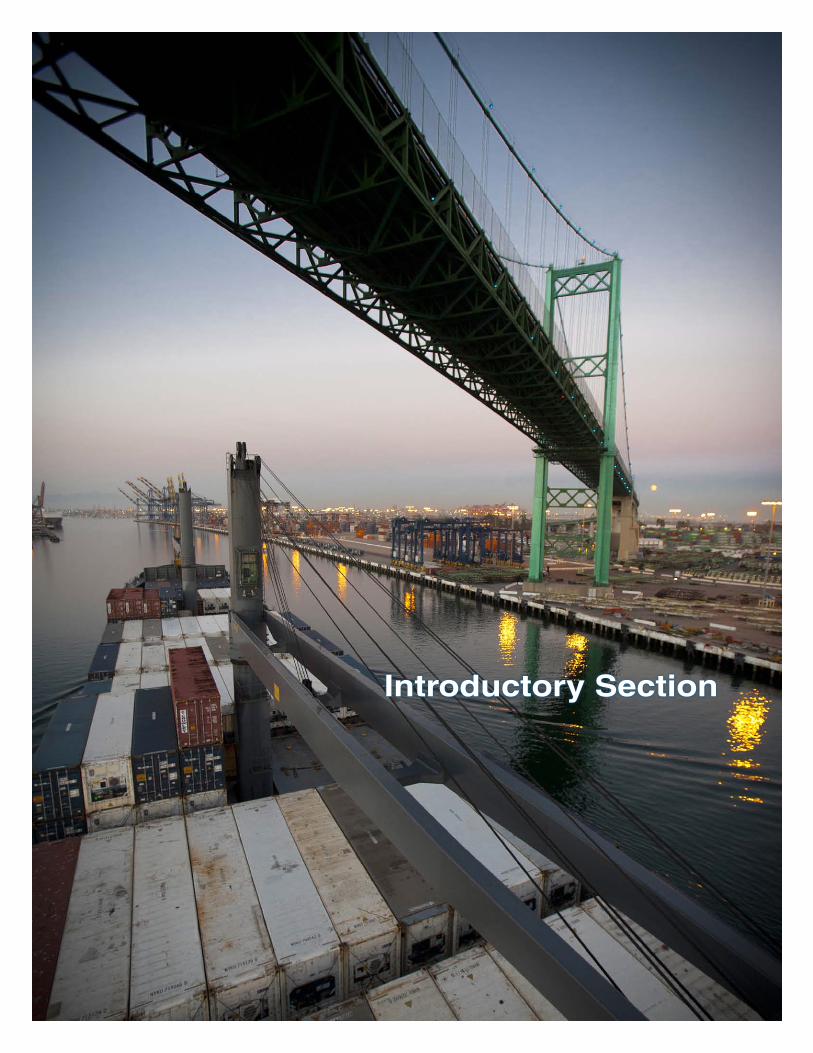
Introductory Section
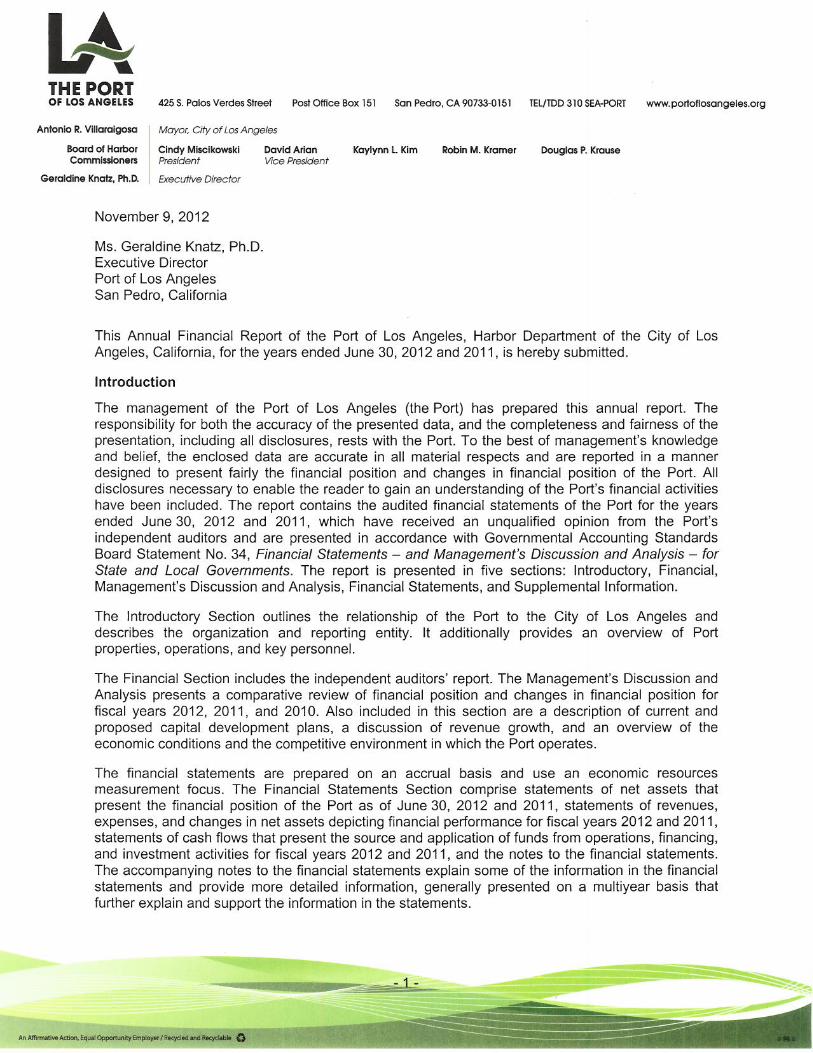
Letter of Transmittal…………………………………………………………………………………... 1
Organizational Chart………………………………………………………………………………….. 4
Administrative Staff…………………………………………………………………………………… 5
Financial Section
Independent Auditors’ Report……………………………………………………………………….. 6
Management’s Discussion and Analysis (Unaudited)…………………………………………….. 8
Financial Statements
Statements of Net Assets……………………………………………………………….………. 31
Statements of Revenues, Expenses, and Changes in Net Assets……………….………… 33
Statements of Cash Flows………………………………………………………………………. 35
Notes to the Financial Statements (Index Page 37)………………...…….………………….. 38
Supplemental Information – Unaudited
Capital Development Program Estimated Expenditure……………………………………… 89
Ten-year Comparisons:
Revenues Statistics…………………………………………………………………………… 90
Other Operating Information…………………………………...…………………………….. 91
Summary of Revenues, Expenses, and Changes in Net Assets………………………… 92
Summary of Debt Service Coverage (Pledged Revenue)………………………………. 93
Compliance Section
Independent Auditors’ Report on Internal Control over Financial Reporting and on Compliance and Other Matters…………………………………………………….………. 94
Introductory Section
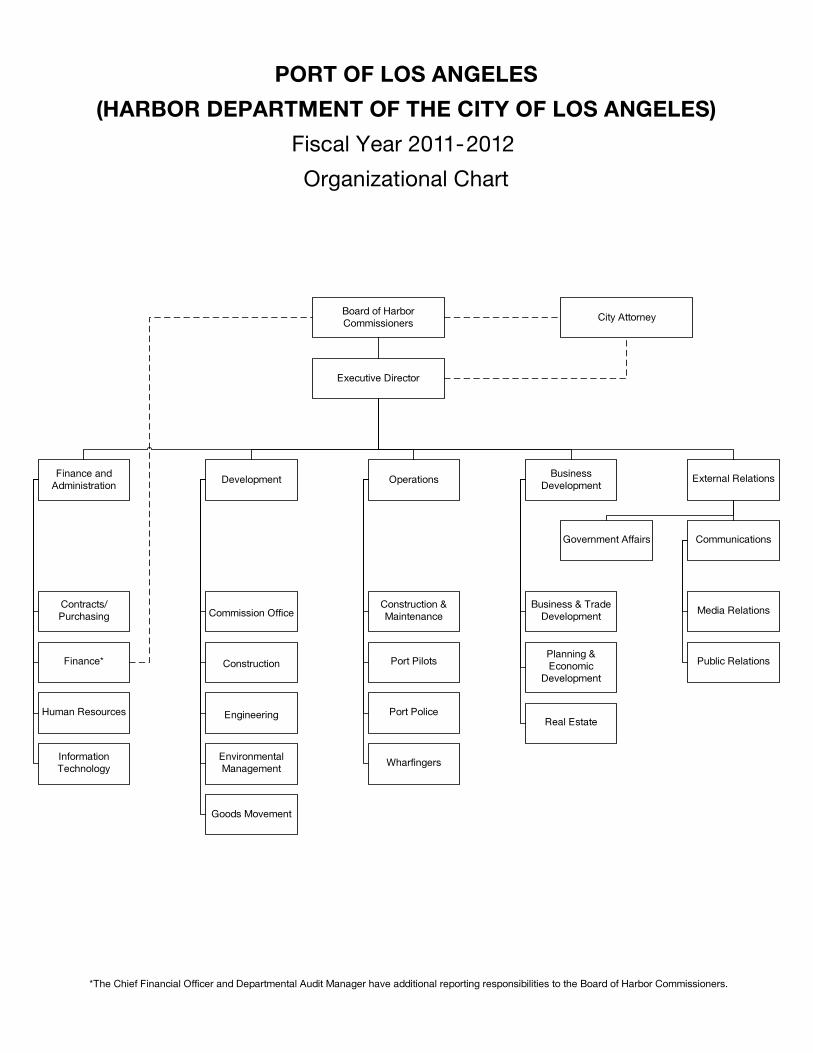
PORT OF LOS ANGELES
(HARBOR DEPARTMENT OF THE CITY OF LOS ANGELES)
Fiscal Year 2011-2012
Organizational Chart
Board of HarborCommissioners
Executive Director
City Attorney
Development OperationsFinance and
AdministrationBusiness
Development
Human Resources
Contracts/Purchasing
Information Technology
Finance*
Communications
Engineering
Environmental Management
Construction
Goods Movement
Construction & Maintenance
Port Pilots
Wharfingers
Port Police
Business & Trade Development
Planning & Economic
Development
Real Estate
Government Affairs
Commission Office
External Relations
Public Relations
Media Relations
*The Chief Financial Officer and Departmental Audit Manager have additional reporting responsibilities to the Board of Harbor Commissioners.

Board of Harbor Commissioners
Senior ManagementGeraldine Knatz, Ph.D., Executive Director
Michael Christensen, Deputy Executive Director – Development
Molly Campbell, Deputy Executive Director – Finance & Administration
Capt. John M. Holmes, Deputy Executive Director – Operation
Kathryn McDermott, Deputy Executive Director – Business Development
Cynthia Ruiz, Deputy Executive Director of External Relations
Arley Baker, Senior Director of Communications
David Libatique, Senior Director of Governmental Affairs
Management StaffTheresa Adams Lopez, Director of Public Relations
Diane Boskovich, Chief Wharfinger
Ronald Boyd, Chief of Port Police
Kerry Cartwright, Director of Goods Movement
Capt. Bent Christiansen and Capt. Mike Rubino, Pilot Service
Tony Gioiello, Chief Harbor Engineer of Design
Annie Gregorio, Director of Accounting
Jack Hedge, Director of Real Estate
Lance Kaneshiro, Director of Information Technology
Tish Lorenzana, Director of Human Resources
David Mathewson, Director of Planning & Economic Development
Kathy Merkovsky, Director of Risk Management
Jim Morgan, Director of Construction & Maintenance
Jim Olds, Director of Management Audits
Karl K.Y. Pan, Chief Financial Officer
Glenn Robison, Director of Contracts & Purchasing
Soheila Sajadian Director of Debt & Treasury
Phillip Sanfield, Director of Media Relations
Shaun Shahrestani, Chief Harbor Engineer of Construction
Julie Wichmann Huerta, Commission Office
Christopher Cannon, Director of Environmental Management
Eileen Yohsimura, Director of Financial Management
Cindy Miscikowski, President
David Arian, Vice President
Robin Kramer, Commissioner
Dr. Sung Won Sohn, Commissioner
Douglas P. Krause, Commissioner

Financial Section

KPMG LLP Suite 2000 355 South Grand Avenue Los Angeles, CA 90071-1568
KPMG LLP is a Delaware limited liability partnership, the U.S. member firm of KPMG International Cooperative (“KPMG International”), a Swiss entity.
Independent Auditors’ Report
The Board of Commissioners Port of Los Angeles (Harbor Department of the City of Los Angeles):
We have audited the accompanying financial statements of the Port of Los Angeles (Harbor Department of the City of Los Angeles) (the Port), an enterprise fund of the City of Los Angeles, California, as of and for the years ended June 30, 2012 and 2011, as listed in the accompanying table of contents. These financial statements are the responsibility of the Port’s management. Our responsibility is to express an opinion on these financial statements based on our audits.
We conducted our audits in accordance with auditing standards generally accepted in the United States of America; and the standards applicable to financial audits contained in Government Auditing Standards, issued by the Comptroller General of the United States. Those standards require that we plan and perform the audits to obtain reasonable assurance about whether the financial statements are free of material misstatement. An audit includes consideration of internal control over financial reporting as a basis for designing audit procedures that are appropriate in the circumstances, but not for the purpose of expressing an opinion on the effectiveness of the Port’s internal control over financial reporting. Accordingly, we express no such opinion. An audit also includes examining, on a test basis, evidence supporting the amounts and disclosures in the financial statements, assessing the accounting principles used and significant estimates made by management, as well as evaluating the overall financial statement presentation. We believe that our audits provide a reasonable basis for our opinion.
As discussed in note 1, the financial statements of the Port are intended to present the financial position, the changes in financial position, and cash flows of only that portion of the business-type activities of the City of Los Angeles, California that is attributable to the transactions of the Port. They do not purport to, and do not, present fairly the financial position of the City of Los Angeles, California as of June 30, 2012 and 2011, the changes in its financial position or, where applicable, its cash flows for the years then ended in conformity with U.S. generally accepted accounting principles.
In our opinion, the financial statements referred to above present fairly, in all material respects, the financial position of the Port of Los Angeles (Harbor Department of the City of Los Angeles) as of June 30, 2012 and 2011, and the changes in its net assets and its cash flows for the years then ended in conformity with U.S. generally accepted accounting principles.
7
In accordance with Government Auditing Standards, we have also issued our reports dated November 14, 2012, on our consideration of the Port’s internal control over financial reporting and our tests of its compliance with certain provisions of laws, regulations, contracts, and grant agreements and other matters. The purpose of those reports is to describe the scope of our testing of internal control over financial reporting and compliance and the results of that testing, and not to provide an opinion on the internal control over financial reporting or on compliance. Those reports are an integral part of an audit performed in accordance with Government Auditing Standards and should be read in conjunction with this report in assessing the results of our audits.
U.S. generally accepted accounting principles require that the management’s discussion and analysis on pages 8 – 30 be presented to supplement the basic financial statements. Such information, although not a part of the basic financial statements, is required by the Governmental Accounting Standards Board who considers it to be an essential part of financial reporting for placing the basic financial statements in an appropriate operational, economic, or historical context. We have applied certain limited procedures to the required supplementary information in accordance with auditing standards generally accepted in the United States of America, which consisted of inquiries of management about the methods of preparing the information and comparing the information for consistency with management’s responses to our inquiries, the basic financial statements, and other knowledge we obtained during our audit of the basic financial statements. We do not express an opinion or provide any assurance on the information because the limited procedures do not provide us with sufficient evidence to express an opinion or provide any assurance.
Our audit was conducted for the purpose of forming an opinion on the Port’s basic financial statements. The introductory and supplemental information sections are presented for the purposes of additional analysis and are not a required part of the basic financial statements. Such information has not been subjected to the auditing procedures applied in the audit of the basic financial statements, and accordingly, we do not express an opinion or provide any assurance on them.
November 14, 2012
Management’sDiscussion and Analysis
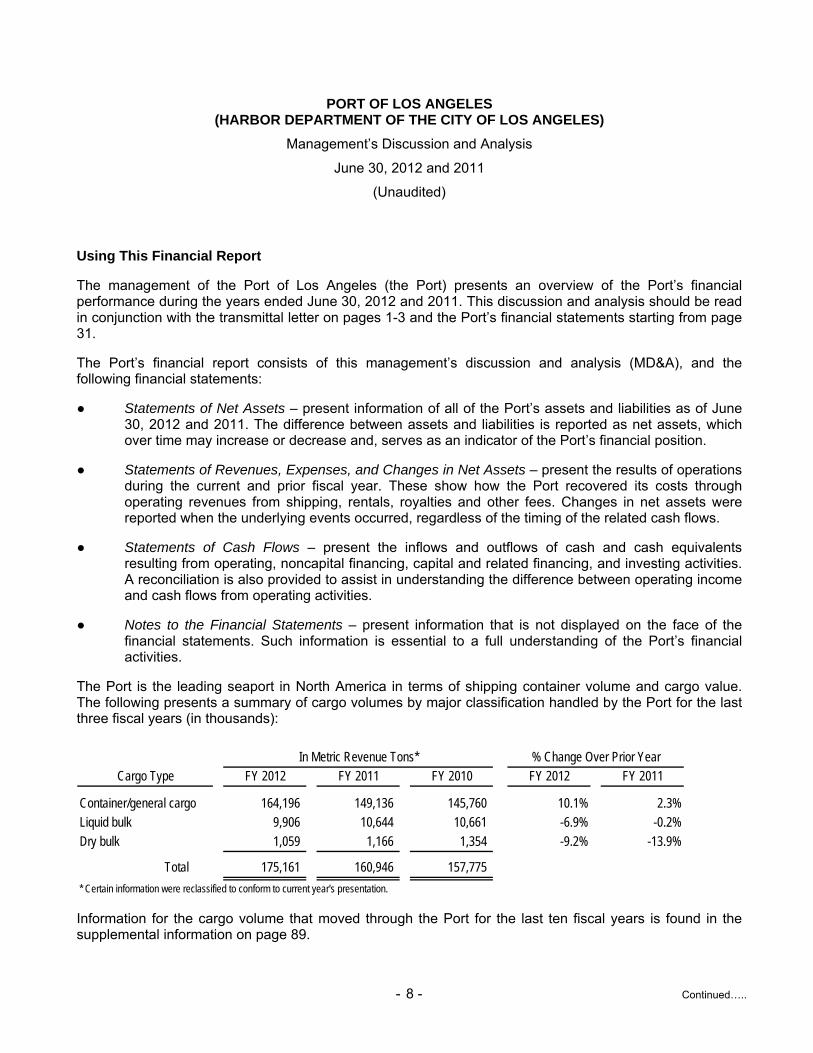
PORT OF LOS ANGELES (HARBOR DEPARTMENT OF THE CITY OF LOS ANGELES)
Management’s Discussion and Analysis
June 30, 2012 and 2011
(Unaudited)
- 8 - Continued…..
Using This Financial Report
The management of the Port of Los Angeles (the Port) presents an overview of the Port’s financial performance during the years ended June 30, 2012 and 2011. This discussion and analysis should be read in conjunction with the transmittal letter on pages 1-3 and the Port’s financial statements starting from page 31.
The Port’s financial report consists of this management’s discussion and analysis (MD&A), and the following financial statements:
● Statements of Net Assets – present information of all of the Port’s assets and liabilities as of June 30, 2012 and 2011. The difference between assets and liabilities is reported as net assets, which over time may increase or decrease and, serves as an indicator of the Port’s financial position.
● Statements of Revenues, Expenses, and Changes in Net Assets – present the results of operations during the current and prior fiscal year. These show how the Port recovered its costs through operating revenues from shipping, rentals, royalties and other fees. Changes in net assets were reported when the underlying events occurred, regardless of the timing of the related cash flows.
● Statements of Cash Flows – present the inflows and outflows of cash and cash equivalents resulting from operating, noncapital financing, capital and related financing, and investing activities. A reconciliation is also provided to assist in understanding the difference between operating income and cash flows from operating activities.
● Notes to the Financial Statements – present information that is not displayed on the face of the financial statements. Such information is essential to a full understanding of the Port’s financial activities.
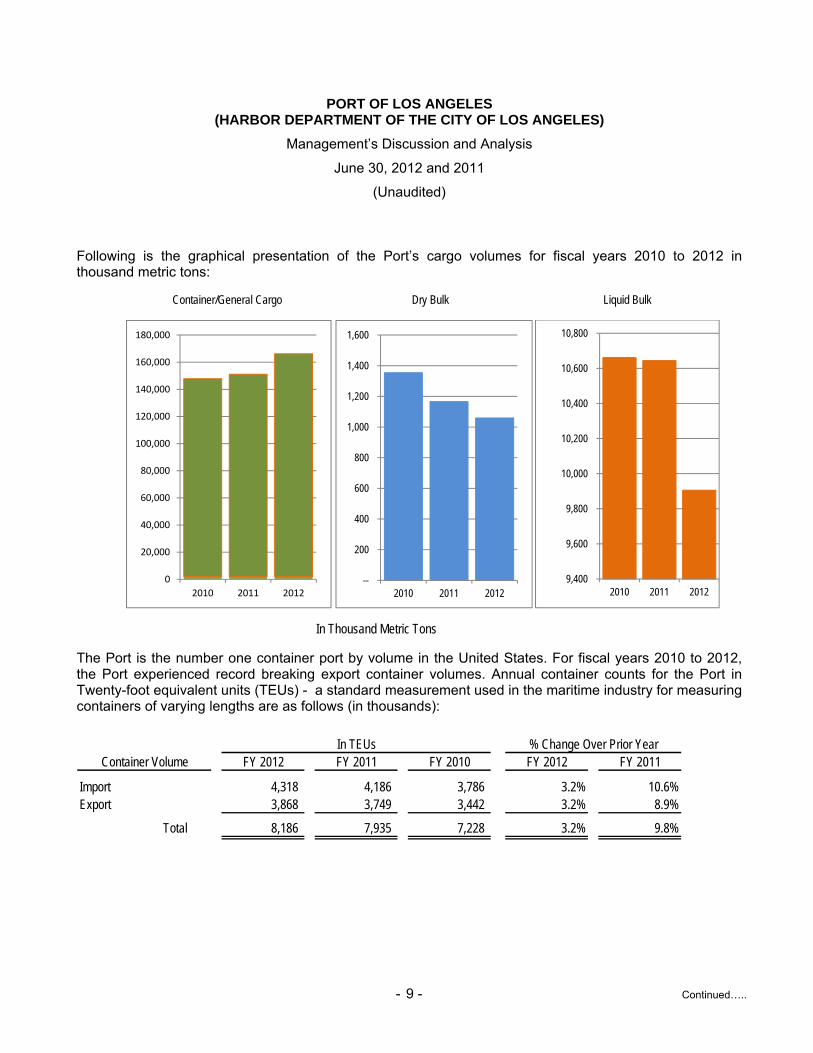
The Port is the leading seaport in North America in terms of shipping container volume and cargo value. The following presents a summary of cargo volumes by major classification handled by the Port for the last three fiscal years (in thousands):
In Metric Revenue Tons* % Change Over Prior YearCargo Type FY 2012 FY 2011 FY 2010 FY 2012 FY 2011
Container/general cargo 164,196 149,136 145,760 10.1% 2.3%Liquid bulk 9,906 10,644 10,661 -6.9% -0.2%
Dry bulk 1,059 1,166 1,354 -9.2% -13.9%
Total 175,161 160,946 157,775
* Certain information were reclassified to conform to current year's presentation.
Information for the cargo volume that moved through the Port for the last ten fiscal years is found in the supplemental information on page 89.
PORT OF LOS ANGELES (HARBOR DEPARTMENT OF THE CITY OF LOS ANGELES)
Management’s Discussion and Analysis
June 30, 2012 and 2011
(Unaudited)
- 9 - Continued…..
Following is the graphical presentation of the Port’s cargo volumes for fiscal years 2010 to 2012 in thousand metric tons:
Container/General Cargo Dry Bulk Liquid Bulk
In Thousand Metric Tons
The Port is the number one container port by volume in the United States. For fiscal years 2010 to 2012, the Port experienced record breaking export container volumes. Annual container counts for the Port in Twenty-foot equivalent units (TEUs) - a standard measurement used in the maritime industry for measuring containers of varying lengths are as follows (in thousands):
In TEUs % Change Over Prior YearContainer Volume FY 2012 FY 2011 FY 2010 FY 2012 FY 2011
Import 4,318 4,186 3,786 3.2% 10.6%Export 3,868 3,749 3,442 3.2% 8.9%
Total 8,186 7,935 7,228 3.2% 9.8%
0
20,000
40,000
60,000
80,000
100,000
120,000
140,000
160,000
180,000
2010 2011 2012--
200
400
600
800
1,000
1,200
1,400
1,600
2010 2011 20129,400
9,600
9,800
10,000
10,200
10,400
10,600
10,800
2010 2011 2012
PORT OF LOS ANGELES (HARBOR DEPARTMENT OF THE CITY OF LOS ANGELES)
Management’s Discussion and Analysis
June 30, 2012 and 2011
(Unaudited)
- 10 - Continued…..
Overview of the Port’s Financial Statements
The Port is a fiscally independent department and an enterprise fund of the City. The Port’s financial statements are prepared on an accrual basis using the economic resources measurement focus in accordance with generally accepted accounting principles promulgated by the Governmental Accounting Standards Board (GASB). The notes to the financial statements on pages 38 to 87 provide additional information that is essential to a full understanding of the data provided in the financial statements.
Financial Highlights for Fiscal Year 2012
● Current assets exceeded current liabilities by $381.8 million.
● Capital assets, net of accumulated depreciation of $1.4 billion amounted to $3.4 billion.
● Application development costs of $ 4.1 million, incurred during the fiscal year, for the design, installation, coding and testing of the Port’s new financial system, the Enterprise Resource Planning System (ERP), was capitalized as Intangible Assets. The ERP system will go live in fiscal year 2013.
● Total assets exceeded total liabilities by $2.8 billion.
● Bonded debt net of unamortized discounts, premiums and refunding charges of $26.6 million, totaled $866.8 million.
● Borrowings in the form of commercial paper continue to total $100.0 million.
● Operating revenue amounted to $409.8 million.
● Operating expenses excluding depreciation of $100.5 million, and net of capitalized charges of $11.8 million, amounted to $199.8 million.
● Capital grants amounted to $31.3 million.
Financial Highlights for Fiscal Year 2011
● Current assets exceeded current liabilities by $348.7 million.
● Capital assets, net of accumulated depreciation of $1.3 billion amounted to $3.3 billion.
● Total assets exceeded total liabilities by $2.6 billion.
● Bonded debt net of unamortized discounts, premiums and refunding charges of $19.1 million, totaled $899.0 million.
● Commercial paper outstanding totaled $100.0 million.
● Operating revenue amounted to $400.5 million.
PORT OF LOS ANGELES (HARBOR DEPARTMENT OF THE CITY OF LOS ANGELES)
Management’s Discussion and Analysis
June 30, 2012 and 2011
(Unaudited)
- 11 - Continued…..
● Operating expenses excluding depreciation of $90.5 million, and net of capitalized charges of $15.7 million amounted to $209.7 million.
● Capital grants amounted to $12.1 million.
Analysis of Net Assets
Net assets is the difference between the Port’s assets and liabilities. Over time, increases or decreases in net assets may serve as an indicator of whether the Port’s financial position is improving or deteriorating. The following is a condensed summary of the Port’s net assets as of June 30, 2012, 2011, and 2010 (in thousands):
Condensed Net Assets
Increase (Decrease) Over Prior Year
FY 2012 FY 2011 FY 2010 FY 2012 FY 2011Assets
Current and other assets $ 653,844 $ 657,535 $ 669,593 $ (3,691) $ (12,058) Capital assets, net 3,358,320 3,278,907 3,087,544 79,413 191,363
Total assets 4,012,164 3,936,442 3,757,137 75,722 179,305
Liabilities
Current liabilities 167,256 197,938 205,849 (30,682) (7,911) Long term liabilities 1,068,780 1,095,619 1,016,534 (26,839) 79,085
Total liabilities 1,236,036 1,293,557 1,222,383 (57,521) 71,174
Net assetsInvested in capital assets,
net of related debt 2,397,744 2,286,360 2,164,885 111,384 121,475 Restricted for debt service 67,796 67,341 67,844 455 (503) Unrestricted 310,588 289,184 302,025 21,404 (12,841)
Total net assets $ 2,776,128 $ 2,642,885 $ 2,534,754 $ 133,243 $ 108,131
Net Assets, Fiscal Year 2012
The largest portion of the Port’s net assets ($2.4 billion or 86.4%) reflects its investment in capital assets (e.g. land, facilities and equipment, construction in progress and intangible assets) less any related outstanding debt used to acquire those assets. These assets are used for operation and maintenance of Port facilities, and construction of various capital projects and improvements. An additional portion of the Port’s net assets ($67.8 million or 2.4%) represents resources that are subject to debt restrictions. The remaining balance of $310.6 million or 11.2% are unrestricted resources that may be used to meet the Port’s ongoing obligations.
PORT OF LOS ANGELES (HARBOR DEPARTMENT OF THE CITY OF LOS ANGELES)
Management’s Discussion and Analysis
June 30, 2012 and 2011
(Unaudited)
- 12 - Continued…..
Current and other assets decreased by a marginal $3.7 million or 0.6% from $657.5 million in fiscal year 2011 to $653.8 million in fiscal year 2012. Fluctuations in current and other assets result from: decrease in cash and investments of $4.8 million, increase of $9.1 million in accounts and grants receivables, decrease of $1.5 million in inventories and prepaid expenses, decline of $4.7 million in notes receivable, and $1.9 million lower investments in joint powers authorities and other assets.
Unrestricted and restricted cash, cash equivalents, and investments consist primarily of cash and pooled investments held by the City Treasurer on behalf of the Port. The decrease of $4.8 million from $569.9 million at June 30, 2011 to $565.2 million at June 30, 2012 was due mainly to the decrease in cash collateral from securities lending transactions due to the suspension of the City’s securities lending program (SLP) in fiscal year 2012. This decrease however, was offset by increased cash from operating activities, increase in grant reimbursements, and higher investment income. At June 30, 2012, the Port’s share in the mark to market valuation of the City’s pooled investments totaled $7.2 million, an increase of $1.4 million from $5.9 million in the prior fiscal year. The Port also reported additional investments of $11.9 million from its share in the City’s investment purchases on June 30, 2012.
Capital assets, net of depreciation increased by $79.4 million due to continued commercial and terminal development, various building and facilities improvements, and acquisition of various facilities and equipment.
Current liabilities decreased by $30.7 million or 15.5% mainly due to timing differences in payments, and decrease of $41.1 million in liabilities under the SLP due its suspension in the current fiscal year. A payment of $9.8 million from the TraPac Mitigation Fund, offset by additional liability of $11.9 million for Port’s share in investment purchases at June 30, 2012, accounted for the net increase of $1.8 million in other current liabilities. Please refer to pages 84-85 of the notes to financial statements for additional information on the $9.8 million payment from the TraPac Mitigation Fund.
Long-term liabilities decreased by $26.8 million mainly due to the decrease in bonds payable of $33.1 million. Increase in workers’ compensation liability accrual due to higher actuarial valuation accounted for the increase in other long-term liabilities.
Net Assets, Fiscal Year 2011
The largest portion of the Port’s net assets ($2.3 billion or 86.5%) reflects its investment in capital assets (e.g. land, facilities, construction in progress and intangible assets) less any related outstanding debt used to acquire those assets. These assets are used for the operation and maintenance of Port facilities and the construction of various capital projects and improvements. An additional portion of the Port’s net assets ($67.3 million or 2.6%) represents resources that are subject to debt restrictions. The remaining balance of $289.2 million or 10.9% are unrestricted resources that may be used to meet the Port’s ongoing obligations.
Current and other assets decreased by $ 0.01 million or 1.8% to $657.5 million in fiscal year 2011, mainly due to the increased disbursements in restricted funds.
Unrestricted and restricted cash and investments consist primarily of cash and pooled investments, including reinvested cash collateral held by the City Treasurer. The decrease of $8.4 million from
PORT OF LOS ANGELES (HARBOR DEPARTMENT OF THE CITY OF LOS ANGELES)
Management’s Discussion and Analysis
June 30, 2012 and 2011
(Unaudited)
- 13 - Continued…..
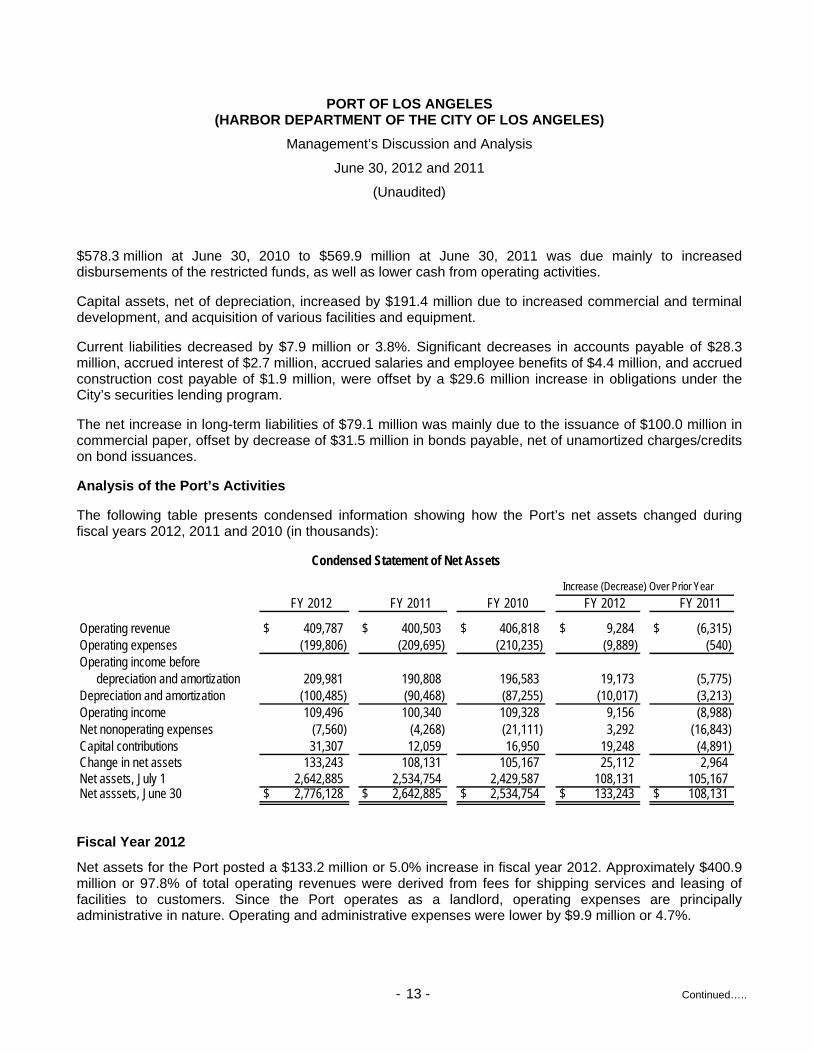
$578.3 million at June 30, 2010 to $569.9 million at June 30, 2011 was due mainly to increased disbursements of the restricted funds, as well as lower cash from operating activities.
Capital assets, net of depreciation, increased by $191.4 million due to increased commercial and terminal development, and acquisition of various facilities and equipment.
Current liabilities decreased by $7.9 million or 3.8%. Significant decreases in accounts payable of $28.3 million, accrued interest of $2.7 million, accrued salaries and employee benefits of $4.4 million, and accrued construction cost payable of $1.9 million, were offset by a $29.6 million increase in obligations under the City’s securities lending program.
The net increase in long-term liabilities of $79.1 million was mainly due to the issuance of $100.0 million in commercial paper, offset by decrease of $31.5 million in bonds payable, net of unamortized charges/credits on bond issuances.
Analysis of the Port’s Activities
The following table presents condensed information showing how the Port’s net assets changed during fiscal years 2012, 2011 and 2010 (in thousands):
Condensed Statement of Net Assets
Increase (Decrease) Over Prior Year
FY 2012 FY 2011 FY 2010 FY 2012 FY 2011
Operating revenue $ 409,787 $ 400,503 $ 406,818 $ 9,284 $ (6,315) Operating expenses (199,806) (209,695) (210,235) (9,889) (540) Operating income before
depreciation and amortization 209,981 190,808 196,583 19,173 (5,775) Depreciation and amortization (100,485) (90,468) (87,255) (10,017) (3,213) Operating income 109,496 100,340 109,328 9,156 (8,988) Net nonoperating expenses (7,560) (4,268) (21,111) 3,292 (16,843) Capital contributions 31,307 12,059 16,950 19,248 (4,891) Change in net assets 133,243 108,131 105,167 25,112 2,964 Net assets, July 1 2,642,885 2,534,754 2,429,587 108,131 105,167 Net asssets, June 30 $ 2,776,128 $ 2,642,885 $ 2,534,754 $ 133,243 $ 108,131
Fiscal Year 2012
Net assets for the Port posted a $133.2 million or 5.0% increase in fiscal year 2012. Approximately $400.9 million or 97.8% of total operating revenues were derived from fees for shipping services and leasing of facilities to customers. Since the Port operates as a landlord, operating expenses are principally administrative in nature. Operating and administrative expenses were lower by $9.9 million or 4.7%.
PORT OF LOS ANGELES (HARBOR DEPARTMENT OF THE CITY OF LOS ANGELES)
Management’s Discussion and Analysis
June 30, 2012 and 2011
(Unaudited)
- 14 - Continued…..
Depreciation expense increased by $10.0 million to $100.5 million in fiscal year 2012 from $90.5 million in fiscal year 2011, primarily due the net addition of $432.2 million in net depreciable assets in fiscal year 2012.
Net nonoperating transactions increased by $3.3 million to $7.6 million in fiscal year 2012 primarily as a result of recognizing an $8.5 million loss on sale of POLA High School (POLAHS), offset by higher nonoperating revenue of $13.4 million. During the fiscal year, the Port’s investment income was $3.1 million higher than the prior fiscal year. Credits received from the Department of Water and Power’s solar energy program due to the Port’s initiatives towards installing solar energy equipment mainly accounted for the $8.1 million increase in other nonoperating revenue. $2.2 million higher investment in joint powers authorities also contributed to the increase in nonoperating revenue.
As a result, income before capital contributions increased by $5.9 million to $101.9 million, a 6.1% increase over fiscal year 2011.
Capital contributions of $31.3 million represented funds for capital grants obtained in fiscal year 2012, or an increase of $19.2 million compared to the $12.1 million received in fiscal year 2011. Increases in federal capital grants during the year included $1.8 million for Police patrol and boats, $2.0 million for information technology data storage security project, $7.0 million for Harry Bridges Boulevard improvement, $2.0 million for computer aided dispatch and record management system, $5.6 million for the Port-wide fiber optic continuance project, and $1.6 million for Port security grant’s supplemental projects.
Fiscal Year 2011
Net assets for the Port increased by $108.1 million in fiscal year 2011. Approximately 97.1% of total operating revenues were derived from fees for shipping services and leasing of facilities to customers. Operating and administrative expenses decreased by $0.5 million, or 0.2% from fiscal year 2010.
Depreciation expense increased by $3.2 million to $90.5 million in fiscal year 2011 primarily due to the net addition of $235.3 million in net depreciable assets.
Other expenses increased by $3.7 million to $6.7 million in fiscal year 2011, from $3.0 million in fiscal year 2010 as a first time shortfall payment to the Alameda Corridor Transportation Authority (ACTA) was accrued for $3.0 million in fiscal year 2011.
As a result, income before capital contributions increased by $7.9 million to $96.1 million, an 8.9% increase over the fiscal year 2010 amount of $88.2 million. This increase reflected the combined effect of greater levels of capitalized interest expense offset by lower interest income and reduced revenue from clean truck fees.
Capital contributions of $12.1 million represented funds for capital grants obtained in fiscal year 2011, or a reduction of $4.9 million compared to the $17.0 million received in fiscal year 2010. The increase in capital grants earned was due to proactive and successful efforts on part of the Port in applying for and obtaining more capital grants for its projects.

PORT OF LOS ANGELES (HARBOR DEPARTMENT OF THE CITY OF LOS ANGELES)
Management’s Discussion and Analysis
June 30, 2012 and 2011
(Unaudited)
- 15 - Continued…..
Operating Revenue
The Port’s major sources of its operating revenue are derived from shipping services, rental fees, royalties and other concession fees. The following table presents a summary of the Port’s operating revenues during fiscal years 2012, 2011 and 2010 (in thousands):
Summary of Operating Revenues
Increase (Decrease) Over Prior Year
FY 2012 FY 2011 FY 2010 FY 2012 FY 2011
Shipping servicesWharfage $ 333,757 $ 317,621 $ 304,653 $ 16,136 $ 12,968 Dockage and demurrage 5,043 6,086 7,068 (1,043) (982) Pilotage 7,131 7,417 7,025 (286) 392 Assignment and other charges 11,785 12,374 8,884 (589) 3,490
Total shipping services 357,716 343,498 327,630 14,218 15,868
Rentals Land 40,127 42,693 39,741 (2,566) 2,952 Others 3,016 2,735 3,400 281 (665)
Total rentals 43,143 45,428 43,141 (2,285) 2,287
Royalties, and other fees Fees, concession and royalties 1,866 2,333 2,561 (467) (228) Clean truck program fees 3,250 6,376 30,505 (3,126) (24,129) Others royalties and fees 3,812 2,868 2,981 944 (113)
Total royalties, and other fees 8,928 11,577 36,047 (2,649) (24,470) Total operating revenues $ 409,787 $ 400,503 $ 406,818 $ 9,284 $ (6,315)

PORT OF LOS ANGELES (HARBOR DEPARTMENT OF THE CITY OF LOS ANGELES)
Management’s Discussion and Analysis
June 30, 2012 and 2011
(Unaudited)
- 16 - Continued…..
The following charts show the major components of each of the Port’s sources of operating revenue for fiscal years 2012 and 2011:
Fiscal Year 2012
Fiscal year 2011
Wharfage93.3%
Dockage, demurrage
1.4%
Pilotage2.0%
Assignment and other charges
3.3%
Shipping Services
Land93.0%
Others7.0%
Rentals
Fees, concession
and royalties20.9%
Clean truck program
fees36.4%
Others royalties and fees42.7%
Royalties and Other Fees
Wharfage92.4%
Dockage, demurrage
1.8%
Pilotage2.2%
Assignment and other charges
3.6%
Shipping Services
Land94.0%
Others6.0%
Rentals
Fees, concession
and royalties20.1%
Clean truck program
fees55.1%
Others royalties and fees24.8%
Royalties and Other Fees
PORT OF LOS ANGELES (HARBOR DEPARTMENT OF THE CITY OF LOS ANGELES)
Management’s Discussion and Analysis
June 30, 2012 and 2011
(Unaudited)
- 17 - Continued…..
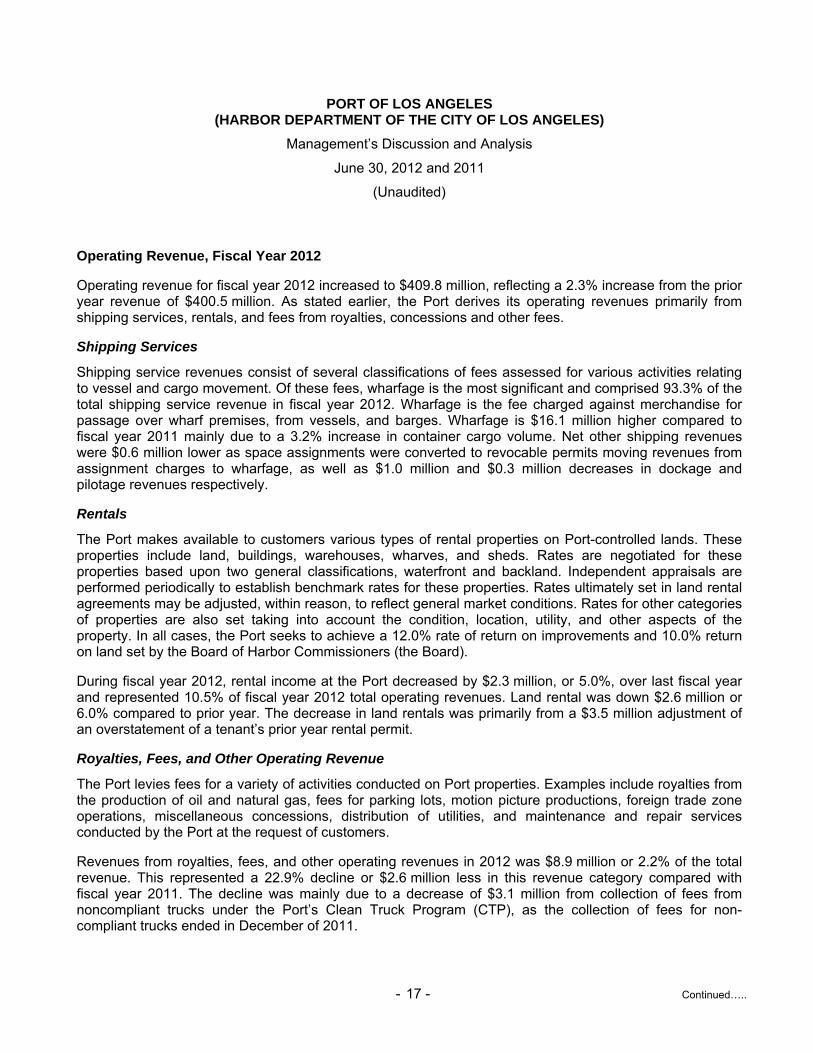
Operating Revenue, Fiscal Year 2012
Operating revenue for fiscal year 2012 increased to $409.8 million, reflecting a 2.3% increase from the prior year revenue of $400.5 million. As stated earlier, the Port derives its operating revenues primarily from shipping services, rentals, and fees from royalties, concessions and other fees.
Shipping Services
Shipping service revenues consist of several classifications of fees assessed for various activities relating to vessel and cargo movement. Of these fees, wharfage is the most significant and comprised 93.3% of the total shipping service revenue in fiscal year 2012. Wharfage is the fee charged against merchandise for passage over wharf premises, from vessels, and barges. Wharfage is $16.1 million higher compared to fiscal year 2011 mainly due to a 3.2% increase in container cargo volume. Net other shipping revenues were $0.6 million lower as space assignments were converted to revocable permits moving revenues from assignment charges to wharfage, as well as $1.0 million and $0.3 million decreases in dockage and pilotage revenues respectively.
Rentals
The Port makes available to customers various types of rental properties on Port-controlled lands. These properties include land, buildings, warehouses, wharves, and sheds. Rates are negotiated for these properties based upon two general classifications, waterfront and backland. Independent appraisals are performed periodically to establish benchmark rates for these properties. Rates ultimately set in land rental agreements may be adjusted, within reason, to reflect general market conditions. Rates for other categories of properties are also set taking into account the condition, location, utility, and other aspects of the property. In all cases, the Port seeks to achieve a 12.0% rate of return on improvements and 10.0% return on land set by the Board of Harbor Commissioners (the Board).
During fiscal year 2012, rental income at the Port decreased by $2.3 million, or 5.0%, over last fiscal year and represented 10.5% of fiscal year 2012 total operating revenues. Land rental was down $2.6 million or 6.0% compared to prior year. The decrease in land rentals was primarily from a $3.5 million adjustment of an overstatement of a tenant’s prior year rental permit.
Royalties, Fees, and Other Operating Revenue
The Port levies fees for a variety of activities conducted on Port properties. Examples include royalties from the production of oil and natural gas, fees for parking lots, motion picture productions, foreign trade zone operations, miscellaneous concessions, distribution of utilities, and maintenance and repair services conducted by the Port at the request of customers.
Revenues from royalties, fees, and other operating revenues in 2012 was $8.9 million or 2.2% of the total revenue. This represented a 22.9% decline or $2.6 million less in this revenue category compared with fiscal year 2011. The decline was mainly due to a decrease of $3.1 million from collection of fees from noncompliant trucks under the Port’s Clean Truck Program (CTP), as the collection of fees for non-compliant trucks ended in December of 2011.
PORT OF LOS ANGELES (HARBOR DEPARTMENT OF THE CITY OF LOS ANGELES)
Management’s Discussion and Analysis
June 30, 2012 and 2011
(Unaudited)
- 18 - Continued…..
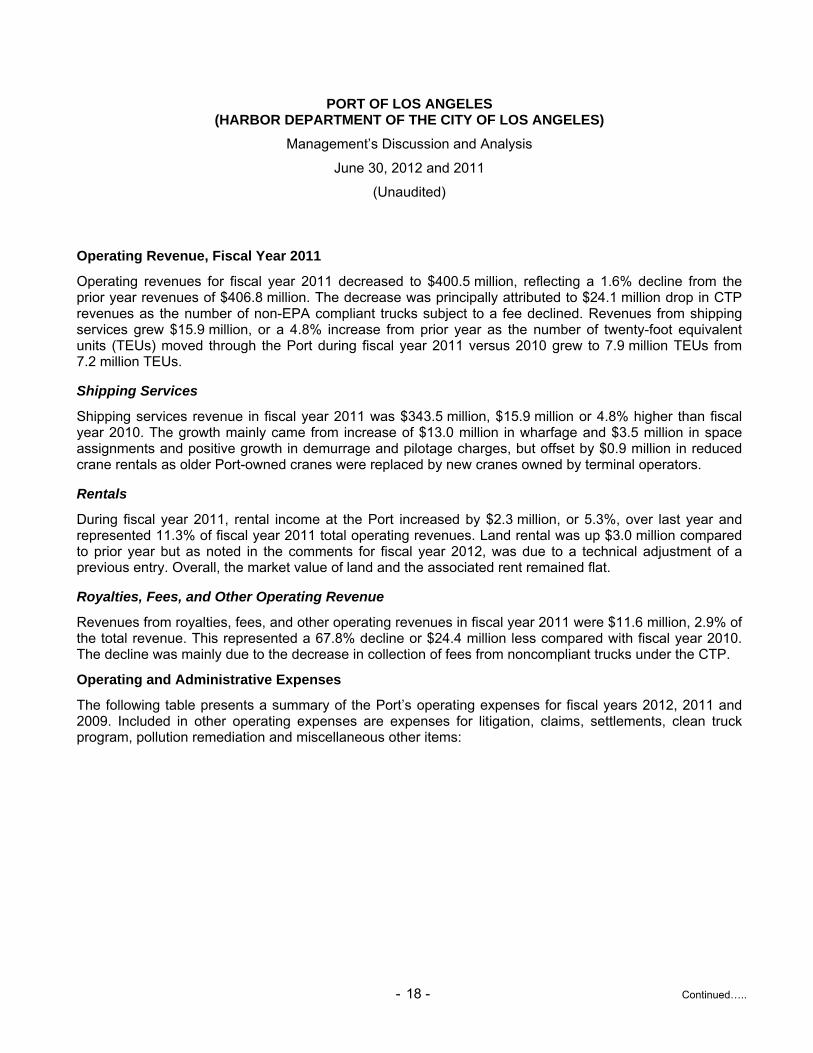
Operating Revenue, Fiscal Year 2011
Operating revenues for fiscal year 2011 decreased to $400.5 million, reflecting a 1.6% decline from the prior year revenues of $406.8 million. The decrease was principally attributed to $24.1 million drop in CTP revenues as the number of non-EPA compliant trucks subject to a fee declined. Revenues from shipping services grew $15.9 million, or a 4.8% increase from prior year as the number of twenty-foot equivalent units (TEUs) moved through the Port during fiscal year 2011 versus 2010 grew to 7.9 million TEUs from 7.2 million TEUs.
Shipping Services
Shipping services revenue in fiscal year 2011 was $343.5 million, $15.9 million or 4.8% higher than fiscal year 2010. The growth mainly came from increase of $13.0 million in wharfage and $3.5 million in space assignments and positive growth in demurrage and pilotage charges, but offset by $0.9 million in reduced crane rentals as older Port-owned cranes were replaced by new cranes owned by terminal operators.
Rentals
During fiscal year 2011, rental income at the Port increased by $2.3 million, or 5.3%, over last year and represented 11.3% of fiscal year 2011 total operating revenues. Land rental was up $3.0 million compared to prior year but as noted in the comments for fiscal year 2012, was due to a technical adjustment of a previous entry. Overall, the market value of land and the associated rent remained flat.
Royalties, Fees, and Other Operating Revenue
Revenues from royalties, fees, and other operating revenues in fiscal year 2011 were $11.6 million, 2.9% of the total revenue. This represented a 67.8% decline or $24.4 million less compared with fiscal year 2010. The decline was mainly due to the decrease in collection of fees from noncompliant trucks under the CTP.
Operating and Administrative Expenses
The following table presents a summary of the Port’s operating expenses for fiscal years 2012, 2011 and 2009. Included in other operating expenses are expenses for litigation, claims, settlements, clean truck program, pollution remediation and miscellaneous other items:
PORT OF LOS ANGELES (HARBOR DEPARTMENT OF THE CITY OF LOS ANGELES)
Management’s Discussion and Analysis
June 30, 2012 and 2011
(Unaudited)
- 19 - Continued…..
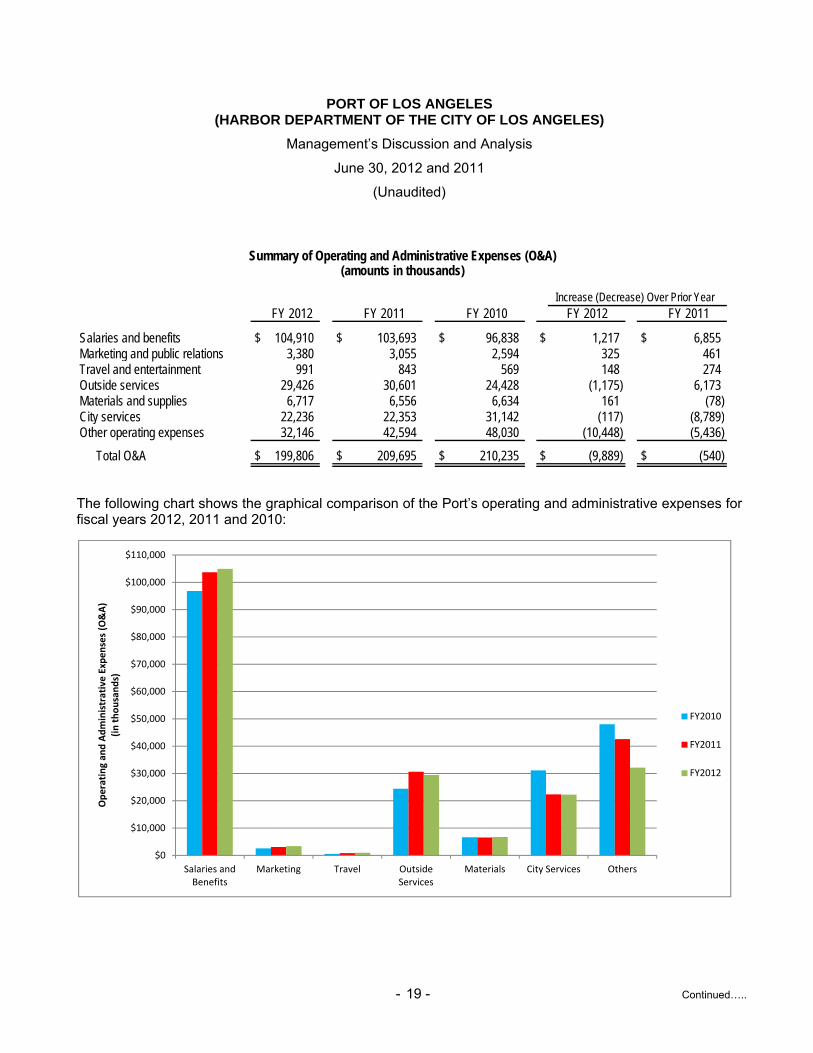
Summary of Operating and Administrative Expenses (O&A)(amounts in thousands)
Increase (Decrease) Over Prior YearFY 2012 FY 2011 FY 2010 FY 2012 FY 2011
Salaries and benefits $ 104,910 $ 103,693 $ 96,838 $ 1,217 $ 6,855 Marketing and public relations 3,380 3,055 2,594 325 461 Travel and entertainment 991 843 569 148 274 Outside services 29,426 30,601 24,428 (1,175) 6,173 Materials and supplies 6,717 6,556 6,634 161 (78) City services 22,236 22,353 31,142 (117) (8,789) Other operating expenses 32,146 42,594 48,030 (10,448) (5,436)
Total O&A $ 199,806 $ 209,695 $ 210,235 $ (9,889) $ (540)
The following chart shows the graphical comparison of the Port’s operating and administrative expenses for fiscal years 2012, 2011 and 2010:
$0
$10,000
$20,000
$30,000
$40,000
$50,000
$60,000
$70,000
$80,000
$90,000
$100,000
$110,000
Salaries and Benefits
Marketing Travel Outside Services
Materials City Services Others
Operating an
d Administrative Expenses (O&A)
(in thousands)
FY2010
FY2011
FY2012
PORT OF LOS ANGELES (HARBOR DEPARTMENT OF THE CITY OF LOS ANGELES)
Management’s Discussion and Analysis
June 30, 2012 and 2011
(Unaudited)
- 20 - Continued…..
Fiscal Year 2012
In fiscal year 2012, operating and administrative expenses decreased by $9.9 million to $199.8 million, a 4.7% decrease from prior fiscal year expense of $209.7 million. Significant drivers in operating and administrative expenses include outside services, allocations to capital overhead, the Clean Truck Program, City services and benefits.
Salaries and benefits expense increased by $1.2 million to $104.9 million, or 1.2% higher than prior year of $103.7 million. Fluctuations in salaries and benefits were caused primarily by the following: $1.5 million increase in salaries due to 0.75% increase in cost of living allowances (COLA) for Port employees covered by various MOUs effective July 1, 2011, and a 3% COLA increase for non-represented employees effective January 1, 2012; $0.2 million increase in pension and retirement contributions; $0.2 million increase in medical and dental insurance costs; and $0.4 million increase in overtime pay. Allocation of portions of the cost of salaries and benefits to capital projects increased by $1.3 million which offset the increases in salaries and benefits account. Average full time employee headcount increased by 4 to 954.
As part of its strategic plan to retain and increase market share, the Port increased its spending for domestic trade promotion, business, government and other commercial promotion, accounting for the $0.3 million increase in marketing and public relations expenses.
Outside services decreased by $1.2 million to $29.4 million or 3.8% from prior year of $30.6 million primarily due to $0.9 million lower maintenance expenses, even as the Port completed and opened the 29.2 acre Wilmington Waterfront Park.
Additional maintenance, administrative and operating supplies, offset by decrease in inventory at the end of the fiscal year accounted for the slight increase of $0.2 million in materials and supplies expense.
Total payments for City services slightly decreased by $0.1 million. Fluctuations in City services payments were: $3.2 million higher charges primarily from Fire services ($1.4 million), the Recreation and Parks ($1.0 million) Department, the City Attorney’s Office ($0.5 million), City Administrative Office and Information Technology Agency ($0.3 million). These increases were offset by lower net payments of $2.8 million mainly to Building and Safety, Public Works and the Los Angeles Police departments.
Provision for workers’ compensation was $5.8 million higher mainly due to an increase of $3.7 million in valuation of the medical component of the fiscal year 2012 workers compensation actuarial study, $1.1 million in the permanent disability component, and $1.1 million in temporary disability and other expenses components. As the Port is part of the overall City workers’ compensation self-insurance program, the City allocated these costs to the Port on a pro-rata basis.
In prior fiscal year 2011, litigation and settlement expenses were $3.0 million higher than the current fiscal year due to a payment of $3.2 million for community aesthetic mitigation, representing cost of four cranes acquired at $0.8 million each, as stipulated in the environmental impact report for China Shipping.
Lesser administrative expenditures for clean truck monitoring of trucks entering the Port, as well as lower CTP subsidy payments, accounted for $4.7 million reduction in CTP expenses during the fiscal year.
PORT OF LOS ANGELES (HARBOR DEPARTMENT OF THE CITY OF LOS ANGELES)
Management’s Discussion and Analysis
June 30, 2012 and 2011
(Unaudited)
- 21 - Continued…..
The decrease of $8.6 million in pollution remediation expenses was mainly due to lower remediation costs incurred in the current fiscal year, particularly for the site cleanup of 800 Southerland Ave. and the petroleum carbon remediation of HY”C” Tane Tank Farm. Major cleanup costs for these projects were incurred in fiscal year 2011.
Fiscal Year 2011
In fiscal year 2011, operating and administrative expenses decreased by $0.5 million to $209.7 million, a 0.3% decrease from prior fiscal year expense of $210.2 million as the Port continued to exercise close controls over expenses.
Although salaries and benefits expense rose by $6.9 million to $103.7 million, or 7.1% higher than prior year of $96.8 million, the increase was primarily attributable to 4.9 percentage points increase in pension rates and an average $760 per position increase in health benefits despite a control of headcount of full time employees to an average of 950.
Outside services increased by $6.2 million to $30.6 million or 25.3% from prior year of $24.4 million due to an increase in expenses from hiring workers from the Hiring Hall of $1.8 million, accommodation work projects closed to expense of $1.3 million, and Port’s facility security enhancement of $1.1 million plus increases in other projects.
City services, net of capitalized amount and overhead allocation, decreased by $8.8 million to $22.4 million or 28.2% lower than previous year of $31.1 million mainly due to lower costs incurred from City’s Fire Department and Recreation & Parks Department, resulting from lower overhead allocation costs as the City reduced its work force costs.
Other operating expenses for fiscal year 2011 decreased by $5.4 million to $42.6 million or 11.3% from prior year of $48.0 million primarily due to the decline in CTP’s subsidy payments and administrative costs of $15.2 million, and a $4.0 million reduction in contribution to the Community Mitigation Fund. Offsetting these decreases were the $6.9 million increase in estimated pollution remediation expenses, a $3.2 million increase in China Shipping Mitigation expense, and $2.7 million increase in provision for bad debts and workers compensation costs.
Nonoperating Revenue and Expenses
Nonoperating revenue and expenses are derived from transactions that do not result from providing services in connection with the Port’s ongoing operations. The following table presents a summary of the Port’s nonoperating revenue and expenses for fiscal years 2012, 2011 and 2010:

PORT OF LOS ANGELES (HARBOR DEPARTMENT OF THE CITY OF LOS ANGELES)
Management’s Discussion and Analysis
June 30, 2012 and 2011
(Unaudited)
- 22 - Continued…..
Summary of NonOperating Revenue and Expenses(amounts in thousands)
Increase (Decrease) Over Prior Year
FY 2012 FY 2011 FY 2010 FY 2012 FY 2011
Nonoperating revenueIncome from investments in
Joint Powers Authorities $ 1,851 $ (333) $ 2,270 $ 2,184 $ (2,603) Interest and investment income 9,486 6,436 15,233 3,050 (8,797) Other nonoperating revenue 14,167 6,023 -- 8,144 6,023
Total nonoperating revenue 25,504 12,126 17,503 13,378 (5,377)
Nonoperating expensesInterest expense 10,538 3,704 35,663 6,834 (31,959) Other nonoperating expenses 22,526 12,690 2,951 9,836 9,739
Total nonoperating expenses 33,064 16,394 38,614 16,670 (22,220)
Net nonoperating revenue (expenses) $ (7,560) $ (4,268) $ (21,111) $ (3,292) $ 16,843
Fiscal Year 2012
Net nonoperating expenses for fiscal year 2012 increased by $3.3 million or 77.1% to $7.6 million from prior year’s of $4.3 million.
In prior fiscal year 2011, POLA wrote down $2.3 million in receivables from the Intermodal Container Transfer Facility Joint Powers Authority (ICTF JPA). The charge was an accounting adjustment against an overstatement of receivables that resulted from timing differences in the calculation of receipts.This resulted in a negative $0.3 million share in ICTF’s operations in the prior year. ICTF reported income of $3.9 million in the fiscal year 2012, thereby resulting in $1.9 million increase in investment in JPA.
Interest and investment income increased by $3.1 million or 47.4% to $9.5 million from the prior fiscal year’s $6.4 million due to higher interest earnings on investments.
Interest expense increased by $6.8 million or 184.2% to $10.5 million from the prior fiscal year of $3.7 million. The Port incurred bond interest expense of $3.8 million from the issuance of the 2011 Series A and B Refunding bonds, but the refunding along with the repayment of $101.1 million of refunded bonds reduced overall interest obligations, thereby generating a $6.6 million decrease in interest expenses. In addition, in fiscal year 2012, the Port made an adjustment to its capitalized interest, thereby reducing interest capitalized to the construction in progress account from $40.1 million in fiscal year 2011 to $30.6 million in fiscal year 2012. The exclusion of the costs of certain completed projects from the calculation of capitalized interest resulted in an adjustment of $9.5 million in capitalized interest, which was charged to current year’s interest expense.
PORT OF LOS ANGELES (HARBOR DEPARTMENT OF THE CITY OF LOS ANGELES)
Management’s Discussion and Analysis
June 30, 2012 and 2011
(Unaudited)
- 23 - Continued…..
In fiscal year 2012, the Port recorded as other nonoperating revenue a $2.5 million solar power incentive received from the Department of Water and Power. Other sources of nonoperating revenues during the year were $0.3 million in delinquency penalties, $0.1 million from sale of equipment and other fixed assets, and $0.6 million credits from rebates and other reimbursements. Included also in nonoperating revenues were noncapital grants received by the Port. During the fiscal year, federal and state grants of $2.1 million as well as $5.9 million of federal and state pass-through grants were received.
During the fiscal year, the Port recorded as nonoperating expense a loss of $8.5 million from the sale of POLA High School, which mainly accounted for the increase of $9.8 million in nonoperating expenses. Please see page 25 for details on the sale of this property.
Fiscal Year 2011
Net nonoperating revenues and expenses for fiscal year 2011 decreased by $16.8 million or 79.8% to $4.3 million from prior year of $21.1 million.
Interest and investment income decreased by $8.8 million or 57.8% to $6.4 million from the prior fiscal year of $15.2 million. The interest income decrease of $3.9 million was mainly due to the 21.3% drop in average yields in fiscal year 2011 from 2010. In addition, there was a loss of $1.3 million in the fair value of the investment pool in fiscal year 2011 as compared to a gain of $3.6 million in fiscal year 2010.
Interest expense decreased by $32.0 million or 89.6% to $3.7 million from the prior fiscal year of $35.7 million due to increase in capitalized interest expense in fiscal year 2011. In the past, the computation of interest to be capitalized was based only on certain ongoing capital projects that were identified as directly financed by the external debts. Beginning fiscal year 2011, the Port adopted the computation of interest to be capitalized based on the average accumulated expenditures for all ongoing capital projects. The Port capitalized a total of $40.1 million in interest expense out of a gross interest expense of $43.8 million in fiscal year 2011.
Other income, net of other expense, declined by $3.7 million to negative $6.7 million in fiscal year 2011, from negative $3.0 million in prior year.
Other income increased by $3.4 million from $2.6 million to $6.0 million mainly due to the increase of $3.3 million in Federal pass-through grants.
Other expenses increased by $7.1 million from $5.6 million to $12.7 million primarily due to the estimated ACTA shortfall charge of about $3.0 million as well as the Federal pass-through grant expense of $3.0 million.
Long-Term Debt
The Port’s long-term debt comprises of senior debt in the form of Harbor Revenue Bonds, commercial paper, and subordinated debt in the form of a loan. As of June 30, 2012 and 2011, the Port’s outstanding long-term debt was $968.1 million and $1.0 billion, respectively. For all outstanding bonds, the Port continues to maintain Aa2, AA, and AA credit ratings from Moody’s, Standard & Poor’s, and Fitch Ratings, respectively.
PORT OF LOS ANGELES (HARBOR DEPARTMENT OF THE CITY OF LOS ANGELES)
Management’s Discussion and Analysis
June 30, 2012 and 2011
(Unaudited)
- 24 - Continued…..
Bonded Debt
Under Section 609 of the City Charter of the City of Los Angeles and the Bond Procedural Ordinance, the Port’s capacity to issue debt is not limited. However, the Port’s capacity is constrained under covenants of the currently outstanding debt to an aggregate ratio of revenue to annual debt service of at least one hundred twenty-five percent (125%). The Port’s financial policy requires that a minimum of 2.0x debt service coverage ratio be maintained at all times. At June 30, 2012, the Port’s debt service coverage ratio stood at 3.0x.
The Port’s long-term debt consisted of the following as of June 30, 2012, 2011, and 2010 (in thousands):
2012 2011 2010
Revenue bonds payable $ 866,762 $ 898,981 $ 929,202 Notes payable 1,366 1,874 2,360 Commercial paper 100,000 100,000 --
Total $ 968,128 $ 1,000,855 $ 931,562
During fiscal year 2012, the Port issued 2011 Series A and B Refunding Bonds of $58.9 million and $32.8 million respectively, to refund the outstanding principal of $36.2 million and $64.9 million, of the 2001 Series A and B Refunding Bonds, respectively. Principal and interest on these bonds are payable solely from the Port’s revenues and other amounts pledged under the bond indenture. The refunding transaction resulted in cash flow savings of $16.4 million and economic gain of $12.6 million. The deferred amount on refunding of $3.7 million will be amortized through fiscal year 2026.
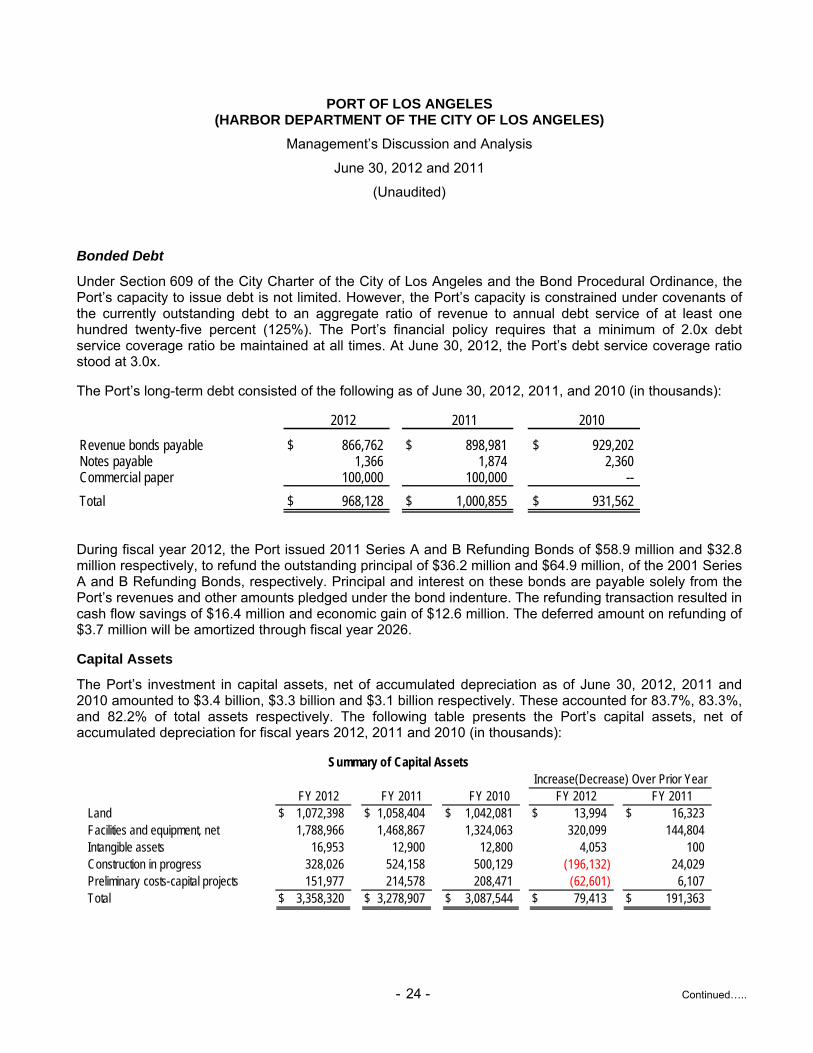
Capital Assets
The Port’s investment in capital assets, net of accumulated depreciation as of June 30, 2012, 2011 and 2010 amounted to $3.4 billion, $3.3 billion and $3.1 billion respectively. These accounted for 83.7%, 83.3%, and 82.2% of total assets respectively. The following table presents the Port’s capital assets, net of accumulated depreciation for fiscal years 2012, 2011 and 2010 (in thousands):
FY 2012 FY 2011 FY 2010 FY 2012 FY 2011Land $ 1,072,398 $ 1,058,404 $ 1,042,081 $ 13,994 $ 16,323Facilities and equipment, net 1,788,966 1,468,867 1,324,063 320,099 144,804Intangible assets 16,953 12,900 12,800 4,053 100Construction in progress 328,026 524,158 500,129 (196,132) 24,029Preliminary costs-capital projects 151,977 214,578 208,471 (62,601) 6,107Total $ 3,358,320 $ 3,278,907 $ 3,087,544 $ 79,413 $ 191,363
Increase(Decrease) Over Prior YearSummary of Capital Assets
PORT OF LOS ANGELES (HARBOR DEPARTMENT OF THE CITY OF LOS ANGELES)
Management’s Discussion and Analysis
June 30, 2012 and 2011
(Unaudited)
- 25 - Continued…..
Fiscal Year 2012
Major capital assets activities during fiscal year 2012 with the total cost of the projects are as follows:
● $162.6 million - Cabrillo Way Marina Phase II development.
● 113.7 million - various wharves improvement, including $12.3 million for landfill and wharf demolition.
● $77.7 million - Harry Bridges Boulevard improvement.
● $26.7 million - improvement of various terminals including $23.3 million for cruise terminals.
● $22.1 million - improvement of various warehouses, buildings and facilities.
● $9.5 million - improvement of waterfront and other public areas in Wilmington and San Pedro.
● $6.8 million - fiber optic network programs.
● $5.1 million - POLA electric truck program.
● $11.8 million - for Port Police headquarters, Port Police integrated command and control system and other security enhancement projects, and passenger complex perimeter security enhancement projects.
● $1.1 million - acquisition of vehicles, parts and accessories.
● $3.1 million - acquisition of boats, barge, boat hardware and parts.
● $0.8 million - expended for electronic equipment, devices including computer hardware for the Port’s new financial accounting system to be implemented in fiscal year 2013.
● $3.2 million - police data center equipment, mobile command center and various computer equipments for the new Port police building and headquarters.
● Sale of POLA High School (POLAHS) costing $14.3 million with accumulated depreciation of $2.7 million on October 14, 2011. The lease permit with POLAHS provided for the sale of this property as prescribed under California Government Code Section 54220, the City Charter, and the Administrative Code. A notice of intent to purchase this property was received from POLAHS on October 8, 2008. Subsequently, on August 13, 2009, the POLA Board declared this property as surplus to the needs of the POLA. POLA received cash of $3.5 million on the sale and credited rental income of $0.4 million. This sale resulted in a loss of $8.5 million, which was reflected as nonoperating expense in the Port’s financial statements.
PORT OF LOS ANGELES (HARBOR DEPARTMENT OF THE CITY OF LOS ANGELES)
Management’s Discussion and Analysis
June 30, 2012 and 2011
(Unaudited)
- 26 - Continued…..
Fiscal Year 2011
Major capital assets activities during fiscal year 2011 are as follows:
● $62.6 million - construction of Port Police Headquarters.
● $32.3 million - improvements of various Port facilities and buildings.
● $60.7 million - development, improvement and rehabilitation of various wharves.
● $51.6 million - improvement and upgrade of terminal facilities.
● $10.1 million - Port facilities security enhancement.
● $1.4 million - waterfront and public area improvements at Wilmington and San Pedro.
● $28.2 million - costs of area survey, planning, site restoration and demolition.
● $2.1 million - acquisition of vehicles, barge, boat and related parts and accessories.
● $3.2 million - acquisition of various equipments including $1.6 million storage tank and canopy, $1.0 million Port Police equipments and other marine and scanning devices, and $0.5 million network computer and electronic parts and devices.
Estimated Capital Improvement Expenditures for Fiscal Year 2013
Estimated expenditures for the Port’s fiscal year 2013 capital improvement program is $285.7 billion. Two-thirds of next fiscal year’s construction in progress (CIP) budget is expected to be spent on actual construction. The more significant activities for next fiscal year including expenditures for terminal development, waterfront development, transportation projects, port security, and environmental initiatives are as follows:
Terminal Development Projects
● $132.4 million of CIP budget dedicated to development projects at existing Port terminals.
● $29.3 million for projects at TraPac terminal, including the construction of four new terminal buildings and a new main gate for $9.8 million, and $17.7 million for design and physical development of backlands throughout the terminal.
● $38.2 million for the expansion of China Shipping Terminal, including $3.5 million for a new marine operations building, $18.8 million for backland development throughout the terminal, $13.2 million for the southern extension of the wharf at Berth 100, and $1.4 million for an Alternative Maritime Power (AMP) installation.
● $54.7 million funding to be provided for AMP installations at the Yang Ming, YTI, Evergreen, and APM terminals.
PORT OF LOS ANGELES (HARBOR DEPARTMENT OF THE CITY OF LOS ANGELES)
Management’s Discussion and Analysis
June 30, 2012 and 2011
(Unaudited)
- 27 - Continued…..
Waterfront Development Projects
● $18.5 million will be spent on L.A. Waterfront projects.
● $11.3 million funding for the construction of the Downtown Harbor Water Cut, which will create a new downtown harbor between 5th and 6th streets, and will be available for berthing guest boaters and Tall Ships visiting San Pedro.
● Parking lot improvements construction at Berths 87-93 required to incorporate the operations of USS Iowa Battleship.
● Design of the Front Street Beautification Project, the downtown Harbor landslide improvements, the 3rd Street crossing/traffic signal and rail improvements, the Urban Marine Research Center at City Dock No. 1, and the Maritime Museum concrete wharf.
Transportation and Infrastructure Projects
● $80.4 million estimated for transportation projects to improve the movement of goods and vehicular traffic in the Port and its surrounding roads and highways.
● $40.4 million for the construction of the Berth 200 Rail Yard project and $17.2 million for the South Wilmington Grade Separation project.
● Construction of the John S.Gibson access ramp to the I-110/SR 147 connector.
● $11.2 million estimated for the completion of the Port’s channel deepening which will deepen the Main Channel and turn basins to -53 MLLW (Mean Lower Low Water), allowing for cargo vessels to call at the Port’s container terminals.
Port Security Projects
● Estimated port security related projects of $5.5 million, which include the Port’s fiber optic network program phase I, the Front Street inspection facility, the Port police computer aided dispatch and records management system, the 120 W “C” Street Port police K9 facility, and the Port-wide surveillance radar projects. Other projects include the Port police tactical radio improvement, and the initial construction of the Port’s fiber optic network Phase II.
Environmental Initiatives
● $16.1 million committed to environmental programs which include: $6.3 million for various Clean Air Action Plan activities, $2.0 million for the successful vessel speed reduction, and $0.4 million for the new Environmental Ship Index incentive program.
● $1.5 million dedicated to technology advancement in a joint venture with the Port of Long Beach.
● $2.2 million to be spent on the CTP, for concession and grant administration, enforcement, data collection and analysis, outreach, and other support services.
PORT OF LOS ANGELES (HARBOR DEPARTMENT OF THE CITY OF LOS ANGELES)
Management’s Discussion and Analysis
June 30, 2012 and 2011
(Unaudited)
- 28 - Continued…..
● $2.7 million funding for hazardous materials-related activities.
● Environmental project priorities include allocation of $1.8 million for air quality and climate change measures, $1.5 million for water quality projects, $0.7 million for technical support to the implementation of the Total Daily Maximum Load Requirements, $0.3 million for Water Resources Action Plan control measures, and $0.3 million for biological resource assessment and management.
● Over $0.9 million for mitigation monitoring and reporting of environmental assessments.
● $3.0 million for remediation of Port property for current as well as future development and use.
Factors That May Affect the Port’s Operations
There is significant competition for container traffic among North American ports. The availability of alternate port facilities at competitive prices affects the use of the Port’s facilities, and therefore the revenues of the Port. The Port cannot predict the scope of such impact.
All of the ports on the West Coast of the U.S. compete for discretionary intermodal cargo destined for locations in the Central and Eastern U.S. and Canada. Discretionary cargo makes up approximately 50% of cargo arriving at the Port. Currently, this discretionary cargo moves eastward primarily by rail, after being off loaded at West Coast ports in the U.S. and Canada. The use of all-water routes to the East and Gulf Coasts of the U.S. is an alternative to Asian intermodal cargo moving through US West Coast ports. All-water service from Asia to the Gulf of Mexico and East Coast ports move primarily through the Panama Canal. The Panama Canal is in the process of expanding its locks such that its capacity will double. Although recent reports indicate that the opening of the new locks will be delayed to April 2015 from the original scheduled date of October 2014, the widening and deepening of the lock chambers will allow ships of greater size to transit the Canal. The expansion creates a potential route to the East and Gulf Coast for ships of greater capacity than the current “Panamax” ships. While the effects of an expanded Canal are unknown, The Port has an existing ability to handle the New Panamax ships, and continues to maintain and improve its strong infrastructure and intermodal capabilities.
The Port is subject to legal and regulatory requirements relating to air emissions that may be generated by activities at the Port. Such requirements mandate and offer certain incentives for reductions of air pollution from ships, trains, trucks and other operational activities. Paying for mandated air pollution reduction infrastructure, equipment and other measures may become a significant portion of the Port’s capital budget and operating budget. Such expenditures are necessary even if the Port does not undertake any new revenue-generating capital improvements, and the Port cannot provide assurances that the actual cost of the required measures will not exceed the forecasted amount.
Competitive Environment
As of fiscal year ended June 30, 2012, six major container ports controlled 99.3% of the entire U.S. West Coast containerized cargo market: the ports of Los Angeles, Long Beach, and Oakland in California; the ports of Seattle and Tacoma in Washington State; and the port of Portland in Oregon. The ports of Los Angeles and Long Beach together controlled 71.5% of all U.S. West Coast market share based on a loaded TEU basis.
PORT OF LOS ANGELES (HARBOR DEPARTMENT OF THE CITY OF LOS ANGELES)
Management’s Discussion and Analysis
June 30, 2012 and 2011
(Unaudited)
- 29 - Continued…..
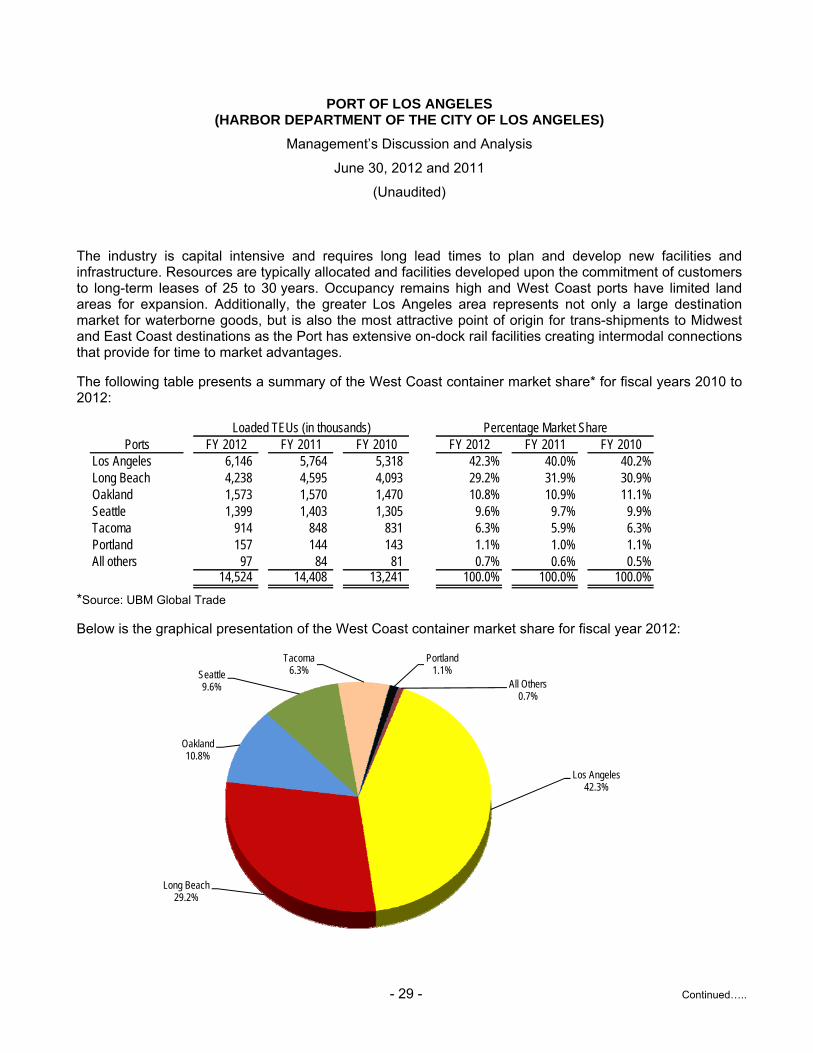
The industry is capital intensive and requires long lead times to plan and develop new facilities and infrastructure. Resources are typically allocated and facilities developed upon the commitment of customers to long-term leases of 25 to 30 years. Occupancy remains high and West Coast ports have limited land areas for expansion. Additionally, the greater Los Angeles area represents not only a large destination market for waterborne goods, but is also the most attractive point of origin for trans-shipments to Midwest and East Coast destinations as the Port has extensive on-dock rail facilities creating intermodal connections that provide for time to market advantages.
The following table presents a summary of the West Coast container market share* for fiscal years 2010 to 2012:
Loaded TEUs (in thousands) Percentage Market SharePorts FY 2012 FY 2011 FY 2010 FY 2012 FY 2011 FY 2010
Los Angeles 6,146 5,764 5,318 42.3% 40.0% 40.2%Long Beach 4,238 4,595 4,093 29.2% 31.9% 30.9%Oakland 1,573 1,570 1,470 10.8% 10.9% 11.1%Seattle 1,399 1,403 1,305 9.6% 9.7% 9.9%Tacoma 914 848 831 6.3% 5.9% 6.3%Portland 157 144 143 1.1% 1.0% 1.1%All others 97 84 81 0.7% 0.6% 0.5%
14,524 14,408 13,241 100.0% 100.0% 100.0%
*Source: UBM Global Trade
Below is the graphical presentation of the West Coast container market share for fiscal year 2012:
Los Angeles42.3%
Long Beach29.2%
Oakland10.8%
Seattle9.6%
Tacoma6.3%
Portland1.1%
All Others0.7%
PORT OF LOS ANGELES (HARBOR DEPARTMENT OF THE CITY OF LOS ANGELES)
Management’s Discussion and Analysis
June 30, 2012 and 2011
(Unaudited)
- 30 - Continued…..
Request for Information
This financial report is designed to provide a general overview of the Port of Los Angeles’ finances. Questions concerning any of the information provided in this report or requests for additional information should be addressed to Karl Pan, Chief Financial Officer, Port of Los Angeles (Harbor Department of the City of Los Angeles), 425 S. Palos Verdes St., San Pedro, CA 90731.
Financial Statements
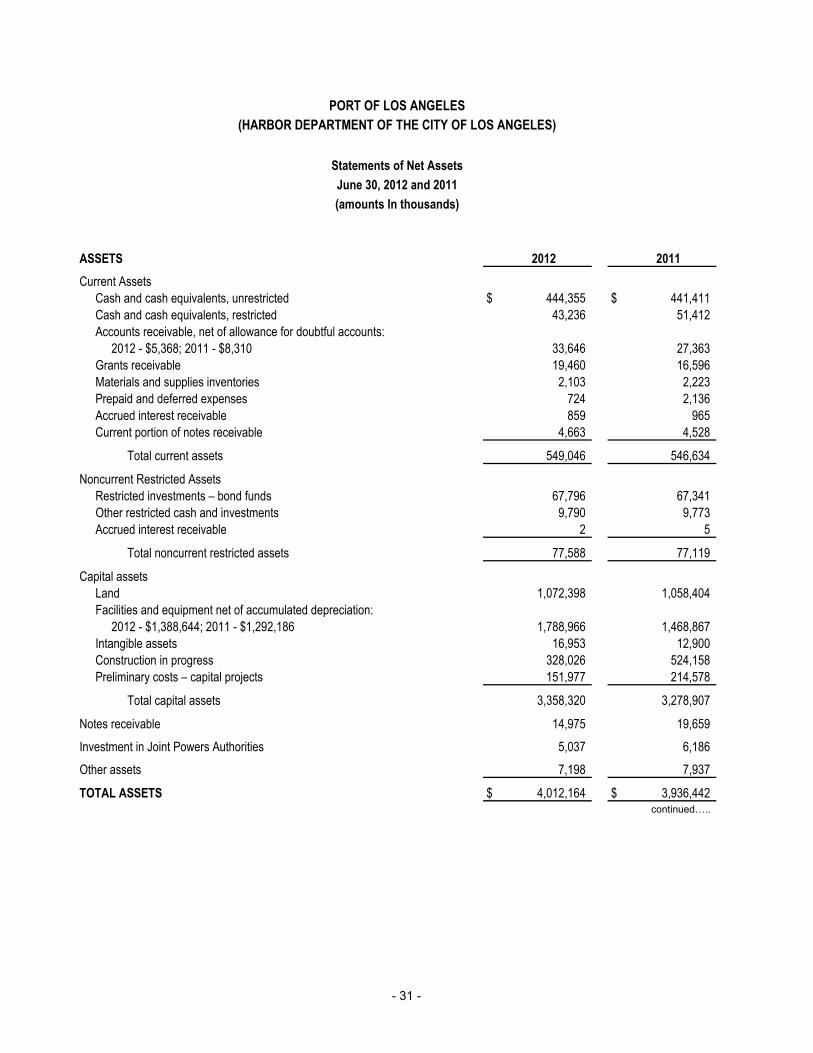
PORT OF LOS ANGELES
(HARBOR DEPARTMENT OF THE CITY OF LOS ANGELES)
Statements of Net Assets
June 30, 2012 and 2011
(amounts In thousands)
ASSETS 2012 2011
Current Assets
Cash and cash equivalents, unrestricted $ 444,355 $ 441,411
Cash and cash equivalents, restricted 43,236 51,412
Accounts receivable, net of allowance for doubtful accounts:
2012 - $5,368; 2011 - $8,310 33,646 27,363
Grants receivable 19,460 16,596
Materials and supplies inventories 2,103 2,223
Prepaid and deferred expenses 724 2,136
Accrued interest receivable 859 965
Current portion of notes receivable 4,663 4,528
Total current assets 549,046 546,634
Noncurrent Restricted Assets
Restricted investments – bond funds 67,796 67,341
Other restricted cash and investments 9,790 9,773
Accrued interest receivable 2 5
Total noncurrent restricted assets 77,588 77,119
Capital assets
Land 1,072,398 1,058,404
Facilities and equipment net of accumulated depreciation:
2012 - $1,388,644; 2011 - $1,292,186 1,788,966 1,468,867
Intangible assets 16,953 12,900
Construction in progress 328,026 524,158
Preliminary costs – capital projects 151,977 214,578
Total capital assets 3,358,320 3,278,907
Notes receivable 14,975 19,659
Investment in Joint Powers Authorities 5,037 6,186
Other assets 7,198 7,937
TOTAL ASSETS $ 4,012,164 $ 3,936,442 continued…..
- 31 -
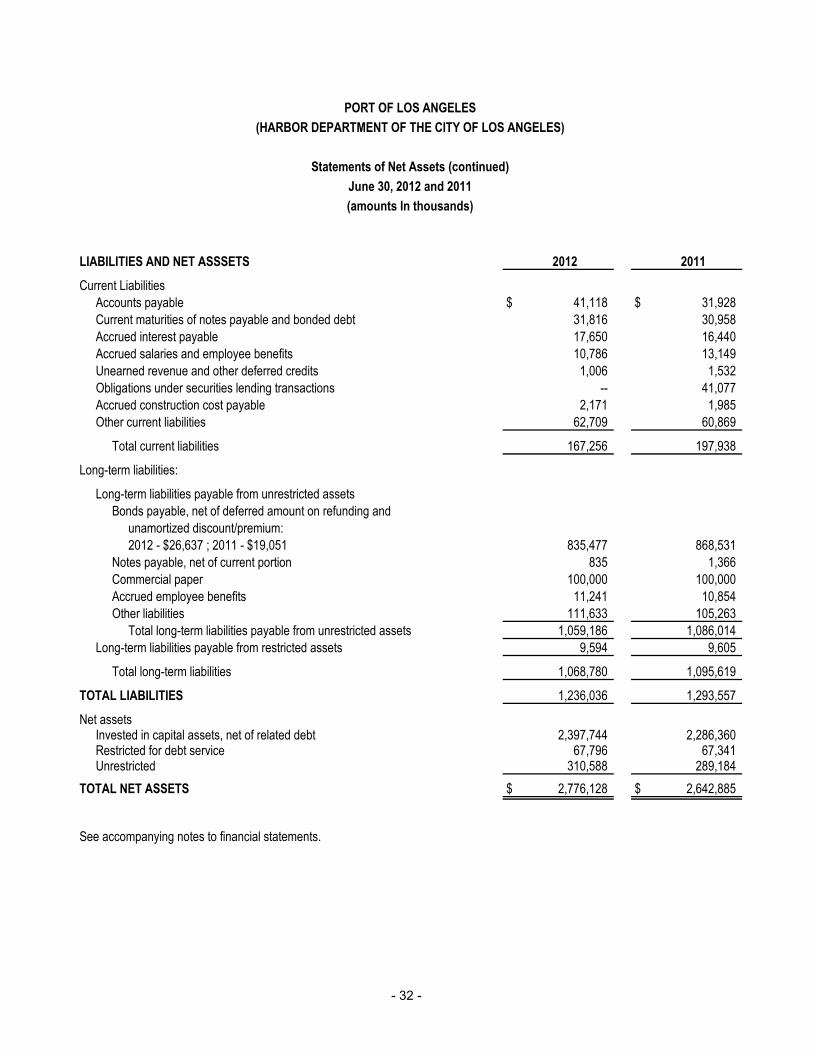
PORT OF LOS ANGELES
(HARBOR DEPARTMENT OF THE CITY OF LOS ANGELES)
Statements of Net Assets (continued)
June 30, 2012 and 2011
(amounts In thousands)
LIABILITIES AND NET ASSSETS 2012 2011
Current Liabilities
Accounts payable $ 41,118 $ 31,928
Current maturities of notes payable and bonded debt 31,816 30,958
Accrued interest payable 17,650 16,440
Accrued salaries and employee benefits 10,786 13,149
Unearned revenue and other deferred credits 1,006 1,532
Obligations under securities lending transactions -- 41,077
Accrued construction cost payable 2,171 1,985
Other current liabilities 62,709 60,869
Total current liabilities 167,256 197,938
Long-term liabilities:
Long-term liabilities payable from unrestricted assets
Bonds payable, net of deferred amount on refunding and
unamortized discount/premium:
2012 - $26,637 ; 2011 - $19,051 835,477 868,531
Notes payable, net of current portion 835 1,366
Commercial paper 100,000 100,000
Accrued employee benefits 11,241 10,854
Other liabilities 111,633 105,263
Total long-term liabilities payable from unrestricted assets 1,059,186 1,086,014
Long-term liabilities payable from restricted assets 9,594 9,605
Total long-term liabilities 1,068,780 1,095,619
TOTAL LIABILITIES 1,236,036 1,293,557
Net assetsInvested in capital assets, net of related debt 2,397,744 2,286,360 Restricted for debt service 67,796 67,341 Unrestricted 310,588 289,184
TOTAL NET ASSETS $ 2,776,128 $ 2,642,885
See accompanying notes to financial statements.
- 32 -
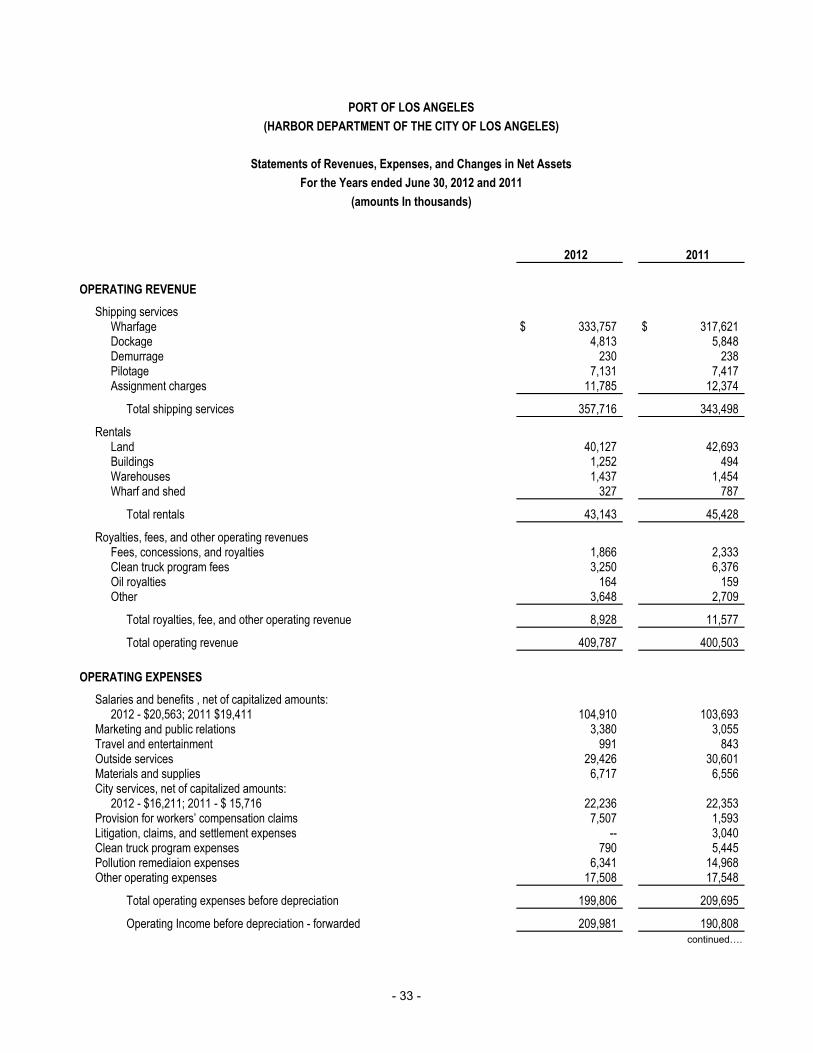
PORT OF LOS ANGELES
(HARBOR DEPARTMENT OF THE CITY OF LOS ANGELES)
Statements of Revenues, Expenses, and Changes in Net Assets
For the Years ended June 30, 2012 and 2011
(amounts In thousands)
2012 2011
OPERATING REVENUE
Shipping servicesWharfage $ 333,757 $ 317,621 Dockage 4,813 5,848 Demurrage 230 238 Pilotage 7,131 7,417 Assignment charges 11,785 12,374
Total shipping services 357,716 343,498
RentalsLand 40,127 42,693 Buildings 1,252 494 Warehouses 1,437 1,454 Wharf and shed 327 787
Total rentals 43,143 45,428
Royalties, fees, and other operating revenuesFees, concessions, and royalties 1,866 2,333 Clean truck program fees 3,250 6,376 Oil royalties 164 159 Other 3,648 2,709
Total royalties, fee, and other operating revenue 8,928 11,577
Total operating revenue 409,787 400,503
OPERATING EXPENSES
Salaries and benefits , net of capitalized amounts:2012 - $20,563; 2011 $19,411 104,910 103,693
Marketing and public relations 3,380 3,055 Travel and entertainment 991 843 Outside services 29,426 30,601 Materials and supplies 6,717 6,556 City services, net of capitalized amounts:
2012 - $16,211; 2011 - $ 15,716 22,236 22,353 Provision for workers’ compensation claims 7,507 1,593 Litigation, claims, and settlement expenses -- 3,040 Clean truck program expenses 790 5,445 Pollution remediaion expenses 6,341 14,968 Other operating expenses 17,508 17,548
Total operating expenses before depreciation 199,806 209,695
Operating Income before depreciation - forwarded 209,981 190,808 continued….
- 33 -
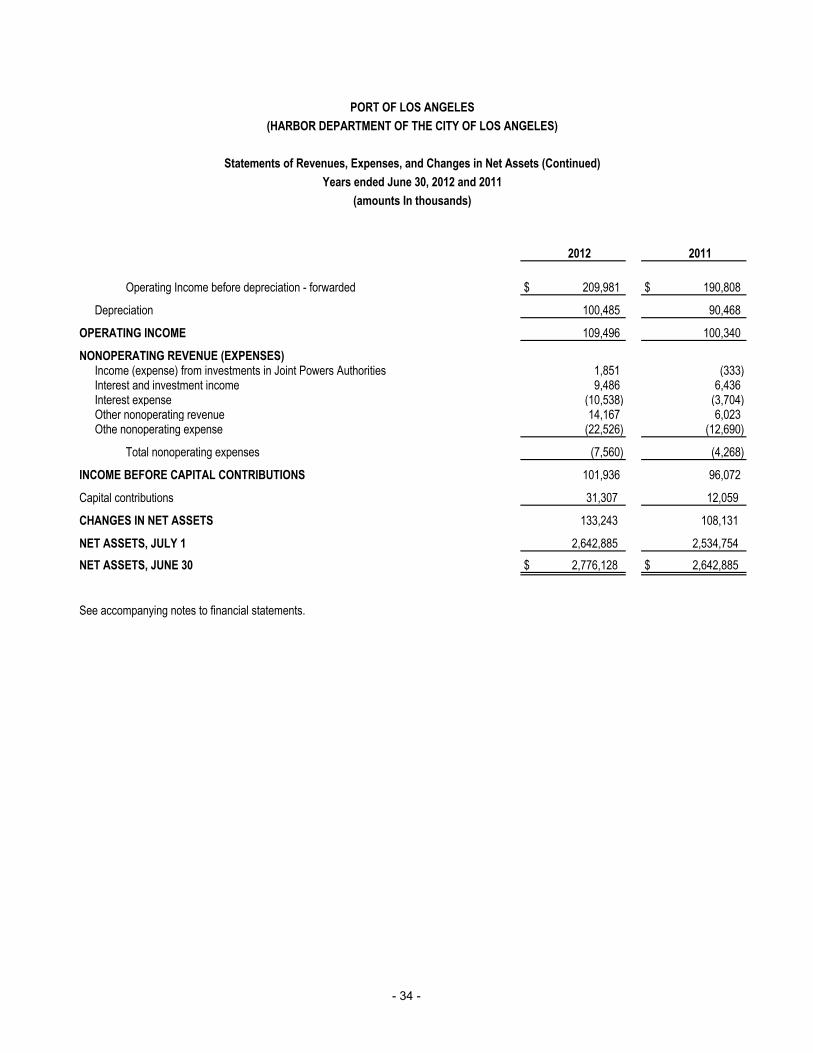
PORT OF LOS ANGELES
(HARBOR DEPARTMENT OF THE CITY OF LOS ANGELES)
Statements of Revenues, Expenses, and Changes in Net Assets (Continued)
Years ended June 30, 2012 and 2011
(amounts In thousands)
2012 2011
Operating Income before depreciation - forwarded $ 209,981 $ 190,808
Depreciation 100,485 90,468
OPERATING INCOME 109,496 100,340
NONOPERATING REVENUE (EXPENSES)Income (expense) from investments in Joint Powers Authorities 1,851 (333)Interest and investment income 9,486 6,436Interest expense (10,538) (3,704)Other nonoperating revenue 14,167 6,023Othe nonoperating expense (22,526) (12,690)
Total nonoperating expenses (7,560) (4,268)
INCOME BEFORE CAPITAL CONTRIBUTIONS 101,936 96,072
Capital contributions 31,307 12,059
CHANGES IN NET ASSETS 133,243 108,131
NET ASSETS, JULY 1 2,642,885 2,534,754
NET ASSETS, JUNE 30 $ 2,776,128 $ 2,642,885
See accompanying notes to financial statements.
- 34 -
PORT OF LOS ANGELES
(HARBOR DEPARTMENT OF THE CITY OF LOS ANGELES)
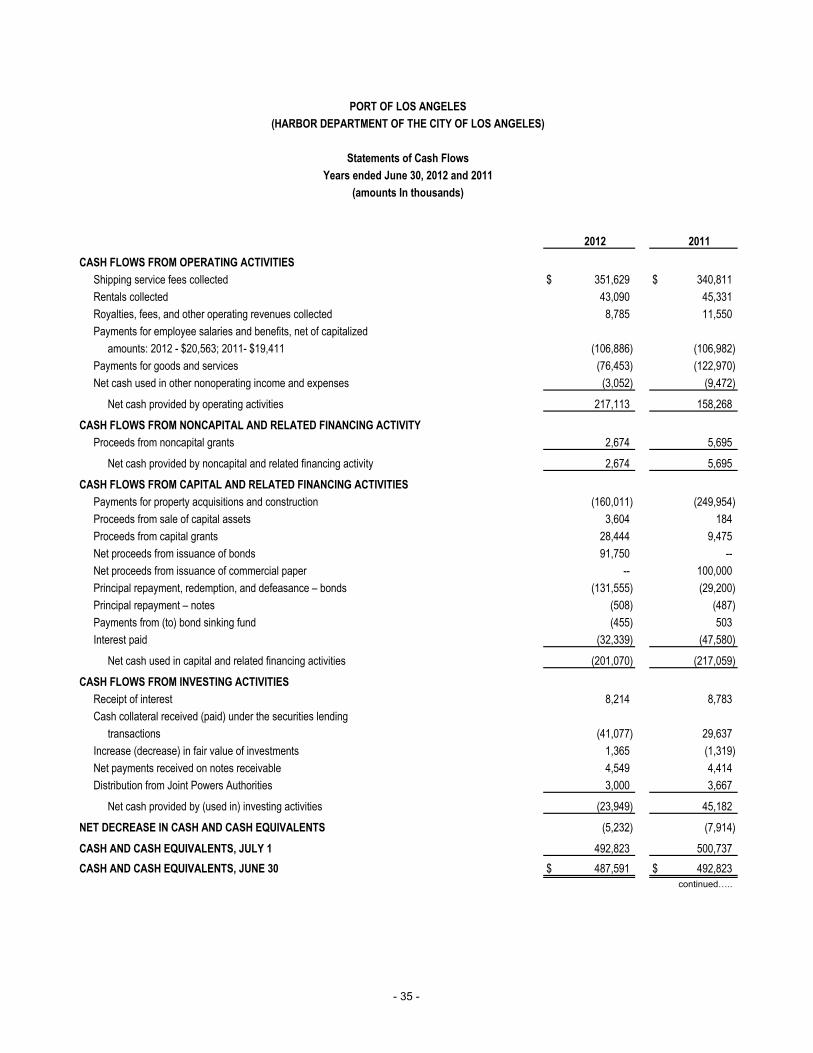
Statements of Cash Flows
Years ended June 30, 2012 and 2011
(amounts In thousands)
2012 2011
CASH FLOWS FROM OPERATING ACTIVITIES
Shipping service fees collected $ 351,629 $ 340,811
Rentals collected 43,090 45,331
Royalties, fees, and other operating revenues collected 8,785 11,550
Payments for employee salaries and benefits, net of capitalized
amounts: 2012 - $20,563; 2011- $19,411 (106,886) (106,982)
Payments for goods and services (76,453) (122,970)
Net cash used in other nonoperating income and expenses (3,052) (9,472)
Net cash provided by operating activities 217,113 158,268
CASH FLOWS FROM NONCAPITAL AND RELATED FINANCING ACTIVITY
Proceeds from noncapital grants 2,674 5,695
Net cash provided by noncapital and related financing activity 2,674 5,695
CASH FLOWS FROM CAPITAL AND RELATED FINANCING ACTIVITIES
Payments for property acquisitions and construction (160,011) (249,954)
Proceeds from sale of capital assets 3,604 184
Proceeds from capital grants 28,444 9,475
Net proceeds from issuance of bonds 91,750 --
Net proceeds from issuance of commercial paper -- 100,000
Principal repayment, redemption, and defeasance – bonds (131,555) (29,200)
Principal repayment – notes (508) (487)
Payments from (to) bond sinking fund (455) 503
Interest paid (32,339) (47,580)
Net cash used in capital and related financing activities (201,070) (217,059)
CASH FLOWS FROM INVESTING ACTIVITIES
Receipt of interest 8,214 8,783
Cash collateral received (paid) under the securities lending
transactions (41,077) 29,637
Increase (decrease) in fair value of investments 1,365 (1,319)
Net payments received on notes receivable 4,549 4,414
Distribution from Joint Powers Authorities 3,000 3,667
Net cash provided by (used in) investing activities (23,949) 45,182
NET DECREASE IN CASH AND CASH EQUIVALENTS (5,232) (7,914)
CASH AND CASH EQUIVALENTS, JULY 1 492,823 500,737
CASH AND CASH EQUIVALENTS, JUNE 30 $ 487,591 $ 492,823
continued…..
- 35 -
PORT OF LOS ANGELES
(HARBOR DEPARTMENT OF THE CITY OF LOS ANGELES)
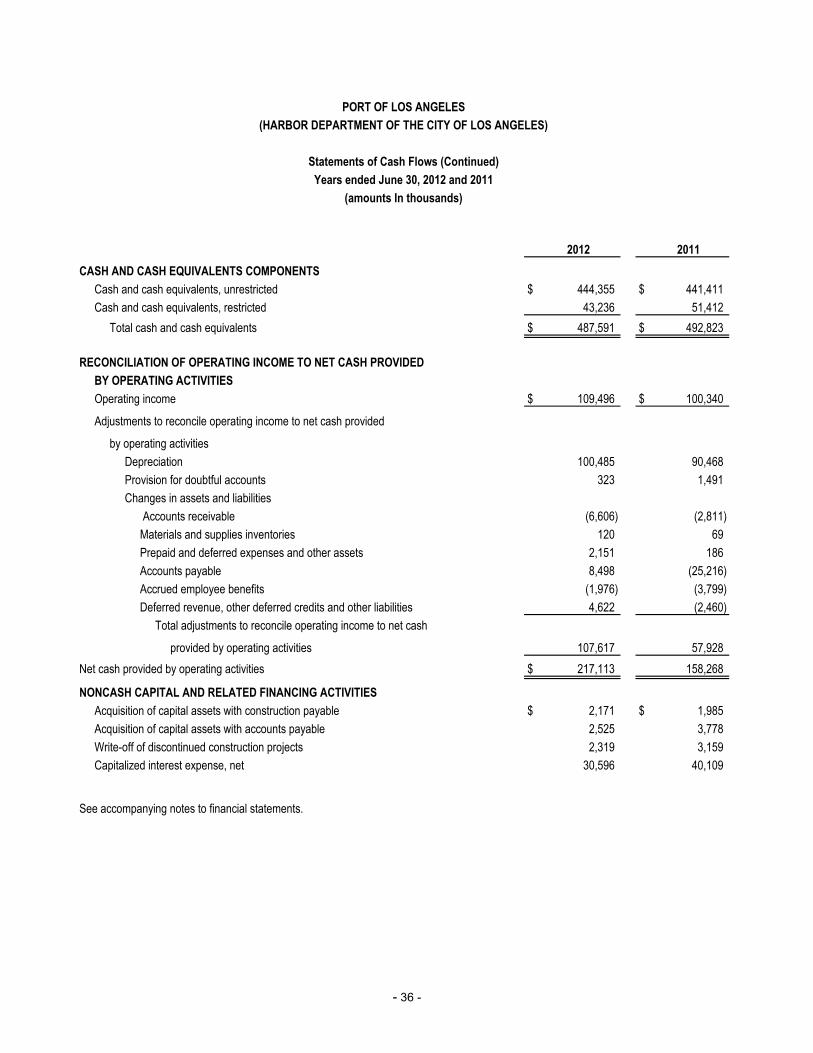
Statements of Cash Flows (Continued)
Years ended June 30, 2012 and 2011
(amounts In thousands)
2012 2011
CASH AND CASH EQUIVALENTS COMPONENTS
Cash and cash equivalents, unrestricted $ 444,355 $ 441,411
Cash and cash equivalents, restricted 43,236 51,412
Total cash and cash equivalents $ 487,591 $ 492,823
RECONCILIATION OF OPERATING INCOME TO NET CASH PROVIDED
BY OPERATING ACTIVITIES
Operating income $ 109,496 $ 100,340
Adjustments to reconcile operating income to net cash provided
by operating activities
Depreciation 100,485 90,468
Provision for doubtful accounts 323 1,491
Changes in assets and liabilities
Accounts receivable (6,606) (2,811)
Materials and supplies inventories 120 69
Prepaid and deferred expenses and other assets 2,151 186
Accounts payable 8,498 (25,216)
Accrued employee benefits (1,976) (3,799)
Deferred revenue, other deferred credits and other liabilities 4,622 (2,460)
Total adjustments to reconcile operating income to net cash
provided by operating activities 107,617 57,928
Net cash provided by operating activities $ 217,113 158,268
NONCASH CAPITAL AND RELATED FINANCING ACTIVITIES
Acquisition of capital assets with construction payable $ 2,171 $ 1,985
Acquisition of capital assets with accounts payable 2,525 3,778
Write-off of discontinued construction projects 2,319 3,159
Capitalized interest expense, net 30,596 40,109
See accompanying notes to financial statements.
- 36 -
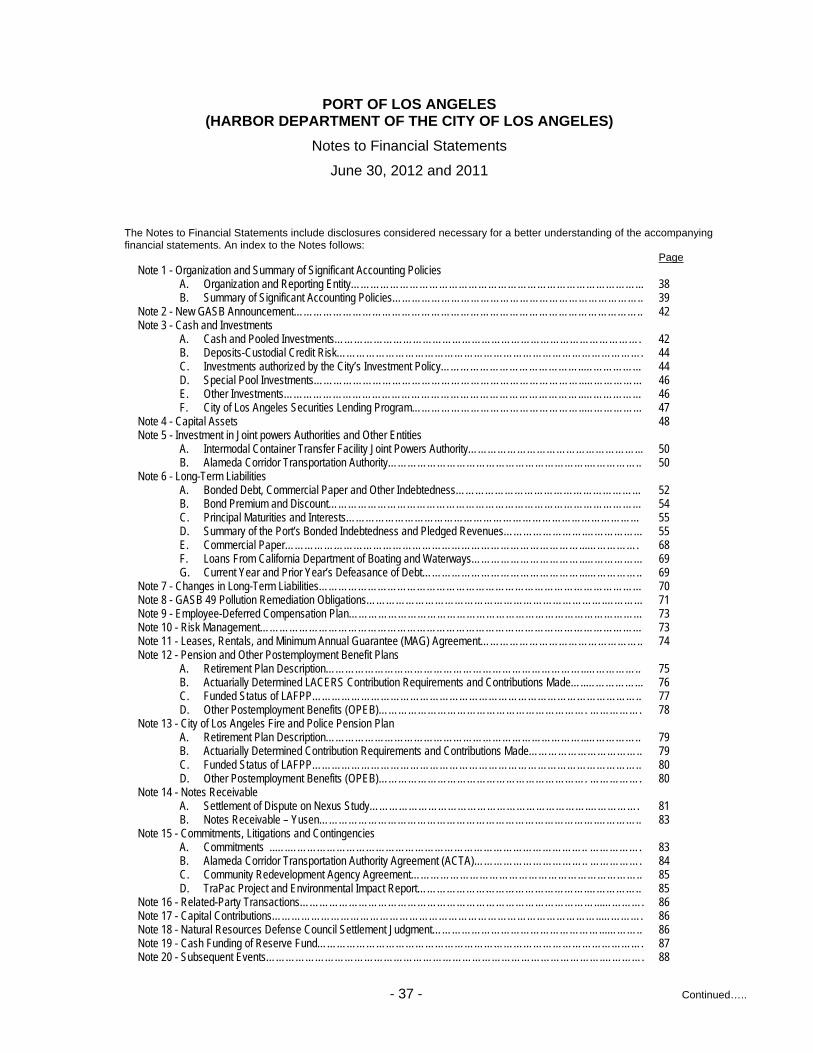
PORT OF LOS ANGELES (HARBOR DEPARTMENT OF THE CITY OF LOS ANGELES)
Notes to Financial Statements
June 30, 2012 and 2011
- 37 - Continued…..
The Notes to Financial Statements include disclosures considered necessary for a better understanding of the accompanying financial statements. An index to the Notes follows:
Page Note 1 - Organization and Summary of Significant Accounting Policies A. Organization and Reporting Entity……………………………………………………………………………... 38 B. Summary of Significant Accounting Policies………………………………………………………………….. 39 Note 2 - New GASB Announcement…………………………………………………………………………………………….. 42 Note 3 - Cash and Investments A. Cash and Pooled Investments…………………………………………………………………………………. 42 B. Deposits-Custodial Credit Risk…………………………………………………………………………………. 44 C. Investments authorized by the City’s Investment Policy……………………………………..……………… 44 D. Special Pool Investments………………………………………………………………………..……………… 46 E. Other Investments………………………………………………………………………………..……………… 46 F. City of Los Angeles Securities Lending Program……………………………………………..……………… 47 Note 4 - Capital Assets 48 Note 5 - Investment in Joint powers Authorities and Other Entities A. Intermodal Container Transfer Facility Joint Powers Authority……………………………………………... 50 B. Alameda Corridor Transportation Authority…………………………………………………….…………….. 50 Note 6 - Long-Term Liabilities A. Bonded Debt, Commercial Paper and Other Indebtedness………………………………………………… 52 B. Bond Premium and Discount…………………………………………………………………………………… 54 C. Principal Maturities and Interests……………………………………………………………………………… 55 D. Summary of the Port’s Bonded Indebtedness and Pledged Revenues…………………….……………… 55 E. Commercial Paper………………………………………………………………………………...……………. 68 F. Loans From California Department of Boating and Waterways……………………………..……………… 69 G. Current Year and Prior Year’s Defeasance of Debt…………………………………………...…………….. 69 Note 7 - Changes in Long-Term Liabilities……………………………………………………………………………………… 70 Note 8 - GASB 49 Pollution Remediation Obligations……………………………………………………………….………… 71 Note 9 - Employee-Deferred Compensation Plan……………………………………………………………………………… 73 Note 10 - Risk Management……………………………………………………………………………………………………… 73 Note 11 - Leases, Rentals, and Minimum Annual Guarantee (MAG) Agreement………………………………………….. 74 Note 12 - Pension and Other Postemployment Benefit Plans A. Retirement Plan Description……………………………………………………………………..…………….. 75 B. Actuarially Determined LACERS Contribution Requirements and Contributions Made…..……………... 76 C. Funded Status of LAFPP……………………………………………………………………………………….. 77 D. Other Postemployment Benefits (OPEB)………………………………………………………. ……………. 78 Note 13 - City of Los Angeles Fire and Police Pension Plan A. Retirement Plan Description……………………………………………………………………..…………….. 79 B. Actuarially Determined Contribution Requirements and Contributions Made…………………………….. 79 C. Funded Status of LAFPP……………………………………………………………………………………….. 80 D. Other Postemployment Benefits (OPEB)………………………………………………………. ……………. 80 Note 14 - Notes Receivable A. Settlement of Dispute on Nexus Study………………………………………………………….……………. 81 B. Notes Receivable – Yusen………………………………………………………………………….………….. 83 Note 15 - Commitments, Litigations and Contingencies A. Commitments ..….……………………………………………………………………………….. ……………. 83 B. Alameda Corridor Transportation Authority Agreement (ACTA)…………………………….. ……………. 84 C. Community Redevelopment Agency Agreement…………………………………………………………….. 85 D. TraPac Project and Environmental Impact Report…………………………………………….…………….. 85 Note 16 - Related-Party Transactions………………………………………………………………………………...…………. 86 Note 17 - Capital Contributions………………………………………………………………………………………..…………. 86 Note 18 - Natural Resources Defense Council Settlement Judgment……………………………………………...……….. 86 Note 19 - Cash Funding of Reserve Fund………………………………………………………………………………………. 87 Note 20 - Subsequent Events………………………………………………………………………………………….…………. 88
PORT OF LOS ANGELES (HARBOR DEPARTMENT OF THE CITY OF LOS ANGELES)
Notes to Financial Statements
June 30, 2012 and 2011
- 38 - Continued…..
1. Organization and Summary of Significant Accounting Policies
The financial statements of the Port of Los Angeles (Harbor Department of the City of Los Angeles), hereafter referred to as “Port of Los Angeles” or “Port,” have been prepared in conformity with generally accepted accounting principles (GAAP) as promulgated by the Governmental Accounting Standards Board (GASB). GASB is the accepted standard-setting body for establishing governmental accounting and financial reporting principles. The Port’s significant accounting policies are described below.
A. Organization and Reporting Entity
The Port of Los Angeles is an independent, self-supporting department of the City of Los Angeles (the City), formed for the purpose of providing shipping, fishing, recreational, and other resources and benefits for the enjoyment of the citizens of California. The Port is under the control of a five-member Board of Harbor Commissioners (BHC), who are appointed by the Mayor and approved by the City Council. The BHC is administered by an Executive Director, subject to the State of California Tidelands Trust Act. The Port is granted control of tidelands, and all monies arising out of the operation of the Port are limited as to use for the operation and maintenance of Port facilities, the acquisition and construction of improvements, and other such trust considerations under the Tidelands Trust and the Charter of the City.
The Port prepares and controls its own financial plan, administers and controls its fiscal activities, and is responsible for all Port construction and operations. The Port operates as principal landlord for the purpose of assigning or leasing port facilities and land areas. The Port’s principal source of revenue is from shipping services under tariffs (dockage and wharfage, etc.), rental of land and facilities, royalties (oil wells), and other fees. Capital construction is financed from operations, bonded debt, and loans secured by future revenues and federal grants. Daily operation of the port facilities and regular maintenance are performed by the Port’s permanent work force. Generally, major maintenance and new construction projects are assigned to commercial contractors.
Operations of the Port are financed in a manner similar to that of a private business. The Port recovers its costs of providing services and improvements through tariff charges for shipping services and the leasing of facilities to Port customers.
In evaluating how to define the Port for financial reporting purposes, management has considered all potential component units by applying the criteria set forth by the GASB. The financial statements present only the financial activities of the Port and are not intended to present fairly the financial position and results of operations of the City in conformity with GAAP.
The Los Angeles Harbor Improvements Corporation (LAHIC) is a nonprofit public benefit corporation organized under the laws of the state of California for public purposes. LAHIC was formed to assist the Port by constructing, replacing, extending, or improving facilities and services that the BHC deems necessary for the promotion and accommodation of commerce.
PORT OF LOS ANGELES (HARBOR DEPARTMENT OF THE CITY OF LOS ANGELES)
Notes to Financial Statements
June 30, 2012 and 2011
- 39 - Continued…..
The board of directors of LAHIC consists of five members. Election of the LAHIC board of directors occurs by vote of the BHC. Although tenants reimburse LAHIC for its costs of operations, the BHC is financially responsible for LAHIC’s activities. Further, although LAHIC is legally separate from the Port, it is reported as if it were part of the Port, because its sole purpose is to finance and construct facilities and improvements, which directly benefit the Port.
LAHIC is included in the reporting entity of the Port, and accordingly, the operations of LAHIC are blended in the Port’s accompanying financial statements.
B. Summary of Significant Accounting Policies
Method of Accounting – The Port activities are accounted for as an enterprise fund, and as such, its financial statements are presented using the economic resources measurement focus and the accrual method of accounting. Under this method of accounting, revenues are recognized when earned and expenses are recorded when the related liabilities are incurred. The measurement focus is on determination of changes in net assets, financial position, and cash flows.
The Port follows private-sector standards of accounting and financial reporting issued by the Financial Accounting Standards Board (FASB) and predecessor standard setters prior to November 30, 1989, unless those standards conflict with or contradict guidance of the GASB. The Port also has the option of following subsequent private-sector guidance subject to the same limitation. The Port has elected not to follow subsequent private-sector guidance.
Cash, Cash Equivalents, and Investments – In order to maximize investment returns, the Port pools its available cash with that of the City. All cash and investments pooled with the City, plus any other cash deposits or investments with initial maturities of three months or less are considered cash and cash equivalents.
Interest income and realized gains and losses arising from such pooled cash and investments are apportioned to each participating City department fund based on the relationship of such department fund’s respective daily cash balances to aggregate pooled cash and investments. The change in the fair value of pooled investments is allocated to each participating City department fund based on the aggregate respective cash balances at year-end.
The Port’s investments, including its share of the City’s pooled investments, are stated at fair value. Fair value is determined based upon market closing prices or bid/asked prices for regularly traded securities. The fair value of investments with no regular market is estimated based on similar traded investments. The fair value of mutual funds, government-sponsored investment pools, and other similar investments is stated at share value or an allocation of fair value of the pool, if separately reported. Certain money market investments with initial maturities at the time of purchase of less than one year are recorded at cost. The calculation of realized gains is independent of the calculation of the net increase in the fair value of investments. Realized gains and losses on investments that had been held more than one fiscal year and sold in the current year may have been recognized as an increase or decrease in fair value of investments reported in the prior year and the current year.
PORT OF LOS ANGELES (HARBOR DEPARTMENT OF THE CITY OF LOS ANGELES)
Notes to Financial Statements
June 30, 2012 and 2011
- 40 - Continued…..
Securities Lending – As a participant in the City of Los Angeles Investment Pool, the Port also participates in the City’s securities lending program (SLP). The investment collateral received by the City together with the corresponding liability is allocated among the City’s participating funds using the same basis as that of allocating interest income and realized gains or losses. The City suspended its SLP in fiscal year 2012.
Materials and Supplies Inventories – Inventories of materials and supplies are stated at lower of average cost or market.
Capital Assets – Capital assets are carried at cost or at appraised fair value at the date received, in the case of properties acquired by donation, and by termination of leases for tenant improvements, less allowance for accumulated depreciation. The Port has a capitalization threshold of $5,000. Capital assets include intangible assets for the Port’s radio frequency and emission mitigation credits, and capitalized costs of the new enterprise resource planning system currently under development.
Development costs for proposed capital projects that are incurred prior to the finalization of formal construction contracts are capitalized. Upon completion of capital projects, such preliminary costs are transferred to the appropriate property account. In the event the proposed capital projects are abandoned, the associated preliminary costs are charged to expense in the year of abandonment. Preliminary costs of capital projects for fiscal years 2012 and 2011 are $152.0 million and $214.6 million respectively.
Just as the Port capitalizes the actual interest costs incurred on indebtedness, it also capitalizes an imputed interest cost for cash used to pay for capital projects. The Port computes the imputed cost of interest for cash monies using its actual cost of borrowing on a weighted average basis. Interest capitalized in fiscal years 2012 and 2011 were $30.6 million and $40.1 million respectively.
The Port capitalizes indirect project costs associated with the acquisition, development, and construction of new capital projects of the Port. Indirect project costs allocated to construction projects for fiscal years 2012 and 2011 were $7.8 million and $7.3 million respectively.
Depreciation is computed on the straight-line basis over the estimated useful lives of the assets. The estimated useful lives of the Port’s depreciable assets are as follows:
Wharves and sheds 10 to 15 yearsBuildings and facilities 10 to 50 yearsEquipment 3 to 20 years
Investments in Joint Powers Authorities – Investments in joint power authorities are accounted for by the equity method.
Accrued Salaries and Employee Benefits – Aside from accrued wages, the Port records as liabilities all accrued employee benefits, including estimated liabilities for vacation and sick leave in the period the benefits are earned. Port employees accumulate annual vacation and
PORT OF LOS ANGELES (HARBOR DEPARTMENT OF THE CITY OF LOS ANGELES)
Notes to Financial Statements
June 30, 2012 and 2011
- 41 - Continued…..
sick leave based on their length of service. Upon termination or retirement, employees are paid the cash value of their accumulated leave benefits.
Operating and Nonoperating Revenues and Expenses – The Port differentiates between operating revenues and expenses, and nonoperating revenues and expenses. Operating revenues and expenses generally result from the Port’s primary ongoing operations. All revenues and expenses other than these are reported as nonoperating revenues and expenses.
Revenues from shipping services, rental fees, and royalties are the major sources of the Port’s revenues. Shipping service revenues consist of fees assessed for various activities relating to vessel and cargo movement. Twenty foot Equivalent Units and metric tons are the measures used to determine cargo volumes that move through the Port. Rental fees are collected from the lease of various types of rental properties in Port-controlled lands. Rental rates are set using various methodologies, and are appraised periodically to evaluate and establish benchmark rates. Rental rates may be adjusted, within reason, to reflect general market conditions. The Port levies fees for various activities such as royalties from oil and natural gas production, fees for parking lots, and miscellaneous concessions.
Operating Leases – The Port leases a substantial portion of lands and facilities to others. The majority of these leases provide for cancellation on a 30-day notice by either party and for retention of ownership by the Port or restoration of the property at the expiration of the agreement; accordingly, no leases are considered capital leases.
Pension and Other Post Employment Benefits (OPEB) – All full-time civilian Port employees are eligible to participate in the Los Angeles City Employees’ Retirement System (LACERS), a defined benefit pension plan. Starting fiscal year 2007, all full-time Port Police Officers are eligible to participate in the Los Angeles Fire and Police Pension System (LAFPP), a defined benefit single-employer pension plan available to all full-time active sworn firefighters and police officers (except Airport Police) of the City. The Port’s policy is to fund fully its entire annual share of LACERS and LAFPP pensions and the respective OPEB costs. The funded costs are determined at the start of each fiscal year and are incorporated into the payroll burden rate to reimburse the City for the Port’s pro rata contribution share.
Capital Contributions – The Port may receive grants for the purpose of acquisition or construction of property and equipment. These grants are generally structured as reimbursements against expenditures. Grants are recorded as capital contributions when the grant is earned. Grants are generally earned upon expenditure of funds.
Net Assets – The statements of net assets are designed to display the financial position of the Port. The Port’s equity is reported as net assets, which is classified into the following categories:
Invested in capital assets, net of related debt – This category consists of capital assets, net of accumulated depreciation, and is reduced by the outstanding balances of any bonds, notes, or other borrowings that are attributable to the acquisition, construction, or improvement of those assets.
PORT OF LOS ANGELES (HARBOR DEPARTMENT OF THE CITY OF LOS ANGELES)
Notes to Financial Statements
June 30, 2012 and 2011
- 42 - Continued…..
Restricted – This category consists of restrictions placed on net asset use through external constraints imposed by creditors (such as debt covenants), grantors, contributors, or law or regulations of other governments. Constraints may also be imposed by law or constitutional provisions or enabling legislation.
Unrestricted – This category consists of net assets that do not meet the definition of “restricted” or “invested in capital assets, net of related debt.”
When both restricted and unrestricted resources are available for use, it is the Port’s policy to use restricted resources first, and then unrestricted resources, as they are needed.
Use of Estimates – The preparation of financial statements in conformity with U.S. generally accepted accounting principles requires management to make estimates and assumptions that affect certain reported amounts and disclosures. Accordingly, actual results could differ from those estimates.
2. New GASB Pronouncement
GASB Statement No. 60, “Accounting and Financial Reporting for Service Concession Arrangements.” Issued in November 2010, this statement aims to improve financial reporting of service concession arrangements (SCAs). SCA is an arrangement between a transferor (government) and an operator (governmental or nongovernmental entity) in which the transferor conveys to an operator the right and related obligation to provide services through the use of infrastructure or another public asset in exchange for significant consideration; the operator then collects and is compensated by fees from third parties. Implementation of this statement is effective fiscal year 2012. The Port does not have activities that qualify as SCAs, hence, this statement has no material impact on the Port’s financial statements.
3. Cash and Investments
A. Cash and Pooled Investments
The cash balances of substantially all funds on deposit in the City Treasury are pooled and invested by the City Treasurer for the purpose of maximizing interest earnings through pooled investment activities; however, safety and liquidity still take precedence over return. Interest earned on pooled investments is allocated to the participating funds based on each fund’s average daily deposit balance during the allocation period with all remaining interest allocated to the General Fund of the City of Los Angeles. Investments are stated at fair value based on quoted market prices except for money market investments that have remaining maturities of one year or less at the time of purchase, which are reported at amortized cost.
All investment transactions and the entire portfolio must comply with the California Government Code Section 53600 and 53635 et seq. and the City’s Investment Policy.
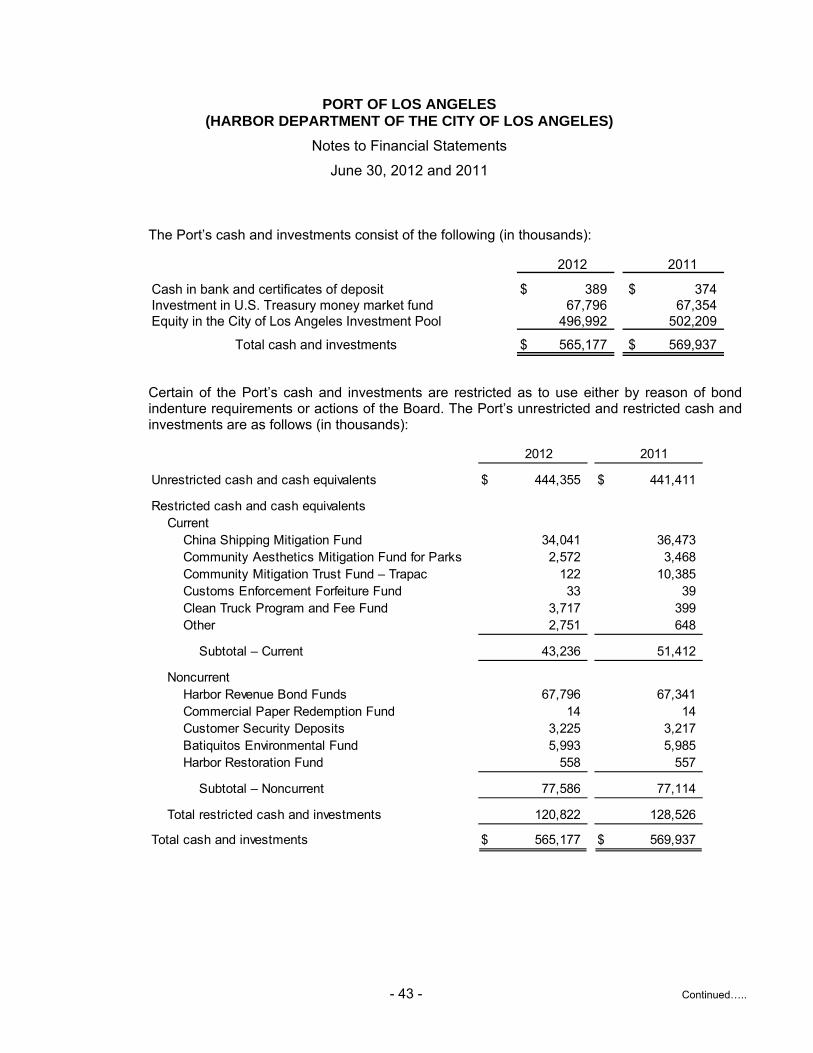
PORT OF LOS ANGELES (HARBOR DEPARTMENT OF THE CITY OF LOS ANGELES)
Notes to Financial Statements
June 30, 2012 and 2011
- 43 - Continued…..
The Port’s cash and investments consist of the following (in thousands):
2012 2011
Cash in bank and certificates of deposit $ 389 $ 374 Investment in U.S. Treasury money market fund 67,796 67,354 Equity in the City of Los Angeles Investment Pool 496,992 502,209
Total cash and investments $ 565,177 $ 569,937
Certain of the Port’s cash and investments are restricted as to use either by reason of bond indenture requirements or actions of the Board. The Port’s unrestricted and restricted cash and investments are as follows (in thousands):
2012 2011
Unrestricted cash and cash equivalents $ 444,355 $ 441,411
Restricted cash and cash equivalentsCurrent
China Shipping Mitigation Fund 34,041 36,473 Community Aesthetics Mitigation Fund for Parks 2,572 3,468 Community Mitigation Trust Fund – Trapac 122 10,385 Customs Enforcement Forfeiture Fund 33 39 Clean Truck Program and Fee Fund 3,717 399 Other 2,751 648
Subtotal – Current 43,236 51,412
NoncurrentHarbor Revenue Bond Funds 67,796 67,341 Commercial Paper Redemption Fund 14 14 Customer Security Deposits 3,225 3,217 Batiquitos Environmental Fund 5,993 5,985 Harbor Restoration Fund 558 557
Subtotal – Noncurrent 77,586 77,114
Total restricted cash and investments 120,822 128,526
Total cash and investments $ 565,177 $ 569,937
PORT OF LOS ANGELES (HARBOR DEPARTMENT OF THE CITY OF LOS ANGELES)
Notes to Financial Statements
June 30, 2012 and 2011
- 44 - Continued…..
B. Deposits – Custodial Credit Risk
The Port had cash deposits and certificates of deposit with several major financial institutions amounting to $0.4 million at June 30, 2012 and 2011, respectively. The deposits were entirely covered by federal depository insurance or collateralized by securities held by the financial institutions in the Port’s name in conformance with the State Government Code.
C. Investments Authorized by the City’s Investment Policy
Interest Rate Risk. The Policy limits the maturity of its investments to five years for U.S. Treasury and government agency securities, CD placement service, medium-term notes, collateralized bank deposits, mortgage pass-through securities, and bank/time deposits; one year for repurchase agreements; 270 days for commercial paper; 180 days for bankers’ acceptances, and 92 days for reverse repurchase agreements. The Policy also allows City funds with longer-term investments horizons, to be invested in securities that at the time of the investment have a term remaining to maturity in excess of five years, but with a maximum final maturity of thirty years.
Credit Risk. The Policy establishes minimum credit ratings requirement for investments. There is no credit quality requirement for local agency bonds, U.S. Treasury Obligations, State of California Obligations, California Local Agency Obligations, and U.S. Sponsored Agencies (U.S. government-sponsored enterprises) securities.
Medium-term notes must be issued by corporations organized and operating within the United States or by depository institutions licensed by the United States or any state and operating within the United States. Medium-term notes must have at least an “A” rating.
Commercial paper issues must have a minimum of “A-1” or equivalent rating. If the issuer has issued long-term debt, it must be rated “A” without regard to modifiers. Issuing corporation must be organized and operating within the United States and have assets in excess of $500 million.
Concentration of Credit Risk. The investment policy does not allow more than 40% of its investment portfolio be invested in commercial paper and bankers’ acceptances. The Policy further provides for a maximum concentration limit of 10% in any one issuer of commercial paper as well as in any one mutual fund, 30% in bankers’ acceptances of any one commercial bank, 30% in certificates of deposit and medium-term notes, and 20% in mutual funds, money market mutual funds, and mortgage pass-through securities. There is no percentage limitation on the amount that can be invested in the U.S. government agencies. The City’s pooled investments comply with these requirements.
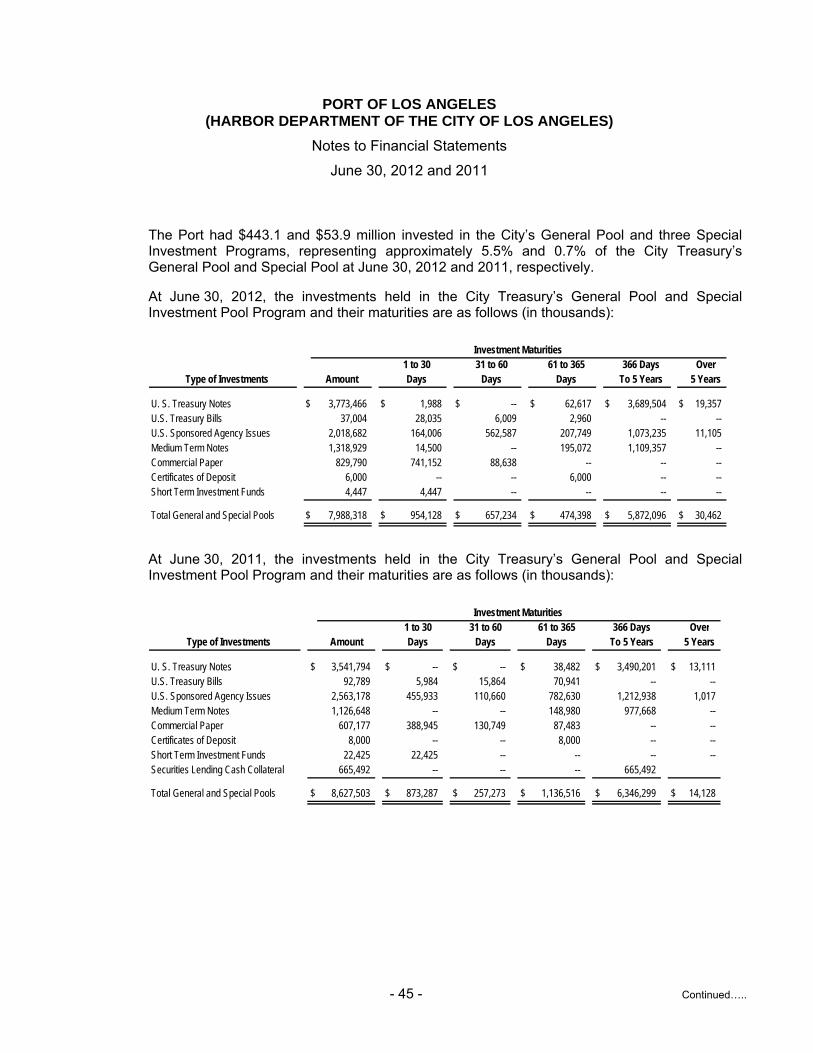
PORT OF LOS ANGELES (HARBOR DEPARTMENT OF THE CITY OF LOS ANGELES)
Notes to Financial Statements
June 30, 2012 and 2011
- 45 - Continued…..
The Port had $443.1 and $53.9 million invested in the City’s General Pool and three Special Investment Programs, representing approximately 5.5% and 0.7% of the City Treasury’s General Pool and Special Pool at June 30, 2012 and 2011, respectively.
At June 30, 2012, the investments held in the City Treasury’s General Pool and Special Investment Pool Program and their maturities are as follows (in thousands):
Investment Maturities 1 to 30 31 to 60 61 to 365 366 Days Over
Type of Investments Amount Days Days Days To 5 Years 5 Years
U. S. Treasury Notes $ 3,773,466 $ 1,988 $ -- $ 62,617 $ 3,689,504 $ 19,357 U.S. Treasury Bills 37,004 28,035 6,009 2,960 -- -- U.S. Sponsored Agency Issues 2,018,682 164,006 562,587 207,749 1,073,235 11,105 Medium Term Notes 1,318,929 14,500 -- 195,072 1,109,357 -- Commercial Paper 829,790 741,152 88,638 -- -- -- Certificates of Deposit 6,000 -- -- 6,000 -- -- Short Term Investment Funds 4,447 4,447 -- -- -- --
Total General and Special Pools $ 7,988,318 $ 954,128 $ 657,234 $ 474,398 $ 5,872,096 $ 30,462
At June 30, 2011, the investments held in the City Treasury’s General Pool and Special Investment Pool Program and their maturities are as follows (in thousands):
Investment Maturities 1 to 30 31 to 60 61 to 365 366 Days Over
Type of Investments Amount Days Days Days To 5 Years 5 Years
U. S. Treasury Notes $ 3,541,794 $ -- $ -- $ 38,482 $ 3,490,201 $ 13,111 U.S. Treasury Bills 92,789 5,984 15,864 70,941 -- -- U.S. Sponsored Agency Issues 2,563,178 455,933 110,660 782,630 1,212,938 1,017 Medium Term Notes 1,126,648 -- -- 148,980 977,668 -- Commercial Paper 607,177 388,945 130,749 87,483 -- -- Certificates of Deposit 8,000 -- -- 8,000 -- -- Short Term Investment Funds 22,425 22,425 -- -- -- -- Securities Lending Cash Collateral 665,492 -- -- -- 665,492
Total General and Special Pools $ 8,627,503 $ 873,287 $ 257,273 $ 1,136,516 $ 6,346,299 $ 14,128
PORT OF LOS ANGELES (HARBOR DEPARTMENT OF THE CITY OF LOS ANGELES)
Notes to Financial Statements
June 30, 2012 and 2011
- 46 - Continued…..
D. Special Pool Investments
The Port currently has three funds that are invested in the City’s Special Investment Pool. They are Emergency/ACTA Reserve Fund 751, Restoration Fund 70L, and Batiquitos Long-term Investment Fund 72W. Investments in the Special Investment Pool are managed in accordance with the Pool’s policy. If none exists, the Pool’s policy will be deemed to be the California State Government Code Sections 53600-53635 et seq. Funds in the three funds were solely invested in government agency securities with maturities of 182 days or less per Port instruction.
E. Other Investments
In each issuance of a parity obligation, the Port is required to establish a reserve fund with the trustee pursuant to the indenture. All moneys in the reserve funds or accounts shall be invested by the trustee solely in permitted investments. Permitted investments on deposit in the debt service reserve funds should be valued at fair market value and marked to market at least once per half year to meet the specific requirement under the indenture. Investments held in the debt service reserve funds shall mature no later than the final maturity of the bonds.
As a result of the annual evaluation of the reserve funds on or before August 1 of each year, in accordance with the Indenture of Trust (Indenture), the common reserve was $67.8 million at June 30, 2012 from $67.3 million at June 30, 2011. The majority of the reserve funds were invested at Federal Agency Securities rated “Aaa” by Moody’s and “AAA” by Standard & Poor’s (S&P), and U.S. treasuries.
Proceeds from any new money bonds should be invested in the “Permitted Investments” specified as follows: (1) direct obligations of the United States of America or obligations of the principal of and interest on which are unconditionally guaranteed by the United States of America; (2) bonds, debentures, notes, or other evidence of indebtedness issued or guaranteed by the federal or U.S. government agencies identified in the Indenture; (3) money market funds registered under the Federal Securities Act of 1933, and having a rating of AAAm-G, AAA-m, or AA-m by S&P and Aaa, Aa1, or Aa2 by Moody’s; (4) certificates of deposit issued by commercial bank, savings and loan associations, or mutual saving banks and secured at all times by collateral held by a third party; (5) certificates of deposits, savings accounts, deposit accounts, or money market deposits, which are fully insured by the Federal Deposit Insurance Corporation (FDIC), including the Bank Insurance Fund (BIF) and the Savings Association Insurance Fund (SAIF); (6) investment agreements including guaranteed investment contracts, forward purchase agreements, and reserve fund agreements with a provider whose long-term unsecured debt is rated not lower than the second highest rating category of Moody’s, and S&P; (7) commercial paper rated at the time of purchase, “Prime-1” by Moody’s, and “A-1” or better by S&P; (8) bonds or notes issued by any state or municipality, which are rated by Moody’s and S&P in one of the two highest rating categories assigned by such agencies; (9) federal funds or bankers acceptances with a maximum term of one year of any bank, which has an unsecured, uninsured, and unguaranteed obligation rating of “Prime-1” or “A3” or better by Moody’s and “A-1” or “A” or better by S&P; and (10) repurchase agreements between the department and a dealer bank and securities firm. The term of the repurchase agreement may be up to 30 days and the value of the collateral must be equal to 104% of the amount of cash transferred to the dealer bank plus accrued interest. If the value of securities held as collateral slips below 104% of the value of the cash transferred by the department, then additional cash and/or acceptable
PORT OF LOS ANGELES (HARBOR DEPARTMENT OF THE CITY OF LOS ANGELES)
Notes to Financial Statements
June 30, 2012 and 2011
- 47 - Continued…..
securities must be transferred. If, however, the securities used as collateral are the Federal National Mortgage Association (FNMA) or the Federal Home Loan Mortgage Corporation (FHLMC) then the value of collateral must equal to 105%.
F. City of Los Angeles Securities Lending Program
The Port participates in the City of Los Angeles Securities Lending Program (SLP). The SLP is permitted and limited under provision of California Government Code Section 53601. The City Council approved the SLP on October 22, 1991 under Council File No. 91-1860, which complies with the California Government Code. The objectives of the SLP are safety of loaned securities and prudent investment of cash collateral to enhance revenues from the investment program. The SLP is governed by a separate policy and guidelines.
The City’s custodial bank acts as the securities lending agent. In the event a counterparty defaults by reason of an act of insolvency, the bank shall take all actions that are necessary or appropriate to liquidate permitted investment and collateral in connection with such transaction and shall make a reasonable effort for within two business days (Replacement Period) to apply the proceeds thereof to the purchase of securities identical to the loaned securities not returned. If during the replacement period, the collateral liquidation proceeds are insufficient to replace any of the loaned securities not returned, the bank shall, subject to payment by the City of the amount of any losses on any permitted investments, pay such additional amounts as necessary to make such replacement.
Under the provisions of the SLP, and in accordance with the California Government Code, no more than 20% of the market value of the Pool shall be available for lending. The City receives cash as collateral on loaned securities, which is reinvested in securities permitted under the Policy.
In accordance with the California Government Code, the securities lending agent marks to market the value of both the collateral and the reinvestments daily. Except for open loans which either party can terminate a lending contract on demand, term loans shall have a maximum life of 92 days. Earnings from securities lending accrue to the Pool and are allocated on a pro rata basis to all Pool participants.
During fiscal year 2012, collateralizations on all loaned securities were compliant with the required 102% of the market value. The City can sell collateral securities only in the event of borrower default. The lending agent provides indemnification for borrower default. There were no violations of legal or contractual provisions and no borrower or lending agent default losses during the fiscal year. There was no credit risk exposure to the City because the amounts owed to the borrowers exceeded the amounts borrowed. Loaned securities are held by the City’s agents in the City’s name and are not subject to custodial credit risk.
The Port’s share in the assets and liabilities from the reinvested cash collateral amounted to $41.1 million in fiscal year 2011. On May 30, 2012, the City suspended its SLP due to ongoing negotiations of new terms at it relates to both custodial and securities lending with the Bank of New York. The City anticipates resuming the SLP in fiscal year 2013.

PORT OF LOS ANGELES (HARBOR DEPARTMENT OF THE CITY OF LOS ANGELES)
Notes to Financial Statements
June 30, 2012 and 2011
- 48 - Continued…..
4. Capital Assets
The Port’s capital assets consist of the following activities for fiscal year ended June 30, 2012 (in thousands):
Balance Retirements BalanceJuly 1, 2011 Additions and Disposals Transfers June 30, 2012
Capital assets not depreciatedLand $ 1,058,404 $ 13,994 $ -- $ -- $ 1,072,398 Construction in progress 524,158 129,338 -- (325,470) 328,026 Preliminary costs – capital --
projects 214,578 49,199 -- (111,800) 151,977 Intangible assets 12,900 4,053 -- -- 16,953
Total capital assetsnot depreciated 1,810,040 196,584 -- (437,270) 1,569,354
Capital assets depreciated/amortizedWharves and sheds 754,511 102,449 -- -- 856,960 Buildings/facilities 1,907,863 311,691 (14,333) -- 2,205,221 Equipment 98,679 18,105 (1,355) -- 115,429
Total capital assetsdepreciated/amortized 2,761,053 432,245 (15,688) -- 3,177,610
Less accumulated depreciation/amortizationWharves and sheds (339,999) (21,533) -- -- (361,532) Buildings/facilities (898,739) (67,916) 2,747 -- (963,908) Equipment (53,448) (11,035) 1,279 -- (63,204)
Total accumulateddepreciation/amortization (1,292,186) (100,484) 4,026 -- (1,388,644)
Total capital assets depreciated/amortized, net 1,468,867 331,761 (11,662) -- 1,788,966
Capital assets, net $ 3,278,907 $ 528,345 $ (11,662) $ (437,270) $ 3,358,320
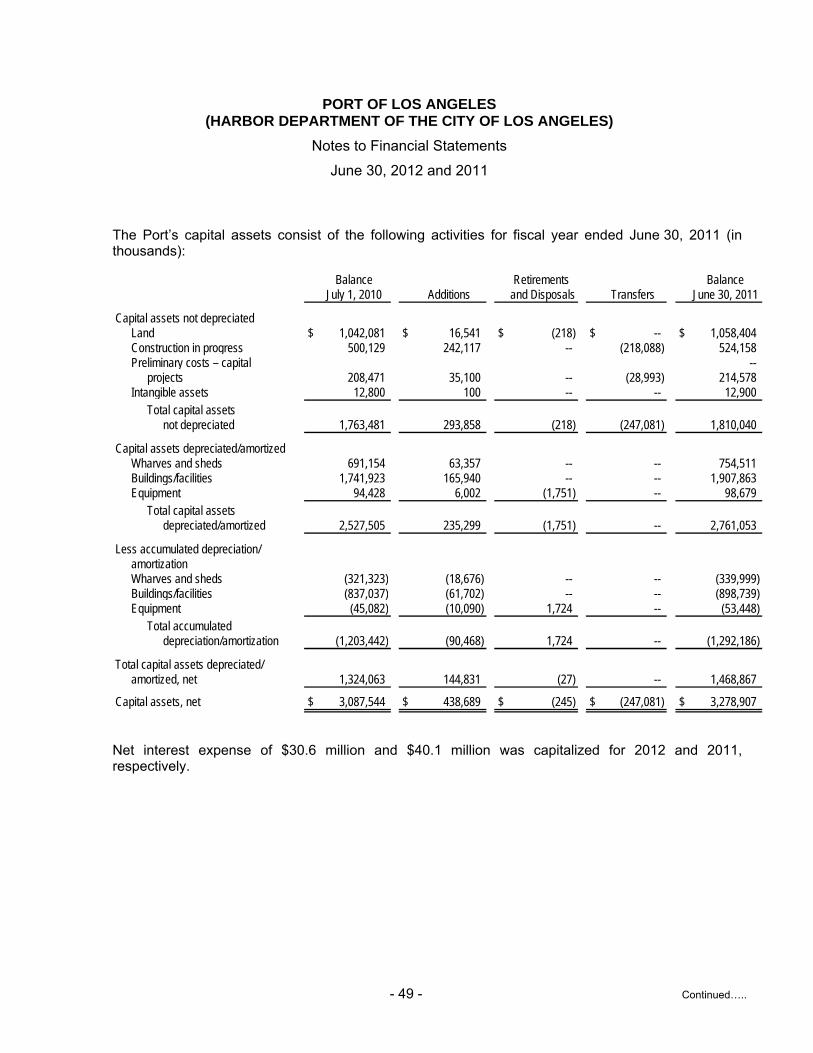
PORT OF LOS ANGELES (HARBOR DEPARTMENT OF THE CITY OF LOS ANGELES)
Notes to Financial Statements
June 30, 2012 and 2011
- 49 - Continued…..
The Port’s capital assets consist of the following activities for fiscal year ended June 30, 2011 (in thousands):
Balance Retirements BalanceJuly 1, 2010 Additions and Disposals Transfers June 30, 2011
Capital assets not depreciatedLand $ 1,042,081 $ 16,541 $ (218) $ -- $ 1,058,404 Construction in progress 500,129 242,117 -- (218,088) 524,158 Preliminary costs – capital --
projects 208,471 35,100 -- (28,993) 214,578 Intangible assets 12,800 100 -- -- 12,900
Total capital assetsnot depreciated 1,763,481 293,858 (218) (247,081) 1,810,040
Capital assets depreciated/amortizedWharves and sheds 691,154 63,357 -- -- 754,511 Buildings/facilities 1,741,923 165,940 -- -- 1,907,863 Equipment 94,428 6,002 (1,751) -- 98,679
Total capital assetsdepreciated/amortized 2,527,505 235,299 (1,751) -- 2,761,053
Less accumulated depreciation/amortizationWharves and sheds (321,323) (18,676) -- -- (339,999) Buildings/facilities (837,037) (61,702) -- -- (898,739) Equipment (45,082) (10,090) 1,724 -- (53,448)
Total accumulateddepreciation/amortization (1,203,442) (90,468) 1,724 -- (1,292,186)
Total capital assets depreciated/amortized, net 1,324,063 144,831 (27) -- 1,468,867
Capital assets, net $ 3,087,544 $ 438,689 $ (245) $ (247,081) $ 3,278,907
Net interest expense of $30.6 million and $40.1 million was capitalized for 2012 and 2011, respectively.
PORT OF LOS ANGELES (HARBOR DEPARTMENT OF THE CITY OF LOS ANGELES)
Notes to Financial Statements
June 30, 2012 and 2011
- 50 - Continued…..
5. Investment in Joint Powers Authorities and Other Entities
The Port has entered into two joint exercise of powers agreements as follows:
A. Intermodal Container Transfer Facility Joint Powers Authority
The Port of Los Angeles (the POLA) and the Harbor Department of the City of Long Beach, California (POLB) entered into a joint exercise of powers agreement to form the Intermodal Container Transfer Facility Joint Powers Authority (ICTF) for the purpose of financing and constructing a facility to transfer cargo containers between trucks and railroad cars. The POLA contributed $2.5 million to the ICTF as part of the agreement. The facility, which began operations in December 1986, was developed by Southern Pacific Transportation Company (SPTC, subsequently a wholly owned subsidiary of Union Pacific Corporation), which operates the facility under a long-term lease agreement. The POLA appoints two members of the ICTF’s five-member governing board and accounts for its investment using the equity method. Both the POLA and POLB share income and equity distributions equally.
Pursuant to an indenture of trust dated November 1, 1984, the ICTF issued $53.9 million in bonds (1984 Bonds) on behalf of the SPTC to construct the facility. In 1989, the ICTF issued $52.3 million in refunding bonds (1989 Bonds) on behalf of the SPTC to advance refund all of the 1984 Bonds. In 1999, the ICTF, on behalf of the SPTC, again issued $42.9 million of refunding bonds (1999 Bonds) to advance refund all of the 1989 Bonds. The 1999 Bonds are payable solely from payments by the SPTC under the lease agreement for use of the facility. The nature of the bonds is such that the indebtedness is that of the SPTC and not of the ICTF, nor the POLA, nor POLB.
The ICTF’s operations are financed from lease revenues by ICTF activities. The ICTF is empowered to perform those actions necessary for the development of its facilities and related facilities, including acquiring, constructing, leasing, and selling any of its property. The Port’s share of the ICTF’s net assets at June 30, 2012 and 2011 totaled $5.0 million and $6.2 million, respectively. Separate financial statements for ICTF may be obtained from the Executive Director, Port of Long Beach, 925 Harbor Plaza, Long Beach, California 90802.
B. Alameda Corridor Transportation Authority
In August 1989, the POLA and the POLB entered into a joint exercise of powers agreement and formed the Alameda Corridor Transportation Authority (ACTA) for the purpose of establishing a comprehensive transportation corridor and related facilities consisting of street and railroad rights-of-way and an improved highway and railroad network along Alameda Street between the Santa Monica Freeway and the POLA and POLB in San Pedro Bay linking the two ports to the central Los Angeles area.
During fiscal year 1995, the POLA and POLB purchased railroad rights-of-way and other assets totaling $370.0 million along the proposed corridor route.
At June 30, 1998, the POLA had advanced a total of $13.3 million to the ACTA to fund its share of planning and other costs incurred to date. During fiscal year 1999, the ACTA reimbursed the POLA for all amounts advanced plus approximately $3.2 million of interest on such advances
PORT OF LOS ANGELES (HARBOR DEPARTMENT OF THE CITY OF LOS ANGELES)
Notes to Financial Statements
June 30, 2012 and 2011
- 51 - Continued…..
out of debt or grant financing proceeds. In addition, the ACTA reimbursed the POLA for approximately $81.7 million of capital assets directly related to the ACTA’s mission, which the POLA had previously included in construction in progress. Of the capital assets transferred, approximately $22.2 million had been funded by capital grants, which the POLA had previously included in contributions/land valuation equity.
The POLA and POLB share income and equity distributions equally. If ACTA revenues are insufficient to pay ACTA debt obligations, the Port will severally but not jointly with the POLB pay up to 20% of any shortfall of that obligation on an annual basis. The POLA has no share of the ACTA’s net assets and income at June 30, 2012 and 2011, and accordingly, they have not been recorded in the accompanying financial statements. Any payments made to ACTA are in the form of an advance and subordinated to other obligations of POLA. POLA paid $3.0 million in shortfall payments in fiscal year 2012, and will pay another $3.0 million in fiscal year 2013. Shortfall payments beyond fiscal year 2013 are not expected to occur until fiscal year 2020, at which time, payments are projected to be made each year over a four-year period. The Port does not expect that the projected future shortfall payments will have a material effect on its financial statements.
Separate financial statements for ACTA may be obtained from the Chief Financial Officer, Alameda Corridor Transportation Authority, One Civic Plaza Drive, Suite 350, Carson, California 90745.
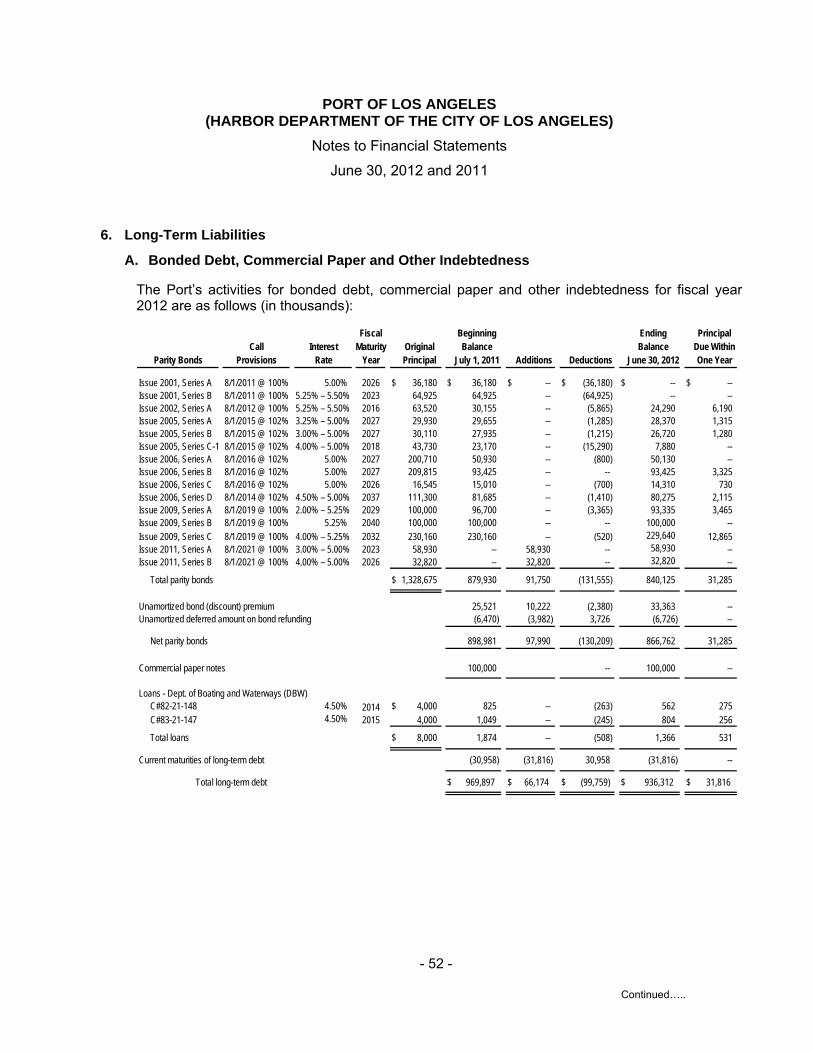
PORT OF LOS ANGELES (HARBOR DEPARTMENT OF THE CITY OF LOS ANGELES)
Notes to Financial Statements
June 30, 2012 and 2011
- 52 -
Continued…..
6. Long-Term Liabilities
A. Bonded Debt, Commercial Paper and Other Indebtedness
The Port’s activities for bonded debt, commercial paper and other indebtedness for fiscal year 2012 are as follows (in thousands):
Fiscal Beginning Ending PrincipalCall Interest Maturity Original Balance Balance Due Within
Parity Bonds Provisions Rate Year Principal July 1, 2011 Additions Deductions June 30, 2012 One Year
Issue 2001, Series A 8/1/2011 @ 100% 5.00% 2026 $ 36,180 $ 36,180 $ -- $ (36,180) $ -- $ -- Issue 2001, Series B 8/1/2011 @ 100% 5.25% – 5.50% 2023 64,925 64,925 -- (64,925) -- -- Issue 2002, Series A 8/1/2012 @ 100% 5.25% – 5.50% 2016 63,520 30,155 -- (5,865) 24,290 6,190 Issue 2005, Series A 8/1/2015 @ 102% 3.25% – 5.00% 2027 29,930 29,655 -- (1,285) 28,370 1,315 Issue 2005, Series B 8/1/2015 @ 102% 3.00% – 5.00% 2027 30,110 27,935 -- (1,215) 26,720 1,280 Issue 2005, Series C-1 8/1/2015 @ 102% 4.00% – 5.00% 2018 43,730 23,170 -- (15,290) 7,880 -- Issue 2006, Series A 8/1/2016 @ 102% 5.00% 2027 200,710 50,930 -- (800) 50,130 -- Issue 2006, Series B 8/1/2016 @ 102% 5.00% 2027 209,815 93,425 -- -- 93,425 3,325 Issue 2006, Series C 8/1/2016 @ 102% 5.00% 2026 16,545 15,010 -- (700) 14,310 730 Issue 2006, Series D 8/1/2014 @ 102% 4.50% – 5.00% 2037 111,300 81,685 -- (1,410) 80,275 2,115 Issue 2009, Series A 8/1/2019 @ 100% 2.00% – 5.25% 2029 100,000 96,700 -- (3,365) 93,335 3,465 Issue 2009, Series B 8/1/2019 @ 100% 5.25% 2040 100,000 100,000 -- -- 100,000 -- Issue 2009, Series C 8/1/2019 @ 100% 4.00% – 5.25% 2032 230,160 230,160 -- (520) 229,640 12,865 Issue 2011, Series A 8/1/2021 @ 100% 3.00% – 5.00% 2023 58,930 -- 58,930 -- 58,930 -- Issue 2011, Series B 8/1/2021 @ 100% 4.00% – 5.00% 2026 32,820 -- 32,820 -- 32,820 --
Total parity bonds $ 1,328,675 879,930 91,750 (131,555) 840,125 31,285
Unamortized bond (discount) premium 25,521 10,222 (2,380) 33,363 -- Unamortized deferred amount on bond refunding (6,470) (3,982) 3,726 (6,726) --
Net parity bonds 898,981 97,990 (130,209) 866,762 31,285
Commercial paper notes 100,000 -- 100,000 --
Loans - Dept. of Boating and Waterways (DBW)C#82-21-148 4.50% 2014 $ 4,000 825 -- (263) 562 275 C#83-21-147 4.50% 2015 4,000 1,049 -- (245) 804 256
Total loans $ 8,000 1,874 -- (508) 1,366 531
Current maturities of long-term debt (30,958) (31,816) 30,958 (31,816) --
Total long-term debt $ 969,897 $ 66,174 $ (99,759) $ 936,312 $ 31,816
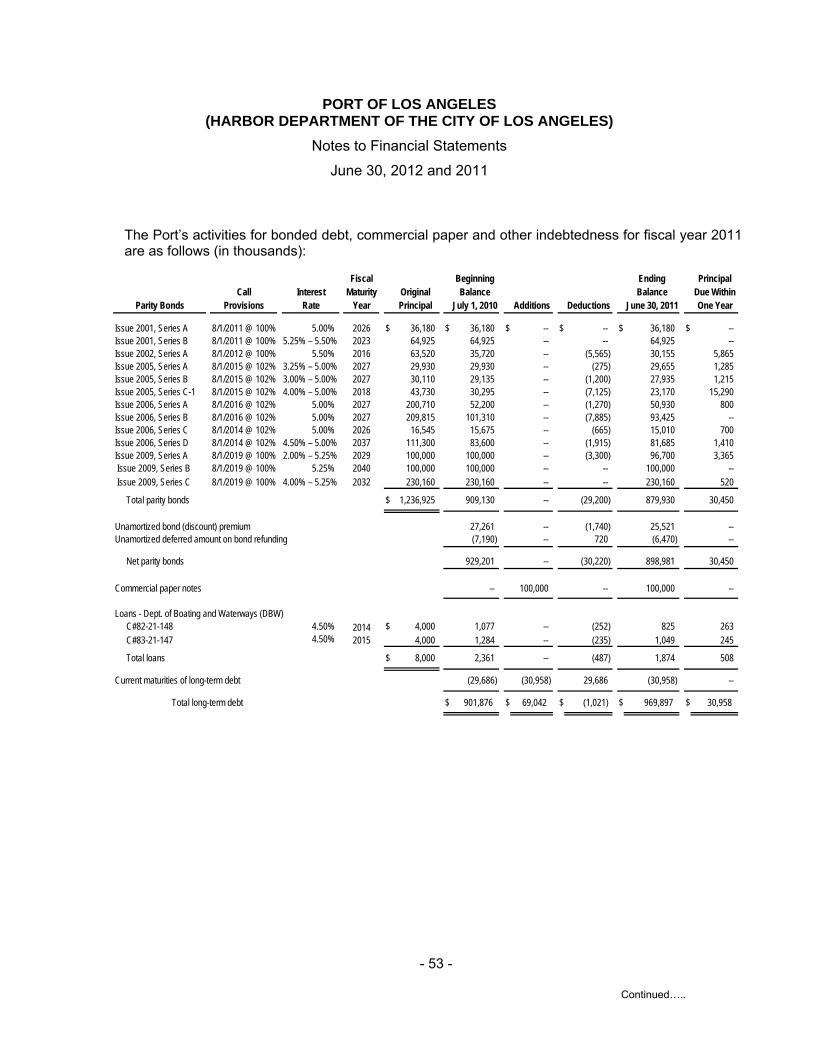
PORT OF LOS ANGELES (HARBOR DEPARTMENT OF THE CITY OF LOS ANGELES)
Notes to Financial Statements
June 30, 2012 and 2011
- 53 -
Continued…..
The Port’s activities for bonded debt, commercial paper and other indebtedness for fiscal year 2011 are as follows (in thousands):
Fiscal Beginning Ending PrincipalCall Interest Maturity Original Balance Balance Due Within
Parity Bonds Provisions Rate Year Principal July 1, 2010 Additions Deductions June 30, 2011 One Year
Issue 2001, Series A 8/1/2011 @ 100% 5.00% 2026 $ 36,180 $ 36,180 $ -- $ -- $ 36,180 $ -- Issue 2001, Series B 8/1/2011 @ 100% 5.25% – 5.50% 2023 64,925 64,925 -- -- 64,925 -- Issue 2002, Series A 8/1/2012 @ 100% 5.50% 2016 63,520 35,720 -- (5,565) 30,155 5,865 Issue 2005, Series A 8/1/2015 @ 102% 3.25% – 5.00% 2027 29,930 29,930 -- (275) 29,655 1,285 Issue 2005, Series B 8/1/2015 @ 102% 3.00% – 5.00% 2027 30,110 29,135 -- (1,200) 27,935 1,215 Issue 2005, Series C-1 8/1/2015 @ 102% 4.00% – 5.00% 2018 43,730 30,295 -- (7,125) 23,170 15,290 Issue 2006, Series A 8/1/2016 @ 102% 5.00% 2027 200,710 52,200 -- (1,270) 50,930 800 Issue 2006, Series B 8/1/2016 @ 102% 5.00% 2027 209,815 101,310 -- (7,885) 93,425 -- Issue 2006, Series C 8/1/2014 @ 102% 5.00% 2026 16,545 15,675 -- (665) 15,010 700 Issue 2006, Series D 8/1/2014 @ 102% 4.50% – 5.00% 2037 111,300 83,600 -- (1,915) 81,685 1,410 Issue 2009, Series A 8/1/2019 @ 100% 2.00% – 5.25% 2029 100,000 100,000 -- (3,300) 96,700 3,365 Issue 2009, Series B 8/1/2019 @ 100% 5.25% 2040 100,000 100,000 -- -- 100,000 -- Issue 2009, Series C 8/1/2019 @ 100% 4.00% – 5.25% 2032 230,160 230,160 -- -- 230,160 520
Total parity bonds $ 1,236,925 909,130 -- (29,200) 879,930 30,450
Unamortized bond (discount) premium 27,261 -- (1,740) 25,521 -- Unamortized deferred amount on bond refunding (7,190) -- 720 (6,470) --
Net parity bonds 929,201 -- (30,220) 898,981 30,450
Commercial paper notes -- 100,000 -- 100,000 --
Loans - Dept. of Boating and Waterways (DBW)C#82-21-148 4.50% 2014 $ 4,000 1,077 -- (252) 825 263 C#83-21-147 4.50% 2015 4,000 1,284 -- (235) 1,049 245
Total loans $ 8,000 2,361 -- (487) 1,874 508
Current maturities of long-term debt (29,686) (30,958) 29,686 (30,958) --
Total long-term debt $ 901,876 $ 69,042 $ (1,021) $ 969,897 $ 30,958
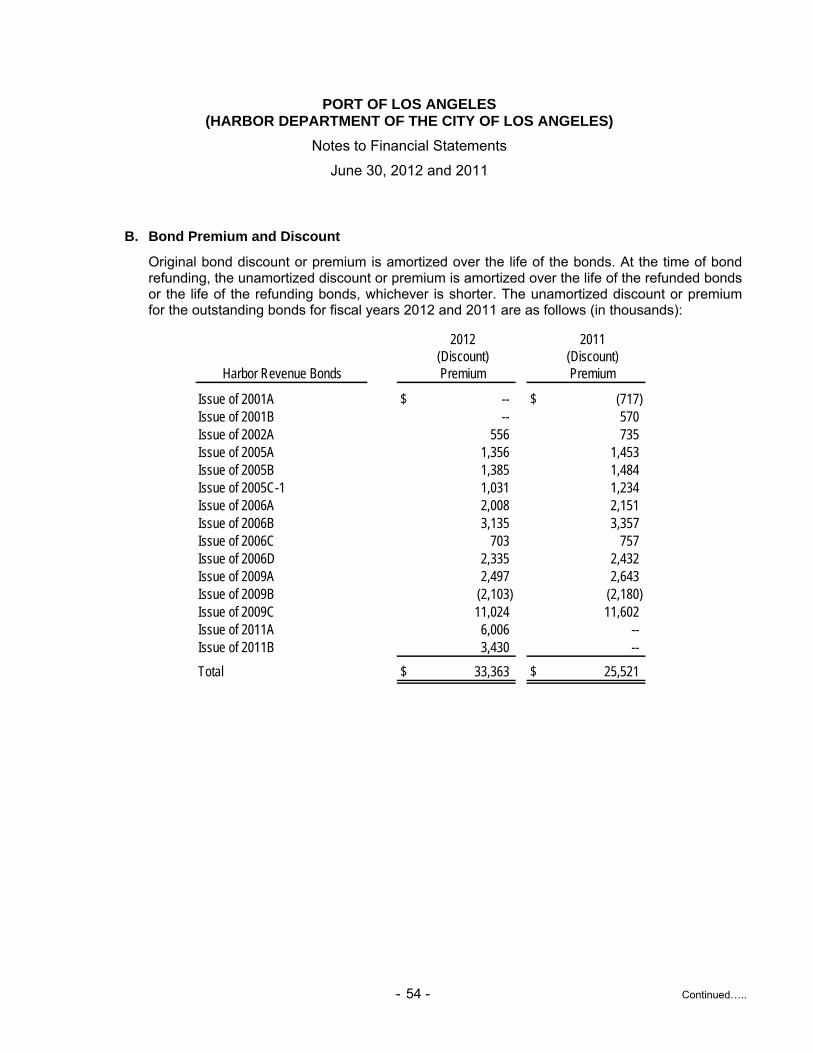
PORT OF LOS ANGELES (HARBOR DEPARTMENT OF THE CITY OF LOS ANGELES)
Notes to Financial Statements
June 30, 2012 and 2011
- 54 - Continued…..
B. Bond Premium and Discount
Original bond discount or premium is amortized over the life of the bonds. At the time of bond refunding, the unamortized discount or premium is amortized over the life of the refunded bonds or the life of the refunding bonds, whichever is shorter. The unamortized discount or premium for the outstanding bonds for fiscal years 2012 and 2011 are as follows (in thousands):
2012 2011(Discount) (Discount)
Harbor Revenue Bonds Premium Premium
Issue of 2001A $ -- $ (717) Issue of 2001B -- 570 Issue of 2002A 556 735 Issue of 2005A 1,356 1,453 Issue of 2005B 1,385 1,484 Issue of 2005C-1 1,031 1,234 Issue of 2006A 2,008 2,151 Issue of 2006B 3,135 3,357 Issue of 2006C 703 757 Issue of 2006D 2,335 2,432 Issue of 2009A 2,497 2,643 Issue of 2009B (2,103) (2,180) Issue of 2009C 11,024 11,602 Issue of 2011A 6,006 -- Issue of 2011B 3,430 --
Total $ 33,363 $ 25,521
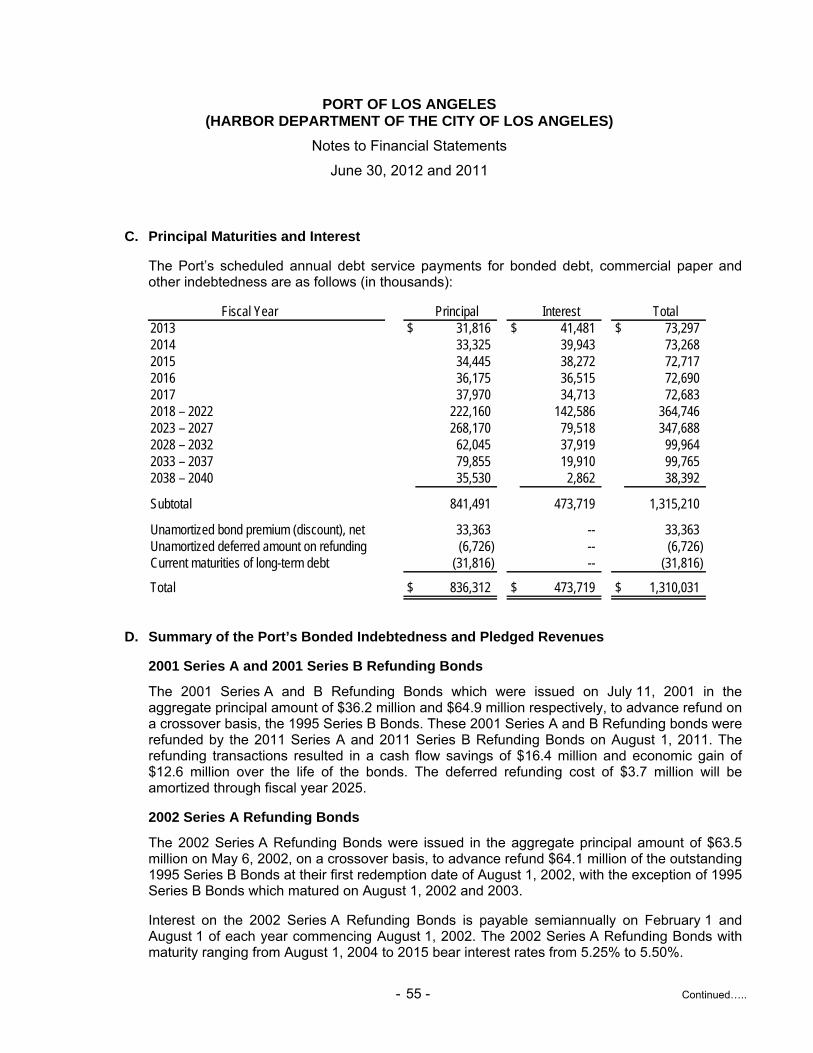
PORT OF LOS ANGELES (HARBOR DEPARTMENT OF THE CITY OF LOS ANGELES)
Notes to Financial Statements
June 30, 2012 and 2011
- 55 - Continued…..
C. Principal Maturities and Interest
The Port’s scheduled annual debt service payments for bonded debt, commercial paper and other indebtedness are as follows (in thousands):
Fiscal Year Principal Interest Total2013 $ 31,816 $ 41,481 $ 73,297 2014 33,325 39,943 73,268 2015 34,445 38,272 72,717 2016 36,175 36,515 72,690 2017 37,970 34,713 72,683 2018 – 2022 222,160 142,586 364,746 2023 – 2027 268,170 79,518 347,688 2028 – 2032 62,045 37,919 99,964 2033 – 2037 79,855 19,910 99,765 2038 – 2040 35,530 2,862 38,392
Subtotal 841,491 473,719 1,315,210
Unamortized bond premium (discount), net 33,363 -- 33,363 Unamortized deferred amount on refunding (6,726) -- (6,726) Current maturities of long-term debt (31,816) -- (31,816)
Total $ 836,312 $ 473,719 $ 1,310,031
D. Summary of the Port’s Bonded Indebtedness and Pledged Revenues
2001 Series A and 2001 Series B Refunding Bonds
The 2001 Series A and B Refunding Bonds which were issued on July 11, 2001 in the aggregate principal amount of $36.2 million and $64.9 million respectively, to advance refund on a crossover basis, the 1995 Series B Bonds. These 2001 Series A and B Refunding bonds were refunded by the 2011 Series A and 2011 Series B Refunding Bonds on August 1, 2011. The refunding transactions resulted in a cash flow savings of $16.4 million and economic gain of $12.6 million over the life of the bonds. The deferred refunding cost of $3.7 million will be amortized through fiscal year 2025.
2002 Series A Refunding Bonds
The 2002 Series A Refunding Bonds were issued in the aggregate principal amount of $63.5 million on May 6, 2002, on a crossover basis, to advance refund $64.1 million of the outstanding 1995 Series B Bonds at their first redemption date of August 1, 2002, with the exception of 1995 Series B Bonds which matured on August 1, 2002 and 2003.
Interest on the 2002 Series A Refunding Bonds is payable semiannually on February 1 and August 1 of each year commencing August 1, 2002. The 2002 Series A Refunding Bonds with maturity ranging from August 1, 2004 to 2015 bear interest rates from 5.25% to 5.50%.
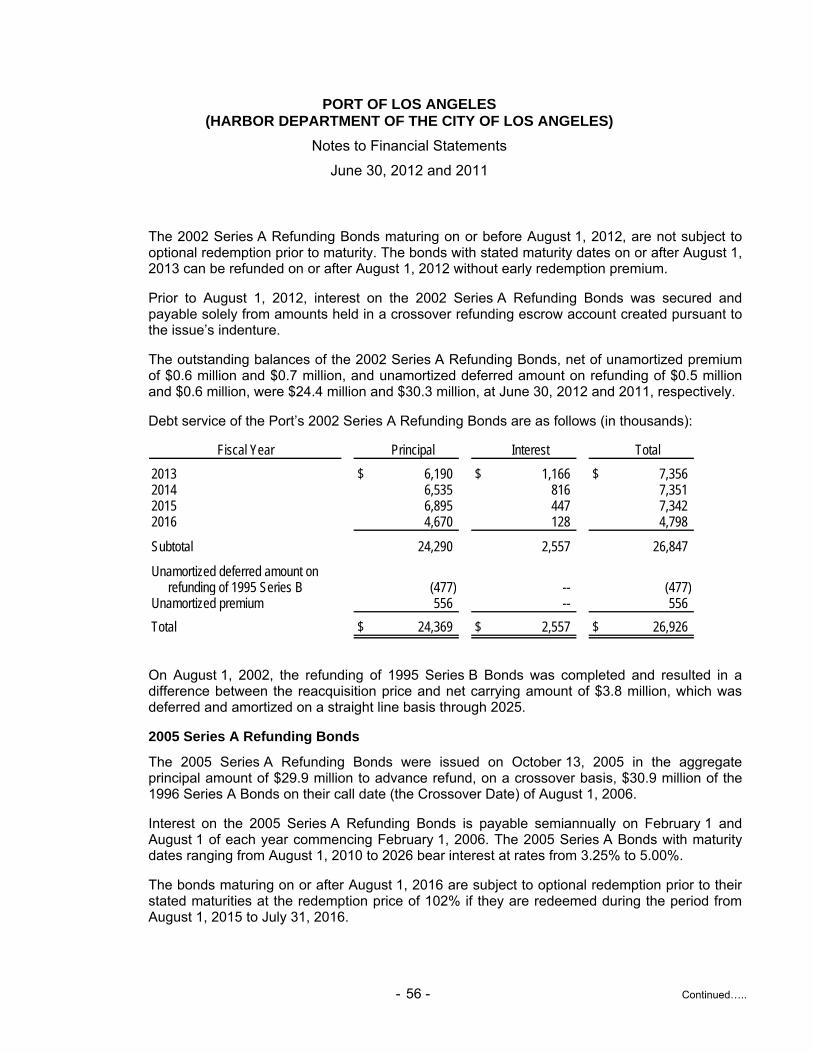
PORT OF LOS ANGELES (HARBOR DEPARTMENT OF THE CITY OF LOS ANGELES)
Notes to Financial Statements
June 30, 2012 and 2011
- 56 - Continued…..
The 2002 Series A Refunding Bonds maturing on or before August 1, 2012, are not subject to optional redemption prior to maturity. The bonds with stated maturity dates on or after August 1, 2013 can be refunded on or after August 1, 2012 without early redemption premium.
Prior to August 1, 2012, interest on the 2002 Series A Refunding Bonds was secured and payable solely from amounts held in a crossover refunding escrow account created pursuant to the issue’s indenture.
The outstanding balances of the 2002 Series A Refunding Bonds, net of unamortized premium of $0.6 million and $0.7 million, and unamortized deferred amount on refunding of $0.5 million and $0.6 million, were $24.4 million and $30.3 million, at June 30, 2012 and 2011, respectively.
Debt service of the Port’s 2002 Series A Refunding Bonds are as follows (in thousands):
Fiscal Year Principal Interest Total
2013 $ 6,190 $ 1,166 $ 7,356 2014 6,535 816 7,351 2015 6,895 447 7,342 2016 4,670 128 4,798
Subtotal 24,290 2,557 26,847
Unamortized deferred amount onrefunding of 1995 Series B (477) -- (477)
Unamortized premium 556 -- 556
Total $ 24,369 $ 2,557 $ 26,926
On August 1, 2002, the refunding of 1995 Series B Bonds was completed and resulted in a difference between the reacquisition price and net carrying amount of $3.8 million, which was deferred and amortized on a straight line basis through 2025.
2005 Series A Refunding Bonds
The 2005 Series A Refunding Bonds were issued on October 13, 2005 in the aggregate principal amount of $29.9 million to advance refund, on a crossover basis, $30.9 million of the 1996 Series A Bonds on their call date (the Crossover Date) of August 1, 2006.
Interest on the 2005 Series A Refunding Bonds is payable semiannually on February 1 and August 1 of each year commencing February 1, 2006. The 2005 Series A Bonds with maturity dates ranging from August 1, 2010 to 2026 bear interest at rates from 3.25% to 5.00%.
The bonds maturing on or after August 1, 2016 are subject to optional redemption prior to their stated maturities at the redemption price of 102% if they are redeemed during the period from August 1, 2015 to July 31, 2016.
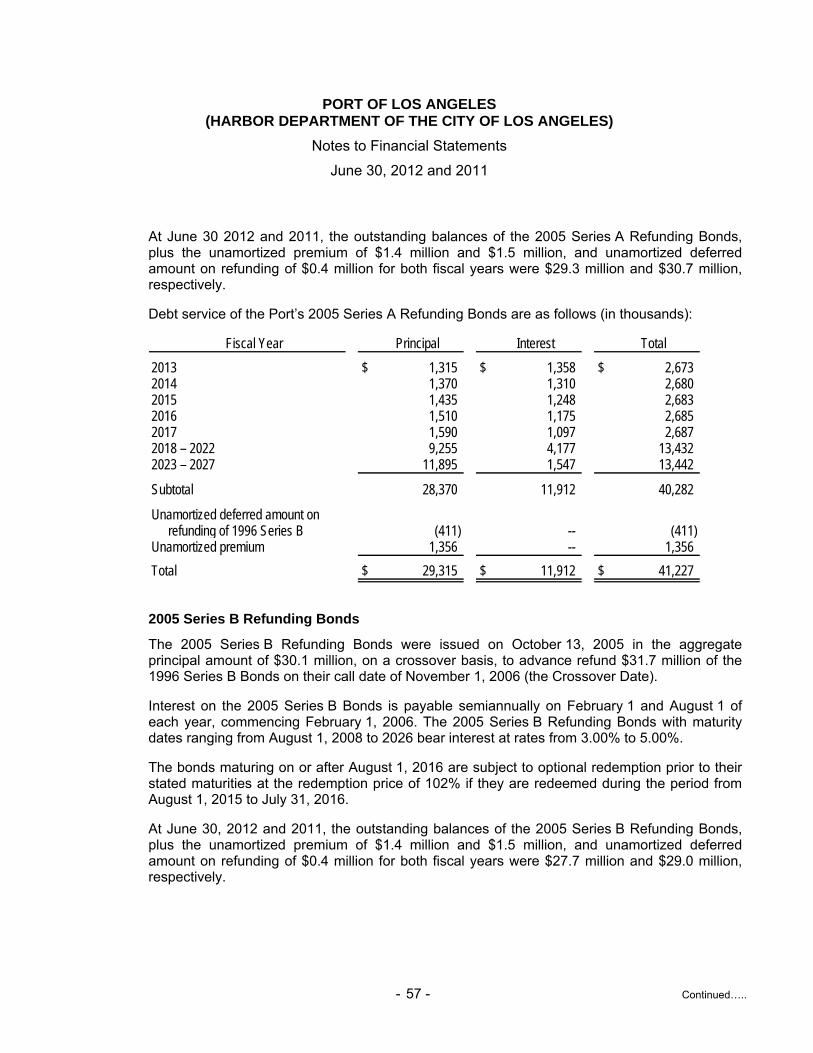
PORT OF LOS ANGELES (HARBOR DEPARTMENT OF THE CITY OF LOS ANGELES)
Notes to Financial Statements
June 30, 2012 and 2011
- 57 - Continued…..
At June 30 2012 and 2011, the outstanding balances of the 2005 Series A Refunding Bonds, plus the unamortized premium of $1.4 million and $1.5 million, and unamortized deferred amount on refunding of $0.4 million for both fiscal years were $29.3 million and $30.7 million, respectively.
Debt service of the Port’s 2005 Series A Refunding Bonds are as follows (in thousands):
Fiscal Year Principal Interest Total
2013 $ 1,315 $ 1,358 $ 2,673 2014 1,370 1,310 2,680 2015 1,435 1,248 2,683 2016 1,510 1,175 2,685 2017 1,590 1,097 2,687 2018 – 2022 9,255 4,177 13,432 2023 – 2027 11,895 1,547 13,442
Subtotal 28,370 11,912 40,282
Unamortized deferred amount onrefunding of 1996 Series B (411) -- (411)
Unamortized premium 1,356 -- 1,356
Total $ 29,315 $ 11,912 $ 41,227
2005 Series B Refunding Bonds
The 2005 Series B Refunding Bonds were issued on October 13, 2005 in the aggregate principal amount of $30.1 million, on a crossover basis, to advance refund $31.7 million of the 1996 Series B Bonds on their call date of November 1, 2006 (the Crossover Date).
Interest on the 2005 Series B Bonds is payable semiannually on February 1 and August 1 of each year, commencing February 1, 2006. The 2005 Series B Refunding Bonds with maturity dates ranging from August 1, 2008 to 2026 bear interest at rates from 3.00% to 5.00%.
The bonds maturing on or after August 1, 2016 are subject to optional redemption prior to their stated maturities at the redemption price of 102% if they are redeemed during the period from August 1, 2015 to July 31, 2016.
At June 30, 2012 and 2011, the outstanding balances of the 2005 Series B Refunding Bonds, plus the unamortized premium of $1.4 million and $1.5 million, and unamortized deferred amount on refunding of $0.4 million for both fiscal years were $27.7 million and $29.0 million, respectively.
PORT OF LOS ANGELES (HARBOR DEPARTMENT OF THE CITY OF LOS ANGELES)
Notes to Financial Statements
June 30, 2012 and 2011
- 58 - Continued…..
Debt service of the Port’s 2005 Series B Refunding Bonds are as follows (in thousands):
Fiscal Year Principal Interest Total
2013 $ 1,280 $ 1,284 $ 2,564 2014 1,345 1,232 2,577 2015 1,415 1,169 2,584 2016 1,490 1,097 2,587 2017 1,565 1,020 2,585 2018 – 2022 9,105 3,814 12,919 2023 – 2027 10,520 1,256 11,776
Subtotal 26,720 10,872 37,592
Unamortized deferred amount onrefunding of 1996 Series B (395) -- (395)
Unamortized premium 1,385 -- 1,385
Total $ 27,710 $ 10,872 $ 38,582
2005 Series C-1 Refunding Bonds
The 2005 Series C-1 Refunding Bonds were issued on October 13, 2005 in the aggregate principal amount of $43.7 million, to reimburse Citigroup and De La Rosa for fees associated with the purchase on the open market of the purchased 1996 Bonds.
Interest on the 2005 Series C-1 Refunding Bonds is payable semiannually on February 1 and August 1 of each year, commencing February 1, 2006. The 2005 Series C-1 Bonds with maturity dates ranging from August 1, 2006 to August 1, 2017 bear interest at rates from 4.00% to 5.00%.
The bonds maturing on or after August 1, 2017 shall be subject to optional redemption prior to their stated maturities at the redemption price of 102% if they are redeemed during the period from August 1, 2015 to July 31, 2016.
The 2005 Series C-2 Refunding Bonds were issued for $4.1 million to pay certain issuance costs. The 2005 Series C-2 Bonds Refunding Bonds were sold at a rate of 4.75%.
To take advantage of the American Recovery and Reinvestment Act (ARRA) of 2009, the Port issued the 2009 Series C (Non-AMT) Refunding Bonds in an aggregate amount of $230.2 million on July 9, 2009. A portion of the Refunding bond proceeds was to provide funds to refund $2.7 million of the 2005 Series C-1 AMT Bonds.
The outstanding balances of the 2005 Series C-1 Refunding Bonds, net of unamortized premium of $1.0 million and $1.2 million, and unamortized deferred amount on refunding of $0.7 million and $0.9 million, were $8.2 million and $23.5 million at June 30, 2012 and 2011, respectively.
PORT OF LOS ANGELES (HARBOR DEPARTMENT OF THE CITY OF LOS ANGELES)
Notes to Financial Statements
June 30, 2012 and 2011
- 59 - Continued…..
Debt service of the Port’s 2005 Series C-1 Refunding Bonds are as follows (in thousands):
Fiscal Year Principal Interest Total
2013 $ -- $ 389 $ 389 2014 -- 389 389 2015 470 380 850 2016 -- 371 371 2017 -- 371 371 2018 7,410 185 7,595
Subtotal 7,880 2,085 9,965
Unamortized deferred amount onrefunding of 1996 Series A and1996 Series B (718) -- (718)
Unamortized premium 1,031 -- 1,031
Total $ 8,193 $ 2,085 $ 10,278
The 2005 Series A, B, and C refunding transactions resulted in an economic gain of $4.0 million and a cash savings of $6.1 million.
2006 Series A Refunding Bonds
The 2006 Series A Refunding Bonds were issued on May 4, 2006 in the aggregate principal amount of $200.7 million, on a forward-delivery basis, to currently refund $202.7 million of the 1996A Bonds. The 2006 Series A refunding transactions resulted in an economic gain of $27.7 million and cash savings of $44.8 million.
Interest on the 2006 Series A Refunding Bonds is payable semiannually on February 1 and August 1 of each year. Principal and interest are payable commencing August 1, 2006. The 2006 Series A Bonds bear interest at rate of 5.00% with maturity dates ranging from August 1, 2006 to August 1, 2026.
The bonds maturing on or after August 1, 2017 shall be subject to optional redemption prior to their maturities at the redemption price of 102% if they are redeemed during the period from August 1, 2016 to July 31, 2017.
To take advantage of the ARRA, the Port issued the 2009 Series C (Non-AMT) Refunding Bonds on July 9, 2009. A portion of the 2009 Refunding Bond proceeds was to provide funds to refund $121.1 million of the 2006 Series A AMT Bonds.
At June 30, 2012 and 2011, the outstanding balances of the 2006 Series A Refunding Bonds, net of unamortized premium of $2.0 million and $2.2 million, and unamortized deferred amount on refunding of $0.9 million for both fiscal years, were $51.3 million and $52.1 million respectively.
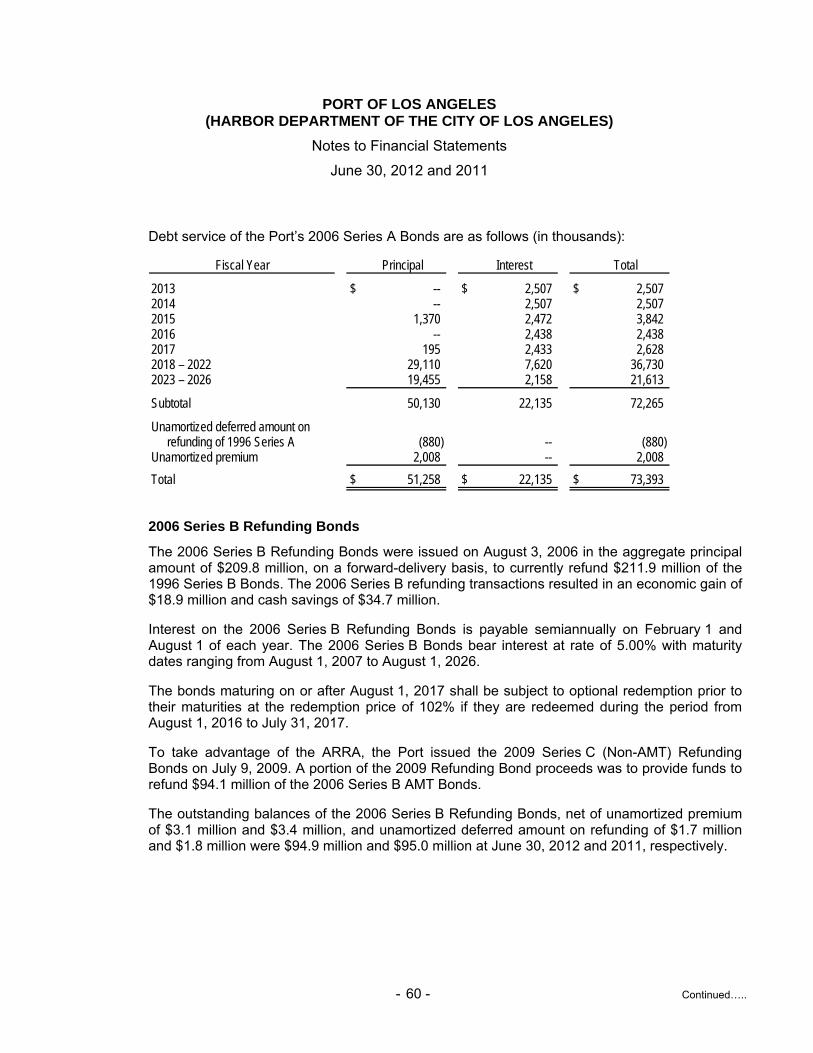
PORT OF LOS ANGELES (HARBOR DEPARTMENT OF THE CITY OF LOS ANGELES)
Notes to Financial Statements
June 30, 2012 and 2011
- 60 - Continued…..
Debt service of the Port’s 2006 Series A Bonds are as follows (in thousands):
Fiscal Year Principal Interest Total
2013 $ -- $ 2,507 $ 2,507 2014 -- 2,507 2,507 2015 1,370 2,472 3,842 2016 -- 2,438 2,438 2017 195 2,433 2,628 2018 – 2022 29,110 7,620 36,730 2023 – 2026 19,455 2,158 21,613
Subtotal 50,130 22,135 72,265
Unamortized deferred amount onrefunding of 1996 Series A (880) -- (880)
Unamortized premium 2,008 -- 2,008
Total $ 51,258 $ 22,135 $ 73,393
2006 Series B Refunding Bonds
The 2006 Series B Refunding Bonds were issued on August 3, 2006 in the aggregate principal amount of $209.8 million, on a forward-delivery basis, to currently refund $211.9 million of the 1996 Series B Bonds. The 2006 Series B refunding transactions resulted in an economic gain of $18.9 million and cash savings of $34.7 million.
Interest on the 2006 Series B Refunding Bonds is payable semiannually on February 1 and August 1 of each year. The 2006 Series B Bonds bear interest at rate of 5.00% with maturity dates ranging from August 1, 2007 to August 1, 2026.
The bonds maturing on or after August 1, 2017 shall be subject to optional redemption prior to their maturities at the redemption price of 102% if they are redeemed during the period from August 1, 2016 to July 31, 2017.
To take advantage of the ARRA, the Port issued the 2009 Series C (Non-AMT) Refunding Bonds on July 9, 2009. A portion of the 2009 Refunding Bond proceeds was to provide funds to refund $94.1 million of the 2006 Series B AMT Bonds.
The outstanding balances of the 2006 Series B Refunding Bonds, net of unamortized premium of $3.1 million and $3.4 million, and unamortized deferred amount on refunding of $1.7 million and $1.8 million were $94.9 million and $95.0 million at June 30, 2012 and 2011, respectively.
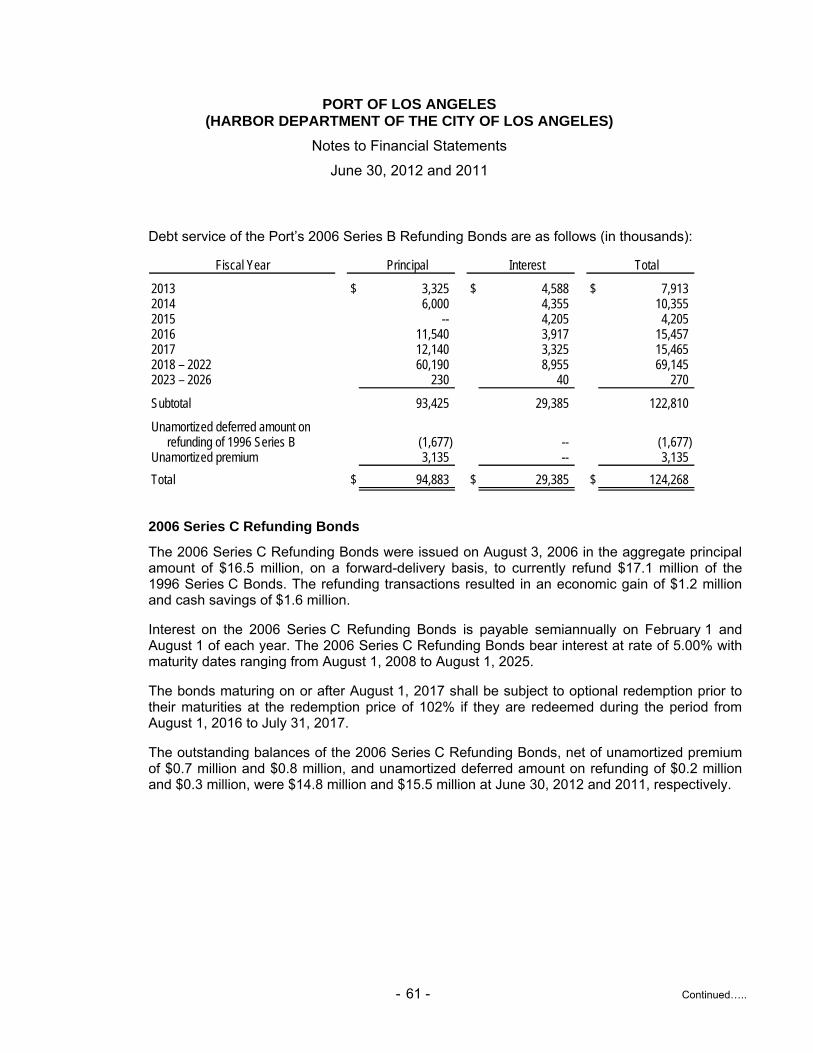
PORT OF LOS ANGELES (HARBOR DEPARTMENT OF THE CITY OF LOS ANGELES)
Notes to Financial Statements
June 30, 2012 and 2011
- 61 - Continued…..
Debt service of the Port’s 2006 Series B Refunding Bonds are as follows (in thousands):
Fiscal Year Principal Interest Total
2013 $ 3,325 $ 4,588 $ 7,913 2014 6,000 4,355 10,355 2015 -- 4,205 4,205 2016 11,540 3,917 15,457 2017 12,140 3,325 15,465 2018 – 2022 60,190 8,955 69,145 2023 – 2026 230 40 270
Subtotal 93,425 29,385 122,810
Unamortized deferred amount onrefunding of 1996 Series B (1,677) -- (1,677)
Unamortized premium 3,135 -- 3,135
Total $ 94,883 $ 29,385 $ 124,268
2006 Series C Refunding Bonds
The 2006 Series C Refunding Bonds were issued on August 3, 2006 in the aggregate principal amount of $16.5 million, on a forward-delivery basis, to currently refund $17.1 million of the 1996 Series C Bonds. The refunding transactions resulted in an economic gain of $1.2 million and cash savings of $1.6 million.
Interest on the 2006 Series C Refunding Bonds is payable semiannually on February 1 and August 1 of each year. The 2006 Series C Refunding Bonds bear interest at rate of 5.00% with maturity dates ranging from August 1, 2008 to August 1, 2025.
The bonds maturing on or after August 1, 2017 shall be subject to optional redemption prior to their maturities at the redemption price of 102% if they are redeemed during the period from August 1, 2016 to July 31, 2017.
The outstanding balances of the 2006 Series C Refunding Bonds, net of unamortized premium of $0.7 million and $0.8 million, and unamortized deferred amount on refunding of $0.2 million and $0.3 million, were $14.8 million and $15.5 million at June 30, 2012 and 2011, respectively.
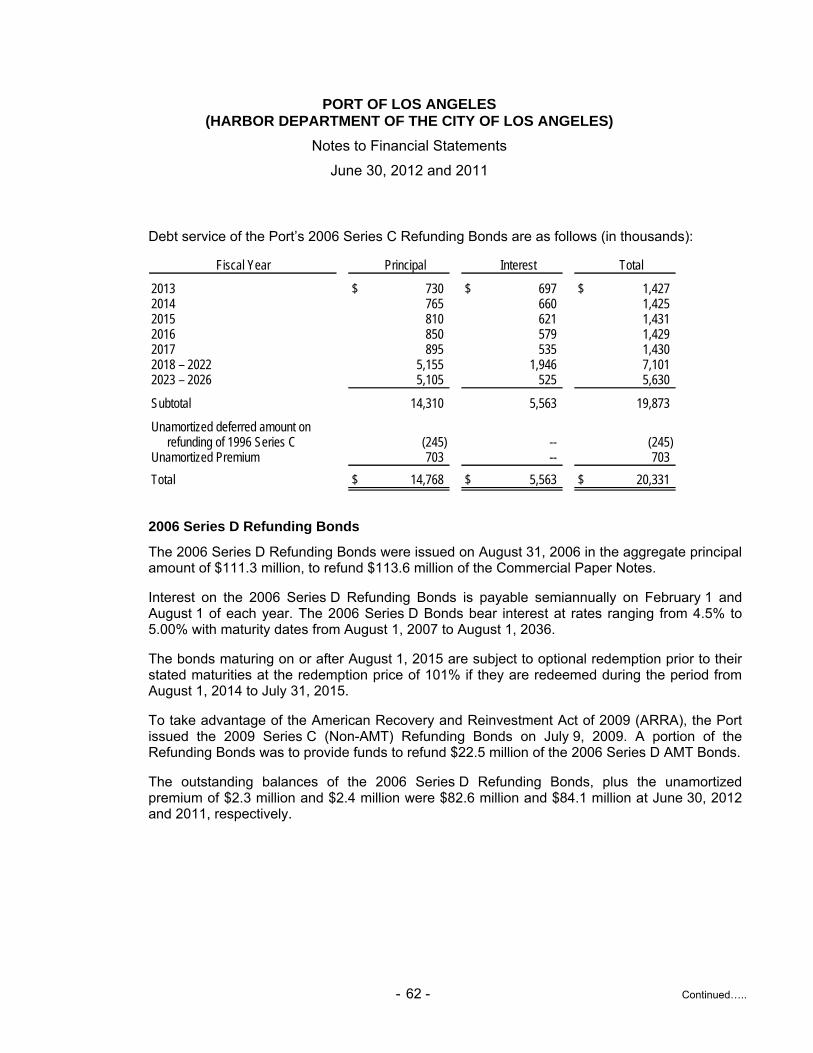
PORT OF LOS ANGELES (HARBOR DEPARTMENT OF THE CITY OF LOS ANGELES)
Notes to Financial Statements
June 30, 2012 and 2011
- 62 - Continued…..
Debt service of the Port’s 2006 Series C Refunding Bonds are as follows (in thousands):
Fiscal Year Principal Interest Total
2013 $ 730 $ 697 $ 1,427 2014 765 660 1,425 2015 810 621 1,431 2016 850 579 1,429 2017 895 535 1,430 2018 – 2022 5,155 1,946 7,101 2023 – 2026 5,105 525 5,630
Subtotal 14,310 5,563 19,873
Unamortized deferred amount onrefunding of 1996 Series C (245) -- (245)
Unamortized Premium 703 -- 703
Total $ 14,768 $ 5,563 $ 20,331
2006 Series D Refunding Bonds
The 2006 Series D Refunding Bonds were issued on August 31, 2006 in the aggregate principal amount of $111.3 million, to refund $113.6 million of the Commercial Paper Notes.
Interest on the 2006 Series D Refunding Bonds is payable semiannually on February 1 and August 1 of each year. The 2006 Series D Bonds bear interest at rates ranging from 4.5% to 5.00% with maturity dates from August 1, 2007 to August 1, 2036.
The bonds maturing on or after August 1, 2015 are subject to optional redemption prior to their stated maturities at the redemption price of 101% if they are redeemed during the period from August 1, 2014 to July 31, 2015.
To take advantage of the American Recovery and Reinvestment Act of 2009 (ARRA), the Port issued the 2009 Series C (Non-AMT) Refunding Bonds on July 9, 2009. A portion of the Refunding Bonds was to provide funds to refund $22.5 million of the 2006 Series D AMT Bonds.
The outstanding balances of the 2006 Series D Refunding Bonds, plus the unamortized premium of $2.3 million and $2.4 million were $82.6 million and $84.1 million at June 30, 2012 and 2011, respectively.
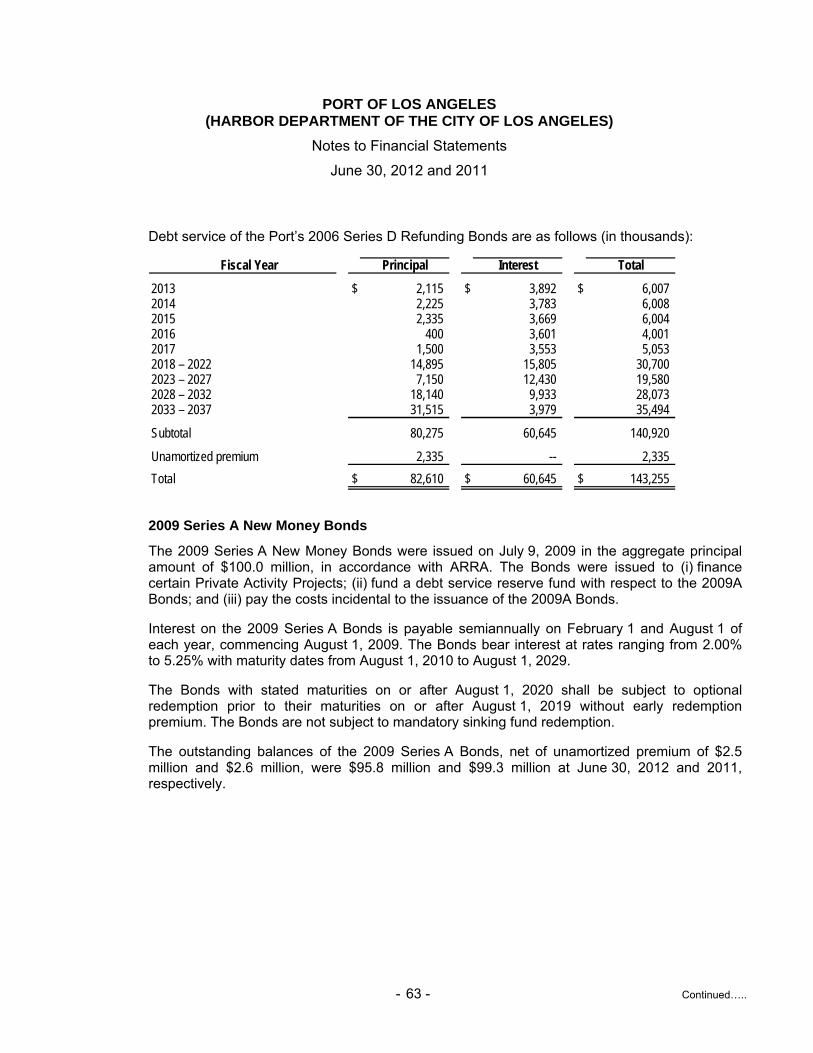
PORT OF LOS ANGELES (HARBOR DEPARTMENT OF THE CITY OF LOS ANGELES)
Notes to Financial Statements
June 30, 2012 and 2011
- 63 - Continued…..
Debt service of the Port’s 2006 Series D Refunding Bonds are as follows (in thousands):
Fiscal Year Principal Interest Total
2013 $ 2,115 $ 3,892 $ 6,007 2014 2,225 3,783 6,008 2015 2,335 3,669 6,004 2016 400 3,601 4,001 2017 1,500 3,553 5,053 2018 – 2022 14,895 15,805 30,700 2023 – 2027 7,150 12,430 19,580 2028 – 2032 18,140 9,933 28,073 2033 – 2037 31,515 3,979 35,494
Subtotal 80,275 60,645 140,920
Unamortized premium 2,335 -- 2,335
Total $ 82,610 $ 60,645 $ 143,255
2009 Series A New Money Bonds
The 2009 Series A New Money Bonds were issued on July 9, 2009 in the aggregate principal amount of $100.0 million, in accordance with ARRA. The Bonds were issued to (i) finance certain Private Activity Projects; (ii) fund a debt service reserve fund with respect to the 2009A Bonds; and (iii) pay the costs incidental to the issuance of the 2009A Bonds.
Interest on the 2009 Series A Bonds is payable semiannually on February 1 and August 1 of each year, commencing August 1, 2009. The Bonds bear interest at rates ranging from 2.00% to 5.25% with maturity dates from August 1, 2010 to August 1, 2029.
The Bonds with stated maturities on or after August 1, 2020 shall be subject to optional redemption prior to their maturities on or after August 1, 2019 without early redemption premium. The Bonds are not subject to mandatory sinking fund redemption.
The outstanding balances of the 2009 Series A Bonds, net of unamortized premium of $2.5 million and $2.6 million, were $95.8 million and $99.3 million at June 30, 2012 and 2011, respectively.
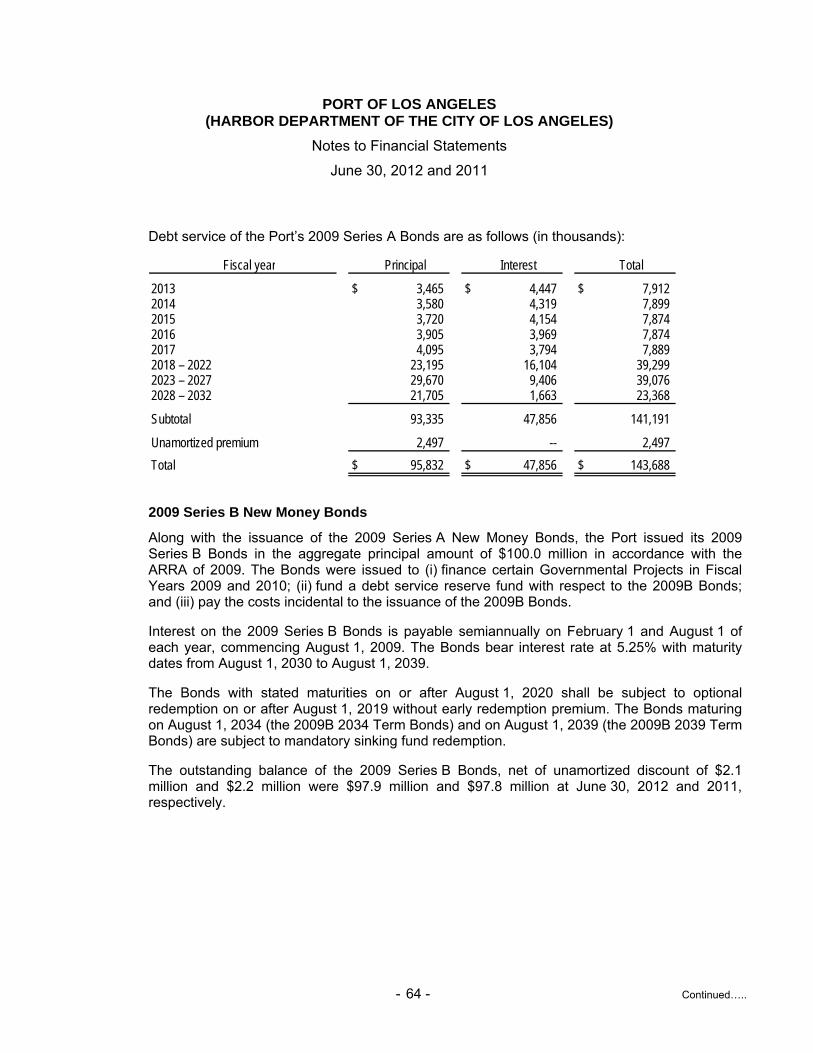
PORT OF LOS ANGELES (HARBOR DEPARTMENT OF THE CITY OF LOS ANGELES)
Notes to Financial Statements
June 30, 2012 and 2011
- 64 - Continued…..
Debt service of the Port’s 2009 Series A Bonds are as follows (in thousands):
Fiscal year Principal Interest Total
2013 $ 3,465 $ 4,447 $ 7,912 2014 3,580 4,319 7,899 2015 3,720 4,154 7,874 2016 3,905 3,969 7,874 2017 4,095 3,794 7,889 2018 – 2022 23,195 16,104 39,299 2023 – 2027 29,670 9,406 39,076 2028 – 2032 21,705 1,663 23,368
Subtotal 93,335 47,856 141,191
Unamortized premium 2,497 -- 2,497
Total $ 95,832 $ 47,856 $ 143,688
2009 Series B New Money Bonds
Along with the issuance of the 2009 Series A New Money Bonds, the Port issued its 2009 Series B Bonds in the aggregate principal amount of $100.0 million in accordance with the ARRA of 2009. The Bonds were issued to (i) finance certain Governmental Projects in Fiscal Years 2009 and 2010; (ii) fund a debt service reserve fund with respect to the 2009B Bonds; and (iii) pay the costs incidental to the issuance of the 2009B Bonds.
Interest on the 2009 Series B Bonds is payable semiannually on February 1 and August 1 of each year, commencing August 1, 2009. The Bonds bear interest rate at 5.25% with maturity dates from August 1, 2030 to August 1, 2039.
The Bonds with stated maturities on or after August 1, 2020 shall be subject to optional redemption on or after August 1, 2019 without early redemption premium. The Bonds maturing on August 1, 2034 (the 2009B 2034 Term Bonds) and on August 1, 2039 (the 2009B 2039 Term Bonds) are subject to mandatory sinking fund redemption.
The outstanding balance of the 2009 Series B Bonds, net of unamortized discount of $2.1 million and $2.2 million were $97.9 million and $97.8 million at June 30, 2012 and 2011, respectively.
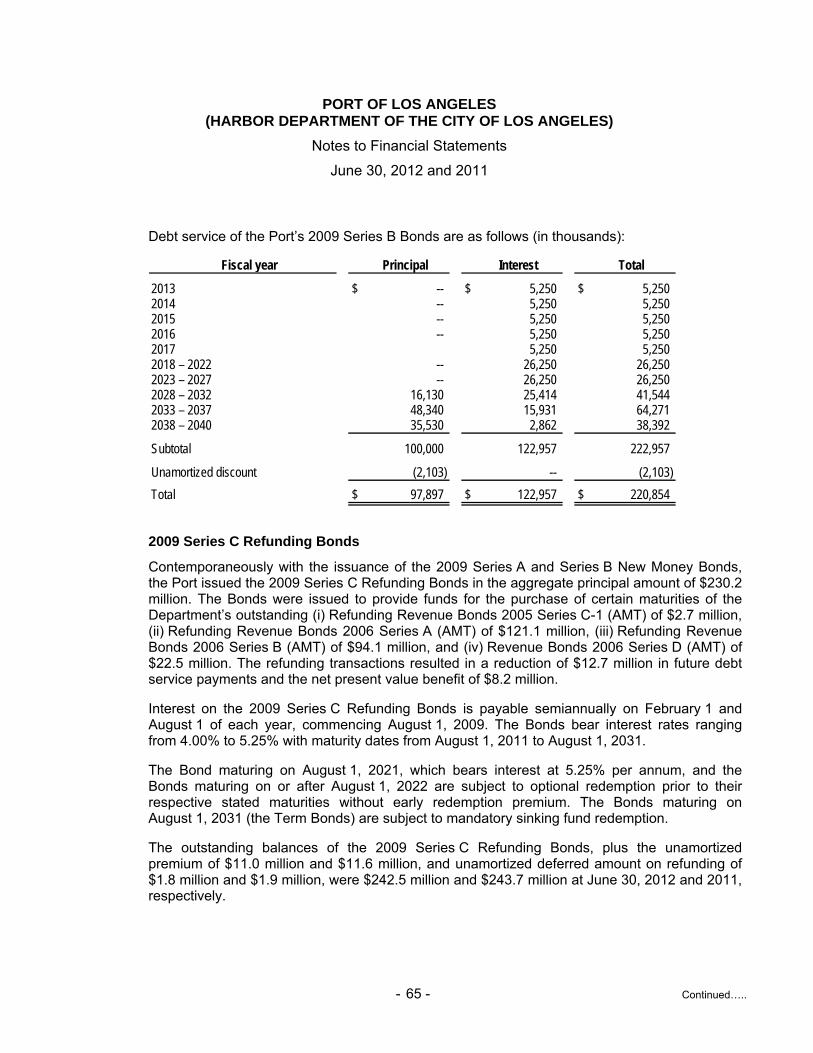
PORT OF LOS ANGELES (HARBOR DEPARTMENT OF THE CITY OF LOS ANGELES)
Notes to Financial Statements
June 30, 2012 and 2011
- 65 - Continued…..
Debt service of the Port’s 2009 Series B Bonds are as follows (in thousands):
Fiscal year Principal Interest Total
2013 $ -- $ 5,250 $ 5,250 2014 -- 5,250 5,250 2015 -- 5,250 5,250 2016 -- 5,250 5,250 2017 5,250 5,250 2018 – 2022 -- 26,250 26,250 2023 – 2027 -- 26,250 26,250 2028 – 2032 16,130 25,414 41,544 2033 – 2037 48,340 15,931 64,271 2038 – 2040 35,530 2,862 38,392
Subtotal 100,000 122,957 222,957
Unamortized discount (2,103) -- (2,103)
Total $ 97,897 $ 122,957 $ 220,854
2009 Series C Refunding Bonds
Contemporaneously with the issuance of the 2009 Series A and Series B New Money Bonds, the Port issued the 2009 Series C Refunding Bonds in the aggregate principal amount of $230.2 million. The Bonds were issued to provide funds for the purchase of certain maturities of the Department’s outstanding (i) Refunding Revenue Bonds 2005 Series C-1 (AMT) of $2.7 million, (ii) Refunding Revenue Bonds 2006 Series A (AMT) of $121.1 million, (iii) Refunding Revenue Bonds 2006 Series B (AMT) of $94.1 million, and (iv) Revenue Bonds 2006 Series D (AMT) of $22.5 million. The refunding transactions resulted in a reduction of $12.7 million in future debt service payments and the net present value benefit of $8.2 million.
Interest on the 2009 Series C Refunding Bonds is payable semiannually on February 1 and August 1 of each year, commencing August 1, 2009. The Bonds bear interest rates ranging from 4.00% to 5.25% with maturity dates from August 1, 2011 to August 1, 2031.
The Bond maturing on August 1, 2021, which bears interest at 5.25% per annum, and the Bonds maturing on or after August 1, 2022 are subject to optional redemption prior to their respective stated maturities without early redemption premium. The Bonds maturing on August 1, 2031 (the Term Bonds) are subject to mandatory sinking fund redemption.
The outstanding balances of the 2009 Series C Refunding Bonds, plus the unamortized premium of $11.0 million and $11.6 million, and unamortized deferred amount on refunding of $1.8 million and $1.9 million, were $242.5 million and $243.7 million at June 30, 2012 and 2011, respectively.
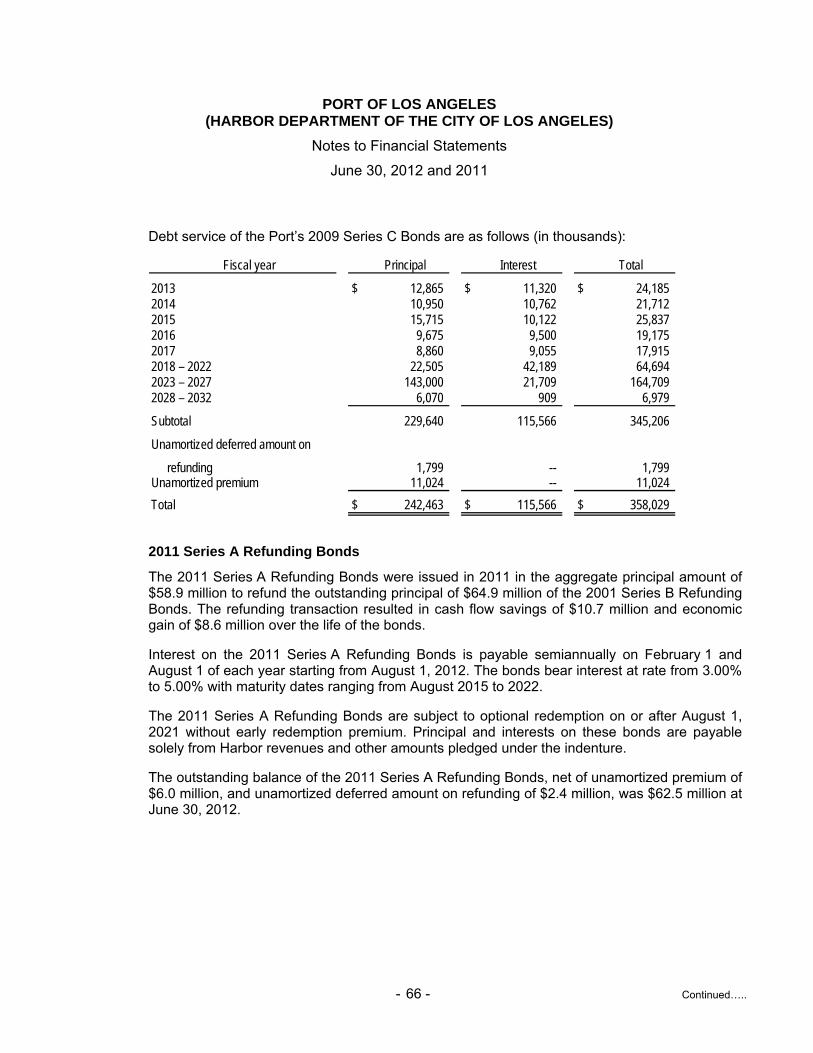
PORT OF LOS ANGELES (HARBOR DEPARTMENT OF THE CITY OF LOS ANGELES)
Notes to Financial Statements
June 30, 2012 and 2011
- 66 - Continued…..
Debt service of the Port’s 2009 Series C Bonds are as follows (in thousands):
Fiscal year Principal Interest Total
2013 $ 12,865 $ 11,320 $ 24,185 2014 10,950 10,762 21,712 2015 15,715 10,122 25,837 2016 9,675 9,500 19,175 2017 8,860 9,055 17,915 2018 – 2022 22,505 42,189 64,694 2023 – 2027 143,000 21,709 164,709 2028 – 2032 6,070 909 6,979
Subtotal 229,640 115,566 345,206
Unamortized deferred amount on
refunding 1,799 -- 1,799 Unamortized premium 11,024 -- 11,024
Total $ 242,463 $ 115,566 $ 358,029
2011 Series A Refunding Bonds
The 2011 Series A Refunding Bonds were issued in 2011 in the aggregate principal amount of $58.9 million to refund the outstanding principal of $64.9 million of the 2001 Series B Refunding Bonds. The refunding transaction resulted in cash flow savings of $10.7 million and economic gain of $8.6 million over the life of the bonds.
Interest on the 2011 Series A Refunding Bonds is payable semiannually on February 1 and August 1 of each year starting from August 1, 2012. The bonds bear interest at rate from 3.00% to 5.00% with maturity dates ranging from August 2015 to 2022.
The 2011 Series A Refunding Bonds are subject to optional redemption on or after August 1, 2021 without early redemption premium. Principal and interests on these bonds are payable solely from Harbor revenues and other amounts pledged under the indenture.
The outstanding balance of the 2011 Series A Refunding Bonds, net of unamortized premium of $6.0 million, and unamortized deferred amount on refunding of $2.4 million, was $62.5 million at June 30, 2012.
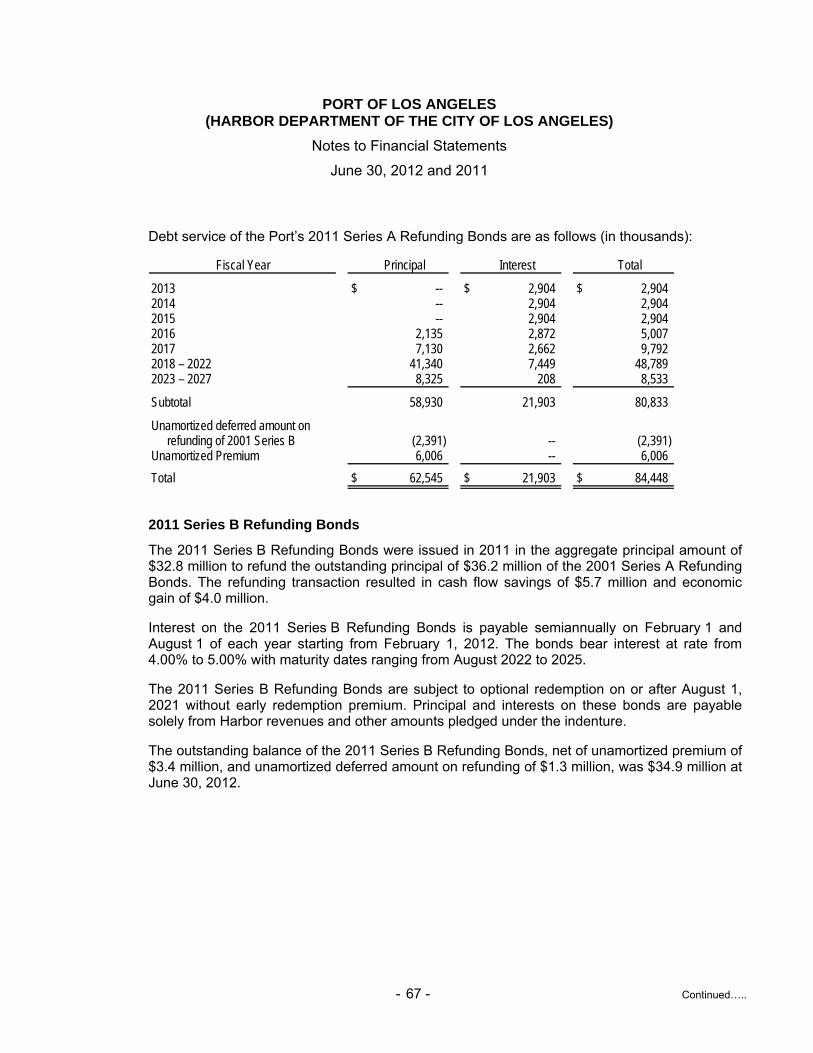
PORT OF LOS ANGELES (HARBOR DEPARTMENT OF THE CITY OF LOS ANGELES)
Notes to Financial Statements
June 30, 2012 and 2011
- 67 - Continued…..
Debt service of the Port’s 2011 Series A Refunding Bonds are as follows (in thousands):
Fiscal Year Principal Interest Total
2013 $ -- $ 2,904 $ 2,904 2014 -- 2,904 2,904 2015 -- 2,904 2,904 2016 2,135 2,872 5,007 2017 7,130 2,662 9,792 2018 – 2022 41,340 7,449 48,789 2023 – 2027 8,325 208 8,533
Subtotal 58,930 21,903 80,833
Unamortized deferred amount onrefunding of 2001 Series B (2,391) -- (2,391)
Unamortized Premium 6,006 -- 6,006
Total $ 62,545 $ 21,903 $ 84,448
2011 Series B Refunding Bonds
The 2011 Series B Refunding Bonds were issued in 2011 in the aggregate principal amount of $32.8 million to refund the outstanding principal of $36.2 million of the 2001 Series A Refunding Bonds. The refunding transaction resulted in cash flow savings of $5.7 million and economic gain of $4.0 million.
Interest on the 2011 Series B Refunding Bonds is payable semiannually on February 1 and August 1 of each year starting from February 1, 2012. The bonds bear interest at rate from 4.00% to 5.00% with maturity dates ranging from August 2022 to 2025.
The 2011 Series B Refunding Bonds are subject to optional redemption on or after August 1, 2021 without early redemption premium. Principal and interests on these bonds are payable solely from Harbor revenues and other amounts pledged under the indenture.
The outstanding balance of the 2011 Series B Refunding Bonds, net of unamortized premium of $3.4 million, and unamortized deferred amount on refunding of $1.3 million, was $34.9 million at June 30, 2012.
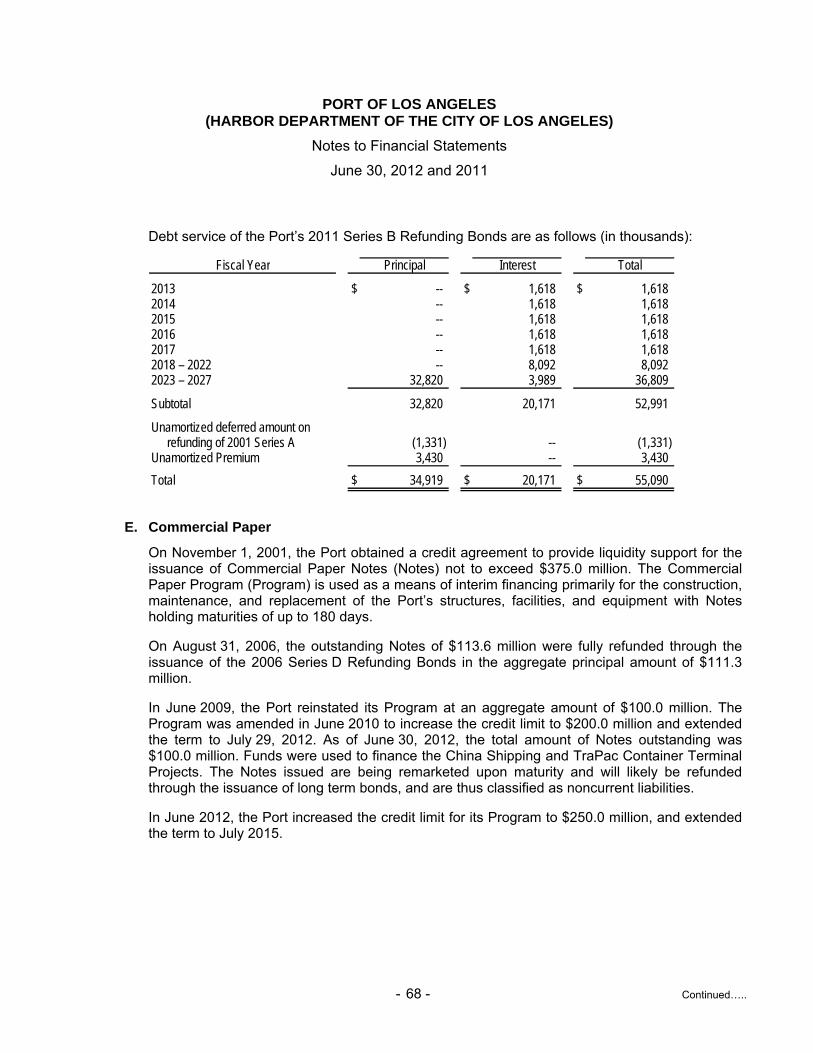
PORT OF LOS ANGELES (HARBOR DEPARTMENT OF THE CITY OF LOS ANGELES)
Notes to Financial Statements
June 30, 2012 and 2011
- 68 - Continued…..
Debt service of the Port’s 2011 Series B Refunding Bonds are as follows (in thousands):
Fiscal Year Principal Interest Total
2013 $ -- $ 1,618 $ 1,618 2014 -- 1,618 1,618 2015 -- 1,618 1,618 2016 -- 1,618 1,618 2017 -- 1,618 1,618 2018 – 2022 -- 8,092 8,092 2023 – 2027 32,820 3,989 36,809
Subtotal 32,820 20,171 52,991
Unamortized deferred amount onrefunding of 2001 Series A (1,331) -- (1,331)
Unamortized Premium 3,430 -- 3,430
Total $ 34,919 $ 20,171 $ 55,090
E. Commercial Paper
On November 1, 2001, the Port obtained a credit agreement to provide liquidity support for the issuance of Commercial Paper Notes (Notes) not to exceed $375.0 million. The Commercial Paper Program (Program) is used as a means of interim financing primarily for the construction, maintenance, and replacement of the Port’s structures, facilities, and equipment with Notes holding maturities of up to 180 days.
On August 31, 2006, the outstanding Notes of $113.6 million were fully refunded through the issuance of the 2006 Series D Refunding Bonds in the aggregate principal amount of $111.3 million.
In June 2009, the Port reinstated its Program at an aggregate amount of $100.0 million. The Program was amended in June 2010 to increase the credit limit to $200.0 million and extended the term to July 29, 2012. As of June 30, 2012, the total amount of Notes outstanding was $100.0 million. Funds were used to finance the China Shipping and TraPac Container Terminal Projects. The Notes issued are being remarketed upon maturity and will likely be refunded through the issuance of long term bonds, and are thus classified as noncurrent liabilities.
In June 2012, the Port increased the credit limit for its Program to $250.0 million, and extended the term to July 2015.
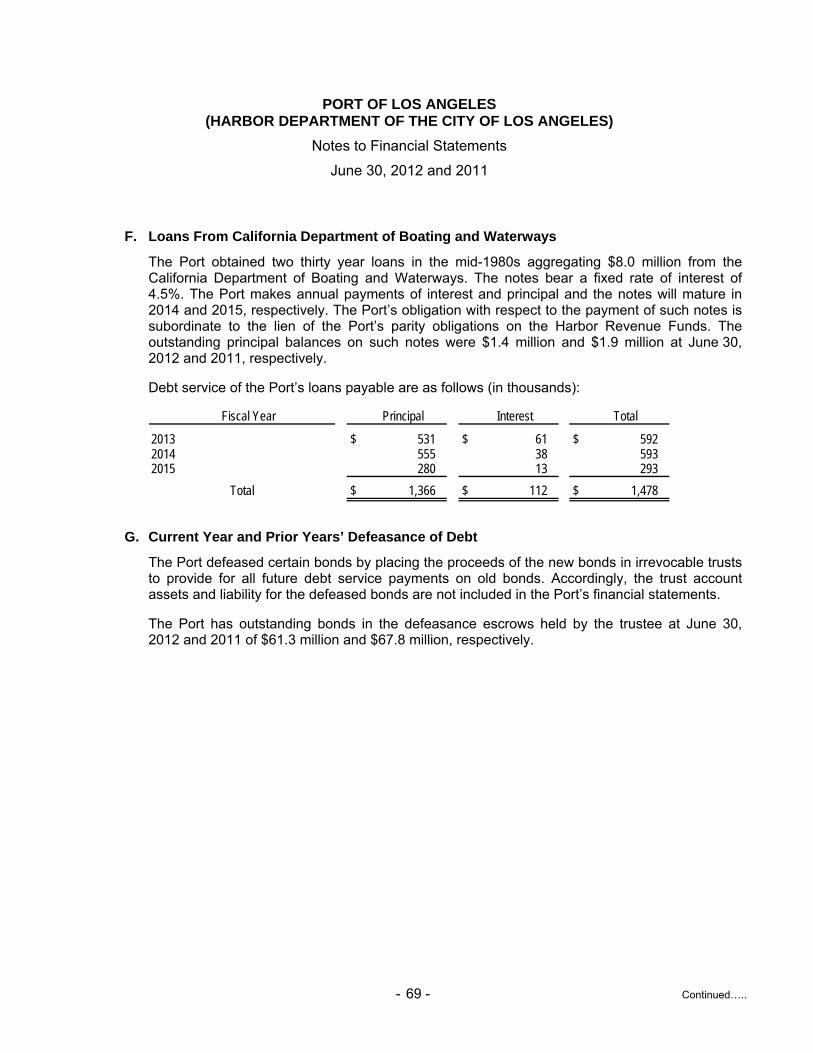
PORT OF LOS ANGELES (HARBOR DEPARTMENT OF THE CITY OF LOS ANGELES)
Notes to Financial Statements
June 30, 2012 and 2011
- 69 - Continued…..
F. Loans From California Department of Boating and Waterways
The Port obtained two thirty year loans in the mid-1980s aggregating $8.0 million from the California Department of Boating and Waterways. The notes bear a fixed rate of interest of 4.5%. The Port makes annual payments of interest and principal and the notes will mature in 2014 and 2015, respectively. The Port’s obligation with respect to the payment of such notes is subordinate to the lien of the Port’s parity obligations on the Harbor Revenue Funds. The outstanding principal balances on such notes were $1.4 million and $1.9 million at June 30, 2012 and 2011, respectively.
Debt service of the Port’s loans payable are as follows (in thousands):
Fiscal Year Principal Interest Total
2013 $ 531 $ 61 $ 592 2014 555 38 593 2015 280 13 293
Total $ 1,366 $ 112 $ 1,478
G. Current Year and Prior Years’ Defeasance of Debt
The Port defeased certain bonds by placing the proceeds of the new bonds in irrevocable trusts to provide for all future debt service payments on old bonds. Accordingly, the trust account assets and liability for the defeased bonds are not included in the Port’s financial statements.
The Port has outstanding bonds in the defeasance escrows held by the trustee at June 30, 2012 and 2011 of $61.3 million and $67.8 million, respectively.
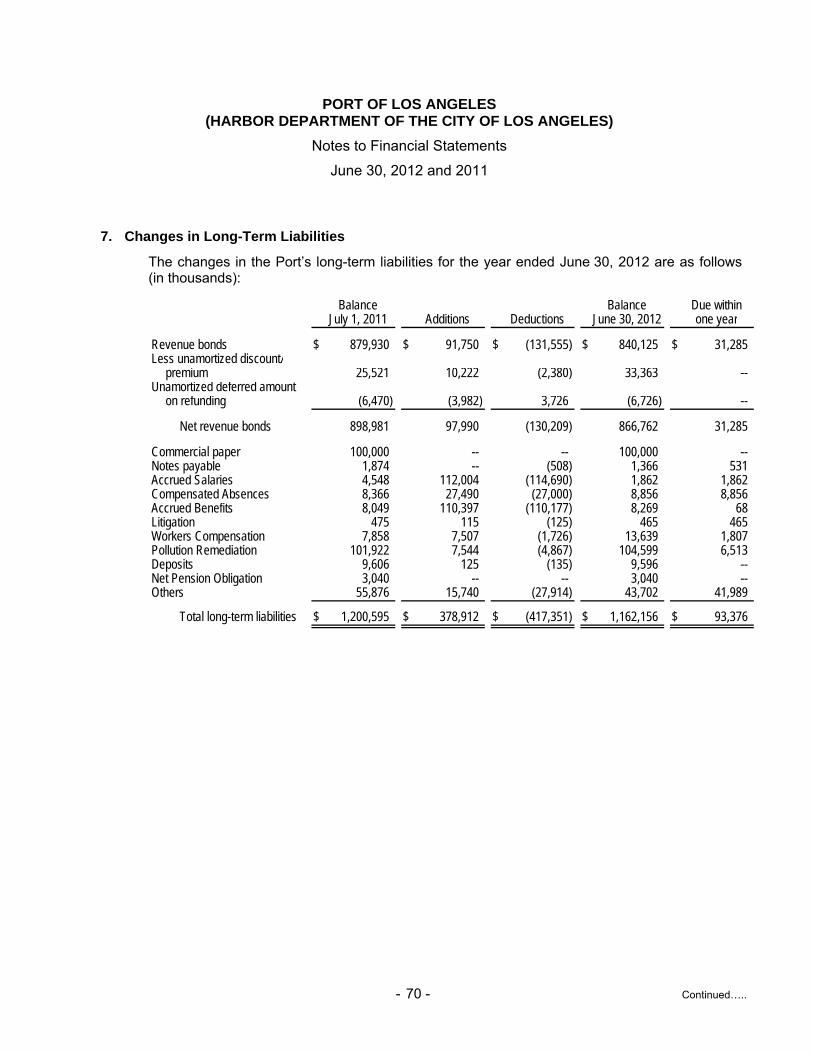
PORT OF LOS ANGELES (HARBOR DEPARTMENT OF THE CITY OF LOS ANGELES)
Notes to Financial Statements
June 30, 2012 and 2011
- 70 - Continued…..
7. Changes in Long-Term Liabilities
The changes in the Port’s long-term liabilities for the year ended June 30, 2012 are as follows (in thousands):
Balance Balance Due withinJuly 1, 2011 Additions Deductions June 30, 2012 one year
Revenue bonds $ 879,930 $ 91,750 $ (131,555) $ 840,125 $ 31,285 Less unamortized discount/
premium 25,521 10,222 (2,380) 33,363 -- Unamortized deferred amount
on refunding (6,470) (3,982) 3,726 (6,726) --
Net revenue bonds 898,981 97,990 (130,209) 866,762 31,285
Commercial paper 100,000 -- -- 100,000 -- Notes payable 1,874 -- (508) 1,366 531 Accrued Salaries 4,548 112,004 (114,690) 1,862 1,862 Compensated Absences 8,366 27,490 (27,000) 8,856 8,856 Accrued Benefits 8,049 110,397 (110,177) 8,269 68 Litigation 475 115 (125) 465 465 Workers Compensation 7,858 7,507 (1,726) 13,639 1,807 Pollution Remediation 101,922 7,544 (4,867) 104,599 6,513 Deposits 9,606 125 (135) 9,596 -- Net Pension Obligation 3,040 -- -- 3,040 -- Others 55,876 15,740 (27,914) 43,702 41,989
Total long-term liabilities $ 1,200,595 $ 378,912 $ (417,351) $ 1,162,156 $ 93,376
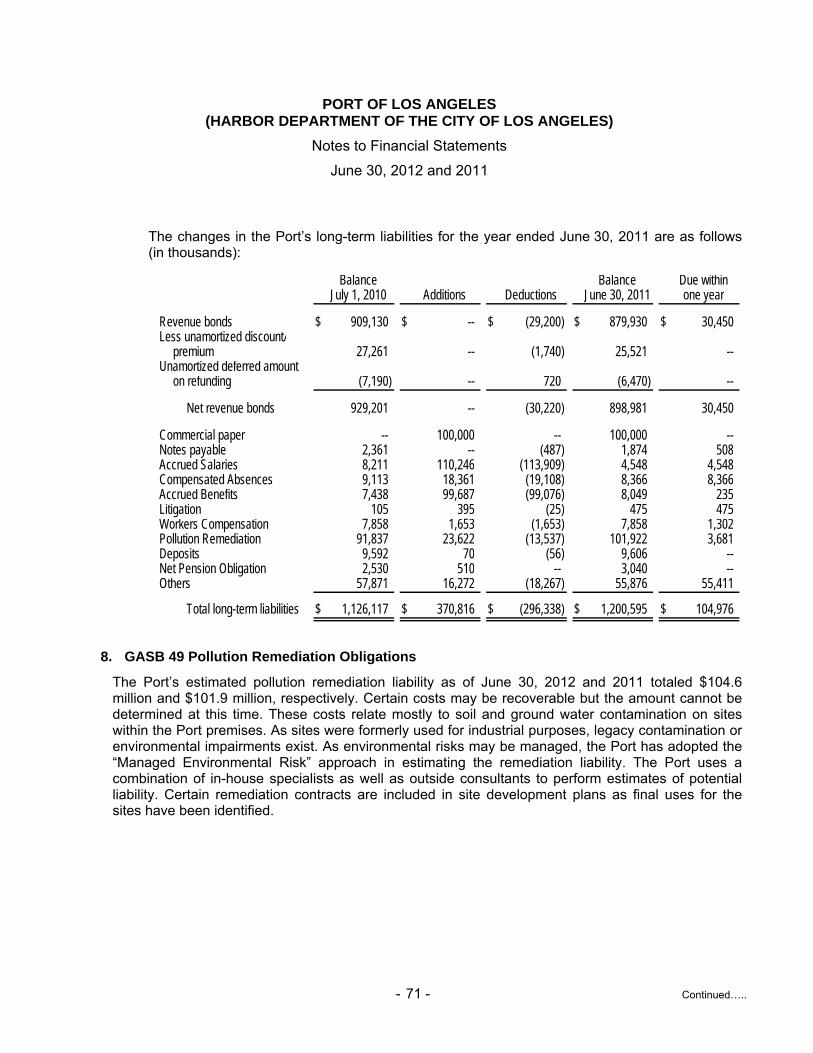
PORT OF LOS ANGELES (HARBOR DEPARTMENT OF THE CITY OF LOS ANGELES)
Notes to Financial Statements
June 30, 2012 and 2011
- 71 - Continued…..
The changes in the Port’s long-term liabilities for the year ended June 30, 2011 are as follows (in thousands):
Balance Balance Due withinJuly 1, 2010 Additions Deductions June 30, 2011 one year
Revenue bonds $ 909,130 $ -- $ (29,200) $ 879,930 $ 30,450 Less unamortized discount/
premium 27,261 -- (1,740) 25,521 -- Unamortized deferred amount
on refunding (7,190) -- 720 (6,470) --
Net revenue bonds 929,201 -- (30,220) 898,981 30,450
Commercial paper -- 100,000 -- 100,000 -- Notes payable 2,361 -- (487) 1,874 508 Accrued Salaries 8,211 110,246 (113,909) 4,548 4,548 Compensated Absences 9,113 18,361 (19,108) 8,366 8,366 Accrued Benefits 7,438 99,687 (99,076) 8,049 235 Litigation 105 395 (25) 475 475 Workers Compensation 7,858 1,653 (1,653) 7,858 1,302 Pollution Remediation 91,837 23,622 (13,537) 101,922 3,681 Deposits 9,592 70 (56) 9,606 -- Net Pension Obligation 2,530 510 -- 3,040 -- Others 57,871 16,272 (18,267) 55,876 55,411
Total long-term liabilities $ 1,126,117 $ 370,816 $ (296,338) $ 1,200,595 $ 104,976
8. GASB 49 Pollution Remediation Obligations
The Port’s estimated pollution remediation liability as of June 30, 2012 and 2011 totaled $104.6 million and $101.9 million, respectively. Certain costs may be recoverable but the amount cannot be determined at this time. These costs relate mostly to soil and ground water contamination on sites within the Port premises. As sites were formerly used for industrial purposes, legacy contamination or environmental impairments exist. As environmental risks may be managed, the Port has adopted the “Managed Environmental Risk” approach in estimating the remediation liability. The Port uses a combination of in-house specialists as well as outside consultants to perform estimates of potential liability. Certain remediation contracts are included in site development plans as final uses for the sites have been identified.
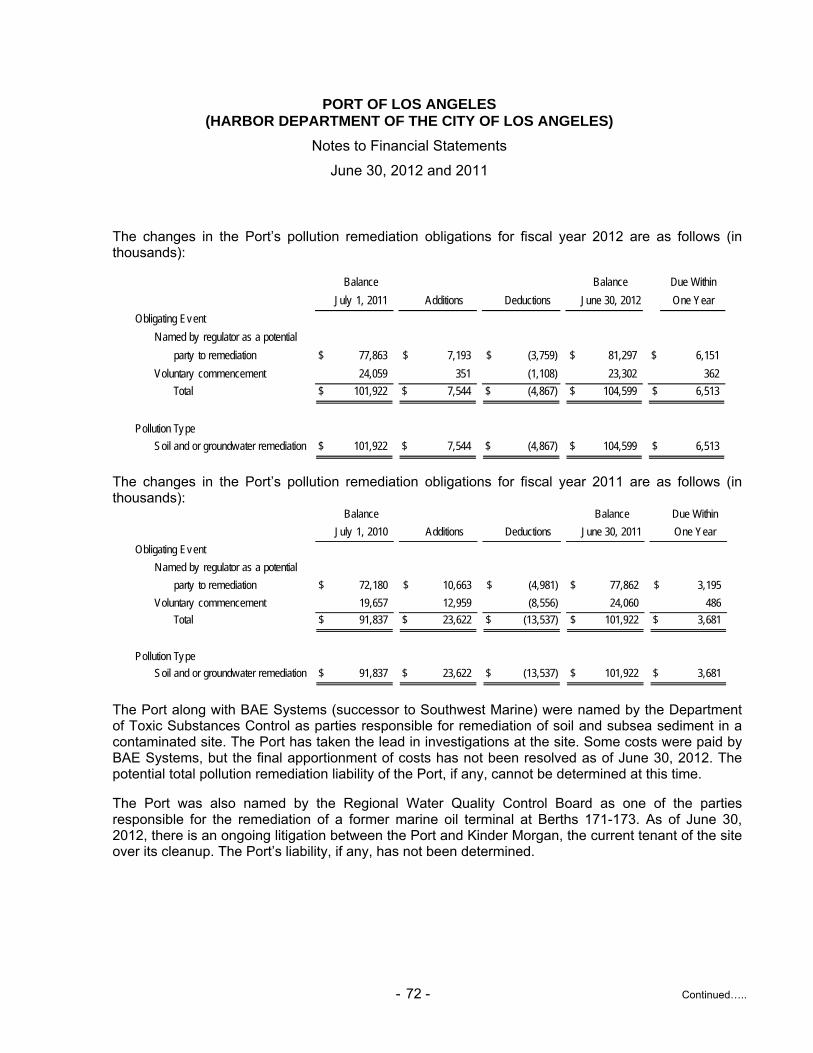
PORT OF LOS ANGELES (HARBOR DEPARTMENT OF THE CITY OF LOS ANGELES)
Notes to Financial Statements
June 30, 2012 and 2011
- 72 - Continued…..
The changes in the Port’s pollution remediation obligations for fiscal year 2012 are as follows (in thousands):
Balance Balance Due Within
July 1, 2011 Additions Deductions June 30, 2012 One Year
Obligating Event
Named by regulator as a potential
party to remediation $ 77,863 $ 7,193 $ (3,759) $ 81,297 $ 6,151
Voluntary commencement 24,059 351 (1,108) 23,302 362
Total $ 101,922 $ 7,544 $ (4,867) $ 104,599 $ 6,513
Pollution Type
Soil and or groundwater remediation $ 101,922 $ 7,544 $ (4,867) $ 104,599 $ 6,513
The changes in the Port’s pollution remediation obligations for fiscal year 2011 are as follows (in thousands):
Balance Balance Due Within
July 1, 2010 Additions Deductions June 30, 2011 One Year
Obligating Event
Named by regulator as a potential
party to remediation $ 72,180 $ 10,663 $ (4,981) $ 77,862 $ 3,195
Voluntary commencement 19,657 12,959 (8,556) 24,060 486
Total $ 91,837 $ 23,622 $ (13,537) $ 101,922 $ 3,681
Pollution Type
Soil and or groundwater remediation $ 91,837 $ 23,622 $ (13,537) $ 101,922 $ 3,681
The Port along with BAE Systems (successor to Southwest Marine) were named by the Department of Toxic Substances Control as parties responsible for remediation of soil and subsea sediment in a contaminated site. The Port has taken the lead in investigations at the site. Some costs were paid by BAE Systems, but the final apportionment of costs has not been resolved as of June 30, 2012. The potential total pollution remediation liability of the Port, if any, cannot be determined at this time.
The Port was also named by the Regional Water Quality Control Board as one of the parties responsible for the remediation of a former marine oil terminal at Berths 171-173. As of June 30, 2012, there is an ongoing litigation between the Port and Kinder Morgan, the current tenant of the site over its cleanup. The Port’s liability, if any, has not been determined.
PORT OF LOS ANGELES (HARBOR DEPARTMENT OF THE CITY OF LOS ANGELES)
Notes to Financial Statements
June 30, 2012 and 2011
- 73 - Continued…..
9. Employee-Deferred Compensation Plan
The City offers a deferred compensation plan created in accordance with Internal Revenue Code Section 457 to its employees, in which Port employees participate, allowing them to defer receipt of income. All amounts deferred by the Port’s employees are paid to the City, which in turn pays them to the deferred compensation plan administrator. All amounts of compensation deferred under the plan, all property and rights purchased with those amounts, and all income attributable to those amounts are held in such custodial account for the exclusive benefit of the employee participants and their beneficiaries. Information on the Port employees’ share of plan assets is not available and is not recorded in the Port’s financial statements.
While the City has full power and authority to administer and to adopt rules and regulations for the plan, all investment decisions under the plan are the responsibility of the plan participants. The City has no liability for losses under the plan, but does have the duty of due care that would be required of an ordinary prudent investor. Under certain circumstances, employees may modify their arrangements with the plan to provide for greater or lesser contributions or to terminate their participation. If participants retire under the plan or terminate service with the City, they may be eligible to receive payments under the plan in accordance with the provisions thereof. In the event of serious financial emergency, the City may approve, upon request, withdrawals from the plan by the participants, along with their allocated contributions.
10. Risk Management
The Port purchases insurance for a variety of exposures associated with property, automobiles, vessels, railroad, employment practices, travel, police, pilotage, and terrorism. The City is self-insured for workers compensation, and the Port participates in the City’s self-insurance program. Third party general liability exposures are self-insured by the Port for $1.0 million and the excess liability is maintained over the self-insured retention. There have been no settlements in the past three years that have exceeded the Port’s insurance coverage.
The actuarially determined accrued liability for workers compensation includes provision for incurred but not reported claims and loss adjustment expenses. The Port’s accrued workers compensation liability at June 30, 2012 and 2011 were $13.6 million and $7.9 million respectively.
A number of lawsuits were pending against the Port that arose in the normal course of operations. The Port recognizes a liability for claims and when it is probable that a loss has been incurred and the amount of that loss, including those incurred but not reported, can be reasonably estimated. The City Attorney provides estimates for the amount of liabilities to be probable of occurring from lawsuits. The Port’s liability for litigation and other claims at June 30, 2012 and 2011 were $0.5 million.
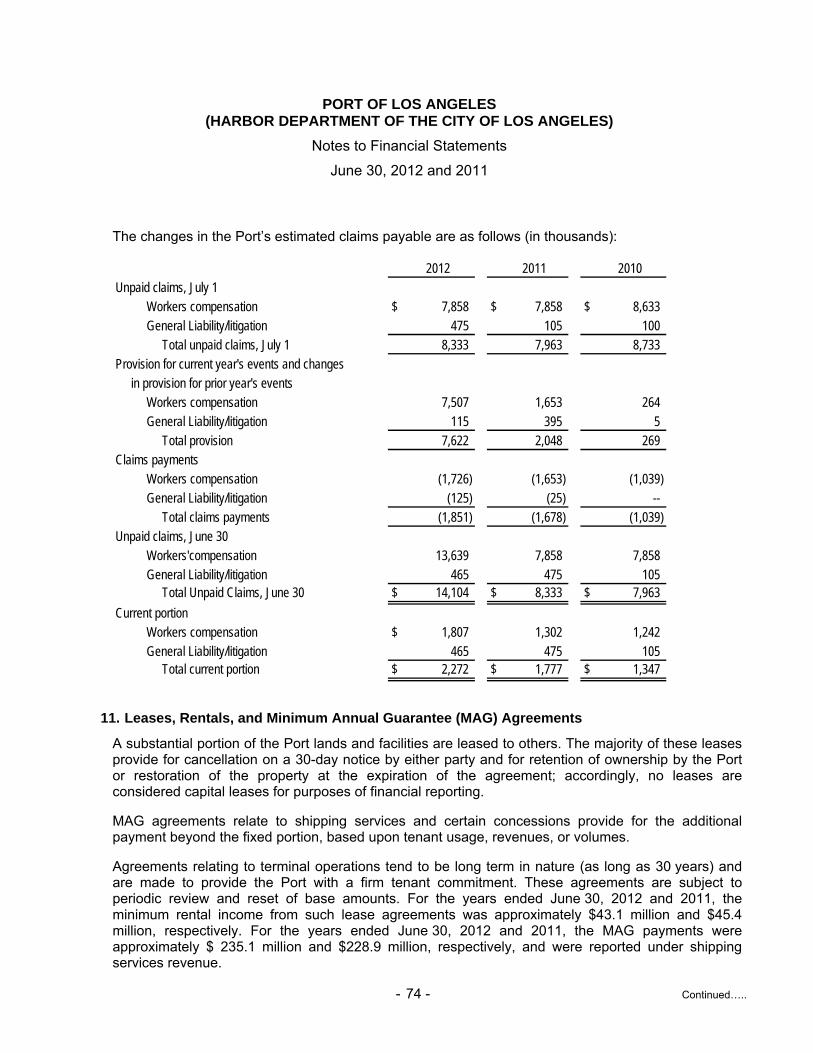
PORT OF LOS ANGELES (HARBOR DEPARTMENT OF THE CITY OF LOS ANGELES)
Notes to Financial Statements
June 30, 2012 and 2011
- 74 - Continued…..
The changes in the Port’s estimated claims payable are as follows (in thousands):
2012 2011 2010Unpaid claims, July 1
Workers compensation $ 7,858 $ 7,858 $ 8,633 General Liability/litigation 475 105 100
Total unpaid claims, July 1 8,333 7,963 8,733 Provision for current year's events and changes
in provision for prior year's eventsWorkers compensation 7,507 1,653 264 General Liability/litigation 115 395 5
Total provision 7,622 2,048 269 Claims payments
Workers compensation (1,726) (1,653) (1,039) General Liability/litigation (125) (25) --
Total claims payments (1,851) (1,678) (1,039) Unpaid claims, June 30
Workers'compensation 13,639 7,858 7,858 General Liability/litigation 465 475 105
Total Unpaid Claims, June 30 $ 14,104 $ 8,333 $ 7,963
Current portionWorkers compensation $ 1,807 1,302 1,242 General Liability/litigation 465 475 105
Total current portion $ 2,272 $ 1,777 $ 1,347
11. Leases, Rentals, and Minimum Annual Guarantee (MAG) Agreements
A substantial portion of the Port lands and facilities are leased to others. The majority of these leases provide for cancellation on a 30-day notice by either party and for retention of ownership by the Port or restoration of the property at the expiration of the agreement; accordingly, no leases are considered capital leases for purposes of financial reporting.
MAG agreements relate to shipping services and certain concessions provide for the additional payment beyond the fixed portion, based upon tenant usage, revenues, or volumes.
Agreements relating to terminal operations tend to be long term in nature (as long as 30 years) and are made to provide the Port with a firm tenant commitment. These agreements are subject to periodic review and reset of base amounts. For the years ended June 30, 2012 and 2011, the minimum rental income from such lease agreements was approximately $43.1 million and $45.4 million, respectively. For the years ended June 30, 2012 and 2011, the MAG payments were approximately $ 235.1 million and $228.9 million, respectively, and were reported under shipping services revenue.
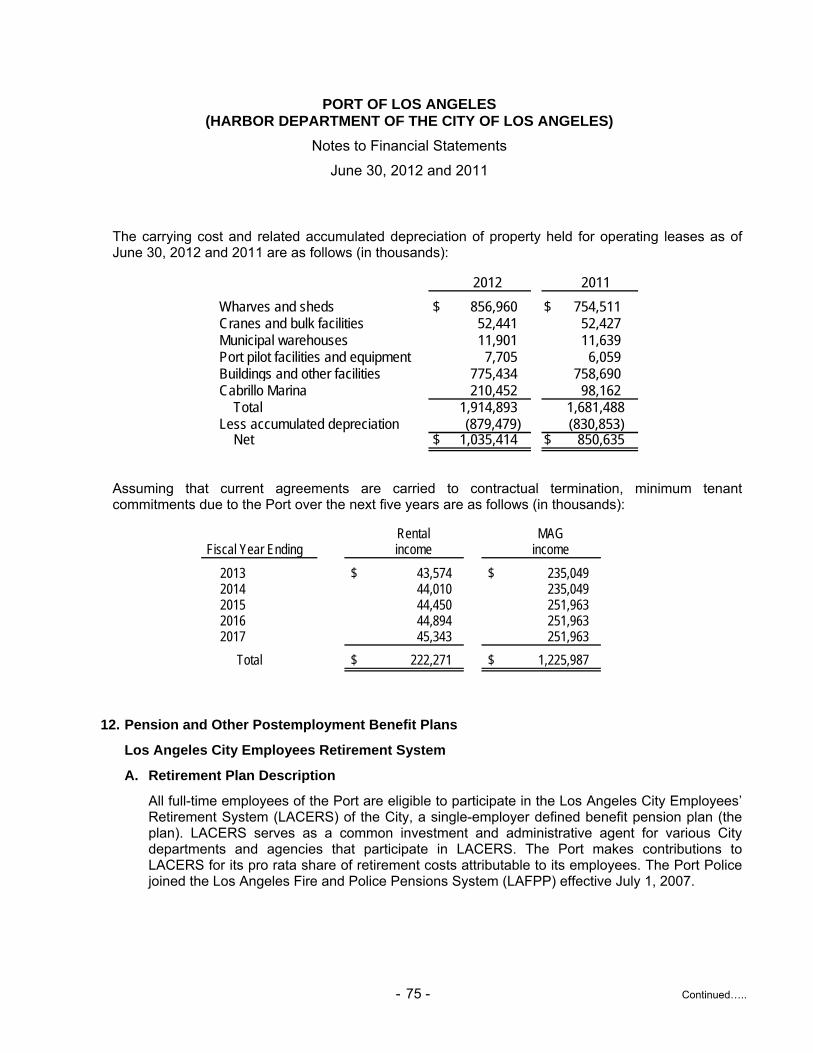
PORT OF LOS ANGELES (HARBOR DEPARTMENT OF THE CITY OF LOS ANGELES)
Notes to Financial Statements
June 30, 2012 and 2011
- 75 - Continued…..
The carrying cost and related accumulated depreciation of property held for operating leases as of June 30, 2012 and 2011 are as follows (in thousands):
2012 2011
Wharves and sheds $ 856,960 $ 754,511 Cranes and bulk facilities 52,441 52,427 Municipal warehouses 11,901 11,639 Port pilot facilities and equipment 7,705 6,059 Buildings and other facilities 775,434 758,690 Cabrillo Marina 210,452 98,162
Total 1,914,893 1,681,488 Less accumulated depreciation (879,479) (830,853)
Net $ 1,035,414 $ 850,635
Assuming that current agreements are carried to contractual termination, minimum tenant commitments due to the Port over the next five years are as follows (in thousands):
Rental MAG Fiscal Year Ending income income
2013 $ 43,574 $ 235,049 2014 44,010 235,049 2015 44,450 251,963 2016 44,894 251,963 2017 45,343 251,963
Total $ 222,271 $ 1,225,987
12. Pension and Other Postemployment Benefit Plans
Los Angeles City Employees Retirement System
A. Retirement Plan Description
All full-time employees of the Port are eligible to participate in the Los Angeles City Employees’ Retirement System (LACERS) of the City, a single-employer defined benefit pension plan (the plan). LACERS serves as a common investment and administrative agent for various City departments and agencies that participate in LACERS. The Port makes contributions to LACERS for its pro rata share of retirement costs attributable to its employees. The Port Police joined the Los Angeles Fire and Police Pensions System (LAFPP) effective July 1, 2007.
PORT OF LOS ANGELES (HARBOR DEPARTMENT OF THE CITY OF LOS ANGELES)
Notes to Financial Statements
June 30, 2012 and 2011
- 76 - Continued…..
LACERS provides retirement, disability, death benefits, postemployment healthcare benefits, and annual cost-of-living adjustments based on the employees’ years of service, age, and final compensation. Employees with ten or more years of service may retire if they are at least 55 years old, or if the retirement date is between October 2, 1996 and September 30, 1999 at age 50 or older with at least 30 years of service. Normal retirement allowances are reduced for employees under age 60 at the time of retirement, unless they have more than 30 years of service and are age 55 or older. Employees aged 70 or above may retire at any time with no required minimum period of service. LACERS does not have a mandatory retirement age.
B. Actuarially Determined LACERS Contribution Requirements and Contributions Made
The Board of Administration of LACERS establishes and may amend the contribution requirements of System members and the City. Covered employees contribute to LACERS at a rate (8.22% to 13.33%) established through the collective bargaining process for those whose membership began prior to January 1, 1983.
For those who entered membership on or after January 1, 1983, the contribution is a fixed rate of 6% of salary. In 2011, the City Council adopted new ordinances that require members of LACERS represented by certain bargaining groups to contribute an additional 2% or 4% of pay beginning April 24, 2011. As a result, LACERS’ members’ contribution rates at June 30, 2011 are either 6% or 8% of pay. Effective July 1, 2011, contribution rates will be 7%, 9% or 11% of pay, depending upon the terms and conditions of specific Memoranda of Understanding to which the member is subject.
The City subsidizes member contributions as determined by the actuarial consultant of LACERS. For fiscal year 2012, the initial stated contribution rate for LACERS was 27.66% of the City’s covered payroll. On May 10, 2011, the City adopted a supplemental fiscal year 2012 contribution rate of 24.01% in consideration of an additional 4% contribution by members. As a result, a reduced rate of 24.01% will be applied to the portion of covered payroll for employees subject to 4% additional member contribution. The 27.66% rate will only be applied to the covered payroll for those employees who are not contributing the additional 4% consistent with the June 30, 2010 valuation.
Based on the Port’s reported covered payroll of $71.9 million for fiscal year 2012, $66.8 million is subject to the 24.01% rate, and $5.1 million is subject to the 27.66% rate. The Port’s actual contribution to LACERS, including family death benefit, excess benefit, and limited term plans is $17.5 million,100% of the annual required contribution (ARC), $17.8 million (100% of ARC), and $11.6 million (100% of ARC) for the fiscal years ended June 30, 2012, 2011, and 2010, respectively. The allocation of contributions between the pension and postemployment healthcare benefits are not available.
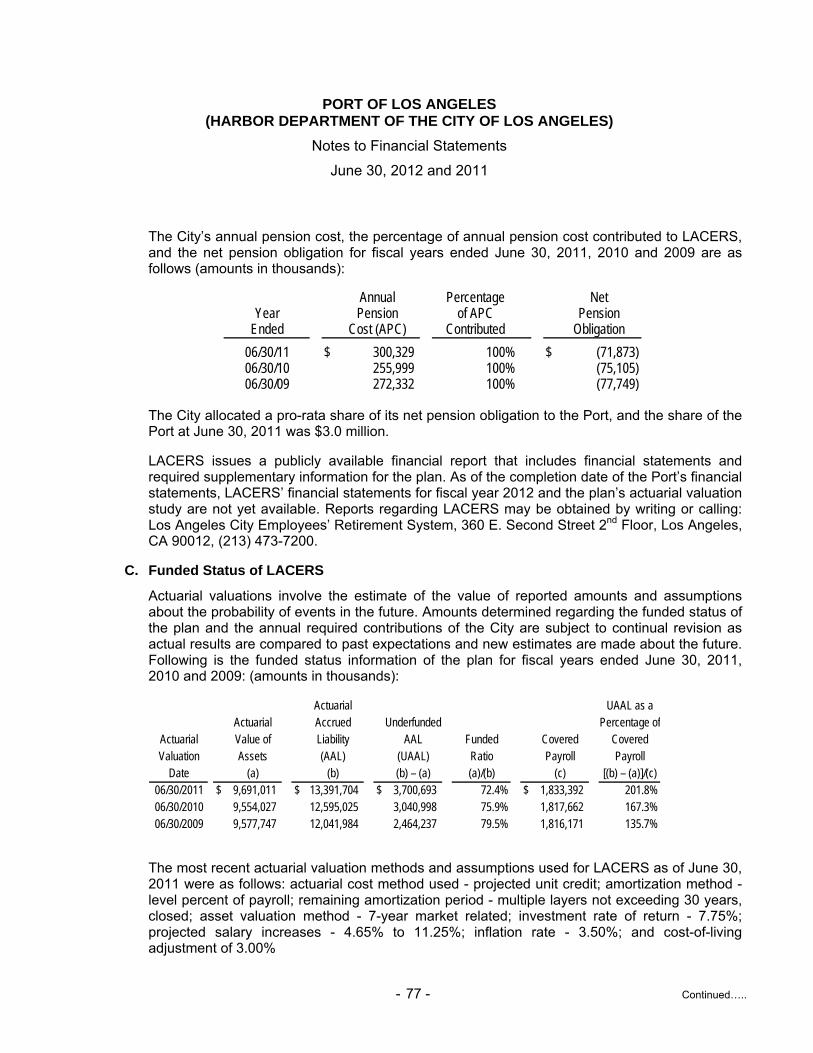
PORT OF LOS ANGELES (HARBOR DEPARTMENT OF THE CITY OF LOS ANGELES)
Notes to Financial Statements
June 30, 2012 and 2011
- 77 - Continued…..
The City’s annual pension cost, the percentage of annual pension cost contributed to LACERS, and the net pension obligation for fiscal years ended June 30, 2011, 2010 and 2009 are as follows (amounts in thousands):
Annual Percentage NetYear Pension of APC Pension
Ended Cost (APC) Contributed Obligation
06/30/11 $ 300,329 100% $ (71,873)06/30/10 255,999 100% (75,105)06/30/09 272,332 100% (77,749)
The City allocated a pro-rata share of its net pension obligation to the Port, and the share of the Port at June 30, 2011 was $3.0 million.
LACERS issues a publicly available financial report that includes financial statements and required supplementary information for the plan. As of the completion date of the Port’s financial statements, LACERS’ financial statements for fiscal year 2012 and the plan’s actuarial valuation study are not yet available. Reports regarding LACERS may be obtained by writing or calling: Los Angeles City Employees’ Retirement System, 360 E. Second Street 2nd Floor, Los Angeles, CA 90012, (213) 473-7200.
C. Funded Status of LACERS
Actuarial valuations involve the estimate of the value of reported amounts and assumptions about the probability of events in the future. Amounts determined regarding the funded status of the plan and the annual required contributions of the City are subject to continual revision as actual results are compared to past expectations and new estimates are made about the future. Following is the funded status information of the plan for fiscal years ended June 30, 2011, 2010 and 2009: (amounts in thousands):
Actuarial UAAL as aActuarial Accrued Underfunded Percentage of
Actuarial Value of Liability AAL Funded Covered CoveredValuation Assets (AAL) (UAAL) Ratio Payroll Payroll
Date (a) (b) (b) – (a) (a)/(b) (c) [(b) – (a)]/(c)06/30/2011 $ 9,691,011 $ 13,391,704 $ 3,700,693 72.4% $ 1,833,392 201.8%06/30/2010 9,554,027 12,595,025 3,040,998 75.9% 1,817,662 167.3%06/30/2009 9,577,747 12,041,984 2,464,237 79.5% 1,816,171 135.7%
The most recent actuarial valuation methods and assumptions used for LACERS as of June 30, 2011 were as follows: actuarial cost method used - projected unit credit; amortization method - level percent of payroll; remaining amortization period - multiple layers not exceeding 30 years, closed; asset valuation method - 7-year market related; investment rate of return - 7.75%; projected salary increases - 4.65% to 11.25%; inflation rate - 3.50%; and cost-of-living adjustment of 3.00%
PORT OF LOS ANGELES (HARBOR DEPARTMENT OF THE CITY OF LOS ANGELES)
Notes to Financial Statements
June 30, 2012 and 2011
- 78 - Continued…..
As mentioned above, information related to the funded status of LACERS for fiscal year 2012 are not yet available as of the completion date of the Port’s financial statements. Separate information for the Port is not available.
D. Other Postemployment Benefits (OPEB)
The Port, as a participant in LACERS, also provides a Retiree Health Insurance Premium Subsidy. Under Division 4, Chapter 11 of the City’s Administrative Code, certain retired employees are eligible for a health insurance premium subsidy. This subsidy is to be funded entirely by the City. Employees with ten or more years of service who retire after age 55, or employees who retire at age 70 with no minimum service requirement, are eligible for a health premium subsidy with a City approved health carrier. LACERS is advance funding the retiree health benefits on an actuarially determined basis.
Projections of benefits include the types of benefits in force at the valuation date. Actuarial calculations reflect a long-term perspective and employ methods and assumptions that are designed to reduce short-term volatility in actuarial accrued liabilities and the actuarial value of assets.
As mentioned before, the actuarial valuation for OPEB for fiscal year 2012 is not yet available as of the completion date of the Port’s financial statements.
The City’s annual OPEB cost, the percentage of annual OPEB cost contributed to the plan, and the net OPEB asset (obligation) for fiscal years ended June 30, 2011 and the two preceding years for the plan are as follows (amounts in thousands):
Annual Percentage of Net OPEBYear OPEB OPEB Cost Asset
Ended Cost (AOC) Contributed (Obligation)06/30/11 $ 107,396 100% $ -- 03/30/10 96,511 100% -- 06/30/09 95,122 100% --
As of June 30, 2011, LACERS OPEB had $1.9 billion actuarial accrued liability (AAL) and $1.5 billion actuarial value of assets, thereby resulting in a net underfunded AAL of $0.4 billion or a funded ratio of $78.9%.
The most recent actuarial valuation methods and assumptions used for LACERS OPEB as of June 30, 2011 were as follows: actuarial cost method used - projected unit credit; amortization method - level percent of payroll; remaining amortization period - multiple layers not exceeding 30 years, closed; asset valuation method - 7-year market related; investment rate of return - 7.75%; projected salary increases - 4.25%; inflation rate - 3.50%; medical healthcare cost trend rate - 8.75%, decreasing by 0.5% for each year for ten years until it reaches an ultimate rate of 5%; and dental healthcare cost trend rate of 5%.
PORT OF LOS ANGELES (HARBOR DEPARTMENT OF THE CITY OF LOS ANGELES)
Notes to Financial Statements
June 30, 2012 and 2011
- 79 - Continued…..
13. City of Los Angeles Fire and Police Pension Plan
A. Retirement Plan Description
The Los Angeles City Council approved Ordinance No. 177214 that allows Harbor Department’s Port Police Officers the option to transfer from LACERS to Tier V of the LAFPP. The election period was from January 8, 2006 to January 5, 2007 and the decision to transfer is irrevocable.
Only “sworn” service with the Port is transferable to LAFPP. Other “nonsworn” services with other City Departments are not eligible for transfer. All new employees hired by the Harbor Department after the effective date of the Ordinance automatically go into either Tier V or Tier VI of LAFPP.
As part of the change, LACERS transferred $6.1 million of Harbor Port Police assets to LAFPP in October 2007 for fiscal year 2007.
B. Actuarially Determined Contribution Requirements and Contributions Made
The Board of Administration/Commissioners of LAFPP establishes and may amend the contribution requirements of members and the City. The City’s annual cost for the LAFPP plan is calculated based on the annual required contribution (ARC) of the employer, an amount actuarially determined in accordance with the parameters of the applicable GASB statements. The ARC represents a level of funding that, if paid on an ongoing basis, is projected to cover normal cost each year and to amortize unfunded actuarial liabilities over a period not to exceed thirty years. The City Administrative Code and related ordinance define member contributions.
In fiscal year 2012, the Port’s contribution rate is 34.11% of covered payroll. The actuary has also calculated a supplemental contribution rate for the new Tier VI plan as approved by voters in March 2011. The new Port Tier VI plan rate is 30.70% of covered payroll. Based on the Port’s reported sworn covered payroll of $10.5 million for Tier V, and $0.3 million for Tier VI, the Port’s pro rata share of the combined actuarially required contribution (ARC) for pension and postemployment healthcare benefits, and actual contribution made to LAFPP was $3.6 million (100% of ARC), $3.1 million (100% of ARC) and $2.0 million (100% of ARC) for the years ended June 30, 2012, 2011 and 2010, respectively. The allocation of contributions between the pension and postemployment healthcare benefits is not available.
The City’s annual LAFPP pension cost and the percentage of annual pension cost contributed to the plan for fiscal years ended June 30, 2011, 2010 and 2009 are as follows (amount in thousands):
Annual Percentage Net pensionYear Pension of APC Asset
Ended Cost (APC) Contributed (Obligation)6/30/11 $ 277,092 100% $ -- 6/30/10 250,517 100% -- 6/30/09 238,698 100% --

PORT OF LOS ANGELES (HARBOR DEPARTMENT OF THE CITY OF LOS ANGELES)
Notes to Financial Statements
June 30, 2012 and 2011
- 80 - Continued…..
C. Funded Status of LAFPP
Actuarial valuations involve estimate of the value of reported amounts and assumptions about the probability of events in the future. Amounts determined regarding the funded status of the plan and the ARC of the City are subject to continual revision as actual results are compared to expectations and new estimates are made about the future. Following is the funded status information for the LAFPP plan for fiscal years ended June 30, 2011, 2010 and 2009 (amounts in thousands).
Actuarial UAAL as aActuarial Accrued Underfunded Percentage of
Actuarial Value of Liability AAL Funded Covered CoveredValuation Assets (AAL) (UAAL) Ratio Payroll Payroll
Date (a) (b) (b) – (a) (a)/(b) (c) [(b) – (a)]/(c)06/30/2011 $ 14,337,669 $ 16,616,476 $ 2,278,807 86.3% $ 1,343,963 169.6%06/30/2010 14,219,581 15,520,625 1,301,044 91.6% 1,356,986 95.9%06/30/2009 14,256,611 14,817,146 560,535 96.2% 1,356,986 41.3%
The most recent actuarial valuation methods and assumptions used for LAFPP as of June 30, 2011 were as follows: actuarial cost method used - entry age normal; amortization method - level dollar for Tier 1, and level percent of payroll for Tiers 2 to 6; remaining amortization period - multiple layers not exceeding 30 years, closed; asset valuation method – 5-year market related prior to June 30, 2008, and 7-year market related after June 30, 2008; investment rate of return - 7.75%; projected salary increases - 5.25% to 12.25%; inflation rate - 3.50%; and cost-of-living adjustment of 3.50% for Tiers 1 and 2, and 3% for Tiers 4 to 6.
The LAFPP issues a publicly available financial report that includes financial statements and required supplementary information for the plan. As of the completion date of the Port’s financial statements, LAFPP’s financial statements and the plan’s actuarial valuation study for fiscal year 2012 are not yet available. Financial and valuation reports may be obtained by writing or calling: Los Angeles Fire and Police Pensions, 360 E. Second Street, Ste 400, Los Angeles, CA 90012, (213) 978-4545.
D. Other Postemployment Benefits (OPEB)
The City Charter, the Administrative Code, and related ordinance define the postemployment healthcare benefits. There are no member contributions for healthcare benefits. The Port, as a participant in LAFPP, also provides a Retiree Health Insurance Premium Subsidy.
Projections of benefits are based on the plan and include the types of benefits in force at the valuation date. Actuarial calculations reflect a long-term perspective and employ methods and assumptions that are designed to reduce short-term volatility in actuarially accrued liabilities and the actuarial value of assets.
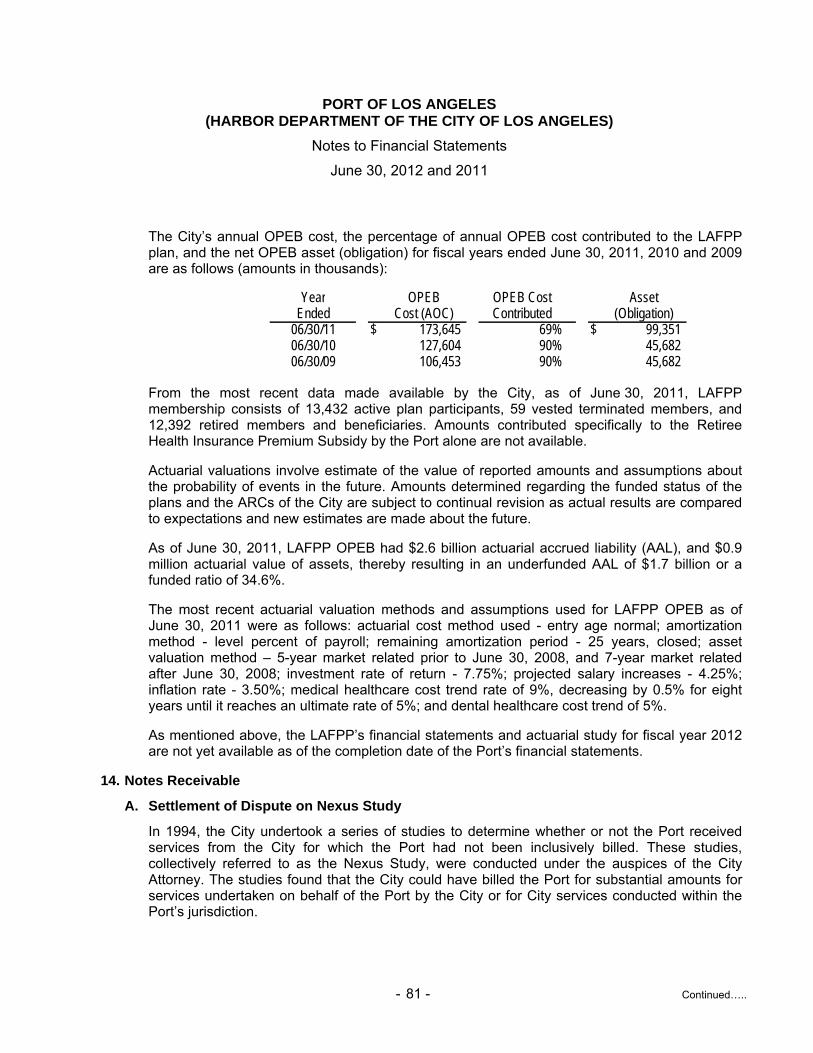
PORT OF LOS ANGELES (HARBOR DEPARTMENT OF THE CITY OF LOS ANGELES)
Notes to Financial Statements
June 30, 2012 and 2011
- 81 - Continued…..
The City’s annual OPEB cost, the percentage of annual OPEB cost contributed to the LAFPP plan, and the net OPEB asset (obligation) for fiscal years ended June 30, 2011, 2010 and 2009 are as follows (amounts in thousands):
Year OPEB OPEB Cost AssetEnded Cost (AOC) Contributed (Obligation)
06/30/11 $ 173,645 69% $ 99,351 06/30/10 127,604 90% 45,682 06/30/09 106,453 90% 45,682
From the most recent data made available by the City, as of June 30, 2011, LAFPP membership consists of 13,432 active plan participants, 59 vested terminated members, and 12,392 retired members and beneficiaries. Amounts contributed specifically to the Retiree Health Insurance Premium Subsidy by the Port alone are not available.
Actuarial valuations involve estimate of the value of reported amounts and assumptions about the probability of events in the future. Amounts determined regarding the funded status of the plans and the ARCs of the City are subject to continual revision as actual results are compared to expectations and new estimates are made about the future.
As of June 30, 2011, LAFPP OPEB had $2.6 billion actuarial accrued liability (AAL), and $0.9 million actuarial value of assets, thereby resulting in an underfunded AAL of $1.7 billion or a funded ratio of 34.6%.
The most recent actuarial valuation methods and assumptions used for LAFPP OPEB as of June 30, 2011 were as follows: actuarial cost method used - entry age normal; amortization method - level percent of payroll; remaining amortization period - 25 years, closed; asset valuation method – 5-year market related prior to June 30, 2008, and 7-year market related after June 30, 2008; investment rate of return - 7.75%; projected salary increases - 4.25%; inflation rate - 3.50%; medical healthcare cost trend rate of 9%, decreasing by 0.5% for eight years until it reaches an ultimate rate of 5%; and dental healthcare cost trend of 5%.
As mentioned above, the LAFPP’s financial statements and actuarial study for fiscal year 2012 are not yet available as of the completion date of the Port’s financial statements.
14. Notes Receivable
A. Settlement of Dispute on Nexus Study
In 1994, the City undertook a series of studies to determine whether or not the Port received services from the City for which the Port had not been inclusively billed. These studies, collectively referred to as the Nexus Study, were conducted under the auspices of the City Attorney. The studies found that the City could have billed the Port for substantial amounts for services undertaken on behalf of the Port by the City or for City services conducted within the Port’s jurisdiction.

PORT OF LOS ANGELES (HARBOR DEPARTMENT OF THE CITY OF LOS ANGELES)
Notes to Financial Statements
June 30, 2012 and 2011
- 82 - Continued…..
It is and has been the policy of the Port to pay the City all of the amounts to which the City is entitled. In light of these studies, the Board of Harbor Commissioners adopted a resolution providing for the reimbursement to the City of certain expenditures incurred by the City on behalf of the Port, but which the City had never inclusively billed the Port. Under its resolution, the Board of Harbor Commissioners authorized the Port to make, and the Port paid to the City, two annual payments of $20.0 million for the 1994/95 and 1995/96 fiscal years. The Board of Harbor Commissioners further authorized the Executive Director to negotiate additional amounts as may be determined to be due, and accordingly, a memorandum of understanding (MOU) with the City was executed on June 27, 1997 (1997 MOU).
The California State Lands Commission (the Commission) is responsible for oversight of the State’s Tideland Trust Lands. This Commission, together with the State Office of Attorney General, has expressed concerns regarding the methodologies employed in the studies and whether such transfers of monies from the Port to the City comply with the criteria for compliance with applicable California State Tidelands Trust Land laws. Prior to the adoption of the above-referenced resolution, the California State Lands Commission officials and the Office of the Attorney General requested the Board of Harbor Commissioners to postpone any decision involving these trust funds until the California State Lands Commission and Office of Attorney General could complete an inquiry into the studies and transfers. Subsequently, various organizations, including the Steamship Association of Southern California, which represents carriers using the Port, together with the California State Lands Commission and Office of Attorney General, have brought legal action against the City and Port regarding the Board of Harbor Commissioners’ action.
On January 19, 2001, the City, along with the Port and the California State Lands Commission, entered into a settlement and mutual release agreement to resolve their disputes concerning the City’s entitlement to historic and future reimbursements for costs the City incurred or would incur providing services to the Port. The settlement agreement provides that the City, as reimbursement for payments made by the Port to the City for retroactive billings for City services provided during the period July 1, 1977 through June 30, 1994, inclusive, pay the Port $53.4 million in principal plus 3% simple interest over a 15-year period.
The settlement agreement also provides that the City reimburse the Port for the payment differential, that amount representing the difference between the actual payments and the amount to which the City would have been entitled to reimbursement during fiscal year 1994–1995 through fiscal year 2000–2001, inclusive, had the reimbursement been computed during each of those fiscal years using the settlement formula. This amount is estimated at $8.4 million. Payment for this period is to be reimbursed to the Port over 15 years, including 3% simple interest. The agreement also states that at any time after five years from January 19, 2001, the City, the Port, and California State Lands Commission may negotiate to amend this agreement to account for new or changed circumstances.
PORT OF LOS ANGELES (HARBOR DEPARTMENT OF THE CITY OF LOS ANGELES)
Notes to Financial Statements
June 30, 2012 and 2011
- 83 - Continued…..
The State of California (the State), the City, and the Port agreed to mutually release and discharge the other from any and all claims, demands, obligations, and causes of action, of whatever kind or nature pertaining in any way to the use, payment, transfer, or expenditure for any of the services or facilities identified in the Nexus Study or the 1997 MOU and provided for during the period July 1, 1977 through June 30, 2002.
Accordingly, the Port of Los Angeles had recorded the amount due from the City as a long-term notes receivable of $14.7 million and $19.3 million; and current portion of notes receivable of $4.6 million and $4.5 million as of June 30, 2012 and 2011, respectively.
B. Note Receivable – Yusen
In order to settle the then-outstanding $2.4 million terminal construction cost overruns, the Port agreed in 1994 that Yusen, one of the Port container terminal tenants, be permitted to pay over 22 years in equal monthly installments of $0.1 million. To record the transaction, an amortization schedule using a 5% interest rate was prepared and the note balance was adjusted to $1.5 million, with the balance of $0.9 million recognized as the Port’s capital assets in fiscal year 1995. The note matures in October 2015. The long-term note receivable balance outstanding on the Yusen note is $0.3 million and $0.4 million at June 30, 2012 and 2011 respectively; while the current portion is $0.1 million for both fiscal years 2012 and 2011.
15. Commitments, Litigations and Contingencies
A. Commitments
Open purchase orders and uncompleted construction contracts amounted to approximately $225.1 million as of June 30, 2012. Such open commitments do not lapse at the end of the Port’s fiscal year and are carried forth to succeeding periods until fulfilled.
In 1985, the Port received a parcel of land, with an estimated value of $14.0 million from the federal government, for the purpose of constructing a marina. The Port has agreed to reimburse the federal government up to $14.0 million from excess revenues, if any, generated from marina operations after the Port has recovered all costs of construction. No such payments were made in 2012 or 2011.
The Port is also involved in certain litigation arising in the normal course of business. In the opinion of management, there is no pending litigation or unasserted claims, the outcome of which would materially affect the financial position of the Port.
PORT OF LOS ANGELES (HARBOR DEPARTMENT OF THE CITY OF LOS ANGELES)
Notes to Financial Statements
June 30, 2012 and 2011
- 84 - Continued…..
B. Alameda Corridor Transportation Authority Agreement (ACTA)
In August 1989, the Port and the Port of Long Beach (the POLB and, together with the Port, the Ports) entered into a joint exercise of powers agreement and formed ACTA for the purpose of establishing a comprehensive transportation corridor and related facilities consisting of street and railroad rights-of-way and an improved highway and railroad network along Alameda Street between the Santa Monica Freeway and the Ports in San Pedro Bay, linking the Ports to the central Los Angeles area. The Alameda Corridor began operating on April 15, 2002. ACTA is governed by a seven-member board, which comprises of two members from each Port, one each from the Cities of Los Angeles and Long Beach and one from the Metropolitan Transportation Authority. In 2003, ACTA agreed to an expanded mission to develop and support projects that more effectively move cargo to points around Southern California, ease truck congestion, improve air quality, and make roads safer. If in the future ACTA becomes entitled to distribute income or make equity distributions, the Ports shall share any such income or equity distributions equally.
In October 1998, the Ports, ACTA, and the railroad companies, which operate on the corridor, entered into a Corridor Use and Operating Agreement (Corridor Agreement). The Corridor Agreement obligates the privilege of using the corridor to transport cargo into and out of the Ports. ACTA negotiated with BNSF Railway Company (BNSF) and Union Pacific (UP) regarding certain types of cargo movements (trans load movements) for which BNSF and UP are not paying use fees. In the Settlement and Release Agreement (the Agreement), dated as July 5, 2006, ACTA, BNSF, and UP agreed to resolve the “Trans loading Dispute.” ACTA, the Ports, the City of Los Angeles, and the City of Long Beach (the ACTA Releasing Parties) each release, acquit, and discharge BNSF and UP of all liability and costs, as stated in the Agreement, arising from or relating to the Trans loading Dispute. BNSF and UP (the Railroad Releasing Parties) each release, acquit, and discharge the ACTA Releasing Parties from any and all liability and costs, as stated in the Agreement, arising from or relating to any claim by the Railroad Releasing Parties. These use fees are used to pay (a) the debt service that ACTA incurs on approximately $1.20 billion of bonds, which ACTA issued in early 1999 and approximately $686 million of bonds issued in 2004, and (b) for the cost of funding required reserves and costs associated with the financing, including credit enhancement and rebate requirements, if any (collectively, ACTA Obligations). Use fees end after 35 years or sooner if the ACTA Obligations are paid off earlier.
If ACTA revenues are insufficient to pay ACTA Obligations, the Corridor Agreement obligates each Port to pay up to twenty percent (20%) of the shortfall (Shortfall) on an annual basis. If this event occurs, the Ports’ payments to ACTA are intended to provide cash for debt service payments and to assure that the Alameda Corridor is available to maintain continued cargo movement through the Ports. The Ports are required to include expected Shortfall payments in their budgets, but Shortfall payments are subordinate to other obligations of the Port, including the bonds and commercial paper currently outstanding, the Port does not and is not required to take Shortfall payments into account when determining whether it may incur additional indebtedness or when calculating compliance with rate covenants under their respective bond indentures and resolutions.
PORT OF LOS ANGELES (HARBOR DEPARTMENT OF THE CITY OF LOS ANGELES)
Notes to Financial Statements
June 30, 2012 and 2011
- 85 - Continued…..
In April 2004, it was estimated by ACTA that the Ports would be required to make Shortfall payments totaling approximately $20.5 million (the Port and POLB each being liable for their one-half share of $10.3 million) through 2027. Pursuant to the ACTA Operating Agreement, the Port is obligated to include any forecasted Shortfall payments in its budget each fiscal year. The Port made a shortfall payment of $3.0 million in September 2011.
C. Community Redevelopment Agency Agreement
On September 20, 2007, the Los Angeles Board of Harbor Commissioners approved the agreement between the City of Los Angeles and the Community Redevelopment Agency of the City of Los Angeles (CRALA) for the purpose of readying the underutilized and contaminated industrial properties within the Wilmington Industrial Park, the project area for development.
CRALA may execute note(s) in an aggregate amount not to exceed $25.0 million, and will accrue interest at the General Pool Rate compounded monthly. All notes will become due and payable sixty months from the date of the first executed note pursuant to this agreement unless the term of the note(s) is otherwise extended and approved in writing by CRALA and the Port. The CRALA shall pay down the line of credit by applying proceeds generated from the periodic sale and disposition of acquired properties.
The CRALA was dissolved on February 1, 2012. As of February 1, 2012 and June 30, 2011, there were no drawdowns made by CRALA from this line of credit.
D. TraPac Project and Environmental Impact Report
On December 6, 2007, the Board of Harbor Commissioners (BHC) certified the Final Environmental Impact Report (FEIR) for TraPac, Inc (TraPac), a terminal operator, and approved the TraPac project. The project involves the development of the various improvements to Berths 136-147, currently occupied by TraPac. Subsequent to the project approval, certain entities (Appellants) appealed to the City Council the certification/project approval under the provisions of the California Environmental Quality Act (CEQA).
On April 3, 2008, the BOHC approved an MOU between the City and the Appellants of the TraPac FEIR. The term of the MOU is five years, and after the first five years, the agreement may be renewed for a successive five-year period by mutual agreement of the Port and a majority of the Appellants. The MOU provides for the revocation of the appeals and the establishment of a Port Community Mitigation Trust Fund (PCMTF) to be operated by a nonprofit entity. The nonprofit created to provide administrative services for this fund is the Harbor Community Benefit Foundation (HCBF). The California Community Foundation (CCF) Community Initiatives Fund (CIF) is a nonprofit entity operated by the CCF to provide fund management services to PCMTF.
The Port has provided the first two years funding of $12.04 million and $4.02 million in the PCMTF geared towards the identified Trapac projects in the MOU. Based on the volume of cargo processed in the third year, no additional funding was necessary.

PORT OF LOS ANGELES (HARBOR DEPARTMENT OF THE CITY OF LOS ANGELES)
Notes to Financial Statements
June 30, 2012 and 2011
- 86 - Continued…..
On November 3, 2011, the BHC approved an agreement with the CCF CIF to provide fund management services in relation to the PCMTF Operating Agreement. According to the PCMTF Operating Agreement, the Port shall transfer funds from its existing PCMTF to the new PCMTF held by the CCF upon execution of the agreement with CCF. The requisite steps set out by the CCF CIF Agreement have been taken, hence, the transfer of funds to the CIF must be done. In fiscal year 2012, $9.8 million was transferred from the PCMTF to CCF CIF.
As of June 30, 2012, a total of $ 16.8 million has been disbursed from the PCMTF including the $9.8 million funds transferred to the CCF CIF. Total fund balance, including interest earned of the PCMTF at the end of the fiscal year was $0.1 million.
16. Related-Party Transactions
During the normal course of business, the Port is charged for services provided and use of land owned by the City, the most significant of which is related to fire protection, museum/park maintenance, and legal services. Total amounts charged by the City for services approximate $38.4 million and $38.1 million in fiscal years 2012 and 2011, respectively.
17. Capital Contributions
Amounts either received or to be reimbursed for the restricted purpose of the acquisition, construction of capital assets, or other grant-related capital expenditures are recorded as capital contributions. During the years ended June 30, 2012 and 2011, the Port reported capital contributions of $31.3 million and $12.1 million, respectively, for certain capital construction and grant projects.
18. Natural Resources Defense Council Settlement Judgment
In March 2003, the Port of Los Angeles settled a lawsuit entitled: Natural Resources Defense Council, Inc., et al. v. City of Los Angeles, et al., regarding the environmental review of a Port project. The settlement calls for a total of $50.0 million in mitigation measures to be undertaken by the Port. This $50.0 million charge was recorded as expense in fiscal year 2003.
The terms of the agreement require that the Port fund various mitigation activities in the amount of $10.0 million per year over a five-year term ending in fiscal year 2007. As of June 30, 2009, a total of $50.0 million were transferred from Harbor Revenue Fund to the restricted mitigation funds.
Pursuant to the settlement, the Port is also obligated to expend up to $5.0 million to retrofit customer vessels to receive shore-side power as an alternative to using on-board diesel fueled generators. Through the end of fiscal year 2009, the Port has spent $5.0 million for this program.
In June 2004, the Port agreed to amend the original settlement to include, and transferred to the restricted fund, an additional $3.5 million for the creation of parks and open space in San Pedro.
PORT OF LOS ANGELES (HARBOR DEPARTMENT OF THE CITY OF LOS ANGELES)
Notes to Financial Statements
June 30, 2012 and 2011
- 87 - Continued…..
The settlement agreement also established a throughput restriction at China Shipping Terminal per calendar year. Actual throughput at the terminal exceeded the cap for calendar years 2008, 2007, 2006, and 2005, and payments of $1.8 million, $6.9 million, $5.8 million, and $3.9 million, respectively, were made for having exceeded the caps. The Port charged to nonoperating expense and deposited in the restricted mitigation funds the said amounts in June 2009, June 2008, May 2007, and April 2006, respectively. Total deposits for the four years were $18.3 million, with the June 2009 deposit for calendar year 2008 being the last payment for excess throughput required under the settlement agreement.
As of June 30, 2012, the Port has disbursed a total of $ 47.1 million from the $50.0 million in mitigation funds, of which $4.0 million was made in fiscal year 2012, as provided in accordance with the provisions of the settlement.
19. Cash Funding of Reserve Fund
As of June 30, 2012, the Port had $840.1 million of outstanding parity bonds. Each Indenture of the outstanding bonds requires the Port to establish a reserve fund and authorizes the Port to obtain one or more reserve sureties in lieu of fully funding the reserve fund with cash. Three bond insurers (Ambac, FGIC, and MBIA) provide the reserve sureties for the Port’s outstanding bonds. Until December 2007, these bond insurers maintained “AAA” ratings from the three rating agencies: Fitch, Moody’s, and S&P. Starting in January 2008, the rating agencies began downgrading the bond insurers. The Port filed material event notices as part of its continuing disclosure undertakings subsequent to each of the related downgrades or placements on negative outlook. The downgrade of MBIA by S&P on June 5, 2008 triggered certain specific requirements in compliance with the 2005/2006 Indenture. The Port opted to cash fund its reserve funds in order to comply with its bond covenants. In doing so, the Board of Harbor Commissioners, on September 18, 2008, approved the one-time cash funding of the entire reserve requirement of $61.5 million and transferred from the Harbor Emergency Fund (Fund 751) to the Port’s bond trustee in December 2008. Subsequent to the refunding in July 2011, the total reserve fund balance increased to $63.6 million. To be consistent with the bond covenants in the Indenture, the required amount for the individual reserve fund will be reevaluated on a yearly basis. The excess amounts in the Common Reserve will be transferred to the interest fund and/or redemption fund to be used to pay interest and redeem bonds.
PORT OF LOS ANGELES (HARBOR DEPARTMENT OF THE CITY OF LOS ANGELES)
Notes to Financial Statements
June 30, 2012 and 2011
- 88 -
20. Subsequent Events Commercial Paper Program On June 7, 2012, the Board of Harbor Commissioners (Board) approved an increase in the standby line of credit to $250.0 million from $200.0 million and extended the commercial paper program through July 2015. At the same meeting, the Board approved the replacement of the commercial paper liquidity provider, JP Morgan Chase Bank, whose contract expired on July 29, 2012, with Mizuho Corporate Bank and Wells Fargo Bank at $125.0 million each. Redemption of 2002 Harbor Revenue Bonds Series A On August 1, 2012, the Port redeemed the outstanding $18.1 million of 2002 Harbor Revenue Bonds Series A, which had a 5.50% coupon rate. The bonds were redeemed with $6.7 million of debt service reserve fund proceeds and with $11.4 million of cash from operations. With the repayment, the debt service reserve requirement was reduced to $58.2 million.
Alameda Corridor Transportation Authority Agreement (ACTA)
In ACTA’s Notice of Port Shortfall Advance dated August 8, 2012, a revised Shortfall Advance of $3.0 million each from the Ports of Los Angeles (POLA) and Long Beach is due no later than September 24, 2012. On June 30, 2012, POLA charged this shortfall amount to nonoperating expense, and was recorded as a current liability. POLA paid this shortfall advance on September 14, 2012.
The Port has evaluated subsequent events through November 14, 2012, the date the financial statements were available to be issued, and has determined that no other significant subsequent events have occurred through that date.
Supplemental Information
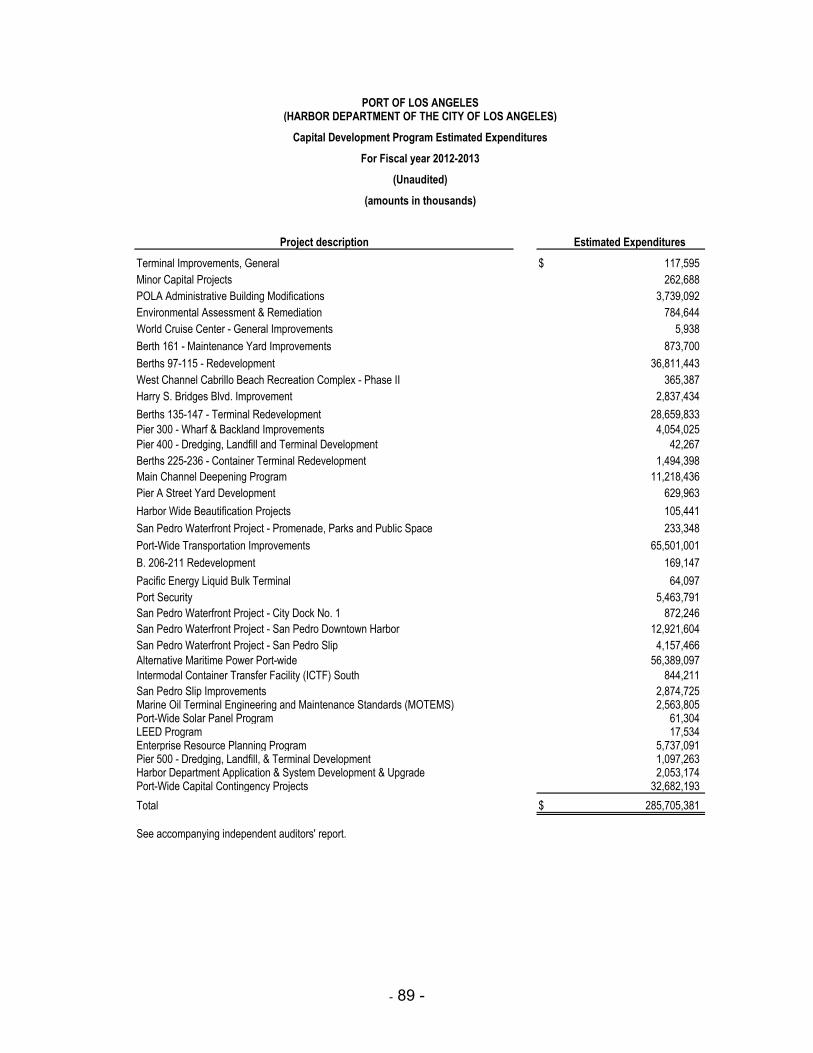
PORT OF LOS ANGELES(HARBOR DEPARTMENT OF THE CITY OF LOS ANGELES)
Capital Development Program Estimated Expenditures
For Fiscal year 2012-2013
(Unaudited)
(amounts in thousands)
Project description Estimated Expenditures
Terminal Improvements, General $ 117,595
Minor Capital Projects 262,688
POLA Administrative Building Modifications 3,739,092
Environmental Assessment & Remediation 784,644
World Cruise Center - General Improvements 5,938
Berth 161 - Maintenance Yard Improvements 873,700
Berths 97-115 - Redevelopment 36,811,443
West Channel Cabrillo Beach Recreation Complex - Phase II 365,387
Harry S. Bridges Blvd. Improvement 2,837,434
Berths 135-147 - Terminal Redevelopment 28,659,833
Pier 300 - Wharf & Backland Improvements 4,054,025
Pier 400 - Dredging, Landfill and Terminal Development 42,267
Berths 225-236 - Container Terminal Redevelopment 1,494,398
Main Channel Deepening Program 11,218,436
Pier A Street Yard Development 629,963
Harbor Wide Beautification Projects 105,441
San Pedro Waterfront Project - Promenade, Parks and Public Space 233,348
Port-Wide Transportation Improvements 65,501,001
B. 206-211 Redevelopment 169,147
Pacific Energy Liquid Bulk Terminal 64,097
Port Security 5,463,791
San Pedro Waterfront Project - City Dock No. 1 872,246
San Pedro Waterfront Project - San Pedro Downtown Harbor 12,921,604
San Pedro Waterfront Project - San Pedro Slip 4,157,466
Alternative Maritime Power Port-wide 56,389,097
Intermodal Container Transfer Facility (ICTF) South 844,211
San Pedro Slip Improvements 2,874,725 Marine Oil Terminal Engineering and Maintenance Standards (MOTEMS) 2,563,805 Port-Wide Solar Panel Program 61,304 LEED Program 17,534 Enterprise Resource Planning Program 5,737,091 Pier 500 - Dredging, Landfill, & Terminal Development 1,097,263 Harbor Department Application & System Development & Upgrade 2,053,174 Port-Wide Capital Contingency Projects 32,682,193
Total $ 285,705,381
See accompanying independent auditors' report.
- 89 -
PORT OF LOS ANGELES(HARBOR DEPARTMENT OF THE CITY OF LOS ANGELES)
Revenue Statistics Last Ten Fiscal Years
(Unaudited)
2003 2004 2005 2006 2007 2008 2009 2010 2011 2012
Revenue Information
Revenue Rates
General cargo tariff rate 5.95 5.95 5.95 6.25 6.25 6.25 6.25 6.25 6.25 6.25
Basic dockage (600’) 2,236 2,348 2,348 2,465 2,465 2,465 2,465 2,465 2,465 2,465
Required rate of return 12.0% 12.0% 12.0% 12.0% 12.0% 12.0% 12.0% 12.0% 12.0% 12.0%
Containerized cargo volume
(in millions of TEUs) 6.7 7.4 7.3 7.8 8.7 8.1 7.3 7.2 7.9 8.2
Inbound tonnage (million tons) 94 104 102 113 118 105 94 88 94 98
Outbound tonnage (million tons) 53 58 60 69 72 65 66 67 68 75
Revenue tons (million)
General cargo 131.9 146.3 145.0 155.2 171.9 161.9 144.3 145.8 149.1 164.2
Liquid bulk 11.4 11.9 12.8 22.8 15.4 6.2 11.1 10.7 10.6 9.9
Dry bulk 4.2 3.9 4.3 3.6 2.8 1.9 2.0 1.4 1.2 1.1
Total revenue tons (million) 147.5 162.1 162.1 181.6 190.1 170.0 157.4 157.9 160.9 175.2
See accompanying independent auditors’ report.
- 90 -
PORT OF LOS ANGELES
(HARBOR DEPARTMENT OF THE CITY OF LOS ANGELES)
Other Operating Information
Last Ten Fiscal Years
(Unaudited)
2003 2004 2005 2006 2007 2008 2009 2010 2011 2012
Other Operating Information
Miles of waterfront 43 43 43 43 43 43 43 43 43 43
Number of major container terminals 8 8 8 8 8 8 8 8 8 8
Number of cargo terminals 27 26 26 27 25 25 25 24 24 24
Vessel arrivals 2,845 2,812 2,646 2,771 2,920 2,467 2,322 2,124 2,236 2,100
Cruise passengers 1,057,293 803,308 1,097,204 1,205,947 1,194,984 1,191,449 990,965 802,899 667,434 515,827
Vehicles 347,067 213,933 242,024 232,149 144,068 185,978 109,634 147,935 183,126 215,374
Full time employees 594 634 659 717 806 935 971 948 959 963
See accompanying independent auditors’ report.
- 91 -
Summary of Revenues, Expenses, and Changes in Net Assets
Last Ten Fiscal Years
(Unaudited)
(amounts In thousands)
2003 2004 2005 2006 2007 2008 2009 2010 2011 2012
Operating revenues
Shipping services $ 281,700 $ 293,977 $ 315,615 $ 353,390 $ 369,972 $ 374,878 $ 329,347 $ 327,630 $ 343,498 $ 357,716 Rentals 36,563 33,261 34,630 33,876 40,322 45,524 42,368 43,141 45,428 43,143 Royalties, fees, and other operating
revenues 5,013 5,016 5,384 4,893 6,867 5,943 30,509 36,047 11,577 8,928
Total operating revenues 323,276 332,254 355,629 392,159 417,161 426,345 402,224 406,818 400,503 409,787
Operating expensesSalaries and benefits 44,427 53,165 58,182 65,705 74,313 95,444 99,350 96,838 103,693 104,910 Marketing and public relations 3,654 3,769 3,455 3,333 4,521 5,274 3,676 2,594 3,055 3,380 Travel and entertainment 658 758 743 822 604 1,128 635 569 843 991 Outside services 21,971 32,104 39,672 33,673 33,277 37,937 29,498 24,428 30,601 29,426 Materials and supplies 3,771 4,682 5,320 5,400 5,813 8,950 8,121 6,634 6,556 6,717 City services and payments 18,525 18,729 22,361 20,821 28,640 27,101 28,704 31,142 22,353 22,236 Other operating expenses 55,409 16,967 41,158 54,378 16,607 45,918 84,159 48,030 42,594 32,146
Total operating expenses before depreciation 148,415 130,174 170,891 184,132 163,775 221,752 254,143 210,235 209,695 199,806
Operating Income before depreciation 174,861 202,080 184,738 208,027 253,386 204,593 148,081 196,583 190,808 209,981
Depreciation 59,365 67,934 70,040 98,779 88,106 78,295 83,413 87,255 90,468 100,485
Operating Income 115,496 134,146 114,698 109,248 165,280 126,298 64,668 109,328 100,340 109,496
Nonoperating revenues (expenses)Income from investments in Joint Powers
Authorities 3,717 2,795 3,543 4,302 4,675 4,440 2,980 5,832 (333) 1,851 Interest and investment income 11,430 2,298 7,266 9,582 23,773 34,863 18,824 11,671 6,436 9,486 Interest expense (44,293) (43,034) (42,279) (37,787) (50,038) (38,052) (36,979) (35,663) (3,704) (10,538) Other income and expenses, net (18,698) (13,724) 11,842 7,222 11,018 (2,536) (7,625) (2,951) (6,667) (8,359)
Net nonoperating revenues (47,844) (51,665) (19,628) (16,681) (10,572) (1,285) (22,800) (21,111) (4,268) (7,560)
Income before capital contributions 67,652 82,481 95,070 92,567 154,708 125,013 41,868 88,217 96,072 101,936
Capital contributions 1,386 867 -- 2,044 4,145 14,161 4,103 16,950 12,059 31,307
Special item -- -- -- -- (22,291) -- -- -- -- --
Deletions of capital contribution -- (2,518) -- -- -- -- -- -- -- --
Changes in net assets 69,038 80,830 95,070 94,611 136,562 139,174 45,971 105,167 108,131 133,243
Total net assets – beginning of year 1,861,758 1,930,796 2,011,626 2,106,696 2,201,307 2,337,869 2,383,616 2,429,587 2,534,754 2,642,885
Total net assets – end of year $ 1,930,796 $ 2,011,626 $ 2,106,696 $ 2,201,307 $ 2,337,869 $ 2,477,043 $ 2,429,587 $ 2,534,754 $ 2,642,885 $ 2,776,128 Net assets:
Invested in capital assets,net of related debt 1,786,780 1,853,776 1,890,002 1,854,468 1,931,037 1,985,653 2,101,396 2,164,885 2,278,052 2,397,744
Restricted 95 17 16 63,917 62 9 61,608 67,844 67,341 67,796 Unrestricted 143,921 157,883 216,678 282,922 406,770 491,381 266,583 302,025 297,492 310,588
Total net assets $ 1,930,796 $ 2,011,676 $ 2,106,696 $ 2,201,307 $ 2,337,869 $ 2,477,043 $ 2,429,587 $ 2,534,754 $ 2,642,885 $ 2,776,128 See accompanying independent auditors’ report.
(HARBOR DEPARTMENT OF THE CITY OF LOS ANGELES)
PORT OF LOS ANGELES
- 92 -
PORT OF LOS ANGELES(HARBOR DEPARTMENT OF THE CITY OF LOS ANGELES)
Summary of Debt Service Coverage (Pledged Revenue)
Last Ten Fiscal Years
(Unaudited)
(In thousands of dollars)
Trade routes 2003 2004 2005 2006 2007 2008 2009 2010 2011 2012
Operating revenues (including investment/interestincome) (1) $ 338,423 $ 337,347 $ 366,438 $ 406,043 $ 445,609 $ 465,648 $ 424,028 $ 424,306 $ 406,606 $ 419,158
Operating expenses (2) 148,415 130,174 170,891 184,132 163,775 221,752 254,143 210,235 209,695 199,806
Net available revenue $ 190,008 $ 207,173 $ 195,547 $ 221,911 $ 281,834 $ 243,896 $ 169,885 $ 214,071 $ 196,911 $ 219,352
Debt service, revenue bonds $ 54,097 $ 57,994 $ 58,515 $ 58,143 $ 58,293 $ 61,318 $ 61,298 $ 66,851 $ 72,736 $ 71,382 Debt services, commercial papers 988 1,029 2,021 3,431 792 — — — 191 227
Total debt service (3) $ 55,085 $ 59,023 $ 60,536 $ 61,574 $ 59,085 $ 61,318 $ 61,298 $ 66,851 $ 72,927 $ 71,609
Net available revenue coverage 3.4 3.5 3.2 3.6 4.8 4.0 2.8 3.2 2.7 3.1
Net cash flow from operations $ 215,117 $ 208,762 $ 226,037 $ 201,575 $ 246,665 $ 252,898 $ 151,264 $ 185,416 $ 158,228 $ 217,113
Net operating cash flow Coverage 3.9 3.5 3.7 3.3 4.2 4.1 2.5 2.8 2.2 3.0
(1) Operating revenues include pledged pooled investment and interest income.
(2) Depreciation and amortization expenses, interest expense, and other nonoperating expenses are not included.
Note: Details regarding the Port of Los Angeles’ outstanding debt can be found in the notes to the financial statements.
See accompanying independent auditors’ report.
(3) Debt service includes principal and interest payments on issued bonds as well as on commercial paper notes, which are senior debt backed by pledged-revenue. Debt service does not include loans from the California
Department of Boating and Waterways, which are not backed by pledged-revenue.
- 93 -
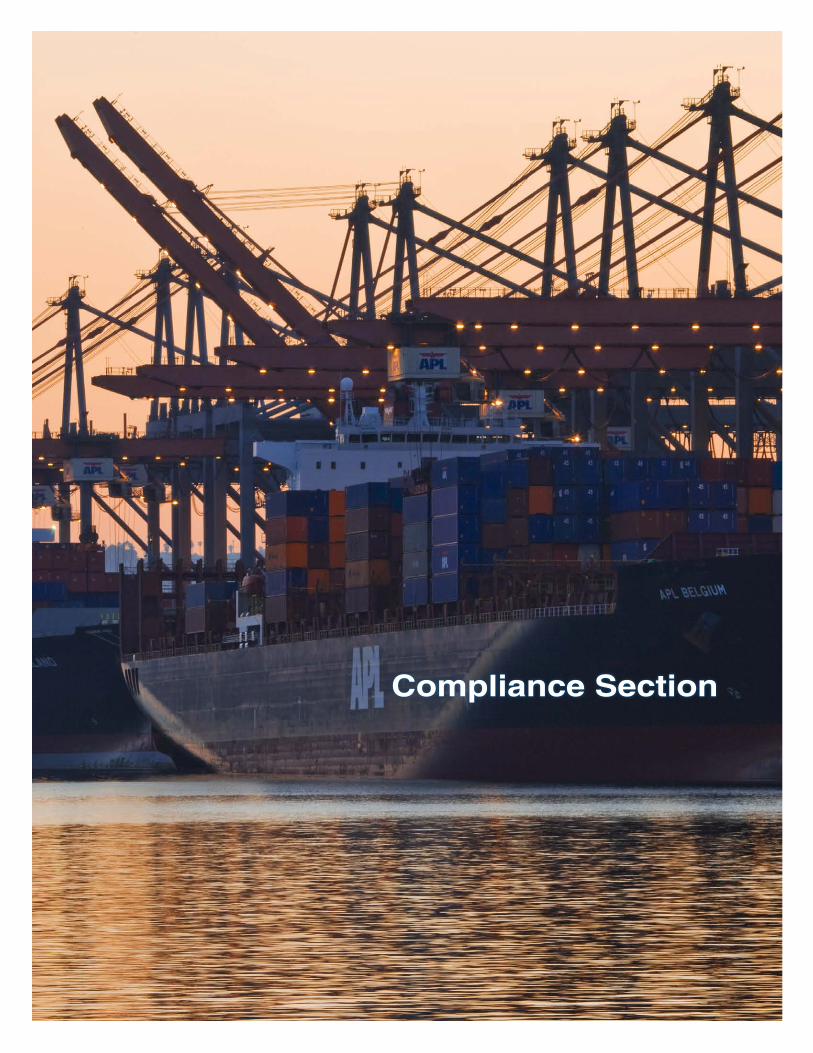
Compliance Section
KPMG LLP Suite 2000 355 South Grand Avenue Los Angeles, CA 90071-1568
KPMG LLP is a Delaware limited liability partnership, the U.S. member firm of KPMG International Cooperative (“KPMG International”), a Swiss entity.
Report on Internal Control over Financial Reporting and on Compliance and Other Matters Based on an Audit of Financial Statements Performed in Accordance with Government Auditing
Standards
The Board of Commissioners Port of Los Angeles (Harbor Department of the City of Los Angeles):
We have audited the financial statements of the Port of Los Angeles (Harbor Department of the City of Los Angeles) (the Port), an enterprise fund of the City of Los Angeles, California, as of and for the year ended June 30, 2012, and have issued our report thereon dated November 14, 2012. We conducted our audit in accordance with auditing standards generally accepted in the United States of America and the standards applicable to financial audits contained in Government Auditing Standards, issued by the Comptroller General of the United States.
Internal Control over Financial Reporting
Management of the Port is responsible for establishing and maintaining effective internal control over financial reporting. In planning and performing our audit, we considered the Port’s internal control over financial reporting as a basis for designing our auditing procedures for the purpose of expressing our opinion on the financial statements, but not for the purpose of expressing an opinion on the effectiveness of the Port’s internal control over financial reporting. Accordingly, we do not express an opinion on the effectiveness of the Port’s internal control over financial reporting.
A deficiency in internal control over financial reporting exists when the design or operation of a control does not allow management or employees, in the normal course of performing their assigned functions, to prevent, or detect and correct misstatements on a timely basis. A material weakness is a deficiency, or combination of deficiencies, in internal control over financial reporting, such that there is a reasonable possibility that a material misstatement of the entity’s financial statements will not be prevented, or detected and corrected on a timely basis.
Our consideration of internal control over financial reporting was for the limited purpose described in the first paragraph of this section and was not designed to identify all deficiencies in internal control over financial reporting that might be deficiencies, significant deficiencies, or material weaknesses. We did not identify any deficiencies in internal control over financial reporting that we consider to be material weaknesses, as defined above.
95
Compliance and Other Matters
As part of obtaining reasonable assurance about whether the Port’s financial statements are free of material misstatement, we performed tests of its compliance with certain provisions of laws, regulations, contracts, and grant agreements, noncompliance with which could have a direct and material effect on the determination of financial statement amounts. However, providing an opinion on compliance with those provisions was not an objective of our audit, and accordingly, we do not express such an opinion. The results of our tests disclosed no instances of noncompliance or other matters that are required to be reported under Government Auditing Standards.
This report is intended solely for the information and use of management, the Port’s Board of Commissioners, others within the entity, pass-through entities, and federal awarding agencies, and is not intended to be and should not be used by anyone other than these specified parties.
November 14, 2012