Container Terminal Automation - Port of Los Angeles Container Terminal Automation March 2014 City of...
21
DRAFT Container Terminal Automation March 2014 City of Los Angeles Harbor Department Planning and Economic Development Division
Transcript of Container Terminal Automation - Port of Los Angeles Container Terminal Automation March 2014 City of...

DRAFT
Container Terminal Automation
March 2014
City of Los Angeles Harbor Department Planning and Economic Development Division
ZULIANIT
Typewritten Text
TRANSMITTAL 3

Page 1 of 20 03/27/2014
Overview of Automated Container Terminal Technologies
In the context of this report1, automated terminals are defined as terminals with at least some container handling equipment operating without direct human interaction for 100% of the duty cycle of the equipment. In most cases, drivers have been physically removed from the cranes, although in some cases drivers remain in the equipment cabins but are not needed for the entire duty cycle.
There are several types of automated container terminal types around the world. The two primary types are:
1) Automated Stacking Cranes (ASCs). ASCs are rail mounted gantry cranes (RMGs) that are generally aligned perpendicular to the berth and interface with the terminal at the ends of the stacks. The ASCs both lift and carry loaded containers along the row to their destination within the row. Each ASC row typically has two ASCs running on the same set of rails: one for stevedoring work, and one for landside (gate and rail) work. ASC terminals are the current world standard for automated container terminals. ASCs do most of their duty cycle with no human interaction and can be driven remotely as needed. ASCs can be fed by automated shuttle carriers; however, other types of horizontal transport such as automated guided vehicles (AGVs), automated straddle carriers (Autostrads), manual shuttles, or tractors and terminal chassis can also be used within the same approximate terminal footprint.
2) Cantilever RMGs. This terminal design uses large cantilever RMGs running either
parallel or perpendicular to the wharf to handle containers in a very high density layout. RMGs are in use in many terminals worldwide, particularly in Asia, and are coming into use in rail terminals in this country. Unlike ASC systems, the number of RMGs is not fixed; for instance, land and water side rows can have different numbers of RMGs. RMGs of this type are usually serviced by manual tractors.
Other less common automated terminal types include:
3) Rubber Tired Gantry (RTG) cranes. RTGs are usually manually driven with drivers on the crane, and served by manual tractors and bombcarts. The only exception worldwide is the Tobishima Terminal in Nagoya, Japan, which has a unique design with unmanned RTGs serviced by AGVs. Due to the technical difficulty involved in automating a rubber-tired crane as opposed to a rail mounted crane, new automated terminal designs are unlikely to involve automating RTGs.
4) Automated straddle carrier (Autostrad). An Autostrad terminal involves using an
unmanned straddle carrier (strad) as both the dock crane service vehicle and yard crane storage type. However, since Autostrad rows require generous spacing to give the vehicle room to maneuver and low stacking heights due to height limitations on the strad itself, this yields a very low density overall.
5) Bridge Crane Terminal. In a bridge crane terminal, yard cranes are mounted atop heavy
concrete pillars to keep them separate from terminal traffic below. This system allows stacking up to eight containers high. However, due to the high cost of fixed infrastructure compared to an RMG system, this design has not been implemented
1 Source: “Port of Los Angeles Automated Container Survey”, AECOM US, May 1, 2012.
Page 2 of 20 03/27/2014
outside of Pasir Panjang Terminal in Singapore and will not be implemented in further expansions at that terminal.
Twelve existing terminals from around the world and two terminals at the Port of Los Angeles (POLA) are included in the survey. North America There is one existing automated terminal in North America, an ASC terminal in Norfolk, Virginia. There is an ASC system paired with an autostrad system planned for a portion of the TraPac terminal at the POLA, and a proposed cantilever RMG system for a 41 acre portion of APL-EMS Pier 300 terminal at the POLA. The Port of Long Beach is constructing its Middle Harbor ASC terminal, and the Port of New York/New Jersey is building an ASC terminal in Bayonne. Australia There is one automated terminal in Australia, an automated strad terminal operated by Patrick Terminals at the Port of Brisbane. Asia There are five automated terminals in various locations across Asia, three of which have cantilever RMGs in the container yard:
Pusan Newport, Pusan, South Korea
Hong Kong International Terminal 6-7, Hong Kong
Kaohsiung Evergreen Terminal, Kaohsiung, Taiwan. In addition, Tobishima Terminal has automated RTGs and PSA Pasir Panjang in Singapore has bridge cranes in parts of the terminal, both of which are unique to these locations.
Europe There are five automated terminals in locations across Europe, all of which feature ASCs:
Euromax Terminal, Rotterdam, the Netherlands
DPW Antwerp Gateway Terminal, Antwerp, Belgium
Container Terminal Altenwerder, Hamburg, Germany
Container Terminal Burchardkai, Hamburg, Germany
TTI Algeciras, Algeciras, Spain. Most automated terminals that are under development worldwide are focused on ASC designs. These allow for not only the cranes to be automated, but also the horizontal transport. In very high labor cost areas such as POLA, this is a motivating factor in terms of reducing overall operating cost. The optimal style of horizontal transport is still very much in debate. In ASC facilities, a stacking height of 1-over-5 has become the industry standard. The taller stacks may be possible, but pose more of a challenge for precisely level stacking areas, and also result in delay in retrieving local imports from tall stacks. The current range of ASC stack length varies from 36-59 total ground slots (TGS) (770 to 1260 feet). While these are not necessarily hard limits, stacks that are too short make poor use of expensive ASCs, and stacks that are too long may not allow for sufficient crane capacity to place or remove containers to make full use of them.
Page 3 of 20 03/27/2014
All ASC systems in the world, with the exception of the two facilities in Hamburg, use two identical ASCs on the same set of rails. All ASC systems in the world with the exception of the first ECT terminal in Rotterdam (which was not surveyed in this report) are designed to allow trucks to back directly into ASC buffer slots at one end of the ASC stack. ASC based terminals also have the advantage of allowing street trucks to turn off engines while waiting for service after backing into an ASC buffer; this results in significantly reduced trucks emissions. There may also be conversion challenges in shifting from existing RTG+top-pick operations to ASC systems in terminals with non-rectangular shapes, such as the TraPac terminal plan that entails ASC stacks of different orientations/length. In addition, ASC facilities have a landside access limitation due to a maximum of one landside ASC per ASC module, which may have trouble keeping up with local gate arrivals.
Page 4 of 20 03/27/2014
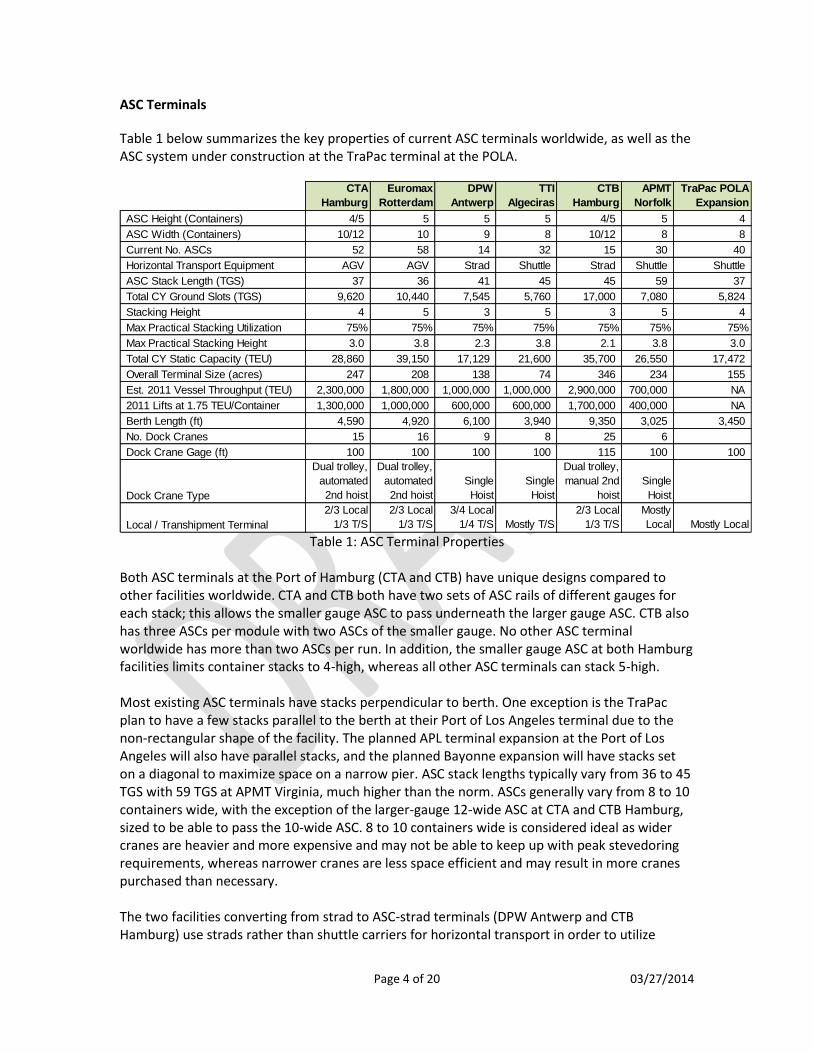
ASC Terminals
Table 1 below summarizes the key properties of current ASC terminals worldwide, as well as the ASC system under construction at the TraPac terminal at the POLA.
Table 1: ASC Terminal Properties
Both ASC terminals at the Port of Hamburg (CTA and CTB) have unique designs compared to other facilities worldwide. CTA and CTB both have two sets of ASC rails of different gauges for each stack; this allows the smaller gauge ASC to pass underneath the larger gauge ASC. CTB also has three ASCs per module with two ASCs of the smaller gauge. No other ASC terminal worldwide has more than two ASCs per run. In addition, the smaller gauge ASC at both Hamburg facilities limits container stacks to 4-high, whereas all other ASC terminals can stack 5-high. Most existing ASC terminals have stacks perpendicular to berth. One exception is the TraPac plan to have a few stacks parallel to the berth at their Port of Los Angeles terminal due to the non-rectangular shape of the facility. The planned APL terminal expansion at the Port of Los Angeles will also have parallel stacks, and the planned Bayonne expansion will have stacks set on a diagonal to maximize space on a narrow pier. ASC stack lengths typically vary from 36 to 45 TGS with 59 TGS at APMT Virginia, much higher than the norm. ASCs generally vary from 8 to 10 containers wide, with the exception of the larger-gauge 12-wide ASC at CTA and CTB Hamburg, sized to be able to pass the 10-wide ASC. 8 to 10 containers wide is considered ideal as wider cranes are heavier and more expensive and may not be able to keep up with peak stevedoring requirements, whereas narrower cranes are less space efficient and may result in more cranes purchased than necessary. The two facilities converting from strad to ASC-strad terminals (DPW Antwerp and CTB Hamburg) use strads rather than shuttle carriers for horizontal transport in order to utilize
CTA
Hamburg
Euromax
Rotterdam
DPW
Antwerp
TTI
Algeciras
CTB
Hamburg
APMT
Norfolk
TraPac POLA
Expansion
ASC Height (Containers) 4/5 5 5 5 4/5 5 4
ASC Width (Containers) 10/12 10 9 8 10/12 8 8
Current No. ASCs 52 58 14 32 15 30 40
Horizontal Transport Equipment AGV AGV Strad Shuttle Strad Shuttle Shuttle
ASC Stack Length (TGS) 37 36 41 45 45 59 37
Total CY Ground Slots (TGS) 9,620 10,440 7,545 5,760 17,000 7,080 5,824
Stacking Height 4 5 3 5 3 5 4
Max Practical Stacking Utilization 75% 75% 75% 75% 75% 75% 75%
Max Practical Stacking Height 3.0 3.8 2.3 3.8 2.1 3.8 3.0
Total CY Static Capacity (TEU) 28,860 39,150 17,129 21,600 35,700 26,550 17,472
Overall Terminal Size (acres) 247 208 138 74 346 234 155
Est. 2011 Vessel Throughput (TEU) 2,300,000 1,800,000 1,000,000 1,000,000 2,900,000 700,000 NA
2011 Lifts at 1.75 TEU/Container 1,300,000 1,000,000 600,000 600,000 1,700,000 400,000 NA
Berth Length (ft) 4,590 4,920 6,100 3,940 9,350 3,025 3,450
No. Dock Cranes 15 16 9 8 25 6
Dock Crane Gage (ft) 100 100 100 100 115 100 100
Dock Crane Type
Dual trolley,
automated
2nd hoist
Dual trolley,
automated
2nd hoist
Single
Hoist
Single
Hoist
Dual trolley,
manual 2nd
hoist
Single
Hoist
Local / Transhipment Terminal
2/3 Local
1/3 T/S
2/3 Local
1/3 T/S
3/4 Local
1/4 T/S Mostly T/S
2/3 Local
1/3 T/S
Mostly
Local Mostly Local

Page 5 of 20 03/27/2014
existing equipment. All existing surveyed new-build sites all use either shuttles or AGVs. Note that the mean stack heights for the two ASC-strad terminals are lower than other ASC-terminals; this represents a terminal-wide average at current phasing including ASC and strad modules across the terminal. DPW Antwerp ASC modules have 5-high container stacks, while CTB has 4-high ASC stacks. ASC stacks are limited to 5-high worldwide as higher stacks are too difficult to manage. In ASC terminals with shuttles or strads used for dock crane service, there are typically about 3 service vehicles per dock crane, compared to 7-8 yard tractors at most terminals at Port of Los Angeles. This yields significant reductions in labor requirements for horizontal transport, even in systems with manned shuttles rather than autoshuttles. All the ASC terminals surveyed have some on-terminal rail facilities. CTA Hamburg, CTB Hamburg, Euromax Rotterdam, and DPW Antwerp all have cantilever RMG intermodal yard with 1-2 total IYRMGs. TTI Algeciras also has a small amount of on-terminal rail, but the facility is mostly transshipment, not local. AMPT Virginia has a manned RTG railyard. Table 2 lists some common statistics to compare existing ASC facilities. Note that terminal-specific TEU throughput values are proprietary; terminal throughputs for all facilities are estimated based on a ratio of (individual terminal area) / (port-wide container terminal area) * 2011 port-wide TEU throughput. These values are meant to demonstrate the approximate level of utilization for each terminal.
Table 2: ASC Terminal Calculated Statistics
CTA
Hamburg
Euromax
Rotterdam
DPW
Antwerp
TTI
Algeciras
CTB
Hamburg
APMT
Norfolk
TraPac
POLA
TGS/Acre 39 50 55 78 49 30 38
TEU Static Capacity/Acre 117 189 124 291 103 113 113
Berth Length (ft) / No. Dock Cranes 306 308 678 493 374 504 NA
2011 Est TEU/Acre 9,300 8,700 7,300 13,500 8,400 3,000 NA
2011 Est Lifts/Dock Crane 87,000 63,000 67,000 75,000 68,000 67,000 NA
2011 Est Lifts/Berth-ft 280 200 100 150 180 130 NA
Dwell Time (Days) 4.6 7.9 6.3 7.9 4.5 13.8 NA

Page 6 of 20 03/27/2014
Cantilever RMG Terminals
Table 3 below summarizes the key properties of three existing container terminals with cantilever RMG yards, as well as the proposed cantilever RMG system at the APL-EMS-Pier 300 terminal at the POLA.
Table 3: Cantilever RMG Terminal Properties
The orientation of container stacks to the berth in cantilever RMG container yards varies. Kaohsiung has two berths at a 90 degree angle to one another, so stacks are parallel to south berth and perpendicular to west berth. Container stacks under the RMGs vary from 5 to 6 high. At Port of Hong Kong’s HIT Terminal 6-7, there is a mix of 5-high RTG stacks and 6-high RMG stacks, reflected in the stacking height of 5.5. All existing RMG terminals all use manual tractors for horizontal transport, which is typical in Asia due to lower labor rates. The RMG expansion at POLA APL Pier 300 is planned to use AGVs, the only potential exception. Unless a secondary transfer system is used (as was proposed at APL Pier 300), cantilever systems must be serviced by manual tractors because street trucks and stevedoring vehicles use the same cross aisles. It is unsafe to mix either manual shuttles or any type of automated vehicles with manual trucks in the same area. For this reason, automated terminals with cantilever RMGs typically do not save any labor for horizontal transport compared with a manual terminal.
HIT T67
Hong Kong
Pusan
Newport
Evergreen
Kaohsiung
APL Pier 300
Expansion
RMG Height (Containers) 6 5 5 6
RMG Width (Containers) 12 10 11 13
No. Yard Cranes 24 120 24 22
Horizontal Transport Equipment Tractor Tractor Tractor AGV
Stack Orientation vs. Berth Perpendicular Parallel Both Parallel
CY Ground Slots (TGS) 11,754 42,240 5,742 3,900
Stacking Height 5.5 5.0 5.0 6.0
Max Practical Stacking Utilization 75% 75% 75% 75%
Max Practical Stacking Height 4.1 3.8 3.8 4.5
Total CY Static Capacity (TEU) 48,486 158,400 21,533 17,550
Overall Terminal Size (acres) 158 706 99 41
Est. 2011 Vessel Throughput (TEU) 4,000,000 7,200,000 1,600,000 NA
2011 Lifts at 1.75 TEU/Container 2,300,000 4,100,000 900,000 NA
Berth Length (ft) 9,797 14,100 2,670 1,250
No. Dock Cranes 27 37 9 6
Dock Crane Gage (ft) 80 140 100 100
Dock Crane Type Single Hoist Dual Hoist Single Hoist Dual Hoist
Local / Transhipment Terminal
1/2 Local
1/2 T/S
1/2 Local
1/2 T/S
1/2 Local
1/2 T/S Mostly Local
Page 7 of 20 03/27/2014
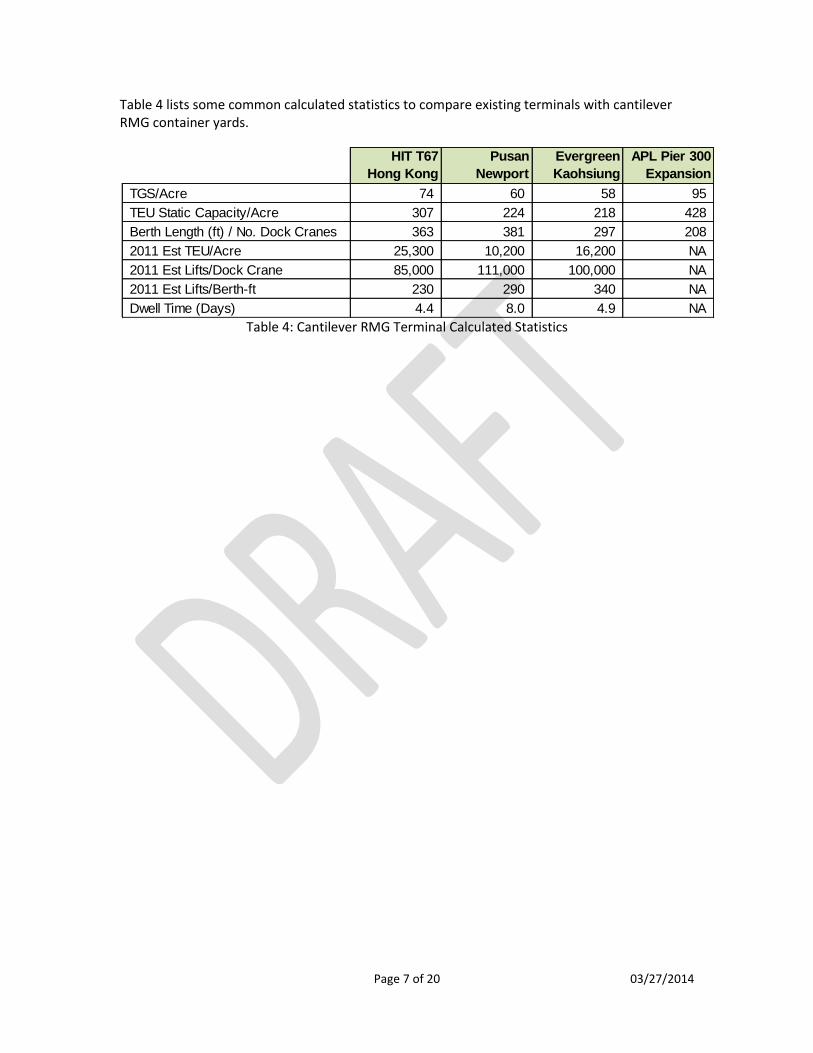
Table 4 lists some common calculated statistics to compare existing terminals with cantilever RMG container yards.
Table 4: Cantilever RMG Terminal Calculated Statistics
HIT T67
Hong Kong
Pusan
Newport
Evergreen
Kaohsiung
APL Pier 300
Expansion
TGS/Acre 74 60 58 95
TEU Static Capacity/Acre 307 224 218 428
Berth Length (ft) / No. Dock Cranes 363 381 297 208
2011 Est TEU/Acre 25,300 10,200 16,200 NA
2011 Est Lifts/Dock Crane 85,000 111,000 100,000 NA
2011 Est Lifts/Berth-ft 230 290 340 NA
Dwell Time (Days) 4.4 8.0 4.9 NA
Page 8 of 20 03/27/2014
Other Automated Terminals
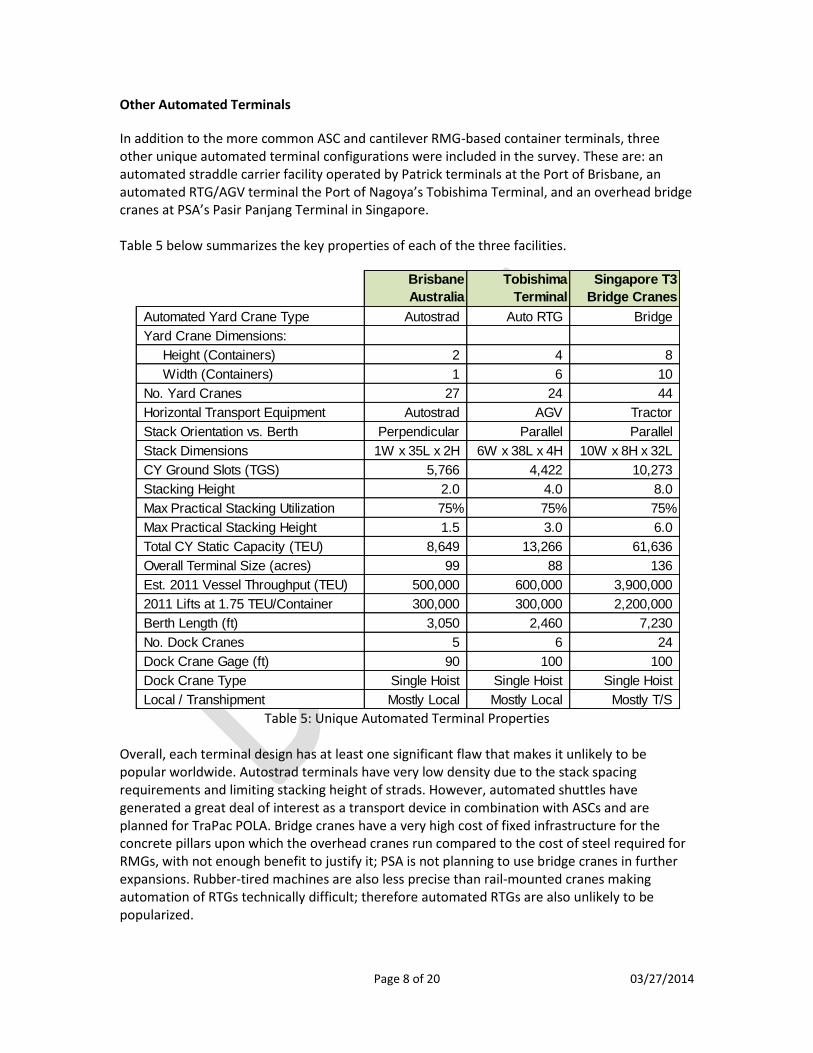
In addition to the more common ASC and cantilever RMG-based container terminals, three other unique automated terminal configurations were included in the survey. These are: an automated straddle carrier facility operated by Patrick terminals at the Port of Brisbane, an automated RTG/AGV terminal the Port of Nagoya’s Tobishima Terminal, and an overhead bridge cranes at PSA’s Pasir Panjang Terminal in Singapore. Table 5 below summarizes the key properties of each of the three facilities.
Table 5: Unique Automated Terminal Properties
Overall, each terminal design has at least one significant flaw that makes it unlikely to be popular worldwide. Autostrad terminals have very low density due to the stack spacing requirements and limiting stacking height of strads. However, automated shuttles have generated a great deal of interest as a transport device in combination with ASCs and are planned for TraPac POLA. Bridge cranes have a very high cost of fixed infrastructure for the concrete pillars upon which the overhead cranes run compared to the cost of steel required for RMGs, with not enough benefit to justify it; PSA is not planning to use bridge cranes in further expansions. Rubber-tired machines are also less precise than rail-mounted cranes making automation of RTGs technically difficult; therefore automated RTGs are also unlikely to be popularized.
Brisbane
Australia
Tobishima
Terminal
Singapore T3
Bridge Cranes
Automated Yard Crane Type Autostrad Auto RTG Bridge
Yard Crane Dimensions:
Height (Containers) 2 4 8
Width (Containers) 1 6 10
No. Yard Cranes 27 24 44
Horizontal Transport Equipment Autostrad AGV Tractor
Stack Orientation vs. Berth Perpendicular Parallel Parallel
Stack Dimensions 1W x 35L x 2H 6W x 38L x 4H 10W x 8H x 32L
CY Ground Slots (TGS) 5,766 4,422 10,273
Stacking Height 2.0 4.0 8.0
Max Practical Stacking Utilization 75% 75% 75%
Max Practical Stacking Height 1.5 3.0 6.0
Total CY Static Capacity (TEU) 8,649 13,266 61,636
Overall Terminal Size (acres) 99 88 136
Est. 2011 Vessel Throughput (TEU) 500,000 600,000 3,900,000
2011 Lifts at 1.75 TEU/Container 300,000 300,000 2,200,000
Berth Length (ft) 3,050 2,460 7,230
No. Dock Cranes 5 6 24
Dock Crane Gage (ft) 90 100 100
Dock Crane Type Single Hoist Single Hoist Single Hoist
Local / Transhipment Mostly Local Mostly Local Mostly T/S

Page 9 of 20 03/27/2014
Table 6 lists common statistics for each of these three terminals. Note that Pasir Panjang Terminal (Singapore T3) statistics refer to bridge crane modules along with adjacent wharves and dock cranes only, not RTG areas of terminal.
Table 6: Unique Automated Terminal Calculated Statistics
Brisbane
Australia
Tobishima
Terminal
Singapore T3
Bridge Cranes
TGS/Acre 58 50 76
TEU Static Capacity/Acre 88 151 453
Berth Length (ft) / No. Dock Cranes 610 410 301
2011 Est TEU/Acre 5,100 6,800 28,700
2011 Est Lifts/Dock Crane 60,000 50,000 92,000
2011 Est Lifts/Berth-ft 100 120 300
Dwell Time (Days) 6.3 8.1 5.8
Page 10 of 20 03/27/2014
Overall Automated Terminal Statistics
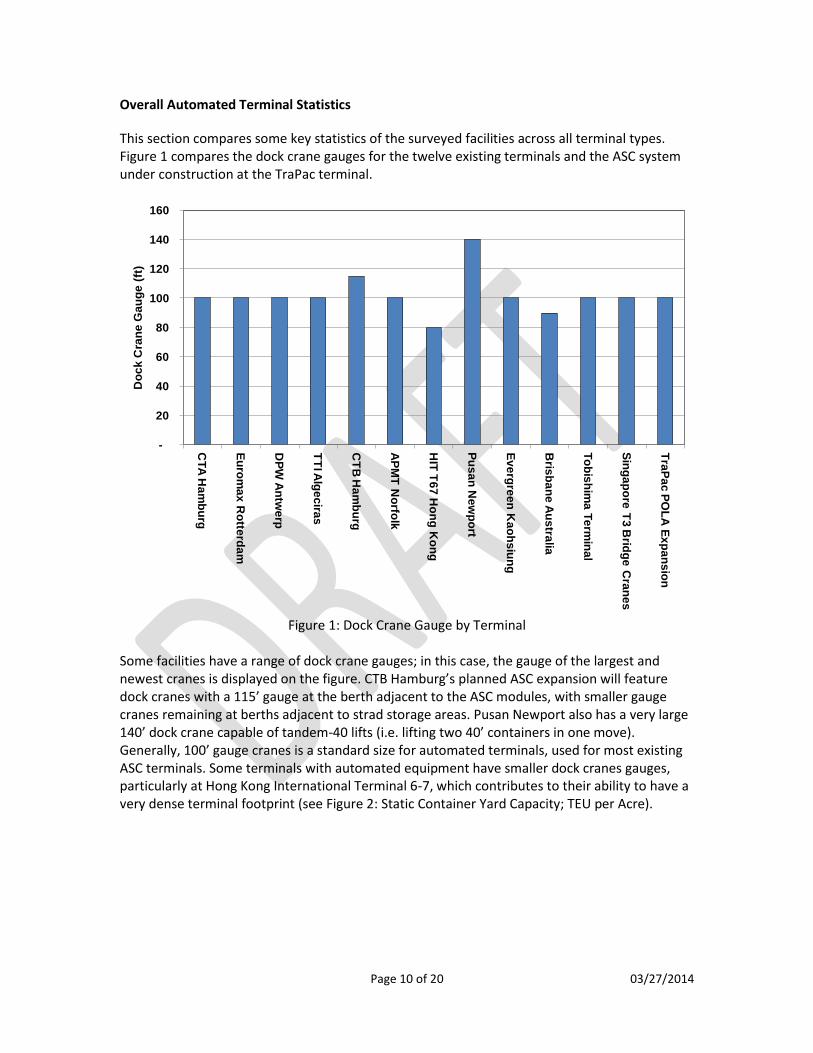
This section compares some key statistics of the surveyed facilities across all terminal types. Figure 1 compares the dock crane gauges for the twelve existing terminals and the ASC system under construction at the TraPac terminal.
Figure 1: Dock Crane Gauge by Terminal
Some facilities have a range of dock crane gauges; in this case, the gauge of the largest and newest cranes is displayed on the figure. CTB Hamburg’s planned ASC expansion will feature dock cranes with a 115’ gauge at the berth adjacent to the ASC modules, with smaller gauge cranes remaining at berths adjacent to strad storage areas. Pusan Newport also has a very large 140’ dock crane capable of tandem-40 lifts (i.e. lifting two 40’ containers in one move). Generally, 100’ gauge cranes is a standard size for automated terminals, used for most existing ASC terminals. Some terminals with automated equipment have smaller dock cranes gauges, particularly at Hong Kong International Terminal 6-7, which contributes to their ability to have a very dense terminal footprint (see Figure 2: Static Container Yard Capacity; TEU per Acre).
-
20
40
60
80
100
120
140
160
CT
A H
am
bu
rg
Eu
rom
ax
Ro
tterd
am
DP
W A
ntw
erp
TT
I Alg
ec
iras
CT
B H
am
bu
rg
AP
MT
No
rfolk
HIT
T6
7 H
on
g K
on
g
Pu
sa
n N
ew
po
rt
Ev
erg
ree
n K
ao
hs
iun
g
Bris
ba
ne
Au
stra
lia
To
bis
him
a T
erm
ina
l
Sin
ga
po
re T
3 B
ridg
e C
ran
es
Tra
Pa
c P
OL
A E
xp
an
sio
nD
oc
k C
ran
e G
au
ge
(ft
)

Page 11 of 20 03/27/2014
Figure 2 summarizes the static capacity of the container yard (TEU/acre); i.e., the total number of containers than can be physically stacked in the yard at one time divided by total acreage) for each surveyed terminal.
Figure 2: Static Container Yard Capacity: TEU/Acre
It is important to note that the type of terminal area measured in Figure 2 is not necessarily identical between terminals and includes more than just pure container stacking areas. Facilities with and without on-terminal rail are differentiated; in general, terminals without on-terminal rail will have more static capacity (TEU/acre) due to not having to average in non-stacking areas to the total terminal acreage. Some facilities, such as APMT Norfolk and DPW Antwerp, are not completely developed and have unimproved acreage within the bounds of the terminal; these undeveloped areas are subtracted from total terminal acreage. The Singapore value refers only to the bridge crane modules on the terminal and adjacent berths only, yielding a high TEU/acre value with the high stacking heights at the Pasir Panjang bridge crane terminal. The APL Pier 300 facility entry also refers to the 41-acre expansion only, which includes mostly pure stacking area and berths, rather than any rail, administration buildings, etc., yielding a high capacity (TEU/acre) value. TTI Algeciras is a very densely stacked terminal and while it has some on-terminal rail, the terminal is mainly used for transshipment and the total rail area is lower than at other ASC terminals, yielding a higher density.
-
50
100
150
200
250
300
350
400
450
500
CT
A H
am
bu
rg
Eu
rom
ax
Ro
tterd
am
DP
W A
ntw
erp
TT
I Alg
ec
iras
CT
B H
am
bu
rg
AP
MT
No
rfolk
HIT
T6
7 H
on
g K
on
g
Pu
sa
n N
ew
po
rt
Ev
erg
ree
n K
ao
hs
iun
g
Bris
ba
ne
Au
stra
lia
To
bis
him
a T
erm
ina
l
Sin
ga
po
re T
3 B
ridg
e C
ran
es
AP
L P
ier 3
00
Ex
pa
ns
ion
Tra
Pa
c P
OL
A E
xp
an
sio
n
Sta
tic
CY
TE
U C
ap
ac
ity p
er
Ac
re
Includes On-Terminal Rail in Area No On-Terminal Rail in Area

Page 12 of 20 03/27/2014
Figure 3 compares estimated 2011 lifts per dock crane across all existing surveyed terminals. Recall that terminal-specific TEU throughput values are proprietary; terminal throughputs for all facilities are estimated based on a ratio of: (individual terminal area) / (port-wide container terminal area) * 2011 port-wide TEU throughput.
Figure 3: 2011 Estimated Lifts per Dock Crane at 1.75 TEU/Container
As a rule of thumb, 100,000 annual lifts per dock crane is used as a limit on per-crane capacity for planning purposes. Most terminals were at lower levels of dock crane utilization, with the exception of the highly utilized Pusan Newport tandem-40 dock cranes, and Evergreen Kaohsiung terminal with about 100,000 lifts per dock crane. Utilization levels are driven primarily by demand, not crane capacity; lower values do not indicate that cranes cannot reach 100,000 annual lifts or higher with adequate market demand. It is important to note that in the surveyed terminals, terminals generally run on a 24 hour a day, 7 day a week basis. By contrast, most US West Coast terminals run closer to 16 hours a day annually due to ILWU regulations, making 100,000 annual lifts per dock crane difficult to achieve.
-
20,000
40,000
60,000
80,000
100,000
120,000
CT
A H
am
bu
rg
Eu
rom
ax
Ro
tterd
am
DP
W A
ntw
erp
TT
I Alg
ec
iras
CT
B H
am
bu
rg
AP
MT
No
rfolk
HIT
T6
7 H
on
g K
on
g
Pu
sa
n N
ew
po
rt
Ev
erg
ree
n K
ao
hs
iun
g
Bris
ba
ne
Au
stra
lia
To
bis
him
a T
erm
ina
l
Sin
ga
po
re T
3 B
ridg
e C
ran
es
20
11
Es
tim
ate
d L
ifts
pe
r D
oc
k C
ran
e
Page 13 of 20 03/27/2014
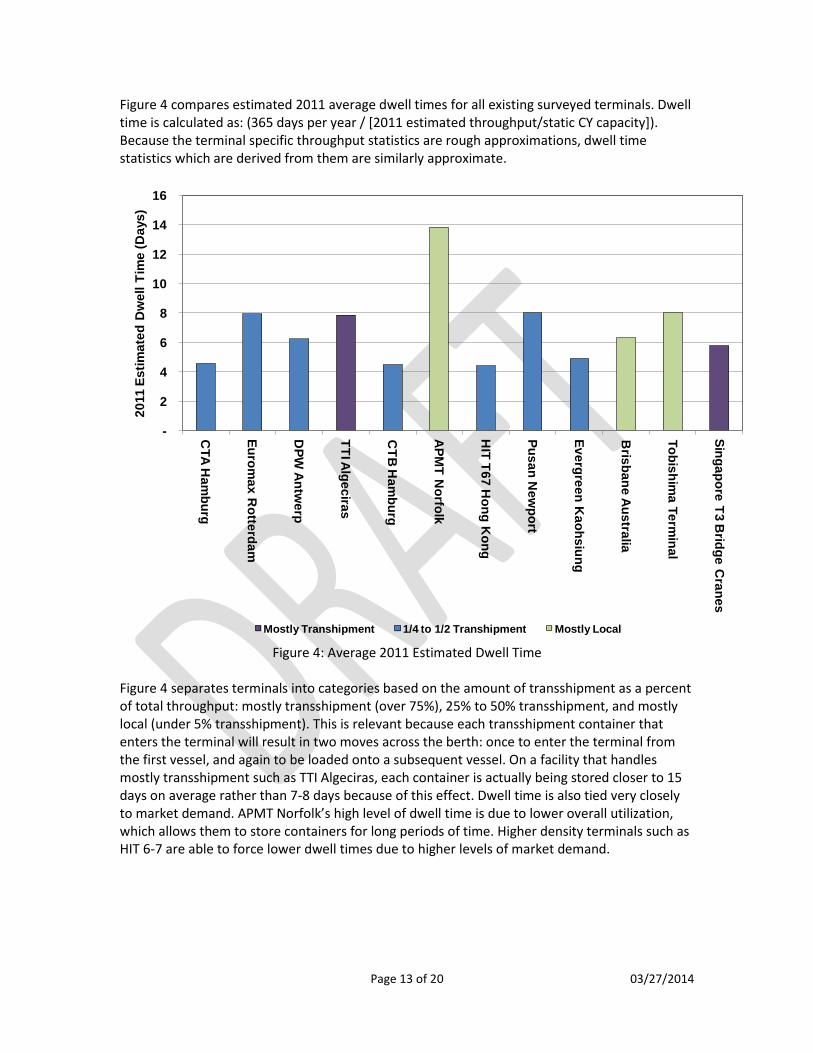
Figure 4 compares estimated 2011 average dwell times for all existing surveyed terminals. Dwell time is calculated as: (365 days per year / [2011 estimated throughput/static CY capacity]). Because the terminal specific throughput statistics are rough approximations, dwell time statistics which are derived from them are similarly approximate.
Figure 4: Average 2011 Estimated Dwell Time
Figure 4 separates terminals into categories based on the amount of transshipment as a percent of total throughput: mostly transshipment (over 75%), 25% to 50% transshipment, and mostly local (under 5% transshipment). This is relevant because each transshipment container that enters the terminal will result in two moves across the berth: once to enter the terminal from the first vessel, and again to be loaded onto a subsequent vessel. On a facility that handles mostly transshipment such as TTI Algeciras, each container is actually being stored closer to 15 days on average rather than 7-8 days because of this effect. Dwell time is also tied very closely to market demand. APMT Norfolk’s high level of dwell time is due to lower overall utilization, which allows them to store containers for long periods of time. Higher density terminals such as HIT 6-7 are able to force lower dwell times due to higher levels of market demand.
-
2
4
6
8
10
12
14
16
CT
A H
am
bu
rg
Eu
rom
ax
Ro
tterd
am
DP
W A
ntw
erp
TT
I Alg
ec
iras
CT
B H
am
bu
rg
AP
MT
No
rfolk
HIT
T6
7 H
on
g K
on
g
Pu
sa
n N
ew
po
rt
Ev
erg
ree
n K
ao
hs
iun
g
Bris
ba
ne
Au
stra
lia
To
bis
him
a T
erm
ina
l
Sin
ga
po
re T
3 B
ridg
e C
ran
es
20
11
Es
tim
ate
d D
we
ll T
ime
(D
ays
)
Mostly Transhipment 1/4 to 1/2 Transhipment Mostly Local
Page 14 of 20 03/27/2014
Role of the Harbor Department in Container Terminal Automation
The Los Angeles Trust Grant In 1911, the state granted to the City of Los Angeles control over all state tidelands and submerged lands in the San Pedro-Wilmington area “solely for the establishment, improvement, and conduct of a harbor... for all purposes of commerce and navigation.” In 1929, the purposes provision of the grant was revised to state “commerce, navigation and fishery.” In 1970, the purposes of the grant outside the Port area were greatly expanded, but the Port’s tidelands purposes were explicitly excluded from these broader purposes and remained limited to commerce, navigation and fishery. Subsequent legislation in 2003 expanded the purposes allowed on Port lands to include the traditional commerce, navigation, and fisheries purposes, together with the 1970-added purposes, so long as those new purposes “comply with the terms of the trust and are matters of statewide, as distinguished from local or purely private, interest and benefit.” These added purposes include: establishment of harbors, commercial and industrial purposes, airports, highways, streets, bridges, belt line railroads, parking facilities, transportation and utility facilities, public buildings, convention centers, public parks, public recreation facilities, small boat harbors and marinas, snack bars, cafes, cocktail lounges, restaurants, motels, hotels, protection of wildlife habitats, open space areas and areas for recreational use with open access to the public, and “any other uses or purposes of statewide, as distinguished from purely local or private, interest and benefit which are in fulfillment of those trust uses and purposes described in this act.”
The Board of Harbor Commissioners Under the City of Los Angeles Charter, the five-member Board of Harbor Commissioners has possession, management and control of all navigable waters, and all tidelands and submerged lands comprising the Port of Los Angeles. The Commissioners are appointed by the Mayor and confirmed by the City Council for five-year terms. The lands and waters they control are known as the Harbor District. The City of Los Angeles Harbor Department is a proprietary department of the City, self-funding through fees from shipping and other services.
The Harbor Department as a Landlord The Port of Los Angeles is considered a landlord port. The Harbor Department leases its property to tenants who in turn operate their own facilities. As a landlord, the Harbor Department does not:
operate any of the cargo terminals;
invest in any capital equipment (cranes, yard equipment, etc.) used in operations;
hire labor to staff the terminal;
take part in labor negotiations between terminal operators and the ILWU.
The Harbor Department does invest in the physical plant of the Port (channels, roads, rail, docks, berths, and terminal infrastructure). When these investments are made at the request of a tenant, the Harbor Department should follow its rate of return guidelines to ensure that the compensation paid by the tenant increases to reflect the increased value of the improved terminal.

Page 15 of 20 03/27/2014
The Decision to Automate Automation has been a contentious issue between labor and management, and the Harbor Department has assumed no role in these discussions. The most recent agreement between the ILWU and the terminal operators, in 2008, permitted terminal operators to begin implementing automation technology at their terminals. As was seen earlier in this report, automation can take a number of different forms, each of which has different advantages and disadvantages.2 Each individual terminal operator will make its own decision as to automate or not, and if so, to what extent they introduce automated technology. Because of the Harbor Department’s role as a landlord that is not involved in the operation of the terminals, the Harbor Department neither encourages nor discourages automation. It is the terminal operators who decide whether or not to exercise their ability under their labor agreement to implement some form of automation. The Harbor Department then responds by providing terminal infrastructure needed to support the terminal operators’ projects, subject to the Harbor Department’s terminal development process and agreement on commercial terms. Terminal operators choose their mode of operation (amount of labor employed per vessel, terminal operating hours, degree of automation) based upon their own internal business models which balance the level of service they can provide to their shipping line and cargo-owning customers against the costs of providing that level of service. As shipping lines have begun operating larger vessels to reduce their own operating costs by capturing economies of scale, this has placed increased pressure on terminal operators and labor to improve their efficiency in handling an increasing number of containers arriving in a smaller window of time. A 12,000 TEU vessel calling at one terminal places a greater strain on existing operations than what previously would have been two 6,000 TEU vessels calling at different times (and perhaps terminals). With the trend towards larger vessels likely to continue, the need for increased efficiency will continue to grow. Terminals that cannot provide the level of service required by larger vessels could potentially see their cargo diverted to terminals (both within and outside the region) that can provide better service or lower costs. Automation is one of the strategies that a terminal operator can pursue to reduce costs or improve efficiency; however, given the high cost of automating terminals, terminal operators may limit how much technology they employ, and may also work with labor to find non-automated routes to improving terminal efficiency.
The Impacts of Automation at the Port of Los Angeles Harbor Department staff reviewed publicly-available studies of automation technologies. However, hard numbers detailing the impacts of future automation at the Port of Los Angeles are difficult to generate. First, information on the cost structures, business models, and long-term business plans for terminal operators is not readily available. Container terminals have
2 See also: “New Conceptual Handling Systems in Container Terminals”, K. Kim, M. Thi Phan & Y. Woo,
Industrial Engineering & Management Systems; “A Paper on Automation in Leading Container Terminal Units”, T. Anupama, I. Murthy & K. Deepa, ICOQM-10.
Page 16 of 20 03/27/2014
different ground lease rates, operate under different level of service models, and may have financial relationships with related shipping line companies that mask the underlying true cost of service. Because terminal operators compete with one another, they have a strong interest in keeping this information confidential. This is true both with and without automation. Second, the actual efficiency improvements to be gained through automation at the Port depend upon both the theoretical capabilities of the mix of automation technologies a terminal operator may select and the actual real-world operation of the automated systems. There is a large body of research dedicated to simulation modeling and automation optimizing in an effort to ensure that real-world results match the promised theoretical results of automation.3 Third, it is unclear how terminal operators will actually alter their labor demand once automated systems are online. Labor demand is partly determined through complex negotiations between ILWU and terminal operators. Terminal operators may choose not to fully automate; even in the case of fully automated terminals, the operators may not reduce their workforces as much as their equipment would allow. For example, in the 1960’s with the rise of containerization, terminal operators helped smooth the transition to a lower labor demand by paying guaranteed wages to displaced workers. Furthermore, there is a potential for offsetting job losses by retraining ILWU workers in the repair and maintenance of the automated equipment. It is impossible at present to estimate the extent to which these mitigating factors, which would be the result of future negotiations between labor and management, would reduce potential job losses due to automation. Fourth, the automation of the Port of Los Angeles is not occurring in isolation. Potential job losses at the Port through automating would need to be weighed against potential job losses that would occur if a competing port (such as Seattle or Prince Rupert) were to automate and the Port did not. If the cost reductions or efficiency gains through automating were great enough to give a competing port a competitive advantage over Los Angeles, then the resulting regional job losses due to cargo diversion could be much larger than the job losses from automation at the Port of Los Angeles. To prepare a true cost-benefit analysis, staff would need reliable data on cost of service at local terminals and competing terminals, as well as reliable data on the actual job losses expected. Given the amount of information that is currently unknown about the form that automation may take at the Port of Los Angeles and its competitors, including the impacts of discussions between labor and management on future staffing levels and worker retraining, it is not possible at this time to produce a cost-benefit analysis that accurately predicts the impacts of future automation. Working with the limited information available, staff can make the following statements about the impacts of automation on the Port of Los Angeles, the workforce, and the community:
3 For example: “3D Virtual and Physical Simulation of Automated Container Terminal and Analysis of
Impact on Inland Transportation”, B. Khoshnevis & A. Asef-Vaziri; “Optimizing automated container terminals to boost productivity”, Y. Saanen & A. de Waal, Port Technology International.

Page 17 of 20 03/27/2014
Capacity Impacts o Because the ultimate container cargo capacity of the Port appears to be
constrained (primarily) by its berth capacity, automating the Port does not appear to expand the total volume of container cargo that the Port can handle in the long-term.
Efficiency/Throughput Impacts o Automation can improve the efficiency of cargo handling and speed the velocity
of cargo, especially as volumes increase. o Automation speeds the handling of the newer Super-Post-Panamax vessels. o Full automation is not always required, and terminals can improve efficiency to
some degree in partnership with labor.
Environmental Impacts o Automation results in decreases in emissions and greenhouse gases through
switching to more use of electricity versus fossil fuels. The TraPac EIR addendum, which analyzed the change from a
conventional to automated terminal, showed a 68% reduction in CO2, 93% reduction in CH4, and an 82% reduction in N2O.
o Automation is not required to meet Clean Air Action Plan air emission goals.
Terminal Operating Cost Impacts o Terminal operating costs are likely to go down under automation. o The amount of reduction depends on labor cost savings versus cost of capital
employed. o The Harbor Department cannot currently provide an estimate, which would
require detailed information on automation used and terminal cost structures.
Labor/Workforce Impacts o Automation leads to a reduction in the amount of ILWU labor required. o The amount of reduction depends on types of automation employed. o The amount of reduction can be offset by new jobs in repair and maintenance of
automated equipment. o The amount of reduction can also be offset by terminal operator concessions. o The ultimate impact of automation on the labor force depends upon
agreements between labor and management regarding staffing levels and workforce retraining.
Harbor Department Financial Impact o Automation should not impact the Port’s income, if volumes are unchanged. o Terminal operators are responsible for investment in automation equipment. o The Harbor Department is responsible for terminal improvements. o Under the Harbor Department rate of return policy, terminal improvement
investments should be offset by increased revenue from the terminal operator.
Competitive Impact o Automation, if it reduces terminal costs and/or increases terminal efficiency,
can provide a competitive advantage to a terminal that implements it. o Conversely, if competing ports automate and the Port of Los Angeles does not,
it may find itself at a competitive disadvantage.
o The amount of cargo at risk depends upon the level of cost savings or efficiency gains, which in turn depends on the level of automation and how well it works.

Page 18 of 20 03/27/2014
o Cargo losses (and related job losses) could be significant, but too little is known at present to prepare reliable estimates.
Estimating Automation Impacts: an Example Using TraPac As noted above, a significant amount of information necessary to provide an accurate cost-benefit analysis of future automation is still unknown at present. However, it is possible to prepare a rough estimate of automation impacts using what is known about the TraPac automation project.
ILWU and TraPac representatives agree that automation at TraPac is likely to result in a 40 to 50% reduction in the number of longshore jobs at the TraPac terminal.
o Autostrad automation reduces the number of workers needed per crane by about 53%.
o Automating the container backland reduces the number of workers needed per transtainer by 85%.
o TraPac is only automating a portion of the terminal, with the remainder operating as a traditional manned terminal; thus, the overall impact is between 40 and 50% fewer workers needed at TraPac.
Based on Pacific Maritime Association reporting on hours and wages, in 2011 the Ports of Los Angeles and Long Beach were served by the equivalent of approximately 9,000 fulltime longshore workers (at 2,080 hours per year).
Assuming longshore hours are allocated proportionately across terminals based on their container volumes, TraPac was served by the equivalent of 400 longshore workers in 2011.
o A 40 to 50% reduction in longshore labor equates to a reduction of the equivalent of 160 to 200 longshore jobs
o Additionally, because longshore jobs are dispatched from a hiring hall, the loss of jobs can be translated into reduced working hours across the pool of longshore labor
A loss of 200 longshore jobs equates to a loss of 416,000 hours of work. Spread across 9,000 longshore workers, that is a loss of less than one hour of work per week, or a 2.2% reduction in hours (and pay) overall.
o Some of this job loss has been offset by the hiring of additional mechanics to service the automated equipment.
If container volume moves to TraPac from other San Pedro Bay terminals until TraPac reaches its capacity of approximately 2 million TEUs, and the volumes are split evenly between the automated and non-automated portions of the TraPac terminal, job losses would be as high as approximately 600 jobs (or a 7% reduction in hours and pay overall).
o Growth at other non-automated container terminals could partially or entirely offset this job loss.
The ILWU Local 13 provided data on the geographical distribution of its longshore workers. According to this data, approximately 27.7 percent of the Local 13 workers live in San Pedro and 9.8% live in Wilmington. Assuming the lost jobs match the distribution of Local 13 workers by place of residency, San Pedro and Wilmington could expect to see direct job losses equal to approximately 37.5 percent of the predicted job losses due to automation – between 60 and 75

Page 19 of 20 03/27/2014
jobs at current volumes and up to 225 jobs if TraPac reaches capacity by taking volume from other Port terminals. These job losses will be significant to the local community because longshore jobs pay approximately 85% more than the median household income for San Pedro. However, the impact will be muted because of the relatively low number of jobs lost. While Wilmington and San Pedro have very strong ties to the Port, the Port is not the primary source of employment for these communities. Occupational Breakdown by Place of Residence
San Pedro (90731)
San Pedro (90732)
Wilmington (90744)
Construction 6.63% 4.22% 6.89% Manufacturing 12.77% 12.95% 22.24% Transportation & Warehousing
10.80% 12.71% 8.06%
Retail Trade 10.32% 8.56% 9.83% Education, Health & Social Services
18.38% 21.94% 12.42%
(Source: U.S. Census Bureau Summary File (SF3), 2000.)
Port of Los Angeles Position on Container Terminal Automation Given the amount that is unknown about how automation is likely to proceed at the Port of Los Angeles and its competitors, the Harbor Department’s Business Development team has developed a position on dealing with existing and potential future container terminal automation projects:
Complete TraPac’s first phase (31 acres of 146 acres) of Autostrad automation by mid-2014. The remainder will be completed by the year 2016.
Eagle Marine Services/APL has an approved EIR with AGV automation, as an option, in the 40 new acres. If Eagle Marine Services/APL chooses to automate the 40 acres, the Port will provide the infrastructure as described in the current scope of work, which includes compensation by the customer meeting the Harbor Department’s rate-of-return policy.
Prepare an EIR for Yang Ming that includes an assessment of automation.
If terminal operators want to automate their facilities they may do so using their own capital. The Harbor Department will evaluate each such proposal on a case-by-case basis.
Based on an assessment of (1) the performance outcomes from automated operations at TraPac and other automated terminals, (2) the evolution of shipping alliances and their impacts on future terminal needs and infrastructure, (3) the financial contributions terminal customers are willing to make towards automation projects, and (4) other competing ports’ approaches to terminal automation, the Harbor Department will proceed to develop a terminal automation strategy.
Page 20 of 20 03/27/2014
Bibliography “White Paper on the Terminal Capacity of Pier 300 with the Automation of the 41-acre Backland at Proposed Berth 306”, December 2011 “The Future of Container Terminal Automation” (presentation), Maxwell R. Mozo, P.E., CH2M HILL, May 16, 2013 “Container Terminal Automation” (presentation), Ed DeNike, SSA Terminals “The Strategic Value of the Port of Rotterdam for the international competitiveness of the Netherlands: a first exploration”, Prof. dr Frans A.J. Van Den Bosch, Rick Hollen MScBA, Prof dr Henk W. Volberda & Dr Marc G. Baaij, Rotterdam School of Management, May 2011 “Alternative Port Management Structures and Ownership Models”, Public Private Infrastructure Advisory Facility “Port of Los Angeles Automated Container Terminal Survey”, AECOM U.S., May 1, 2012 “Maritime Transportation: Drivers for the Shipping and Port Industries”, Jean-Paul Rodrigue, International Transport Forum 2010, May 26, 2010 “Automation and safety on container terminals”, Mark Sisson, PE, AECOM U.S., Port Technology International “Optimizing automated containter terminals to boost productivity”, Dr. Yvo Saanen & Arjen de Waal, TBA Netherlands, Port Technology International “A Paper on Automation in Leading Container Terminal Units”, Tadamarla Anupama, Inumula Krishna Murthy & K. Deeppa, University of Petroleum and Energy Studies, Dehradun, June 28, 2011 “Benchmarking Container Terminal Performance”, Gordon Rankine, Beckett Rankine Partnership UK, February 2003 “New Conceptual Handling Systems in Container Terminals”, Kap Hwan Kim, Mai-Ha Thi Phan & Youn Ju Woo, Industrial Engineering & Management Systems Vol. 11, No. 4, December 2012 “3D Virtual and Physical Simulation of Automated Container Terminal and Analysis of Impact on Inland Transportation”, Behrokh Khoshnevis & Ardavan Asef-Vaziri, USC, December 2000 “The Competitiveness of Global Port Cities: The Case of Rotterdam/Amsterdam – the Netherlands”, Olaf Merk & Theo Notteboom, OECD Regional Development Working Papers, August 2013 “On the Waterfront, Rise of the Machines”, Alan Feuer, New York Times, September 28, 2012 “Ports of LA and Long Beach Looking Toward the Future”, Mark Nero, Pacific Maritime Magazine, February 1, 2013 “ILWU, Employers Prepare for Toughest Talks in Decades”, Bill Mongelluzzo, Journal of Commerce, January 3, 2014 “Global Logistics News: Pacific Maritime Association Says that West Coast Port Automation is Coming, but is Still in Early Stages”, SCDigest Editorial Staff, Supply Chain Digest, May 23, 2012 “Calling a new tune – APM’s Virginia terminal sets a new standard for U.S. port automation. Will others follow?”, R. G. Edmonson, Journal of Commerce, September 7, 2007 “Three Trends that Will Impact the Future of Puget Sound Ports”, Larry Ehl, Transportation Issues Daily, March 27, 2013 “Effects of automation in the lives of longshoremen”, Stan Weir, Singlejack Solidarity, 2004