POLICY The Closing of the INFORMATION REPORT Education Frontier?
28
Research and Development Policy Information Center POLICY INFORMATION REPORT The Closing of the Education Frontier?
Transcript of POLICY The Closing of the INFORMATION REPORT Education Frontier?
Research andDevelopment
Policy InformationCenter
POLICYINFORMATIONREPORT
The Closing of theEducation Frontier?
88503-012430 • CL82M6 • Printed in U.S.A.I.N. 995077

CONTENTS
Acknowledgments . . . . . . . . . . . . . . . . . . . . . . . . . . . . . . . . . . . 1
Preface . . . . . . . . . . . . . . . . . . . . . . . . . . . . . . . . . . . . . . . . . . . . 2
Introduction . . . . . . . . . . . . . . . . . . . . . . . . . . . . . . . . . . . . . . . 3
The Peaking of Attainment? . . . . . . . . . . . . . . . . . . . . . . . . . . . . 4High School Graduation . . . . . . . . . . . . . . . . . . . . . . . . . . . . 4College Attendance and Graduation . . . . . . . . . . . . . . . . . . . 7A Quarter Century of No Growth . . . . . . . . . . . . . . . . . . . . . 9Inequality and Persistence . . . . . . . . . . . . . . . . . . . . . . . . . . . 10
The American Reliance on Education . . . . . . . . . . . . . . . . . . . . 14
The Economy and Labor Market Connection . . . . . . . . . . . . . . 16The College Degree . . . . . . . . . . . . . . . . . . . . . . . . . . . . . . . . 17Some College . . . . . . . . . . . . . . . . . . . . . . . . . . . . . . . . . . . . . 18High School Graduation . . . . . . . . . . . . . . . . . . . . . . . . . . . . 22
Summary and Conclusions . . . . . . . . . . . . . . . . . . . . . . . . . . . . 24
This report was written by:
Paul E. BartonEducational Testing Service
The views expressed in this reportare those of the author and do notnecessarily reflect the views of theofficers and trustees of EducationalTesting Service.
Additional copies of this report can beordered for $15.00 (prepaid) from:
Policy Information CenterMail Stop 04-REducational Testing ServiceRosedale RoadPrinceton, NJ 08541-0001(609) 734-5694Internet – [email protected]
Copies can also be downloaded from:www.ets.org/research/pic
Copyright © 2002 by Educational TestingService. All rights reserved. EducationalTesting Service is an Affirmative Action/Equal Opportunity Employer. EducationalTesting Service, ETS, and the ETS logoare registered trademarks of EducationalTesting Service. The modernized ETSlogo is a trademark of EducationalTesting Service.
September 2002
ACKNOWLEDGMENTS
This report was reviewed by Robert Atwell (former President of the Ameri-can Council on Education); Richard Coley, Carol Dwyer, and ArchieLapointe (ETS); Emerson Elliott (National Council for the Accreditationof Teacher Education); Andy Sum (Center for Labor Market Studies atNortheastern University); and Mike Timpane (former president of TeachersCollege). Kim Fryer was the editor. Carla Cooper provided desk-top pub-lishing. Kelly Gibson designed the cover. Trina Black coordinated produc-tion. Errors of fact or omission are those of the author.

2
PREFACE
As our nation struggles to put in place policies andpractices intended to leave no child behind, thisnew report—The Closing of the Education Frontier?—provides grist to confront the question of whogets ahead. Paul Barton presents illuminating datachallenging the conventional wisdom that educationalattainment has continued to increase during thelast quarter century. He paints a picture of an educa-tional system that is not producing more high schoolgraduates, that continues to display great socialinequality, and that is not able to support greaterproportions of students through to degrees in four-year college programs.
Barton’s synthesis of a variety of data sources isa significant contribution to helping us understandthe past and current conditions of education in theUnited States. But he is also clear that, as a society, weneed to come to agreement with respect to the natureof the problem before defining any policy remedies.From an economic perspective, the data are equivocalabout whether stagnation in the number of highereducation degrees is problematic. Issues around thedistribution of wealth are always contentious. Whatdoes it mean for institutions of higher education, andthe students who attend them, that a greater propor-tion of students do not complete their degrees? Simi-larly, what does it mean for our society that greaternumbers of high school students are opting to foregothe traditional high school diploma for the GED?
Defining these problems is a political exerciserequiring social, educational, economic, and moralconsiderations. As we decide what we want of and
from our society, we must align our policy incentiveswith desired outcomes. Barton’s work forces readers toask whether current incentives for higher educationinstitutions are too focused on enrollment and notenough on completion and whether high schools’focus on test scores—used to audit school perfor-mance—actually encourages lower performing stu-dents to opt out of the system. He suggests that wemay have, wittingly or unwittingly, developed incen-tive structures that prevent us from continuing theincrease in educational attainment that characterizedthe greater part of the last century.
Barton makes explicit the risk in treating anyparticular piece of data as the definition of theproblem. It is only when one draws on multiplesources of data that a full story of what is happeningbegins to emerge. While it is important to haveoutcome measures that reflect policy goals, we cannotafford to define the debate only by outcome measures,or we risk skewing both policy and practice. We haveseen the limitation of considering college enrollmentas the sole proxy for higher education attainment. Ifthe educational frontier is in fact closing, then at leastBarton has opened our eyes to some very powerfultrends in American education. This report will besurprising and even discomforting to many. We hopethat it will encourage thoughtful debate and action.
Drew GitomerSenior Vice President, Research and DevelopmentEducational Testing Service

3
The United States, ever growing and for a great manyyears expanding geographically, has been a place offrontiers, with opportunity for improvement and apeople who continually sought to improve themselves.Its people settled a wide expanse; built the transporta-tion systems that knitted the country together; nur-tured democracy; created an education system withgreater access than ever seen before; absorbed millionsof newcomers of differing nationalities, races, andethnicities; and built an industrial economy thatemerged as the strongest in the world.
Except for the limits of geography, all these fron-tiers have remained open. And when historianFrederick Jackson Turner announced the closing of thewestern frontier in 1893, intense discussion, specula-tion—and consternation—followed about what thiswould mean for Americans, who had been ever ableto pick up and relocate to find land and opportunity.
The opportunity to get an education—and acontinual increase in attainment—is another criticalfrontier, important to reach other milestones in ahistory of progress on one front or another. TheUnited States has recently been engaged in an effort toimprove the quality of education offered, and whilethe results are not yet in, it seems there is considerableresolve to see it through. But here we address thequestion of quantity. Have we stopped growing in
INTRODUCTION
terms of graduating young people from high schoolsand colleges? The experience of the last quartercentury or so is clear enough to warrant seriousexamination of the question.
How important is continued growth in thequantity of those graduated, and how important isit that education continue to be “the balance wheelof the social machinery,” as Horace Mann called it?How intertwined is this continual growth with theeconomy, the labor market, the successful absorptionof immigrants (including the influx in the 1990s,especially of undocumented immigrants, many ofwhom had limited schooling), and the earnings ofAmerican workers? And what are the sources ofrenewed growth? These are large questions. At best,the author hopes to frame them for careful examina-tion and provide the kind of discussion that mightestablish or dismiss their importance.
It is a fact that the rate of both high school andcollege graduations has leveled off since the mid- toearly-1970s. Whether this is acceptable or a cause forconcern that the nation should do something about isa matter of judgment that entails sizing up the conse-quences and assessing individual values. But thechange from our past is striking and worthy of discus-sion and examination.

4
If the public were polled about whether we are payinga lot of attention to raising educational achievement,the answer would likely be a resounding yes. The“education reform movement” has been in high gearsince the Nation at Risk report in 1983 and the Educa-tion Summit of 1989, which brought together thePresident and the nation’s governors to create thenational goals that were subsequently ratified byCongress. “Standards-based reform” has spread to allthe states, to one degree or another, and Congress hasnow passed a major piece of legislation called for byPresident George W. Bush, who vows to “leave nochild behind.” Prevalent in the early 1990s, talk aboutmeasuring the quality of achievement in highereducation is even renewed, but very little by way of“reform” has been attempted.
As regards higher education, a perception gener-ally prevails that ever more people are going to college,and enrollment figures bear that out. Candidates forgovernor and president put improvement in thequality of education, and access to more education, atthe top of their priorities. Therefore, it will come as asurprise to most Americans that digging deeply intothe statistical volumes will reveal three facts:1
One: The proportion of young people getting aregular diploma after attending four years of highschool—after rising throughout the history of theUnited States—peaked about 30 years ago by onemeasure, at just over 75 percent, and has nowslipped back to just over 70 percent.
Two: The proportion of young adults (age 25-29)getting a bachelor’s degree—after rising throughoutU.S. history—stabilized at 21 to 25 percent begin-ning 25 years ago, and only began to slightly riseagain in 1996.
Three: The percentage of the entire population 25years and over with a bachelor’s degree pretty muchcaught up with the young adult rate in the 1990s,after a history in which continually better educatedyoung people replaced less educated older people.
This report describes these trends, the context inwhich they have occurred, and some implications forthe future. The over-arching question is: How impor-tant is it that these rates of educational attainmenthave now been level for a quarter century, and shouldwe be making more effort to resume an upwardgrowth? Some may conclude that the situation isacceptable, but it does seem worthy of examination.
High School Graduation
At the turn of the 20th century, only a tinyproportion of young people completed high schooland received a high school diploma, rising to aboutone in six by 1920 (see Figure 1). The climb wascontinuous, to half in the late 1940s, to two in threeby the late 1950s, and to over three in four during the1960s. But since the late 1960s, there have beenno gains. In fact, there has been slippage down to 71or 72 percent in the late 1990s.
The measurement of the high school completionrate has always been somewhat problematic, for anumber of reasons. The data used here allow a histori-cal comparison of the ratio of high school graduationsin any one year to the number of 17-year-olds in thatyear, a statistical series long published by the NationalCenter for Education Statistics (NCES). Of course,some graduates are 18 or even 19 years old when theygraduate, but the ratio of graduates to 17-year-oldsshould give us an approximate rate and reflect thetrend over time. Thomas G. Mortenson, of Post-secondary Education OPPORTUNITY, recently made
THE PEAKING OF ATTAINMENT?
1 Statistics that apply to all young adults, of course, conceal differences among population groups. Separate stories are the divergence in thegraduation rate among men and women, the lower rates for most minorities, and the higher rates for Asian Americans. For a recent accountof these differences, see Postsecondary Education OPPORTUNITY, Number 118, April 2002.

5
estimates on another basis, taking the ratio of highschool freshmen in one year to the number of gradu-ates four years later, with a very similar result.2 Someestimates that exclude General Education Develop-ment (GED) certificates put the current rate around75 to 76 percent.
The most used set of data comes from the CurrentPopulation Survey of the U.S. Bureau of the Census,where people are asked whether they graduated fromhigh school. This survey includes those who got aGED certificate, and it is not now possible to separateregular high school diplomas from GEDs in thispublished statistical time series. On this basis, 88percent of those aged 25-29 were high school gradu-ates (or more) in 2000, a little higher than the 85
1870 1920 1952 1959 1964 1969 1974 1978 1984 1989 1994 2000
0
20
40
60
80G
radu
ates
as
a P
erce
ntag
e of
17 Y
ear
Old
Pop
ulat
ion
Figure 1: High School Graduates Compared with thePopulation 17 Years of Age, 1869-70 to 1999-2000
2 Similar graduation rates were also calculated by the Education Trust.
percent of 20 years ago. What seems to have happenedof late is that getting regular diplomas has droppedmodestly, with the drop more than made up by morepeople in the 19 or under age group getting a GEDcertificate. In fact, the meaning of getting a “regular”diploma is evolving, with states introducing differentkinds of diplomas, depending on the nature of thestudent’s academic achievement, and some statescreating diplomas for their GED recipients.
Of course, there is wide variation in the “regular”graduation rate by state and by race and ethnic groupsamong the states. Jay P. Greene of the ManhattanInstitute has made estimates by looking at eighthgrade enrollments in 1993 and the number of stu-dents getting a high school diploma in 1998 (with
Note: Graduates are of regular day school programs.Source: U.S. Department of Education, National Center for Education Statistics.

6
majority of GEDs go to people under age 25. Thepercentage going to people age 19 or younger hasrisen substantially, from 33 percent in 1975 to 43percent in 1999; the GED is an increasingly impor-tant factor in tracking the attainment of young peoplearound the traditional age of high school graduation.
Should we be comfortable with this increase inthe number of those in the under 20 age groupreceiving GEDs? Certainly we can view the develop-ment of the GED as a very positive one, since itconstitutes a way for people to make up, at leastsomewhat, for missing graduation from the regularschool system. It also has permitted credentialingbased upon the efforts of a great many “secondchance” institutions and programs, such as adult
1971
1975
1980
1981
1982
1983
1984
1985
1986
1987
1988
1989
1990
1991
1992
1993
1994
1995
1996
1997
1998
1999
200
250
300
350
400
450
500
550
GE
D C
rede
ntia
ls A
war
ded
(in T
hous
ands
)
In 1975, 33 percent of GED test takerswere 19 years old or younger,rising to 43 percent in 1999.
Figure 2: General Education Development (GED)Credentials Issued, 1971 to 1999
some adjustments to account for students moving intoand out of the area). The state with the highest gradu-ation rates, by these estimates, was Iowa at 93 percent,and the lowest was Georgia at 57 percent. Acrossstates, the Black rate ranged from a low of 40 percentto a high of 71, and the Latino rate from 32 to82 percent.3
Doubtlessly, the GED has become an importantfactor in reporting the educational attainment of theU.S. population. Credentials awarded rose from227,000 in 1971 to 312,000 in 1975 and to 500,000in 1981 (see Figure 2). A decline then set in, likelyrelated to demographic changes, with awards droppingsharply by the end of the 1980s and then risingback to previous levels by the mid-1990s. The great
3 Jay P. Greene, High School Graduation Rates in the United States, the Manhattan Institute for Policy Research, prepared for the Black Alliance forEducational Options, November 2001. Estimates with such a time lag approach have also been made by the Education Trust.
Source: American Council on Education.

7
education and community-based organizations.But on average, at least, the GED is not a completeequivalent, and arguably, it is not satisfactory to tradeoff regular graduations for GED certification.
A number of studies have been made of themeaning of the GED, and this work was synthesizedby the U.S. Department of Education in 1998.4 Thereport makes the point that the GED itself is not aneducation program, but a way to certify the knowl-edge a person has. GED examinees spend a medianof 30 hours in preparation, although 24 percent spendover 100 hours. This compares to about 410 hours incore curriculum classes in a typical school year. Also,with their average of 2.1 years of additional schooling,“high school graduates typically had 861 more hoursof core curriculum classes.”
The general conclusion of the synthesis was asfollows: “In some respects, GED recipients resemblehigh school graduates; in others, they resemble drop-outs; in still other ways, they fall between the two.Given these mixed findings, the common practice ofcounting GEDs as high school graduates in educa-tional statistics should be reconsidered.” At a mini-mum, graduation data should be collected in such away that we can separate regular graduates from thosewho obtain a GED. As we track the results of educa-tion reform and higher standards, we need to knowwhat effect they are having on school retention.
Recently, however, the American Council onEducation revised the GED so that it goes beyondmultiple-choice testing. As this new test is adminis-tered and passing scores are set by the individualstates, it will remain to be seen whether the test provesto be more demanding in terms of the level of educa-tional achievement attained and what the outcomeis for those who receive the GED certificate.
Returning to the basic point of this discussion,the rate at which young people have completed highschool has remained fairly level for decades, with slightdeclines despite many campaigns to reduce the drop-out rate. None has been successful, at least in termsof the national average.5
College Attendance and Graduation
A general perception exists that more youngpeople are attending college than ever before, and thisis, in fact, the case. What gets attention is the fact thatmore high school graduates are entering college in thefall after they graduate, and the college enrollmentrates of people aged 18 to 24 are up over what theywere 15 years ago; this fact is well reported, and thestatistics are abundant. The word on the street hasbeen that to get anywhere anymore, one must have acollege education. Employment and earnings datasupport this view, and more and more young peopleare trying.
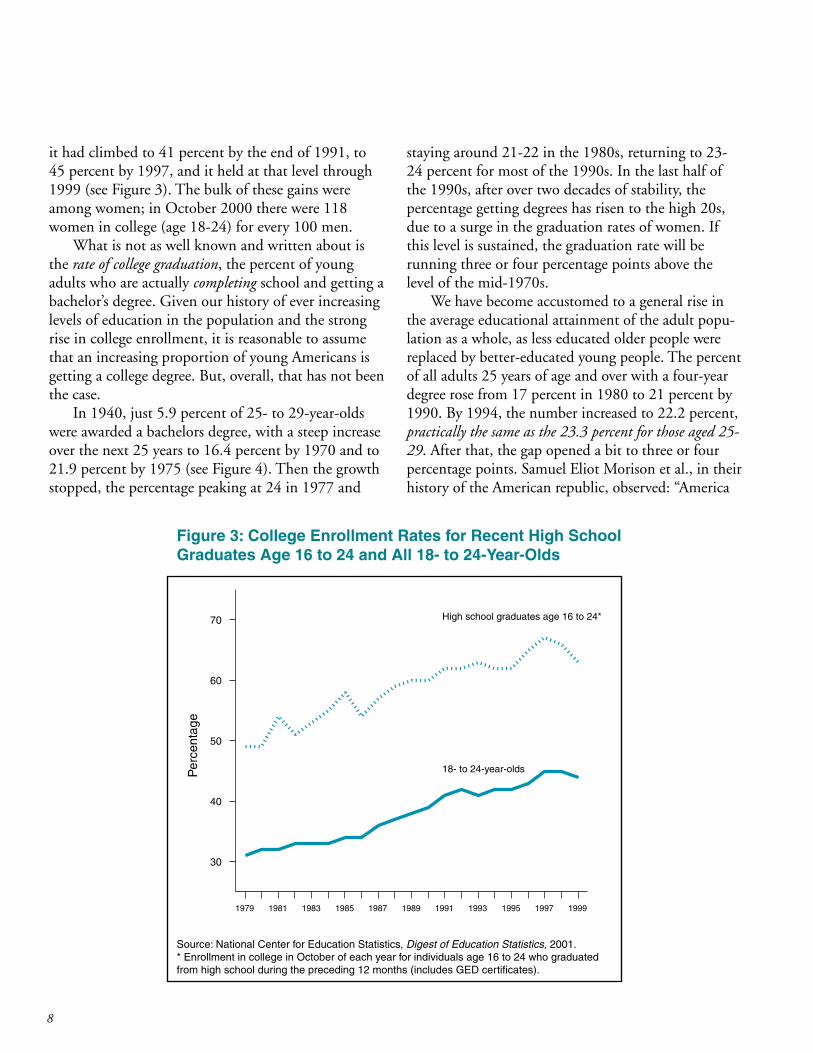
At the beginning of the 1980s, one half of highschool graduates entered college the fall after theygraduated from high school. Just a decade and a halfago, the W. T. Grant Foundation issued The ForgottenHalf, a much-quoted report calling the nation’s atten-tion to the plight of those not going to college.6 Thenthe percentage climbed to 60 percent by 1989, to 67percent by 1997, and dropped to 63 percent by 1998.The average (mean) of the 1990s was around 63percent, or 13 percentage points higher than the early1980s (see Figure 3).
By any standard of the past, that is a large increase.A nearly comparable increase is seen in college enroll-ment for the whole college-going age group of 18 to24. At the end of the 1970s, 31 percent were enrolled;
4 David Boesel, Nabeel Alsalam, and Thomas M. Smith, Educational and Labor Market Performance of GED Recipients, U.S. Department ofEducation, National Education Library, 1998.
5 An emerging factor that is important in the dropout picture is the increased immigration of people who were dropouts before they came to theUnited States.
6 William T. Grant Foundation Commission on Work, Family, and Citizenship, The Forgotten Half: Non-College Youth in America, Washington,DC, January 1988.
8
it had climbed to 41 percent by the end of 1991, to45 percent by 1997, and it held at that level through1999 (see Figure 3). The bulk of these gains wereamong women; in October 2000 there were 118women in college (age 18-24) for every 100 men.
What is not as well known and written about isthe rate of college graduation, the percent of youngadults who are actually completing school and getting abachelor’s degree. Given our history of ever increasinglevels of education in the population and the strongrise in college enrollment, it is reasonable to assumethat an increasing proportion of young Americans isgetting a college degree. But, overall, that has not beenthe case.
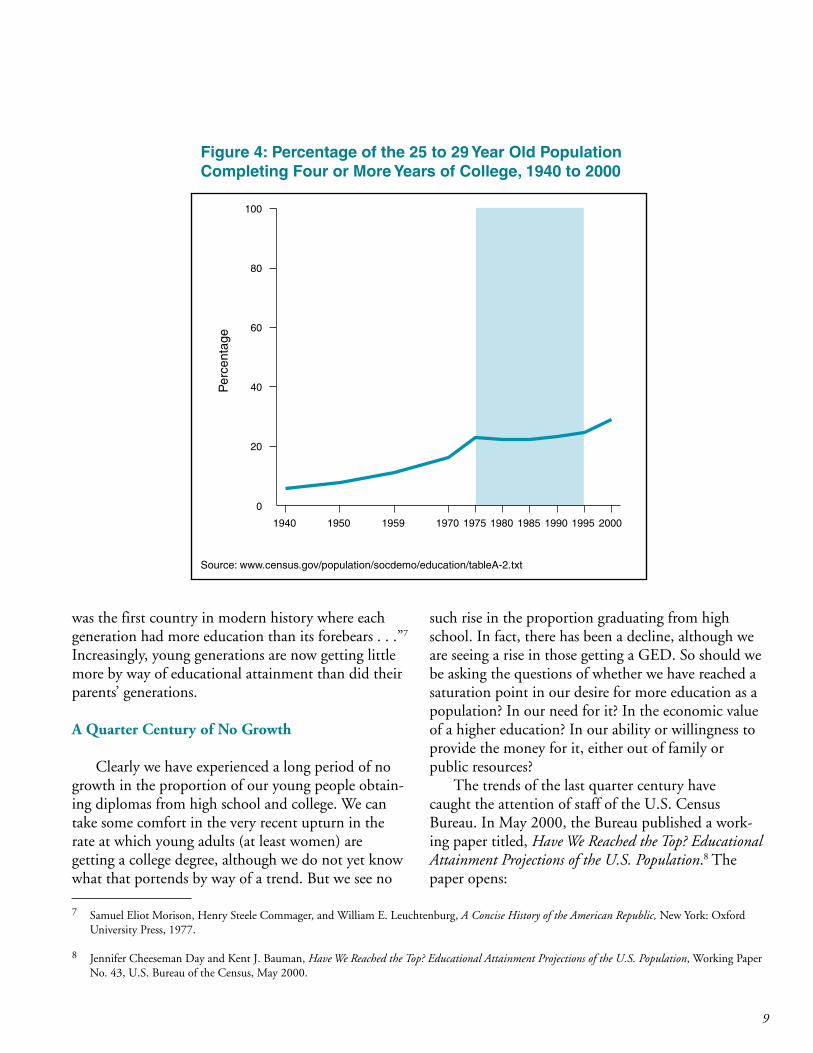
In 1940, just 5.9 percent of 25- to 29-year-oldswere awarded a bachelors degree, with a steep increaseover the next 25 years to 16.4 percent by 1970 and to21.9 percent by 1975 (see Figure 4). Then the growthstopped, the percentage peaking at 24 in 1977 and
staying around 21-22 in the 1980s, returning to 23-24 percent for most of the 1990s. In the last half ofthe 1990s, after over two decades of stability, thepercentage getting degrees has risen to the high 20s,due to a surge in the graduation rates of women. Ifthis level is sustained, the graduation rate will berunning three or four percentage points above thelevel of the mid-1970s.
We have become accustomed to a general rise inthe average educational attainment of the adult popu-lation as a whole, as less educated older people werereplaced by better-educated young people. The percentof all adults 25 years of age and over with a four-yeardegree rose from 17 percent in 1980 to 21 percent by1990. By 1994, the number increased to 22.2 percent,practically the same as the 23.3 percent for those aged 25-29. After that, the gap opened a bit to three or fourpercentage points. Samuel Eliot Morison et al., in theirhistory of the American republic, observed: “America
1979 1981 1983 1985 1987 1989 1991 1993 1995 1997 1999
30
40
50
60
70
Per
cent
age
High school graduates age 16 to 24*
18- to 24-year-olds
Figure 3: College Enrollment Rates for Recent High SchoolGraduates Age 16 to 24 and All 18- to 24-Year-Olds
Source: National Center for Education Statistics, Digest of Education Statistics, 2001.* Enrollment in college in October of each year for individuals age 16 to 24 who graduatedfrom high school during the preceding 12 months (includes GED certificates).
9
was the first country in modern history where eachgeneration had more education than its forebears . . .”7
Increasingly, young generations are now getting littlemore by way of educational attainment than did theirparents’ generations.
A Quarter Century of No Growth
Clearly we have experienced a long period of nogrowth in the proportion of our young people obtain-ing diplomas from high school and college. We cantake some comfort in the very recent upturn in therate at which young adults (at least women) aregetting a college degree, although we do not yet knowwhat that portends by way of a trend. But we see no
such rise in the proportion graduating from highschool. In fact, there has been a decline, although weare seeing a rise in those getting a GED. So should webe asking the questions of whether we have reached asaturation point in our desire for more education as apopulation? In our need for it? In the economic valueof a higher education? In our ability or willingness toprovide the money for it, either out of family orpublic resources?
The trends of the last quarter century havecaught the attention of staff of the U.S. CensusBureau. In May 2000, the Bureau published a work-ing paper titled, Have We Reached the Top? EducationalAttainment Projections of the U.S. Population.8 Thepaper opens:
1940 1950 1959 1970 1975 1980 1985 1990 1995 2000
0
20
40
60
80
100P
erce
ntag
e
Figure 4: Percentage of the 25 to 29 Year Old PopulationCompleting Four or More Years of College, 1940 to 2000
7 Samuel Eliot Morison, Henry Steele Commager, and William E. Leuchtenburg, A Concise History of the American Republic, New York: OxfordUniversity Press, 1977.
8 Jennifer Cheeseman Day and Kent J. Bauman, Have We Reached the Top? Educational Attainment Projections of the U.S. Population, Working PaperNo. 43, U.S. Bureau of the Census, May 2000.
Source: www.census.gov/population/socdemo/education/tableA-2.txt

10
There is growing concern that educational levels in the U.S.population may stagnate or even decrease in the comingdecades. Factors contributing to this concern include aleveling of education levels of entering cohorts compared tothose that are retiring, and growth in population numbersof ethnic groups and immigrants with traditionally lowereducation levels.
The authors have developed new projectionmodels to determine the future direction of attain-ment. Their results lead them to conclude that wehave not reached the top, and that some growth willcontinue. They caution, however: “If younger cohortswere to get less education, our projections may beoverly optimistic.”
The stability of regular high school graduationrates and college completion for such a long periodhas provoked new efforts by demographers to lookinto the future. If attainment of these degrees is goingto grow at all, the evidence is that it will likely be atvery much slower rates than we have long been accus-tomed to. The record of the last quarter century isclear enough to put some important questions on thetable, such as: Why has growth stopped or slowed toa crawl? Where is the stoppage or slowdown concen-trated, and what does it mean for equity and access?What are the consequences and implications for theAmerican society and economy and for the goal ofequality of opportunity across racial and ethnicgroups? What are the implications for inequality inthe overall earnings and income distribution giventhe existing differences in educational attainment?This report will try to frame these questions andunderstand their importance rather than provideanswers—for this author does not have them. Theeffort itself was undertaken as a result of surprise andperplexity after absorbing what the statistical seriesseemed to be revealing.
After being accustomed to having the highest ratesof attainment of a college/university education, theUnited States has now lost its preeminence in the
world. According to the Organization for EconomicCooperation and Development (OECD), a U.S. four-year degree would be in the category of “medium firstdegree tertiary (type) programs.” In such programsfor 1998, the graduation rate was 32.9 percent forthe United States, compared to 33.2 percent for GreatBritain, 33.3 percent for Norway, and 33.3 percentfor the Netherlands. Just below the United States areJapan (27.7 percent), Canada (27 percent), and NewZealand (26.1 percent).9
One striking contrast among the countries is thevariation in the dropout rate in higher education. Ofcourse, comparisons are difficult and OECD usesvarying time periods and summaries from studiescarried out in different ways. The rate reported rangesfrom a low of 11 percent in Japan to 65 percent inItaly; it was 37 percent in the United States. Out of 20countries, 13 countries have dropout rates lower thanthe United States. Getting more of those who do startto make the higher education journey through thesystem to finish it would make a large change in howthe United States compares internationally.
Inequality and Persistence
Given the well-known inequalities in educationalattainment, the reader, by this point, may be thinkingthat the sources of growth in the rate of gettingdiplomas are obvious. According to the U.S. CensusBureau, in 1999, 27 percent of Hispanic 16- to24-year-olds did not have a high school diploma ora GED, compared to 13 percent for Blacks and 7percent for Whites. The comparable percentage forthe lowest quartile in family income is 21, comparedto 4 for the highest quartile; there is plenty of roomfor—and need for—growth in high school completionfor minority and lower-income families.
In 1999, 66 percent of White high school gradu-ates had enrolled in college the following fall, com-pared to 59 percent of Black graduates (who havebeen narrowing this gap) and just about half
9 Organization for Economic Cooperation and Development, Education at a Glance: OECD Indicators, 2000, Paris, 2000.

11
of Hispanic graduates (on the basis of a three-yearmoving average).
Thirty-six percent of White 25- to 29-year-oldswho had completed high school had attained abachelor’s degree or higher by 2000, compared to 21percent of Blacks and 15 percent of Hispanics. A lotof room clearly is left for minority groups to catch upwith the attainment level of the majority.
Enlarging the sources of growth in college gradua-tion will mean facing some hard facts with regard tocosts and resources. The reasons for failure to improvegraduation rates from high school (and the achieve-ment of those who do graduate) is perhaps moreelusive, as investments in public education have risen.But in the sphere of higher education, tuition costshave grown at a much greater rate than prices gener-ally, the proportion of costs covered by financial aidprograms has shrunk, and state appropriations tohigher education have declined in terms of the pro-portion of state revenues earmarked for higher educa-tion.10 Of course, costs and resources are intertwinedwith the ability of minority groups to catch up withthe majority.
It is reasonable to conclude that a considerableresource available to increase the rate of college gradu-ation lies in the large group of young people who startcollege but do not finish. It is, of course, not easy todetermine how much educational value ensues for theindividual, the society, and the economy when youngpeople spend six months or a year or two in collegewithout getting a certificate or a degree. (There hasbeen research, but more is needed.) We will go intothis a bit more below. But it is clear that more and moreyoung people are starting down the college path and notreaching their destination. The apparent increasing rateof non-completion has not been much examined anddebated, to this author’s knowledge, as an issue ofpublic educational policy and practice, although
individual colleges and universities are putting moreemphasis on student retention as they struggle tomaintain or increase their average enrollment.
It is, in fact, hard to get a statistical handle onthe college non-completion rate, in terms of trendsover time, even harder than for the high school non-completion rate. In Towards Inequality, a case wasmade that non-completion was increasing, basedheavily on circumstantial evidence; the data are firmernow. A comparison of the rate of entry into collegeand the proportion of 18- to 24-year-olds enrolled incollege (Figure 3) with the proportion of 25- to 29-year-olds completing four or more years of college(Figure 4) establishes that a higher percentage must besettling for less than a four-year college degree. Enroll-ments have long been rising steadily while graduationis flat, until the last several years.
A longitudinal study in which those who entercollege are followed over a considerable period of timeis needed to determine the pattern of persistence.NCES started such a study in 1989 and completed afive-year follow-up in 1994.11 In five years, 18 percentwere still enrolled and 28 percent had no degree andwere no longer enrolled. Another study was started ofthe 3.3 million students who enrolled in college in the1995-1996 school year, and the first follow-up wasconducted in 1998.12 At this point, the rate ofcompletion between comparable time periods cannotbe determined, because not enough time has elapsedin the second study for those students to have receiveda bachelor’s degree. We do know that of those enteringin the 1995-1996 school year, 32 percent had nodegree and were no longer enrolled three years later.This compares with the 28 percent who had no degreeand were no longer enrolled after five years. Thissuggests a rise in non-completion, with more studentsleaving the system after three years than after five yearsin the earlier study.
10 A review of these developments can be found in Paul E. Barton, Towards Inequality: Disturbing Trends in Higher Education, Policy InformationPerspective, Policy Information Center, Educational Testing Service, October 1997.
11 National Center for Education Statistics, “Postsecondary Education Longitudinal Survey,” Digest of Education Statistics, 1996.
12 National Center for Education Statistics, Beginning Postsecondary Students Longitudinal Study, First Follow-Up, 1996-98, Methodology Report,NCES-2000-157, April 2000.

12
If NCES does a five-year follow-up, a clear picturewill be available of precisely what happened to theclass entering in 1995-1996 as compared to the classentering in 1989-1990. These studies will also shedlight on trends for students transferring amongcolleges and continuing their education after receivingan associate’s degree.
Other data are available that show the persistencerates of students from the freshman year to the startof the sophomore year. There is deterioration in thesepersistence rates for private four-year institutions andfor both private and public two-year institutions. Thepersistence rates vary greatly among categories ofinstitutions: 91.6 percent for those that are “highlyselective,” 81.8 percent for “selective,” 72.4 percentfor “traditional,” 66 percent for “liberal,” and 60.6
percent for those with “open enrollment.” The largestdecline from 1991 to 2001 was in those with openenrollment.13
Data are also available on institutional graduationrates—the percentage of those who enter four-yearcolleges and universities as freshmen and five yearslater have graduated. There has been a steady declinein these graduation rates since 1983. The graduationrate in public four-year institutions dropped from52.2 percent in 1983 to 41.9 percent in 2001, and inprivate schools from 59.5 percent in 1983 to 55.1percent in 2001 (see Figure 5). However, from thisdata we do not know how many transferred to otherinstitutions and graduated, so a precise measure ofchange remains elusive. The rates vary with selectivity,ranging from 78.8 percent graduating from highly
83 85 87 89 91 93 95 97 99 01
40
45
50
55
60
65
60%
58%
Total
Private
Public
52%
55%
51%
42%Ave
rage
Inst
itutio
nal G
radu
atio
n R
ate
Figure 5: Average 5-Year Institutional Graduation Rates atPublic and Private 4-Year Institutions, 1983 to 2001
13 Postsecondary Education OPPORTUNITY, Number 110, August 2001.
Source: Postsecondary Education OPPORTUNITY, Number 110, August 2001.

13
selective institutions, down to 36.5 percent in schoolswith open enrollment.14
While graduation is not the objective of manystudents who enroll in community colleges, a similardecline in graduation rates has occurred there, drop-ping from 44 percent graduating in three years in 1983to 37 percent in 2001.
A sure sign that we do not attach enough impor-tance to these high attrition rates is the failure to havegood measures of them or of the trend in attritionover time. As Daniel Patrick Moynihan has said, “Inour country, we only do what we measure.” So wemust start with better records of how many and ofwhat income, race, and ethnicity are those who fall bythe wayside. The data will help focus attention andalso will help frame the right questions. Some actionsto consider include the following.
� The sources of growth for getting higher rates ofcollege completions are intertwined with dealingwith inequities in opportunity—although, of course,eliminating inequities is a worthy goal on its own.Those who start college and do not finish are dispro-portionately Black, Hispanic, and American Indianand have lower income across all races. Federal andstate financial aid policies are critical here.
� Financial aid for those less well off—such as Hopescholarships—have encouraged more to entercollege. But we need more attention to whathappens after they get there and what is neededto sustain effort to graduation.
� We know that success in college is dependent onhigh achievement and the taking of rigorous coursesin high school (and earlier). And we know thatabout 3 in 10 college freshmen are taking remedialcourses. Success in improving college completionrates is tied to success in providing more rigorous
14 Postsecondary Education OPPORTUNITY, Number 117, March 2002.
15 Vincent Tinto, Leaving College: Rethinking the Causes and Cures of Student Attrition, University of Chicago Press, 1987, with a revised editionin 1994.
16 Postsecondary Education OPPORTUNITY, Number 58, April 1997.
courses earlier and in raising standards—all themore important for minorities and students fromlower socio-economic backgrounds generally.
� We also know that persistence in college is not all amatter of finances. A lot has to do with the cultureof particular colleges and factors that are in thecontrol of colleges. Vincent Tinto summarizes theresults of the many studies that have been madeof these college environments.15 One example: “Itis of little surprise to discover that institutions withlow rates of student retention are those in whichstudents generally report low rates of studentfaculty contact.”
� Greater awareness is needed of the success andfailure of individual colleges and universities ingetting the students through to graduation. Whileretention rates are generally available, they varywith the characteristics of the student body, as wellas with the culture and climate of the college. Forcomparison, these differences need to be takeninto account.
One such effort was made by Postsecondary Educa-tion OPPORTUNITY, where estimated graduationrates (using student background characteristics) werecompared with actual rates, institution by institution,and then ranked “according to their success (or failure)to graduate the students they admit.” The top rankingschool had an expected graduation rate (within sixyears) of 40 percent and an actual rate of 77 percent.The bottom ranking school had an expected rate of75 percent and an actual rate of 21 percent.16
Perhaps financial aid and support policies shouldtake into account those schools that are doing toomuch churning of students or operating revolvingdoor institutions. At a minimum, such measuresshould be made widely available.

14
How important is it that we seem to have stoppedgrowing in formal education attainment? While that isa hard question to answer, education has historicallybeen very important. Max Lerner in America as aCivilization (1957) commented that Americans “havean extravagant reliance on education.”17 Studies byeconomists have shown the importance of educationin economic growth and productivity. The personperhaps most representative of American education,Horace Mann, called education “the balance wheelof the social machinery.”
When the United States has faced problems, it hastypically turned to the education system for solutions.The assimilation of immigrants was sped by “Ameri-canization” classes in public schools. In the late 1950s,education in science and mathematics was America’sresponse to Sputnik. In the 1960s, it was the responseof the Kennedy administration to “getting Americagrowing again.” Society’s increasing involvement indrugs was to be countered by programs in the schools,teaching students to “just say no.” Teenage pregnancywas to be approached, in part, through increasededucation. Just name a problem, and there likely hasbeen a movement to deal with it in the schools.
The intractable problem of prejudice and dis-crimination was often said to require education. Asa Princeton University graduate student in the late1950s, this author participated in a large study thatexamined the role of education in “Resistance andReadiness for Desegregation,” as the study and result-ant book was called. Research for that study includeda review of numerous studies on the role of educationin shaping attitudes and belief systems. The studyfound that, as formal education increased, noticeableshifts tended to occur from common sense to scienceas acceptable evidence; from punishment to reform inpenological theory; from violence and direct action tolaw as agents of policy; from patriarchy to democracy
in spousal relations; and from aesthetics to creativityin patterns of recreation, among others. This studyalso found less prejudiced behavior as educationadvanced.18
In a book published in 1991, Ernest Pascarellaand Patrick Terenzini synthesized over 2,600 researchstudies.19 The list of areas in which positive effects ofa college education occur is extensive:
� A host of improvements in learning and cognitivedevelopment in verbal, quantitative, oral andcommunication, analytical, and critical thinkingskills, as well as the use of reason and evidence toaddress ill-structured problems and intellectualflexibility;
� Aesthetic, cultural, and intellectual values;
� Social self-concept;
� Self-esteem;
� Intellectual orientation;
� Personal adjustment and psychological well-being;and
� Use of principled reasoning in judging moral issues.
Other national studies have found associationwith civic and community affairs, participation inpolitics, and in voting. A function of education noteasily captured in research studies is the pervasive roleit plays in social and economic mobility in a classless-by-birth society. Much of our cohesiveness in a land oflarge and growing inequality in income and status isachieved as a result of the ability of the individual tomove up through effort and education. Our recent
THE AMERICAN RELIANCE ON EDUCATION
17 Max Lerner, America as a Civilization, New York: Henry Holt, 1957.
18 Paul Barton, Bernie Burrus, and Melvin Tumin, “Education, Prejudice, and Discrimination,” American Journal of Sociology, Vol. 23, No. 1,February 1958, pp. 41-49. This was one of the many journal articles resulting from the study, in addition to the book.
19 Ernest Pascarella and Patrick Terenzini, How College Affects Students: Findings and Insights from Twenty Years of Research, San Francisco: Jossey-Bass,1991.

15
history is one of a growing inequality of income,making individual opportunity ever more necessaryfor improving relative achievement. It is hard tooverestimate the important role education has playedand the role historians have ascribed to it. In his 1953history The United States of America, Henry BamfordParkes put it this way:
The expansion of education on all levels was anotherexample of the continuity of the American heritage. It wasan article of faith for most Americans that as much educa-tion as possible should be given to as many people aspossible. After the final establishment of compulsoryeducation in all states after 1918, the process of extendingthe years of compulsory attendance and enlarging thenumber of public high schools went up steadily.20
The United States enters this new century muchchanged in this respect. We have stopped growing, orare barely growing, in the portion of the populationgetting degrees. Ever more young people who do getthrough high school are entering college—at least upto 1997—but seem to be faltering, either as a failureof resolve or as an insufficiency of resources or both. Itis not apparent in the national discourse that there isany widespread appreciation for this development ofthe last quarter century or so, nor is there examination
20 Henry Bamford Parkes, The United States of America, A History, New York: Alfred A. Knopf, 1953.
21 Richard Tarnas, The Passion of the Western Mind, New York: Ballantine Books, 1991.
of what the consequences might be for a well-being sorooted in continued educational growth. The facts aresuch as to warrant this examination, even if we donot dramatize the importance of education growth asH.G. Wells did when he said that the “human storybecomes more and more a race between educationand catastrophe.”
While it is useful to describe the development ofthe intellect in these instrumental terms, it is notmeant to diminish its broader importance in thehuman experience. In The Passion of the Western Mind,Richard Tarnas conveys our early heritage: “InSocrates, thought was confidently embraced as a vitalforce of life and an indispensable instrument of thespirit. Intellect was not just a profitable tool . . . it was,rather, the divine faculty by which the human soulcould discover both its own essence and the world’smeaning . . . However arduous the path of awakening,such divine intellectual power lay potentially residentin humble and great alike.”21 Cutting to the essence,as he was wont to do, the late Stephen K. Bailey usedto say, as he rapped his knuckles on his forehead, “Iget an education so that later in life when I knock onme, somebody answers.”
These are some of the broader considerations. Weexplore in more detail the labor market and economicconsequences—education as “a profitable tool.”

16
Labor market and human capital economists havebeen, for decades now, pointing out the relativelygreater demand and remuneration in the United Statesfor people with college degrees and the relative declinein demand for those with only a high school educa-tion or less. National and international assessmentshave shown strong economic rewards for literacy andmath proficiency. Some declines also occurred inabsolute earnings, in real dollars, for people with lessthan a college degree, especially among young male
adults. The history of the recent past, since 1987, isshown in Figure 6. Data are for full-time, year-roundworkers. Men and women who have a bachelor’sdegree or more have gained modestly in real dollars.When those with just a bachelor’s degree are separatedout, real earnings have been fairly level, with only alittle gain at the end of the 1990s after an extendedperiod of unprecedented economic growth. The realearnings of men and women with an associate’s degreewere stable during this period. A decline in earnings is
THE ECONOMY AND LABOR MARKET CONNECTION
Figure 6: Median Annual Earnings* of Full-Time, Year-Round Workers 25 Years Old andOver, by Educational Attainment, 1987 to 2000
1987 1988 1989 1990
10
20
30
40
50
60
70
1991 1992 1993 1994 1995 1996 1997 1998 1999 2000
Tho
usan
ds o
f Dol
lars
Bachelor’s degree or more
Bachelor’s degree
Associate’s degreeSome college (no degree)
High school graduate(or equivalency)
9th to 12th grade(no diploma)
1
2
3
4
5
1987 1988 1989 1990
10
20
30
40
50
60
70
1991 1992 1993 1994 1995 1996 1997 1998 1999 2000
Tho
usan
ds o
f Dol
lars
1
2
3
4
5
Bachelor’s degree or more
Bachelor’s degree
Associate’s degreeSome college (no degree)
High school graduate(or equivalency)
9th to 12th grade(no diploma)
1 = 5 years of college or more2 = 4 years of college or more3 = 1 to 3 years of college4 = 4 years of high school5 = 1 to 3 years of high school
*Earnings are in 2000 CPI-U-RS adjusted dollars
Sources: U.S. Census Bureau, Tables P-24 and P-25,www.census.gov/hhes/income/histinc/p24.html andwww.census.gov/hhes/income/histinc/p25.html
MALES
FEMALES

17
seen for men with some college but no degree, witha recovery toward the end of the period and a dipand recovery for women. For all others from 1987-1999, there was a decline. Those doing the worst werehigh school dropouts, with annual earnings fallingsharply until 1996, with some recovery after that. Theincreased supply of immigrants at the low skilled endof the labor market contributed to declining earningsof dropouts.
The College Degree
Tracing the labor market role in the patterns ofeducational attainment would be an extended undertak-ing that would need to cover the whole period of thelast 25 years when attainment plateaued. But theselimited data do show that demand—as expressed interms of what employers will pay—has not beenrising faster than the supply of those with a collegeeducation, until the education required exceeds thebachelor’s degree. Absolute returns to the individual whocompletes college have not been rising and luring moreto complete college work, although the returns havebeen growing relative to those who have less education(see Figure 6). On the cost side of the ledger, tuitionhas risen more rapidly than general inflation.
Decisions about pursuing a college education havebeen made in an environment unfriendly to non-college graduates. The presumption has been thatbecause of rising relative earnings, demand for collegegraduates is increasing, and that should attract moreyouth to college. But when young people look at thesebasically stable earnings for college graduates com-bined with greatly rising costs for a college education,perhaps that dampens the drive to spend the effortand money to pursue and complete a four-year degree.
What else do we know about the need for college-educated people in the economy that might cast lighton whether people choose to get degrees? The U.S.Bureau of Labor Statistics (BLS) projects employmentby occupation and by the educational requirementsof those occupations. The new projections, from 2000to 2010, show greater growth in occupations requiring
postsecondary education than did the projectionsfrom 1996 to 2006. While average employment inall occupations is expected to grow by 15 percent,employment in occupations requiring a bachelor’sdegree or higher is expected to grow by 22 percent,about the same as for occupations requiring onlya bachelor’s degree (see Table 1). In addition, a24 percent increase is expected in occupations requir-ing an associate degree or postsecondary vocationalaward. (The increase of associate degrees alone was32 percent, higher than any other category ofpostsecondary education.)
The BLS also has projected the number of jobopenings between 2000 and 2010. Job openingprojections take into account both employmentgrowth and the need to replace workers who leavejobs to enter other occupations, retire, or leave thelabor force for other reasons. The importance ofdifferentiating growth and replacement needs isillustrated by the BLS projection that “more jobopenings are expected to result from replacementneeds (35.8 million) than from employment growth(22.2 million) . . . The only major group with feweropenings from replacement needs than from employ-ment growth is professional and related occupations,the fastest growing.” Generally, jobs requiringadvanced education have less turnover; in educationand career planning, both job growth and job open-ings should be considered.
The projected growth rates for employment inoccupations requiring college degrees indicate muchfaster than average growth and suggest some accelera-tion in the need for workers with a college degree.This contrasts with a past period when the proportionof young adults getting a four-year college degree hasbeen mostly stable. Still, of the total job openingsexpected by 2010, 7 out of 10 are expected to requireonly work experience or on-the-job training.
One way to look at the need for more collegegraduates and at the absorption of college graduatesinto the economy is to look at how they are employedand the extent to which they are using the educationsthey received. If a considerable proportion end up

18
doing work that does not require a college degree, theword will get around and fewer will go to college, ormore of those who do go will change the kinds of jobsthey prepare for. NCES used to conduct a survey ofthe jobs recent graduates obtained but curtailed itafter the 1992-1993 school year. However, there is anew study that has added a dimension not previouslyavailable. NCES recently published a report thatdiscusses the 1997 work experience of 1992-1993degree recipients who were not enrolled in graduateeducation.22 In all fields, 61 percent were in jobswhere a degree was required, 55 percent were in jobswith a definite career potential, and just 38 percentwere in jobs where both a degree was required and thejob had definite career potential (see Figure 7). As canbe seen from the figure, the range was large, from 54percent to 80 percent in the first category, and from27 percent to 54 percent in the last category, depend-ing on the field of study in college. This was in astrong, low unemployment rate economy. In some
occupational areas, demand may not be strong enoughto require more college graduates; information fromthese surveys can help inform about that need.
Some College
With an increasing proportion of high schoolgraduates now entering college compared to 15 yearsago,23 an increasing proportion of 18- to 24-year-oldsenrolled in college, and relative stability in the propor-tion of 25- to 29-year-olds getting a bachelor’s degree,we can expect to have had a growing number ofpeople who start college and not finish. One factor tobe weighed in the balance is the tendency of such astrong economy (until the recession in 2001) to lurepeople out of school—and a strong and growingeconomy it was during most of the 1990s. Whiledemand was strong and unemployment was falling,real wages did not rise over the 1987-2000 period.They fell from $41,672 (in 2000 dollars) to $38,650
Table 1: Employment Projections by Source of Education or Training, 2000 to 2010*
Most Significant Source Percent Change in Percent Distribution of Percent Distribution ofof Education or Training Employment 2000-2010 Change in Employment Total Job Openings
Total, All Occupations 15.2 100.0 100.0Bachelor's or Higher Degree 21.6 29.3 20.9 First Professional Degree 18.2 1.7 1.2 Doctoral Degree 23.7 1.6 1.3 Master's Degree 23.4 1.5 1.1 Bachelor's or Higher Degree Plus Work Experience 19.4 6.4 4.7 Bachelor's Degree 22.5 18.1 12.6Associate Degree or Postsecondary 24.1 12.8 9.3Vocational Award Associate Degree 32.0 7.3 4.5 Postsecondary Award 18.2 5.5 4.8Work-Related Training(Work Experience or On-The-JobTraining) 12.4 57.9 69.8
Source: Daniel E. Hecker, "Occupational Employment Projections to 2010," Monthly Labor Review, U.S. Department of Labor, November 2001, page 83.
*An example of how to read the table: From 2000 to 2010 there is expected to be an increase of 21.6 percent in employmentwhere the most significant source of education or training is a Bachelor's degree or higher. Jobs with this education requirement areexpected to account for 29.3 percent of the change in employment, and for 20.9 percent of total job openings during that period.
22 Laura J. Horn, Lisa Zahn, and C. Dennis Carroll, From Bachelor’s Degree to Work, National Center for Education Statistics, NCES 2001-165,February 2001.
23 Peaking in 1997, with some decline since.

19
for all full-time year-round male workers with justsome college. Earnings were stable for women, averag-ing $27,617 in 1987 and $27,190 in 2000 (see Figure6). It was not the rise in real earnings that lured peopleto college nor attracted them to leave; however,earnings were increasing relative to people with lesseducation, whose earnings were falling even morerapidly.
Another important avenue of exploration iswhether employer demand was such that the increasingnumber of jobs available required the additional learn-ing that was imparted in one to three years of college.This question cannot be easily settled with the dataavailable. On the one hand, labor economists generallyhold that if the employer paid more to such people
than to those with less education, they must have paidmore because the workers had higher productivity orlower training costs, presumably because of theirgreater knowledge or possibly because of work habits,motivation, etc. that are common to both school andjobs. We do know that their earnings are higher thanthe earnings of high school graduates, even if they havenot been rising, and as earnings of high school gradu-ates declined in real terms, there was a relative increasein the earnings of those with some college.
Another consideration is that the pool of younghigh school graduates has changed considerably in thelast 15 years, and this is a likely factor in the decline inearnings of high school graduates (although we do notknow how large it is). One change is that a higher
Figure 7: Attributes of Jobs of 1992-1993 Bachelor Degree Recipients in April 1997(those not enrolled in graduate education)
All fields
Education
Business
Engineering/Architecture
Computer Science
Health/Nursing
Health/Other
Communications/Journalism
Social Work/Protective Service
Humanities and Arts
Biological/Interdisciplinary Science
Mathematics/Physical Science
Social Sciences
Other
0 30 40 50 60 70 80 100
61
75
56
80
69
75
81
59
60
54
65
73
54
58
Applied Fields
Academic Fields
0 30 40 50 60 70 80 100
55
45
58
63
63
56
54
59
41
54
50
49
53
59
0 30 40 50 60 70 80 100
38
37
37
54
46
43
47
41
27
33
33
42
33
38
Employed in JobWhere Degree Is Required
Employed in Job withDefinite Career Potential
Employed in Job WhereDegree Is Required and with
Definite Career Potential
Percentage
Bachelor’s Degree Major
Source: Laura J. Horn, Lisa Zahn, and C. Dennis Carroll, From Bachelor’s Degree to Work, National Center for Education Statistics,NCES 2001-165, February 2001.

20
proportion now have only a GED; employers paythem more than they pay dropouts, but less than theypay those with a regular diploma.24 Another change isthat two decades ago, half of high school graduates didnot enroll in college the fall after graduation, but by1997, the percentage had fallen to 33 percent, edgingup to 37 percent by 1999 (see Figure 3). The averagelabor market quality of high school graduates with nocollege must have dropped, given a reasonable assump-tion that, on average, those who went on to collegewere more qualified in employers’ eyes than those whodid not. Were the young people who had some collegenow better qualified for jobs that required advancedlearning, or would the employers have hired many ofthem anyway, because they were the “upper cut” of thehigh school graduates and the people the employerswould have paid a premium to get? We do know thatemployers will pay more to people who have greaterliteracy proficiency but have the same educationalcredentials, and we can expect that, on average, thehigh school graduates who opt for college now—butdid not 15 years ago—have higher literacy achieve-ment than those not going on to college.25
With the growing proportion of young peoplegetting some college credit but no degree or certificate,it becomes more important to understand what kindof benefits ensue from this much education. There hasbeen some analysis, but not enough in view of theincreasing importance of the question. For an earlierperiod covering the last half of the 1970s and most ofthe 1980s, earnings gains were found for persons withpostsecondary credits but no degrees (associate or
bachelor’s).26 Using a different data set for the period1984-1990, W. Norton Grubb examined the samequestion. His analyses of data from the Survey ofIncome and Program Participation (SIPP) led him tothe conclusion that “entering postsecondary educa-tion, but failing to complete a credential, does notimprove earnings reliably, unless perhaps a woman hasthree or four years of college. For men, the results aresomewhat more positive.”27
A recent study by NCES confirmed the payofffrom the two-year degree and the four-year degreebut had this to say about college attendance withouta degree:
“. . .after controlling for multiple aspects of student experi-ence and background, the economic returns of some collegecredits apart from degree completion were negligible—irrespective of the number of credits completed.” 28
We need to pursue research on this and reachsome consensus in the research community about thereturns to less-than-college completion. High schoolstudents, parents, and guidance counselors needreliable information; it may be more important tocomplete college than previously understood. And ifthe conclusions of these recent studies prove correct,this trend to a higher rate of non-completion is amatter of concern.
In any event, with more trying college and morenot completing it, the spotlight needs to be puton the reasons for non-completion and the conditionsthat favor persistence to obtaining a degree. And, of
24 Although the work of Richard Murnane, et al. has established that it was the dropouts who had demonstrated the lowest cognitive achievement inhigh school who got an advantage from obtaining a GED (see Who Benefits From Obtaining a GED? Evidence From High School and Beyond,National Bureau of Economic Research, June 1999), findings of different studies have varied and recent CPS data does not show a difference forfull-time workers (personal communication from Andrew Sum).
25 Andrew Sum, Literacy in the Labor Force: Results From the National Adult Literacy Survey, National Center for Education Statistics, 1996.
26 Thomas J. Kane and Cecilia Elena Rouse, Labor Market Returns to Two- and Four-Year Colleges: Is a Credit a Credit and Do Degrees Matter?Working Paper Series, National Bureau of Economic Research, January 1993.
27 W. Norton Grubb, The Returns to Education and Training in the Sub-Baccalaureate Labor Market: Evidence from the Survey of Income and ProgramParticipation 1984-1990, National Center for Research in Vocational Education, University of California, Berkeley, May 1995.
28 Brian Zucker and Royal Dawson, Credits and Attainment: Returns to Postsecondary Education Ten Years After High School, National Center forEducation Statistics, NCES 2001-168, March 2001, page iv.

21
course, success at the college level is presaged by highlevels of achievement in high school. (CliffordAdelman at the U.S. Department of Education hasestablished that the largest single predictor of collegecompletion is the rigor of courses taken in highschool.)29 It is also established that colleges vary a greatdeal in how many students complete them, even aftercontrolling for the backgrounds of the students theyenroll; the spotlight needs to shine on schools withhigh non-completion rates, as well as on the institu-tional factors and cultures associated with high ratesof completion.
While we work on getting the non-completionrates down, we should also recognize the need todevelop more avenues to success in the labor marketthan the traditional college route. More young peopleare making a try at college, possibly because they aregetting the message that not to get a degree meansbeing left in the backwashes of the economy. We need
to offer a variety of options at the high school level andto high school graduates. We need a fresh look atdeveloping other opportunities. And when we dostudies of whether a year of college—with no degree orcertificate to show for it—makes a difference in labormarket success, we need to make a comparative study,one that includes alternatives of the kind discussedbelow. The United States has been too much a one-option nation for getting ahead, unlike some of ourcompetitors, and one option does not fit all, particu-larly in a country with such a diverse population.
Whatever the consequences of college non-completion and insufficient options, the burden fallsunequally on racial and ethnic groups. In 1998, White25- to 29-year-olds who had a two-year or four-yearcollege degree comprised 62 percent of those who hadgone to college. For Black 25- to 29-year-olds, it wasjust 43 percent, and for Hispanics it was 47 percent(see Figure 8).
29 Clifford Adelman, Answers in the Tool Box: Academic Intensity, Attendance Patterns, and Bachelor’s Degree Attainment, U.S. Department ofEducation, June 1999.
Total
White
Hispanic
Black
25 35 45 55 65 75
58
62
47
43
Percentage
Figure 8: 1998 College Completion, 25- to 29-Year-Oldswith a Four- or Two-Year Degree as a Percentage of Thosewith Some College, by Racial/Ethnic Group
Source: Derived from Bureau of the Census Current Population Survey, unpublished data.

22
High School Graduation
There is enough of a consensus that all our youngpeople need to complete high school that not muchmore needs to be said about it. There should beconsiderable consternation that we have made noprogress in the last several decades in the percentagewho get a diploma after successfully completing fouryears of regular high school (see discussion above).The lumping of regular diplomas and GEDs togetherhas caused a misunderstanding. According to NCES,in 2000, 88.1 percent of 25- to 29-year-olds com-pleted high school.32 If we had a separate number forattainment of a regular high school diploma, however,it would likely be in the range of 70 to 75 percent,with no improvement in three decades (given theeffect of immigration, it may be somewhat higher forthose born in the United States).
There is new focus on the high schools, in terms ofimproving academic achievement. Standards, account-ability, the problem of “senioritis,” and high schoolexit exams are all getting attention. But these efforts toraise achievement and introduce more rigor will notreach the 25 to 30 percent who drop out. Those whohave no diploma have limited earning opportunities,and they may have closed off options to a collegeeducation. In addition to academic rigor, we need toexplore options that broaden the appeal to graduateand get the diploma, and we need to find options thatprove to work in terms of making graduates moreattractive to employers, as well as to colleges. A newreport on the high school senior year by the NationalCommission on the High School Senior Year offerssome sound recommendations for doing so.33
Community colleges have proven to be responsiveand flexible, both in meeting the needs of studentsand in recognizing the educational and skill needs ofemployers.30 Inadequate treatment has been given tothese colleges in the historical statistical categoriespresented in this paper. Only relatively recently havethose students been separated from the category of“one to three” years of college. There are also promis-ing efforts to link the last two years of high school andfirst two years of college programs in occupationaleducation; the effort, called “Tech-Prep,” is supportedwith grants to states from the U.S. government(although more evaluation of outcomes is needed).
Recently, ETS issued a report that chronicles animportant development, the surge in certificateprograms, typically one-year long and tied closely toindustry needs. The growth in such programs isexpanding in community colleges and other places,with much of the growth coming from programsprovided by employers.31
Expanding the avenues beyond spending sometime in traditional college includes the kind of im-provements in high school education that makegraduates more employable, such as the High SchoolsThat Work Consortium of over 35 states, created andoperated by the Southern Regional Education Board(SREB). The effort in these high schools—now over4,000 of them—is to increase academic achievementand occupational education—and interrelate the two.Youth apprenticeships also bring school and work-based learning together.
No one wants to steer high school students away fromseeking a college degree. On the other hand, no one wouldwant to hold out only the path of a traditional collegeeducation they all have to stumble down if more choicescan be created that result in success in the labor market.Of course, the quality of that education is also critical.
30 For a summary, see Richard J. Coley, The American Community College Turns 100: A Look at its Students, Programs, and Prospects, Policy Informa-tion Report, Policy Information Center, Educational Testing Service, March 2000.
31 Anthony P. Carnevale and Donna M. Desrochers, Help Wanted... Credentials Required: Community Colleges in the Knowledge Economy, EducationalTesting Service, 2001.
32 National Center for Education Statistics, The Condition of Education 2001.
33 National Commission on the High School Senior Year, Raising Our Sights: No High School Senior Left Behind, October 2001.
23
There are two more recent comprehensive assess-ments of the high school and what needs to be done:
� The American Youth Policy Forum’s report HighSchools of the Millennium: Report of the Workgroup(2001), and
� Transforming the American High School: New Direc-tions for State and Local Policy, authored by MichaelCohen and published by Jobs for the Future andThe Aspen Institute in December 2001.
A lot of the staff work has been done. Action nowcould be well informed.
One promising avenue to interest more highschool students to stay in school and more graduatesto meet employer requirements is the effort known as“School to Careers,” or “School to Work.” This wassupported by the federal School to Work Opportuni-ties Act passed by Congress in 1994, and while nowexpired, the approach has a strong presence in manystates. An important component of this approach isthe use of employer work sites for “work-based”training and education, combined with high standardsfor academic achievement.
The results of over 100 studies of this initiativehave been summarized in a recent report titled School-to-Work: Making a Difference in Education.34 Theauthors found that “there is evidence that school-to-work provides benefits for students, teachers, andparticipating employees.” The approach supportsacademic achievement, career preparation, and youthdevelopment. Teachers were found to support it andemployers were enthusiastic. With federal supportnow withdrawn, expansion rests with the states.
In this period of “standards-based educationreform,” the attention has been to the qualityof a high school education. This is understandable,given little improvement in the achievement of 12thgraders over the last 30 years and the dissatisfactionexpressed by employers about the employment readi-ness of our high school graduates who do not con-tinue on to college. Quantity, however, is also impor-tant, particularly given the subject of this section on“The Economy and Labor Market Connection.” Aprecise measure of the high school dropout rate wouldput it at between 25 to 30 percent for the last quarterof a century. If a great many high school graduates aredeficient as they enter the labor market, what aboutthe quarter of them or so who leave without complet-ing high school (particularly when those dropout ratesare higher for subgroups of the population)?
While this non-completion rate has slipped fromnational attention during the current wave of educa-tion reform, national and state dropout preventionprograms have come and gone since the 1960s (“So-cial Dynamite,” as the dropout situation was termedin the book with that title by James Conant). Butthe programs were to no avail, at least in terms ofthe nation as a whole. Getting more students tostay in school and graduate is likely intertwined withwhat students think high school completion has tooffer them and how relevant it is to their success inthe employment world. And that, in turn, is likelyintertwined with the questions about quality, aboutalternative avenues discussed above, and about persis-tence and continuity in creating—and sustaining—the kind of school and employer partnerships in theschool-to-work initiatives and in youth apprentice-ship-type arrangements.
34 Katherine Hughes, Thomas Bailey, and Melinda Mechur, School-to-Work: Making a Difference in Education, Columbia University, Institute onEducation and the Economy, 2001.
24
This report marches not toward a conclusion, but aquestion. After setting forth the facts that a quartercentury went by with no growth in a) the high schoolgraduation rate, and b) the rate at which young peopleget a four-year college degree, and c) a new era, whenfor the first time, young people are getting no moreeducation than their parents, we ask the question: Isthis set of facts alarming? Worth moderate concern?Or satisfactory?
To pose the central question, this report hasgenerally focused on the overall averages for theUnited States as a whole, as the country might belooked at in international comparisons. A lot of sub-stories are concealed in this average: men fallingbehind women in graduation rates (and women’seducation growth raising the average the last severalyears); minorities still behind the majority in educa-tion level; and Asian Americans ahead of all othergroups. These have been mentioned throughout thisreport, but the bottom line for the nation is that weare not growing educationally.
We are talking about quantity. In terms of quality,achievement test scores of 12th graders are basicallyflat over the past 30 years (dipping in the 1970s andrecovering in the 1980s). And we have no informationabout the trends over time in the quality of post-secondary education (although some efforts areunderway to finally measure it). There is attention toimproving quality in K-12 education for the lastdecade; that is what the education reform decade hasbeen about.
While not trying to tell the reader what to thinkabout the overarching question, the author doesmaintain that this break with the nation’s past experi-ence of continually raising educational attainment andopportunity is worth attention and examination. Thereport attempts to set forth facts and conditions thatcould help in thinking about the question, and ifcorrective effort seems called for, some of the consider-ations involved in untangling what is happening. Afew points made are the following:
� The level—even falling—high school graduationrate has been masked by the inclusion in the statis-tics of GED certificates (which have been growing).While the GED is a very useful program, thestatistics for it should be gathered separately.
� While high school dropout statistics fail to disclosewhat is happening, the statistics available on collegenon-completion are worse (although NCES hasa longitudinal survey that establishes the degree ofcollege completions and has the potential formeasuring the trend in completion rates).
� The bulk of statistics available regularly trackenrollment in college—and enrollment has beenrising over the last 15 years. But until the lastseveral years, completion rates have not; the non-completion rate has been rising, a fact that seemshardly to have been noticed.
� The United States has lost its preeminence in theworld in higher education completion rates, and13 countries have a lower dropout rate.
� Projections show that occupations requiring acollege degree will grow considerably over the nextdecade and faster than employment generally. Inthis period, the baby boomers will be retiring andwill have to be replaced.
� Of relevance in making judgments about theleveling off of the high school and college comple-tion rate is understanding how important educationopportunity has been in U.S. history, how we haverelied upon it, and what the accumulated researchshows are the measured benefits and effects ofa college education, both non-economic andeconomic. The report reviews the accumulatedknowledge.
SUMMARY AND CONCLUSIONS

25
Non-economic
- Improvements in cognitive development inverbal, quantitative, oral communication,analytical, and critical thinking skills.
- Aesthetic, cultural, and intellectual values.
- Social self-concept, self-esteem, personal adjust-ment, and psychological well-being.
- Use of principled reasoning in judging moralissues.
- Increased participation in civic and communityaffairs, in political affairs, and in volunteering.
Economic
- Higher earnings, relative to those with lesseducation (and over recent decades, increasedrelative earnings). But absolute earnings at theassociate and bachelor degree levels have beenrather flat the last dozen years, with someincrease the last couple of years at the bachelor’sdegree level; earnings for people with degreesbeyond the bachelor’s degree have been growing.
- Although earnings of people with some collegecredits but no degree have been falling for menand are stable for women on an absolute basis,earlier studies have found some increased earn-ings over high school graduates. More recentstudies by NCES and the National Center forResearch in Vocational Education, however,found no or little earning advantage for atten-dance without completion. More researchis needed on the returns for getting collegecredits but no degree, after taking into accountother attitudes and characteristics that make adifference to employers.
- While college graduates are more likely thanothers to enter the higher paid and higher
prestige occupations after graduation, a highpercent are found in jobs that do not require acollege degree, and this varies considerably by theoccupation graduates are employed in. Regularavailability and analysis of such surveys wouldhelp in making judgments about the whether wehave enough people getting college degrees.
- Increased education is associated with increasednational economic growth and productivity.
- Education is a means of achieving more equityin the earnings of racial and ethnic minorities.
� Resumption of growth in education completioninvolves such things as:
- Creating more alternatives in the high schoolprogram that can entice more students tocomplete high school—enlarging the pool ofstudents available to go to college. Improvinghigh school education has recently been closelyexamined by commissions, study groups, andscholars; an agenda for change is available.
- Elevating the importance of high school comple-tion rates to equal status with increasing highschool achievement standards in the educationreform movement.
- Increasing the rigor of courses in high schooland raising standards so that those who go tocollege are better prepared; the largest singlepredictor of completing college is the rigor ofthe courses taken in high school.
- Measuring and reporting college completionrates regularly for the nation and for individualinstitutions, and comparing institutions that aresimilar in the makeup of their entering studentbodies.
- Focusing on getting low income and minoritystudents through college as much as getting themin college.

26
- Exploring ways to distinguish among highereducation institutions based on their trackrecord in the persistence rates of students tograduation and providing such information toparents, students, and guidance counselors.
- Reversing downward trends in the proportionof college costs covered by federal financial aidawards and in state appropriations for highereducation as a proportion of state financialresources.
Reactions to the statistics and information pro-vided in this report, and with the way the author hasframed the questions, will differ. There will be con-sternation that graduation rates have shown littlechange over the last quarter century, and there will bepeople who do not see in this a pressing matter forconcern. (After all, the United States has emerged asthe most powerful country, with the strongesteconomy, in the world.) Stimulating such examina-tion, disagreement, and debate—and informing it—is the objective of this report.

Research andDevelopment
Policy InformationCenter
POLICYINFORMATIONREPORT
The Closing of theEducation Frontier?
88503-012430 • CL82M6 • Printed in U.S.A.I.N. 995077