
NEM STRUCTURE IN LIGHT OF TECHNOLOGY AND POLICY … · 1 NEM structure in light of technology and...
74
NEM STRUCTURE IN LIGHT OF TECHNOLOGY AND POLICY CHANGES REPORT FOR THE AUSTRALIAN ENERGY COUNCIL PREPARED BY RAJAT SOOD, FRONTIER ECONOMICS 13 DECEMBER 2018
Transcript of NEM STRUCTURE IN LIGHT OF TECHNOLOGY AND POLICY … · 1 NEM structure in light of technology and...
NEM STRUCTURE IN LIGHT OF TECHNOLOGY AND POLICY
CHANGES
REPORT FOR THE AUSTRALIAN ENERGY COUNCIL PREPARED BY RAJAT SOOD, FRONTIER ECONOMICS
13 DECEMBER 2018

1
NEM structure in light of technology and policy changes
frontier economics
Frontier Economics Pty Ltd is a member of the Frontier Economics network, and is headquartered in
Australia with a subsidiary company, Frontier Economics Pte Ltd in Singapore. Our fellow network
member, Frontier Economics Ltd, is headquartered in the United Kingdom. The companies are
independently owned, and legal commitments entered into by any one company do not impose any
obligations on other companies in the network. All views expressed in this document are the views of
Frontier Economics Pty Ltd.
Disclaimer
None of Frontier Economics Pty Ltd (including the directors and employees) make any representation
or warranty as to the accuracy or completeness of this report. Nor shall they have any liability (whether
arising from negligence or otherwise) for any representations (express or implied) or information
contained in, or for any omissions from, the report or any written or oral communications transmitted in
the course of the project.

0
NEM structure in light of technology and policy changes
frontier economics
CONTENTS
Executive Summary 2
1 Introduction 5
2 Concerns raised by policy-makers and regulators 6
2.1 Background 6
2.2 ACCC REPI 6
2.3 Commonwealth Government Consultation Paper 10
2.4 Implications for the NEO 11
3 Key features of the NEM and their implications 12
3.1 Nature of generation infrastructure 12
3.2 Energy-only market design 12
3.3 Highly inelastic demand and the need for a MPC 14
3.4 Pricing and structural implications of NEM features 15
4 Technology and policy changes 20
4.1 Changes to generation & storage infrastructure 20
4.2 Transmission expansion 27
4.3 Better access to wholesale prices via the internet, ‘smart’ software and DER optimisation 28
4.4 Three-year notice of generator closure 31
4.5 5-minute settlement 31
4.6 Demand response mechanism 31
4.7 LNG import terminals 32
5 Implications of technology and other changes 33
5.1 Expected changes in generation technology and costs 33
5.2 Expected changes in market design and structure 39
5.3 Expected changes to demand elasticity 40
5.4 Implications for the achievement of the NEO 41
A Energy-only wholesale market operation 42
Part 1 – Fixed cost recovery 42

1
NEM structure in light of technology and policy changes
frontier economics
Part 2 – Optimal plant mix 43
B Literature review 47
Part 1 – Historical trends in generation technology in the NEM 47
Part 2 – Future cost projections 56
Part 3 – ISP projections 67
2 NEM structure in light of technology and policy changes
frontier economics
EXECUTIVE SUMMARY
Policy-makers and regulators have recently raised concerns about high prices in Australia’s National
Electricity Market (NEM). This report discusses technological, policy and structural developments in the
energy sector that are underway or are likely to take place over the next decade and considers their
implications for the likely future structure, conduct and performance of the NEM. In particular, this report
considers whether changes in technology, market architecture and the supporting infrastructure could
over time address concerns that policy-makers and regulators have raised about wholesale market
bidding, contracting, vertical integration and pricing outcomes.
The NEM has traditionally exhibited a combination of characteristics that differentiate it from many other
markets in the economy. These characteristics are:
• Generating plant has tended to be large and expensive to build, which has made it hard for smaller
players to participate;
• Electricity demand is highly unresponsive to real-time prices; and
• To maintain a secure power system, electricity supply needs to equal demand at all times.
Taken together, these features imply that wholesale prices can be very volatile depending on physical
supply/demand conditions, which in turn draws greater scrutiny on the size of each player’s portfolio.
These features also mean that when new plant enter the system or retiring plant leave, average prices
can suddenly collapse or jump, respectively, reflecting the marked implications of changes in the
industry supply-demand balance. Customers have recently experienced the latter phenomenon
following the exit of the Northern and Hazelwood power stations – in both cases, wholesale prices went
from very low levels to well above the long run average in the space of weeks or months. Similar
outcomes could occur again in future if other large fossil-fuel generators were to close as renewable
plant continue to enter the NEM in response to Commonwealth and State renewable energy targets
(RETs). The price impact of large plant exits is illustrated in a stylised manner in Figure 1 below.
Given the essential nature of electricity to citizens and businesses in the modern economy, these types
of abrupt shifts naturally cause public consternation and draw the attention of policy-makers. Many of
the relatively interventionist measures proposed to date are directed at addressing what policy-makers
perceive to be competition problems that stem from the current environment.
However, recent and upcoming changes to electricity generation and storage technology, market
architecture and supporting infrastructure are likely to mitigate not only these medium-term price cycles
in the NEM, but also the scope for generators to instigate short-term price spikes – thereby overcoming
much of the impetus for the kinds of interventions that have been put forward. The types of changes
that have already been forthcoming or are likely to occur over the next few years are as follows:
• The availability of renewable plant in much smaller increments and reflecting much smaller scale
efficiencies than traditional generators, and the much shorter lead times for commissioning such
plant. These developments will make it easier for small non-vertically-integrated retailers and
business customers to sponsor the entry of new plant.
• Substantial reductions in the costs of utility-scale solar thermal plant and battery storage, in
particular.
• More transmission investment across the NEM to reduce network constraints and facilitate the
movement of power from ‘renewable energy zones’ to demand centres.

3 NEM structure in light of technology and policy changes
frontier economics
• Detailed changes to the operation of the NEM to reduce strategic bidding incentives and promote
dispatchable demand response from smaller customers.
• A new obligation on generators to notify the market of their intention to exit three years in advance
of doing so.
• Smarter metering and energy management systems combined with further increases in rooftop PV
and distributed batteries to increase the real-time ability of demand to respond to high wholesale
prices.
• The possibility of a liquefied natural gas (LNG) import terminal in the southern part of the NEM,
helping to diversify fuel supplies and increase competitive discipline on existing gas suppliers.
This combination of technological, economic and policy-driven changes is likely to have a very significant
effect on participant short- and longer-term decision-making and on medium-term price cycles.
Figure 1: Recent RET-driven price-cycle dynamics
Source: Frontier Economics
As a result of the greater scope for existing and new investors to finance and develop small additions of
generating plant, the abruptness and amplitude of medium-term price cycles is likely to diminish. These
price cycles are likely to shift over the next decade from the familiar pattern shown in Figure 1 towards
cycles that appear more like those in Figure 2 below.
In addition, short term price volatility is likely to reduce, as the wider adoption of battery storage and
greater participation of scheduled demand response increase the ability of demand response to
attenuate price spikes and other changes such as the impending move to 5-minute participant
settlement and deeper transmission interconnection impose tighter discipline on participant bidding
behaviour.

4 NEM structure in light of technology and policy changes
frontier economics
Figure 2: Future RET-driven price cycles in the NEM
Source: Frontier Economics
Overall, these developments are likely to offer three major benefits from the perspective of policy-makers
and regulators:
• The first is that they should help smooth wholesale price volatility in both the short term and in the
medium to longer term;
• The second is they should reduce the advantages of the vertically-integrated ‘gentailer’ business
model; and
• The third is that they should encourage more competitive behaviour in the NEM wholesale market
and thereby lead to more efficient and cost-reflective dispatch and pricing outcomes.
In this way, the analysis in this report is directly relevant to whether interventions of the type that have
been proposed are likely to be worthwhile.
These developments are also broadly consistent with the satisfaction of the National Electricity Objective
(NEO), although only the third is directly relevant. Reduced price volatility may or may not promote the
NEO in itself, but is expected to be a consequence of behaviours that would promote the NEO – namely,
more efficient participant decisions about energy usage and investment, and more cost-reflective
bidding. Similarly, reduced advantages for the gentailer business model may not promote the NEO
directly, but could increase competition by lowering entry barriers.

5 NEM structure in light of technology and policy changes
frontier economics
1 INTRODUCTION
This report has been prepared by Rajat Sood, consultant at Frontier Economics, for the Australian
Energy Council (AEC). This report discusses the implications of technological and policy changes in the
energy sector for the likely future structure, conduct and performance of Australia’s National Electricity
Market (NEM). The report considers whether changes in technology and energy infrastructure combined
with forthcoming modifications to the NEM design could over time organically address concerns that
policy-makers and regulators have raised about wholesale market bidding, contracting, vertical
integration and pricing outcomes both recently as well as at various times since the commencement of
the NEM. As well as helping to address policy-maker and regulator concerns, these technological and
other developments should enable to market to better meet the National Electricity Objective (NEO)1 –
which is to promote efficient investment in, and efficient operation and use of, electricity services for the
long term interests of consumers of electricity with respect to:
• price, quality, safety and reliability and security of supply of electricity
• the reliability, safety and security of the national electricity system.
This report is arranged as follows:
• Chapter 2 summarises concerns raised by the Australian Competition and Consumer Commission
(ACCC or Commission) in its Retail Electricity Price Inquiry (REPI) final report and subsequently by
the Federal Government in its recent consultation paper on electricity price monitoring and
responses.
• Chapter 3 attempts to discern the specific underlying economic features of the NEM that do not apply
to most other markets and appear to have given rise to the concerns of policy-makers and regulators.
• Chapter 4 briefly summarises our literature review on recent and expected future changes in
technology and outlines key policy and other expected changes to the operation of the wholesale
market.
• Chapter 5 explains the implications of changes in technology, market architecture and the supporting
infrastructure for the underlying drivers of policy-makers’ concerns about the NEM wholesale market
and how the changes are likely to lead to policy-makers’ concerns dissipating over time.
• Appendix A Energy-only wholesale market operation – provides a brief explanation of how energy-
only markets such as the NEM are designed to remunerate investors for their fixed and sunk costs
and provide incentives for investment in an optimal mix of plant.
• Appendix B Literature review – contains the most salient findings from our literature review of
historical and expected future technology changes and costs.
1 National Electricity Law, section 7.

6 NEM structure in light of technology and policy changes
frontier economics
2 CONCERNS RAISED BY POLICY-MAKERS AND REGULATORS
2.1 Background
Policy-makers and regulators have recently been expressing concerns about prices in the wholesale
and retail electricity markets that appear to them to be excessive. In the retail market, the primary
concern appears to be that customers who are either unable or unwilling to vigilantly monitor retailer
offers pay far higher tariffs than are available and that this ‘loyalty tax’ feeds into retailers’ profits. In the
wholesale market, the key concerns appear to revolve around the bidding and contracting behaviour of
the large incumbent generators, including the vertically-integrated ‘gentailers’. The large generators are
seen as engaging in and benefitting from the exercise of some form of market power, both by increasing
wholesale spot and contract prices as well as potentially by withholding the supply of hedge contracts
that are regarded as a necessary input to retailing.
This report focuses on the concerns raised by policy-makers and regulators about the wholesale market,
as well as how the wholesale market can influence the retail market through vertical integration. The
report seeks to identify the underlying reasons for policy-maker and regulator concerns, and the extent
to which these underlying causes are likely to be overcome or addressed by expected technological and
other structural or market design changes over the next decade. I note that similar concerns have been
expressed by policy-makers and regulators at various times since the commencement of the NEM. For
example, in 2001, in response to a number of price spikes in the wholesale market, the then National
Electricity Code Administrator made an application to the ACCC for authorisation of changes to the
National Electricity Code seeking to prohibit bids that “have the purpose, or have or are likely to have
the effect, of materially prejudicing the efficient, competitive or reliable operation of the market”.2
This chapter outlines the concerns raised by the:
• ACCC in its Retail Electricity Pricing Inquiry (REPI) final report of June 2018;3 and
• Commonwealth Government in its Electricity price monitoring and response legislative framework
Consultation paper (Consultation paper) of October 2018.4
2.2 ACCC REPI
The ACCC’s REPI raised concerns about both wholesale market concentration and vertical integration.
2 See NECA Code Change Panel, Generators’ bidding and rebidding strategies and their effect on prices, Volume 1 Report, September 2001, available at: https://www.accc.gov.au/public-registers/authorisations-and-notifications-registers/authorisations-register/nec-rebidding-code-changes.
3 ACCC, Restoring electricity affordability and Australia’s competitive advantage, Retail Electricity Pricing Inquiry – Final Report, June 2018 (ACCC REPI), available at: https://www.accc.gov.au/regulated-infrastructure/energy/electricity-supply-prices-inquiry/final-report.
4 The Australian Government the Treasury, Electricity price monitoring and response legislative framework, Consultation paper, October 2018 (Consultation paper), available at: https://treasury.gov.au/consultation/c2018-t337042/.

7 NEM structure in light of technology and policy changes
frontier economics
2.2.1 Wholesale bidding
The ACCC did not find evidence of the large generators systematically engaging in output-withholding
behaviour to ‘spike’ wholesale prices.5 However, the report included some discussion about coal-fired
generators in New South Wales and Queensland experiencing higher fuel costs in recent times and
increasing their offer prices by more than the Commission considered necessary to reflect those cost
increases.6 See Figure 3 and Figure 4, reproduced from chapter 3 of the REPI.
Figure 3: NSW black coal generator bidding
Source: ACCC REPI, p.68.
5 The ACCC said: “[T]he key cause of higher wholesale prices is less related to discrete instances of market power being used to spike the price and more driven by a subtle and sustained ‘lift’ in prices that can be attributed in part to a lack of competitive constraint.” See ACCC REPI, p.96.
6 It is not clear why the ACCC chose to focus on the differences between black coal generator offer prices and contract fuel costs rather than the Newcastle export price, which better reflect the opportunity cost of black coal and from which offer prices show much smaller divergences.

8 NEM structure in light of technology and policy changes
frontier economics
Figure 4: Queensland black coal generator bidding
Source: ACCC REPI, p.69.
The Commission concluded:7
The ACCC considers that the overall widening between NSW and Queensland black coal generators’
offer prices and their fuel costs is likely to be a product of a lack of competitive constraint and the highly
concentrated market structure in Queensland.
These concerns did not extend to the bidding behaviour of gas-fired generators:8
The ACCC also considered how gas generators’ average offer prices related to their fuel costs. Average
gas generators’ offers increased from $30–50/MWh (depending on the region) in early 2015, to around
$90/MWh in early 2018. In Victoria, NSW and South Australia, average offers were generally above fuel
costs by $10–15/MWh in the earlier periods, however fuel costs and average offers tended to increase
together and converge by late 2017.
Unlike black coal, the ACCC’s analysis indicates that gas generators’ average offers at cost-related price
bands tended to increase in line with their fuel costs, which to an extent appear linked to (gas) market
prices.
The REPI also highlighted instances of generator bidding behaviour and dispatch outcomes in different
NEM regions before and after certain market structural changes and policy interventions as a means of
demonstrating the apparent influence of these factors. For example, following the closure of the
Hazelwood power station in March 2017, the ACCC commented that both AGL and Origin Energy began
shifting significant capacity of their Bayswater and Eraring power stations, respectively, into higher price
bands from December 2016. Both participants at least partly reversed these increases from about
October 2017 onwards.9 Similar behaviour by AGL in relation to Pelican Point had followed the closure
7 ACCC REPI, p.69.
8 ACCC REPI, p.71.
9 ACCC REPI, p.77.

9 NEM structure in light of technology and policy changes
frontier economics
of the Northern power station in South Australia in May 2016. The ACCC also observed that the
Queensland Government’s direction to Stanwell in July 2017 to “place downward pressure on prices”
appeared to show a ‘stark effect’ on Stanwell’s bidding behaviour from around that date.
The ACCC concluded its findings on generator bidding behaviour as follows:10
Following the closure of Hazelwood, the behaviour of particular NSW black coal generators appears to
be a result of both increases in fuel costs (and fuel supply issues in parts of 2017) and outcomes from
an environment where generators can and appear to have acted in a relatively unconstrained manner.
This lack of competitive pressure is of concern to the ACCC, particularly given the critical need for a
sufficient level of competition in this market to drive affordable electricity prices.
The concentrated nature of the South Australian market has clearly contributed to high price outcomes
in that region, particularly when supply conditions in the region have been tight. When supply has been
improved, through the return of Pelican Point as well as the introduction of the Hornsdale Power
Reserve, there has been downward pressure on prices in the region.
In terms of the Queensland black coal generators, the ACCC considers that analysis of the available
information indicates that, in the absence of the direction by the Queensland Government to place
downward pressure on wholesale prices, there is very limited constraint on the bidding behaviour of
Queensland’s black coal generators.
In response, the ACCC made a number of recommendations in relation to the wholesale electricity
market including:
• Prohibition on any acquisition or arrangement that would raise a participant’s market share above or
beyond 20 per cent (Recommendation 1)
• General market manipulation rule – to prevent fraudulent or misleading behaviour intended to distort
or manipulate prices, mainly in the future and especially under the NEG (Recommendation 3)
• Australian Government to enter into ‘low fixed-price’ offtake contracts for the ‘later years’ of new
generation projects that meet certain criteria (Recommendation 4)
• OTC contract disclosure obligation (Recommendation 6)
• Market-making obligations on vertically-integrated firms in South Australia (Recommendation 7)
The question for policy- and rule-makers of the NEM has always been whether trying to regulate what
Justice French in 2003 called the exercise of ‘transient market power’11 is worth the cost. The key risk
of, say, capping generator bids is that if the regulator gets it wrong and sets the cap too low, generators
could choose to withhold their output altogether, potentially leading to load shedding (or blackouts). This
would then require the regulator or another party to conduct an in-depth audit to establish whether the
generator’s reason for not offering its output into the market was genuine. This would constitute a very
intrusive, laborious and error-prone process.
Ultimately, the ACCC did not recommend specific market power mitigation rules, echoing the 2013
assessment of the AEMC that such rules “would address the symptoms rather than the underlying cause
of market power.”12 The ACCC instead supported structural solutions, although it did recommend a
general prohibition on market manipulation in a similar form to the prohibition that applies to gas supply
hubs.13
10 ACCC REPI, p.87.
11 Australian Gas Light Company v ACCC (No 3) [2003] FCA 1525 (19 December 2003), at para 453. See: http://www.australiancompetitionlaw.org/cases/agl.html.
12 ACCC REPI, p.96.
13 ACCC REPI, pp.96-98.

10 NEM structure in light of technology and policy changes
frontier economics
2.2.2 Vertical integration
Chapter 5 of the REPI focused on concerns surrounding wholesale contracting trading in the NEM and
the effect of vertical integration. The ACCC highlighted concerns that:
• Vertical integration provides gentailers with cheaper access to wholesale power than smaller
retailers; and
• Vertical integration has reduced contract liquidity and lessened the ability of (standalone) participants
to effectively manage their risk.
While recognising the efficiency benefits of vertical integration and the variety of ways in which ‘liquidity’
can be defined and has changed over time, the ACCC nonetheless expressed concern about the
prospects of standalone retailers.14
The ACCC also sought and examined ‘transfer prices’ for gentailers – the prices that gentailers
effectively price wholesale energy to their own retail arms – and found that:15
The majority of vertically integrated businesses calculate a transfer price based on what they could sell
the same electricity for in contracts with third parties. In an economic sense, the retail arms of vertically
integrated businesses are paying the ‘opportunity cost’ of the business’s generation capacity. The
retailer will therefore be incurring a wholesale electricity cost comparable to a standalone retailer
contracting through the market. In these circumstances, the economic benefits of vertical integration are
largely accruing to the wholesale arm of the business.
I make three observations on this comment. First, setting transfer prices based on opportunity cost
suggests that gentailers are treating standalone retailers on an equal basis to their own retail arms and
not seeking to foreclose on rivals. Second, if one were to focus on competition as a process rather than
as a situation, one would presumably seek to encourage other participants to make efficiency-enhancing
changes (such as vertical integration) so as to promote competition between a larger number of more
efficient competitors and raise the likelihood that those efficiencies will be sustainably passed on to
consumers through lower retail prices. Third, suggesting that gentailers should pass on a greater share
of the efficiency benefits from vertical integration to their own retail customers than to standalone
retailers seems inconsistent with recommendations aimed at increasing the viability of the standalone
retailer business model.
2.3 Commonwealth Government Consultation Paper
The Commonwealth Government’s recent Consultation paper builds on the Government’s
announcement of 20 August 2018 that it would task the ACCC with, inter alia, monitoring wholesale
bidding and contract market liquidity in the NEM and provide for enforcement remedies. The list of
potential remedies included imposing wholesale contract market-making obligations beyond South
Australia and ordering asset or business divestiture.16
The Consultation paper seeks comment on how ‘prohibited conduct’ ought to be characterised in
wholesale bidding and contracting. The proposed prohibition in relation to wholesale bidding and
conduct is stated as follows:17
14 ACCC REPI, pp.111-114.
15 ACCC REPI, p.125.
16 Consultation paper, p.2.
17 Consultation paper, p.4.
11 NEM structure in light of technology and policy changes
frontier economics
An electricity generator must not, when making a bid or offer to dispatch electricity, act fraudulently,
dishonestly or in bad faith with the purpose of distorting or manipulating prices.
The Consultation paper goes on to describe the objective of the prohibition and seek feedback on two
hypothetical examples:
The objective of this limb is to prevent conduct in the wholesale spot market (in the case of the NEM) or
other form of wholesale market (outside the NEM) which is anti-competitive and can lead to an increase
in prices which flows through to end consumers. The relevant conduct could involve bidding, or could
involve non-bidding behaviour, such as a decision to supply or withhold supply.
The Government is considering how best to distinguish between behaviour which takes advantage of
periods of high prices (which, over time, should be a signal to investors) and behaviour which seeks to
manipulate or distort prices in a way not intended by the design of the relevant wholesale market.
Stakeholder feedback is sought on the hypothetical example below, including under what circumstances
of this sort of conduct should or should not be captured by a prohibition:
• Generator A schedules discretionary maintenance on a power plant to occur during a peak period in
order to increase the market price, and increase the revenue received by the other power plants owned
by Generator A.
Another hypothetical example that may represent conduct that could be prohibited is where:
• Gentailer A continually bids in significant capacity at a low price in times of relatively low demand
incurring significant losses in doing so for a sustained period of time; and
• Gentailer A’s purpose is to ensure that a Gentailer B (a rival), which cannot incur the same losses and
must bid at a price sufficient to cover its costs, is unable to be dispatched and is driven from the market.
This limb is not intended to interfere with the design and operation of the relevant wholesale market. For
example, the NEM wholesale spot market permits rebidding in good faith as it can allow market
participants to respond to changing market conditions. Similarly, transient instances of market power
can act as a market signal for more investment, stimulating competition.
2.4 Implications for the NEO
One overarching interpretation of the competition concerns expressed in the REPI and the
Government’s Consultation paper is that even though new generation entry has occurred in the past in
response to high wholesale prices, existing generators and gentailers can have and exercise excessive
market power, such that prices are higher than they would be otherwise.
To the extent these concerns are supported by recent market outcomes, they would similarly suggest
that the NEM is failing to satisfy the NEO. As noted above, the NEO refers to the promotion of efficient
investment in, and efficient operation and use of, electricity services for the long term interests of
consumers of electricity with respect to:
• price, quality, safety and reliability and security of supply of electricity
• the reliability, safety and security of the national electricity system
If participants operating in the wholesale market wield excessive market power, then it is unlikely that
investment in the NEM will be efficient, or that consumers face prices that reflect the lowest sustainable
costs of delivering reliable and secure power.
The subsequent chapters explore whether, leaving aside the merit of these concerns, technology and
other changes over the next decade are likely to address the underlying drivers of these concerns, and
in so doing, help the NEM to better satisfy the NEO.

12 NEM structure in light of technology and policy changes
frontier economics
3 KEY FEATURES OF THE NEM AND THEIR IMPLICATIONS
This chapter of the report attempts to discern the underlying economic features of the NEM that
differentiate it from textbook models of competitive markets and many real-world markets operating in
the economy. In my view, it is the outworkings of these features that have likely contributed to the policy-
maker and regulatory concerns discussed in the previous chapter. The discussion in this chapter will
provide a suitable context for analysing the implications of emerging and future changes to electricity
technology, policy and structure for the future prevalence of the issues that have raised concerns about
the market.
3.1 Nature of generation infrastructure
Electricity generating plant has traditionally exhibited a range of features that differentiate it from the
supply-side characteristics of many other markets:
• Generators tend to have relatively low operating or variable costs18 and relatively high fixed costs
that are typically largely unavoidable or ‘sunk’ once an investment has been made.
• Generation plant has traditionally exhibited strong economies of scale, in that the average total cost
of output from a given technology tends to fall (in declining order of magnitude):
o As unit capacity size increases;
o As the number of units in a power station increases; and
o As the number of power stations in a portfolio increases.
• Generation plant has traditionally exhibited discreteness or ‘lumpiness’ of investment options, in that
it has only been possible to make investments in certain minimum increments.
• The development of new generating plant has generally involved long lead times. Like other forms
of large-scale infrastructure, such as transport and mining infrastructure, it takes considerable time
for proponents to obtain planning and environmental consents, secure project financing, and
undertake site preparation, development and commissioning.
3.2 Energy-only market design
The NEM is one of the relatively few ‘energy-only’ wholesale electricity markets around the world. As
discussed in Appendix A, an energy-only market is one where investors in electricity supply assets are
remunerated solely through the supply of power to the wholesale market at prevailing spot prices and
voluntary derivative contracts settled against spot price outcomes. Unlike many markets elsewhere, the
NEM does not incorporate a separate capacity market or ‘mechanism’ that provides investors with a
18 In this report, the operating or variable cost of production of a generator is assumed to be a single number that excludes start-up costs and any dispatch inflexibilities. This is often referred to in the industry as a generator’s short-run marginal cost (SRMC) of production.

13 NEM structure in light of technology and policy changes
frontier economics
separate stream of revenue to help recover the fixed and sunk costs of their plant. There are good
reasons to expect an energy-only market to deliver more efficient outcomes than two-market designs.19
Nevertheless, the absence of a separate capacity mechanism in the NEM is a significant feature due to
the high fixed and sunk costs that generators have traditionally exhibited. In order to recover these fixed
costs in an energy-only market, the spot price must be able to at least occasionally rise above the
variable cost of the plant with the highest variable costs in the market in order to enable that plant
(traditionally, a gas peaking plant) to recover its fixed costs. When this happens, other generators with
lower variable costs (such as coal, hydro-electric and many other renewable plant) also receive a price
on their output in excess of their variable costs and a contribution towards their fixed costs. If the spot
price is higher or remains high longer than necessary to enable existing generators to recover their total
(fixed and operating) costs, this provides an incentive to investors to develop more plant. Conversely, if
the spot price is insufficient to enable existing generators to recover their fixed costs, investors receive
an incentive to not develop more plant and some existing plant may be partly or wholly shut down or
‘mothballed’ until conditions improve (see Part 1 of Appendix A).
The ability of new generation proponents to make investments on the basis of wholesale price signals
and physically connect to the grid at minimal cost is a key design feature of the NEM, and it has the
effect of placing new entrants on a similar footing to most new entrants elsewhere in the economy. That
is, new entrants face relatively low barriers to investment, facilitating a timely investment response to
prevailing and expected future periods of high prices. This ‘open access’ model of network connection
is not commonplace in electricity markets elsewhere – in part, due to the conflicts that can arise between
open access and the operation of separate capacity mechanisms (see Box 1).
19 For example, see ACCC REPI, p. 41 and Wood, T., Blowers, D., and Griffiths, K. (2017). Next Generation: the long-term future of the National Electricity Market. Grattan Institute. (Grattan Institute Next Generation report), pp. 31, 36-37. See: https://grattan.edu.au/report/next-generation-the-long-term-future-of-the-national-electricity-market/.

14 NEM structure in light of technology and policy changes
frontier economics
Open access
Unlike many electricity markets elsewhere, the NEM embodies an ‘open access’ philosophy to
generation investment, connection and dispatch. New generators are permitted to seek
connection to the transmission (or distribution) system and pay only the direct or ‘shallow’ costs
of connection. Generators are not required to contribute to the cost of the existing grid or to any
network expansions or extensions that they themselves do not request. The quid pro quo for open
access is twofold. First, generators have no right to be dispatched in accordance with their
position in the dispatch merit-order (which arranges participant bids and offers from lowest to
highest and selects the cheapest first) and will typically have their output limited if and when
applicable network constraints bind. Second, transmission network augmentation is determined
in a centralised manner on the basis of an overall system cost minimisation criterion that place
no value on the dispatch of individual generators per se.
By contrast, the Western Australian wholesale electricity market and most markets in the United
States do not allow generators to connect without meeting various technical requirements and
paying ‘deep’ augmentation costs. In these markets, generators seeking connection need to wait
for the system operator to perform power flow analysis to ascertain the effect of the new generator
on transmission constraints. This leads to a connection ‘queue’ being formed, which – combined
with higher connection charges – imposes considerable delays and costs on new entry.
Part of the reason for the connection and queuing policies adopted in such markets is the role of
separate capacity mechanisms. If the system operator is relying on a specific generator to be
dispatched at peak times to meet demand, the system operator needs to be confident that the
network will not constrain the output of that generator under peak loading conditions. This
particular issue does not arise in the NEM because generators are not paid for their output unless
and until they are dispatched, and transmission planning is undertaken on the basis of ensuring
that sufficient energy will be available – from any generator anywhere across the NEM – to meet
demand across the system to the extent necessary to satisfy the NEM reliability standard (see
below).
3.3 Highly inelastic demand and the need for a MPC
Another key feature of the NEM and most other electricity markets to date has been the highly
unresponsive or ‘inelastic’ nature of real-time electricity demand. Very few electricity customers
participate directly in the wholesale market, although some have arrangements with retailers to curtail
demand at times of high spot prices.20 Most customers face retail prices that tend to involve flat usage-
based charges. Even when customers face time- or demand-based tariffs, the applicable rates typically
do not change in line with prevailing spot market outcomes. Yet the secure operation of a power system
requires, inter alia, the maintenance of a stable system frequency, which in turn requires electricity
supply to precisely equal demand at all times. Indeed, if there is insufficient supply to meet demand for
even a few moments, there may be no price at which the market will clear. In these circumstances of
‘market failure’, the market and system operator will be required to shed load involuntarily and set a
20 For example, AGL has a commercial agreement in place with the Tomago smelter that gives AGL flexibility to manage its customer load during plant outages in exchange for Tomago receiving commercial benefits. See: https://www.agl.com.au/about-agl/media-centre/asx-and-media-releases/2017/february/agl-and-tomago-agreement-in-place-to-curtail-electricity.

15 NEM structure in light of technology and policy changes
frontier economics
price for the remaining transactions that are able to take place. For these reasons, the NEM incorporates
a market price cap (the ‘MPC’, formerly the ‘Value of Lost Load’ or ‘VoLL’), at which the spot price is set
if supply cannot meet demand. The MPC is presently $14,500/MWh, which is well above the operating
costs of any plant in the NEM.
The MPC is set at a level designed to ensure that generators – particularly peaking generators – are
able to recover both their variable and fixed costs over those short periods when supply is insufficient
or barely sufficient to meet demand. This is designed to encourage enough generation investment to
ensure that periods of involuntary load shedding are relatively rare. Specifically, the NEM reliability
standard is a maximum level of unserved energy (USE) in a region of 0.002 per cent of the total electricity
demanded in that region for a given financial year.21 The higher the MPC is set, the more generation
and demand response is likely to be viable and hence the less involuntary unserved energy could be
expected to result. In order to achieve this objective, the MPC is reviewed by the AEMC Reliability Panel
every four years.
In equilibrium, an energy-only market in which participants behave in a price-taking (highly competitive)
manner should not only yield levels of unserved energy and installed generation capacity consistent
with meeting the NEM reliability standard at least cost, it should also produce an efficient technology
mix of plant (see Part 2 of Appendix A).
3.4 Pricing and structural implications of NEM features
The unique features of the NEM as an energy-only electricity market have hitherto differentiated it from
most other markets in the economy in relation to its implications for both pricing outcomes (in the short
and longer terms)22 and structural (contracting and integration) outcomes.
3.4.1 Short term pricing implications
In the very short term, even small deviations from pure price-taking conditions can result in large
(transient) price spikes. Under pure price-taking, the wholesale spot price should remain relatively low
(at or below the variable costs of peaking plant) unless load shedding is occurring. However, at times of
very high market demand, if even one or a small number of generators refrain from offering all of their
available output or raise their offer prices towards the MPC, the spot price may spike several orders of
magnitude above pure price-taking levels. This is a point frequently made by the Australian Energy
Regulator (AER) in its reports of conditions when NEM spot prices exceed $5,000/MWh.23
This extreme sensitivity of wholesale prices to supply and demand is a phenomenon that is not widely
observed in any other substantial market in the economy. In general, the ability and incentive for a
21 See: https://www.aemc.gov.au/energy-system/electricity/electricity-system/reliability.
22 ‘Longer term’ here refers to a period of months or years, which may not be sufficient for traditional forms of supply-side capacity to be augmented or commissioned. This differs from the economic concept of the ‘long run’, in which all inputs are flexible.
23 For example, in relation to high prices in Victoria and South Australia on 19 January 2018, the AER said: “On 19 January maximum temperatures in Melbourne and Adelaide exceeded 40°C, leading to high demand for electricity and forecast high prices. While demand for electricity was high in both the South Australian and Victorian regions, it was not near record levels. In South Australia the spot price reached $11 864/MWh at 2.30 pm, $13 408/MWh at 3 pm, $5413/MWh at 5 pm and $5332/MWh at 6 pm. The spot price exceeded $5000/MWh only once in Victoria, reaching $10 152/MWh at 2.30 pm. The vast majority of capacity in both regions was priced in very low price bands, a small amount in very high price bands and almost no mid-priced capacity. As a result, small increases in demand at the top end of low priced capacity had the potential to lead to high prices. This was essentially the major contributing factor behind the high price outcomes.” See AER, Electricity spot prices above $5000/MWh, Victoria and South Australia, 19 January 2018, 20 March 2018, available at: https://www.aer.gov.au/wholesale-markets/market-performance/prices-above-5000-mwh-19-january-2018-vic-and-sa.

16 NEM structure in light of technology and policy changes
frontier economics
generator to strategically withhold potential output increases with the size of the participant’s portfolio,
as the size of the revenue ‘payoff’ from higher prices increases.
Other electricity market designers have responded to the risk of this type of behaviour by imposing
bidding rules or caps of one form or another. However, Australian designers have long resisted these
types of measures for several reasons:24
• Bid-capping rules are intrusive and complicated to design and apply, and raise the risk that they
could deter investment if set too low.
• Many of the markets in which these rules are imposed have two-market designs, such that the risk
of deterring investment is mitigated through the returns available from a separate capacity market.
• If barriers to new generation entry are relatively low, then new entrants will respond to higher prices
by investing sooner and driving prices down.
• Structural solutions – namely, horizontal disaggregation – are preferable to behavioural conditions.
This view was restated by the ACCC in the REPI (see section 2.2.1 above).
• Since NEM start, market designers have been hopeful that increased demand-side response could
mitigate generators incentives to engage in non-price-taking behaviour in the energy-only NEM.
Regarding the last of these points, the ACCC made the following comments in its 1997 National
Electricity Code Authorisation determination:25
The other aspect that must be developed in conjunction with action on structure is the need to
develop demand side flexibility. The larger the demand uncertainty faced by generators relative
to capacity, the more likely it is that all generators will have an incentive to bid aggressively
because they face the prospect of being left out of the market during that trading period. However,
the responsiveness of the demand side is likely to increase in the longer term.
3.4.2 Longer term pricing implications
The second way in which the features of the NEM have traditionally differentiated its pricing outcomes
from other markets is that even under conditions of highly competitive bidding, periods of relatively
elevated and depressed average wholesale prices can persist for extended periods – often, several
years. This is due to the characteristics of electricity supply infrastructure and electricity demand
discussed above:
• Low operating and high fixed and sunk costs – which contribute to barriers to entry and exit.
• Strong economies of scale – imply that in an environment in which demand is rising only gradually,
it will often be efficient to wait longer to invest than in the absence of these economies.
• ‘Lumpiness’ – means that the market may experience alternating periods of insufficient and excess
supply, with the short run operating profits of plant oscillating from much higher-than-necessary to
recover fixed costs to zero.26
24 For example, see AEMC, Final Rule Determination, Potential Generator Market Power in the NEM, 26 April 2013, available at: https://www.aemc.gov.au/rule-changes/potential-generator-market-power-in-the-nem.
25 ACCC, Applications for Authorisation, National Electricity Code, 10 December 1997 (ACCC Code Authorisation), p.103, available at: https://www.accc.gov.au/public-registers/authorisations-and-notifications-registers/authorisations-register/national-electricity-code-mark-i.
26 Electricity economist, Steve Stoft provides the following example: if baseload plant can only be built with a capacity of 1000 MW and peakers can only be built with a capacity of 100 MW, then if peak demand in the market is 7,750 MW, for an assumed set of costs and load profile, the optimal plant mix is six baseload plant and 19.75 peakers. In this context, he says, “Building 19 peakers would result in supply being short of demand for a duration 4 times greater than is optimal (2.5% instead of 0.62%), and this would cause peakers to over-recover fixed costs by a factor of four. These high profits would entice the entry of another peaker which would drop short-run profits to zero. This would stop entry as demand grew. With free entry and the uncertainties of a real market, short-run profits would average out to the level of fixed costs. But lumpiness would prevent the right

17 NEM structure in light of technology and policy changes
frontier economics
• Long lead times – the longer it takes to commission new plant, the longer that periods of insufficient
supply may persist. Conversely, plant can be mothballed or retired relatively quickly, which can limit
the duration of periods in which excess supply persists.
• Inelastic demand – while not almost completely inelastic as in the short run, electricity demand is
still relatively inelastic in the longer term, contributing to sustained periods of high or low prices.
Taken together, these factors mean that prior to a generation investment being made (or after a major
plant has been retired), average spot prices will tend to be higher than the long run equilibrium average
price; and prices will be lower than the long run equilibrium in the period following an investment.
Figure 5 below shows how an energy-only market such as the NEM can exhibit a multi-year ‘cycling’ of
average spot and contract prices under historically conventional conditions of rising demand and no
major plant exits:
• In the period (which may be several months or years) prior to a new generation investment, average
prices will be above the long run marginal cost (LRMC) of supplying market demand;
• Immediately after a large lumpy investment, average prices will be below LRMC; and
• If demand is rising over time, prices should gradually rise back towards and beyond LRMC.
Figure 5: Conventional price cycles in an energy-only market
Source: Frontier Economics
In the more recent scenario we have been observing in the NEM of RET-driven investment helping to
trigger sporadic major plant exits, the dynamics of price-cycles are almost reversed, appearing more as
they do in Figure 6.
(fractional) number for peakers from being built, and this would cause some inefficiency.” See Stoft, S., Power System Economics, Designing Markets for Electricity, IEEE Press 2002, p.131.

18 NEM structure in light of technology and policy changes
frontier economics
Figure 6: Recent RET-driven price-cycle dynamics
Source: Frontier Economics
It is important to note that given traditionally characteristic strong economies of scale, lumpiness and
long lead times for generation development, such cycling of average prices is perfectly consistent with
competitive and efficient participant behaviour and market outcomes.27 However, the amplitude of such
cycles can be exacerbated where existing participants are not pure price-takers and where barriers to
entry to new generation investment are high, such as under the following circumstances:
• If incumbent generators have a high market share (as a result of benefitting from economies of scale),
they may have a reduced incentive to invest because the subsequent ‘collapse’ in wholesale prices
can substantially curtail their expected returns (although, in reality, incumbents in the NEM have
invested with reasonable alacrity in the past and continue to do so).28
• Even new entrants might not find it worthwhile to invest given that entry requires high sunk costs to
be incurred and can cause post-entry prices to fall significantly.
• The post-entry fall in prices also means that customers have a reduced incentive to invest in
generation or demand-side response (DSR) themselves, because other customers who do not
contribute to the new investment also benefit from lower prices (free-rider effects).
The recommendations in the ACCC’s REPI and proposals in the Government’s Consultation paper –
and more generally, the sense that ordinary competition law is believed to be unsuitable and sector-
specific rules for the NEM are necessary – seem to reflect a degree of frustration with the performance
of the energy-only market, particularly over these longer time periods.
27 For example, agricultural markets – in which producers (farmers) typically behave in a pure price-taking manner – can exhibit volatile ‘cobweb’ patterns of prices and volumes due to lags in the adjustment of supply (crops) to demand. See: https://en.wikipedia.org/wiki/Cobweb_model.
28 See Part 2 of Appendix A on the drivers for the Somerton and Hallet OCGT plant.

19 NEM structure in light of technology and policy changes
frontier economics
3.4.3 Structural implications
The in-built short- and longer-term volatility of wholesale prices in an energy-only market such as the
NEM has its own implications for the way market participants choose to structure their businesses.
Generators and retailers operating in the NEM are typically exposed to complementary risks:
• Generators are exposed to the risk that the (volatile) wholesale prices they are paid for their output
may not be sufficient to finance their fixed and sunk costs and earn a reasonable profit; while
• Retailers and large customers are exposed to the risk that the price they pay for wholesale power
will exceed the typically fixed29 price they receive, respectively, from their customers or for their
output.
The complementary nature of these risks mean that generators and retailers engage in either or both
the following risk allocation activities:
• Purchase or sale of financial derivative contracts – that are settled against regional spot prices.
NEM participants usually enter derivative contracts to hedge (rather than extend or speculate on)
their natural spot price exposures. Accordingly:
o Since generators have a natural long30 exposure to the spot price, generators generally sell
derivative contracts to hedge or offset their natural exposure.
o Likewise, since retailers and large industrial customers have a natural short exposure to the spot
price, these parties typically purchase derivative contracts to offset their natural exposure.
• Vertical integration – to provide an internal or ‘physical’ hedge against spot price risk. Vertical
integration can consist of any of the following:
o Acquisition of existing generation or retail assets
o Establishment or development of new generation or retail assets or activities
o Acquisition of rights to the outputs or cash flows of generation or retail activities, such as through
Power Purchase Agreements (PPAs).
A key advantage of vertical integration over contracting is that vertical integration avoids or reduces the
transaction costs associated with a generator or retailer/large customer needing to negotiate or trade
derivative contracts on a regular basis to hedge its spot price exposures. Such costs can include:
• Operating and maintaining (as large) a trading team
• Meeting additional prudential requirements or providing additional credit support to counterparties
• Potentially paying higher prices for hedging due to significant counterparties or potential
counterparties ‘holding-up’ contract (re)negotiations.
As noted in section 2.2.2 above, the ACCC in its REPI report acknowledged that vertical integration
could offer efficiency benefits.
The remainder of this report considers the extent to which recent and forthcoming changes to
technology, market architecture and the supporting infrastructure are likely, over time, to minimise the
differences between the NEM and other more ‘normal’ markets that have given rise to the concerns
recently expressed.
29 ‘Fixed’ in this context refers to fixed with respect to the wholesale electricity price.
30 ‘Long’ in this context refers to financially benefitting from a rise in the price of the underlying commodity (here, wholesale electricity). ‘Short’ has the opposite meaning.
20 NEM structure in light of technology and policy changes
frontier economics
4 TECHNOLOGY AND POLICY CHANGES
This chapter outlines the nature of changes to technology, market architecture and structural features
of the NEM that are occurring or can be reasonably anticipated over the next decade.
4.1 Changes to generation & storage infrastructure
The previous chapter discussed the technical and economic characteristics of traditional electricity
generation infrastructure that have contributed to short- and longer-term price volatility in the NEM. This
section discusses how many of these characteristics have changed and are likely to continue changing
and the likely implications for the future plant mix of the NEM.
More detail on existing generating plant types and sizes, likely future trends in plant technology and cost
characteristics, and the potential future NEM plant mix is provided in Appendix B.
4.1.1 Historical trends in plant technologies, unit and station sizes
The S&P World Electric Power Plants Database (WEPP) database31 is a worldwide inventory of
generator technology investment decisions from 1960 to the present day. The WEPP provides
interesting insights into historical trends in centralised generation investment around the world.
Focussing on 5 key countries (Australia, Canada, the United States, Germany and China), some of the
most salient features are:
• Coal-fired and gas steam turbines, and to a lesser extent, hydro power stations are the largest
generators built in each of countries examined, with unit sizes in Australia in the 250-750 MW range
and station sizes of at least 500 MW.
• The number of coal-fired power stations built in developed countries has decreased in recent years.
• In Australia and the USA, coal-fired generator sizes have been falling, with the trend flat or mixed
elsewhere.
• The trend in coal plant unit sizes appear to be falling in Australia and Canada, while rising in China
and mixed elsewhere.
Appendix B provides more details.
4.1.2 Current large-scale generation mix in the NEM
In spite of several recent coal-fired generator retirements, large coal-fired power stations in New South
Wales, Queensland and (to a lesser extent, after the closure of Hazelwood) Victoria dominate the NEM
energy mix, with the remaining generation stock consisting of smaller stations fuelled by gas, wind, solar
and liquid fuels (Figure 7). The current dominance of coal plant is even more pronounced when
considering relative output shares of different plant (Figure 8).32
31 S&P Global Market Intelligence World Electric Power Plants Database – see: https://www.platts.com.es/products/world-electric-power-plants-database.
32 Both Figures have been reproduced from Appendix B.

21 NEM structure in light of technology and policy changes
frontier economics
Figure 7: NEM station capacity by region and fuel type
Source: Frontier Economics analysis of AEMO data (generation information 2 November 2018)
Figure 8: NEM station output by region and fuel type
Source: Frontier Economics analysis of AEMO data (MMSDM)
Projected coal-fired plant retirements
Despite its present dominance of the NEM plant capacity and output mix, the overall level of coal-fired
generation capacity has peaked and is likely to diminish in future decades due to ongoing plant
retirements. Figure 9 below shows the current stock of NEM coal-fired power stations and when they
22 NEM structure in light of technology and policy changes
frontier economics
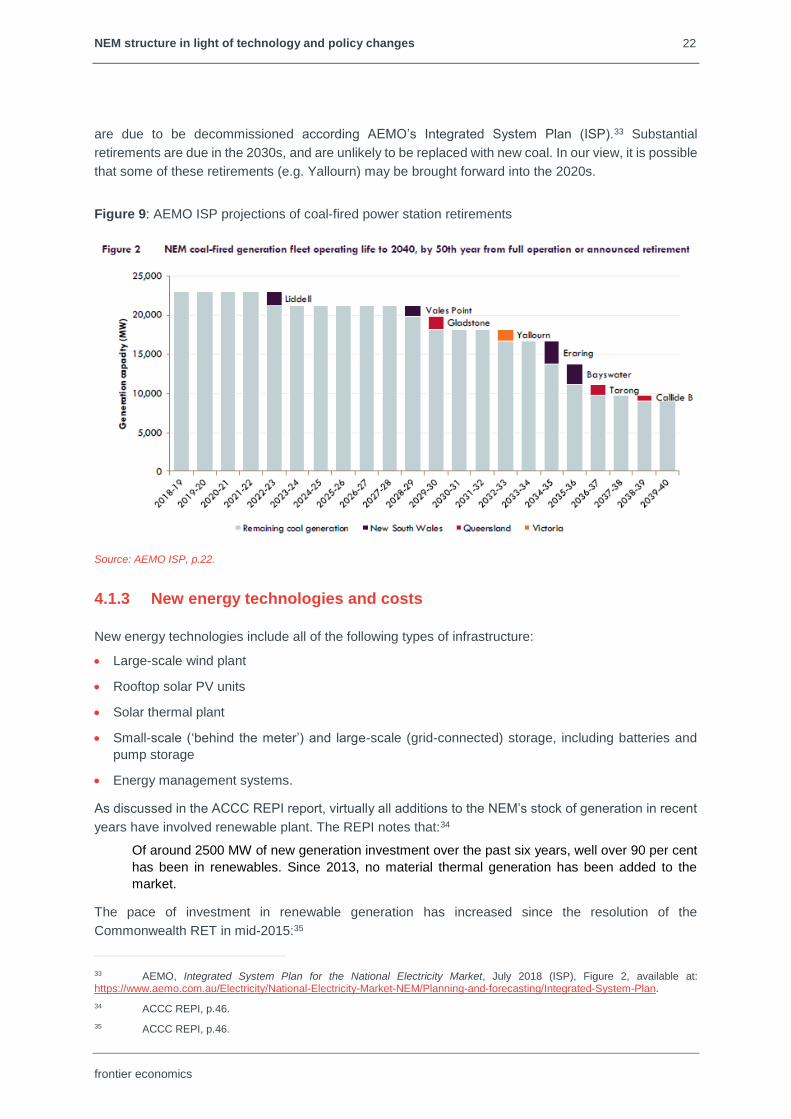
are due to be decommissioned according AEMO’s Integrated System Plan (ISP).33 Substantial
retirements are due in the 2030s, and are unlikely to be replaced with new coal. In our view, it is possible
that some of these retirements (e.g. Yallourn) may be brought forward into the 2020s.
Figure 9: AEMO ISP projections of coal-fired power station retirements
Source: AEMO ISP, p.22.
4.1.3 New energy technologies and costs
New energy technologies include all of the following types of infrastructure:
• Large-scale wind plant
• Rooftop solar PV units
• Solar thermal plant
• Small-scale (‘behind the meter’) and large-scale (grid-connected) storage, including batteries and
pump storage
• Energy management systems.
As discussed in the ACCC REPI report, virtually all additions to the NEM’s stock of generation in recent
years have involved renewable plant. The REPI notes that:34
Of around 2500 MW of new generation investment over the past six years, well over 90 per cent
has been in renewables. Since 2013, no material thermal generation has been added to the
market.
The pace of investment in renewable generation has increased since the resolution of the
Commonwealth RET in mid-2015:35
33 AEMO, Integrated System Plan for the National Electricity Market, July 2018 (ISP), Figure 2, available at: https://www.aemo.com.au/Electricity/National-Electricity-Market-NEM/Planning-and-forecasting/Integrated-System-Plan.
34 ACCC REPI, p.46.
35 ACCC REPI, p.46.

23 NEM structure in light of technology and policy changes
frontier economics
As at March 2018, nearly 90 per cent of the 4400 MW of committed generation investment coming
into the NEM is either wind (2032 MW) or solar PV (1877 MW).30 A similar percentage of the
45000 MW of proposed projects in the NEM are also renewables (39 per cent wind, 38 per cent
solar and 11 per cent hydro), with the remainder mostly gas plant.
See also Figure 10 below.
Figure 10: Recent trend in renewable energy project developments
Source: ACCC REPI, p.46.
Evidence on lumpiness and scale economies for new technologies
A 2015 study by CO2CRC36 found that lumpiness and economies of scale for renewable technologies
are far less significant than for large fossil-fuelled power stations. This lack of both features applies at
both the unit level and the overall plant or station level.
For example, wind turbines investigated in the study consist of 3 MW turbines, with farm sizes of 50 MW
and 200 MW, reflecting the availability of much smaller capacity increments than traditional technology
types. Further, wind exhibited fairly modest economies of scale by the standards of traditional fossil-
fuelled plant, as demonstrated by the following plant costs:
• Capital cost (sent-out):
o 50 MW: $2,550 / kW
o 200 MW: $2,450 / kW
• Operating and maintenance (O&M) cost (per annum):
o 50 MW: $60 / kW
o 200 MW: $55 / kW
36 Wiley, D., Neal, P., Ho, M. 2015, Fimbres Weihs, G., Australian Power Generation Technology Report, CO2CRC, CSIRO, ARENA, Office of the Chief Economist (Federal Department of Industry and Science) and anlecr&d (CO2CRC et al (2015)). See Appendix B.

24 NEM structure in light of technology and policy changes
frontier economics
These figures indicate that potential investors in wind generation face relatively weak incentives to invest
in large and expensive projects, and hence are likely to face fewer financing and other barriers to
investing.
CO2CRC also evaluated solar PV at residential (5 kW), commercial (100 kW) and utility-scale (10 MW
and 50 MW) sizes, with utility-scale plant assessed with fixed, single-axis and dual-axis mounts. In all
cases, economies of scale were again fairly limited:
For fixed module mounting:
• Capital cost (sent-out):
o 5 kW: $2,100 / kW
o 100 kW: $1,950/ kW
o 10 MW: $2,400 / kW
o 50 MW: $2,300 / kW
• O&M cost (per annum):
o 5 kW: $30 / kW
o 100 kW: $30 / kW
o 10 MW: $30 / kW
o 50 MW: $25 / kW
For utility-scale dual-axis module mounting (which offers the highest capacity factors):
• Capital cost (sent-out):
o 10 MW: $3,600 / kW
o 50 MW: $3,400 / kW
• O&M cost (per annum):
o 10 MW: $45 / kW
o 50 MW: $40 / kW
This relatively wide spread of available capacity increments combined with gently-declining slopes of
renewable energy average cost curves is likely to promote the recent trend of smaller, geographically
diverse and independently-owned renewable power stations (see below). This, in turn, will help reduce
the importance of existing retail market positions in helping to support or underwrite new capacity
additions, thus lowering barriers to entry and expansion.
Projected changes in new technology costs
Generation
Recent research produced by the CSIRO highlights the falling costs of new generation technologies.37
Hayward & Graham (2017) developed cost projections for a range of both conventional and new
technologies out to 2050 taking into account ‘learning effects’ – which reduce deployment costs – and
modelled costs under two scenarios: 2 degrees (formerly 450 ppm) and 4 degrees (550 ppm) warming.
Selected projections for the latter scenario are provided below (see also Appendix B). As the figures
show, less developed renewable technologies (solar PV and solar thermal) are still expected to benefit
37 Hayward, J.A. and Graham, P.W. 2017, Electricity generation technology cost projections: 2017-2050, CSIRO, Australia (Hayward & Graham (2017)), available at: https://publications.csiro.au/rpr/download?pid=csiro:EP178771&dsid=DS2.

25 NEM structure in light of technology and policy changes
frontier economics
from substantial learning effects and cost reductions over time. However, given the relative maturity of
wind technology, the unit costs of wind are not expected to fall significantly.
Figure 11: Solar thermal, wind and solar PV cost projections
Source: Hayward & Graham (2017), p.9.
The cost projections for rooftop solar PV and batteries (see below) were updated in 2018 in Graham et
al (2018).38 See also Appendix B.
Traditional generation technologies were not expected to not exhibit anything like the same cost
reductions.
38 Graham P.W., Wang D., Braslavsky, J., and Reedman L.J. 2018. Projections for small-scale embedded technologies, Report for AEMO, CSIRO, Australia (Graham et al (2018)), available at: https://www.aemo.com.au/-/media/Files/Electricity/NEM/Planning_and_Forecasting/NEM_ESOO/2018/Projections-for-Small-Scale-Embedded-Technologies-Report-by-CSIRO.pdf.

26 NEM structure in light of technology and policy changes
frontier economics
Batteries
Battery storage is projected to benefit from continued learning-based cost reductions in the near term.
Of all the technologies discussed, storage is the most modular, has very short lead times and economic
lifespan, which reduces long term investment risk and lowers barriers to investment.
Hayward & Graham (2017) also projected future costs of batteries, finding even more rapid reductions
were likely than previous bullish forecasts (see Figure 12). While battery costs are projected to fall
rapidly and substantially, balance of plant costs (referring to the required parts of the station excluding
the battery itself) are significant and benefit less from learning. This will slow overall cost reductions of
the technology.
Figure 12: Battery-only cost projections: 2017 update and previous projections, 2017 $A
Source: Hayward & Graham (2017), p.14.
CSIRO published updated cost projections for batteries – including balance of plant costs – in 2018.39
See also Appendix B.
4.1.4 Projected changes in generation plant mix
The trends discussed above suggest that reductions in costs, economies of scale and lumpiness of
generating plant will continue to occur over the next decade. However, these reductions will largely be
driven by an ongoing shift in the types of technology investors favour, rather than taking place within
39 Graham et al (2018).
27 NEM structure in light of technology and policy changes
frontier economics
traditional types of generation. In short, new plant investment is likely to exhibit the following changes in
characteristics relative to historical patterns of plant development – new plant will tend to reflect:
• Renewable and storage technologies rather than fossil-fuelled technologies; and
• Smaller economies of scale and smaller capacity increments, which combined with shorter
development lead-times should result in more ‘right-sized’ and timely additions to the stock of plant
than previously.
Having regard to changing generation cost structures and trajectories of demand growth, federal and
state environmental policies and their financing implications, and planned transmission expansions (see
below), generation investment in the NEM and the overall NEM plant mix is likely to be substantially
different in a decade’s time than it is now. Investment in new coal-fired power stations and more
generally steam turbines is unlikely to be substantial. As in recent years, generation investment is likely
to be dominated by many relatively small utility-scale wind and solar projects, with a continuing steady
uptake of residential solar PV. In addition, it is likely that a substantial quantity of battery storage will be
required, even if Snowy 2.0 proceeds.
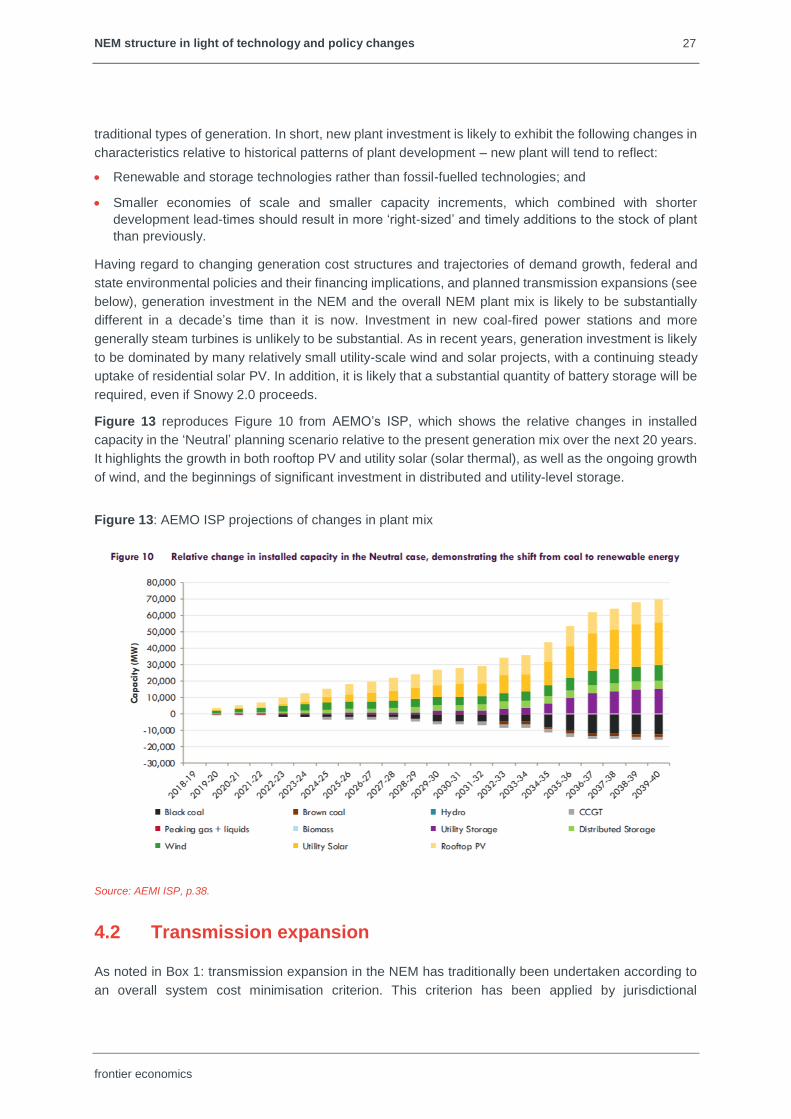
Figure 13 reproduces Figure 10 from AEMO’s ISP, which shows the relative changes in installed
capacity in the ‘Neutral’ planning scenario relative to the present generation mix over the next 20 years.
It highlights the growth in both rooftop PV and utility solar (solar thermal), as well as the ongoing growth
of wind, and the beginnings of significant investment in distributed and utility-level storage.
Figure 13: AEMO ISP projections of changes in plant mix
Source: AEMI ISP, p.38.
4.2 Transmission expansion
As noted in Box 1: transmission expansion in the NEM has traditionally been undertaken according to
an overall system cost minimisation criterion. This criterion has been applied by jurisdictional

28 NEM structure in light of technology and policy changes
frontier economics
transmission businesses on a project-by-project basis. However, following from the recommendations
of the 2017 Finkel Review,40 AEMO published its initial ISP in July 2018.
The ISP recommends a large number of transmission investments in three tranches, depending on how
urgent AEMO considers them to be. The first tranche (Group 1) comes at a cost of $450-650 million and
includes:
• Increase transfer capacity between New South Wales, Queensland, and Victoria by 170-460 MW.
• Reduce congestion for existing and committed renewable energy developments in western and
north-western Victoria.
• Remedy system strength in South Australia.
The second tranche (Group 2) is designed to be completed by the mid-2020s to support new ‘renewable
energy zones’ or ‘REZs’ and consists of:
• New transfer capacity between New South Wales and South Australia of 750 MW (RiverLink).
• Increased transfer capacity between Victoria and South Australia by 100 MW.
• Increased transfer capacity between Queensland and New South Wales by a further 378 MW (QNI).
• Connecting renewable energy through the above developments.
• Coordinating distributed energy resources (DER, primarily solar PV and batteries) in South Australia.
The third tranche (Group 3) is designed to support REZs and system reliability and security and is to be
undertaken by the mid-2030s and beyond.
4.3 Better access to wholesale prices via the internet, ‘smart’
software and DER optimisation
Developments in communications technology have enabled tariffs and services previously restricted to
large energy consumers to be offered to the mass market. Type 4 (‘smart’) meters measure electricity
consumption at periodic intervals (typically 30 minutes) and remotely report readings, removing the need
for manual meter reads. Smart meters were rolled out in Victoria between 2009 and 2015 under state
regulations41 and are gradually being installed in other NEM regions principally via opt-in and new-and-
replacement meter policies. Smart meters enable network businesses and retailers to set tariffs with
more sophisticated and cost-reflective charging bases than anytime consumption.
The AEMC made a rule change in late 2014 that imposed more prescriptive obligations on distribution
networks to set cost-reflective network tariffs.42 As a result, most distribution networks now offer optional
time-of-use and maximum demand tariffs to residential and small business customers, and many
businesses are moving to mandatory or opt-out assignment of cost-reflective tariffs to new customers,
as well as existing customers installing or changing solar PV or battery units.43
40 Independent Review into the Future Security of the National Electricity Market: Blueprint for the Future, Commonwealth of Australia 2017 (Finkel Review), Recommendation 5.1, p.124.
41 See: http://www.smartmeters.vic.gov.au/about-smart-meters/reports-and-consultations/advanced-metering-infrastructure-cost-benefit-analysis/2.-background#.
42 AEMC, Rule Determination, National Electricity Amendment (Distribution Network Pricing Arrangements) Rule 2014, 27 November 2014, available at: https://www.aemc.gov.au/rule-changes/distribution-network-pricing-arrangements.
43 AEMC, Economic Regulatory Framework Review, Promoting Efficient Investment in the Grid of the Future, 26 July 2018, section 7.3.2 and Table 7.2, pp.110-112, available at: https://www.aemc.gov.au/markets-reviews-advice/electricity-network-economic-regulatory-framew-1.

29 NEM structure in light of technology and policy changes
frontier economics
Importantly, for the purposes of this report, traditional time-of-use (ToU) and demand (and even critical
peak pricing or CPP) tariffs do not necessarily imply a greater elasticity of real-time wholesale electricity
demand. Rather, tariffs aimed at signalling times of peak demand in advance will tend to reduce actual
electricity demand at the relevant times, rather than increase the sensitivity of demand to real-time
wholesale prices.
That said, communications technology has increased economic opportunities for customers to provide
real-time demand-side responses via alerts or autonomous controls or systems. On a residential level,
several networks are offering incentives to install devices that enable them to control customer air-
conditioner thermostats remotely44 during peak events. To date, the emphasis on residential product
offerings has focussed on times of network peak events rather than wholesale market peak events, but
this has started changing following recent rule changes to promote competition in metering45 and the
contestability of distributed energy services.46 On a commercial level, offerings of demand-side
management hardware and software services attempt to minimise businesses’ costs by optimising the
timing of flexible loads, predicting wholesale price spikes, and initiating demand-side responses during
peak periods. An example of these offerings is GreenSync’s PeakResponse product.47 In addition:
• ERM offers a pool price pass-through contract for consumers with an electricity bill spend of over
$30,000 per annum;48 and
• Amber offers a pool price pass-through contract for residential consumers, presently only in New
South Wales.49
Falls in the price and increases in the energy density of chemical battery storage have made electricity
storage products financially and/or practically feasible for some customers to install in their homes or
businesses. Industry reports suggest that residential battery storage install rates almost quadrupled from
about 6,000 systems in 2016 to around 23,000 systems in 2017.50 Further, all the mainland NEM states
have now announced battery subsidy schemes offering several thousand dollars of benefit per unit and
with an overall target of nearly 100,000 installations. On the other hand, AEMO has recently revised
down its battery forecasts in its 2018 Electricity Statement of Opportunities (2018 ESOO)51 in light of
recent reductions in wholesale electricity prices – see Figure 14.
44 See: https://www.geelongadvertiser.com.au/news/geelong/powercor-energy-partner-program-offers-financial-incentive-for-airconditioning-control/news-story/2aaf7d403b9d4779de3ad7bd01912191 and https://www.ergon.com.au/network/manage-your-energy/incentives/peaksmart-air-conditioning.
45 See: https://www.aemc.gov.au/rule-changes/expanding-competition-in-metering-and-related-serv.
46 See: https://www.aemc.gov.au/rule-changes/contestability-of-energy-services.
47 See: https://greensync.com/solutions/greensync-pr/.
48 See: https://ermpower.com.au/business-energy/energy-products/.
49 See: https://www.amberelectric.com.au/.
50 See: http://www.sunwiz.com.au/index.php/2012-06-26-00-47-40/73-newsletter/434-australian-battery-markettrebles-in-2018.html
51 AEMO, 2018 Electricity Statement of Opportunities, A report for the National Electricity Market, August 2018 (AEMO 2018 ESOO), available at: https://www.aemo.com.au/Electricity/National-Electricity-Market-NEM/Planning-and-forecasting/NEM-Electricity-Statement-of-Opportunities.
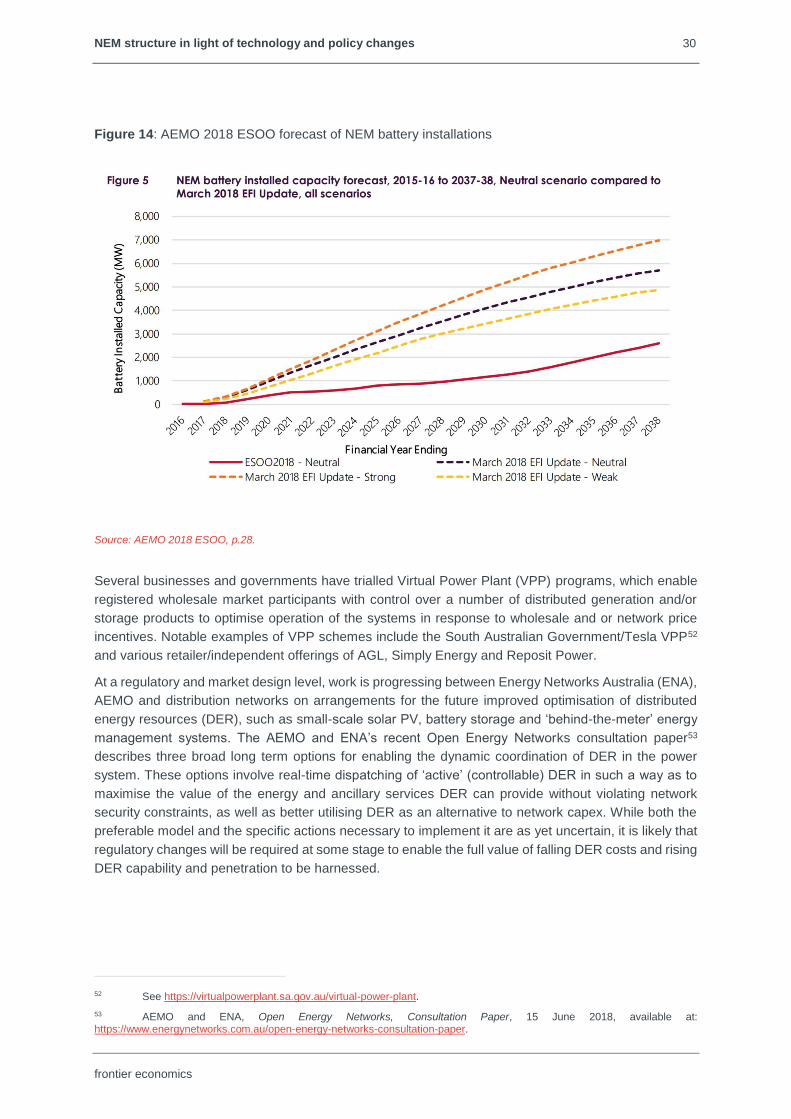
30 NEM structure in light of technology and policy changes
frontier economics
Figure 14: AEMO 2018 ESOO forecast of NEM battery installations
Source: AEMO 2018 ESOO, p.28.
Several businesses and governments have trialled Virtual Power Plant (VPP) programs, which enable
registered wholesale market participants with control over a number of distributed generation and/or
storage products to optimise operation of the systems in response to wholesale and or network price
incentives. Notable examples of VPP schemes include the South Australian Government/Tesla VPP52
and various retailer/independent offerings of AGL, Simply Energy and Reposit Power.
At a regulatory and market design level, work is progressing between Energy Networks Australia (ENA),
AEMO and distribution networks on arrangements for the future improved optimisation of distributed
energy resources (DER), such as small-scale solar PV, battery storage and ‘behind-the-meter’ energy
management systems. The AEMO and ENA’s recent Open Energy Networks consultation paper53
describes three broad long term options for enabling the dynamic coordination of DER in the power
system. These options involve real-time dispatching of ‘active’ (controllable) DER in such a way as to
maximise the value of the energy and ancillary services DER can provide without violating network
security constraints, as well as better utilising DER as an alternative to network capex. While both the
preferable model and the specific actions necessary to implement it are as yet uncertain, it is likely that
regulatory changes will be required at some stage to enable the full value of falling DER costs and rising
DER capability and penetration to be harnessed.
52 See https://virtualpowerplant.sa.gov.au/virtual-power-plant.
53 AEMO and ENA, Open Energy Networks, Consultation Paper, 15 June 2018, available at: https://www.energynetworks.com.au/open-energy-networks-consultation-paper.

31 NEM structure in light of technology and policy changes
frontier economics
4.4 Three-year notice of generator closure
On 8 November 2018, the AEMC made a final rule that requires large electricity generators to provide
at least three years’ notice to the market before closing.54 The rule change was based on one of the
recommendations in the Finkel Review.55
The AEMC considered that the provision of this advanced information will help market participants
respond to possible future shortfalls in electricity generation, such as by building replacement capacity
in a more timely manner. In so doing, it will eliminate incumbents’ informational advantage over other
parties as to when new generation investment may be viable. This should reduce the risks of entry and
promote wholesale competition.
4.5 5-minute settlement
In November 2017, the AEMC made a final rule to change the settlement period for the electricity spot
price from 30 minutes to five minutes, starting on 1 July 2021.56 The delay of over three and a half years
was provided to mitigate the costs and risks associated with implementation.57
The implications of moving to 5-minute settlement for policy-makers’ concerns are discussed in the
following chapter.
4.6 Demand response mechanism
The Finkel Review found that demand response plays a relatively small role in the NEM and
recommended that the COAG Energy Council should direct the AEMC to undertake a review to
recommend a mechanism that facilitates demand response in the wholesale energy market.58
In the REPI, the ACCC recommended the development of a demand response mechanism for the NEM
to enable third parties who are not retailers to offer demand response directly into the wholesale market,
“given its potential to constrain the pricing of generation businesses, limit the need for additional
generation and lead to lower prices.”59
In its final report for the Reliability Frameworks Review, the AEMC supported the development of a rule
change to implement a mechanism that would enable demand response aggregators to be treated on
an equal footing with generation.60 On 31 August 2018, the Public Interest Advocacy Centre (PIAC),
Total Environment Centre and the Australia Institute submitted a rule change request to implement a
wholesale demand response mechanism.61 Subsequently, the AEC submitted its own proposed rule
54 AEMC, National Electricity Amendment (Generator three year notice of closure) Rule 2018, 8 November 2018, available at: https://www.aemc.gov.au/rule-changes/generator-three-year-notice-closure.
55 Independent Review into the Future Security of the National Electricity Market: Blueprint for the Future, Commonwealth of Australia 2017 (Finkel Review), Recommendation 3.2, pp.87-97.
56 AEMC, Rule Determination, National Electricity Amendment (Five Minute Settlement) Rule 2017, 28 November 2017 (AEMC 5-minute settlement determination), available at: https://www.aemc.gov.au/rule-changes/five-minute-settlement.
57 AEMC 5-minute settlement determination, p.vi, 17 and chapter 7.
58 Finkel Review, Recommendation 6.7, p.148.
59 ACCC REPI, p.204.
60 AEMC, Final Report, Reliability Frameworks Review, 26 July 2018 (AEMC Reliability Frameworks Review), available at: https://www.aemc.gov.au/markets-reviews-advice/reliability-frameworks-review
61 Public Interest Advocacy Centre, Total Environment Centre and the Australia Institute, Wholesale Demand Response Energy Market Mechanism: Rule Change Request, 31 August 2018, available at: https://www.aemc.gov.au/rule-changes/wholesale-demand-response-mechanism.

32 NEM structure in light of technology and policy changes
frontier economics
change supporting the development of demand response, which the AEC says could provide many of
the benefits of the PIAC et al rule change, but at significantly lower costs.62 Then on 30 October 2018,
the South Australian Government submitted a third, related rule change request that would allow third
parties to offer wholesale demand response into the wholesale market as well as set up a separate
wholesale demand response market.63
The AEMC has published a consultation paper on all three rule change proposals.64 Given the support
a demand response mechanism has received from the ACCC, AEMC and the COAG Energy Council,
it is likely that something of this nature will be implemented in the next two to three years.
4.7 LNG import terminals
AGL is one of several parties considering building a LNG import facility on the east coast of Australia.
AGL’s proposed facility is at Crib Point on Western Port Bay in Victoria.65 The Crib Point terminal would
utilise a floating storage and regassification unit (FSRU) which stores the liquid gas and could allow
between 12 to 40 LNG ships per year to resupply the FSRU with LNG. AGL anticipated that the first
deliveries of LNG could occur in early 2020. However, the Victorian government recently decided to
conduct a full environmental assessment for the project, which at the least would likely delay
commissioning beyond this date.66
If the Crib Point project or one like it were to proceed, it would enable LNG to be supplied from overseas
or elsewhere in Australia, providing more certain supply and greater price competition for east coast gas
supplies.
62 Letter from Sarah McNamara, Chief Executive Officer, Australian Energy Council, to John Pierce, Chair, Australian Energy Market Commission, “Demand Response Mechanisms”, 18 October 2018, available at: https://www.aemc.gov.au/rule-changes/wholesale-demand-response-register-mechanism.
63 Letter from The Hon Dan van Holst Pellekaan MP, Minister for Energy and Mining to John Pierce, Chair, Australian Energy Market Commission, “Proposed Rule change – Demand Response Mechanisms”, 30 October 2018, available at: https://www.aemc.gov.au/rule-changes/mechanisms-wholesale-demand-response.
64 AEMC, Consultation Paper, Wholesale Demand Response Mechanisms, 15 November 2018, available at: https://www.aemc.gov.au/rule-changes/wholesale-demand-response-mechanism.
65 See: https://www.agl.com.au/about-agl/how-we-source-energy/crib-point-project.
66 See: https://www.theaustralian.com.au/business/mining-energy/agl-energys-plan-to-import-gas-at-crib-point-faces-delay/news-story/110f34f2e3d69d539f43bd42aec359e9.

33 NEM structure in light of technology and policy changes
frontier economics
5 IMPLICATIONS OF TECHNOLOGY AND OTHER CHANGES
Chapter 3 explained how certain key features of the NEM likely contributed to short and longer term
price outcomes that have attracted the attention of policy-makers and regulators. Chapter 4 outlined a
range of technology and market design changes affecting the NEM that can be reasonably anticipated
over the next decade. This chapter brings together the themes explored in the previous two chapters by
examining the implications of the expected technology and other changes for future market conduct and
outcomes in coming to a view on whether the factors underlying policy-makers’ historical and recent
concerns are likely to persist over the next decade and beyond.
This chapter proceeds by examining the potential influence of the technology and other changes
discussed in chapter 4 on the features of the NEM that I believe have driven policy-makers’ concerns
laid out in chapter 3. Specifically, this chapter considers how various forms of technology and other
policy and market changes will likely affect those features of the NEM that together have led to high and
prolonged sensitivity of wholesale prices to demand and supply conditions (and thereby the benefits of
vertical integration) – these features being:
• The nature of generation technology – as exhibiting high fixed and sunk costs, large economies of
scale, ‘lumpiness’ and long lead-times
• The energy-only design of the NEM, combined with
• Highly inelastic nature of real-time wholesale electricity demand.
5.1 Expected changes in generation technology and costs
As discussed in Appendix B and summarised in chapter 4, it is likely that over the next decade,
generation technology will move more rapidly in the direction it has been moving over the decade –
towards more renewable generation capacity and storage and away from conventional fossil-fuelled
generation. As a consequence, new electricity generation in particular is likely to exhibit:
• Less irreversibility (or ‘sunkness’) – some plant types (such as batteries and micro-generators)
will be smaller and more portable than traditional fossil-fuelled turbines, and many new technology
plant have shorter asset lives. Both of these factors will tend to reduce barriers to entry and exit.
• Weaker economies of scale – renewable generation and battery storage technologies exhibit much
smaller average unit cost declines with larger unit and plant sizes than traditional technologies,
making it efficient to invest at a smaller scale – and sooner – than previously would have been
optimal.
• Reduced lumpiness – renewable generation and battery storage technologies are available in much
smaller increments than fossil-fuelled units, making it possible to take advantage of smaller
economies of scale to invest sooner than otherwise and without creating the same capacity overhang
and ‘price collapse’ effects as the commissioning of new generators created in the past.
• Shorter lead times – enabling quicker market reactions to high demand conditions.
All of these factors are likely to encourage faster and smaller-sized market responses to periods of
relative undersupply than has previously been the case. They should also help reduce the importance

34 NEM structure in light of technology and policy changes
frontier economics
of (i) existing retail market positions and (ii) fear of price collapse effects in developing new capacity
additions, thus lowering barriers (such as they are) to entry and expansion.
The impact of such changes has already been evident following the closure of the Northern and
Hazelwood power stations in South Australia and Victoria, respectively. While the South Australian
Government has instigated a number of supply-side investments itself, elsewhere, the investment
response to date has been largely driven by market responses to high wholesale prices and the existing
Commonwealth RET.67
Further, less irreversible or shorter-lived generation and storage that can be commissioned without long
lead times could encourage faster market responses to high prices.
The likely future effect of these changes can be shown using a similar stylised approach to the price-
cycling phenomenon shown in Figure 5. In this context, I note the following figure from the AEMC’s
2017 Residential Price Trends report68 (as adapted from the Grattan Institute’s Next Generation report69)
and reproduced by the ACCC in the REPI (Figure 15). This figure purports to show contemporary NEM
price-cycle dynamics.
Figure 15: Cycle of wholesale prices in the energy-only NEM with the RET
Source: AEMC 2017 Residential Price Trends report, Figures 1 and 3.3, pp.v and 23; ACCC REPI, Figure 2.12, p.53.
The Grattan / AEMC figure appears to be based on an expectation of minimal future changes to
generation technology and costs across the dimensions highlighted above – investment cost
reversibility, economies of scale, lumpiness and development lead times. If these aspects of generation
technologies and costs change over the next decade in ways that appear likely, NEM price-cycle
dynamics in both the short term and the medium to longer term could change considerably.
67 See: https://www.energycouncil.com.au/analysis/tracking-ret/.
68 AEMC, Final Report, 2017 Residential Electricity Price Trends, 18 December 2017, available at: https://www.aemc.gov.au/markets-reviews-advice/2017-residential-electricity-price-trends.
69 Grattan Institute Next Generation report, Figure 3.1, p.17.
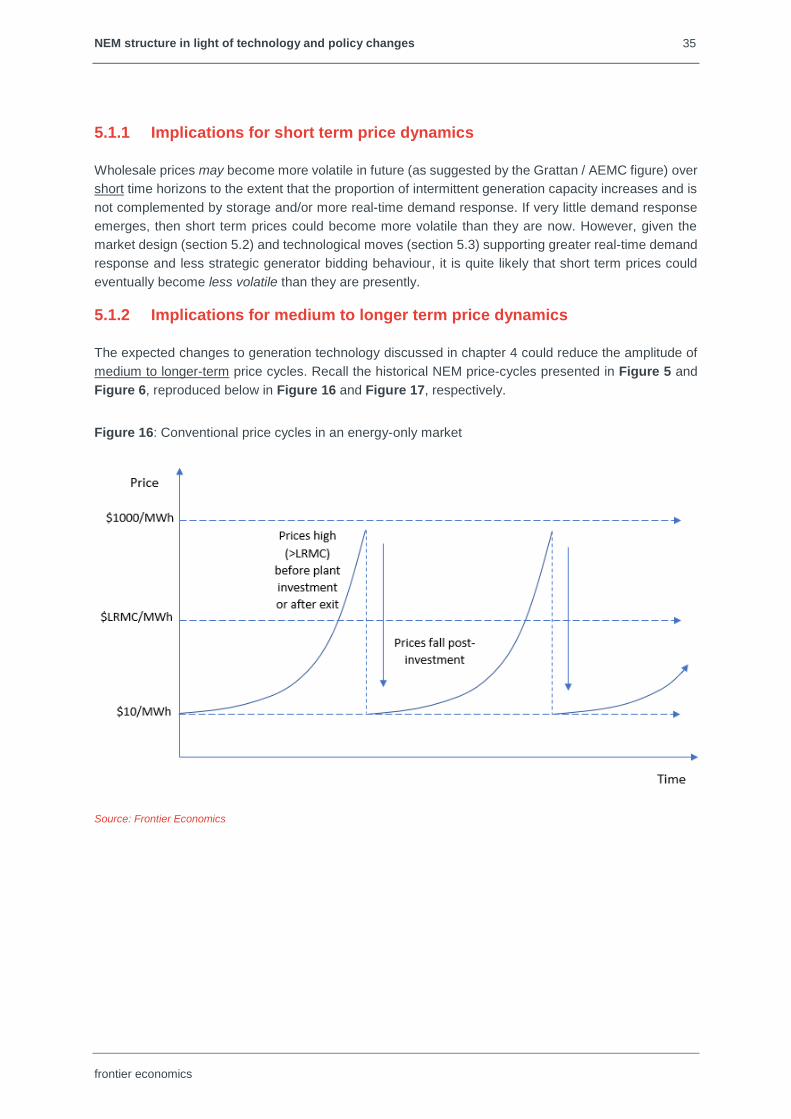
35 NEM structure in light of technology and policy changes
frontier economics
5.1.1 Implications for short term price dynamics
Wholesale prices may become more volatile in future (as suggested by the Grattan / AEMC figure) over
short time horizons to the extent that the proportion of intermittent generation capacity increases and is
not complemented by storage and/or more real-time demand response. If very little demand response
emerges, then short term prices could become more volatile than they are now. However, given the
market design (section 5.2) and technological moves (section 5.3) supporting greater real-time demand
response and less strategic generator bidding behaviour, it is quite likely that short term prices could
eventually become less volatile than they are presently.
5.1.2 Implications for medium to longer term price dynamics
The expected changes to generation technology discussed in chapter 4 could reduce the amplitude of
medium to longer-term price cycles. Recall the historical NEM price-cycles presented in Figure 5 and
Figure 6, reproduced below in Figure 16 and Figure 17, respectively.
Figure 16: Conventional price cycles in an energy-only market
Source: Frontier Economics

36 NEM structure in light of technology and policy changes
frontier economics
Figure 17: Recent RET-driven price-cycle dynamics
Source: Frontier Economics
In my view, medium to longer-term price cycles are likely to shift over the next decade towards cycles
that appear more like those in Figure 18 and/or Figure 19 below.
Figure 18: Future conventional price cycles in the NEM
Source: Frontier Economics

37 NEM structure in light of technology and policy changes
frontier economics
Figure 19: Future RET-driven price cycles in the NEM
Source: Frontier Economics
To the extent that electricity demand grows and plant exits are limited or delayed, price cycles should
resemble those in Figure 18. The smaller scale of potential generation investment means both that:
• Incumbents face less of a ‘price collapse’ deterrent to investing in a timely manner; and
• New entrants face reduced financing and other barriers to generation investment.
Both of these factors should mean that investment happens more promptly and in smaller increments
than has historically been the case. The result is a flatter price cycle over the medium to longer term.
In the perhaps more likely scenario that coal-fired generators gradually continue to exit the market and
renewable energy targets drive a sizeable proportion of all new generation investment, future price cycle
dynamics could more resemble those in Figure 19. The recently-imposed requirement for a three-year
notice of closure combined with the shorter lead times for new generation technology investments
should mean that wholesale prices do not rise as much following a plant exit as they did following the
departure of Hazelwood because investors will have time to anticipate and invest in advance the closure.
Further, the three-year notice requirement may encourage plant owners to err on the side of bringing
forward closures to avoid the risk of being obliged to run their plant when wholesale prices drop to very
low (circa 2015) levels. This should mean that other things being equal, wholesale prices do not fall to
as low levels prior to a plant exit as they did prior to the closure of Northern and Hazelwood.
5.1.3 Implications for the benefits of vertical integration
Changes in generation technology and costs should also limit the benefits of vertical integration,
particularly the importance of large retail positions in sponsoring or underwriting new generation
investment.
Strong evidence for the proposition that economies of scale and lumpiness are not presenting barriers
to end-customer investment in renewable technologies is provided by data on recent power purchase

38 NEM structure in light of technology and policy changes
frontier economics
agreements (PPAs). There is an emerging trend of corporate energy consumers signing PPAs directly
with generators on much smaller scales than has historically been typical in the NEM. Figure 20
illustrates recent public corporate PPA deals in the NEM from 2016 to 2018. These PPAs enable
prospective wholesale market entrants with projects in the hundreds or even tens of MW to contract
their output to one or several customers, rather than selling to an existing retailer or building a retail
portfolio. In signing long term PPAs, financers are willing to accept high debt-to-equity ratios, lowering
the weighted average cost of capital (WACC) for the prospective entrant and increasing the economic
viability of the project. Direct contracting in this manner reduces barriers to entry for prospective market
participants and diminishes the benefits of vertical integration – see also section 5.1.3.
Figure 20: Corporate renewable energy PPA deals
Source: Energetics corporate renewable energy PPA deal tracker https://www.energetics.com.au/insights/knowledge-
centres/corporate-renewable-ppa-deal-tracker/
It is clear that many such investments are being made in reliance on some form of renewable subsidy
program – whether the Commonwealth RET, or the Victorian or Queensland RETs (VRET and QRET,
respectively) – rather than price signals from the energy-only market alone. However, a substantial
amount of investment in addition to that motivated by RETs will be required by 2030 to meet the NEM
reliability standard, and such investments will need to be driven by wholesale market signals.
One interpretation of the PPA evidence is that heralds the beginning of the end for the advantages of
the gentailer business model. While it is unlikely that business consumers sponsoring new small-scale
renewable plant via PPAs are presently bypassing the need to contract with a retailer for hedging
services (who in turn would need to own or contract with flexible suppliers), this may become more
realistic in the future.
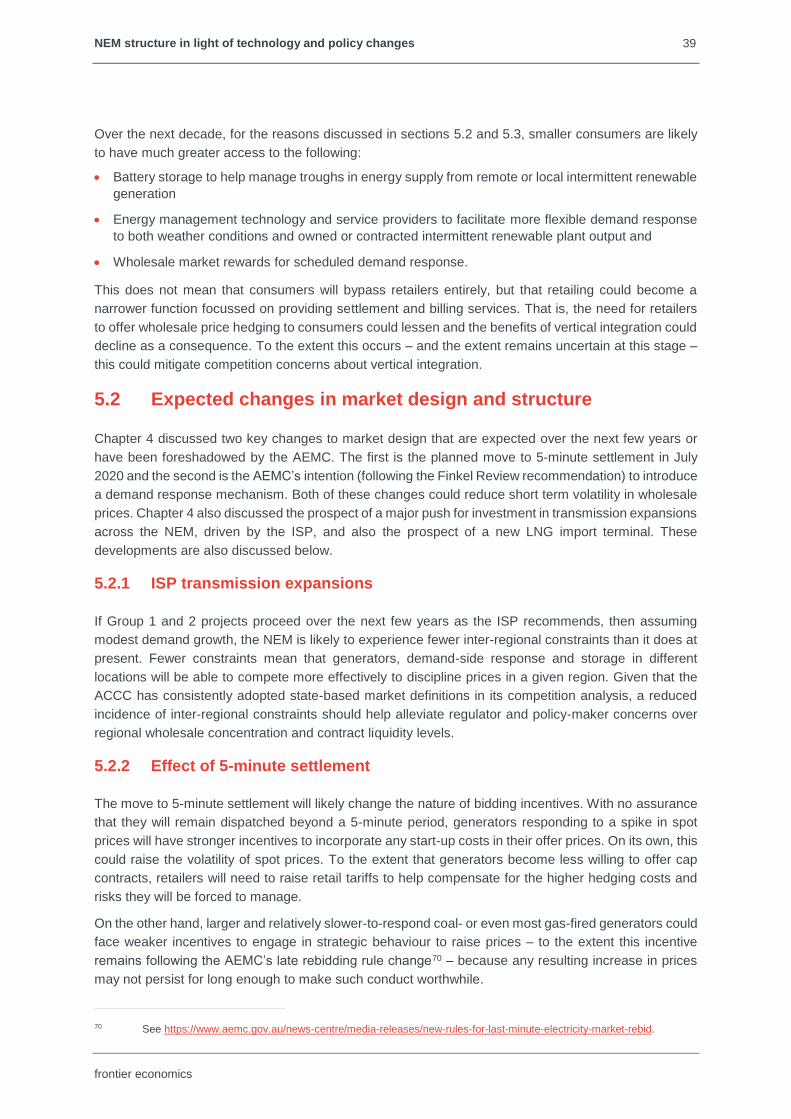
39 NEM structure in light of technology and policy changes
frontier economics
Over the next decade, for the reasons discussed in sections 5.2 and 5.3, smaller consumers are likely
to have much greater access to the following:
• Battery storage to help manage troughs in energy supply from remote or local intermittent renewable
generation
• Energy management technology and service providers to facilitate more flexible demand response
to both weather conditions and owned or contracted intermittent renewable plant output and
• Wholesale market rewards for scheduled demand response.
This does not mean that consumers will bypass retailers entirely, but that retailing could become a
narrower function focussed on providing settlement and billing services. That is, the need for retailers
to offer wholesale price hedging to consumers could lessen and the benefits of vertical integration could
decline as a consequence. To the extent this occurs – and the extent remains uncertain at this stage –
this could mitigate competition concerns about vertical integration.
5.2 Expected changes in market design and structure
Chapter 4 discussed two key changes to market design that are expected over the next few years or
have been foreshadowed by the AEMC. The first is the planned move to 5-minute settlement in July
2020 and the second is the AEMC’s intention (following the Finkel Review recommendation) to introduce
a demand response mechanism. Both of these changes could reduce short term volatility in wholesale
prices. Chapter 4 also discussed the prospect of a major push for investment in transmission expansions
across the NEM, driven by the ISP, and also the prospect of a new LNG import terminal. These
developments are also discussed below.
5.2.1 ISP transmission expansions
If Group 1 and 2 projects proceed over the next few years as the ISP recommends, then assuming
modest demand growth, the NEM is likely to experience fewer inter-regional constraints than it does at
present. Fewer constraints mean that generators, demand-side response and storage in different
locations will be able to compete more effectively to discipline prices in a given region. Given that the
ACCC has consistently adopted state-based market definitions in its competition analysis, a reduced
incidence of inter-regional constraints should help alleviate regulator and policy-maker concerns over
regional wholesale concentration and contract liquidity levels.
5.2.2 Effect of 5-minute settlement
The move to 5-minute settlement will likely change the nature of bidding incentives. With no assurance
that they will remain dispatched beyond a 5-minute period, generators responding to a spike in spot
prices will have stronger incentives to incorporate any start-up costs in their offer prices. On its own, this
could raise the volatility of spot prices. To the extent that generators become less willing to offer cap
contracts, retailers will need to raise retail tariffs to help compensate for the higher hedging costs and
risks they will be forced to manage.
On the other hand, larger and relatively slower-to-respond coal- or even most gas-fired generators could
face weaker incentives to engage in strategic behaviour to raise prices – to the extent this incentive
remains following the AEMC’s late rebidding rule change70 – because any resulting increase in prices
may not persist for long enough to make such conduct worthwhile.
70 See https://www.aemc.gov.au/news-centre/media-releases/new-rules-for-last-minute-electricity-market-rebid.

40 NEM structure in light of technology and policy changes
frontier economics
5.2.3 Effect of demand response mechanism
Assuming the adoption of changes to the market arrangements to promote greater demand response
(particularly, scheduled demand response), along the lines of either of the proposals discussed in
section 4.6, the extent of real-time demand response is likely to increase in the future. This should
increase the real-time responsiveness or elasticity of electricity demand with respect to the wholesale
price – see also section 5.3 below.
5.2.4 Access to alternative fuel sources
As discussed in section 4.7, AGL is one of several parties considering building a LNG import facility on
the east coast of Australia. If the Crib Point project or one like were to proceed, it would enable LNG to
be supplied from overseas or elsewhere in Australia, providing more certain supply and greater price
competition for east coast gas supplies.
Access to an alternative source of gas at internationally-traded prices should, other things being equal,
lead to less medium-term volatility in gas prices and hence less medium-term volatility in wholesale
electricity prices to the extent that gas generation remains marginal at peak demand times. This is likely
to be the case over the next decade.
5.3 Expected changes to demand elasticity
Leaving aside changes to the market design or rules, section 4.3 explained how improvements in
communications technology and metering have increased economic opportunities for customers to
provide real-time demand-side responses via alerts or autonomous controls or systems. Further, the
scope for much improved DER optimisation could help ensure that DER is applied to whatever purpose
– wholesale or network demand response – offers the greatest benefits. At times of peak system
demand (and given the likely infrequency of constraints on distribution networks), this is likely to be
electricity demand that is more responsive to wholesale prices. Over time, these developments should
result in a more elastic wholesale demand for electricity.
A more elastic real-time demand for electricity will help reduce price volatility in the short term in two key
ways:
• First, real-time demand that is more responsive to wholesale prices will reduce the price impact and
hence ‘payoff’ to generators of a given size from withdrawing or pricing-up their capacity to spike
prices, relative to the incentives for such behaviour that might otherwise prevail. Further, new entrant
retailers will have access to similar physical hedging options as large gentailers do now (i.e. new
entrants can pick and choose a ‘right-sized’ physical generation hedge to match their small loads),
with the result that financial hedge premiums should reflect efficient risk allocation rather than any
market power.
• Second, even where generators largely behave as price-takers, more elastic real-time wholesale
demand should reduce the extent to which wholesale prices spike in the event of events such as
unexpectedly high system peak demand and/or sudden major plant outages.
Even with a relatively modest degree of real-time demand responsiveness, both the incentives on
generators to engage in strategic bidding and even the need for a MPC to enable the spot market to
clear can diminish. These developments would help bring the NEM more into line with other markets in
the economy and potentially reduce policy-makers’ and regulators’ concerns about the efficient and
competitive functioning of the electricity sector.
41 NEM structure in light of technology and policy changes
frontier economics
5.4 Implications for the achievement of the NEO
The developments discussed in this chapter are likely to offer three major benefits from the perspective
of policy-makers and regulators:
• The first is that they should help smooth wholesale price volatility in both the short term and in the
medium to longer term;
• The second is they should reduce the advantages of the vertically-integrated ‘gentailer’ business
model; and
• The third is that they should encourage more competitive behaviour in the NEM wholesale market
and thereby lead to more efficient and cost-reflective dispatch and pricing outcomes.
These developments are also broadly consistent with the satisfaction of the NEO, although only the third
is directly relevant. Reduced price volatility may or may not promote the NEO in itself, but is expected
to be a consequence of behaviours that would promote the NEO – namely, more efficient participant
decisions about energy usage and investment, and more cost-reflective bidding. Similarly, reduced
advantages for the gentailer business model may not promote the NEO directly, but could increase
competition by lowering entry barriers.
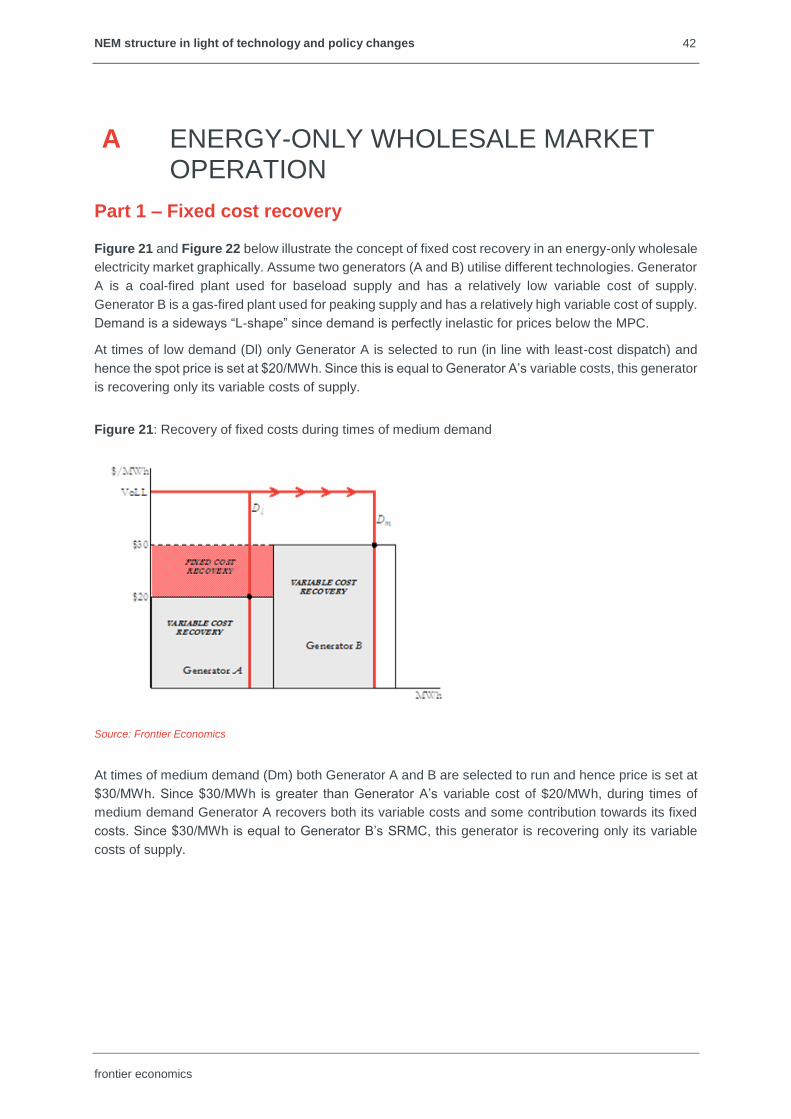
42 NEM structure in light of technology and policy changes
frontier economics
A ENERGY-ONLY WHOLESALE MARKET OPERATION
Part 1 – Fixed cost recovery
Figure 21 and Figure 22 below illustrate the concept of fixed cost recovery in an energy-only wholesale
electricity market graphically. Assume two generators (A and B) utilise different technologies. Generator
A is a coal-fired plant used for baseload supply and has a relatively low variable cost of supply.
Generator B is a gas-fired plant used for peaking supply and has a relatively high variable cost of supply.
Demand is a sideways “L-shape” since demand is perfectly inelastic for prices below the MPC.
At times of low demand (Dl) only Generator A is selected to run (in line with least-cost dispatch) and
hence the spot price is set at $20/MWh. Since this is equal to Generator A’s variable costs, this generator
is recovering only its variable costs of supply.
Figure 21: Recovery of fixed costs during times of medium demand
Source: Frontier Economics
At times of medium demand (Dm) both Generator A and B are selected to run and hence price is set at
$30/MWh. Since $30/MWh is greater than Generator A’s variable cost of $20/MWh, during times of
medium demand Generator A recovers both its variable costs and some contribution towards its fixed
costs. Since $30/MWh is equal to Generator B’s SRMC, this generator is recovering only its variable
costs of supply.

43 NEM structure in light of technology and policy changes
frontier economics
Figure 22: Recovery of fixed costs during times of high demand
Source: Frontier Economics
At times of high demand (Dh), where demand outstrips supply, price will approach the MPC and thus
both generators will recover their variable costs of supply and some contribution towards their fixed
costs.
Part 2 – Optimal plant mix
The energy-only market design is not only intended to yield consistent levels of unserved energy and
installed generation capacity, it can also produce an efficient technology mix of plant. In a theoretically
ideal (fully-competitive) energy-only market in which all generators bid at their avoidable operating costs,
for a given:
• MPC
• mix of available generation technologies (with differing cost and operating characteristics) and
• shape or ‘profile’ of load,
the market should produce:
• the optimal technology mix and timing of generation investment as well as the optimal operation of
these generators, together ensuring that long-run total costs of meeting load are minimised and
• a path of market prices that results in this optimal mix of plant – based on optimal dispatch – perfectly
recovering all generators’ total costs (fixed and variable) over time.
The precise conditions necessary for this outcome are not borne out in practice due to a range of real-
world market imperfections and failures. For example, it ignores generator start-up costs, which are
typically material for conventional thermal generators (such as coal and gas-fired plant) but are not
typically factored into estimates of operating cost.
Nevertheless, it is illustrative to describe how in theory an energy-only market seeks to ensure the
efficient mix and operation of generation plant, as well as cost recovery for that efficient mix of plant.
Different types and technologies of generating plant have different fixed and variable costs. ‘Baseload’
plant, such as coal-fired generators, tend to have relatively high fixed costs and relatively low variable
costs. This structure of costs means that it is efficient for them to operate at high capacity for a large

44 NEM structure in light of technology and policy changes
frontier economics
proportion of the time. ‘Mid-merit’ plant such as combined cycle gas turbines (CCGTs) tend to have
moderate fixed and variable costs, making it efficient for them to operate for a moderate proportion of
the time. ‘Peaking’ plant, such as open-cycle gas turbines (OCGT), tend to have relatively low fixed
costs and relatively high variable costs. This structure of costs means that it is efficient for them to
operate for a small proportion of the time, such as during hot or cold weather when electricity demand
is high.
As noted above, for efficient plant to recover their full costs in an energy-only market, the wholesale spot
price must be able – and expected – to rise above the operating cost of all technologies of plant from
time to time, to enable each plant type to recover its fixed (as well as variable) costs:
• When the spot price rises above the operating cost of baseload plant, baseload plant earn ‘infra-
marginal’ rents that contribute towards the recovery of their fixed costs.
• When the spot price rises above the operating cost of mid-merit plant, both peaking and mid-merit
plant earn infra-marginal rents that contribute to the recovery of their fixed costs.
• When the spot price rises above the operating cost of peaking plant, all plant (baseload, mid-merit
and peaking) earn infra-marginal rents that contribute to the recovery of their fixed costs.
The level and shape or ‘profile’ of demand over time will – in combination with generator and demand-
side bids – influence how often and for what duration the spot price lies above or below the operating
costs of various plant. The expected level and profile of the spot price will over time influence which
plant are likely to be profitable and enter or exit the market.
Figure 23 below provides a stylised illustration of how energy-only markets signal an efficient plant mix.
The top panel shows the total cost, per MWh, of three generation technologies at different operating
capacity factors. The y-intercept denotes fixed cost and the slope of the line denotes variable cost.
Depending on the duration of operation, each technology is at some point least-cost in $/MWh terms (ie
it lies on the dotted red line). These ‘screening curves’ can be used to determine the optimum plant mix
for a given shape of load.
Taking as given the target maximum annual magnitude of unserved energy, it is possible to derive the
optimal proportion of time that each plant should run and the resultant optimal level of installed capacity
of each plant from the middle panel.
Under the assumptions of a fully-competitive market, the:
• optimal duration of unserved energy, combined with the
• optimal plant mix and operation given technology costs and the shape of load,
can be used to derive an optimal price-duration curve as per the bottom panel.
This resultant price-duration curve is sufficient to ensure that all technologies in the optimal mix can
recover their total costs (variable and fixed) over time. Each technology recovers only its variable costs
when it is setting the price (i.e. it is the marginal generator). Each technology recovers both its variable
and a portion of its fixed costs when the market price rises above its variable cost. This means that:
• The most expensive generation technology recovers its fixed costs only when it is required to be
dispatched meet demand, or during periods of unserved energy when the market price is equal to
the MPC.
• All other generation technologies in the optimal mix also rely on MPC prices at these times to ensure
they fully recover their fixed costs. For example, a baseload unit will recover some of its fixed costs
when a mid-merit plant is marginal and setting the price, but will not recover all its fixed costs unless
the optimal duration of MPC prices occurs.

45 NEM structure in light of technology and policy changes
frontier economics
Figure 23: Technology costs, optimal plant mix and price-duration curve
Source: Frontier Economics
Investment in unsubsidised (non-renewable) generation have generally reflected the predictions of
energy-only market theory. When the NEM commenced, there was considerable coal baseload capacity
in Victoria but limited gas peaking capacity (although Snowy Hydro’s plant played this role to some
extent). Through the course of several hot summers, when demand and spot prices in Victoria and
South Australia rose sharply for short periods of time (see Figure 24), investors realised that while
additional baseload plant would not be viable, lower fixed cost peaking plant that would only operate for

46 NEM structure in light of technology and policy changes
frontier economics
a few days or weeks a year could be profitable. The result was the development of the gas-fired
Somerton OCGT in Victoria and the gas/diesel Hallett OCGT in South Australia.
Figure 24: NEM spot prices 1999-2007
Source: AER, State of the Energy Market 2007, Figure 2.9, p.90.

47 NEM structure in light of technology and policy changes
frontier economics
B LITERATURE REVIEW
Part 1 – Historical trends in generation technology in the NEM
World Electric Power Plants Database
The S&P Global Market Intelligence World Electric Power Plants Database71 (WEPP) is a worldwide
inventory of electric power generating units. This database can be used to examine historical trends in
centralised generation investment around the world. Entries in this database include information about
unit sizes, station sizes, construction year, operating status, technology, fuel type and location.
This report uses the WEPP data to investigate trends in generator technology investment decisions from
1960 to the present day. To obtain a subset of projects of interests, we perform some basic filtering prior
to presenting the following results. Our filtering methodology is as follows:
• We select five significant countries of interest, including Australia.
• We consider the most common fuels utilised in Australia, including coal, gas, water (hydro), solar
and wind.
• We only consider power stations greater than or equal to 30MW in size. Many projects in the
database are embedded (decentralised), which we consider separately in the following section. We
use a 30MW minimum station capacity as a heuristic to filter out decentralised projects which would
otherwise skew results.
The following figures show distributions via box-and-whisker plots72 of station size by technology and
country (Figure 25) and unit size by technology and country (Figure 26) in five year periods. We
aggregate projects by fuel type, but split gas into technology categories of steam turbine and ‘other’, as
there is a distinct step change in the size of steam turbine gas generators compared to other gas
generator technology types73. For stations with units built in different years, we attribute the modal (most
frequent) year of unit construction to the station74.
From Figure 25, it is clear that coal-fired and gas steam turbines, and to a lesser extent, hydro power
stations are the largest generators built in each of countries examined. Most remarkably in Australia,
coal-fired power stations have consistently dominated other fuel groups – small coal-fired power stations
in Australia are comparable in size to large power stations of other fuel types.
The number of coal-fired power stations built in developed countries has decreased in recent years,
likely due to a combination of the following reasons:
• Flattening or falling demand in the selected countries other than China
• Carbon pricing or abatement risk, leading to investment in low-carbon emitting substitutes
71 See: https://www.platts.com.es/products/world-electric-power-plants-database
72 The methodology for calculating elements of the box and whiskers is known as Tukey’s methodology. The elements of the box include 25th, 50th and 75th percentiles. The whiskers represent the most extreme values falling within the 25th/75th percentiles plus/minus the interquartile range (IQR), which is the difference between the 75th and 25th percentile. Outliers include any values more extreme than the 25th/75th percentiles plus/minus the IQR.
73 There are a large number of possible configurations for gas-fired power stations with similar unit/station size characteristics. (footnote)The relatively new single shaft combined cycle configuration (both prime-movers attached to a single shaft) has favoured larger units, explaining recent increases in size in the US and China
74 This explains several data points seemingly missing from Figure 25 from data in Figure 26.

48 NEM structure in light of technology and policy changes
frontier economics
• Requirements for flexibility in systems with increasing variable renewable energy (VRE) – coal-fired
power stations (large steam turbines) are generally slow to respond to rapid changes in demand and
supply conditions.
In Australia and the USA, coal-fired generator sizes have been falling. The size trend for coal stations
is flat in China and mixed in Germany.
Figure 25: Station size by fuel type
Source: Frontier Economics analysis of WEPP data
Figure 26 illustrates trends in unit sizes for the same fuels/technologies and countries. We omit solar
and wind fuels in this figure, as these technologies are aggregated to station size in the database.75 As
is the case with station sizes, steam turbine units (coal-fired and separately presented gas-fired units)
are among the largest. However, both gas-fired steam turbines and coal units have fallen out of favour
75 Likely due to the fact that PV panels are typically measured in hundreds of watts and wind turbines in single-digit MW; inclusion of each individual panel and/or wind turbine would make the database very large.
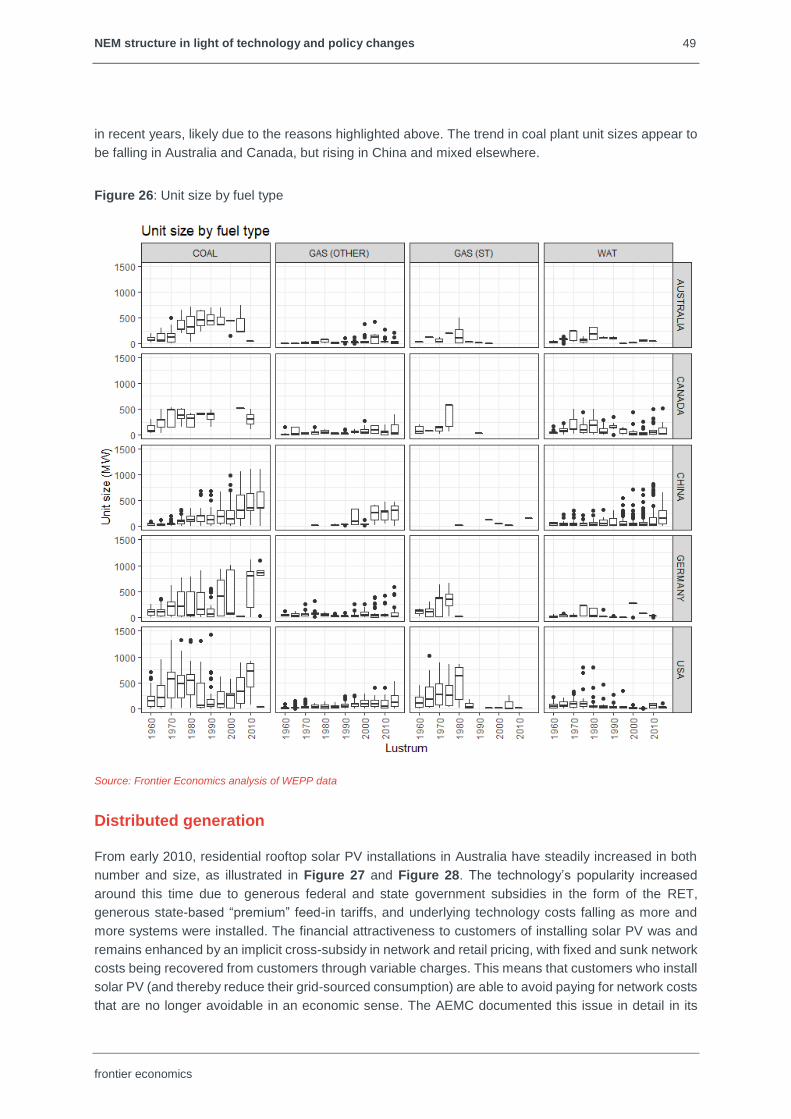
49 NEM structure in light of technology and policy changes
frontier economics
in recent years, likely due to the reasons highlighted above. The trend in coal plant unit sizes appear to
be falling in Australia and Canada, but rising in China and mixed elsewhere.
Figure 26: Unit size by fuel type
Source: Frontier Economics analysis of WEPP data
Distributed generation
From early 2010, residential rooftop solar PV installations in Australia have steadily increased in both
number and size, as illustrated in Figure 27 and Figure 28. The technology’s popularity increased
around this time due to generous federal and state government subsidies in the form of the RET,
generous state-based “premium” feed-in tariffs, and underlying technology costs falling as more and
more systems were installed. The financial attractiveness to customers of installing solar PV was and
remains enhanced by an implicit cross-subsidy in network and retail pricing, with fixed and sunk network
costs being recovered from customers through variable charges. This means that customers who install
solar PV (and thereby reduce their grid-sourced consumption) are able to avoid paying for network costs
that are no longer avoidable in an economic sense. The AEMC documented this issue in detail in its

50 NEM structure in light of technology and policy changes
frontier economics
network pricing rule change determination.76 Since the early 2010s, jurisdictional feed-in tariffs have
become far less generous, but network cross-subsidies remain significant as cost-reflective network
tariffs apply to relatively few residential customers.
Figure 27: Rooftop PV uptake in Australia
Source: Frontier Economics analysis of CER data
76 AEMC, Rule Determination, National Electricity Amendment (Distribution Network Pricing Arrangements) Rule 2014, 27 November 2014, section 4, available at: https://www.aemc.gov.au/rule-changes/distribution-network-pricing-arrangements.
0
1,000
2,000
3,000
4,000
5,000
6,000
7,000
2001-2
00
9
Mar
2010
Jun 2
010
Sep
201
0
De
c 2
010
Mar
2011
Jun 2
011
Sep
201
1
De
c 2
011
Mar
2012
Jun 2
012
Sep
201
2
De
c 2
012
Mar
2013
Jun 2
013
Sep
201
3
De
c 2
013
Mar
2014
Jun 2
014
Sep
201
4
De
c 2
014
Mar
2015
Jun 2
015
Sep
201
5
De
c 2
015
Mar
2016
Jun 2
016
Sep
201
6
De
c 2
016
Mar
2017
Jun 2
017
Sep
201
7
De
c 2
017
Cu
mu
lati
ve i
nsta
lled
cap
acit
y (
MW
)
ACT NSW NT QLD SA TAS VIC WA
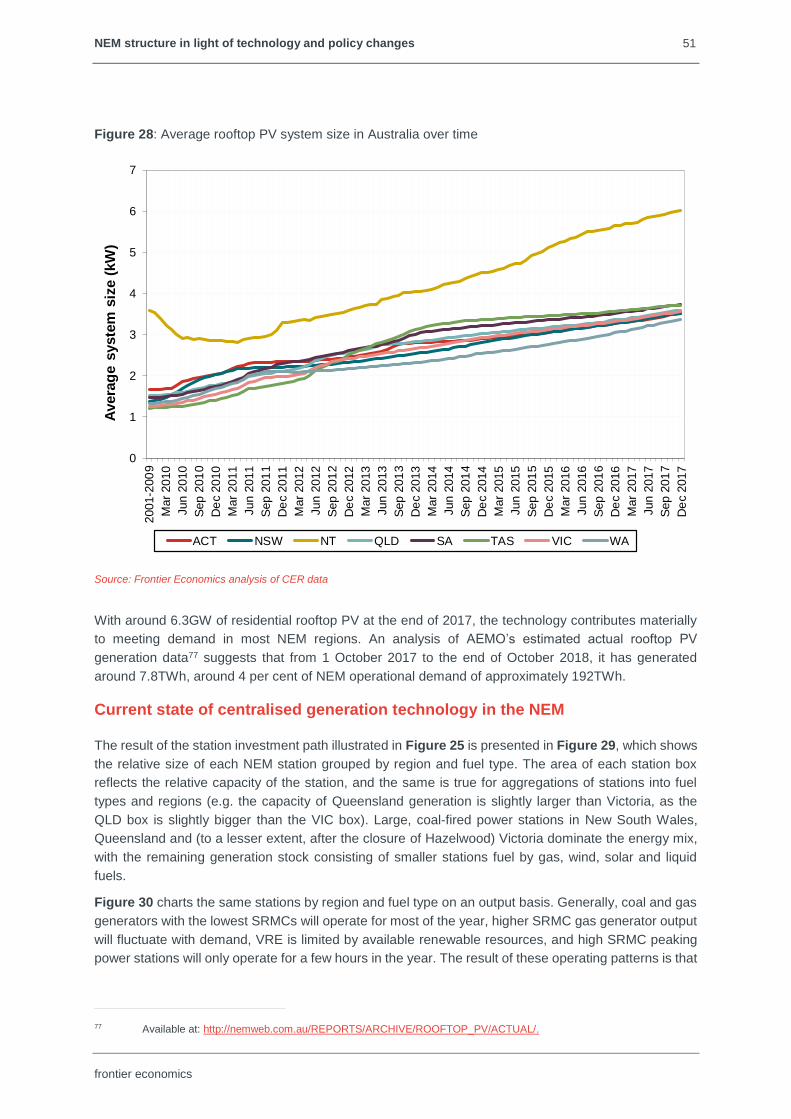
51 NEM structure in light of technology and policy changes
frontier economics
Figure 28: Average rooftop PV system size in Australia over time
Source: Frontier Economics analysis of CER data
With around 6.3GW of residential rooftop PV at the end of 2017, the technology contributes materially
to meeting demand in most NEM regions. An analysis of AEMO’s estimated actual rooftop PV
generation data77 suggests that from 1 October 2017 to the end of October 2018, it has generated
around 7.8TWh, around 4 per cent of NEM operational demand of approximately 192TWh.
Current state of centralised generation technology in the NEM
The result of the station investment path illustrated in Figure 25 is presented in Figure 29, which shows
the relative size of each NEM station grouped by region and fuel type. The area of each station box
reflects the relative capacity of the station, and the same is true for aggregations of stations into fuel
types and regions (e.g. the capacity of Queensland generation is slightly larger than Victoria, as the
QLD box is slightly bigger than the VIC box). Large, coal-fired power stations in New South Wales,
Queensland and (to a lesser extent, after the closure of Hazelwood) Victoria dominate the energy mix,
with the remaining generation stock consisting of smaller stations fuel by gas, wind, solar and liquid
fuels.
Figure 30 charts the same stations by region and fuel type on an output basis. Generally, coal and gas
generators with the lowest SRMCs will operate for most of the year, higher SRMC gas generator output
will fluctuate with demand, VRE is limited by available renewable resources, and high SRMC peaking
power stations will only operate for a few hours in the year. The result of these operating patterns is that
77 Available at: http://nemweb.com.au/REPORTS/ARCHIVE/ROOFTOP_PV/ACTUAL/.
0
1
2
3
4
5
6
7
2001-2
00
9
Mar
2010
Jun 2
010
Sep
201
0
De
c 2
010
Mar
2011
Jun 2
011
Sep
201
1
De
c 2
011
Mar
2012
Jun 2
012
Sep
201
2
De
c 2
012
Mar
2013
Jun 2
013
Sep
201
3
De
c 2
013
Mar
2014
Jun 2
014
Sep
201
4
De
c 2
014
Mar
2015
Jun 2
015
Sep
201
5
De
c 2
015
Mar
2016
Jun 2
016
Sep
201
6
De
c 2
016
Mar
2017
Jun 2
017
Sep
201
7
De
c 2
017
Avera
ge s
yste
m s
ize (
kW
)
ACT NSW NT QLD SA TAS VIC WA

52 NEM structure in light of technology and policy changes
frontier economics
actual output in the NEM is dominated by black and brown coal from New South Wales, Queensland
and Victoria.
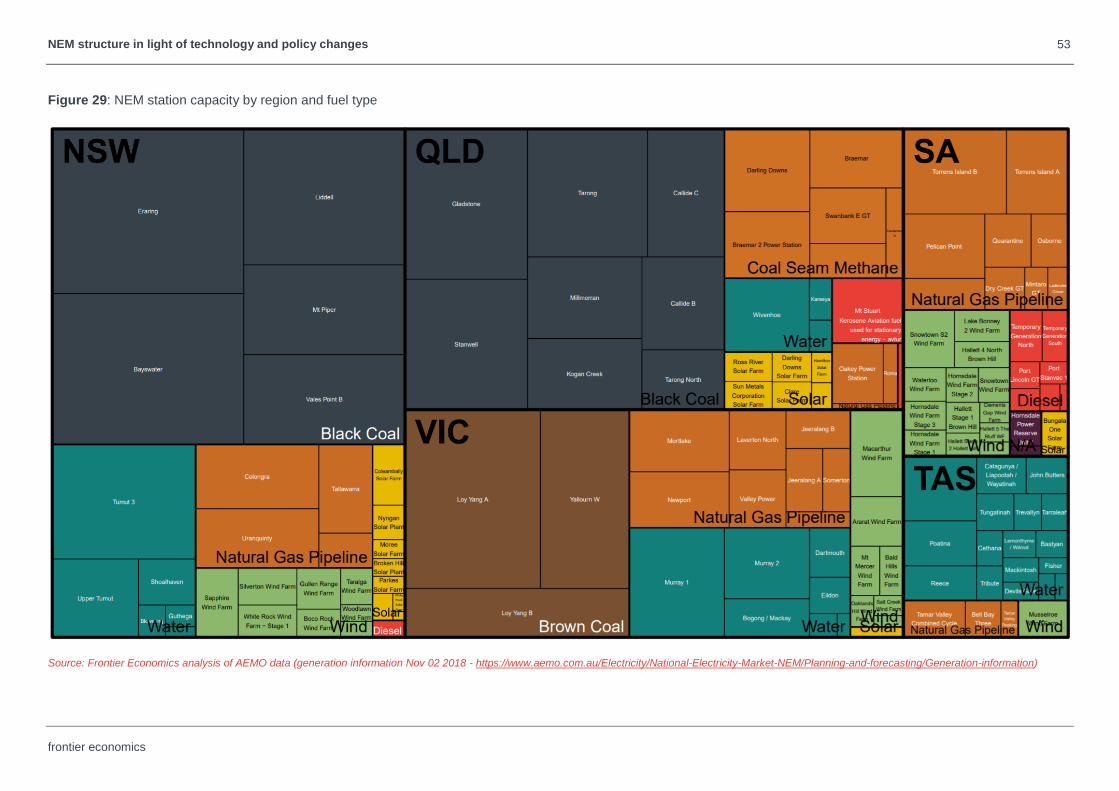
53 NEM structure in light of technology and policy changes
frontier economics
Figure 29: NEM station capacity by region and fuel type
Source: Frontier Economics analysis of AEMO data (generation information Nov 02 2018 - https://www.aemo.com.au/Electricity/National-Electricity-Market-NEM/Planning-and-forecasting/Generation-information)

54 NEM structure in light of technology and policy changes
frontier economics
Figure 30: NEM station output by region and fuel type
Source: Frontier Economics analysis of AEMO data (MMSDM)

55
NEM structure in light of technology and policy changes
frontier economics
Despite its present dominance of the NEM plant capacity and output mix, the overall level of coal-fired
generation capacity has peaked and is likely to diminish in future decades due to ongoing plant
retirements Figure 31 below shows the current stock of NEM coal-fired power stations and when they
are due to be decommissioned (either when announced or after 50 years assumed). Substantial
retirements are due in the 2030s, and are unlikely to be replaced with new coal. It is possible that some
of these retirements (e.g. Yallourn) may be brought forward into the 2020s.
Figure 31: AEMO ISP projections of coal-fired power station retirements
Source: AEMO ISP, p.22

56
NEM structure in light of technology and policy changes
frontier economics
Part 2 – Future cost projections
CO2CRC et al, Australian Power Generation Technology Report (2015)
While the cost data in the CO2CRC et al (2015) report78 were considered “significantly out of date” by
the CSIRO in its 2017 update (see below), the CO2CRC et al (2015) report is a much more detailed
document than the 2017 update and contains some useful information on unit sizes and economies of
scale, particularly for renewable plant of different technologies. In particular, it highlights that renewable
generators are typically available in much smaller unit sizes than traditional generators.79
• Wind turbines investigated in the study consist of 3 MW turbines,80 with farm sizes of 50 MW and
200 MW – exhibiting fairly modest economies of scale:81
o Capital cost (sent-out):
50 MW: $2,550 / kW
200 MW: $2,450 / kW
o Operating and maintenance (O&M) cost (per annum):
50 MW: $60 / kW
200 MW: $55 / kW
• Solar PV is evaluated at residential (5 kW), commercial (100 kW) and utility-scale (10 MW and 50
MW) sizes, with utility-scale plant assessed at fixed, single-axis and dual-axis mounts – also
exhibiting limited economies of scale:82
o For fixed module mounting:
Capital cost (sent-out):
• 5 kW: $2,100 / kW
• 100 kW: $1,950/ kW
• 10 MW: $2,400 / kW
• 50 MW: $2,300 / kW
O&M cost (per annum):
• 5 kW: $30 / kW
• 100 kW: $30 / kW
• 10 MW: $30 / kW
• 50 MW: $25 / kW
78 Wiley, D., Neal, P., Ho, M. 2015, Fimbres Weihs, G., Australian Power Generation Technology Report, CO2CRC, CSIRO, ARENA, Office of the Chief Economist (Federal Department of Industry and Science) and anlecr&d (CO2CRC et al (2015)).
79 CO2CRC et al (2015), p.17.
80 The CO2CRC et al report notes that average size of onshore wind turbines being installed continues to increase (p.49). While the report anticipates that offshore turbines will increase in capacity to 10-20 MW per turbine over time, it notes that onshore turbines are expected to be limited to 3-5 MW due to logistical and construction requirements (p.53). The report notes that, “Offshore wind has been developed at commercial scale globally in shallow waters. No resource maps have been developed for offshore wind in Australia. This is in part due to the narrowness of the continental shelf.” (p.232)
81 CO2CRC et al (2015), p.115.
82 CO2CRC et al (2015), p.234.

57
NEM structure in light of technology and policy changes
frontier economics
o For utility-scale single-axis module mounting (which offers higher capacity factors):
Capital cost (sent-out):
• 10 MW: $2,850 / kW
• 50 MW: $2,700 / kW
O&M cost (per annum):
• 10 MW: $40 / kW
• 50 MW: $35 / kW
o For utility-scale dual-axis module mounting (which offers the highest capacity factors):
Capital cost (sent-out):
• 10 MW: $3,600 / kW
• 50 MW: $3,400 / kW
O&M cost (per annum):
• 10 MW: $45 / kW
• 50 MW: $40 / kW
• Solar thermal is investigated as a single 125 MW plant with 6 hours of direct two-tank molten
storage.83
• Nuclear plant is investigated at a 1,100 MW unit size.84
• Baseload fossil fuel unit sizes are generally assumed to be no greater than 500 MW, irrespective of
the specific technology (pulverised coal, integrated gasification combined cycle and natural gas
combined cycle). However, ultra-supercritical pulverised coal is included in the study at 650 MW for
comparison purposes.85
CSIRO: Hayward & Graham (2017)
More recent research produced by the CSIRO highlights the falling costs of new generation
technologies.86
Hayward & Graham (2017) developed cost projections for a range of both conventional and new
technologies out to 2050 taking into account ‘learning effects’ – which reduce deployment costs – of the
following nature:
• Rapid learning during the early stages of a new technology’s development
• Declining rates of learning as the technology increases its market share – due to established
engineering and thermodynamic limits on the size of strength of components or theoretical maximum
energy conversion efficiency.
• Except for solar photovoltaic generation and battery storage – which “do not appear to have a
strongly settled set of underlying material components”.87 For these technologies, Hayward &
83 CO2CRC et al (2015), p.233.
84 CO2CRC et al (2015), p.236.
85 CO2CRC et al (2015), p.225.
86 Hayward, J.A. and Graham, P.W. 2017, Electricity generation technology cost projections: 2017-2050, CSIRO, Australia (Hayward & Graham (2017)).
87 Hayward & Graham (2017), pp.5-6, says, “While silicon panels are currently the dominant solar photovoltaic technology, there are a number of alternative materials being explored where significant progress is being made in achieving efficient energy

58
NEM structure in light of technology and policy changes
frontier economics
Graham (2017) apply their high historically observed learning rate indefinitely: “In practice, this
means these technologies can achieve steeper cost reduction curves for longer than other
technologies.”88
• No learning-based cost reductions are applied to mature technologies, but a small fixed annual
decline is applied across their cost inputs to reflect general productivity growth.
Hayward & Graham (2017) develop cost projects based on two scenarios:
• 2 degrees’ warming (formerly 450 ppm); and
• 4 degrees’ warming (formerly 550 ppm).
In the 2 degrees scenario, stronger policy action results in faster deployment and learning-based cost
reductions in carbon capture and storage (CCS). However, CCS is generally deployed at a lower level
than in the CSIRO’s 2015 projections due to the unexpectedly large fall in projected renewable costs –
particularly rooftop solar PV and solar thermal – since 2015. The new assumption about ongoing
learning for solar PV along with cost reductions observed since 2015 contributed to this outcome. The
solar thermal cost reductions were informed by the 150 MW South Australian Aurora project due for
completion in 2020, which helped to ‘restore confidence’ in solar thermal projections after initial
optimistic cost projections were disappointed due to the diversion of investment funds towards solar PV
and wind. Wind also experienced some cost reductions compared to the 2015 projections.
Battery cost projections are largely derived from the deployment and learning effects produced by a
separate transport model. Cost projections have nearly halved since the projections incorporated in the
ENA Transformation Roadmap. However, the ‘balance of plant’ costs remain very significant.
While making a number of caveats around their calculation and use, Hayward & Graham (2017) publish
conventional levelised cost of energy estimates to illustrate the effect of changes in projected capital
costs since 2015. They go on to refer to other modelling which shows that the need for the deployment
of intermittent renewable plant to be complemented by ‘firming’ capacity commences as the variable
renewable share in a market rises beyond 40 per cent. From 40 to 60 per cent renewable capacity
share, the modelling favoured installing batteries as a complementary technology, whereas 60 per cent,
open-cycle gas turbines (OCGT) were required. By the time 90 per cent variable renewable generation
is reached in 2050, the following approximate complementary capacity was required for each kW of
variable renewable plant:
• 0.75 kW of batteries and synchronous condensers
• 0.4 kW of flexible dispatchable capacity (e.g. OCGT).
By 90 per cent variable renewable share, wind had suffered a 17 per cent reduction in capacity factor
and solar PV had suffered a 39 per cent reduction due to the need to ‘spill’ excess energy production.
They note that, “However, the increasing losses to the capacity factor does not significantly increase the
total cost of generation because, over time, the cost of capital has also fallen to offset this effect.”
While this research does not directly discuss declining economies of scale and lumpiness, it can be
inferred from the inherent nature of rooftop solar PV and the relatively small sizes of wind and solar
thermal plant.
conversion and in different systems for installing the solar conversion system (Jacoby, 2016) (Fraunhofer ISE, 2015). This could mean improvements not only in the panel but in the installation and balance of system costs. Similarly, alternative battery chemistries and configurations also continue to be explored with no obvious limit on what might be achieved (Miller, 2017).”
88 Hayward & Graham (2017), p.6.

59
NEM structure in light of technology and policy changes
frontier economics

60
NEM structure in light of technology and policy changes
frontier economics
Figure 32: Comparison of 2017 4-degrees and 2015 550ppm scenario costs, 2017 $A sent-out basis
Source: Hayward & Graham (2017), p.9.

61
NEM structure in light of technology and policy changes
frontier economics
Figure 33: Comparison of 2017 2-degrees and 2015 450ppm scenario costs, 2017 $A sent-out basis
Source: Hayward & Graham (2017), p.10.

62
NEM structure in light of technology and policy changes
frontier economics
Figure 34: Battery-only cost projections: 2017 update and previous projections, 2017 $A
Source: Hayward & Graham (2017), p.14.
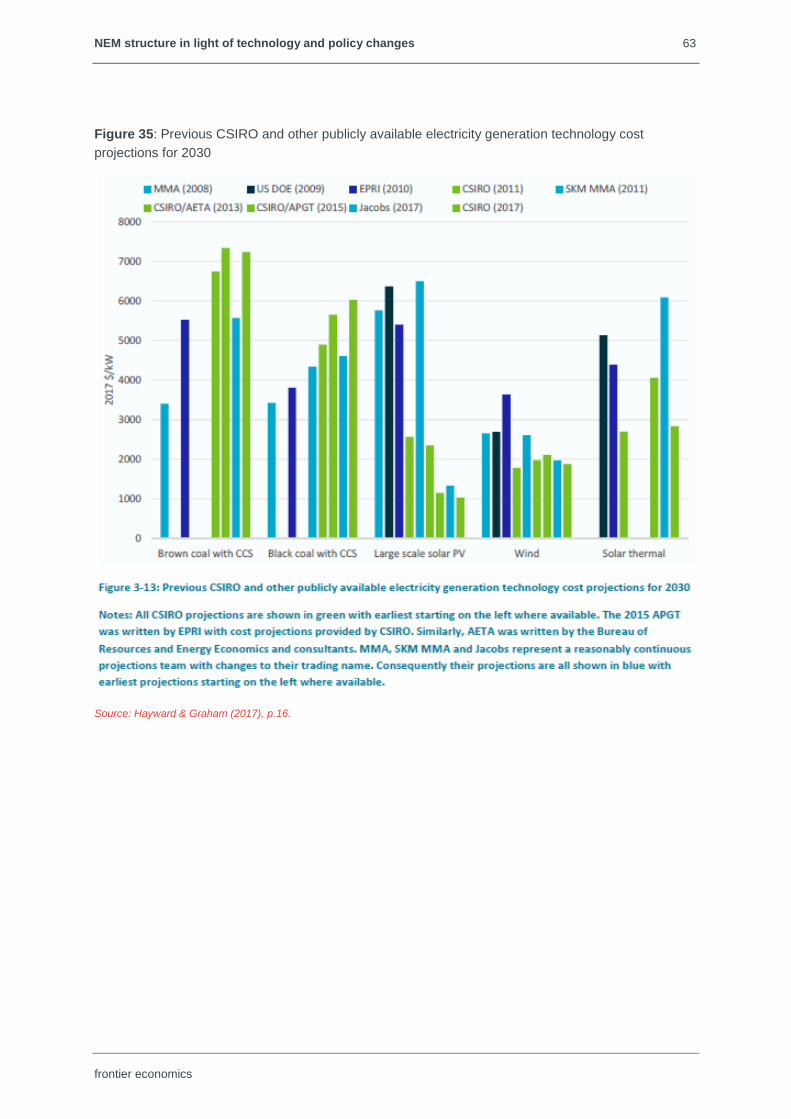
63
NEM structure in light of technology and policy changes
frontier economics
Figure 35: Previous CSIRO and other publicly available electricity generation technology cost
projections for 2030
Source: Hayward & Graham (2017), p.16.

64
NEM structure in light of technology and policy changes
frontier economics
Figure 36: Conventional levelised cost of electricity estimates
Source: Hayward & Graham (2017), p.18.
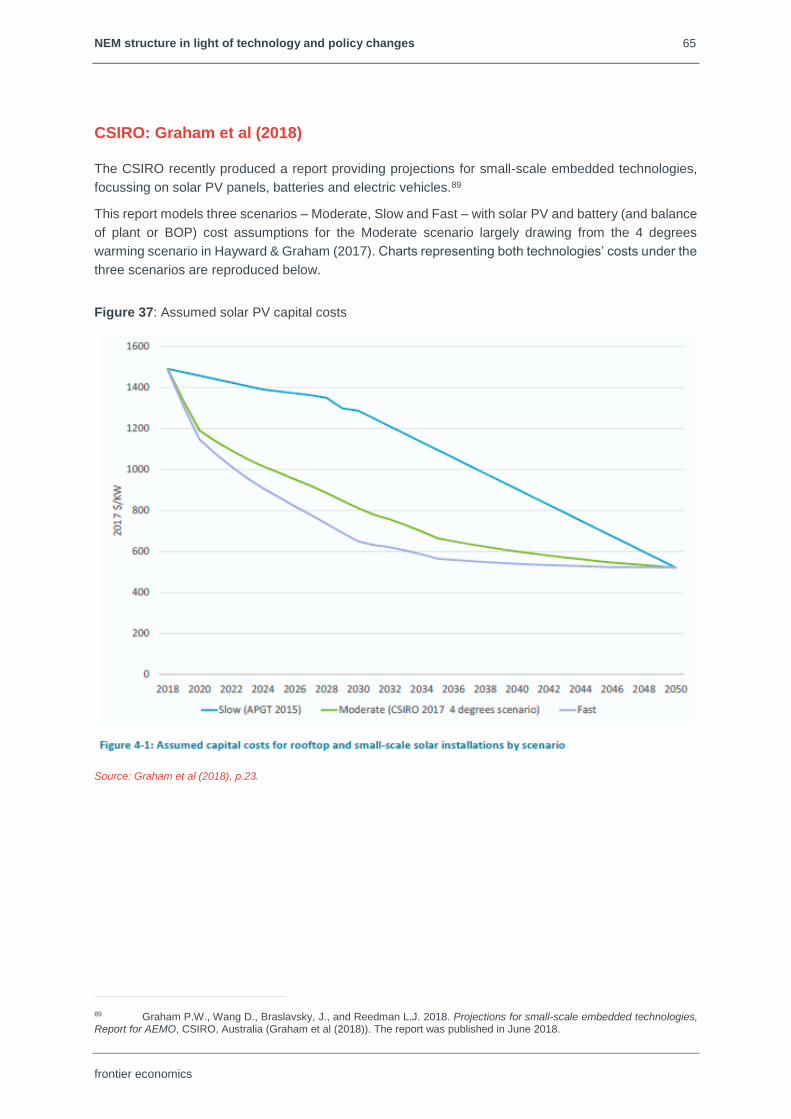
65
NEM structure in light of technology and policy changes
frontier economics
CSIRO: Graham et al (2018)
The CSIRO recently produced a report providing projections for small-scale embedded technologies,
focussing on solar PV panels, batteries and electric vehicles.89
This report models three scenarios – Moderate, Slow and Fast – with solar PV and battery (and balance
of plant or BOP) cost assumptions for the Moderate scenario largely drawing from the 4 degrees
warming scenario in Hayward & Graham (2017). Charts representing both technologies’ costs under the
three scenarios are reproduced below.
Figure 37: Assumed solar PV capital costs
Source: Graham et al (2018), p.23.
89 Graham P.W., Wang D., Braslavsky, J., and Reedman L.J. 2018. Projections for small-scale embedded technologies, Report for AEMO, CSIRO, Australia (Graham et al (2018)). The report was published in June 2018.

66
NEM structure in light of technology and policy changes
frontier economics
Figure 38: Assumed battery and BOP capital costs
Source: Graham et al (2018), p.24.
Other key assumptions made in the report are:
• Relevant government subsidy policies for small-scale renewables are the Small-scale Renewable
Energy Scheme (SRES) and the Victorian and Queensland Renewable Energy Targets (VRET and
QRET). Feed-in tariffs are assumed to continue to be based on the wholesale cost of power.90
• Smart tariff structures gradually apply to a larger proportion of customers. In the Moderate scenario,
25 per cent of residential customers face smart tariffs by 2030 and 50 per cent by 2050.Customers
facing smart tariffs are assumed to optimise battery usage to minimise grid usage at peak times.91
The modelling in the report does not appear to incorporate any technical ‘static’ limits on solar PV exports
to the grid.
As a result, Graham et al (2018) came up with national and jurisdictional projections for the adoption of
the following technologies across three scenarios:
• Residential rooftop solar PV
• Commercial rooftop solar PV (10 kW to 100 kW)
• Commercial solar PV (above 100 kW) – behaving as non-scheduled generation below 30 MW
• Residential batteries
90 Graham et al (2018), pp.19-20.
91 Graham et al (2018), pp.28-30.
67
NEM structure in light of technology and policy changes
frontier economics
• Commercial batteries
• Standalone power systems (SAPS) and
• Electric vehicles
The aggregate size of commercial batteries, and numbers of SAPSs and EVs are expected to be
relatively low over the next decade.
To the extent small-scale embedded technologies are adopted, and the manner in which adoption
occurs, is likely to have implications for the ability of generators in the wholesale market to influence
prices by withholding output. This is discussed in chapter 5 above.
Part 3 – ISP projections
Background to the ISP
Following from the South Australian system black event of 26 September 2016,92 the 2017 Finkel
Review commissioned by the COAG Energy Council recommended that AEMO should have:93
…a stronger role in planning the future transmission network, including through the development
of a NEM-wide integrated grid plan to inform future investment decisions. Significant investment
decisions on interconnection between states should be made from a NEM-wide perspective, and
in the context of a more distributed and complex energy system.
In response to this recommendation, AEMO published its initial ISP in July 2018. The ISP is a cost-
based engineering optimisation plan that forecasts the overall transmission system requirements for the
NEM over the next 20 years. The ISP takes a range of cost inputs combined with system security and
reliability considerations, expressed Commonwealth and State Government policies, to identify
transmission investments that will minimise system costs in a number of scenarios. In the ISP’s ‘Neutral’
planning scenario, the lowest cost replacement for this retiring capacity and energy is expected to
involve a portfolio that includes solar (28GW), wind (10.5 GW) and storage (17 GW and 90 GWh),
complemented by 500 MW of flexible gas plant and transmission investment.94
Transmission projections
The ISP recommends a large number of transmission investments in three tranches, depending on how
urgent AEMO considers them to be – these tranches are described as follows:
• Group 1: Near-term construction to maximise economic use of existing resources – for
immediate action to:
o Increase transfer capacity between New South Wales, Queensland, and Victoria by 170-460 MW.
o Reduce congestion for existing and committed renewable energy developments in western and
north-western Victoria.
o Remedy system strength in South Australia.
Cost: $450-650 million
92 See: https://www.aemo.com.au/Media-Centre/AEMO-publishes-final-report-into-the-South-Australian-state-wide-power-outage.
93 Finkel Review, Recommendation 5.1, p.124.
94 ISP, p.5.

68
NEM structure in light of technology and policy changes
frontier economics
Group 2: Developments in the medium term to enhance trade between regions, provide access
to storage, and support extensive development of ‘renewable energy zones’ (REZs) – to initiate
now for implementation by the mid-2020s to:
• Establish new transfer capacity between New South Wales and South Australia of 750 MW
(RiverLink).
• Increase transfer capacity between Victoria and South Australia by 100 MW.
• Increase transfer capacity between Queensland and New South Wales by a further 378 MW (QNI).
• Efficiently connect renewable energy sources through maximising the use of the existing network
and route selection of the above developments.
• Coordinate DER in South Australia.
Group 3: Longer-term developments to support REZs and system reliability and security – for
the mid-2030s and beyond.
Generation projections
AEMO’s ISP generation plant projections were based on a range of modelling assumptions, including
for generator build costs. According to the ISP, build cost assumptions were derived from Hayward &
Graham (2017), coupled with AEMO internal analysis.95 Accordingly, it is unsurprising that the ISP
projections tell a similar story to the CSIRO analysis. For the sake of completeness, the ISP’s build cost
projections to 2029-30 for the ‘Neutral’ scenario are reproduced in Figure 39 below.96
Figure 40 reproduces Figure 10 from the ISP, which shows the relative changes in installed capacity in
the Neutral planning scenario relative to the present generation mix over the next 20 years. It highlights
the growth in both rooftop PV and utility solar (solar thermal), as well as the ongoing growth of wind,
and the beginnings of significant investment in distributed and utility-level storage.
95 AEMO ISP, Table 2, p.27.
96 AEMO, 2018 ISP Assumptions workbook, 17 July 2018, ‘Build cost’ tab, available at: https://www.aemo.com.au/Electricity/National-Electricity-Market-NEM/Planning-and-forecasting/Integrated-System-Plan/ISP-database

69
NEM structure in light of technology and policy changes
frontier economics
Figure 39: AEMO ISP – Neutral scenario – build costs ($/kW) real 2017 dollars
Source: AEMO, 2018 Integrated System Plan Modelling Assumptions workbook, ‘Build cost’ tab.
Neutral
2017-18 2018-19 2019-20 2020-21 2021-22 2022-23 2023-24 2024-25 2025-26 2026-27 2027-28 2028-29 2029-30
Biomass 3,779.15$ 3,770.82$ 3,757.65$ 3,755.92$ 3,752.78$ 3,752.78$ 3,752.78$ 3,752.78$ 3,752.78$ 3,752.78$ 3,752.78$ 3,752.78$ 3,752.78$
CCGT 1,500.68$ 1,500.66$ 1,500.66$ 1,500.41$ 1,500.30$ 1,499.99$ 1,499.69$ 1,499.39$ 1,499.11$ 1,498.46$ 1,497.45$ 1,496.49$ 1,495.56$
OCGT 1,019.61$ 1,014.51$ 1,009.44$ 1,004.39$ 999.37$ 994.37$ 989.40$ 984.45$ 979.53$ 974.63$ 969.76$ 964.91$ 960.09$
Single-axis Tracking Solar PV2 1,952.05$ 1,733.25$ 1,634.67$ 1,492.50$ 1,421.39$ 1,363.01$ 1,316.62$ 1,270.06$ 1,228.59$ 1,183.76$ 1,148.26$ 1,081.55$ 1,033.69$
Solar Thermal Central Receiver (6 hrs storage) 4,434.41$ 3,677.62$ 3,299.20$ 3,299.20$ 3,299.20$ 3,299.20$ 3,299.20$ 3,299.20$ 3,296.30$ 3,137.48$ 3,031.77$ 2,905.32$ 2,835.99$
Wind 1,945.06$ 1,940.42$ 1,933.93$ 1,924.78$ 1,921.10$ 1,908.58$ 1,901.27$ 1,899.67$ 1,899.10$ 1,899.01$ 1,898.92$ 1,898.77$ 1,875.96$
Pumped Hydro (6hrs storage) 1,386.11$ 1,379.18$ 1,372.29$ 1,365.42$ 1,358.60$ 1,351.80$ 1,345.04$ 1,338.32$ 1,331.63$ 1,324.97$ 1,318.35$ 1,311.75$ 1,305.19$
Large Scale Battery Storage (2hrs storage) 1,480.18$ 1,313.14$ 1,208.39$ 1,166.77$ 1,143.42$ 1,120.72$ 1,099.36$ 1,078.22$ 1,057.30$ 1,036.78$ 1,008.10$ 986.98$ 967.01$
Black Coal (HELE) 3,268.42$ 3,263.89$ 3,249.43$ 3,233.50$ 3,233.50$ 3,233.50$ 3,233.50$ 3,233.50$ 3,233.50$ 3,233.50$ 3,233.50$ 3,233.50$ 3,233.50$

70
NEM structure in light of technology and policy changes
frontier economics
Figure 40: ISP projections of changes in plant mix
Source: AEMO ISP, p.38.

frontier economics
BRISBANE | MELBOURNE | SINGAPORE | SYDNEY
Frontier Economics Pty Ltd
395 Collins Street Melbourne Victoria 3000
Tel: +61 (0)3 9620 4488
www.frontier-economics.com.au
ACN: 087 553 124 ABN: 13 087 553