Poland: Equity Strategy 2016 - SII · Poland: Equity Strategy 2016 ... 2016 EQUITY STRATEGY AT A...
130
Poland: Equity Strategy 2016 Darkness before dawn Warsaw, December 7, 2015
Transcript of Poland: Equity Strategy 2016 - SII · Poland: Equity Strategy 2016 ... 2016 EQUITY STRATEGY AT A...

Poland: Equity Strategy 2016
Darkness before dawn
Warsaw, December 7, 2015

2
TABLE OF CONTENTS 1. 2016 EQUITY STRATEGY AT A GLANCE..................................................... 3 2. SUMMARY………………………………….…………………………………….... 4 3. DM BZ WBK MODEL PORTFOLIO………………………………..……........... 6 4. ROAD MAP………………………………………………………………………… 9 5. 2015 CALLS IN A REAR VIEW…………………………………………………. 16 6. EARNINGS OUTLOOK..……………………………………….….………..…… 18 7. TOP DOWN EARNINGS TRENDS…………………………………………….. 23 8. VALUATION……………………………………………………………………….. 27 9. APPENDICES……………………………………………………………...……… 33 10. PENSION FUNDS.…….…………………………………………………………. 41 11. MUTUAL FUNDS…………..………………………………………………….….. 49 12. INTEREST RATES…….…………………………………………………………. 52 13. FX EXPOSURE……………………………………………………………......….. 53 14. FOOD CPI……………………………………………………………………….…. 57 15. WAGES………………….………………………………………………………….. 58 16. PLN500+ SUBSIDY……………………………………………………………….. 59 17. RETAIL TAX……………………………………………………………………….. 60 18. GAS PRICES…………………………………………………………………….... 61 19. WEATHER…………………………………………………………………………. 62 20. DY PLAYS…………………………………………………………………………. 63 21. EU FUNDING……………………………………………………………………… 64 22. INVESTMENT CYCLE……………………………………………………………. 66 23. EXPORT………………………………………………………………………….... 68 24. COMMODITY CORNER………………………………………………………….. 72 25. SECTOR AND STOCK CALLS……………………………………………...….. 78
25.1. BANKS……………………………………………………………...………… 79 25.2. FINANCIAL SERVICES………………………………………………….…. 81 25.3. OIL & GAS……………………………………………………………………. 83 25.4. CHEMICALS…………………………………………………………...…….. 86 25.5. UTILITIES………………………………………………………………..…… 89 25.6. METALS & MINING…………………………………………….………..….. 92 25.7. CONSTRUCTION………………………………………………………...…. 94 25.8. HOUSING DEVELOPERS……………………………………………..…... 96 25.9. REAL ESTATE………………………………………………………...…….. 97 25.10. INDUSTRIALS……………………………………………………………..… 99 25.11. IT…………………………………………………………………………….... 104 25.12. TME……………………………………………………………...……………. 106 25.13. HEALTH CARE…………………………………………………..………….. 108 25.14. FMCG RETAIL…………………………………………………….………… 110 25.15. CLOTHING & FOOTWEAR RETAIL……………………………..……….. 116 25.16. PHARMA WHOLESALERS………………………………………..………. 121
26. DISCLAIMER………………………………………………………………..…….. 129

3
2016 EQUITY STRATEGY AT A GLANCE
YE 2016E WIG20 target: 2,158
YE 2016E mWIG40 target: 3,978
Top picks:
WIG30: Alior, Asseco PL, CD Projekt, Cyfrowy Polsat, Energa, ING BSK, mBank, Pekao, PKN Orlen, PKO BP, Synthos and Tauron.
AB, Ambra, Asseco SEE, Benefit Systems, Bytom, Ciech, Emperia, EuCO, Monnari , Paged, PCM, Polenergia and Trakcja.
Please note that no recommendations (incl. Target Prices & valuations) were altered in this document.
Positive Neutral Negative
PKO BP ▲ BZ WBK ▬ Handlowy ▼
Pekao ▲ PZU ▬ KGHM ▼
mBank ▲ Lotos ▬ JSW ▼
ING BSK ▲ Azoty ▬ PGNiG ▼
Alior ▲ CCC ▬ PGE ▼
PKN Orlen ▲ PKP Cargo ▬ Enea ▼
Synthos ▲ GTC ▬ Orange PL ▼
Tauron ▲ Kernel ▬ LPP ▼
Energa ▲ Boryszew ▬ Eurocash ▼
Asseco PL ▲
CD Projekt ▲
Cyfrowy Polsat ▲
WIG30
Positive Neutral Negative
Banks ▲Financials
services▬
Clothing &
Footwear▼
Oil & Gas ▲ Chemicals ▬ Utilities ▼
IT ▲ Telecom ▬ Metals & Mining ▼
Media ▲ Industry ▬ Pharmaceuticals ▼
Real Estate ▲Housing
developers▬
Construction ▲ FMCG retail ▬Video Games ▲ Healthcare ▬
Sector calls

4
SUMMARY 1/2 We are positive on Polish equities in 1H16. We believe that a combination of positive domestic and global factors will lift Polish equities. In Poland, the macro environment
should be stable. The dust should settle down once the new government changes managements of the state-owned names. The large caps already seem to have bad news
priced-in. Globally, our positive outlook is predicated on the assumption that EM equities will bounce back after the FED’s rate lift-off in mid-December. This should end the
USD rally, we think. Though this scenario could only materialise if the U.S. monetary tightening cycle were to be orderly. The FED’s use of words at its December meeting
will also be important. A less orderly move or an unexpected spike in inflation in the U.S. in 2H16 would sent the EM spiralling. Investors’ current positioning – crowded O/W
of Europe, U/W of the U.S. and, most importantly, the strong contrarian indicator, namely the extreme underweight positioning of investors in EMs - supports our view.
Finally, the divergence of monetary cycles on both sides of the Atlantic should do Poland no harm. In previous instances, European, particularly Germany equities typically
outperformed the US ones. As Poland is more correlated with European market, this is another good omen.
Our roadmap assumes an upward trajectory for all indices in 1H16 by, say, mid-May. A call on 2H16 is trickier than usual because volatility is likely to remain high and
‘short-termism’ rules among the equity investors. Most importantly, another (if not final) overhaul round of the pension fund system is scheduled for mid-2016. Depending on
its form and outcome, it could be the ‘black swan’ of 2016. A transfer of the pension funds’ equity holdings to a state-managed entity could trigger a significant sell-off in the
mid/small cap space. This would be particularly acute for names with high pension fund participation and a diversified shareholder base. This is why we anticipate a
correction in late spring/early summer. But we would hope that public to private transactions/de-listings, M&A and LBOs that would likely follow could lift the small/mid-cap
indices back up towards the year-end.
Our YE16 price target for WIG20 is at 2,158 points (16% upside implied) while for mWIG40 at 3,775 points (6% upside). These are based on our bottom up models. On
consensus TPs, respective upsides are similar for WIG20 (16%) and higher for mWIG40 (12%). Macro indicators, corporate earnings and share price performance remain
decoupled so we are no longer providing an EPS/DPS based WIG30 target model or a macroeconomic regression-based model for the WIG20 index.
Valuation. Our estimates place the WIG20 forward P/E at 13.7x (consensus: 11.2x) vs. 13.7x (13.9x) a year ago and close to its l-t average. A year ago, WIG20 P/E was
+1STD above the mean. The y/y P/E compression contrasted with the 12% EPS contraction in 2015E. mWIG40 is trading at forward a P/E of 16.7x (consensus: 12.3x)
above last year’s 15.7x (14.7x) and also close its l-t average. A year ago WIG40 was trading at just off +1STD above the mean.
Re-rating potential. If P/Es were to remain unchanged, the 5% index-weighted 2016E EPS contraction for WIG20 and 4% growth for mWIG40 would take indices down 5%
and up 4%, respectively. Additionally, we think that the indices could re-rate. This is because 1) P/Es did not follow the big drop in the 10Y bonds (RFR) over the last two
years, 2) inflation is set to rise in 2016E and higher inflation has historically been consistent with higher P/Es, 3) PEGs broke through the l-t uptrend and are easing and 4)
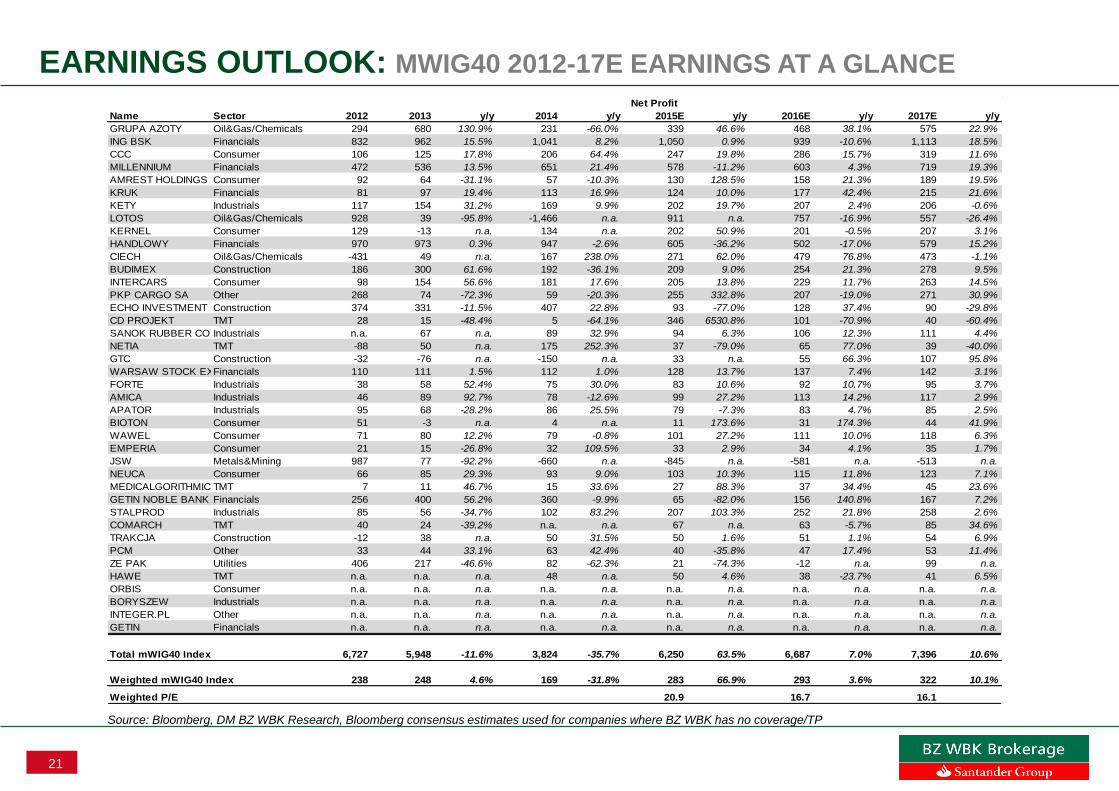
fair P/E is close to the actual one, while historically both indices had for most of the time been trading at a slight premium to their fair values. Finally, Poland is valued at a
discount to both its CEE peers, while the WIG20 P/E looks attractive in the EM context. What is more, it offers an attractive RFR-adjusted earning yield.
Equities vs. bonds. The ’great rotation’ still failed to materialise, but there was some ‘rotation’ in some markets. However, Polish equities remain exceptionally cheap
compared with bonds, with the EY of WIG20 at 9.0% and DY of 4.3% against the current 10YR T-bond yield of 2.9%.

5
SUMMARY 2/2 Earnings’ growth. We estimate that the combined WIG20 earnings will be down 10% y/y in 2016E, while the index-weighted earnings adjusted for Tauron and PGE down
5%. This is will follow the 52% growth in 2015E (103%). We expect Tauron, LPP and Alior to report the strongest earnings’ growth, while Orange, Energa and Enea will likely
see their earnings’ contracting the most. Combined earnings of consumer names are increase 35% y/y, those of financials by 4%. In contrast, O&G/Chemical and Metal &
Mining are to post y/y drop in earnings. Looking further out, 2017E should bring virtually no growth in aggregated earnings of the WIG20 constituents (banks and consumer
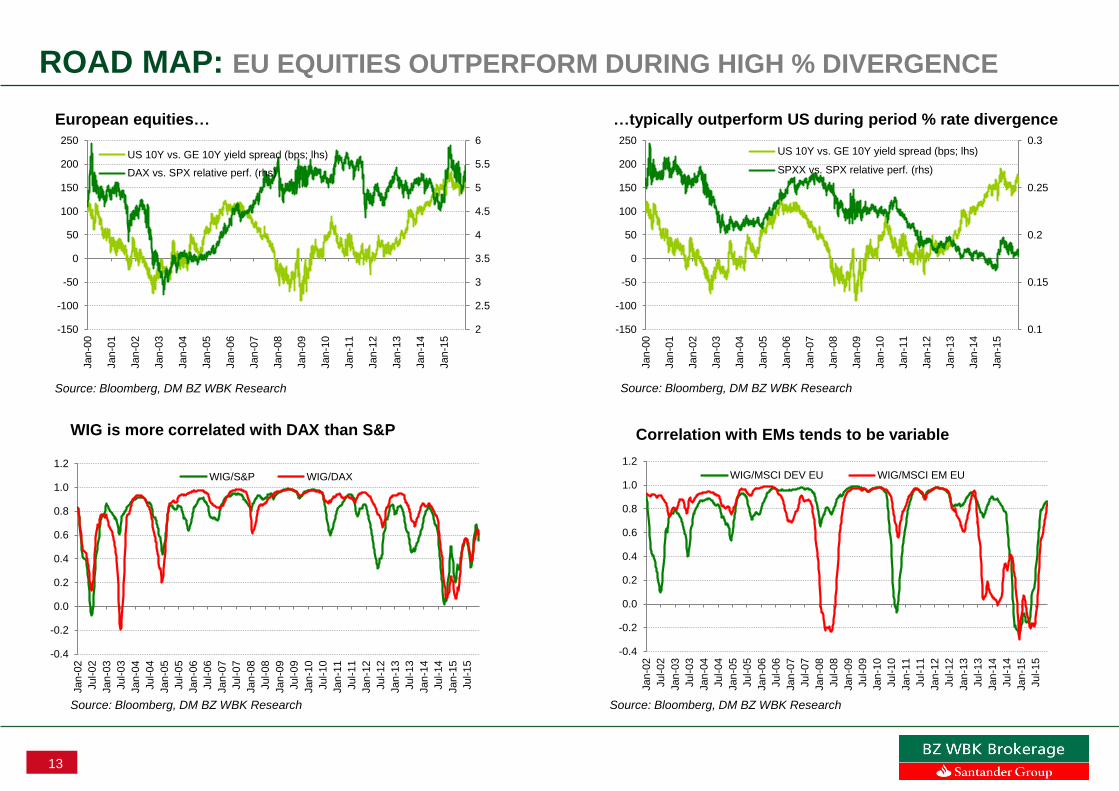
still up, but rest down y/y). Combined earnings of mWIG40 constituents are grow 7% in 2016E (4% index weighted) with CD Projekt, Hawe and PKP Cargo expected to
report the strongest y/y contraction.
Demand/supply. The imbalance is likely to stay. Pension funds will likely remain the net sellers of domestic equities (PLN 3.3bn net selling including exit from delisted
companies vs. net PLN 1.6bn net buying 2014 overall) as their foreign investment cap is to rise to 30% from the current 20% starting on January 1, 2016. At the same time,
mutual funds are unlikely to see major inflows into domestic equity funds unless the market enters a steady upward trajectory. Foreign inflows will probably also remain fickle
(net inflows of EUR 1.8bn in 9M15 after EUR 2.3bn inflows in 2014 overall). The supply of shares (IPOs, ABBs, block placements) should rise if markets turn north.
Macro. GDP growth was in a healthy 3-4% range throughout 2015, roughly in line with our economists’ expectations. They expect a similar growth rate in 2016, driven by
three engines: exports, investments and consumption. Deflation, which proved more stubborn in 2015 than had been expected, will probably be gone for good in 1Q16. 2016
should be a year of lower interest rates (new MPC in 1Q16) and a higher fiscal deficit (amendments to the 2015 and 2016 budgets). This policy-mix could offer domestic
demand a short-term boost, but it would lead to bigger economic imbalances in the medium term (current account deficit and inflation).
Themes. Starting from local punters, a lowered retirement age would mean incremental cash transfer out to ZUS totalling PLN 3.2bn in year one and PLN 2bn p.a. in
subsequent years. This would make them structural net sellers of equities. If the worst case system’s overhaul takes place, 22% Warsaw stock market’s capitalisation (and
36% of WIG20’s free float, 61% of mWIG40 and 44% of sWIG80) would be transferred to a state controlled entity(s). Other key themes to play in 2016 are: 1) further cut of
interest rates (Magellan, Presco, Kruk, ZE PAK, Polenergia, Tauron, Cyfrowy Polsat, Orange Polska, Pelion, Echo Investment, Voxel and IT distributors provide best
exposure, we think), 2) FX movements (should USD strengthen further position in O&G, global IT names like Asseco Poland or LiveChat and game developers), 3) rising
food CPI (Eurocash and Emperia), 4) wage growth (bad for a long list of names starting from Pelion, Unibeb or Emperia), 5) PLN 500 subsidy per child (consumer names
obviously), 6) retail tax (all usual suspects though Emperia and Gino Rossi could suffer relatively more), 7) lower gas prices (Grupa Azoty, Azoty Pulawy, Azoty Police, PKN
and Lotos would benefit, PGNiG would suffer), 8) weather changes, e.g. the forecast warm 2016 winter and hot& humid 2016 overal (lots of implications for various stocks),
9) State’s drive for more cash from dividends (PKN Orlen the main source of the incremental PLN 1bn dividends targeted?), and finally plays on investment cycle and new
government’s incentives (a long list of beneficiaries) and the good old story of EU funding
Sector calls. Overweight: Banks, Oil&Gas, IT, Media, Real Estate, Construction, Video Games. Underweight: Metals & Mining, Utilities, Clothing & Footwear,
Pharmaceuticals. Neutral: Financial services, Chemicals, Telecom, Industry, Housing developers, FMCG retail, Healthcare.
Top picks in WIG30: PKO BP, Pekao, mBank, ING, Alior, PKN Orlen, Synthos, Tauron, Energa, Asseco PL, CD Projekt, Cyfrowy Polsat.
Small/mid-cap top picks: Ciech, Polenergia, Benefit Systems, Emperia, Paged, Trakcja, AB, Asseco SEE, PCM, Monnari, Bytom, EuCO, Ambra.

6
BZ WBK MODEL PORTFOLIO: WIG30 – MOST/LEAST PREFERRED NAMES
The company is the most expensive chemical stock in our coverage universe on its P/E multiple for 2016, how ever Grupa Azoty
should benefit from low gas prices next year. We thus are Neutral for the stock.
Synthos ▲
Azoty ▬
We have Neutral approach on Lotos. Even though the company should enjoy the strong macro in refining its exposure to USD-
denominated debt and heavy capex outlays should w eigh on its cash f low s and dividend potential. ▬
Chemicals
Alior ▲
Alior offers a unique combination of best EPS grow th in 2016E w ith a reasonable valuation. And there is potentially more valuation
upside in store given the potential signif icant M&A related one-offs (badw ill). The risk of the state interference through PZU (the to
be 25% shareholder) is exaggerated w e think and, if any, it seems more than priced in. The capital needs should in the short-term
be addressed by acquisition(s) of cheap but w ell-funded small banks and RWA optimisation. Finally, w ith fast rotating loan book
(c38% of the book matures in one year), odds of a high pass-through of the banking tax to customers are high.
ING BSK
PZU
KGHM
JSW
We are Positive for PKN as w e expect that strong dow nstream business, improved cash delivery and supportive FX markets
should drive stock share price in 2016
We are Negative on PGNiG as, despite the c26% share price drop in last month, progressive gas market liberalisation in Poland and
expected cuts in regulated gaas prices and returns in distribution are likely to w eigh on its earnings next year
▲
▼
PKN Orlen
KGHM w ill likely suffer not only from w eak metal prices, but also from the most unfortunate timing of the Sierra Gorda launch. This
investment kicked off in an environment of long-unseen low moly prices, triggering heavy quarterly losses. Last, but not least, the
idea of scrapping the extraction tax no longer seems to be on the cards for 2016. The lack of no changes in metal price trends
could quickly make KGHM resemble JSW, w hile the technical analysis suggests that a bear market rally in copper and silver is
possible, w hich w ould certainly trigger a bear market rally in KGHM’s share price in the coming months.
The company cannot repay its outsdanding PLN1.1bn in bonds, and it w ill also run short of cash for w ages in several months. We
disbelieve in coking coal / coke recovery in 2016, and zloty strengthening could expose the company's short-term liquidity further.
New issue of shares / convertible bonds, or acquistion by i.e. KGHM remain the only options.
▼
▼
Oil&Gas
PGNiG
Lotos
Synthetic rubber market fundamentals remain bearish, w hile unplanned stoppages at Litvinov should trim company's profitability in
2016. How ever w e strongly believe that decent DY at 6% should be supportive for company's share price at least in 1H16.
Strategic comments2016
view
Sector /
Company
Financials
Is not super cheap admittedly, but it should pay a dividend in 2016E (DY of 2.8%) and more importantly it is the best play on the
steepening yield curve. Also its retail fees are relatively low providing plenty of room for upw ard re-pricing. Finally, its capital needs
w ill be addressed by the just announced Tier-2 issuance.
Metals & Mining
Not covered
▲
▲
▬
▲
▲
▬
PKO BP
Pekao
BZ WBK
mBank
Not only is the cheapest on 2016 P/E (w indfall capital gains on Visa) but offers solid DY of 6.1% in 2016E. And look at its share
price chart!
As alw ays trades at a premium to peers. Its strong capital ratios at times of capital buffers being introduced look particularly
attractive to us. The bank is capable to signif icantly accelerate loan grow th if it opts to and as a result capture a signif icant market
share in the next year or tw o.
Not covered
Is cheap vs. peers on pretty much all counts. This is due to their high exposure to FX mortgages. But as w e believe that the
government w ill be pragmatic on the issue, w e think they offer near-term upside.Key to w atch w ould be w hether the government
w ould seek to compensate borrow ers for past excessive FX spreads charged by banks. mBank had charged relatively hefty
spreads and admittedly the damage could be signif icant.
Handlowy ▼
Has mediocre, to say the least, earnings outlook, and is the most expensive on multiples. Its corporate fees look fat compared to
competitors w hich may constrain its ability to pass the tax to corporate customers. Retail fees seem low in contrast and w e make a
leap of faith factoring a nearly 100% tax mitigation by YE18E. Sadly, it does not help earnings trajectory much.
Boryszew
Eurocash’s surging share price in 2015 has made it expensive. Eurocash is currently trading w ith a FY’16 PE of 28x and an
EV/EBITDA of 14x, w hich implies eye-striking premiums to its CEEMEA competitors. Eurocash also looks overvalued vs. Jeronimo
Martins. This is unjustif ied, in our view .
We believe CCC’s valuation to be more attractive follow ing it recent share price correction vs. LPP, even though most of the risks
for CCC’s business performance are pretty much the same as for LPP.
▬
▬
We still believe the near-term railw ay cargo outlook to be uninspiring, though, in the long term w e are positive on the stock. The
investment cycle should bring in a revival of volumes in the aggregate and building material segments. Beyond that, expansion
abroad should allow for client and contract diversif ication. What is important, there are some political risks involved, w hich might put
PKP Cargo’s share price under pressure.
Not covered
PKP Cargo
GTC ▬ Not covered
Kernel ▬ Not covered
▲
Orange PL
Cyfrowy Polsat
Core business remains under pressure, and new regulator no longer is w illing to cancel mobile frequencies' tender - PLN3bn
payment and Net Debt / EBITDA at 2.0x seem certain. We see no short-term upside to proposed DPS at PLN0.25 (DY 3.9%), w hile
potential 2016 mergers at the Polish market may undermine Orange's business further.
Cyfrow y Polsat remain our TMT top pick. In 2016 company should benefit from mobile ARPU stablilisation, also cost synergies
should be visible, w hile debt refinancing should allow for material interest savings.
Asseco PL ▲
We suggest to O/W Asseco Poland on expected earnings improvement. Company is a play for tenders in public segment co-
financed by EU. On top of that, Asseco Poland generates stable and high FCF, w hich allow s it to maintain its high dividend payout.
In 2016, w e expect a DPS of PLN3 (5.2% yield).
CD Projekt ▲Company w ill be cashing in on the success of The Witcher 3, in 2016 company should generate over PLN100mn in net earnings.
Sell-ins should exceed 10mn units. Compared to its Western peers company is trading w ith a discount.
▼
TMT
We see 2016 EBITDA dow n 21% on w eak generation and a lack of positive one-offs. We do not rule out another round of heavy
w rite-offs in 2016, and w e are concerned that the largest Polish generation player w ill be most likely involved in value-destructive
support for mines and potential construction of new fossil-fueled capacity. Investors should avoid lignite exposure, in our view .
Tauron’s rapidly-grow ing net debt represents a mid-term threat, and a Treasury-dedicated single-digit dilutive share issue is still on
the cards. We also modelled in a PLN1.5bn non-cash 4Q15E w rite-off, w hich is likely to be a short-term mood spoiler. How ever, w e
also expect strong support from the Operating Reserve Mechanism (ORM), a solid long-term distribution contribution, potential
additional free CO2 certif icates and likely capex / opex cuts, w hich should prevent any deeper share price erosion. We believe
Tauron is least exposed to being forced to subsidise mines and is likely to team up w ith another Treasury-controlled company,
PGNiG
We expect Energa to suffer a 19% EBITDA decline in 2016E. We see no further fundamental draw backs after that, but its exposure
to regulatory decisions remains very high. We also w e see a reasonable risk of the government cancelling Energa’s current stable,
high dividend for the sake of funding investment in construction at Ostroleka. This could undermine the company’s long-term outlook
The recent Bogdanka acquisition should keep the company’s EBITDA flat y/y in 2016, but the accompanying burdens of new debt,
the miner’s provisions and minorities are likely to take ENEA’s net debt to EBITDA to 3.0x as soon as 2016E. We strongly dislike the
company’s sw itch from variable coal costs to fixed ones. We see ENEA at risk of acquiring KHW and/or building a 1GW unit at
Ostroleka
PGE
Tauron
Energa
Enea
▼
▲
▲
▼
Consumers
Other
Eurocash
CCC
▼
▬
LPP ▼
LPP should struggle w ith a notable revival of sales due to the tough market environment, w hich should also prevent any price
increases. On the same note, LPP w ill f ind it diff icult to push further pressure on costs from the strong USD and rising w ages onto
the consumer. All of these is paired w ith PE16 at 29x, makes us assign an Underw eight rating to the stock.
Sector /
Company
2016
viewStrategic comments
Utilities

7
DM BZ WBK MODEL PORTFOLIO: SECTOR AND STOCKS VIEWS
SectorSector
viewTop picks
Top
shorts
Banks ▲ Alior, PKO BP GNB, BHW
Financials services ▬ EuCO, PCM -
Metals & Mining ▼ -Bogdanka,
JSW
Oil & Gas ▲ - -
Chemicals ▬ - -
Utilities ▼Polenergia,
Tauron, Energa
PGE, ZE
PAK
Telecom ▬Cyfrow y Polsat,
Midas
Orange
Polska
IT ▲
Asseco Poland,
Asseco SEE,
AB
ABC Data
Media ▲- -
Industry ▬ Paged
Real Estate ▲PHN -
Housing developers ▬- -
Construction ▲
Trakcja, Unibep
FMCG retail ▬Emperia, Ambra Eurocash
Clothing & Footwear ▼Bytom, Monnari
LPP, Gino
Rossi
Video Games ▲CD Projekt, CI
Games -
Healthcare ▬Voxel -
Pharmaceuticals ▼ -Neuca,
Farmacol
Sector comments
Visibility of 2016E earnings has improved and valuations became attractive after the recent sell-off.
We believe that ENEA’s successful call for a 66% stake in Bogdanka effectively erased any fundamental appeal of the latter, not to mention its suddenly w orse investability (FF, trading volume). With the
Upper Silesian mines steadily getting support, room for Bogdanka’s volumes may narrow (U/W). JSW has been in technical bankruptcy for several months now and w e expect it to be split up, acquired or
issue new shares ahead (U/W). Finally, KGHM w ill likely suffer not only from w eak metal prices, but also from the most unfortunate timing of the Sierra Gorda launch. This investment kicked off in an
environment of long-unseen low moly prices, triggering heavy quarterly losses. Last, but not least, the idea of scrapping the extraction tax no longer seems to be on the cards for 2016 (U/W).
Maintaining oil market imbalance is expected to remain in place next year, thus European refiners should experience another good year in 2016E. Sector cash flow s should be also supported by strong US$,
capex discipline and potential divestments.
Chemical companies should benefit from maintaining favourable USD/EUR rate and low gas prices. In our opinion expected earnings expansion is rather priced in current companies valuations.
EuCO’s DY outlook remains generous at 8.0% in 2016E and 9.5% in 2017E. There are three factors that underpin the improvement in the earnings outlook: 1) the value of the ongoing cases continues to rise
2) regulations concerning court proceedings are set to change next year in EuCO’s favour; 3) cases that account for the bulk of its book tend to end in out-of-court settlements, resulting in cash circulation.
And there is more good new s in store, w e think. The Romanian business should be consolidated in 2016 or 2017 at the latest. EuCocar, a new business line, should start in 2016E or 2017E and there is
another one in the pipeline.PCM’s valuation appears reasonable since, on our estimates, it trades at a 2015E P/E of 9x and YE15E P/Book 0.8x. A DY of nearly 10% is likely this year. And this is another
attractive side of the stock, w e reckon. Going forw ard, the focus w ill be on SMEs/micro-companies, further operating improvements in the service and remarketing segments and higher volumes of vehicles,
all of w hich should drive earnings’ grow th.
The fundamental recommendations suggest that double-digit upsides exist in case of Energa and Tauron, but our 2016 strategy is simple: investors should avoid the sector until the dust settles. Polish utilities
currently face a perfect storm, and the w orst scenario imaginable is rapidly becoming reality. Below w e list the key risk factors for the segment and its participants: (1) substantial EBITDA / net profit erosion;
(2) value-destructive mine acquisitions – already carried out and pending; (3) uncertainty over intra-sector mergers; (4) risk of being forced into construction of brand new fossil-fuelled capacity. And finally,
as if all the above w ere not enough to w eaken the sector for the foreseeable future, the Polish Energy Minister hinted in a press interview that utilities may not pay dividends if burdened w ith heavy
investments. Stable dividend f low represents the foundation of investing in utilities, and putting a question mark over them brings into question their share prices.
Aside from general risks, w e suggest avoiding lignite-exposed names (PGE and ZE PAK), in light of the pressure on electricity prices in the medium term. On the other hand, the renew able-skew ed & capex-
free Polenergia should outperform polluters, representing a play on rising CO2 certif icate prices.
We believe that 2016 should bring the long-aw aited flattening-out of ARPU and therefore top-line stabilisation in mobile telephony. Also M&A activity should play an important role in the Polish telecom universe
in the next few months.
In our view the IT sector w ill benefit from an improving business environment and higher IT spending. We think that IT companies should also see higher backlog levels in 2H16 thanks to new , EU co-funded,
major IT investments. Stable cash flow s, dividends and proven business quality even in tough times should support valuations of the softw are companies. Among IT distributors w e dislike ABC Data among
expected poor results dynamics in 2016.
Relatively good macro environment should translate into further improvement of ad market. We think Internet ads w ill traditionally record best dynamics, w e expect mid-single digit grow th in TV ads.
We do not expect any breakthrough in FY16. With respect to the economic environment, w e believe that export sales (our macro team forecasts +9.2% y/y) w ill remain an important catalyst of f inancial
performance. High capacity utilisation is a separate issue. Investment projects are under w ay, but their impact on 2016 should be limited (bigger in 2H16 and FY17). Finally, the political risk affecting PFs AuM
seems to be quite real.
The valuation of Polish real estate developers has become relatively attractive. The median P/NAV of 0.56x offers a discount of approx. 39% to the median for the peer group (w estern developers). History
w ould suggest that follow ing the recent expansion, the valuation divergence betw een PL and foreign names should narrow .
We have an Underw eight rating for the Clothing & Footw ear industry in 2016 due to the sector’s relatively high valuations and emerging risks, w hich should pressure both sales grow th and costs.
We maintain our Neutral stance on healthcare sector. We overw eight Voxel as the company that handles w ell on poor diagnostics market and offers potential upside on M&A story.
Unattractive relative valuations of the pharmaceutical sector vs. the WIG index, sound performance in the previous year make us prone to put an Underw eight stance on the sector.
We expect the 2016 volumes' grow th to be accomapnied w ith a margin stabilisation or its drop for the residential developers. We believe, how ever, that the valuation of the largest developers is an
unattractive entry point for investors at the moment.
The EU funds flow remians the key story for the sector. We expect EU funds to start taking effect this year (scheduled for 2014–2020), w hereas the outlook for 2017-19E is even more optimistic for
contractors, in our view , as EU funds’ allocation should accelerate further. Moreover, sector liquidity is improving. On top of that, the current valuation of construction stocks is not very demanding in light of
the expected healthy mid-term profit grow th.
The main trends that have been observed in the sector are set to continue next year w ith further market consolidation around the largest players. An industry should benefit from predicted rebound of food
inflation, how ever it w ill be not equal for all players. On the other hand, there is a risk of retail tax likely to be introduced in 2016.
2016 should be a rather calm year for CD Projekt, as the company plans no big releases or even announcements about Cyberpunk 2077. It w ill focus on the monetising proces of The Witcher 3. In contrast, CI
Games w ill likely be a hot stock, as it plans to release the next installment of its most recognisable franchise – Sniper - in 3Q16.

8
DM BZ WBK MODEL PORTFOLIO: SMALL/MID-CAPS HIGH CONVICTION 2016 CALLS
Ciech PLN4,522mn
Polenergia PLN1,176mn
Benefit Systems PLN1,070mn
Emperia PLN863mn
Paged PLN832mn
Trakcja PLN639mn
AB PLN567mn
Asseco SEE PLN514mn
PCM PLN403mn
Monnari PLN416mn
Bytom PLN227mn
EuCO PLN257mn
Ambra PLN187mn
Paged is well-positioned to further increase its top-line in the coming years. Paged ultimately launched its entire MIRROR plywood line. We reckon, however, that the output in FY15 will be miniscule (5-
8km3). The company will be able at one go to base its plywood production in c25% (starting from 2017 according to the company’s guidance) on coniferous wood (so far only broadleaved). The furniture
segment is being restructured which should finally lead to higher stabilization and predictability of the contribution to the consolidated financial figures. DTP and Europa Systems are perforoming well. The
former might be sold soon as Paged discloed recently it had confirmed entering into negotiations with a potential acquirer (probably PRA Group) what might lead to a higher value per share. The latter
should bring in approx. PLN82mn sales in FY15. Valuation is encouraging in our opinion.
We expect Ciech to continue to improve its earnings in 2016E due to favourable soda ash market environment, new soda capacities in Poland, low feedstock prices and the persistently strong US$ vs.
EUR. We expect company's EBITDA for 2016E and 2017E to PLN865mn (prev. PLN655mn) and to PLN851mn (prev. PLN669mn), respectively. Ciech will also likely benefit from a refinancing of its
existing high-yield debt. We expect Ciech’s interest expenses to drop 75% (or PLN80mn), which should substantially raise the company’s net profitability from 2016E onwards.
Ambra has relatively low valuation, that is EV/EBTIDA16 at c5.3x following the recent slide in the share price. Please note that Ambra generates a stable OCF (avg. conversion ratio at 0.8x), which, along
with the limited CAPEX, makes it possible to deliver an attractive FcF yield (11.5% in 2008-14 on average). This allows Ambra to pay an attractive DY at c. 5%. The company had recently also reported an
insider buying spree, which is a good omen, in our view.
Company Market cap. Rationale
PCM’s valuation appears reasonable since, on our estimates, it trades at a 2015E P/E of 9x and YE15E P/Book 0.8x. A DY of nearly 10% is likely this year. And this is another attractive side of the stock,
we reckon. Going forward, the focus will be on SMEs/micro-companies, further operating improvements in the service and remarketing segments and higher volumes of vehicles, all of which should drive
earnings’ growth.
EuCO’s DY outlook remains generous at 8.0% in 2016E and 9.5% in 2017E. There are three factors that underpin the improvement in the earnings outlook: 1) the value of the ongoing cases continues to
rise (PLN547mn in 3Q15, up 41% y/y) despite significant inflows from insurance companies (IC), 2) regulations concerning court proceedings are set to change next year in EuCO’s favour; 3) cases that
account for the bulk of its book tend to end in out-of-court settlements, resulting in cash circulation. And there is more good news in store, we think. The Romanian business should be consolidated in 2016
or 2017 at the latest. EuCocar, a new business line, should start in 2016E or 2017E and there is another one in the pipeline.
Emperia’s current market price values Stokrotka at c.2.4x monthly sales, which we believe to be too low when compared with the M&A transaction multiples on the FMCG market. Taking into account
Emperia’s other assets, namely its cash account at PLN90mn and PLN368mn for real estate, it significantly limits the downside in case the new tax turns out to be unfavourable, possibly shaving off c.10%
of the company’s EBITDA in the most pessimistic scenario.
Among the smaller names within the Clothing&Footwear sector, we prefer Monnari and Bytom, which should see further growth of demand for its products as well as selling space growth in 2016. Both
names are attractively valued at 2016 earnings.
1) Pure renewable player, with 147MW running in wind and 99MW under construction; some 1,000MW in new onshore windfarm sites ready for 1) development or 2) disposal; 2) The sole Polish utility with
EBITDA set to rise in 2016 y/y, likely by 14% in conservative scenario; 3) no investment outlays if not for potential new windfarms - VERY HIGH OPCF vs. MINIMAL CAPEX implies high dividend capacity
already in 2016; 4) New Renewable Law substantially trims supply of green certificates in Poland, likely trigering re-rating of green certificates' prices (currently at PLN100, in several years set to reach
PLN200-220); 5) positive exposure to CO2 price - the higher certificate price, the better for pollution-free Polenergia.
We expect 2017-18E should bring solid profit growth along with an expected rise in PKP PLK’s spending on railway track construction. FY16E earnings are likely to be flat y/y; not only this would be a
positive surprise for the market (a ‘transition’ year between the ‘old’ and the ‘new’ EU budgets year and temporary drop in profits is commonly expected) but also would make the company relatively cheap
vs. peers. Finally, Trakcja may, we think, decide to pay a dividend from 2015E earnings, which should we warmly welcomed by investors.
Company maintains 70-80k y/y growth in sport cards user base, holds unprecedented leader position in Poland an successfully expand its business model to new countries. Company reports strong
earnings dynamics and generated decent CF.
The cheapest IT distributor on P/E and EV/EBITDA, the most conservative business model, lowest SG&A/sales, offers the best earnings dynamics in tyhe sector, has biggest exposure outside Poland.
Strong results momentum, improving macro situation in the SEE countries. Moreover, the company could benefit from cash inflows from the EU’s new budget perspective. Depending on the M&A activity,
good cash generation and lower CAPEX in the upcoming quarters could allow for a higher dividend payout.

9
ROAD MAP:
Rebound of equities post FED’s lift-off on Dec 15th
Financials (bad news in the price) and commodity exporters should drive the rally
The upward trajectory may terminate if negative news flow on new overhaul of pension
funds intensifies (late spring?); preparatory activity (poison pills, LBOs) at private held
companies starts
Small/mid cap indices would underperform significantly; WIG30 should outperform in
contrast to 2014
Our bottom up YE16 target for WIG20 is at 2,158 points (16% upside), for mWIG40 it is
at 3,775 points (6% upside)

10
ROAD MAP: UPWARD TRAJECTORY UNTIL LATE SPRING
Source: Bloomberg, DM BZ WBK Research
mWIG40: projected trajectory
Source: Bloomberg, DM BZ WBK Research
WIG20: projected trajectory We are assuming a rebound of equity indices post FED’s lift-off; this
should be driven by financials (bad news in the price) and commodity
exporters (stabilising/weakening USD impact)
Following the changes at helms of the largest State exposed names
situation should return to normal in 1Q16
News flow regarding another, perhaps final, overhaul of the 2nd pillar
pension funds will be the key determinant of market’s performance in
2H16; a consolidation of pension funds holdings in State’s hands
would hit mid-cap the most; WIG30 should be relatively less impacted
as foreign strategic investor owned names (banks) and State owned
companies dominate
1,700
1,800
1,900
2,000
2,100
2,200
2,300
2,400
2,500
2,600
2,700
Jan
-13
Mar-
13
May-1
3
Jul-1
3
Se
p-1
3
Nov-1
3
Jan
-14
Mar-
14
May-1
4
Jul-1
4
Se
p-1
4
Nov-1
4
Jan
-15
Mar-
15
May-1
5
Jul-1
5
Se
p-1
5
Nov-1
5
Jan
-16
Mar-
16
May-1
6
Jul-1
6
Se
p-1
6
Nov-1
6
WIG20 Index Y16 Road Map
2,700
2,900
3,100
3,300
3,500
3,700
3,900
Jun
-13
Au
g-1
3
Oct-
13
Dec-1
3
Fe
b-1
4
Ap
r-14
Jun
-14
Au
g-1
4
Oct-
14
Dec-1
4
Fe
b-1
5
Ap
r-15
Jun
-15
Au
g-1
5
Oct-
15
Dec-1
5
Fe
b-1
6
Ap
r-16
Jun
-16
Au
g-1
6
Oct-
16
Dec-1
6
mWIG40 Index Y16 Road Map

11
ROAD MAP: LIFT-OFF IS ALREADY PRICED IN
Source: Bloomberg, DM BZ WBK Research
US market expects orderly tigtening
Source: Bloomberg, DM BZ WBK Research
…and commodities suffered from the strong USD
Source: Bloomberg, DM BZ WBK Research
EM and PL equities…
Source: Bloomberg, DM BZ WBK Research
15
20
25
30
35
40
45
50
55
60
90%
95%
100%
105%
110%
115%
120%
125%
130%
135%
Jan
-14
Fe
b-1
4
Ma
r-1
4
Ap
r-14
Ma
y-1
4
Jun
-14
Jul-1
4
Au
g-1
4
Se
p-1
4
Oct-
14
Nov-1
4
Dec-1
4
Jan
-15
Fe
b-1
5
Ma
r-1
5
Ap
r-15
Ma
y-1
5
Jun
-15
Jul-1
5
Au
g-1
5
Se
p-1
5
Oct-
15
Nov-1
5
Dec-1
5
Fragile 5 FX Index (lhs) $ FRA 1x4 (rhs)
The lift-off is already priced into most EM FX and equities
60
70
80
90
100
110
120
130
100
150
200
250
300
350
400
450
500
Jan
-94
Dec-9
4
Nov-9
5
Oct-
96
Se
p-9
7
Au
g-9
8
Jul-9
9
Jun
-00
May-0
1
Ap
r-02
Mar-
03
Feb-0
4
Jan
-05
Dec-0
5
Nov-0
6
Oct-
07
Se
p-0
8
Au
g-0
9
Jul-1
0
Jun
-11
May-1
2
Ap
r-13
Mar-
14
Feb-1
5Commodity Index (lhs) US$ Trade Weighted Currency (%, rhs)
0.0
0.2
0.4
0.6
0.8
1.0
1.2
Dec-1
4
Ma
r-15
Jun
-15
Se
p-1
5
Dec-1
5
Ma
r-16
Jun
-16
Se
p-1
6
Dec-1
6
Reference rate
LIBOR 3M
FRA-implied LIBOR as of 4/12/15
90
95
100
105
110
115
120
125
13070
80
90
100
110
120
130
Jan
-14
Fe
b-1
4
Ma
r-14
Ap
r-14
Ma
y-1
4
Jun
-14
Jul-1
4
Au
g-1
4
Se
p-1
4
Oct-
14
Nov-1
4
Dec-1
4
Jan
-15
Fe
b-1
5
Ma
r-15
Ap
r-15
Ma
y-1
5
Jun
-15
Jul-1
5
Au
g-1
5
Se
p-1
5
Oct-
15
Nov-1
5
Dec-1
5
WIG (lhs) EM (lhs) DXY (rhs)

12
ROAD MAP: TIGHTENING MAY BRING A CORRECTION BUT IT SHOULD BE S-T
Source: Bloomberg, DM BZ WBK Research
… are positively correlated with US rates
Source: Bloomberg, DM BZ WBK Research
Polish equities …
Source: Bloomberg, DM BZ WBK Research
…but it is typically short-lived Correction typically follows the first rate hike…
90%
92%
94%
96%
98%
100%
102%
104%
106%
108%
1 6 11 16 21 26 31 36 41 46 51 56
days
Rates increase (1st) Jun 28, 2004
Rates increase (1st) Jun 29, 1999
Rates increase (1st) Feb 3, 1994
Source: Bloomberg, DM BZ WBK Research
60%
70%
80%
90%
100%
110%
120%
130%
140%
150%
0 2 4 6 8 10 12 14 16 18 20
months
Rates increase (1st) Jun 28, 2004
Rates increase (1st) Jun 29, 1999
Rates increase (1st) Feb 3, 1994
0.0
0.5
1.0
1.5
2.0
2.5
0
1
2
3
4
5
6
7
Jan
-00
Se
p-0
0
Ma
y-0
1
Jan
-02
Se
p-0
2
Ma
y-0
3
Jan
-04
Se
p-0
4
May-0
5
Jan
-06
Se
p-0
6
Ma
y-0
7
Jan
-08
Se
p-0
8
Ma
y-0
9
Jan
-10
Se
p-1
0
Ma
y-1
1
Jan
-12
Se
p-1
2
Ma
y-1
3
Jan
-14
Se
p-1
4
Ma
y-1
5
US 10Y bonds (lhs)
US interest rates (lhs)
WIG20 Index (rhs)
0.0
1.0
2.0
3.0
4.0
5.0
6.0
0
1
2
3
4
5
6
7
Jan
-00
Se
p-0
0
May-0
1
Jan
-02
Se
p-0
2
Ma
y-0
3
Jan
-04
Se
p-0
4
Ma
y-0
5
Jan
-06
Se
p-0
6
Ma
y-0
7
Jan
-08
Se
p-0
8
Ma
y-0
9
Jan
-10
Se
p-1
0
Ma
y-1
1
Jan
-12
Se
p-1
2
Ma
y-1
3
Jan
-14
Se
p-1
4
Ma
y-1
5
US 10Y bonds (lhs)
US interest rates (lhs)
mWIG40 Index (rhs)
13
ROAD MAP: EU EQUITIES OUTPERFORM DURING HIGH % DIVERGENCE
Source: Bloomberg, DM BZ WBK Research
European equities…
Source: Bloomberg, DM BZ WBK Research
WIG is more correlated with DAX than S&P
Source: Bloomberg, DM BZ WBK Research
…typically outperform US during period % rate divergence
0.1
0.15
0.2
0.25
0.3
-150
-100
-50
0
50
100
150
200
250
Jan
-00
Jan
-01
Jan
-02
Jan
-03
Jan
-04
Jan
-05
Jan
-06
Jan
-07
Jan
-08
Jan
-09
Jan
-10
Jan
-11
Jan
-12
Jan
-13
Jan
-14
Jan
-15
US 10Y vs. GE 10Y yield spread (bps; lhs)
SPXX vs. SPX relative perf. (rhs)
2
2.5
3
3.5
4
4.5
5
5.5
6
-150
-100
-50
0
50
100
150
200
250
Jan
-00
Jan
-01
Jan
-02
Jan
-03
Jan
-04
Jan
-05
Jan
-06
Jan
-07
Jan
-08
Jan
-09
Jan
-10
Jan
-11
Jan
-12
Jan
-13
Jan
-14
Jan
-15
US 10Y vs. GE 10Y yield spread (bps; lhs)
DAX vs. SPX relative perf. (rhs)
-0.4
-0.2
0.0
0.2
0.4
0.6
0.8
1.0
1.2
Jan
-02
Jul-0
2
Jan
-03
Jul-0
3
Jan
-04
Jul-0
4
Jan
-05
Jul-0
5
Jan
-06
Jul-0
6
Jan
-07
Jul-0
7
Jan
-08
Jul-0
8
Jan
-09
Jul-0
9
Jan
-10
Jul-1
0
Jan
-11
Jul-1
1
Jan
-12
Jul-1
2
Jan
-13
Jul-1
3
Jan
-14
Jul-1
4
Jan
-15
Jul-1
5WIG/S&P WIG/DAX
-0.4
-0.2
0.0
0.2
0.4
0.6
0.8
1.0
1.2
Jan
-02
Jul-0
2
Jan
-03
Jul-0
3
Jan
-04
Jul-0
4
Jan
-05
Jul-0
5
Jan
-06
Jul-0
6
Jan
-07
Jul-0
7
Jan
-08
Jul-0
8
Jan
-09
Jul-0
9
Jan
-10
Jul-1
0
Jan
-11
Jul-1
1
Jan
-12
Jul-1
2
Jan
-13
Jul-1
3
Jan
-14
Jul-1
4
Jan
-15
Jul-1
5
WIG/MSCI DEV EU WIG/MSCI EM EU
Correlation with EMs tends to be variable
Source: Bloomberg, DM BZ WBK Research

14
ROAD MAP: BOTTOM UP YE16 TARGET FOR WIG20 @ 2,158
Bottom up YE16 price target for WIG20
Source: Bloomberg, DM BZ WBK Research, * consensus
TPs where BZ WBK does not have a valid price target
Target prices for WIG20 constituents
Company Last price (PLN)Weight in
index (%)
Price target
(consensus)
Upside /
downside
Price target
(BZ WBK)*
Upside /
downside
PKOBP 25.8 13.8 30.4 18% 31.0 20%
PZU 35.6 12.4 41.4 16% 41.4 16%
PKN ORLEN 66.3 12.8 71.2 7% 72.0 9%
PEKAO 139.8 11.4 158.3 13% 156.0 12%
PGE SA 13.4 6.5 16.3 22% 11.5 -14%
KGHM 66.5 5.7 96.0 44% 96.0 44%
PGNIG 5.0 5.1 5.8 15% 5.8 15%
LPP 6624.4 5.3 7111.0 7% 9211.4 39%
BZWBK 274.5 5.2 302.0 10% 302.0 10%
CYFRPLSAT 23.9 3.2 27.5 15% 32.0 34%
ORANGE POLSKA SA 6.5 2.6 7.1 11% 6.4 -1%
ASSECOPOL 57.2 2.7 66.6 16% 65.5 14%
EUROCASH 54.6 2.7 43.0 -21% 39.8 -27%
ALIOR BANK SA 65.3 2.2 90.3 38% 87.0 33%
MBANK SA 302.9 2.4 362.4 20% 346.0 14%
TAURONPE 2.6 1.7 3.3 26% 3.5 34%
ENERGA SA 12.0 1.5 18.4 53% 17.5 46%
ENEA 11.4 1.5 15.2 34% 12.0 6%
SYNTHOS 3.6 1.1 4.0 11% 4.5 24%
BOGDANKA 40.8 0.3 50.4 24% 27.9 -32%
Source: Bloomberg, DM BZ WBK, *Bloomberg consensus estimates for companies where BZ WBK currently has no TP
Last price 1,868
Target index level (cons.) 2,174
Upside/downside 16.4%
Target index level (BZ WBK)* 2,158
Upside/downside 15.5%

15
ROAD MAP: BOTTOM UP YE16 TARGET FOR WIG40 @ 3,775
Bottom up YE16 price target for mWIG40
Source: Bloomberg, DM BZ WBK Research, * consensus
TPs where BZ WBK does not have a valid price target
Target prices for mWIG40 constituents
Last price 3,550
Target index level (cons.) 3,978
Upside/downside 12.1%
Target index level (BZ WBK)* 3,775
Upside/downside 6.3%
Company Last price (PLN)Weight in
index (%)
Price target
(consensus)
Upside /
downside
Price target
(BZ WBK)*
Upside /
downside
GRUPA AZOTY 106.4 7.5 100.1 -6% 52.5 -51%
INGBSK 114.0 6.4 129.9 14% 139.0 22%
CCC SA 146.5 6.1 169.8 16% 193.7 32%
MILLENNIUM 5.1 5.3 6.4 27% 5.8 15%
AMREST HOLDINGS 197.0 4.9 207.4 5% 207.4 5%
KRUK SA 181.7 4.8 195.7 8% 85.2 -53%
KETY 283.0 4.6 275.1 -3% 340.0 20%
LOTOS 28.4 4.3 31.7 12% 32.0 13%
KERNEL 47.5 4.0 54.3 14% 54.3 14%
HANDLOWY 68.0 3.8 88.2 30% 67.0 -1%
CIECH 85.8 3.8 88.2 3% 100.0 17%
BUDIMEX 202.5 3.7 203.7 1% 223.0 10%
INTERCARS 249.9 3.6 258.6 3% 258.6 3%
PKP CARGO SA 63.7 3.0 78.8 24% 75.9 19%
ECHO 6.7 2.8 6.9 3% 7.1 6%
CD PROJEKT RED 22.8 2.5 33.2 45% 29.0 27%
ORBIS 61.5 2.3 62.5 2% 62.5 2%
SANOK RUBBER 52.5 2.2 62.4 19% 62.4 19%
NETIA 5.3 2.1 6.2 17% 5.7 8%
GTC 7.4 2.0 6.7 -9% 6.7 -9%
WSE 38.6 1.8 44.9 16% 44.9 16%
FORTE 54.5 1.5 57.8 6% 59.8 10%
AMICA 170.9 1.5 188.4 10% 200.0 17%
APATOR 31.3 1.4 34.0 9% 36.5 17%
PCM 33.9 0.7 44.7 32% 52.5 55%
WAWEL 1017.0 1.3 1335.6 31% 1335.6 31%
EMPERIA 65.2 1.2 72.9 12% 84.6 30%
JSW 12.2 1.1 10.4 -14% 8.5 -30%
NEUCA 334.9 1.1 365.3 9% 403.0 20%
MEDICALG SA 243.2 1.1 268.6 10% 285.0 17%
GETIN NOBLE BANK 0.5 1.1 0.9 67% 0.5 -11%
STALPROD 306.0 1.0 290.0 -5% 290.0 -5%
COMARCH 106.5 0.9 142.0 33% 142.0 33%
GETIN 1.0 0.6 2.4 139% 2.4 139%
TRAKCJA 12.4 0.8 12.8 3% 14.0 13%
ZE PAK 9.8 0.4 12.2 24% 9.7 -1%
INTEGERPL 67.5 0.6 n.a. n.a. n.a. n.a.
BIOTON 12.9 1.3 n.a. n.a. n.a. n.a.
BORYSZEW 4.8 0.8 n.a. n.a. n.a. n.a.
HAWE 0.8 0.1 n.a. n.a. n.a. n.a.
Source: Bloomberg, DM BZ WBK, *Bloomberg consensus estimates for companies where BZ WBK currently has no TP

16
2015 CALLS IN A REAR VIEW 1/2
Top shorts within sectors – performance ytd
Source: Reuters, DM BZ WBK Research
Top longs within sectors – performance ytd
Source: Bloomberg, DM BZ WBK Research
164%
-60%
-40%
-20%
0%
20%
40%
60%
80%
100%
120%
140%
160%
180%
BT
M
CIE
EU
C
TR
K
AC
E
AM
C
NE
U
BD
X
UN
I
EM
P
MO
N
EM
T
TV
N
AB
S
PG
D
AC
P
AB
E
KT
Y
CP
S
FC
L
EC
H
ALR
SN
T
PC
M
PH
N
GR
I
MIL
AC
T
MB
K
EN
G
LW
B
ZE
P
Relative performancevs. WIG
Average relativeperformance vs. WIG
-40%
-30%
-20%
-10%
0%
10%
20%
30%
40%
50%
60%
70%
80%
PE
L
BH
W
JS
W
PG
E
OP
L
RO
N
LP
P
AB
C
CC
C
PG
N
AT
T
Relative performance vs. WIG
Sector
Tactical
position
Preferred
stock
Relative
performance
vs. WIG* (%)
Least-
preferred
stock
Relative
performance
vs. WIG* (%)
Banks Overweight ALR -6.8% BHW -20.0%MBK -29.7%MIL -29.5%
Metals & Mining Underweight LWB -44.6% JSW -18.0%Oil & Gas Neutral PGN 27.0%Chemicals Underweight CIE 110.8% ATT 77.5%Utilities Overweight ENG -32.1% PGE -15.7%
ZEP -48.6%TMT Neutral CPS 11.2% OPL -7.0%
TVN 34.8%IT Overweight ABS 33.3% ABC 16.3%
ACT -29.7%ABE 24.5%ACP 27.4%
Industry Neutral AMC 69.0%ACE 69.9%EMT 41.4%KTY 12.7%
Wood Neutral PGD 31.0%Financials services Neutral EUC 99.6%
PCM -16.7%Real Estate Overweight ECH 4.8%
PHN -23.4%Housing Developers Neutral RON 0.1%Construction Overweight TRK 73.0%
UNI 45.4%BDX 56.9%
FMCG Retail Neutral EMP 44.7%Clothing & Footwear Overweight BTM 163.9% LPP 1.5%
MON 43.5% CCC 21.5%GRI -26.2%
Healthcare Neutral SNT -7.6%Pharmaceuticals Overweight NEU 63.0% PEL -35.8%
FCL 5.9%

17
2015 CALLS IN A REAR VIEW 2/2
Our small and mid-caps picks vs. indices
Source: Reuters, DM BZ WBK Research
High conviction mid-cap calls – ytd and 1H15 performance
Source: Bloomberg, DM BZ WBK Research
Politics unexpectedly undermined performance of the majors
2 100
2 200
2 300
2 400
2 500
2 600
2 700
2 800
Jan
-13
Mar-
13
May-1
3
Jul-1
3
Se
p-1
3
Nov-1
3
Jan
-14
Mar-
14
May-1
4
Jul-1
4
Se
p-1
4
Nov-1
4
Jan
-15
Mar-
15
May-1
5
Jul-1
5
Se
p-1
5
Nov-1
5
Jan
-16
Mar-
16
WIG30 Index Y15 Road Map
Source: Reuters, DM BZ WBK Research
90%
95%
100%
105%
110%
115%
120%
125%
130%
Jan
-15
Jan
-15
Jan
-15
Fe
b-1
5
Fe
b-1
5
Ma
r-15
Ma
r-15
Ap
r-15
Ap
r-15
Ma
y-1
5
Ma
y-1
5
Jun
-15
Jun
-15
Jul-1
5
Jul-1
5
Jul-1
5
Au
g-1
5
Au
g-1
5
Se
p-1
5
Se
p-1
5
Oct-
15
Oct-
15
Nov-1
5
Nov-1
5
Dec-1
5
Small-caps model portfolio Mid-caps model portfolio
WIG Index sWIG80 Index
mWIG40 Index
-80%
-40%
0%
40%
80%
120%
160%
200%
BT
M
CIE
EU
C
AC
E
AM
C
NE
U
BF
T
EM
P
MO
N
PG
D
AB
E
FC
L
GR
I
YTD performance 6M performance

18
EARNINGS OUTLOOK:
WIG30 weighted 2016E earnings growth should be -5% y/y after +103% in 2015E
2017 should bring no growth
Tauron, LPP and Alior should show best growth in reported earnings, Orange, Energa
and Enea will be laggards
Our WIG30 2016E earnings are 7% above consensus, those for 2017E are 3% higher
Combined earnings of mWIG40 constituents are grow 7% in 2016E (4% index weighted)
with CD Projekt, Hawe and PKP Cargo expected to report the strongest y/y contraction.

19
EARNINGS OUTLOOK: WIG20 2012-17E EARNINGS AT A GLANCE
Source: Bloomberg, DM BZ WBK Research, Bloomberg consensus estimates used for companies where BZ WBK has no coverage/TP
Name Sector 2012 2013 y/y 2014 y/y 2015E y/y 2016E y/y 2017E y/y
PKO BP Financials 3,739 3,230 -13.6% 3,254 0.8% 2,601 -20.1% 3,241 24.6% 3,151 -2.8%
PKN ORLEN Oil&Gas/Chemicals 2,345 176 -92.5% -5,811 n.a. 4,501 n.a. 3,865 -14.1% 3,480 -10.0%
PZU Financials 3,397 3,366 -0.9% 3,101 -7.9% 2,524 -18.6% 2,625 4.0% 2,706 3.1%
PEKAO Financials 2,943 2,785 -5.4% 2,715 -2.5% 2,268 -16.5% 2,186 -3.6% 2,389 9.3%
PGE Utilities 3,644 3,954 8.5% 3,638 -8.0% 4,241 16.6% 2,926 -31.0% 2,446 -16.4%
KGHM Metals&Mining 4,803 3,259 -32.2% 2,698 -17.2% 3,081 14.2% 3,006 -2.4% 2,875 -4.4%
LPP Consumer 352 431 22.3% 480 11.3% 433 -9.8% 681 57.3% 836 22.9%
BZWBK Financials 1,462 1,825 24.8% 1,981 8.6% 2,219 12.0% 2,052 -7.5% 2,316 12.9%
PGNIG Oil&Gas/Chemicals 2,239 1,918 -14.3% 2,823 47.2% 3,025 7.1% 2,984 -1.3% 3,048 2.1%
CYFROWY POLSAT TMT 598 525 -12.2% 283 -46.2% 1,333 371.3% 1,127 -15.5% 1,158 2.8%
ASSECO POLAND TMT 371 306 -17.3% 358 17.0% 326 -9.1% 352 7.9% 357 1.5%
EUROCASH Consumer 250 221 -11.7% 190 -14.2% 271 43.0% 266 -1.9% 293 10.0%
ORANGE POLSKA TMT 855 275 -67.8% 520 89.3% 448 -14.0% 89 -80.1% -64 n.a.
MBANK Financials 1,197 1,206 0.8% 1,287 6.7% 1,320 2.6% 1,171 -11.3% 1,384 18.2%
ALIOR BANK Financials 61 228 271.9% 312 36.9% 299 -4.2% 377 26.2% 470 24.6%
TAURON Utilities 1,477 1,309 -11.3% 1,181 -9.8% 1,219 3.2% 650 -46.7% 648 -0.3%
ENEA Utilities 700 716 2.2% 908 26.9% 1,062 17.0% 653 -38.5% 604 -7.5%
ENERGA Utilities 440 789 79.4% 982 24.5% 919 -6.4% 520 -43.3% 548 5.4%
SYNTHOS Oil&Gas/Chemicals 586 417 -28.9% 357 -14.4% 422 18.3% 472 11.9% 483 2.3%
BOGDANKA Metals&Mining 289 329 13.9% 273 -17.2% 202 -25.8% 146 -27.6% 161 9.7%
Total WIG20 Index 31,748 27,265 -14.1% 21,530 -21.0% 32,715 51.9% 29,390 -10.2% 29,289 -0.3%
Weighted WIG20 Index 2,427 1,982 -18.3% 1,189 -40.0% 2,413 103.0% 2,297 -4.8% 2,260 -1.6%
Weighted P/E 12.1 13.7 10.8
Net Profit

20
EARNINGS OUTLOOK: WIG20 2012-17E EARNINGS BY SECTORS
Source: Bloomberg, DM BZ WBK Research
Source: Bloomberg, DM BZ WBK Research
Source: Bloomberg, DM BZ WBK Research
Index weighted sector earnings (PLNmn)
Earnings growth expected to be negative in 2016E Nominal earnings by sectors (PLNmn)
Sector
No. of
const. 2012 2013 y/y 2014 y/y 2015E y/y 2016E y/y 2017E y/y
Financials 6 12,799 12,639 -1.2% 12,650 0.1% 11,231 -11.2% 11,652 3.8% 12,416 6.6%
TMT 3 1,824 1,107 -39.3% 1,162 5.0% 2,107 81.3% 1,567 -25.6% 1,451 -7.4%
Industrials 0 0 0 n.a. 0 n.a. 0 n.a. 0 n.a. 0 n.a.
Consumer 2 603 652 8.2% 669 2.7% 704 5.1% 947 34.5% 1,129 19.2%
Utilities 4 6,261 6,768 8.1% 6,709 -0.9% 7,442 10.9% 4,749 -36.2% 4,246 -10.6%
Construction 0 0 0 n.a. 0 n.a. 0 n.a. 0 n.a. 0 n.a.
Oil&Gas/Chemicals 3 5,170 2,511 -51.4% -2,631 n.a. 7,948 n.a. 7,322 -7.9% 7,012 -4.2%
Metals&Mining 2 5,092 3,588 -29.5% 2,971 -17.2% 3,284 10.5% 3,153 -4.0% 3,036 -3.7%
Total WIG20 Index 31,748 27,265 -14.1% 21,530 -21.0% 32,715 51.9% 29,390 -10.2% 29,289 -0.3%
Net Profit
Sector
WIG20
weight 2012 2013 y/y 2014 y/y 2015E y/y 2016E y/y 2017E y/y
Financials 47.5% 6,073 5,997 -1.2% 6,003 0.1% 5,329 -11.2% 5,529 3.8% 5,891 6.6%
TMT 8.5% 154 94 -39.3% 98 5.0% 178 81.3% 133 -25.6% 123 -7.4%
Industrials 0.0% 0 0 n.a. 0 n.a. 0 n.a. 0 n.a. 0 n.a.
Consumer 7.9% 48 52 8.2% 53 2.7% 56 5.1% 75 34.5% 90 19.2%
Utilities 11.2% 700 756 8.1% 750 -0.9% 832 10.9% 531 -36.2% 475 -10.6%
Construction 0.0% 0 0 n.a. 0 n.a. 0 n.a. 0 n.a. 0 n.a.
Oil&Gas/Chemicals19.0% 984 478 -51.4% -501 n.a. 1,512 n.a. 1,393 -7.9% 1,334 -4.2%
Metals&Mining 5.9% 303 213 -29.5% 177 -17.2% 195 10.5% 187 -4.0% 180 -3.7%
Total WIG20 Index 8,261 7,590 -8.1% 6,580 -13.3% 8,102 23.1% 7,848 -3.1% 8,093 3.1%
Net Profit
-40.0%
-20.0%
0.0%
20.0%
40.0%
60.0%
2013 2014 2015E 2016E 2017E
Nominal WIG20 Net Profit y/y change
Weighted average WIG20 Net Profit y/y change
21
EARNINGS OUTLOOK: MWIG40 2012-17E EARNINGS AT A GLANCE
Source: Bloomberg, DM BZ WBK Research, Bloomberg consensus estimates used for companies where BZ WBK has no coverage/TP
Name Sector 2012 2013 y/y 2014 y/y 2015E y/y 2016E y/y 2017E y/y
GRUPA AZOTY Oil&Gas/Chemicals 294 680 130.9% 231 -66.0% 339 46.6% 468 38.1% 575 22.9%
ING BSK Financials 832 962 15.5% 1,041 8.2% 1,050 0.9% 939 -10.6% 1,113 18.5%
CCC Consumer 106 125 17.8% 206 64.4% 247 19.8% 286 15.7% 319 11.6%
MILLENNIUM Financials 472 536 13.5% 651 21.4% 578 -11.2% 603 4.3% 719 19.3%
AMREST HOLDINGS Consumer 92 64 -31.1% 57 -10.3% 130 128.5% 158 21.3% 189 19.5%
KRUK Financials 81 97 19.4% 113 16.9% 124 10.0% 177 42.4% 215 21.6%
KETY Industrials 117 154 31.2% 169 9.9% 202 19.7% 207 2.4% 206 -0.6%
LOTOS Oil&Gas/Chemicals 928 39 -95.8% -1,466 n.a. 911 n.a. 757 -16.9% 557 -26.4%
KERNEL Consumer 129 -13 n.a. 134 n.a. 202 50.9% 201 -0.5% 207 3.1%
HANDLOWY Financials 970 973 0.3% 947 -2.6% 605 -36.2% 502 -17.0% 579 15.2%
CIECH Oil&Gas/Chemicals -431 49 n.a. 167 238.0% 271 62.0% 479 76.8% 473 -1.1%
BUDIMEX Construction 186 300 61.6% 192 -36.1% 209 9.0% 254 21.3% 278 9.5%
INTERCARS Consumer 98 154 56.6% 181 17.6% 205 13.8% 229 11.7% 263 14.5%
PKP CARGO SA Other 268 74 -72.3% 59 -20.3% 255 332.8% 207 -19.0% 271 30.9%
ECHO INVESTMENT Construction 374 331 -11.5% 407 22.8% 93 -77.0% 128 37.4% 90 -29.8%
CD PROJEKT TMT 28 15 -48.4% 5 -64.1% 346 6530.8% 101 -70.9% 40 -60.4%
SANOK RUBBER CO Industrials n.a. 67 n.a. 89 32.9% 94 6.3% 106 12.3% 111 4.4%
NETIA TMT -88 50 n.a. 175 252.3% 37 -79.0% 65 77.0% 39 -40.0%
GTC Construction -32 -76 n.a. -150 n.a. 33 n.a. 55 66.3% 107 95.8%
WARSAW STOCK EXCFinancials 110 111 1.5% 112 1.0% 128 13.7% 137 7.4% 142 3.1%
FORTE Industrials 38 58 52.4% 75 30.0% 83 10.6% 92 10.7% 95 3.7%
AMICA Industrials 46 89 92.7% 78 -12.6% 99 27.2% 113 14.2% 117 2.9%
APATOR Industrials 95 68 -28.2% 86 25.5% 79 -7.3% 83 4.7% 85 2.5%
BIOTON Consumer 51 -3 n.a. 4 n.a. 11 173.6% 31 174.3% 44 41.9%
WAWEL Consumer 71 80 12.2% 79 -0.8% 101 27.2% 111 10.0% 118 6.3%
EMPERIA Consumer 21 15 -26.8% 32 109.5% 33 2.9% 34 4.1% 35 1.7%
JSW Metals&Mining 987 77 -92.2% -660 n.a. -845 n.a. -581 n.a. -513 n.a.
NEUCA Consumer 66 85 29.3% 93 9.0% 103 10.3% 115 11.8% 123 7.1%
MEDICALGORITHMICSTMT 7 11 46.7% 15 33.6% 27 88.3% 37 34.4% 45 23.6%
GETIN NOBLE BANK Financials 256 400 56.2% 360 -9.9% 65 -82.0% 156 140.8% 167 7.2%
STALPROD Industrials 85 56 -34.7% 102 83.2% 207 103.3% 252 21.8% 258 2.6%
COMARCH TMT 40 24 -39.2% n.a. n.a. 67 n.a. 63 -5.7% 85 34.6%
TRAKCJA Construction -12 38 n.a. 50 31.5% 50 1.6% 51 1.1% 54 6.9%
PCM Other 33 44 33.1% 63 42.4% 40 -35.8% 47 17.4% 53 11.4%
ZE PAK Utilities 406 217 -46.6% 82 -62.3% 21 -74.3% -12 n.a. 99 n.a.
HAWE TMT n.a. n.a. n.a. 48 n.a. 50 4.6% 38 -23.7% 41 6.5%
ORBIS Consumer n.a. n.a. n.a. n.a. n.a. n.a. n.a. n.a. n.a. n.a. n.a.
BORYSZEW Industrials n.a. n.a. n.a. n.a. n.a. n.a. n.a. n.a. n.a. n.a. n.a.
INTEGER.PL Other n.a. n.a. n.a. n.a. n.a. n.a. n.a. n.a. n.a. n.a. n.a.
GETIN Financials n.a. n.a. n.a. n.a. n.a. n.a. n.a. n.a. n.a. n.a. n.a.
Total mWIG40 Index 6,727 5,948 -11.6% 3,824 -35.7% 6,250 63.5% 6,687 7.0% 7,396 10.6%
Weighted mWIG40 Index 238 248 4.6% 169 -31.8% 283 66.9% 293 3.6% 322 10.1%
Weighted P/E 20.9 16.7 16.1
Net Profit

22
EARNINGS OUTLOOK: MWIG40 2012-17E EARNINGS BY SECTORS
Source: Bloomberg, DM BZ WBK Research
Source: Bloomberg, DM BZ WBK Research
Source: Bloomberg, DM BZ WBK Research
Index weighted sector earnings (PLNmn)
Earnings will contract in 2016E and rebound thereafter Nominal earnings by sectors (PLNmn)
Sector
No. of
const. 2012 2013 y/y 2014 y/y 2015E y/y 2016E y/y 2017E y/y
Financials 7 2,721 3,078 13.1% 3,224 4.8% 2,549 -20.9% 2,514 -1.4% 2,934 16.7%
TMT 5 -12 99 n.a. 243 144.0% 527 117.1% 304 -42.3% 250 -17.8%
Industrials 7 381 491 28.9% 598 21.7% 765 27.9% 853 11.5% 872 2.2%
Consumer 9 635 506 -20.2% 785 55.1% 1,031 31.3% 1,164 12.8% 1,296 11.3%
Utilities 1 406 217 -46.6% 82 -62.3% 21 -74.3% -12 n.a. 99 n.a.
Construction 4 516 593 14.9% 498 -16.0% 386 -22.5% 488 26.4% 529 8.5%
Oil&Gas/Chemicals 3 792 768 -2.9% -1,068 n.a. 1,520 n.a. 1,704 12.1% 1,606 -5.7%
Metals&Mining 1 987 77 -92.2% -660 n.a. -845 n.a. -581 n.a. -513 n.a.
Other 3 301 118 -60.8% 122 3.1% 296 143.0% 254 -14.0% 323 27.3%
Total mWIG40 Index 6,727 5,948 -11.6% 3,824 -35.7% 6,250 63.5% 6,687 7.0% 7,396 10.6%
Net Profit
Sector
WIG40
weight 2012 2013 y/y 2014 y/y 2015E y/y 2016E y/y 2017E y/y
Financials 23.8% 648 732 13.1% 767 4.8% 607 -20.9% 598 -1.4% 698 16.7%
TMT 6.6% -1 7 n.a. 16 144.0% 35 117.1% 20 -42.3% 17 -17.8%
Industrials 13.0% 50 64 28.9% 78 21.7% 99 27.9% 111 11.5% 113 2.2%
Consumer 25.8% 164 131 -20.2% 203 55.1% 266 31.3% 301 12.8% 335 11.3%
Utilities 0.4% 2 1 -46.6% 0 -62.3% 0 -74.3% 0 n.a. 0 n.a.
Construction 9.3% 48 55 14.9% 46 -16.0% 36 -22.5% 45 26.4% 49 8.5%
Oil&Gas/Chemicals15.6% 124 120 -2.9% -167 n.a. 237 n.a. 266 12.1% 251 -5.7%
Metals&Mining 1.1% 11 1 -92.2% -7 n.a. -9 n.a. -6 n.a. -6 n.a.
Other 4.3% 13 5 -60.8% 5 3.1% 13 143.0% 11 -14.0% 14 27.3%
Total mWIG40 Index 1,057 1,115 5.5% 942 -15.6% 1,284 36.4% 1,346 4.8% 1,471 9.3%
Net Profit
-60.0%
-40.0%
-20.0%
0.0%
20.0%
40.0%
60.0%
80.0%
2013 2014 2015E 2016E 2017E
Nominal mWIG40 Net Profit y/y change
Weighted average mWIG40 Net Profit y/y change

23
TOP DOWN EARNINGS TRENDS:
WIG20 2016/17E consensus EPS expectations remain in a donwtrend
LFL top line growth is sluggish for all major indices
EBIT of WIG20 and sWIG80 remains in an uptrend
Flattenning GDP growth outlook and the recent weakness of PMIs suggest downside
risk to EPS in the near-term
Performance of WIG20 and mWIG40 has in the past been only losely correlated with
EPS or EBIT performance; however recently this correlation has tightened

24
Source: Bloomberg, DM BZ WBK Research
EBIT growth in an uptrend at WIG20 & sWIG80
Source: Bloomberg, DM BZ WBK Research
WIG20 16/17E EPS expectations remain in a downtrend
Top line growth remains sluggish; CPS boosts mWIG*
Source: Bloomberg, DM BZ WBK Research, * old composition of mWIG40
Share price performance remains loosely correlated with EBIT growth
Source: Bloomberg, DM BZ WBK Research
-20%
-10%
0%
10%
20%
30%
40%
50%
60%
70%
1Q
11
2Q
11
3Q
11
4Q
11
1Q
12
2Q
12
3Q
12
4Q
12
1Q
13
2Q
13
3Q
13
4Q
13
1Q
14
2Q
14
3Q
14
4Q
14
1Q
15
2Q
15
3Q
15
WIG20 Index y/y mWIG40 Index y/y sWIG80 Index y/y
-60%
-35%
-10%
15%
40%
65%
90%
115%
140%
1Q
11
2Q
11
3Q
11
4Q
11
1Q
12
2Q
12
3Q
12
4Q
12
1Q
13
2Q
13
3Q
13
4Q
13
1Q
14
2Q
14
3Q
14
4Q
14
1Q
15
2Q
15
3Q
15
WIG20 Index y/y mWIG40 Index y/y sWIG80 Index y/y
-80%
-60%
-40%
-20%
0%
20%
40%
60%
80%
-300% -200% -100% 0% 100% 200% 300%
2015 P
rice y
td p
erf
orm
an
ce
EBIT y/y chng
TOP DOWN EARNINGS TRENDS: TOP LINE FLATTISH, EBIT GRINDING UP
150
160
170
180
190
200
210
150
160
170
180
190
200
210
Jan
-15
Fe
b-1
5
Ma
r-15
Ap
r-15
Ma
y-1
5
Jun
-15
Ju
l-1
5
Au
g-1
5
Se
p-1
5
Oct-
15
Nov-1
5
EPS fwd. Y15 vs. EPS fwd. Y16
2015E EPS
2017E EPS
2016E EPS

25
TOP DOWN EARNINGS TRENDS : DOWNSIDE RISKS EPS IN S-T?
Source: Bloomberg, DM BZ WBK Research
…imply 7% downside to current EPS expectations
Source: Bloomberg, DM BZ WBK Research
Flattening GDP growth implies little upside for EPS
PMIs…
Source: Bloomberg, DM BZ WBK Research
Market expectations are lagging the index by c7 months
Source: Bloomberg, DM BZ WBK Research
0
50
100
150
200
250
300
350
0
1,000
2,000
3,000
4,000
5,000
Jan
-04
Jul-0
4
Jan
-05
Jul-0
5
Jan
-06
Jul-0
6
Jan
-07
Jul-0
7
Jan
-08
Jul-0
8
Jan
-09
Jul-0
9
Jan
-10
Jul-1
0
Jan
-11
Jul-1
1
Jan
-12
Jul-1
2
Jan
-13
Jul-1
3
Jan
-14
Jul-1
4
Jan
-15
Jul-1
5
WIG20 Index (lhs) WIG20 Index (7m lag, lhs)
WIG20 Index EPS fwd. (rhs)
35
40
45
50
55
60
2,000
2,500
3,000
3,500
4,000
4,500
5,000
Jan
-05
Oct-
05
Jul-0
6
Ap
r-07
Jan
-08
Oct-
08
Jul-0
9
Ap
r-10
Jan
-11
Oct-
11
Jul-1
2
Ap
r-13
Jan
-14
Oct-
14
Jul-1
5
WIG est. EPS - 7m lag (lhs) Poland PMI (rhs)
0.0
1.0
2.0
3.0
4.0
5.0
6.0
7.0
8.0
9.0
0
1,000
2,000
3,000
4,000
5,000
Jan
-06
Jun
-06
Nov-0
6
Ap
r-0
7
Se
p-0
7
Fe
b-0
8
Jul-0
8
Dec-0
8
Ma
y-0
9
Oct-
09
Ma
r-10
Au
g-1
0
Jan
-11
Jun
-11
Nov-1
1
Ap
r-1
2
Se
p-1
2
Fe
b-1
3
Jul-1
3
Dec-1
3
Ma
y-1
4
Oct-
14
Ma
r-15
Au
g-1
5
WIG trailing 12m EPS (lhs) PL GDP y/y (rhs)
2,000
2,500
3,000
3,500
4,000
4,500
5,000
Dec-0
7
Se
p-0
8
Jun
-09
Mar-
10
Dec-1
0
Se
p-1
1
Jun
-12
Mar-
13
Dec-1
3
Se
p-1
4
Jun
-15
WIG est. EPS actual value
WIG est. EPS derived from PMI's regression

26
T-D EARNINGS TRENDS: EPS STARTS TO MATTER FOR SHARE PRICES
Source: Bloomberg, DM BZ WBK Research
…so that WIG20 became cheaper after the fall
Source: Bloomberg, DM BZ WBK Research
…and mWIG40 had been loosely correlated with EPS growth
…although it improved recently…
Source: Bloomberg, DM BZ WBK Research
Performance of both WIG20…
Source: Bloomberg, DM BZ WBK Research
2005
2006
2007
2008
2009
2010
2011
2012
20132014
2015
R² = 0.2384
-60%
-40%
-20%
0%
20%
40%
-20% 0% 20% 40% 60% 80%
Ind
ex p
erf
orm
an
ce
EPS change
2005
2006
2007
2008
2009
2010
2011
2012
2013
2014 2015
R² = 0.0876
-80%
-60%
-40%
-20%
0%
20%
40%
60%
80%
-40% -30% -20% -10% 0% 10% 20% 30%
Ind
ex
pe
rfo
rma
nc
e
EPS change
-80%
-40%
0%
40%
80%
120%
160%
Jan
-07
Jun
-07
Nov-0
7
Ap
r-08
Se
p-0
8
Feb-0
9
Jul-0
9
Dec-0
9
Ma
y-1
0
Oct-
10
Mar-
11
Au
g-1
1
Jan
-12
Jun
-12
Nov-1
2
Ap
r-13
Se
p-1
3
Fe
b-1
4
Jul-1
4
Dec-1
4
Ma
y-1
5
Oct-
15
P/E (y/y %) WIG20 (y/y %)
0
500
1,000
1,500
2,000
2,500
3,000
3,500
4,000
4,500
4
6
8
10
12
14
16
18
20
22
Jan
-04
Jul-0
4
Jan
-05
Jul-0
5
Jan
-06
Jul-0
6
Jan
-07
Jul-0
7
Jan
-08
Jul-0
8
Jan
-09
Jul-0
9
Jan
-10
Jul-1
0
Jan
-11
Jul-1
1
Jan
-12
Jul-1
2
Jan
-13
Jul-1
3
Jan
-14
Jul-1
4
Jan
-15
Jul-1
5
WIG20 P/E forward (lhs) WIG20 (rhs)
Source: Bloomberg, DM BZ WBK Research Source: Bloomberg, DM BZ WBK Research

27
VALUATION:
WIG20 is trading at forward P/E of 11.2x, mWIG40 at 12.3x on consensus expectations;
both metrics are close to their l-t averages
There appears to be a re-rating potential:
Over the last two years P/Es have not followed the big drop in 10Y bonds (RFR)
Higher inflation has historically been consistent with higher P/Es
PEGs broke through l-t uptrend and are easing
Fair P/E is close to actual one
Equities remain much cheaper than bonds with WIG20 offering DY of 4.3% vs. 10Y yield
of 2.8% while equities’ EY is at 9%
Following significant performance divergence between CEE markets, Poland is at a
slight discount to its neighbours
In contrast to MSCI EM, WIG20 forward P/E is just off its l-t average and offers
attractive RFR adjusted EY

28
VALUATION: AT L-T AVERAGE
Source: Bloomberg, DM BZ WBK Research
…and mWIG40 are close to their l-t averages P/Es for WIG20…
Source: Bloomberg, DM BZ WBK Research
6.0
8.0
10.0
12.0
14.0
16.0
18.0
Jul-0
5
Dec-0
5
May-0
6
Oct-
06
Mar-
07
Au
g-0
7
Jan
-08
Jun
-08
Nov-0
8
Ap
r-09
Se
p-0
9
Feb-1
0
Jul-1
0
Dec-1
0
May-1
1
Oct-
11
Mar-
12
Au
g-1
2
Jan
-13
Jun
-13
Nov-1
3
Ap
r-14
Se
p-1
4
Feb-1
5
Jul-1
5
WIG20 Indx. PE fwd LT Average
Avg. +1Std Avg. -1Std
5
10
15
20
25
Nov-0
5
Ap
r-06
Se
p-0
6
Fe
b-0
7
Jul-0
7
Dec-0
7
Ma
y-0
8
Oct-
08
Ma
r-09
Au
g-0
9
Jan
-10
Jun
-10
Nov-1
0
Ap
r-11
Se
p-1
1
Fe
b-1
2
Jul-1
2
Dec-1
2
Ma
y-1
3
Oct-
13
Ma
r-14
Au
g-1
4
Jan
-15
Jun
-15
Nov-1
5
WIG40 Indx. PE fwd LT Average
Avg. +1Std Avg. -1Std

29
VALUATION: RE-RATING POTENTIAL?
Source: Reuters, DM BZ WBK Research
PEG continues to improve
Source: Bloomberg, DM BZ WBK Research
Also inflation trends suggest room for P/E expansion
Fair P/E is close to the actual one after period of divergence
Source: Reuters, DM BZ WBK Research
The big drop in RFR has not been reflected in P/E
Source: Bloomberg, DM BZ WBK Research
-3.0%
-1.0%
1.0%
3.0%
5.0%
7.0%
5
7
9
11
13
15
17
Jul-0
5
Dec-0
5
Ma
y-0
6
Oct-
06
Ma
r-07
Au
g-0
7
Jan
-08
Jun
-08
Nov-0
8
Ap
r-09
Se
p-0
9
Fe
b-1
0
Jul-1
0
Dec-1
0
Ma
y-1
1
Oct-
11
Ma
r-12
Au
g-1
2
Jan
-13
Jun
-13
Nov-1
3
Ap
r-14
Se
p-1
4
Fe
b-1
5
Jul-1
5
WIG20 Index P/E fwd. Poland CPI YoY (%, reversed, rhs)
4
6
8
10
12
14
16
18
20
Jan
-03
Nov-0
3
Se
p-0
4
Jul-0
5
May-0
6
Mar-
07
Jan
-08
Nov-0
8
Se
p-0
9
Jul-1
0
May-1
1
Mar-
12
Jan
-13
Nov-1
3
Se
p-1
4
Jul-1
5
2
2.5
3
3.5
4
4.5
5
5.5
6
6.5
7
4%
6%
8%
10%
12%
14%
16%
18%
20%
Jul-0
5
Jan
-06
Jul-0
6
Jan
-07
Jul-0
7
Jan
-08
Jul-0
8
Jan
-09
Jul-0
9
Jan
-10
Jul-1
0
Jan
-11
Jul-1
1
Jan
-12
Jul-1
2
Jan
-13
Jul-1
3
Jan
-14
Jul-1
4
Jan
-15
Jul-1
5
WIG20 Index P/E fwd. Polish 10Y Bonds yield
0
4
8
12
16
20
24
Jan
-05
Oct-
05
Jul-0
6
Ap
r-07
Jan
-08
Oct-
08
Jul-0
9
Ap
r-10
Jan
-11
Oct-
11
Jul-1
2
Ap
r-13
Jan
-14
Oct-
14
Jul-1
5
WIG20 curr year P/E Fair WIG20 curr year P/E

30
KEY THEMES: EQUITIES CONTINUE TO BE CHEAPER THAN BONDS
Source: Reuters, DM BZ WBK Research
…which implies potential for significant performance
Source: Bloomberg, DM BZ WBK Research
This is consistent with positive returns from equities
Also EY is well above 10Y bond yield
Source: Reuters, DM BZ WBK Research
DY of WIG20 remains well above 10Y bond yield
Source: Bloomberg, DM BZ WBK Research
0%
1%
2%
3%
4%
5%
6%
7%
8%
Jan
-04
Jul-0
4
Jan
-05
Jul-0
5
Jan
-06
Jul-0
6
Jan
-07
Jul-0
7
Jan
-08
Jul-0
8
Jan
-09
Jul-0
9
Jan
-10
Jul-1
0
Jan
-11
Jul-1
1
Jan
-12
Jul-1
2
Jan
-13
Jul-1
3
Jan
-14
Jul-1
4
Jan
-15
Jul-1
5
Polish 10YR Bonds yield WIG20 dividend yield
2%
4%
6%
8%
10%
12%
14%
16%
Jan
-04
Jul-0
4
Jan
-05
Jul-0
5
Jan
-06
Jul-0
6
Jan
-07
Jul-0
7
Jan
-08
Jul-0
8
Jan
-09
Jul-0
9
Jan
-10
Jul-1
0
Jan
-11
Jul-1
1
Jan
-12
Jul-1
2
Jan
-13
Jul-1
3
Jan
-14
Jul-1
4
Jan
-15
Jul-1
5Polish 10YR Bonds yield WIG20 12M fwd earnings yield
-60%
-40%
-20%
0%
20%
40%
60%
80%
100%
-6.0%
-4.0%
-2.0%
0.0%
2.0%
4.0%
6.0%
8.0%
10.0%
Jan
-04
Jul-0
4
Jan
-05
Jul-0
5
Jan
-06
Jul-0
6
Jan
-07
Jul-0
7
Jan
-08
Jul-0
8
Jan
-09
Jul-0
9
Jan
-10
Jul-1
0
Jan
-11
Jul-1
1
Jan
-12
Jul-1
2
Jan
-13
Jul-1
3
Jan
-14
Jul-1
4
Jan
-15
Jul-1
5
Polish 10YR Bonds yield premium over WIG20 div yield
WIG20 12M fwd return (rhs)
-60%
-40%
-20%
0%
20%
40%
60%
80%
100%
-6%
-4%
-2%
0%
2%
4%
6%
8%
10%
Jan
-04
Jul-0
4
Jan
-05
Jul-0
5
Jan
-06
Jul-0
6
Jan
-07
Jul-0
7
Jan
-08
Jul-0
8
Jan
-09
Jul-0
9
Jan
-10
Jul-1
0
Jan
-11
Jul-1
1
Jan
-12
Jul-1
2
Jan
-13
Jul-1
3
Jan
-14
Jul-1
4
Jan
-15
Jul-1
5
12M fwd earnings yield premium over 10YR bonds yield (lhs)
WIG20 12M fwd return (rhs)
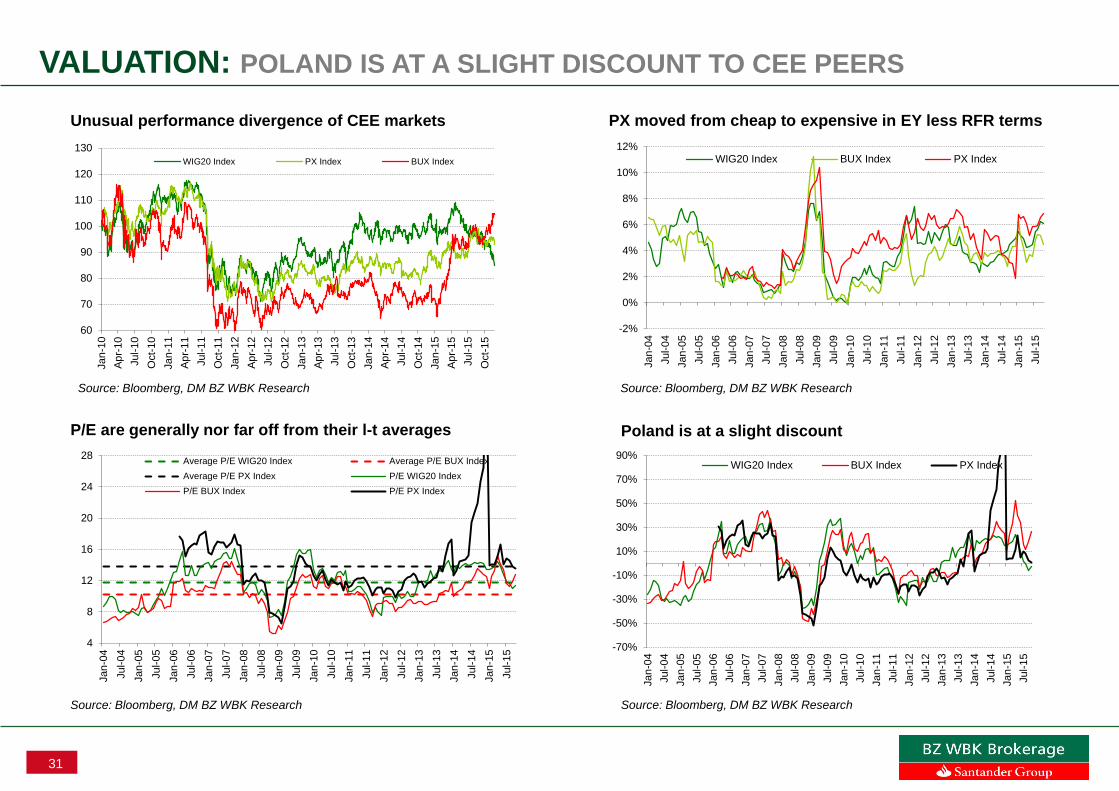
31
VALUATION: POLAND IS AT A SLIGHT DISCOUNT TO CEE PEERS
Source: Bloomberg, DM BZ WBK Research
Poland is at a slight discount
Source: Bloomberg, DM BZ WBK Research
PX moved from cheap to expensive in EY less RFR terms
P/E are generally nor far off from their l-t averages
Source: Bloomberg, DM BZ WBK Research
Unusual performance divergence of CEE markets
Source: Bloomberg, DM BZ WBK Research
-2%
0%
2%
4%
6%
8%
10%
12%
Jan
-04
Jul-0
4
Jan
-05
Jul-0
5
Jan
-06
Jul-0
6
Jan
-07
Jul-0
7
Jan
-08
Jul-0
8
Jan
-09
Jul-0
9
Jan
-10
Jul-1
0
Jan
-11
Jul-1
1
Jan
-12
Jul-1
2
Jan
-13
Jul-1
3
Jan
-14
Jul-1
4
Jan
-15
Jul-1
5
WIG20 Index BUX Index PX Index
-70%
-50%
-30%
-10%
10%
30%
50%
70%
90%
Jan
-04
Jul-0
4
Jan
-05
Jul-0
5
Jan
-06
Jul-0
6
Jan
-07
Jul-0
7
Jan
-08
Jul-0
8
Jan
-09
Jul-0
9
Jan
-10
Jul-1
0
Jan
-11
Jul-1
1
Jan
-12
Jul-1
2
Jan
-13
Jul-1
3
Jan
-14
Jul-1
4
Jan
-15
Jul-1
5
WIG20 Index BUX Index PX Index
4
8
12
16
20
24
28
Jan
-04
Jul-0
4
Jan
-05
Jul-0
5
Jan
-06
Jul-0
6
Jan
-07
Jul-0
7
Jan
-08
Jul-0
8
Jan
-09
Jul-0
9
Jan
-10
Jul-1
0
Jan
-11
Jul-1
1
Jan
-12
Jul-1
2
Jan
-13
Jul-1
3
Jan
-14
Jul-1
4
Jan
-15
Jul-1
5
Average P/E WIG20 Index Average P/E BUX Index
Average P/E PX Index P/E WIG20 Index
P/E BUX Index P/E PX Index
60
70
80
90
100
110
120
130
Jan
-10
Ap
r-10
Jul-1
0
Oct-
10
Jan
-11
Ap
r-11
Jul-1
1
Oct-
11
Jan
-12
Ap
r-12
Jul-1
2
Oct-
12
Jan
-13
Ap
r-13
Jul-1
3
Oct-
13
Jan
-14
Ap
r-14
Jul-1
4
Oct-
14
Jan
-15
Ap
r-15
Jul-1
5
Oct-
15
WIG20 Index PX Index BUX Index
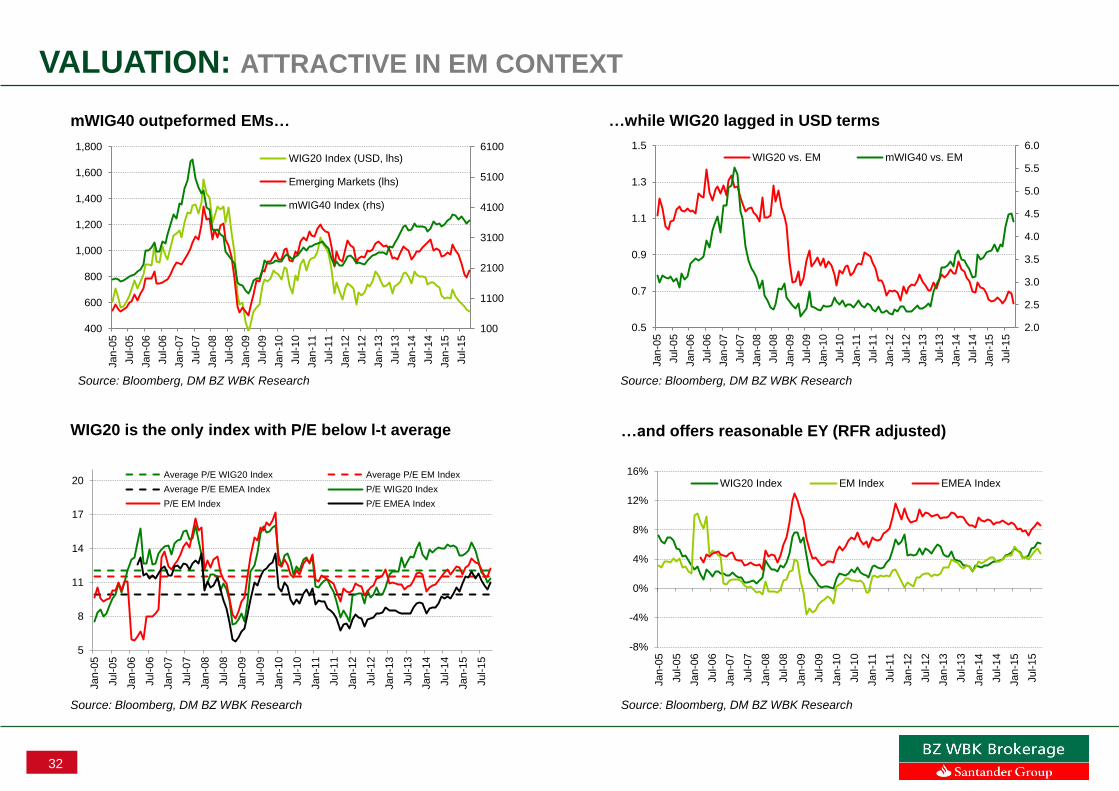
32
VALUATION: ATTRACTIVE IN EM CONTEXT
Source: Bloomberg, DM BZ WBK Research
…and offers reasonable EY (RFR adjusted)
Source: Bloomberg, DM BZ WBK Research
…while WIG20 lagged in USD terms
WIG20 is the only index with P/E below l-t average
Source: Bloomberg, DM BZ WBK Research
mWIG40 outpeformed EMs…
Source: Bloomberg, DM BZ WBK Research
100
1100
2100
3100
4100
5100
6100
400
600
800
1,000
1,200
1,400
1,600
1,800
Jan
-05
Jul-0
5
Jan
-06
Jul-0
6
Jan
-07
Jul-0
7
Jan
-08
Jul-0
8
Jan
-09
Jul-0
9
Jan
-10
Jul-1
0
Jan
-11
Jul-1
1
Jan
-12
Jul-1
2
Jan
-13
Jul-1
3
Jan
-14
Jul-1
4
Jan
-15
Jul-1
5
WIG20 Index (USD, lhs)
Emerging Markets (lhs)
mWIG40 Index (rhs)
2.0
2.5
3.0
3.5
4.0
4.5
5.0
5.5
6.0
0.5
0.7
0.9
1.1
1.3
1.5
Jan
-05
Jul-0
5
Jan
-06
Jul-0
6
Jan
-07
Jul-0
7
Jan
-08
Jul-0
8
Jan
-09
Jul-0
9
Jan
-10
Jul-1
0
Jan
-11
Jul-1
1
Jan
-12
Jul-1
2
Jan
-13
Jul-1
3
Jan
-14
Jul-1
4
Jan
-15
Jul-1
5
WIG20 vs. EM mWIG40 vs. EM
5
8
11
14
17
20
Jan
-05
Jul-0
5
Jan
-06
Jul-0
6
Jan
-07
Jul-0
7
Jan
-08
Jul-0
8
Jan
-09
Jul-0
9
Jan
-10
Jul-1
0
Jan
-11
Jul-1
1
Jan
-12
Jul-1
2
Jan
-13
Jul-1
3
Jan
-14
Jul-1
4
Jan
-15
Jul-1
5Average P/E WIG20 Index Average P/E EM Index
Average P/E EMEA Index P/E WIG20 Index
P/E EM Index P/E EMEA Index
-8%
-4%
0%
4%
8%
12%
16%
Jan
-05
Jul-0
5
Jan
-06
Jul-0
6
Jan
-07
Jul-0
7
Jan
-08
Jul-0
8
Jan
-09
Jul-0
9
Jan
-10
Jul-1
0
Jan
-11
Jul-1
1
Jan
-12
Jul-1
2
Jan
-13
Jul-1
3
Jan
-14
Jul-1
4
Jan
-15
Jul-1
5
WIG20 Index EM Index EMEA Index

33
APPENDICES

34
WIG20: 2016/17E EARNINGS: BZ WBK VS CONSENSUS 1/2
Source: Bloomberg, DM BZ WBK Research
Name Sector 2015E 2016E 2017E 2015E 2016E 2017E 2015E 2016E 2017E
PKO BP Financials 2,601 3,241 3,151 2,750 2,853 3,379 -5.4% 13.6% -6.7%
PKN ORLEN Oil&Gas/Chemicals 4,501 3,865 3,480 4,503 3,865 3,421 0.0% 0.0% 1.7%
PZU Financials 2,524 2,625 2,706 2,442 2,616 2,653 3.4% 0.4% 2.0%
PEKAO Financials 2,268 2,186 2,389 2,428 2,409 2,648 -6.6% -9.3% -9.8%
PGE Utilities 4,241 2,926 2,446 3,297 3,022 2,717 28.7% -3.2% -10.0%
KGHM Metals&Mining 3,081 3,006 2,875 1,811 1,326 1,181 70.1% n.a. n.a.
LPP Consumer 433 681 836 413 548 659 4.8% 24.2% 27.0%
BZWBK Financials 2,219 2,052 2,316 2,101 1,993 2,310 5.6% 3.0% 0.2%
PGNIG Oil&Gas/Chemicals 3,025 2,984 3,048 3,011 2,644 2,708 0.5% 12.9% 12.6%
CYFROWY POLSAT TMT 1,333 1,127 1,158 1,009 1,118 1,341 32.2% 0.8% -13.6%
ASSECO POLAND TMT 326 352 357 344 386 401 -5.1% -8.9% -10.9%
EUROCASH Consumer 271 266 293 226 280 328 20.0% -4.9% -10.6%
ORANGE POLSKA TMT 448 89 -64 327 126 203 36.9% -29.1% -131.7%
MBANK Financials 1,320 1,171 1,384 1,226 992 1,343 7.6% 18.0% 3.1%
ALIOR BANK Financials 299 377 470 363 450 520 -17.6% -16.1% -9.7%
TAURON Utilities 1,219 650 648 1,129 817 741 8.0% -20.5% -12.6%
ENEA Utilities 1,062 653 604 973 649 647 9.2% 0.6% -6.7%
ENERGA Utilities 919 520 548 827 637 682 11.1% -18.3% -19.6%
SYNTHOS Oil&Gas/Chemicals 422 472 483 373 438 518 13.2% 7.8% -6.7%
BOGDANKA Metals&Mining 202 146 161 181 99 140 11.8% 47.9% 14.8%
Total WIG20 Index 32,715 29,390 29,289 29,732 27,265 28,537 10.0% 7.8% 2.6%
Deviation
Net Profit
BZ WBK estimates Bloomberg estimates

35
WIG20: 2016/17E EARNINGS: BZ WBK VS CONSENSUS 2/2
Source: Bloomberg, DM BZ WBK Research
Source: Bloomberg, DM BZ WBK Research
Sector
No. of
const. 2015E 2016E 2017E 2015E 2016E 2017E 2015E 2016E 2017E
Financials 6 11,231 11,652 12,416 11,310 11,312 12,852 -0.7% 3.0% -3.4%
TMT 3 2,107 1,567 1,451 1,679 1,629 1,945 25.5% -3.8% -25.4%
Industrials 0 0 0 0 0 0 0 n.a. n.a. n.a.
Consumer 2 704 947 1,129 639 828 986 10.2% 14.4% 14.5%
Utilities 4 7,442 4,749 4,246 6,226 5,125 4,787 19.5% -7.3% -11.3%
Construction 0 0 0 0 0 0 0 n.a. n.a. n.a.
Oil&Gas/Chemicals 3 7,948 7,322 7,012 7,887 6,947 6,647 0.8% 5.4% 5.5%
Metals&Mining 2 3,284 3,153 3,036 1,992 1,425 1,321 64.8% 121.2% 129.8%
Total WIG20 Index 32,715 29,390 29,289 29,732 27,265 28,537 10.0% 7.8% 2.6%
Deviation
Net Profit
BZ WBK estimates Bloomberg estimates
BZ WBK estimates Bloomberg estimates
Sector
WIG20
weight 2015E 2016E 2017E 2015E 2016E 2017E 2015E 2016E 2017E
Financials 85.1% 9,554 9,913 10,562 9,621 9,624 10,934 -0.7% 3.0% -3.4%
TMT 8.5% 178 133 123 142 138 165 25.5% -3.8% -25.4%
Industrials 0.0% 0 0 0 0 0 0 n.a. n.a. n.a.
Consumer 7.9% 56 75 90 51 66 78 10.2% 14.4% 14.5%
Utilities 11.2% 832 531 475 696 573 535 19.5% -7.3% -11.3%
Construction 0.0% 0 0 0 0 0 0 n.a. n.a. n.a.
Oil&Gas/Chemicals31.8% 2,530 2,330 2,232 2,510 2,211 2,115 0.8% 5.4% 5.5%
Metals&Mining 5.9% 195 187 180 118 85 79 64.8% 121.2% 129.8%
Total WIG20 Index 13,345 13,169 13,662 13,139 12,696 13,906 1.6% 3.7% -1.8%
Deviation
Net Profit

36
MWIG40: 2016/17E EARNINGS: BZ WBK VS CONSENSUS 1/2
Source: Bloomberg, DM BZ WBK Research
Name Sector 2015E 2016E 2017E 2015E 2016E 2017E 2015E 2016E 2017E
GRUPA AZOTY Oil&Gas/Chemicals 339 468 575 592 705 638 -42.6% -33.6% -9.8%
ING BSK Financials 1,050 939 1,113 1,147 982 1,192 -8.4% -4.3% -6.7%
CCC Consumer 247 286 319 264 314 348 -6.4% -9.1% -8.4%
MILLENNIUM Financials 578 603 719 648 563 710 -10.8% 7.1% 1.3%
AMREST HOLDINGS Consumer 130 158 189 131 158 196 -0.6% 0.2% -3.5%
KRUK Financials 124 177 215 186 211 212 -33.1% -16.1% 1.8%
KETY Industrials 202 207 206 202 203 215 0.0% 2.1% -4.2%
LOTOS Oil&Gas/Chemicals 911 757 557 578 686 611 57.5% 10.3% -8.8%
KERNEL Consumer 202 201 207 190 206 210 6.2% -2.3% -1.2%
HANDLOWY Financials 605 502 579 686 670 761 -11.8% -25.1% -24.0%
CIECH Oil&Gas/Chemicals 271 479 473 198 369 383 36.7% 29.7% 23.6%
BUDIMEX Construction 209 254 278 208 254 293 0.6% -0.1% -5.2%
INTERCARS Consumer 205 229 263 205 229 263 0.2% 0.1% 0.0%
PKP CARGO SA Other 255 207 271 223 235 267 14.5% -12.0% 1.4%
ECHO INVESTMENT Construction 93 128 90 102 148 178 -8.4% -13.2% -49.4%
CD PROJEKT TMT 346 101 40 507 141 42 -31.8% -28.3% -5.8%
SANOK RUBBER Industrials 94 106 111 94 106 113 0 0 0
NETIA TMT 37 65 39 18 51 71 103.1% 27.6% -45.0%
GTC Construction 33 55 107 33 60 118 -1.9% -8.7% -9.1%
WSE Financials 128 137 142 125 135 138 2.2% 1.7% 2.9%
FORTE Industrials 83 92 95 83 101 106 0.0% -8.6% -10.0%
AMICA Industrials 99 113 117 94 100 108 6.1% 13.5% 8.2%
APATOR Industrials 79 83 85 75 81 85 5.9% 2.3% 0.4%
BIOTON Consumer 11 31 44 11 31 44 0.0% 0.0% 0.0%
WAWEL Consumer 101 111 118 101 112 121 -0.8% -0.9% -2.5%
EMPERIA Consumer 33 34 35 47 50 50 -29.5% -31.7% -31.1%
JSW Metals&Mining -845 -581 -513 -935 -679 -432 -9.6% -14.5% 18.9%
NEUCA Consumer 103 115 123 101 113 122 1.7% 1.6% 0.8%
MEDICALGORITHMICSTMT 27 37 45 26 36 46 6.6% 2.5% -0.2%
GETIN NOBLE BANK Financials 65 156 167 289 226 298 -77.6% -31.1% -44.0%
STALPROD Industrials 207 252 258 216 279 267 -4.3% -9.8% -3.2%
COMARCH TMT 67 63 85 68 63 85 -1.5% 0.0% 0.0%
TRAKCJA Construction 50 51 54 51 45 53 -0.6% 12.5% 2.7%
PCM Other 40 47 53 42 47 48 -5.0% 0 0
ZE PAK Utilities 21 -12 99 98 85 123 -78.4% -114.7% -19.4%
HAWE TMT 50 38 41 50 38 41 0.0% 0.0% 0.0%
ORBIS Consumer n.a. n.a. n.a. n.a. n.a. n.a. n.a. n.a. n.a.
BORYSZEW Industrials n.a. n.a. n.a. n.a. n.a. n.a. n.a. n.a. n.a.
INTEGER.PL Other n.a. n.a. n.a. n.a. n.a. n.a. n.a. n.a. n.a.
GETIN Financials n.a. n.a. n.a. n.a. n.a. n.a. n.a. n.a. n.a.
Total mWIG40 Index 6,250 6,687 7,396 6,751 7,150 8,120 -7.4% -6.5% -8.9%
Deviation
Net Profit
BZ WBK estimates Bloomberg estimates

37
MWIG40: 2016/17E EARNINGS: BZ WBK VS CONSENSUS 2/2
Source: Bloomberg, DM BZ WBK Research
Source: Bloomberg, DM BZ WBK Research
Sector
No. of
const. 2015E 2016E 2017E 2015E 2016E 2017E 2015E 2016E 2017E
Financials 7 2,549 2,514 2,934 3,080 2,787 3,310 -17.2% -9.8% -11.4%
TMT 5 527 304 250 668 329 284 -21.2% -7.6% -12.1%
Industrials 7 765 853 872 764 869 893 0.1% -1.9% -2.4%
Consumer 9 1,031 1,164 1,296 1,050 1,212 1,352 -1.7% -3.9% -4.2%
Utilities 1 21 -12 99 98 85 123 -78.4% n.a. -19.4%
Construction 4 386 488 529 394 507 642 -2.1% -3.8% -17.5%
Oil&Gas/Chemicals 3 1,520 1,704 1,606 1,368 1,760 1,632 11.2% -3.2% -1.6%
Metals&Mining 1 -845 -581 -513 -935 -679 -432 -9.6% -14.5% 18.9%
Other 3 296 254 323 265 282 315 11.4% -9.8% 2.7%
Total mWIG40 Index 6,250 6,687 7,396 6,751 7,150 8,120 -7.4% -6.5% -8.9%
Deviation
Net Profit
BZ WBK estimates Bloomberg estimates
BZ WBK estimates Bloomberg estimates
Sector
WIG30
weight 2015E 2016E 2017E 2015E 2016E 2017E 2015E 2016E 2017E
Financials 23.8% 607 598 698 733 663 788 -17.2% -9.8% -11.4%
TMT 6.6% 35 20 17 44 22 19 -21.2% -7.6% -12.1%
Industrials 13.0% 99 111 113 99 113 116 0.1% -1.9% -2.4%
Consumer 25.8% 266 301 335 271 313 349 -1.7% -3.9% -4.2%
Utilities 0.4% 0 0 0 0 0 1 -78.4% n.a. -19.4%
Construction 9.3% 36 45 49 36 47 59 -2.1% -3.8% -17.5%
Oil&Gas/Chemicals15.6% 237 266 251 214 275 255 11.2% -3.2% -1.6%
Metals&Mining 1.1% -9 -6 -6 -10 -8 -5 -9.6% -14.5% 18.9%
Other 4.3% 13 11 14 11 12 14 11.4% -9.8% 2.7%
Total mWIG40 Index 1,284 1,346 1,471 1,399 1,438 1,596 -8.2% -6.4% -7.8%
Deviation
Net Profit

38
SECTORS: YTD PERFORMANCE 1/2
Source: Reuters, DM BZ WBK Research
2001 2002 2003 2004 2005 2006 2007 2008 2009 2010 2011 2012 2013 2014 YTD
WIG -14% -2% 44% 22% 37% 33% 12% -51% 46% 19% -19% 26% 8% 0% -7%
WIG 20 -25% -9% 33% 18% 39% 15% 8% -49% 32% 15% -19% 20% -7% -3% -17%
mWIG 40 5% -9% 35% 32% 30% 60% 10% -62% 56% 20% -24% 17% 30% 5% 4%
sWIG 80 -33% -23% 105% 68% 16% 120% 27% -57% 59% 10% -31% 23% 37% -16% 11%
Banks 16% 12% 8% 31% 33% 44% 12% -45% 34% 18% -17% 23% 21% -1% -26%
IT -31% -13% 36% -7% 3% 24% -1% -48% 36% -5% -16% 4% 22% 3% 19%
Construction -11% -11% 35% 25% 66% 124% 11% -49% 15% 7% -56% -31% 31% -4% 48%
Food -4% 46% 49% 23% 9% 48% -10% -59% 123% 48% -27% 5% -12% -23% 38%
Telecom -61% -31% 26% 27% 24% 2% 0% -14% 2% 13% 7% -21% -10% -6% -12%
Media n.a. n.a. n.a. n.a. 41% -1% 22% -47% 16% 26% -34% 8% 31% 13% 16%
Oil & Gas n.a. n.a. n.a. n.a. n.a. -17% 14% -48% 27% 26% -17% 39% -10% 5% 36%
Developers n.a. n.a. n.a. n.a. n.a. n.a. n.a. -74% 120% -6% -51% 10% 2% -10% 13%
Chemicals n.a. n.a. n.a. n.a. n.a. n.a. n.a. n.a. 72% 61% 6% 58% 21% -3% 46%
Energy n.a. n.a. n.a. n.a. n.a. n.a. n.a. n.a. n.a. n.a. -11% -3% -7% 22% -28%
Ukraine n.a. n.a. n.a. n.a. n.a. n.a. n.a. n.a. n.a. n.a. -32% -9% -24% -51% 61%
Basic materials n.a. n.a. n.a. n.a. n.a. n.a. n.a. n.a. n.a. n.a. -23% 79% -33% -13% -35%

39
SECTORS: YTD PERFORMANCE 2/2
Source: Reuters, DM BZ WBK Research
Non-cyclicals were best perfomers ytd, materials/banks the worst
Source: Bloomberg, DM BZ WBK Research
…food, construction and banks
Non-cyclicals underperformed 2015
Source: Reuters, DM BZ WBK Research
2015 brought a change of fortune for sWIG80
Source: Reuters, DM BZ WBK Research
60
80
100
120
140
160
180
Jan
-14
Mar-
14
May-1
4
Jul-1
4
Se
p-1
4
Nov-1
4
Jan
-15
Mar-
15
May-1
5
Jul-1
5
Se
p-1
5
Nov-1
5
Materials Industrials Cyclicals
Non-cyclicals Financials Technology
0.8
0.9
1.0
1.1
1.2
Jan
-14
Feb-1
4
Mar-
14
Ap
r-14
May-1
4
Jun
-14
Jul-1
4
Au
g-1
4
Se
p-1
4
Oct-
14
Nov-1
4
Dec-1
4
Jan
-15
Feb-1
5
Mar-
15
Ap
r-15
May-1
5
Jun
-15
Jul-1
5
Au
g-1
5
Se
p-1
5
Oct-
15
mWIG40 rebased (lhs) WIG20 rebased (lhs) sWIG80 rebased (rhs)
0.4
0.8
1.2
1.6
2.0
Jan
-14
Feb-1
4
Ma
r-14
Ap
r-14
Ma
y-1
4
Jun
-14
Jul-1
4
Au
g-1
4
Se
p-1
4
Oct-
14
Nov-1
4
Dec-1
4
Jan
-15
Fe
b-1
5
Ma
r-15
Ap
r-15
Ma
y-1
5
Jun
-15
Jul-1
5
Au
g-1
5
Se
p-1
5
Oct-
15
IT Telecom Media
Oil&Gas Developers Chemicals
Food Construction Banks
60
70
80
90
100
110
120
130
140
150
160
Jan
-14
Ma
r-1
4
Ma
y-1
4
Jul-1
4
Se
p-1
4
Nov-1
4
Jan
-15
Ma
r-1
5
Ma
y-1
5
Jul-1
5
Se
p-1
5
Nov-1
5Materials Industrials Cyclicals
Non-cyclicals Financials Technology
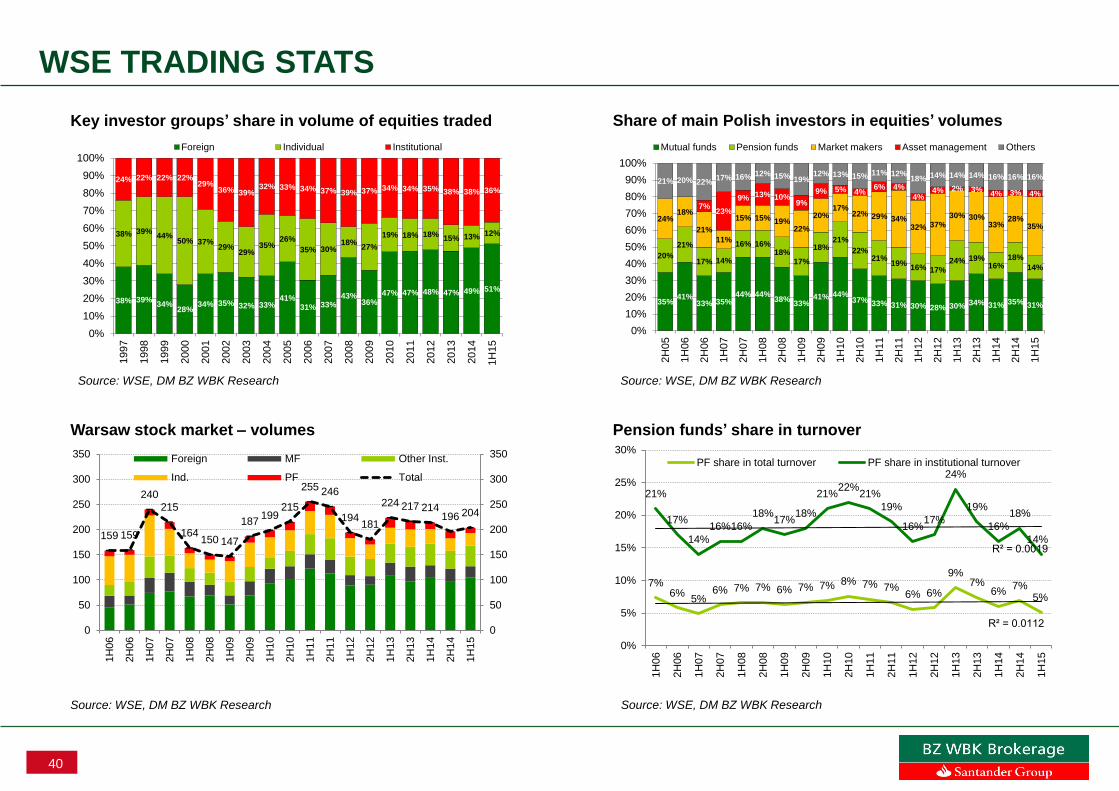
40
WSE TRADING STATS
Source: WSE, DM BZ WBK Research
Pension funds’ share in turnover
Source: WSE, DM BZ WBK Research
Share of main Polish investors in equities’ volumes
Warsaw stock market – volumes
Source: WSE, DM BZ WBK Research
Key investor groups’ share in volume of equities traded
Source: WSE, DM BZ WBK Research
38% 39%34%
28%34% 35% 32% 33%
41%31% 33%
43%36%
47% 47% 48% 47% 49% 51%
38% 39%44%
50% 37%29%
29%35%
26%
35% 30%18%
27%
19% 18% 18%15% 13% 12%
24% 22% 22% 22%29%
36% 39%32% 33% 34% 37% 39% 37% 34% 34% 35% 38% 38% 36%
0%
10%
20%
30%
40%
50%
60%
70%
80%
90%
100%
1997
1998
1999
2000
2001
2002
2003
2004
2005
2006
2007
2008
2009
2010
2011
2012
2013
2014
1H
15
Foreign Individual Institutional
35%41%
33% 35%44% 44%
38%33%
41% 44%37% 33% 31% 30% 28% 30% 34% 31% 35% 31%
20%
21%
17% 14%
16% 16%18%
17%
18%21%
22%21%
19%16% 17%
24% 19%16%
18%
14%
24%18%
21%
11%
15% 15% 19%22%
20%17%
22% 29% 34%32% 37%
30% 30%33%
28%35%
7%23%
9% 13% 10%9%
9% 5% 4%6% 4%
4%4% 2% 3%
4% 3% 4%
21% 20% 22%17% 16% 12% 15% 19%
12% 13% 15% 11% 12%18% 14% 14% 14% 16% 16% 16%
0%
10%
20%
30%
40%
50%
60%
70%
80%
90%
100%
2H
05
1H
06
2H
06
1H
07
2H
07
1H
08
2H
08
1H
09
2H
09
1H
10
2H
10
1H
11
2H
11
1H
12
2H
12
1H
13
2H
13
1H
14
2H
14
1H
15
Mutual funds Pension funds Market makers Asset management Others
159 159
240
215
164150 147
187199
215
255 246
194181
224 217 214196 204
0
50
100
150
200
250
300
350
0
50
100
150
200
250
300
350
1H
06
2H
06
1H
07
2H
07
1H
08
2H
08
1H
09
2H
09
1H
10
2H
10
1H
11
2H
11
1H
12
2H
12
1H
13
2H
13
1H
14
2H
14
1H
15
Foreign MF Other Inst.
Ind. PF Total
7%6%
5%6% 7% 7% 6% 7% 7% 8% 7% 7%
6% 6%
9%7%
6%7%
5%
21%
17%
14%
16%16%
18%17%
18%
21%22%
21%
19%
16%17%
24%
19%
16%
18%
14%
R² = 0.0112
R² = 0.0019
0%
5%
10%
15%
20%
25%
30%
1H
06
2H
06
1H
07
2H
07
1H
08
2H
08
1H
09
2H
09
1H
10
2H
10
1H
11
2H
11
1H
12
2H
12
1H
13
2H
13
1H
14
2H
14
1H
15
PF share in total turnover PF share in institutional turnover

41
LOCAL LIQUIDITY:
Lowered retirement age would mean incremental cash transfer out to ZUS totalling PLN
3.2bn in year one and PLN 2bn p.a. in subsequent years. This would make them
structural net sellers of equities.
If the worst case system overhaul takes place, a significant part of Warsaw stock
market cap (36% of WIG20’s free float, 61% of mWIG40 and 44% of sWIG80) would be
transferred to a state controlled entity(s).

42
PENSION FUNDS: OVERVIEW 1/2
Pension funds’ (PFs) AuM stood at almost PLN148bn at the end
of Oct15 (-5.9% y/y). The y/y decline was caused by a nearly
PLN 7bn drop in the value of equties to cPLN120bn.
On our estimates, ytd PFs purchased equities worth PLN1.6bn
(PLN2.8bn in same period last year). In 2015, however, the
figures are depressed by disposal of securities under tender
offers (GCH, TVN, LWB) which influenced the net
purchase/disposal balance. Nevertheless, our estimates suggest
PLN4.8bn purchase of foreign stocks in the period (PLN1.8bn in
10M14).
Expansion abroad translated into an increase of the foreign
equities allocation in the total investment portfolio (7% at the end
of October vs. c4% at YE14). When a new methodology based
on the currency given stock is applied (foreign securities
definition changed in 2014), the allocation of foreign securities
stood at 11% at the end of Oct’15 (approx. 7% at YE14).
Source: Bloomberg, BZ WBK Brokerage
Share of foreign equities in investment portfolio (Oct 15)
Source: Bloomberg, DM BZ WBK Research
PFs’ AuMs (PLNbn)
PFs’ portfolio structure at the end of Oct 15
Source: Bloomberg, DM BZ WBK Research
-10
10
30
50
70
90
110
130
150
0
50
100
150
200
250
300
350
Ja
n-0
6
Ju
l-06
Ja
n-0
7
Ju
l-07
Ja
n-0
8
Ju
l-08
Ja
n-0
9
Ju
l-09
Ja
n-1
0
Ju
l-10
Ja
n-1
1
Ju
l-11
Ja
n-1
2
Ju
l-12
Ja
n-1
3
Ju
l-13
Ja
n-1
4
Ju
l-14
Ja
n-1
5
Ju
l-15
Total assets (lhs) Equity assets (rhs)
8.11.5
14.3
110.4
9.6
120.0
Bank deposits Other Treasuries Polish equities Foreign equities
9.4%
13.8%12.9%
10.6%
8.4%
10.6%11.5%
7.3%
9.3%
5.8%
9.3% 8.9%
5.0%
9.4%8.2% 7.7%
5.5%8.2% 7.8%
4.6% 5.5%3.0%
5.9% 5.1%
0%
4%
8%
12%
16%
20%
AV
IVA
ING
PZ
U
AM
PL
ICO
Genera
li
PK
O
Nord
ea
Alli
anz
AX
A
Po
czty
lion
AE
GO
N
Pe
kao
Foreign eqt. alloc. - new recommendation Difference in pp. Foreign eqt. alloc.

43
PENSION FUNDS: OVERVIEW 2/2
Source: Bloomberg, DM BZ WBK Research
Equity allocation vs. WIG
Source: Bloomberg, DM BZ WBK Research
PFs monthly transfers to ZUS
Equity purchases vs. cash received (PLNbn)
Source: Bloomberg, DM BZ WBK Research
-113 -88 -86 -130 -158 -200 -73 -77 -164 -144 -104 -104
-400
-300
-200
-100
0
100
200
300
Jan
-15
Fe
b-1
5
Ma
r-15
Ap
r-15
Ma
y-1
5
Jun
-15
Ju
l-1
5
Au
g-1
5
Se
p-1
5
Oct-
15
Nov-1
5
Dec-1
5
Inflows from ZUS Outlofws to ZUS Total
30%
40%
50%
60%
70%
80%
90%
100%
-2.0
-1.0
0.0
1.0
2.0
3.0
4.0
5.0
6.0
De
c-1
2
Mar-
13
Ju
n-1
3
Se
p-1
3
De
c-1
3
Mar-
14
Ju
n-1
4
Se
p-1
4
De
c-1
4
Mar-
15
Ju
n-1
5
Se
p-1
5
Equities net purchase
ZUS inflows
Adjusted Equity Allocation (rhs, %)
20%
30%
40%
50%
60%
70%
80%
90%
10,000
20,000
30,000
40,000
50,000
60,000
70,000
80,000
Ja
n-0
6
Ju
l-06
Ja
n-0
7
Ju
l-07
Ja
n-0
8
Ju
l-08
Ja
n-0
9
Ju
l-09
Ja
n-1
0
Ju
l-10
Ja
n-1
1
Ju
l-11
Ja
n-1
2
Ju
l-12
Ja
n-1
3
Ju
l-13
Ja
n-1
4
Ju
l-14
Ja
n-1
5
Ju
l-15
WIG (lhs, pts) Adjusted Equity Allocation (rhs, %)
In 2015, the net ’cash in’ should total cPLN2bn. The amount
comprises of transfers to ZUS (cPLN4bn), transfers from ZUS
(PLN 2.6bn) and dividends (cPLN3.2bn).
During 2010-13 average annual cash inflows including dividends
stood at PLN17.6bn and the vast majority (78% on average) had
been invested into equities, we estimate. The 2014 was a turning
point due a decrease of inflows from ZUS and monthly pre-
retirement cash payments at cPLN340mn following the
amendment of the retirement act.
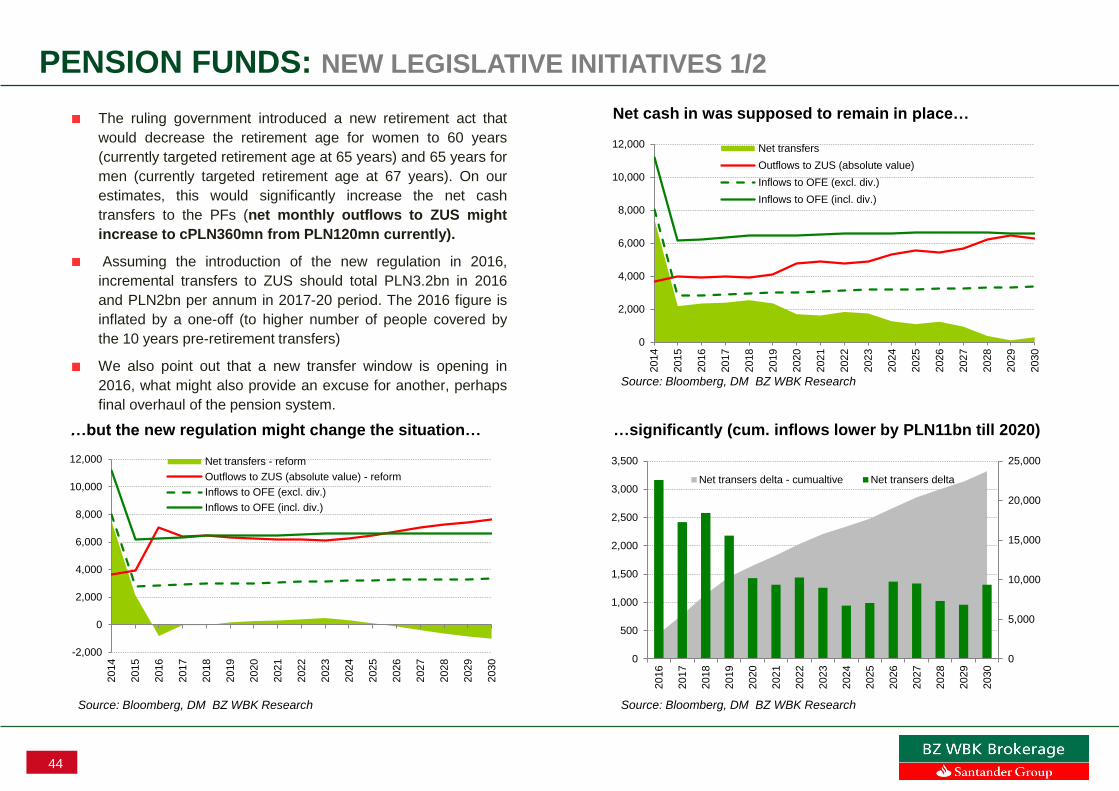
44
PENSION FUNDS: NEW LEGISLATIVE INITIATIVES 1/2
The ruling government introduced a new retirement act that
would decrease the retirement age for women to 60 years
(currently targeted retirement age at 65 years) and 65 years for
men (currently targeted retirement age at 67 years). On our
estimates, this would significantly increase the net cash
transfers to the PFs (net monthly outflows to ZUS might
increase to cPLN360mn from PLN120mn currently).
Assuming the introduction of the new regulation in 2016,
incremental transfers to ZUS should total PLN3.2bn in 2016
and PLN2bn per annum in 2017-20 period. The 2016 figure is
inflated by a one-off (to higher number of people covered by
the 10 years pre-retirement transfers)
We also point out that a new transfer window is opening in
2016, what might also provide an excuse for another, perhaps
final overhaul of the pension system.
.
Source: Bloomberg, DM BZ WBK Research
…significantly (cum. inflows lower by PLN11bn till 2020)
Source: Bloomberg, DM BZ WBK Research
Net cash in was supposed to remain in place…
…but the new regulation might change the situation…
Source: Bloomberg, DM BZ WBK Research
-2,000
0
2,000
4,000
6,000
8,000
10,000
12,000
2014
2015
2016
2017
2018
2019
2020
2021
2022
2023
2024
2025
2026
2027
2028
2029
2030
Net transfers - reform
Outflows to ZUS (absolute value) - reform
Inflows to OFE (excl. div.)
Inflows to OFE (incl. div.)
0
2,000
4,000
6,000
8,000
10,000
12,000
2014
2015
2016
2017
2018
2019
2020
2021
2022
2023
2024
2025
2026
2027
2028
2029
2030
Net transfers
Outflows to ZUS (absolute value)
Inflows to OFE (excl. div.)
Inflows to OFE (incl. div.)
0
5,000
10,000
15,000
20,000
25,000
0
500
1,000
1,500
2,000
2,500
3,000
3,500
2016
2017
2018
2019
2020
2021
2022
2023
2024
2025
2026
2027
2028
2029
2030
Net transers delta - cumualtive Net transers delta

45
PENSION FUNDS: NEW LEGISLATIVE INITIATIVES 2/2
Source: Bloomberg, DM BZ WBK Research
…though the situation varies across PFs
Source: Bloomberg, DM BZ WBK Research
…but the problem is somewhere else.
51+ age group account for 17% of current PFs members…
Source: Bloomberg, DM BZ WBK Research
Dividends should bring some relief…
Source: Bloomberg, DM BZ WBK Research
22%21%
18%
15% 15%14% 14% 14% 14% 14% 13%
10%
0%
5%
10%
15%
20%
25%
PZ
U
AM
PL
ICO
AE
GO
N
Genera
li
ING
Po
czty
lion
PK
O
Pe
kao
AX
A
AV
IVA
Nord
ea
Alli
anz
51+ years share Weighted average
0% 1%7%
15%
19%
17%
14%
10%
17%
17- years
18-20 years
21-25 years
26-30 years
31-35 years
36-40 years
41-45 years
46-50 years
51+ years
-600
200
1,000
1,800
Jan
-15
Fe
b-1
5
Mar-
15
Ap
r-15
Ma
y-1
5
Jun
-15
Jul-1
5
Au
g-1
5
Se
p-1
5
Oct-
15
Nov-1
5
Dec-1
5
Jan
-16
Fe
b-1
6
Ma
r-16
Ap
r-16
May-1
6
Jun
-16
Jul-1
6
Au
g-1
6
Se
p-1
6
Oct-
16
Nov-1
6
Dec-1
6
Dividends Outflows to ZUS Inflows to OFE
Net transfers Net transfers
80,000
100,000
120,000
140,000
160,000
2014
2015
2016
2017
2018
2019
2020
2021
2022
2023
2024
2025
2026
2027
2028
2029
2030
Assets (excluding dividends) - reform
Assets (excluding dividends)

46
PENSION FUNDS: HOLDINGS 1/2
Source: Bloomberg, DM BZ WBK Research
PF’s top holdings (% of free float)
Source: Bloomberg, DM BZ WBK Research
PFs’ share in free-float Another (if not final) overhaul round of the pension fund system is
scheduled for mid-2016.
Depending on its form and outcome, it could be the ‘black swan’ of
2016.
A transfer of the pension funds’ equity holdings to a state-managed
entity could trigger a significant sell-off in the mid/small cap space.
This would be particularly acute for names with high pension fund
participation and a diversified shareholder base
-304
-199
-78
-40
3
70
119
166
262
-450 -350 -250 -150 -50 50 150 250 350
Utilities
Metals&Mining
Financials
TMT
Other
Consumer
Industrials
Construction
Oil&Gas/Chemicals
PFs sector positioning vs WIG
Source: Bloomberg, DM BZ WBK Research
0%
20%
40%
60%
80%
100%
Ko
genera
cja
Po
lice
PH
N
Pfleid
ere
r
BP
H
Ele
ktr
obud.
AC
E
GT
C
Com
p
Inte
r C
ars
Se
rinus
Haw
e
Monnari
CI G
am
es
MC
I
Bio
ton
Gin
o R
ossi
Pa
ged
Bo
ryszew
Inte
r G
roclin
highest | lowest
54%
36% 36%
36%
51%44%
6% 12%19%
0%
20%
40%
60%
80%
100%
WIG20 mWIG40 sWIG80
Foreign MFs
ULIP
Polish MFs
PFs
Other

47
PENSION FUNDS: HOLDINGS 2/2
Source: Bloomberg, DM BZ WBK Research
PF top holdings in WIG80
Source: Bloomberg, DM BZ WBK Research
PF top holding in WIG20
PF’s top holdings in WIG40
Source: Bloomberg, DM BZ WBK Research
PFs’ top holdings (% of market cap)
Source: Bloomberg, DM BZ WBK Research
66.6%
51.4%48.4%
45.4% 44.9%
24.4% 24.1%21.0%
11.6%6.7%
0%
10%
20%
30%
40%
50%
60%
70%
mB
ank
BZ
WB
K
PK
N O
rle
n
Asse
co
PL
Bo
gdanka
Ta
uro
n P
E
KG
HM
Ora
nge
En
erg
a
Eu
rocash
highest | lowest
75.8% 73.6% 73.2% 71.5%65.3%
21.7%
13.4%
5.8% 4.2%1.1%
0%
10%
20%
30%
40%
50%
60%
70%
80%
GT
C
Inte
r C
ars
ING
BS
K
Gru
pa
Ke
ty
ZE
PA
K
JS
W
Sta
lpro
dukt
Haw
e
Bio
ton
Bo
ryszew
highest | lowest 90.7%81.9% 81.1% 80.3% 79.5%
4.8% 4.5% 1.7% 1.2% 0.6%0%
20%
40%
60%
80%
100%
Ko
genera
cja
Po
lice
PH
N
Pfle
idere
r
BP
H
CI G
am
es
MC
I
Gin
o R
ossi
Pa
ged
Inte
r G
roclin
highest | lowest
0%
20%
40%
60%
80%
100%
Ele
ktr
obud.
Gru
pa K
ety
Magella
n
AC
E
Ferr
o
Sa
nok
Com
p
AB
Ag
ora
AT
M
Monnari
Bio
ton
CI G
am
es
Se
rinus
MC
I
Kru
szw
ica
Gin
o R
ossi
Bo
ryszew
Inte
r G
roclin
Pa
ged
highest | lowest

48
LOCAL LIQUIDITY:
Lowered retirement age would mean incremental cash transfer out to ZUS totalling PLN
3.2bn in year one and PLN 2bn p.a. in subsequent years. This would make them
structural net sellers of equities.
If the worst case system overhaul takes place, 22% Warsaw stock market’s
capitalisation (or 36% of WIG20’s free float, 61% of mWIG40 and 44% of sWIG80) would
be transferred to a state controlled entity(s).

49
KEY THEMES: MUTUAL FUNDS
Source: Bloomberg, DM BZ WBK Research
Spread between 12-month return of WIG and banking deposits
Source: DM BZ WBK Research
Net inflows (PLNmn)
Correlation between inflows into equity funds and returns/deposits
Source: Bloomberg, DM BZ WBK Research
Year to date mutual funds recorded solid inflows (PLN 1.5bn) which,
however, are attributable chiefly to an extraordinary PLN1.5bn
upsurge of AuM in March. Adjusted for the one-off, net inflows were
close to null what is still a way above PLN2.3bn outflows in 2014.
Inflows to foreign equities funds stood at PLN2.5bn. In contrast to to
2014, investors withdrew money form Polish bonds dedicated funds.
Money markes funds suffered saw inflows easing as well.
Inflows into mutual funds are correlated with relative attractiveness of
equity returns versus interest earned on banking deposits.
Like at the turn of 2014/15, our estimates suggest that ceteris
paribus the spread between 12-month performance of WIG and
interest on deposits may not improve much going further which puts
inflows into domestic equity funds at risk.
Fund category 2010 2011 2012 2013 2014 10M15
Polish equities 87 -2,619 452 2,088 -2,226 1,549
Foreign equities 853 -195 -414 1,246 1,212 2,551
Polish bonds 2,446 2,651 15,638 -2,963 5,220 -1,592
Money market 5,856 2,234 -3,250 7,781 7,433 2,838
Other 3,315 -1,348 2,285 12,092 -1,014 3,103
Total 12,558 724 14,712 20,244 10,625 8,449
Net estimated equities
purchase595 -3,973 -2,276 3,814 -1,844 3,109
-16%
-12%
-8%
-4%
0%
4%
Dec-1
5
Ja
n-1
6
Fe
b-1
6
Ma
r-16
Ap
r-16
Ma
y-1
6
Ju
n-1
6
Jul-1
6
Au
g-1
6
Se
p-1
6
Oct-
16
Nov-1
6
WIG-12 month returns
Interest rate on new retail deposits
Spread between WIG returns and % on deposits
1.6%
-80
-60
-40
-20
0
20
40
60
80
100
120
-3,000
-2,000
-1,000
0
1,000
2,000
3,000
4,000
Jan
-05
Au
g-0
5
Mar-
06
Oct-
06
May-0
7
Dec-0
7
Jul-0
8
Feb-0
9
Se
p-0
9
Ap
r-10
Nov-1
0
Jun
-11
Jan
-12
Au
g-1
2
Mar-
13
Oct-
13
May-1
4
Dec-1
4
Jul-1
5
Mutual funds (total inflows) (PLNmn) (lhs)Spread between WIG returns and % on deposits (pp) (rhs)
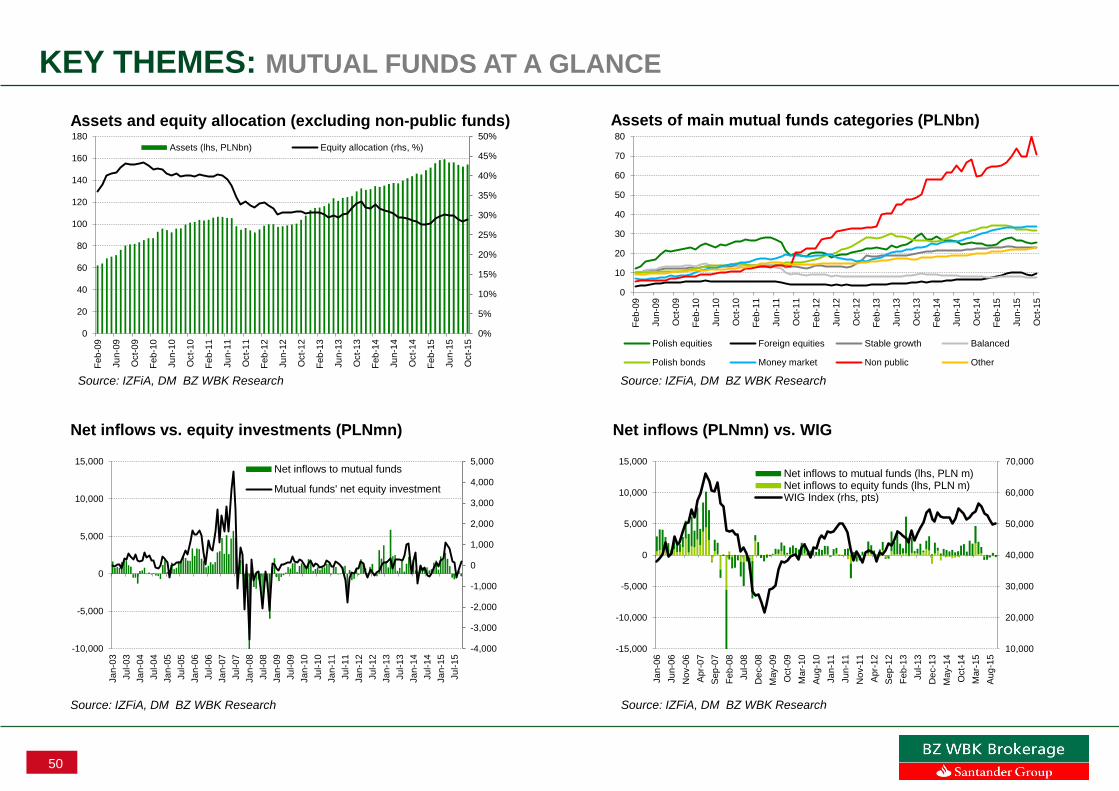
50
KEY THEMES: MUTUAL FUNDS AT A GLANCE
Source: IZFiA, DM BZ WBK Research
Net inflows (PLNmn) vs. WIG
Source: IZFiA, DM BZ WBK Research
Assets of main mutual funds categories (PLNbn)
Net inflows vs. equity investments (PLNmn)
Source: IZFiA, DM BZ WBK Research
Assets and equity allocation (excluding non-public funds)
Source: IZFiA, DM BZ WBK Research
0
10
20
30
40
50
60
70
80
Feb
-09
Ju
n-0
9
Oct-
09
Feb
-10
Ju
n-1
0
Oct-
10
Feb
-11
Ju
n-1
1
Oct-
11
Feb
-12
Ju
n-1
2
Oct-
12
Feb
-13
Ju
n-1
3
Oct-
13
Feb
-14
Ju
n-1
4
Oct-
14
Feb
-15
Ju
n-1
5
Oct-
15
Polish equities Foreign equities Stable growth Balanced
Polish bonds Money market Non public Other
-4,000
-3,000
-2,000
-1,000
0
1,000
2,000
3,000
4,000
5,000
-10,000
-5,000
0
5,000
10,000
15,000
Ja
n-0
3
Ju
l-03
Ja
n-0
4
Ju
l-04
Ja
n-0
5
Ju
l-05
Ja
n-0
6
Ju
l-06
Ja
n-0
7
Ju
l-07
Ja
n-0
8
Ju
l-08
Ja
n-0
9
Ju
l-09
Ja
n-1
0
Ju
l-10
Ja
n-1
1
Ju
l-11
Ja
n-1
2
Ju
l-12
Ja
n-1
3
Ju
l-13
Ja
n-1
4
Ju
l-14
Ja
n-1
5
Ju
l-15
Net inflows to mutual funds
Mutual funds' net equity investment
10,000
20,000
30,000
40,000
50,000
60,000
70,000
-15,000
-10,000
-5,000
0
5,000
10,000
15,000
Ja
n-0
6
Ju
n-0
6
No
v-0
6
Apr-
07
Sep
-07
Feb
-08
Ju
l-08
De
c-0
8
May-0
9
Oct-
09
Mar-
10
Aug
-10
Ja
n-1
1
Ju
n-1
1
No
v-1
1
Apr-
12
Sep
-12
Feb
-13
Ju
l-13
De
c-1
3
May-1
4
Oct-
14
Mar-
15
Aug
-15
Net inflows to mutual funds (lhs, PLN m)Net inflows to equity funds (lhs, PLN m)WIG Index (rhs, pts)
0%
5%
10%
15%
20%
25%
30%
35%
40%
45%
50%
0
20
40
60
80
100
120
140
160
180
Feb
-09
Ju
n-0
9
Oct-
09
Feb
-10
Ju
n-1
0
Oct-
10
Feb
-11
Ju
n-1
1
Oct-
11
Feb
-12
Ju
n-1
2
Oct-
12
Feb
-13
Ju
n-1
3
Oct-
13
Feb
-14
Ju
n-1
4
Oct-
14
Feb
-15
Ju
n-1
5
Oct-
15
Assets (lhs, PLNbn) Equity allocation (rhs, %)

51
KEY THEMES FOR 2016: A further cut of interest rates (play via Magellan, Presco, Kruk, ZE PAK, Polenergia, Tauron,
Cyfrowy Polsat, Orange Polska, Pelion, Echo Investment, Voxel and IT distributors)
FX movements (should USD strengthen further position in O&G, global IT names like Asseco
Poland or LiveChat and game developers)
Rising food CPI (Eurocash and Emperia),
Wage growth (bad for a long list of names starting from Pelion, Unibeb or Emperia)
PLN 500 subsidy per child (consumer names obviously)
Retail tax (all usual suspects though Emperia and Gino Rossi could suffer relatively more)
Lower gas prices (Grupa Azoty, Azoty Pulawy, Azoty Police, PKN and Lotos would benefit, PGNiG
would suffer)
Weather changes, e.g. the forecast warm 2016 winter and hot& humid 2016 overal (lots of
implications for various stocks),
State’s drive for more cash from dividends (PKN Orlen the main source of the incremental PLN
1bn dividends targeted?), and finally
Plays on investment cycle and new government’s incentives (a long list of beneficiaries) and the
good old story of EU funding

52
KEY THEMES: INTEREST RATES
Our macro team assumes a 50bp cut in interest rates in 2016 and
sees WIBOR3M at 1.27% at YE16E.
Within our coverage potential winners of lower interest costs
would be:
most levered stocks
stocks with highest financial costs/EBIT.
Major potential beneficiaries of lower interest rate would be
financial companies (Magellan, Presco, Kruk), utilities (ZE PAK,
Polenergia, Tauron), telecoms (Cyfrowy Polsat, Orange Polska)
as well as some other names like Pelion, Echo Investment,
Voxel and IT distributors.
Source: Bloomberg, DM BZ WBK Research
Companies with highest interest cost/EBIT
Source: Bloomberg, DM BZ WBK Research
WIBOR3M and reference rate
Companies with highest net debt/EBITDA
Source: Bloomberg, DM BZ WBK Research
0.00
1.00
2.00
3.00
4.00
5.00
6.00
7.00
8.00
2007 2008 2009 2010 2011 2012 2013 2014 2015 2016
Wibor 3M Poland NBP Reference Rate
0
5
10
15
20
25
Ma
gella
n
Echo
Pe
lion
Pre
sco
JS
W
Po
len
erg
ia
ZE
PA
K
Ta
uro
n
Kru
k
En
ea
Cyfr
ow
y P
ols
at
Loto
s
AB
Vo
xel
Open F
inance
CE
Z
Actio
n
En
erg
a
AB
C D
ata
Ora
nge P
ols
ka
0%
20%
40%
60%
80%
100%
120%
140%
160%
ZE
PA
K
Ma
gella
n
Pre
sco
Echo
Po
len
erg
ia
Ora
nge P
ols
ka
Open F
inance
Ta
uro
n
Unib
ep
Tra
kcja
Pe
lion
Cyfr
ow
y P
ols
at
Gin
o R
ossi
Vo
xel
En
erg
a
Dom
De
velo
pm
ent
Erb
ud
KR
UK
Loto
s
Work
Serv
ice

53
KEY THEMES: FX EXPOSURE 1/4
Our macro team sees USDPLN at 3.55 and EURPLN at 4.18 at
YE16.
This implies significant weakening of USD vs. PLN from current
level and flat EURPLN in the coming year.
The prospect of a December interest hike by the FED is USD
positive. However, the currency has already strengthened
significantly since mid-October.
Moreover, 2Y interest rate swaps suggest that the market
expects 100pb higher rates in US than in Eurozone; this would be
supportive for the USD.
Additionally, long the USD appears to be a crowded call. This
may limit further gains if the Fed hikes.
Finally, the period of USD strength is almost five-year long
Source: Bloomberg, DM BZ WBK Research
Period of strong USD already last for almost five years
Source: Bloomberg, DM BZ WBK Research
USDPLN and EURPLN performance and BZ WBK fcast
The speculative market is long the USD
Source: Bloomberg, DM BZ WBK Research
2.0
2.5
3.0
3.5
4.0
4.5
5.0
1999
2000
2001
2002
2003
2004
2005
2006
2007
2008
2009
2010
2011
2012
2013
2014
2015
2016
EUR/PLN USD/PLN
60
80
100
120
140
160
Mar-
73
Oct-
74
May-7
6
Dec-7
7
Jul-7
9
Feb-8
1
Se
p-8
2
Ap
r-84
Nov-8
5
Jun
-87
Jan
-89
Au
g-9
0
Mar-
92
Oct-
93
May-9
5
Dec-9
6
Jul-9
8
Feb-0
0
Se
p-0
1
Ap
r-03
Nov-0
4
Jun
-06
Jan
-08
Au
g-0
9
Mar-
11
Oct-
12
May-1
4
US$ Trade Weighted Currency (%)
54.4%
37.6%
-43.7%
-38.2%
54.4%
32.2%
0
10000
20000
30000
40000
50000
60000
70000
80000
90000
82
84
86
88
90
92
94
96
98
100
102
Dec-1
4
Dec-1
4
Jan
-15
Fe
b-1
5
Fe
b-1
5
Ma
r-15
Ap
r-1
5
Ap
r-1
5
May-1
5
Jun
-15
Jul-1
5
Jul-1
5
Au
g-1
5
Se
p-1
5
Se
p-1
5
Oct-
15
Nov-1
5
Nov-1
5USD CFTC Net Futures Position USD Index

54
KEY THEMES: FX EXPOSURE 2/4
Source: Bloomberg, DM BZ WBK Research
Sectors/names most/least impacted by weak EUR
Source: Bloomberg, DM BZ WBK Research
EURUSD exchange rate & expected interest rates
Sectors/names most/least impacted by strong USD
Source: Company data, DM BZ WBK Research, * except of Ciech, ** except
upstream companies reporting in USD (Serinus), ***except of Gino Rossi
Sectors/stocks to play if USD strengthens further early 2016 are:
• Oil & Gas sector
• IT companies with global exposure (especially Asseco Poland,
LiveChat, Medicalgorithmics)
• game developers
Stronger USD would also provide relief to the mining sector (copper
and coke prices lined to USD)
On the other hand, the expected PLN strenghtening vs. USD would
be favourable for chemical/petrochemical names as well as and
clothing and shoe retailers as most have that have USD-linked
costs.
We expect stable/slightly weakening EURPLN across the upcoming
year, but we present a list of beneficiaries and losers in case EUR
weakening would be larger than expected.
Sector Name Positiv e Negativ e Comment
Chemicals/Petrochemicals*all players + Strong USD inflates input costs
Upstream** all players + Higher revenues in lc
Refining all players + Improves refining margins in lc
Clothing & shoe retail*** all players + Strong USD inflates COGS
Metals&Mining KGHM; JSW +
Strong USD boosts top line and earnings;
sti l l , strong USD commonly has got
negative impact on metals' prices
Telecommunications Cyfrowy Polsat +USD denominated bonds (lower cost of
funding)
IT Asseco Poland +Over a dozen % of revenues generated in
USD, exposure through Israeli companies
Video Games all players + 40-60% of revenues in USD
Sector Name Positiv e Negativ e Comment
Oil&Gas PKN +
Weak EUR to PLN could weigh on
product/feedstock margins generated
on petrochemical products
ChemicalsSNS, CIE, ATT,
ZAP, PCE+
Polish chemical companies are export-
oriented, thus weak EUR vs. PLN
should weigh on its export sales
Telecommunications Cyfrowy Polsat +
EUR denominated bonds (lower cost of
funding), lower rental and
programming costs
ConstructionUnibep, Erbud,
Trakcja+
Slightly negative as a part of revenues
in EUR-denominated
Real-Estate +
Revenues and part of debt are EUR
denominated, but net impact is
negative
Util ites All names +
Weaker EUR lowers burden of CO2
dues; it also lowers total cost of new
generation units (comonly EUR-priced)
Clothing & shoe retail + Strong USD inflates rents
all names
all names
0.60
0.80
1.00
1.20
1.40
1.60
1.80
-350
-250
-150
-50
50
150
250
2007 2008 2009 2010 2011 2012 2013 2014
Expected EZ minus US rates (bps, lhs)
EUR/USD exchange rate

55
KEY THEMES: FX EXPOSURE 3/4
Source: Bloomberg, DM BZ WBK Research
…but local factors led to a strong decorelated of Polish names
Source: Bloomberg, DM BZ WBK Research
EM utilities are also closely correlated to the USD…
…but Poland’s O&G recently shows much higher correlation
Source: Bloomberg, DM BZ WBK Research
O&G names in EMs are closely correlated with the USD…
Source: Bloomberg, DM BZ WBK Research
30%
40%
50%
60%
70%
80%
90%
100%
110%
120%
130%
80%
90%
100%
110%
120%
130%
140%
Jan
-08
May-0
8
Se
p-0
8
Jan
-09
May-0
9
Se
p-0
9
Jan
-10
Ma
y-1
0
Se
p-1
0
Jan
-11
May-1
1
Se
p-1
1
Jan
-12
May-1
2
Se
p-1
2
Jan
-13
May-1
3
Se
p-1
3
Jan
-14
May-1
4
Se
p-1
4
Jan
-15
May-1
5
Se
p-1
5
US$ Index (rhs) EM Oil & Gas Index
50%
60%
70%
80%
90%
100%
110%
120%
130%
140%
150%
160%
170%
180%
190%
80%
90%
100%
110%
120%
130%
140%
Jan
-08
May-0
8
Se
p-0
8
Jan
-09
May-0
9
Se
p-0
9
Jan
-10
May-1
0
Se
p-1
0
Jan
-11
May-1
1
Se
p-1
1
Jan
-12
May-1
2
Se
p-1
2
Jan
-13
May-1
3
Se
p-1
3
Jan
-14
May-1
4
Se
p-1
4
Jan
-15
May-1
5
Se
p-1
5
US$ Index (rhs) WIG Oil & Gas Index
30%
40%
50%
60%
70%
80%
90%
100%
110%
120%
90%
95%
100%
105%
110%
115%
120%
125%
130%
135%
140%
Jan
-08
May-0
8
Se
p-0
8
Jan
-09
May-0
9
Se
p-0
9
Jan
-10
May-1
0
Se
p-1
0
Jan
-11
May-1
1
Se
p-1
1
Jan
-12
May-1
2
Se
p-1
2
Jan
-13
May-1
3
Se
p-1
3
Jan
-14
May-1
4
Se
p-1
4
Jan
-15
May-1
5
Se
p-1
5US$ Index (rhs) EM Utilities Index
70%
80%
90%
100%
110%
120%
130%
80%
90%
100%
110%
120%
130%
140%
Jan
-08
May-0
8
Se
p-0
8
Jan
-09
May-0
9
Se
p-0
9
Jan
-10
May-1
0
Se
p-1
0
Jan
-11
May-1
1
Se
p-1
1
Jan
-12
May-1
2
Se
p-1
2
Jan
-13
May-1
3
Se
p-1
3
Jan
-14
May-1
4
Se
p-1
4
Jan
-15
May-1
5
Se
p-1
5
US$ Index (rhs) WIG Utilities Index

56
KEY THEMES: FX EXPOSURE 4/4
Source: Bloomberg, DM BZ WBK Research
…as are the Polish banks EM Banks are closely correlated…
Source: Bloomberg, DM BZ WBK Research
40%
50%
60%
70%
80%
90%
100%
110%
120%
130%
80%
90%
100%
110%
120%
130%
140%
Jan
-08
Ma
y-0
8
Se
p-0
8
Jan
-09
Ma
y-0
9
Se
p-0
9
Jan
-10
Ma
y-1
0
Se
p-1
0
Jan
-11
Ma
y-1
1
Se
p-1
1
Jan
-12
Ma
y-1
2
Se
p-1
2
Jan
-13
Ma
y-1
3
Se
p-1
3
Jan
-14
Ma
y-1
4
Se
p-1
4
Jan
-15
Ma
y-1
5
Se
p-1
5
US$ Index (rhs) EM Banks Index
40%
50%
60%
70%
80%
90%
100%
110%
120%
130%
140%
150%
80%
90%
100%
110%
120%
130%
140%
Jan
-08
May-0
8
Se
p-0
8
Jan
-09
May-0
9
Se
p-0
9
Jan
-10
Ma
y-1
0
Se
p-1
0
Jan
-11
Ma
y-1
1
Se
p-1
1
Jan
-12
Ma
y-1
2
Se
p-1
2
Jan
-13
Ma
y-1
3
Se
p-1
3
Jan
-14
Ma
y-1
4
Se
p-1
4
Jan
-15
Ma
y-1
5
Se
p-1
5
US$ Index (rhs) WIG Banks Index

57
KEY THEMES: RISING FOOD CPI = BOOST TO FMCG’S NAMES LFL GROWTH
Source: CSO, DM BZ WBK Research, BZWBK Macro Team
Food CPI vs. Eurocash and Emperia’s LfL growth (3M avg.)
Source: CSO, DM BZ WBK Research, BZWBK Macro Team
CPI and food CPI in 2016E Food inflation in Poland is set to continue to rise from the record low
3.9% (deflation) in January 2015.
According to our macro team’s estimates, food inflation in Poland is likely
to rise to 1.5% at YE16E on growth in purchasing power. Inflation should
be additionally boosted by a gradual rise of soft commodity prices. Also,
the new government-proposed retail tax might further fuel food CPI as
the FMCG industry is likely to push the tax burden onto retail food prices.
There is evidence of a notable correlation between food CPI and same-
store sales of FMCG retailers in the past years. We expect the projected
rise of food CPI to have a positive impact on the LfL sales growth in
Eurocash and Emperia.
-5
-3
-1
1
3
5
7
9
11
Nov-0
0M
ay-0
1N
ov-0
1M
ay-0
2N
ov-0
2M
ay-0
3N
ov-0
3M
ay-0
4N
ov-0
4M
ay-0
5N
ov-0
5M
ay-0
6N
ov-0
6M
ay-0
7N
ov-0
7M
ay-0
8N
ov-0
8M
ay-0
9N
ov-0
9M
ay-1
0N
ov-1
0M
ay-1
1N
ov-1
1M
ay-1
2N
ov-1
2M
ay-1
3N
ov-1
3M
ay-1
4N
ov-1
4M
ay-1
5N
ov-1
5M
ay-1
6N
ov-1
6M
ay-1
7N
ov-1
7
CPI (%)food and non-alcoholic beverages (CPI)
Forecast
-4%
-2%
0%
2%
4%
6%
8%
-10%
-5%
0%
5%
10%
15%
20%
25%
1Q
07
3Q
07
1Q
08
3Q
08
1Q
09
3Q
09
2009
2Q
10
4Q
10
2Q
11
4Q
11
2Q
12
4Q
12
2Q
13
4Q
13
2Q
14
4Q
15
2Q
15
4Q
15
2Q
16
4Q
16
Eurocash - C&C Eurocash - D&C
Emperia Food CPI
Forecast

58
KEY THEMES: WAGES GROWTH = RISING PRESSURE ON OPEX
Source: DM BZ WBK Research
5% wage growth impact on EBITDA – the most affected names
Source: CSO, DM BZ WBK Research
Wages set to grow by 5% y/y in 2016E
5% wage growth impact on EBITDA – the least affected names
Source: DM BZ WBK Research
0%
2%
4%
6%
8%
10%
12%
14%
Ja
n-0
8
Ja
n-1
0
Ja
n-1
2
Ja
n-1
4
Ja
n-1
6
Wages (%, y/y)
Forecast
as % of total costs negative impact on EBITDA15
Pelion 5% 20%
Unibep 8% 17%
Emperia 13% 16%
Erbud 10% 16%
Asseco Poland 51% 16%
Asseco SEE 40% 12%
Wojas 24% 11%
Gino Rossi 20% 11%
Budimex 14% 11%
Wielton 14% 11%
PKP Cargo 35% 10%
Open Finance 33% 10%
Trakcja 12% 9%
Voxel 23% 9%
as % of total costs negative impact on EBITDA15
Ciech 12% 2%
MOL (HUFbn) 5% 2%
Magellan 48% 1%
MW Trade 67% 1%
Uniwheels 18% 1%
Medicalgorithmics 34% 1%
CEZ 11% 1%
Synthos 4% 1%
OMV (EURmn) 4% 1%
Lotos 2% 1%
Echo 13% 1%
PEP 2% 1%
PKN Orlen 3% 1%
Cyfrowy Polsat 6% 1%

59
KEY THEMES: PLN500 SUBSIDY PER CHILD = BOOST TO HOUSEHOLD INCOME
Source: CSO, DM BZ WBK Research, BZWBK Macro Team *assuming 3% y/y
growth of household income in 2016E
‚500+’ programme’s impact on household income growth y/y*
Source: CSO, DM BZ WBK Research, BZWBK Macro Team
‚500+’ programme as % of total household income The programme is set to begin on April 1, 2016 and cover roughly 3.7mn
children up to 18 years of age.
Income criteria: equal or less than PLN800 per person per month for the
first child, PLN1.2k for a disabled child. No income criteria for the second
and more children.
The programme is likely to cost the government budget almost
c.PLN20bn annually. It should boost consumption, but raise debt and
weaken GDP growth in the long term.
The programme is to substitute the current child benefit programmes
(PLN77-115) and tax allowances (PLN1,112).
According to our calculations, the ‚500+’ programme might add PLN5bn
or 1.8% per quarter to household income levels, boosting the y/y growth
from the projected 3.0% to 4.9%. This might affect final consumption
levels, assuming no extra growth in the savings rate, which oscillates at
3.2% as of 2Q15.
266 267271
273 274275
279281
5
5
5
255
260
265
270
275
280
285
290
1Q15 2Q15 3Q15 4Q15 1Q16 2Q16 3Q16 4Q16
Household income 500+ programme
0
1
2
3
4
5
6
7
4Q
11
1Q
12
2Q
12
3Q
12
4Q
12
1Q
13
2Q
13
3Q
13
4Q
13
1Q
14
2Q
14
3Q
14
4Q
14
1Q
15
2Q
15
3Q
15
4Q
15
1Q
16
2Q
16
3Q
16
4Q
16
household income growth (%, y/y)500+ impact on household income growth (%, y/y)

60
KEY THEMES: RETAIL TAX = RISK FOR PROFITS
Source: DM BZ WBK Research, * ceteris paribus, which means that the final
amount is likely to be lower, **taxable retail sales, *** wholesale sales not directly
impacted by the tax, est. tax is a rough calculation of the amount potentially paid
by Eurocash’s clients. We assumed that Eurocash is likely to cover retail tax by
lower prices.
Potential impact of retail tax on retailers’ profits*
Source: DM BZ WBK Research, Forum Polskiego Handlu
Proposed retail tax thresholds by Forum Polskiego Handlu The PiS government’s retail tax proposal is likely to materialise in 2016.
Initial consultations with the industry’s representatives led to the
conclusion that the final shape of the tax would be discussed further and
that its implementation was planned some time in 2016. More talks are to
be held in December, with the tax’s final shape to depend on the
consensus reached.
Forum Polskiego Handlu, a cluster of Polish retailers, recently presented
an amendment to the early draft proposed by PiS. It proposes four tax
thresholds, which are presented in the table below. The amendment
does not include the criterion of store size, initially set at >250sqm, and,
additionally, assumes the new tax would should be imposed on all retail
stores (own and franchising), including e-commerce.
We expect that the final legislation will be less harmful for supermarkets
than it currently seems. With regards to the impact of new tax on
strategic powers flow within the industry, we expect that the largest
companies (Biedronka, Eurocash etc) are likely to push the tax burden
mainly onto producers rather than consumers. Producers will have to rise
prices for the companies with weaker negotiation power to finance cuts
for the largest, mainly traditional retailers. When the history turns the full
cycle, the largest names will probably emerge as winners as the
consolidation of the market is likely to accelerate at the cost of small
format retail. The higher tax the largest will pay, the higher price pressure
on producers, which will affect mainly small format retail.
Emperia and Gino Rossi seem the most vulnerable to the potential tax
with c10% and 9% potential 2016E EBITDA loss respectively. In contrast,
Farmacol and LPP seem the least exposed with c2% potential EBITDA
loss each.
Annual revenues Tax thresholds
PLN0-12mn 0.1% of annual revenues
· 0.1% of revenues up to PLN12mn,
· 0.5% of revenues between PLN12mn to PLN5bn.
· 0.1% of revenues up to PLN12mn,
· 0.5% of revenues between PLN12mn to PLN5bn,
· 2.0% of revenues between PLN5bn to PLN10bn.
· 0.1% of revenues up to PLN12mn,
· 0.5% of revenues between PLN12mn to PLN5bn,
· 2.0% of revenues between PLN5bn to PLN10bn,
· 4.0% of revenues above PLN10bn.
PLN12mn-5.0bn
PLN5bn-10bn
> PLN10bn
Company est. tax sales16E** est. impact on EBITDA16
Emperia 10 2,000 9.9%
Gino Rossi 2 345 9.3%
Eurocash *** 38 7.2%
o/w Cash&carry 5 4,687
o/w D.C. 10 2,103
o/w Tradis 23 4,559
Pelion 11 2,200 6.8%
Wojas 1 239 6.7%
Bytom 1 162 3.8%
Monnari 1 249 3.1%
CCC 9 1,800 2.5%
LPP 18 3,550 2.1%
Farmacol 2 500 1.8%

61
KEY THEMES: LOWER GAS PRICES = SUBSTANTIAL COST SAVINGS
Gas market liberalisation in Poland will tighten the competition
and will lead to a further drop in gas prices.
Polish gas consumption equals 16.3Bcm annually, which is an
equivalent of PLN158bn at average gas price of PLN108/MWh.
An expected 15% lower gas prices (on average) in 2016 means a
PLN24bn savings for the whole Polish economy. The impact of
lower gas prices for households is estimated at PLN5bn.
In our coverage universe, Grupa Azoty, Azoty Pulawy, Azoty
Police, PKN and Lotos are key beneficiaries of liberalisation of
the gas markets in Poland.
The gas market liberalisation will diminish PGNiG’s market share
and earnings on gas trading.
Source: PGNiG, DM BZ WBK Research
Demand for gas in selected European countries in 2014 (Bcm)
Source: PGNiG, DM BZ WBK Research
Gas prices in Poland follow European gas-hub prices
Structure of gas consumption in Poland and the EU
Source: PGNiG, DM BZ WBK Research
117 115
109
102
10
12
14
16
18
20
22
24
50
60
70
80
90
100
110
120
Jan-14 May-14 Aug-14 Nov-14 Feb-15 Jun-15 Sep-15
TGE gas price - day ahead market PLN/MWh (lhs)PGNiG - average gas tariff price PLN/MWh (lhs)TTF gas spot EUR/MWh (rhs)
7.511.7
14.7 16.3
26.3
70.9
0
10
20
30
40
50
60
70
80
Czech Rep. Romania Belgium Poland Spain Germany
43%
41%
31%
48%
23%
8%
3%
3%
0% 20% 40% 60% 80% 100%
UE
Po
lan
d
Households and wholesale Industry Utilities Others

62
KEY THEMES: WARM 2016 WINTER, HOT & HUMID ENTIRE 2016?
Mid- and long-term forecasts point to likelihood of exceptionally
warm winter. For the entire 2016, weather forecasts suggest
another season of high temperatures and high humidity. Potential
implications for industry sectors are as follows:
Mining & utilities: Strong negative for mining segment (LWB,
ENA, JSW), indirectly strong negative to the entire utility
sector via (1) coal oversupply and (2) higher future subsidies to
mining
Oil & Gas: negative impact of warm winter on gas consumption
Construction: hot 4Q15 / 1Q16 and hot 2016 is positive to the
sector, but the anticipated heavy rainfall may represent
drawback
Clothing: mixed – heavy rainfall is positive, but (1) lack of cold
winter and (2) very hot summer are negative
Shoes: positive, high rainfall boosts shoes’ sales
Benefit Systems: warm winter negative, hot summer positive
Source: Bloomberg, DM BZ WBK Research
2015 Nov-Dec temperature averages do not lie
Source: www.twojapogoda.pl, DM BZ WBK Research
Winter forecasts point at abnormally high temperatures
Climate is changing (avg. daily temp in Poland)
Source: Bloomberg, DM BZ WBK Research
3.23
1.59
3.73
2.66
3.73
2.93
4.32
3.30
4.09
2.61
5.335.03
0.0
1.0
2.0
3.0
4.0
5.0
6.0
01 Nov - 08 Dec 30 days: 08 Nov - 08 Dec
2010 2011 2012 2013 2014 2015*
-20
-15
-10
-5
0
5
10
15
20
25
30
Ja
n-1
0
Ap
r-10
Jul-1
0
Oct-
10
Ja
n-1
1
Ap
r-11
Jul-1
1
Oct-
11
Ja
n-1
2
Ap
r-12
Jul-1
2
Oct-
12
Ja
n-1
3
Ap
r-13
Jul-1
3
Oct-
13
Ja
n-1
4
Ap
r-14
Jul-1
4
Oct-
14
Ja
n-1
5
Ap
r-15
Jul-1
5
Oct-
15
Month Excerpts from the mid-term weather forecast*
December 2015
The first month of winter should be much more like autumn than
winter. We will experience snow cover, but it will most likely not last
long, with rain prevailing and temperatures above zero Celsius.
January 2016
If forecasts of the global models prove correct, we may experience
the warmest or one of the warmest Januaries in the history of
Polish meteorology.
February 2016
This will be month of greatest weather anomalies. We should
expect abnormally high temperatures, in strong contrast to past
seasonal patterns. In the south, the daytime temperature might rise
to above 15 Celsius.

63
KEY THEMES: DY PLAYS
Poor equity market performance ytd and low bond yields should
continue to support high DY names, especially in 1H16.
On our estimates, WIG30’s 2016E DY is equal to 3.6%.
Energa, Bogdanka, PZU, Synthos, Handlowy, KGHM, PKO,
Pekao, Tauron, PGE and Enea offer DY above 5%.
Azoty, Alior, GTC, Kernel, Lotos, JSW, Boryszew and Cyfrowy
Polsat will most likely not pay dividends.
Outside WIG30, the highest dividend payers on BZ WBK
estimates are: ABC Data, PCM, Skarbiec, Euco, Netia, MW
Trade and Action
KEY FOCUS: State Treasury will seek for PLN1bn more dividend
income in 2016.
Source: Bloomberg, DM BZ WBK Research
Non-WIG30: 2016E DY > 3%
Source: Bloomberg, DM BZ WBK Research
WIG30: DY in 2016E
State Treasury: dividend income from key listed holdings
Source: Bloomberg, DM BZ WBK Research
0%
2%
4%
6%
8%
10%
12%
EN
G
LW
B
PZ
U
SN
S
BH
W
KG
H
PK
O
PE
O
TP
E
PG
E
EN
A
BZ
W
AC
P
MB
K
OP
L
PG
N
PK
N
ING
PK
P
CC
C
EU
R
LP
P
KE
R
AT
T
AL
R
GT
C
LT
S
JS
W
BR
S
CP
S
BZ WBK DY16 est. Mkt. DY16 est. WIG30 average
WIG30 Index average = 3.6%
0%
2%
4%
6%
8%
10%
12%
AB
C
PC
M
SK
H
EU
C
NE
T
MW
T
AC
T
AM
B
AB
S
DO
M
PH
N
GR
J
UN
W
AM
L
VO
T
KT
Y
AM
C
BT
M
WO
J
FT
E
AS
E
BD
X
AP
T
MA
G
WLT
EM
T
ZA
P
ZE
P
BZ WBK DY16 est WIG average
WIG average = 3.2%
PLNmn 2014 2015 2016E
PKO BP 294 0 598
PZU 517 1 428 933
PKN 170 194 279
Lotos 0 0 0
PGNiG 641 854 794
GPW 18 35 37
KGHM 320 256 273
PGE 1 201 852 813
TPE 100 79 79
ENG 265 382 318
ENA 129 107 135
PKP 45 36 25
Total 3 700 4 224 4 284

64
KEY THEMES: EU FUNDING SHOULD PROVIDE INVESTMENT BOOST (1/2)
Poland is to receive EUR82bn in co-funding from the EU in 2014-2020,
19% more than the EUR69bn in 2007-2013.
Approximately EUR28bn of this amount is to be spent on infrastructure,
broadly the same as in 2007-2013.
So far, 2007-2013 funds have been fully absorbed. Almost 55% of the
funds were already allocated in the first three years of the 2007-13
perspective.
However, cash transfers are lagging behind because 92% of the cash
has so far been transferred to the funds’ beneficiaries, of which only 16%
in the first three years.
Poland has already allocated c5% of EU2015-20 funds, and c4% of cash
had been transfered to funds beneficiaries.
Source: Ministry of Infrastructure and Development, DM BZ WBK Research
EU funds for Poland in 2007-2013 and 2014-2020
Cash transfers of 2007-2013 EU funds
27.9 27.5
41.1
55
0
10
20
30
40
50
60
70
80
90
2007-2013 2014-2020Infrastructure&Environment Other
69
82
Timeline of 2007-2013 EU funds utilisation
Source: Ministry of Infrastructure and Development, DM BZ WBK Research Source: Ministry of Infrastructure and Development, DM BZ WBK Research
2%
24%29%
14% 14% 12%16%
2%2%
26%
55%
69%
83%
95%101% 103%
0%
20%
40%
60%
80%
100%
120%
2008
2009
2010
2011
2012
2013
2014
Nov-1
5Signed deals on EU financing
Signed deals on EU financing (cumulative)
0%5%
11%14% 17% 16% 16%
11%
0%6%
16%
31%
48%
64%
80%
92%
0%
20%
40%
60%
80%
100%
120%
2008
2009
2010
2011
2012
2013
2014
Nov-1
5
Cash allocation
Cash allocation (cumulative)
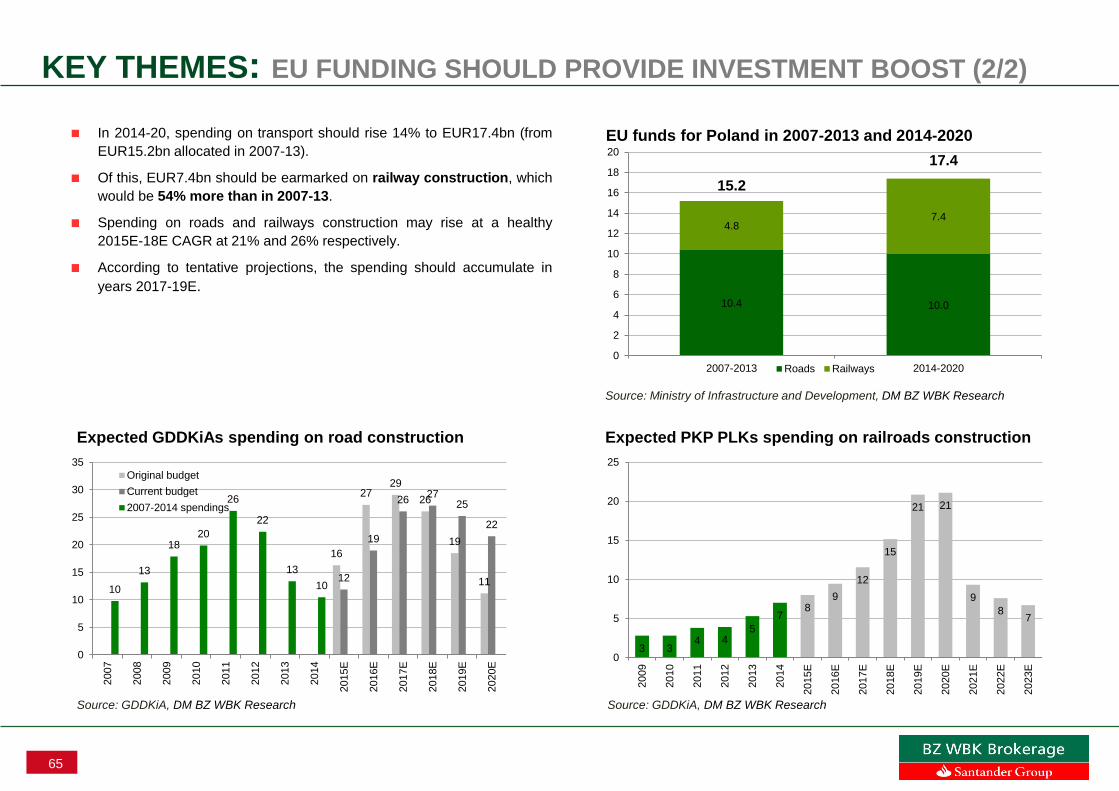
65
KEY THEMES: EU FUNDING SHOULD PROVIDE INVESTMENT BOOST (2/2)
In 2014-20, spending on transport should rise 14% to EUR17.4bn (from
EUR15.2bn allocated in 2007-13).
Of this, EUR7.4bn should be earmarked on railway construction, which
would be 54% more than in 2007-13.
Spending on roads and railways construction may rise at a healthy
2015E-18E CAGR at 21% and 26% respectively.
According to tentative projections, the spending should accumulate in
years 2017-19E. 10.4 10.0
4.8 7.4
0
2
4
6
8
10
12
14
16
18
20
2007-2013 2014-2020Roads Railways
15.2
17.4
EU funds for Poland in 2007-2013 and 2014-2020
Expected PKP PLKs spending on railroads construction Expected GDDKiAs spending on road construction
Source: Ministry of Infrastructure and Development, DM BZ WBK Research
Source: GDDKiA, DM BZ WBK Research Source: GDDKiA, DM BZ WBK Research
3 34 4
5
78
9
12
15
21 21
9
87
0
5
10
15
20
25
2009
2010
2011
2012
2013
2014
2015E
2016E
2017E
2018E
2019E
2020E
2021E
2022E
2023E
16
2729
26
19
1112
19
2627
25
22
10
13
1820
26
22
13
10
0
5
10
15
20
25
30
35
2007
2008
2009
2010
2011
2012
2013
2014
2015E
2016E
2017E
2018E
2019E
2020E
Original budget
Current budget
2007-2014 spendings

66
KEY THEMES: INVESTMENT CYCLE (1/2)
The new government has outlined few pro-investment initiatives,
including:
CIT reduction for small & medium enterprises (cut to 15% from
19% currently)
Accelerated (and doubled) depreciation of some capex
Preference of Polish enterprises in implementation of public
investments.
As past trends suggest, the investment/economic growth is directly
helping the 1) construction output, 2) production output, 3) residential
developments, 4) corporate loans originations, and 5) retail sales.
Stocks offering exposure to investment cycle: Amica, Apator, Asseco
Poland, Elemental Holding, all construction (incl. Unibep, Erbud,
Budimex, Trakcja), ING BSK, Kęty, mBank, PKP Cargo, Pekao, and
Handlowy.
Rising investments are highly correlated with constr. output
Source: Bloomberg, CSO, DM BZ WBK Research
Growing capacity utilization supports new investments
Source: Bloomberg, CSO, DM BZ WBK Research
Source: Bloomberg, CSO, DM BZ WBK Research
Production output and GDP growth
0
1
2
3
4
5
6
7
8
9
-15
-10
-5
0
5
10
15
20
25
30
1Q
03
3Q
03
1Q
04
3Q
04
1Q
05
3Q
05
1Q
06
3Q
06
1Q
07
3Q
07
1Q
08
3Q
08
1Q
09
3Q
09
1Q
10
3Q
10
1Q
11
3Q
11
1Q
12
3Q
12
1Q
13
3Q
13
1Q
14
3Q
14
1Q
15
3Q
15
Production output (% y/y, LHS) GDP (% y/y, RHS)
70
72
74
76
78
80
82
84
86
-15
-10
-5
0
5
10
15
20
25
30
1Q
03
3Q
03
1Q
04
3Q
04
1Q
05
3Q
05
1Q
06
3Q
06
1Q
07
3Q
07
1Q
08
3Q
08
1Q
09
3Q
09
1Q
10
3Q
10
1Q
11
3Q
11
1Q
12
3Q
12
1Q
13
3Q
13
1Q
14
3Q
14
1Q
15
3Q
15
Fixed investments (% y/y, LHS) Capacity utilisation (%, RHS)
-30
-20
-10
0
10
20
30
40
50
1Q
96
1Q
97
1Q
98
1Q
99
1Q
00
1Q
01
1Q
02
1Q
03
1Q
04
1Q
05
1Q
06
1Q
07
1Q
08
1Q
09
1Q
10
1Q
11
1Q
12
1Q
13
1Q
14
1Q
15
Fixed investments (% y/y)
Construction output (% y/y)

67
KEY THEMES: INVESTMENT CYCLE (2/2)
-40
-30
-20
-10
0
10
20
30
40
I.00
VII
.00
I.01
VII
.01
I.02
VII
.02
I.03
VII
.03
I.04
VII
.04
I.05
VII
.05
I.06
VII
.06
I.07
VII
.07
I.08
VII
.08
I.09
VII
.09
I.10
VII
.10
I.11
VII
.11
I.12
VII
.12
I.13
VII
.13
I.14
VII
.14
I.15
VII
.15
General business climate indicator
Current general economic situation of the enterprise
Correlation between fixed investments and retail sales
Growth in apartment sales volume outpaced this of GDP Correlation between fixed investments and corp. loans
Improving business climate indicators
Source: Bloomberg, CSO, DM BZ WBK Research
Source: Bloomberg, CSO, DM BZ WBK Research Source: Bloomberg, CSO, DM BZ WBK Research
Source: REAS, CSO, DM BZ WBK Research, *six largest agglomerations
0
1
2
3
4
5
6
7
8
9
0
2
4
6
8
10
12
14
1Q
07
3Q
07
1Q
08
3Q
08
1Q
09
3Q
09
1Q
10
3Q
10
1Q
11
3Q
11
1Q
12
3Q
12
1Q
13
3Q
13
1Q
14
3Q
14
1Q
15
3Q
15
Housing units sales volume* (in ths, LHS)
GDP (% y/y, RHS)
-1.5%
-1.0%
-0.5%
0.0%
0.5%
1.0%
1.5%
2.0%
2.5%
3.0%
-15
-10
-5
0
5
10
15
20
25
30
1Q
03
3Q
03
1Q
04
3Q
04
1Q
05
3Q
05
1Q
06
3Q
06
1Q
07
3Q
07
1Q
08
3Q
08
1Q
09
3Q
09
1Q
10
3Q
10
1Q
11
3Q
11
1Q
12
3Q
12
1Q
13
3Q
13
1Q
14
3Q
14
1Q
15
3Q
15
Fixed investments (% y/y, LHS)
Corporate loans (% y/y, RHS)
-5
0
5
10
15
20
25
-15
-10
-5
0
5
10
15
20
25
30
1Q
03
3Q
03
1Q
04
3Q
04
1Q
05
3Q
05
1Q
06
3Q
06
1Q
07
3Q
07
1Q
08
3Q
08
1Q
09
3Q
09
1Q
10
3Q
10
1Q
11
3Q
11
1Q
12
3Q
12
1Q
13
3Q
13
1Q
14
3Q
14
1Q
15
3Q
15
Fixed investments (% y/y, LHS)
Retail sales (% y/y, RHS)

68
EXPORT: OVERVIEW
The key drivers of the Polish export success story thus far were
.(1) price competitiveness (relatively low labour costs), 2)
satisfactory quality and (3) presence in the EU.
High capex of Polish producers resulted in higher productivity
which additionally increased Poles’ competitive position leading to
a significant improvement of Polish industrials.
Another factor that worked in favour of Polish exporters was the
strong USD that narrowed the relative advantage gap of Chinese
manufacturers and boosted foreign sales.
The export mix is shifting gradually towards more processed
goods with share of commodities and food falling. This bodes well
for the future as more innovative and higher profitable production
is being sold to Polish foreign contractors.
Further out export sales growth may be triggered by opening up
of new markets, e.g. Transatlantic Trade and Investment
Partnership (TTIP). This is, however, not going to be the case in
2016.
Source: Bloomberg, DM BZ WBK Research
…has been steadily improving
Source: Eurostat, data for 1H15, DM BZ WBK Research
Geographical split of PL exports
Export mix by products…
Source: Eurostat, DM BZ WBK Research
26%
32%
22%
3%
3%
15%
Germany
Eurozone (excl. Germany)
EU other
Russia
CIS
Other
-5%
0%
5%
10%
15%
20%
25%
2011 vs. 2010 2012 vs. 2011 2013 vs. 2012 2014 vs. 2013
Food and bevarages Fuels & crude materialsChemicals Manufactures goodsMachinery
Food and bevarages
Fuels & crude materials
Chemicals
Manufactures goods
Machinery
Other

69
EXPORT: DEPENDENT ON ECONOMIC ENVIRONMENT
Source: Bloomberg, DM BZ WBK Research
Stable EURPLN supports the export business.
Source: Bloomberg, DM BZ WBK Research
…Poland is highly dependent on Germany…
…but the global downturn in 2008 proved it can play alone.
Source: Bloomberg, DM BZ WBK Research
PMIs works as a leading GDP change indicator…
Source: Bloomberg, DM BZ WBK Research
40
42
44
46
48
50
52
54
56
58
-1.0%
-0.5%
0.0%
0.5%
1.0%
1.5%
2.0%
2.5%
3.0%
3.5%
Ju
l-11
Sep
-11
No
v-1
1
Ja
n-1
2
Mar-
12
May-1
2
Ju
l-12
Sep
-12
No
v-1
2
Ja
n-1
3
Mar-
13
May-1
3
Ju
l-13
Sep
-13
No
v-1
3
Ja
n-1
4
Mar-
14
May-1
4
Ju
l-14
Sep
-14
No
v-1
4
Ja
n-1
5
Mar-
15
May-1
5
Ju
l-15
Germany GDP y/y PMI GE
-6.0
-4.0
-2.0
0.0
2.0
4.0
6.0
8.0
1997
1998
1999
2000
2001
2002
2003
2004
2005
2006
2007
2008
2009
2010
2011
2012
2013
2014
2015
2016
2017
2018
Poland - GDP % y/y Euro - GDP % y/y
USA - GDP % y/y Germany - GDP % y/y
3.0
3.2
3.4
3.6
3.8
4.0
4.2
4.4
4.6
4.80.0
1.0
2.0
3.0
4.0
5.0
6.0
7.0
8.0
9.0
1Q
01
1Q
02
1Q
03
1Q
04
1Q
05
1Q
06
1Q
07
1Q
08
1Q
09
1Q
10
1Q
11
1Q
12
1Q
13
1Q
14
1Q
15
1Q
16
1Q
17
1Q
18
Poland - GDP % y/y EUR/PLN
30
35
40
45
50
55
60
65
Jan
-05
Oct-
05
Jul-0
6
Ap
r-07
Jan
-08
Oct-
08
Jul-0
9
Ap
r-10
Jan
-11
Oct-
11
Jul-1
2
Ap
r-13
Jan
-14
Oct-
14
Jul-1
5
PMI GE PMI PL
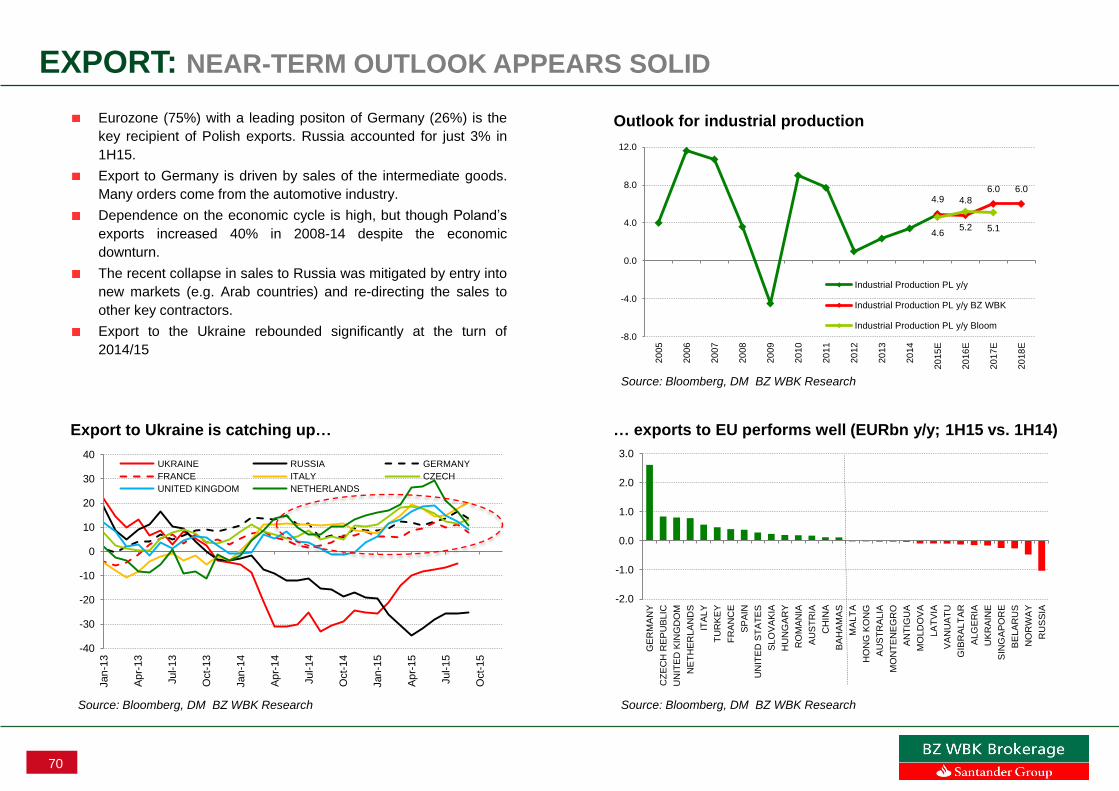
70
EXPORT: NEAR-TERM OUTLOOK APPEARS SOLID
Source: Bloomberg, DM BZ WBK Research
… exports to EU performs well (EURbn y/y; 1H15 vs. 1H14)
Source: Bloomberg, DM BZ WBK Research
Outlook for industrial production
Export to Ukraine is catching up…
Source: Bloomberg, DM BZ WBK Research
-40
-30
-20
-10
0
10
20
30
40
Jan
-13
Ap
r-13
Jul-1
3
Oct-
13
Jan
-14
Ap
r-14
Jul-1
4
Oct-
14
Jan
-15
Ap
r-15
Jul-1
5
Oct-
15
UKRAINE RUSSIA GERMANY
FRANCE ITALY CZECH
UNITED KINGDOM NETHERLANDS
-2.0
-1.0
0.0
1.0
2.0
3.0
GE
RM
AN
Y
CZ
EC
H R
EP
UB
LIC
UN
ITE
D K
ING
DO
M
NE
TH
ER
LA
ND
S
ITA
LY
TU
RK
EY
FR
AN
CE
SP
AIN
UN
ITE
D S
TA
TE
S
SLO
VA
KIA
HU
NG
AR
Y
RO
MA
NIA
AU
ST
RIA
CH
INA
BA
HA
MA
S
MA
LT
A
HO
NG
KO
NG
AU
ST
RA
LIA
MO
NT
EN
EG
RO
AN
TIG
UA
MO
LD
OV
A
LA
TV
IA
VA
NU
AT
U
GIB
RA
LT
AR
ALG
ER
IA
UK
RA
INE
SIN
GA
PO
RE
BE
LA
RU
S
NO
RW
AY
RU
SS
IA
Eurozone (75%) with a leading positon of Germany (26%) is the
key recipient of Polish exports. Russia accounted for just 3% in
1H15.
Export to Germany is driven by sales of the intermediate goods.
Many orders come from the automotive industry.
Dependence on the economic cycle is high, but though Poland’s
exports increased 40% in 2008-14 despite the economic
downturn.
The recent collapse in sales to Russia was mitigated by entry into
new markets (e.g. Arab countries) and re-directing the sales to
other key contractors.
Export to the Ukraine rebounded significantly at the turn of
2014/15
4.9 4.8
6.0 6.0
4.65.2 5.1
-8.0
-4.0
0.0
4.0
8.0
12.0
20
05
20
06
20
07
20
08
20
09
20
10
20
11
20
12
20
13
20
14
20
15
E
20
16
E
20
17
E
20
18
E
Industrial Production PL y/y
Industrial Production PL y/y BZ WBK
Industrial Production PL y/y Bloom

71
EXPORT: SECTOR POSITIONING
Source: Bloomberg, DM BZ WBK Research
…though partly due to on large single names like KGHM.
Source: Bloomberg, DM BZ WBK Research
….is not always indicative for the currency split.
Foreign sales drives the market perfomance of exporters…
Source: Bloomberg, DM BZ WBK Research
Share of export sales by sectors…
Source: Bloomberg, DM BZ WBK Research
48%
58%
75%
84%
82%
18%
78%
99%
100%
48%
25%
24%
10%
7%
6%
5%
1%
0%
4%
17%
1%
6%
11%
76%
17%
0%
0% 20% 40% 60% 80% 100%
Industrials
Oil&Gas/Chemicals
Construction
Consumer
TMT
Metals&Mining
Other
Financials
Utilities
Poland Europe Other
100%
75%
80%
84%
32%
87%
100%
16%
55%
4%
1%
79%
23%
2%
9%
9%
1%
4%
7%
22%
7%
7%
66%
9%
15%
0% 20% 40% 60% 80% 100%
Financials
Construction
TMT
Consumer
Industrials
Other
Utilities
Metals&Mining
Oil&Gas/Chemicals
PLN USD Other EUR
0
20
40
60
80
100
120
140
Jan
-08
May-0
8
Se
p-0
8
Jan
-09
May-0
9
Se
p-0
9
Jan
-10
May-1
0
Se
p-1
0
Jan
-11
May-1
1
Se
p-1
1
Jan
-12
May-1
2
Se
p-1
2
Jan
-13
May-1
3
Se
p-1
3
Jan
-14
May-1
4
Se
p-1
4
Jan
-15
May-1
5
Se
p-1
5
mWig40 rebased sWig80 rebased
Export Index-40
-30
-20
-10
0
10
20
30
40
Polish Export y/y (%, rhs)0
20
40
60
80
100
120
140
Jan
-08
Jul-0
8
Jan
-09
Jul-0
9
Jan
-10
Jul-1
0
Jan
-11
Jul-1
1
Jan
-12
Jul-1
2
Jan
-13
Jul-1
3
Jan
-14
Jul-1
4
Jan
-15
Jul-1
5
mWig40 rebased Export Index adj. Export Index

72
COMMODITY CORNER: DIVERGENCES IN SNAPSHOT
Source: Bloomberg, DM BZ WBK Research
Silver spot price vs. net positions
Source: Bloomberg, DM BZ WBK Research
Copper spot price vs. net positions
Gold spot price vs. net positions
Source: Bloomberg, DM BZ WBK Research
Crude spot price vs. net positions
Source: Bloomberg, DM BZ WBK Research
-14
-9
-4
1
6
11
0
50
100
150
200
250
300
350
400
450
500
Se
p-9
8
Se
p-9
9
Se
p-0
0
Se
p-0
1
Se
p-0
2
Se
p-0
3
Se
p-0
4
Se
p-0
5
Se
p-0
6
Se
p-0
7
Se
p-0
8
Se
p-0
9
Se
p-1
0
Se
p-1
1
Se
p-1
2
Se
p-1
3
Se
p-1
4
Se
p-1
5
Copper spot price (lhs) Net positions ('000s) (rhs)
-50
-40
-30
-20
-10
0
10
20
30
40
50
0
20
40
60
80
100
120
140
160
Se
p-9
8
Se
p-9
9
Se
p-0
0
Se
p-0
1
Se
p-0
2
Se
p-0
3
Se
p-0
4
Se
p-0
5
Se
p-0
6
Se
p-0
7
Se
p-0
8
Se
p-0
9
Se
p-1
0
Se
p-1
1
Se
p-1
2
Se
p-1
3
Se
p-1
4
Se
p-1
5
Crude oil price Net positions ('000s) (rhs)
-100
-50
0
50
100
150
200
250
300
0
200
400
600
800
1000
1200
1400
1600
1800
2000
Se
p-9
8
Se
p-9
9
Se
p-0
0
Se
p-0
1
Se
p-0
2
Se
p-0
3
Se
p-0
4
Se
p-0
5
Se
p-0
6
Se
p-0
7
Se
p-0
8
Se
p-0
9
Se
p-1
0
Se
p-1
1
Se
p-1
2
Se
p-1
3
Se
p-1
4
Se
p-1
5Gold spot price (USD/oz) (Ihs)
Net postions ('000s) (rhs)
-35
-30
-25
-20
-15
-10
-5
0
0
10
20
30
40
50
60
Se
p-9
8
Ap
r-99
Nov-9
9
Jun
-00
Jan
-01
Au
g-0
1
Mar-
02
Oct-
02
May-0
3
Dec-0
3
Jul-0
4
Feb-0
5
Se
p-0
5
Ap
r-06
Nov-0
6
Jun
-07
Jan
-08
Au
g-0
8
Mar-
09
Oct-
09
May-1
0
Dec-1
0
Jul-1
1
Feb-1
2
Se
p-1
2
Ap
r-13
Nov-1
3
Jun
-14
Jan
-15
Au
g-1
5
Silver spot price (USD/oz) (Ihs)
Net positions ('000s) (rhs)
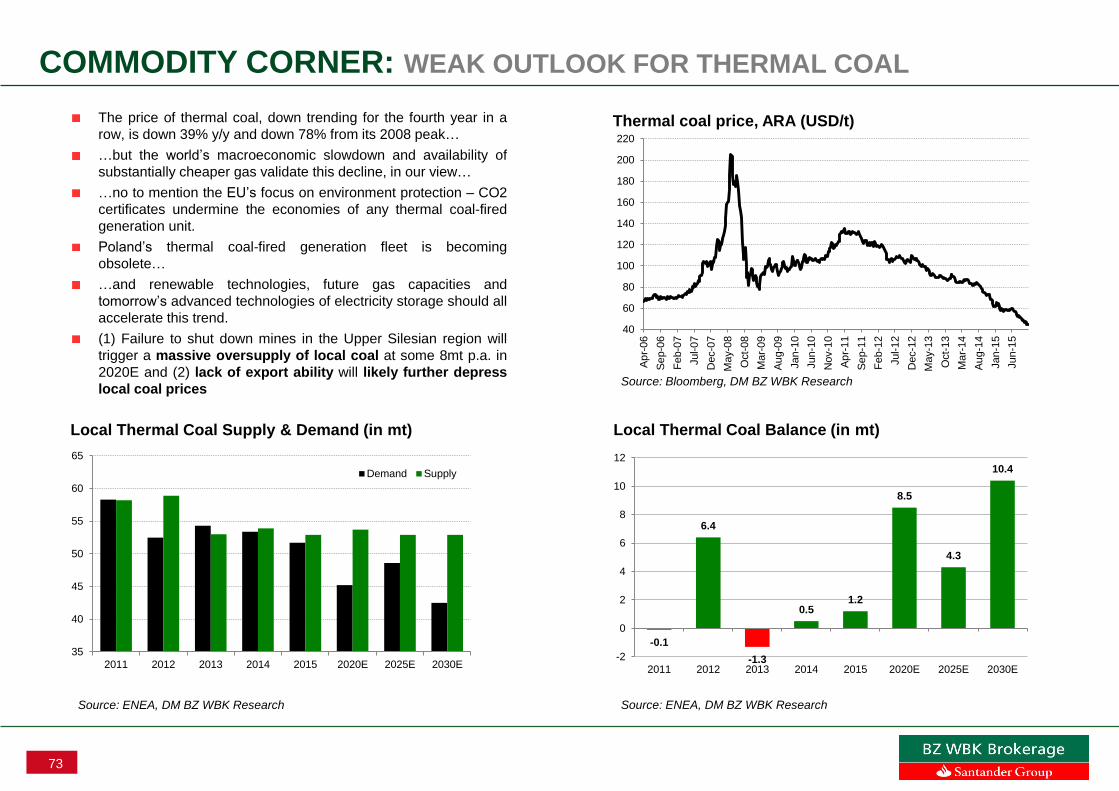
73
COMMODITY CORNER: WEAK OUTLOOK FOR THERMAL COAL
Source: ENEA, DM BZ WBK Research
Local Thermal Coal Balance (in mt)
Source: Bloomberg, DM BZ WBK Research
Thermal coal price, ARA (USD/t)
Local Thermal Coal Supply & Demand (in mt)
Source: ENEA, DM BZ WBK Research
The price of thermal coal, down trending for the fourth year in a
row, is down 39% y/y and down 78% from its 2008 peak…
…but the world’s macroeconomic slowdown and availability of
substantially cheaper gas validate this decline, in our view…
…no to mention the EU’s focus on environment protection – CO2
certificates undermine the economies of any thermal coal-fired
generation unit.
Poland’s thermal coal-fired generation fleet is becoming
obsolete…
…and renewable technologies, future gas capacities and
tomorrow’s advanced technologies of electricity storage should all
accelerate this trend.
(1) Failure to shut down mines in the Upper Silesian region will
trigger a massive oversupply of local coal at some 8mt p.a. in
2020E and (2) lack of export ability will likely further depress
local coal prices
35
40
45
50
55
60
65
2011 2012 2013 2014 2015 2020E 2025E 2030E
Demand Supply
-0.1
6.4
-1.3
0.51.2
8.5
4.3
10.4
-2
0
2
4
6
8
10
12
2011 2012 2013 2014 2015 2020E 2025E 2030E
40
60
80
100
120
140
160
180
200
220
Ap
r-06
Se
p-0
6
Fe
b-0
7
Jul-0
7
Dec-0
7
Ma
y-0
8
Oct-
08
Mar-
09
Au
g-0
9
Jan
-10
Jun
-10
Nov-1
0
Ap
r-11
Se
p-1
1
Fe
b-1
2
Jul-1
2
Dec-1
2
Ma
y-1
3
Oct-
13
Ma
r-14
Au
g-1
4
Jan
-15
Jun
-15

74
COMMODITY CORNER: LACK OF OUTPUT CUTS WILL CONTINUE TO MAKE COPPER SUFFER
Source: Codelco, DM BZ WBK Research
Copper Ore Grade on the slide (in %)
Source: Bloomberg, DM BZ WBK Research
Copper price to follow Chinese slowdown?
China Power Grid Investments (in CNY bn)
Source: Antofagasta, DM BZ WBK Research
China, the world’s key copper consumer, is facing trouble with its
GDP growth, which will have fallen to at least to 6.5%...
…and the China Leading Indicator broke the 100 level in 2H2014,
searching for new lows since then. In our view it suggests a
continuous downside to copper price
China’s actual 2015 investments into its electric grid fell
dramatically by some 25% y/y, substantially, underperforming the
official budget for the first time in several years. Unfortunately, we
do not have an outlook for copper’s most important sector
worldwide
Copper ore grade continues its slide, down from 1.0% by 2003 to
0.65% in 2015. Codelco sees copper ore grade falling further to
0.6%. New projects aside, the falling grade is a natural erosion of
copper production, thus supporting the copper price
Short-term negative: Codelco officially announced that a
reduction of copper output would be a last-resort decision, since
mine closures are expensive and difficult. The same approach
worldwide should trigger a prolonged copper price weakness
150
200
250
300
350
400
450
2011 2012 2013 2014 2015
Grid Investment budget Grid investment actual (current year annualised)
0.55
0.60
0.65
0.70
0.75
0.80
0.85
0.90
0.95
1.00
1985
1987
1989
1991
1993
1995
1997
1999
2001
2003
2005
2007
2009
2011
2013
2015
2017E
2019E
2021E
2023E
2025E
2,000
3,000
4,000
5,000
6,000
7,000
8,000
9,000
10,000
11,000
12,000
97
98
99
100
101
102
103
104
105
106
107
Ap
r-06
Se
p-0
6
Fe
b-0
7
Jul-0
7
Dec-0
7
Ma
y-0
8
Oct-
08
Ma
r-09
Au
g-0
9
Jan
-10
Jun
-10
Nov-1
0
Ap
r-11
Se
p-1
1
Fe
b-1
2
Jul-1
2
Dec-1
2
Ma
y-1
3
Oct-
13
Ma
r-14
Au
g-1
4
Jan
-15
Jun
-15
China Leading Index (LHS) LME Copper Price USD/t (RHS)

75
COMMODITY CORNER: TECHNICAL ANALYSIS OF COPPER AND SILVER
Source: Stooq.pl, BZWBK technical analyst, DM BZ WBK Research
Silver Futures monthly (USd/troz) Copper Futures monthly (USd/lb)
Source: Stooq.pl, BZWBK technical analyst, DM BZ WBK Research
View of technical analyst:
Copper down 26.5% YTD and 55.4% from all time high
Clear downtrend, with negative sequence of lower highs
followed by lower lows
Expected strong demand near upward trend line at USd193/lb
Bear market rally possible in coming months, with targets
at USd249/lb orUSd267/lb
The next strong support at USd150/lb
View of technical analyst:
Silver down 7% YTD and 71% from all-time high
Ending diagonal or wedge pattern sugests trend reversal in
coming weeks
Near term resistances at USD15.15/troz or USD16.37/troz
Bear market rally should lift price to USD23/troz or
USD25.15/troz
Strong support levels at USD11.7/troz or USD8.4/troz

76
COMMODITY CORNER: TECHNICAL ANALYSIS OF USDPLN AND BRENT
Source: Stooq.pl, BZWBK technical analyst, DM BZ WBK Research
ICE Brent Futures monthly (USD/bbl) USDPLN exchange rate monthly
Source: Stooq.pl, BZWBK technical analyst, DM BZ WBK Research
View of technical analyst:
USD/PLN up 12.1% YTD and up 96.6% from 2008 lows
Mid-term trend confirmed
Look for some more upside with potential targets at 4,30-
4,50 range…
…before substantial reversal
Near term support levels at 3,85 and 3,62
View of technical analyst:
Brent down 25% YTD or 71% from all-time high
Currently trading slightly above August'15 low at USD42,23/bbl
More selling quite likely, with potential targets at 2008 lows
at USD37.45/bbl or USD30/bbl…
…before stronger rebound (no clarity on timing)
Resistances at USD54.05/bbl or USD69.58/bbl

77
COMMODITY CORNER: TECHNICAL ANALYSIS OF GOLD AND MOLYBDENUM
Source: Stooq.pl, BZWBK technical analyst, DM BZ WBK Research
Gold futures monthly (USD/troz) LME Molybdenum futures monthly (USD/t)
Source: Stooq.pl, BZWBK technical analyst, DM BZ WBK Research
View of technical analyst:
Molybdenum down 50% YTD and 74% from 2010 all-time high
at USD41,000/t
Strong trend down and no signs of reversal as yet
Near term support at USD9,500/t or USD8,400/t
Important resistances at USD13,700/t or USD14,850/t
View of technical analyst:
Gold down 8.3% YTD and 43.5% from all-time high
Ending diagonal or wedge pattern suggests strong reversal
to the upside
Near term resistances are at USD1,150/troz and USD1,191/troz
Bear market rally quite likely, with targets at USD1,433/troz
or USD1,490/troz in coming months
Alternative support at USD1,031/troz or USD820/troz

78
SECTOR AND STOCK CALLS

79
BANKS: THE FOG IS LIFTING
INVESTMENT CASE: 2016 is shaping up to be another tough year
for banks. On our sub-consensus estimates, the eight banks covered
combined will report a 4% earnings growth (down 17% in 2015E) but
this will largely be achieved owing to one-off gains on Visa. Alior and
PKO BP should deliver a double digit y/y growth in 2016E. There
appear to be upside risks to our 2016E EPS - faster-than-expected
pass-through of tax to customers or bold cost initiatives. On our
current assumptions banks will mitigate between 11% (Millennium) to
67% (Alior) of the bank levy in 2016E (38% to 93% in 2017E). And
2016 may not be a bad year from the share price perspective if the
USD rally ends and if banks start discounting an earnings recovery in
2017E. Finally, WIG Banks never fell (and underperformed the broad
Warsaw market) two years in a row.. For more details please refer to:
separately published Polish banks: The fog is lifting SECTOR
OUTLOOK: OVERWEIGHT.
VALUATION: Valuations are becoming attractive. On our new ‘all-in’
2016-17E earnings, average 2016E P/E of 11.5x is at the lowest level
since 2012, while YE16E P/B of 1.1x has not been this low since 2011
(Fig 7). Valuation premiums to EU and EM peers (1.1x and 1.7x on
P/E respectively, 1.3x and 1.3x on P/B) are the lowest since 2009 and
2013 respectively, while YE16 P/B multiples start to look reasonable
from a ROE/COE perspective. Lastly, 2017E multiples are looking
even more attractive with average P/E of 11.3x and P/B 1.0x.
MAIN THEMES: 4Q15 earnings will be severely damaged by
significant one-offs (and 2015E will likely be ‘down year’ with
combined earnings down 17% y/y) but investors are likely to look to
2016 instead. Here, good news will also be scarce initially
(introduction of bank tax, benchmark rate cut, negative news flow
regarding dividends) but already 2Q16 should bring a turnaround in
earnings (windfall profits from Visa), Source: Bloomberg, DM BZ WBK Research
Source: Bloomberg, DM BZ WBK Research
WIG Bank’s Forward P/E
P/Book premium to EU Banks
0
5
10
15
20
25
Mar-
06
Sep
-06
Mar-
07
Sep
-07
Mar-
08
Sep
-08
Mar-
09
Sep
-09
Mar-
10
Sep
-10
Mar-
11
Sep
-11
Mar-
12
Sep
-12
Mar-
13
Sep
-13
Mar-
14
Sep
-14
Mar-
15
Sep
-15
Forward P/E L-t average
13.2x
11.5x
5.5x
BZ WBK estimates 12x
1.3
1.5
1.7
1.9
2.1
2.3
2.5
2.7
2.9
3.1
Mar-
06
Ju
l-06
No
v-0
6
Mar-
07
Ju
l-07
No
v-0
7
Mar-
08
Ju
l-08
No
v-0
8
Mar-
09
Ju
l-09
No
v-0
9
Mar-
10
Ju
l-10
No
v-1
0
Mar-
11
Ju
l-11
No
v-1
1
Mar-
12
Ju
l-12
No
v-1
2
Mar-
13
Ju
l-13
No
v-1
3
Mar-
14
Ju
l-14
No
v-1
4
Mar-
15
Ju
l-15
No
v-1
5
P/Book premium to EU banks 3Y average
1.9x
1.3x

80
BANKS (O/W): TOP PICKS:ALIOR, PKO BP SECTOR PICKS: Our preferred names are Alior (best EPS growth in 2016E, potential significant M&A related one-offs) and PKO BP (DY of 6.1%,
2016E of 10.3x). Handlowy, with its expensive multiples and GNB with its thin capital and 2016E EPS challenges are our least favourite names.
As for the remaining Buys, each has its charm, though perhaps appealing to different investors. ING BSK is not super cheap admittedly, but it should pay a
dividend in 2016E (DY of 2.8%) and more importantly it is the best play on the steepening yield curve. mBank and Millennium are cheap vs. peers on pretty
much all counts (Fig 9). This is due to their high exposure to FX mortgages. But as we believe that the government will be pragmatic on the issue, we think
they offer near-term upside. Finally, Pekao as always trades at a premium to peers owing to quality management, strong capital ratios, solid DY (6.1% in
2016E) and finally good liquidity in its stock. Its strong capital ratios at times of capital buffers being introduced look particularly attractive to us. The bank is
capable to significantly accelerate loan growth if it opts to and as a result capture a significant market share in the next year or two.
Source: Bloomberg, DM BZ WBK Research, * paid in the given year
Valuation table
Source: Bloomberg, DM BZ WBK Research
WIG Bank performance vs. interest rates Net profit in 2014-17E
Source: DM BZ WBK Research;
Rating TP Up(down)side Last price 2015E 2016E 2017E 2015E 2016E 2017E 2015E 2016E 2017E 2015E 2016E 2017E
Alior Bank Buy 87 32% 66 16.0 12.7 10.2 1.4 1.2 1.1 9.2 10.5 11.5 0.0 0.0 0.0
GNB Sell 0.47 -13% 0.54 22.1 9.2 8.6 0.3 0.3 0.3 1.3 3.0 3.1 0.0 0.0 0.0
Handlow y Sell 67 -2% 68 14.8 17.8 15.4 1.3 1.3 1.3 8.4 7.2 8.3 10.9 6.8 5.6
ING BSK Buy 139 22% 114 14.1 15.8 13.3 1.4 1.4 1.3 10.1 8.8 9.9 3.5 2.8 2.5
mBank Buy 346 17% 296 9.5 10.7 9.0 1.0 1.0 0.9 11.3 9.3 10.2 0.0 4.4 0.0
Millennium Buy 5.8 17% 5.0 10.4 10.0 8.4 1.0 0.9 0.8 9.6 9.2 10.0 0.0 0.0 0.0
Pekao Buy 156 16% 135 15.6 16.2 14.8 1.5 1.5 1.5 9.5 9.2 10.0 7.4 6.1 5.9
PKO BP Buy 31 21% 26 12.3 9.8 10.1 1.1 1.0 1.0 9.1 10.6 9.7 0.0 6.4 3.0
Average 14.3 12.8 11.2 1.1 1.1 1.0 8.5 8.5 9.1 2.7 3.3 2.1
Market cap w eighted average 13.5 14.3 12.4 1.3 1.2 1.2 9.8 9.0 9.8 2.9 3.7 2.5
Median 14.4 11.7 10.2 1.2 1.1 1.0 9.3 9.2 10.0 0.0 3.6 1.3
WIG Bank w eighted 12.0 11.3 10.5 1.1 1.0 1.0 8.0 8.5 8.7 2.5 4.4 2.9
ROE (%) Div. Yield (%)*P/E (x) P/Book (x)
2014 y/y 2015E y/y 2016E y/y 2017E y/y
Alior 312 37% 299 -4% 377 26% 470 25%
GNB 360 -10% 65 -82% 156 141% 167 7%
Handlow y 947 -3% 605 -36% 502 -17% 579 15%
ING BSK 1,041 8% 1,050 1% 939 -11% 1,113 18%
mBank 1,287 7% 1,320 3% 1,171 -11% 1,384 18%
Millennium 651 21% 578 -11% 603 4% 719 19%
Pekao 2,715 -3% 2,268 -16% 2,186 -4% 2,389 9%
PKO BP 3,254 1% 2,601 -20% 3,241 25% 3,151 -3%
Total 10,566 2% 8,785 -17% 9,175 4% 9,971 9%
Average 7% -20% 18% 13%
Median 2% -16% 4% 15%
1
2
3
4
5
6
7
8
9
10
0
1,000
2,000
3,000
4,000
5,000
6,000
7,000
8,000
9,000
10,000
Sep
-03
Mar-
04
Sep
-04
Mar-
05
Sep
-05
Mar-
06
Sep
-06
Mar-
07
Sep
-07
Mar-
08
Sep
-08
Mar-
09
Sep
-09
Mar-
10
Sep
-10
Mar-
11
Sep
-11
Mar-
12
Sep
-12
Mar-
13
Sep
-13
Mar-
14
Sep
-14
Mar-
15
Sep
-15
WIG Bank (lhs) 3M Wibor (rhs)

81
FINANCIAL SERVICES (NEUTRAL): STEADY GROWTH
INVESTMENT CASE: The financial service providers from our
coverage come from a broad range of sub-sectors and, as such, are
driven by various factors. We believe that the segment of
compensation cases should outperform in 2016 again. Both EuCo
and Votum have large portfolios of pre-court cases and we expect
major insurance companies to pay record-high compensations in pre-
court cases in 4Q15. We also believe that this trend will continue in
2015. We prefer EuCO over Votum next year due to its lower
valuation ratio (2016E P/E of 8.5x and 2016E P/E of 7.9x vs. Votum’s
9.1x and 8.0x, respectively) and higher potential for positive one-offs
during the year. On a different note, there are high leverage
companies, such as Kruk and Magellan, but we expect the rally on
low interest rates to be over (50bp cut in 1Q/2Q16). MW Trade is
insensitive to interest rate changes, but it pays dividends with a DY of
c7.5%, same as PCM, so we expect this stock to be relatively
attractive. Of the smaller banks, BOS needs a capital injection of c.
PLN300-500mn for further growth. One of the scenarios assumes that
a financial investor will make it. The BPH investment case is based on
the conviction that GE (which currently holds 87% of the bank) will sell
its stake to a new strategic investor by YE16. Skarbiec looks cheap
and pays dividends, but its valuation is highly correlated to SF. Every
10bps gives PLN5 per share. Finally, we are neutral on Open
Finance, despite its seemingly attractive 2016E P/E of 7.0x. There is
a potentially significant risk that banks will cut margins or decrease
volumes to financial intermediaries (mortgage and consumer loans
contribute c50% of revenues to OF).
Source: Bloomberg, DM BZ WBK Research
Source: Bloomberg, DM BZ WBK Research
Magellan and Kruk vs. 3M WIBOR
Value of court cases (PLNmn)
0
100
200
300
400
500
600
700
800
900
1,000
EuC
O '1
0
Votu
m '1
0
EuC
O '1
1
Votu
m '1
1
EuC
O '1
2
Votu
m '1
2
EuC
O '1
3
Votu
m '1
3
EuC
O '1
4
Votu
m '1
4
EuC
O '9
M1
5
Votu
m '9
M15
Pre-court cases Court cases
0
100
200
300
400
500
600
Sep
-11
No
v-1
1
Ja
n-1
2
Mar-
12
May-1
2
Ju
l-12
Sep
-12
No
v-1
2
Ja
n-1
3
Mar-
13
May-1
3
Ju
l-13
Sep
-13
No
v-1
3
Ja
n-1
4
Mar-
14
May-1
4
Ju
l-14
Sep
-14
No
v-1
4
Ja
n-1
5
Mar-
15
May-1
5
Ju
l-15
Sep
-15
No
v-1
5
Ja
n-1
6
Mar-
16
May-1
6
Ju
l-16
Sep
-16
No
v-1
6
Kruk Magellan Wibor 3M

82
FINANCIAL SERVICES (NEUTRAL): PCM & EUCO ARE OUR TOP PICKS
SECTOR PICKS: EuCO and PCM are our top picks for next year. EuCO’s DY outlook remains generous at 8.0% in 2016E and 9.5% in 2017E. There are three
factors that underpin the improvement in the earnings outlook: 1) the value of the ongoing cases continues to rise (PLN547mn in 3Q15, up 41% y/y) despite
significant inflows from insurance companies (IC), 2) regulations concerning court proceedings are set to change next year in EuCO’s favour; 3) cases that account
for the bulk of its book tend to end in out-of-court settlements, resulting in cash circulation. And there is more good news in store, we think. The Romanian business
should be consolidated in 2016 or 2017 at the latest. EuCocar, a new business line, should start in 2016E or 2017E and there is another one in the pipeline. PCM’s
valuation appears reasonable since, on our estimates, it trades at a 2015E P/E of 9x and YE15E P/Book 0.8x. A DY of nearly 10% is likely this year. And this is
another attractive side of the stock, we reckon. Going forward, the focus will be on SMEs/micro-companies, further operating improvements in the service and
remarketing segments and higher volumes of vehicles, all of which should drive earnings’ growth.
Source: Bloomberg, DM BZ WBK Research, * paid in the given year
Valuation table
Dividend yield (%) Net profit in 2013-17E
Source: Companies data, DM BZ WBK Research *ex- banking tax Source: Companies data, DM BZ WBK Research
8.07.5
10.0
5.7
8.4
0
2
4
6
8
10
12
EuCO MW Trade PCM Votum Skarbiec
2013 2014 y/y 2015E y/y 2016E y/y 2017E y/y
BOS 64 66 2% 13 -81% 46* 259% 69* 52%
BPH 192 112 -42% 26 -77% 21* -18% 64* 199%
EuCO 10 15 49% 25 62% 29 19% 33 11%
Magellan 43 52 20% 53 2% 59 12% 69 17%
MW Trade 14 17 22% 20 18% 23 14% 25 11%
Open Finance 56 30 -47% 28 -7% 29 4% 30 4%
PRESCO 7 2 -72% 5 153% 6 21% 7 7%
PCM 44 63 42% 40 -36% 46 15% 52 14%
Skarbiec 10 29 181% 22 -25% 18 -17% 22 24%
VOTUM 5 10 87% 16 62% 21 34% 25 21%
Rating TP (PLN) Up(down)sideLast price (PLN) 2015E 2016E 2017E 2015E 2016E 2017E 2015E 2016E 2017E 2015E 2016E 2017E
BOS Hold 24 28% 19 34.3 9.5 6.3 n.a. n.a. n.a. 0.0 0.0 0.0 0.8 2.8 4.1
BPH Buy 45 49% 30 89 108 36 n.a. n.a. n.a. 0.0 0.0 0.0 0.5 0.4 1.2
EuCO Buy 57 24% 46 10.4 8.7 7.9 7.9 6.6 5.4 5.9 8.0 9.5 52.3 50.7 49.2
Magellan Buy 84 50% 56 7.0 6.3 5.4 27.7 28.7 n.a. 0.0 0.0 0.0 15.4 14.9 15.0
MW Trade Buy 22 38% 16 6.6 5.8 5.3 30.8 28.7 27.9 7.5 8.5 9.5 25.8 25.8 25.2
Open Finance Buy 5.9 117% 3 5.4 5.2 5.0 6.0 5.5 4.8 0.0 3.7 5.8 5.9 5.8 5.8
PRESCO Sell 2.1 -68% 6 25.3 20.9 19.5 15.2 13.8 14.5 0.1 0.1 0.1 4.2 4.9 5.0
PCM Buy 53 55% 34 10.0 8.7 7.7 n.a. n.a. n.a. 10.0 11.4 13.0 8.3 9.6 10.8
Skarbiec Buy 56 78% 31 9.9 11.9 9.6 6.6 7.8 n.a. 8.4 10.4 10.5 19.2 23.8 23.4
Votum Buy 26 63% 16 12.2 9.1 7.6 8.9 6.3 4.9 4.2 5.7 7.1 60.3 60.3 55.3
Average 20.9 18.9 11.0 14.8 13.6 11.5 3.3 4.4 5.0 19.7 20.1 17.7
Median 10.4 9.1 7.6 12.0 9.6 5.4 0.1 3.7 5.8 15.4 14.9 10.8
P/E (x) EV/EBITDA (x) Div. Yield (%) ROE (%)

83
OIL & GAS (O/W): DOWNSTREAM REMAINS KEY TO VALUE
Source: Bloomberg, DM BZ WBK Research
World Oil Supply Surplus / Deficit vs. Brent oil Price
Source: Bloomberg, Santander , DM BZ WBK Research
BZ WBK Brent oil long term view in US$/bbl INVESTMENT CASE: The continuing low oil price environment is driven
by a fundamental oversupply, caused by new non-OPEC production
combined with anaemic global demand. We expect the oil market
imbalance to remain in place in 2016, although the growth in supply
should ease going forward, mainly in non-OPEC regions as they respond
to weak oil prices. We believe that in 2016 the cost base and cash
management of the oil companies should evolve to allow oil & gas
companies to function profitably at new-era oil price levels. European
refiners should experience another good year in 2016E, helped by weak
oil prices, continuing strong demand for gasoline and tightening
competition between oil producers struggling for market share (widening
Brent-Ural differential). The latter driver could provide structural support
for CEE refiners in generating strong returns from oil processing, we
think. Finally, weak local currencies in relation to USD should be another
value booster for CEE oil & gas companies. SECTOR OUTLOOK:
OVERWEIGHT.
VALUATION: CEE oil & gas companies remain relatively cheap vs their
pan-European peers in terms of P/E and EV/EBITDA, although the gap
narrows in terms of EV/DACF ratio (typical for upstream-oriented names).
The weak oil price environment should support downstream-oriented
companies’ (PKN and LOTOS) valuations in 2016E, while companies
that are relatively more skewed to upstream (PGN) will have to divest
assets and/or keep restructuring to bring in cash and offload capital
commitments.
OIL PRICE ASSUMPTIONS: Our new assumptions for Brent crude in
2015E, 2016E and 2017E are US$53/bbl (prev. US$54.5/bbl), US$50/bbl
(prev. US$58/bbl) and US$55/bbl (prev. US$62/bbl), respectively. Our
long-term assumption is US$65/bbl (prev. US$70/bbl).
MAIN THEMES: We see five major triggers for the CEE oil & gas
companies’ share prices in 2016: (1) oil price development; (2) refining
margins’ strength; (3) widening light-heavy oil spreads; (4) progressive
gas market liberalisation in Poland (PGN); and (5) the EUR/USD rate.
0
20
40
60
80
100
120
140
-4
-3
-2
-1
0
1
2
3
4
1996
1999
2002
2005
2008
2011
2014
BRENT Dated Price (US$/bbl) World Oil Supply Surplus/Deficit (MMbbl/d)
20
40
60
80
100
120
140
01-02 01-04 01-06 01-08 01-10 01-12 01-14 01-16 01-18 01-20
Monthly Brent-1M Brent Future 17/6/14 BZ WBK Assumptions
Brent Future 4/12/15 Brent Future 19/01/09 Brent Future 21/05/08

84
OIL&GAS (O/W): PKN IS OUR TOP PICK…
SECTOR TOP PICKS / SELLS: We are Positive on PKN (Hold, TP PLN72.0) as we believe that strong downstream business, improved cash delivery
and supportive FX markets should drive stock share price next year. We have Neutral approach on LOTOS (Hold, TP PLN32.0). Even though the
company should enjoy a strong refining macro environment, its exposure to USD-denominated debt is likely to limit its stock price, we think. Besides we
point that LOTOS is in the middle of the capex-cycle, what should weigh on the dividend potential. We are Negative on PGNiG (Sell, TP PLN5.77) as,
despite the recent share price drop (c26% in last month), progressive gas market liberalisation in Poland (lower margins on gas trading) and expected
cuts in gas tariffs and WACC in the distribution business are likely to weigh on its earnings next year. Our view on CEE oil&gas names: we are positive
on MOL and OMV. In our opinion MOL’s downstream business should benefit from efficiency improvements, but we expect its upstream output targets to
be trimmed in early 2016E, given delays in Kurdistan projects. We are also Positive on OMV for next year – despite the recent share price rally. We
strongly believe that the maintenance of DPS at EUR1.25 (DY at c5.0%) should be a strong driver for the company’s share price, at least in 1H16E.
Source: PGNiG, Bloomberg, DM BZ WBK Research
NWE Brent 3-2-1 crack spread vs. Brent oil in US$/bbl
Source: Bloomberg, DM BZ WBK Research
Key Data, 4 December 2015
EV/DACFEV/EBITDA Adj P/E DY
(local) (US$ mn) Rating Rating (local) (%) (local) (x) (x) (x) (%)
PKN PKN PW PLN 66.3 8.3 HOLD SELL 72.0 9% 50.8 n/a 5.1 7.3 4.1
LOTOS LTS PW PLN 28.4 1.4 HOLD SELL 32.0 13% 23.9 n/a 5.4 6.9 0.0
PGNiG PGN PW PLN 5.0 7.9 SELL HOLD 5.77 15% 4.8 6.8 5.2 9.9 4.1
7.8 5.8 13.3 6.2
2016E
Sector median*
New Old New TP Upside Old TPCompany Ticker Currency
Market Price Mkt Cap
0
20
40
60
80
100
120
140
-10
-5
0
5
10
15
20
25
30
20
00
20
03
20
06
20
09
20
12
20
15
BRENT Dated Price (rhs) Dated Brent oil 321 crack spread NWE (lhs)
Polish TGE spot prices & PGNiG gas tariff vs. TTF spot 117 115
112
106
10
12
14
16
18
20
22
24
50
60
70
80
90
100
110
120
Jan-14 May-14 Aug-14 Nov-14 Feb-15 Jun-15 Sep-15
TGE gas price - day ahead market PLN/MWh (lhs)PGNiG - average gas tariff price PLN/MWh (lhs)Impact of gas discountsTTF gas spot EUR/MWh (rhs)

85
OIL&GAS (O/W): FORWARD P/E AND EV/EBITDA BELOW AVERAGE
Source: Bloomberg, DM BZ WBK Research
WIG Oil & Gas Forward EV/EBITDA
Source: Bloomberg, DM BZ WBK Research
Oil & Gas stocks – percentage change vs. SXEP Index
WIG Oil & Gas Forward P/E
Source: Bloomberg, DM BZ WBK Research
SXEP Index vs. WSE listed major Oil & Gas stocks - rebased
Source: Bloomberg, DM BZ WBK Research
0.20
0.40
0.60
0.80
1.00
1.20
1.40
1.60
1.80
2.00
2.20
Ja
n-1
4
Feb
-14
Mar-
14
Apr-
14
May-1
4
Ju
n-1
4
Ju
l-14
Aug
-14
Sep
-14
Oct-
14
No
v-1
4
De
c-1
4
Ja
n-1
5
Feb
-15
Mar-
15
Apr-
15
May-1
5
Ju
n-1
5
Ju
l-15
Aug
-15
Sep
-15
Oct-
15
No
v-1
5
De
c-1
5
SXEP PKN PGN LTS
-0.6
7.9
-0.3
5.4
-7.4
3.9
-1.1
-25.7
5.4
-9.8
-2.6
-21.0
-30
-20
-10
0
10
20
30
40
SXEP PKN LTS PGN
1 week 1 month 3 months
4.0
4.5
5.0
5.5
6.0
6.5
7.0
7.5
Ma
r-06
Au
g-0
6
Jan
-07
Jun
-07
Nov-0
7
Ap
r-08
Se
p-0
8
Feb-0
9
Ju
l-0
9
Dec-0
9
Ma
y-1
0
Oct-
10
Ma
r-11
Au
g-1
1
Jan
-12
Jun
-12
Nov-1
2
Ap
r-13
Se
p-1
3
Feb-1
4
Ju
l-1
4
Dec-1
4
Ma
y-1
5
Oct-
15
WIG OIL&GAS EV/EBITDA fwd LT averageSTD +/- 1 STD +/- 2
5
6
7
8
9
10
11
12
13
14
15
Ma
r-06
Au
g-0
6
Jan
-07
Jun
-07
Nov-0
7
Ap
r-08
Se
p-0
8
Fe
b-0
9
Jul-0
9
Dec-0
9
Ma
y-1
0
Oct-
10
Ma
r-11
Au
g-1
1
Jan
-12
Jun
-12
Nov-1
2
Ap
r-13
Se
p-1
3
Fe
b-1
4
Jul-1
4
Dec-1
4
Ma
y-1
5
Oct-
15
WIG OIL&GAS PE fwd LT average
STD +/- 1 STD +/- 2

86
CHEMICALS (NEUTRAL): USD/EUR RATE AND GAS PRICE KEY TO VALUE
Source: Bloomberg, DM BZ WBK Research
*DM BZ WBK Research: major European benchmark product and input prices
Major fertilizers & feedstock indices* - rebased
Source: Bloomberg, DM BZ WBK Research
*DM BZ WBK Research: major European benchmark product and input prices
Major chemicals & feedstock indices* – rebased INVESTMENT CASE: WIG Chemicals, up 48% YTD, significantly
outperformed the WIG index (down 10% YTD) on strong share price
performance of Ciech (up 101% YTD) and Grupa Azoty (up 68% YTD).
Such strong performance of Ciech was caused by decent soda ash price
rises and cheaper coal and coke quotations, while Grupa Azoty enjoyed
lower gas prices. In our opinion, the chemical sector has some potential
to improve its earnings next year. The strong US$ vs. EUR, persistently
weak oil and gas prices should be supportive for the European chemical
companies. However, we need to point out that the WSE-listed chemical
companies have performed strongly YTD, though we do not expect all of
them to enjoy a rise in their earnings. All in all, we are Neutral on the
sector. SECTOR OUTLOOK: NEUTRAL.
VALUATION: The sector’s multiples are slightly lower compared with the
beginning of the year, with the average P/E forward now at 14.5x on the
Bloomberg consensus (vs. 15.9x end-2014). However, the sector’s
multiple still trades above its historical levels (l-t average is 10.7x). The
multiples’ expansion is not visible on the EV/EBITDA forward ratio either,
which currently is at 7.4x on average compared to 7.3x at end-2013 (l-t
average at 5.8x).
MAIN THEMES: US$/EUR, crude oil and gas price developments will
likely be the key drivers for the chemical companies next year. We would
like to highlight that a strong US$/EUR is very supportive for the chemical
companies as it protects the whole sector from overseas imports. In
2016, cheaper gas prices should offer Polish fertiliser producers relief
throughout the year, but the persisting poor grain prices should keep a lid
on their profitability growth. The synthetic rubber market fundamentals
remain unchanged (bearish), while the re-start of Unipetrol’s Litvinov
plant will be crucial for Synthos in 2016. The European soda ash markets
look fundamentally balanced and stable on recovering demand for glass.
We expect a small rise in the soda ash prices in 2016 (up EUR3/t) and
attractive coal and coke quotations.
-75
-25
25
75
125
175
225
275
325
0.50
0.75
1.00
1.25
1.50
1.75
2.00
Jan
-10
Ap
r-10
Jul-1
0
Oct-
10
Jan
-11
Ap
r-11
Jul-1
1
Oct-
11
Jan
-12
Ap
r-12
Jul-1
2
Oct-
12
Jan
-13
Ap
r-13
Jul-1
3
Oct-
13
Jan
-14
Ap
r-14
Jul-1
4
Oct-
14
Jan
-15
Ap
r-15
Jul-1
5
Oct-
15
Cash margin on AN (EUR/t) lhsFertilizers index (AN, CAN, Urea, NPK, DAP)Feedstock index (TTF gas, Potassium salt, Phosphate rock)
Weak gas price in Europe are supportive for feriliser production profitability
-100
0
100
200
300
400
500
600
700
0.35
0.60
0.85
1.10
1.35
1.60
1.85
Jan
-10
Ap
r-10
Jul-1
0
Oct-
10
Jan
-11
Ap
r-11
Jul-1
1
Oct-
11
Jan
-12
Ap
r-12
Jul-1
2
Oct-
12
Jan
-13
Ap
r-13
Jul-1
3
Oct-
13
Jan
-14
Ap
r-14
Jul-1
4
Oct-
14
Jan
-15
Ap
r-15
Jul-1
5
Oct-
15
Agregated product/feedstock spread (EUR/t) lhs
Chemicals index (Caprolactam, PA6, Melamine, OXO, Plasticizers, SBR, Soda ash)
Feedstock index (Benzene, Phenol, TTF gas, Propylene, O-xylene, Butadiene, Styrene)
- impact of lower crude oil price
- marked margin volatility

87
CHEMICALS (NEUTRAL): WE ARE POSITIVE ON CIECH AND PULAWY
SECTOR TOP PICKS / SELLS: Grupa Azoty (Sell, TP PLN52.5) is the most expensive chemical stock in our coverage universe on its P/E multiple for
2016. However, our call on Grupa Azoty from last year (the stock was a top short in the sector) did not materialise with the cheaper gas prices proving
supportive for its earnings. Since we expect gas prices to remain low next year, we change our rating of Grupa Azoty to Neutral. The lower gas prices
should also support Police (Sell, TP PLN16.3) and Pulawy (Buy, TP PLN211). We are, however, Positive only about Pulawy given its clean balance
sheet, strong cash flows and low multiples. We are Neutral on Police at its current market price. We are Positive on Synthos (Sell, TP PLN4.5) due to its
recent share price de-rating. We expect that the company’s earnings will be under pressure in 2016E due to stoppages at the Litvinov plant (Unipetrol).
However, we strongly believe that the expected decent dividend pay-out from the 2015E earnings (DY at c5%) should be the key driver for its share price
in 1H16. Ciech (Buy, TP PLN100) is our top pick among the chemical names. The tight soda ash markets in Europe, the expected EUR3/t soda price
rise and delays in the Turkish trona projects’ ramp-up are the key factors behind our call. Ciech’s bottom line should grow on lower debt costs.
Source: PGNiG, Bloomberg, DM BZ WBK Research
Chemical sector EBITDA development 2007-2016E
Source: Bloomberg, DM BZ WBK Research
Chemical sector bottom line development 2007-2016E
Market Cap P/E EV/EBITDA Stock Performance
Company (PLN bn) 2015E 2016E 2017E 2015E 2016E 2017E 1M 3M YTD
SYNTHOS 4.8 12.9 10.9 9.4 8.7 7.3 6.2 -6% -3% -11%
GRUPA AZOTY 10.5 20.2 18.0 17.1 8.7 7.4 7.0 13% 18% 68%
AZOTY PULAWY 4.2 9.7 8.8 9.9 6.0 4.9 4.9 24% 31% 58%
AZOTY POLICE 2.0 16.3 12.9 12.3 8.7 7.2 6.9 13% 13% 47%
CIECH 4.5 19.9 12.3 12.1 8.4 7.4 7.3 7% 19% 101%
WIG CHEMICALS 17.4 14.1 13.2 8.8 7.5 7.1 7% 14% 48%
SX4P INDEX 17.3 16.0 14.6 9.6 9.0 8.5 -5% 2% 6%
0
500
1000
1500
2000
2500
3000
3500
4000
4500
2007
2008
2009
2010
2011
2012
2013
2014
2015E
2016E
PLN mn
-500
0
500
1000
1500
2000
2500
2007
2008
2009
2010
2011
2012
2013
2014
2015E
2016E
PLN mn

88
CHEMICALS (NEUTRAL): MARKED SECTOR RE-RATING YTD
Source: Bloomberg, DM BZ WBK Research
WIG Chemicals Forward EV/EBITDA
Source: Bloomberg, DM BZ WBK Research
Chemical stocks – percentage change vs. SX4P Index
WIG Chemicals Forward PE
Source: Bloomberg, DM BZ WBK Research
SX4P Index vs. WSE listed major chemicals stocks - rebased
Source: Bloomberg, DM BZ WBK Research
0.9
-3.9
2.7
-0.7
-4.4
0.1
-5.1 -5.9
13.2
24.2
13.3
7.3
1.6
-2.9
17.9
31.2
13.3
19.5
-10
-5
0
5
10
15
20
25
30
35
SX4P SNS ATT ZAP PCE CIE
1 week 1 month 3 months
3
5
7
9
11
13
15
17
Oct-
08
Fe
b-0
9
Jun
-09
Oct-
09
Fe
b-1
0
Jun
-10
Oct-
10
Fe
b-1
1
Jun
-11
Oct-
11
Fe
b-1
2
Jun
-12
Oct-
12
Fe
b-1
3
Jun
-13
Oct-
13
Feb-1
4
Jun
-14
Oct-
14
Fe
b-1
5
Jun
-15
Oct-
15
WIG CHEMICALS PE fwd LT average
STD +/- 1 STD +/- 2
2.5
3.5
4.5
5.5
6.5
7.5
8.5
Oct-
08
Fe
b-0
9
Jun
-09
Oct-
09
Feb-1
0
Jun
-10
Oct-
10
Fe
b-1
1
Jun
-11
Oct-
11
Fe
b-1
2
Jun
-12
Oct-
12
Fe
b-1
3
Jun
-13
Oct-
13
Fe
b-1
4
Jun
-14
Oct-
14
Feb-1
5
Jun
-15
Oct-
15
WIG CHEMICALS EV/EBITDA fwd
LT average
STD +/- 1
0.00
0.50
1.00
1.50
2.00
2.50
3.00
Jan
-14
Fe
b-1
4
Ma
r-1
4
Ap
r-14
Ma
y-1
4
Jun
-14
Jul-1
4
Au
g-1
4
Se
p-1
4
Oct-
14
Nov-1
4
Dec-1
4
Jan
-15
Fe
b-1
5
Ma
r-1
5
Ap
r-15
Ma
y-1
5
Jun
-15
Jul-1
5
Au
g-1
5
Se
p-1
5
Oct-
15
Nov-1
5
Dec-1
5
SX4P SNS CIE ATT ZAP PCE

89
UTILITIES (U/W): AVOID THE SECTOR UNTIL THE DUST SETTLES
Source: Bloomberg, DM BZ WBK Research
Polish vs. German electricity futures – substantial room to fall
Source: DM BZ WBK Research
EBITDA 2015-18E outlook – slide until 2017E [PLNmn] INVESTMENT CASE: The fundamental recommendations suggest
that double-digit upsides exist in case of Energa and Tauron, but our
2016 strategy is simple: investors should avoid the sector until the
dust settles. Polish utilities currently face a perfect storm, and the
worst scenario imaginable is rapidly becoming reality. Aside from
general risks, we suggest avoiding lignite-exposed names (PGE), in
light of the pressure on electricity prices in the medium term. SECTOR
OUTLOOK: Highly Cautious / Underweight, sector likely to be
battered in 1H16.
VALUATION: The weighted per share valuation implies the highest
upside for Polenergia (+50%), followed by Energa (+28%) and Tauron
(+23%). We see 4% valuation upside in ENEA, while PGE and ZE
PAK have downsides. However, because of the extremely high risk
(mine subsidies, cancellation of dividend payments) highlighted
recently by the politicians, we cut our recommendations by a notch
across Treasury-controlled sector. In this light, Polenergia is our lone
Buy, we have two Holds (Energa, Tauron), while PGE and ZE PAK
remain a Sell.
MAIN THEMES: Below we list the key risk factors for the segment
and its participants: (1) substantial EBITDA / net profit erosion; (2)
value-destructive mine acquisitions – already carried out and pending;
(3) uncertainty over intra-sector mergers; (4) risk of being forced into
construction of brand new fossil-fuelled capacity. And finally, as if all
the above were not enough to weaken the sector for the foreseeable
future, the Polish Energy Minister hinted in a press interview that
utilities may not pay dividends if burdened with heavy investments.
Stable dividend flow represents the foundation of investing in utilities,
and putting a question mark over them brings into question their share
prices.
2015E 2016E 2017E 2018E
PGE 8,038 6,355 5,897 5,667
% y/y change -1.0 -20.9 -7.2 -3.9
Tauron 3,652 3,080 3,252 3,167
% y/y change -1.0 -15.7 5.6 -2.6
Energa 2,258 1,838 1,925 1,938
% y/y change -2.1 -18.6 4.8 0.7
ENEA 2,228 2,233 2,220 2,247
% y/y change 16.4 0.2 -0.6 1.2

90
UTILITIES (U/W): UPSIDE IN REGULATED PLAYS, AVOID LIGNITE EXPOSURE
SECTOR PICKS: First of all, we believe the world’s thermal coal oversupply will keep coal price under pressure over 2016, thus negating any
upside to 2017 electricity price futures. Moreover, we believe the price of CO2 certificates should remain on the rise – these two factors
represent the worst possible environment for lignite fleet-based PGE and ZE PAK. ENEA lost its entire appeal with the acquisition of Bogdanka
coal miner – the switch from variable into fixed costs in thermal coal down trending still remains a mystery to us. On top of that, the entire sector
faces two very substantial investment risks of being forced into (1) new capacity investments and (2) mines’ subsidies, both potentially eroding
shareholder's value. Actually we believe that ENEA and Energa will jointly build a new 1,000MW Ostroleka brownfield unit, and more units may
fall on shoulders of PGE. Dividend policies are at risk too – this it the most eye-striking in Energa, where we believe the market is discounting
termination of the company's hefty dividend payout policy. One more year of low electricity price and high CO2 price would push ZE PAK to
verge of bankruptcy, while Polenergia’s lack of investment outlays (other than for the potential renewable auction) and 2016E decent EBITDA
upside turn this stock into our key sector pick for 2016.
Valuation table
Source: Bloomberg, DM BZ WBK Research
TP
(PLN) 2015E 2016E 2017E 2015E 2016E 2017E 2015E 2016E 2017E
PGE 13.4 n.a. 8.6 10.2 4.4 6.4 7.4 5.8% 5.6% 4.7%
Tauron 2.84 1209.6 7.7 7.7 4.4 6.5 6.8 5.3% 5.3% 5.2%
Energa 13.65 6.2 10.9 10.3 4.4 6.1 6.2 10.5% 8.9% 7.5%
ENEA 11.52 4.8 7.8 8.4 6.1 6.7 7.0 4.1% 5.2% 6.1%
POLENERGIA 27.49 19.5 12.9 14.8 8.8 9.2 11.8 0.0% 0.0% 3.9%
ZE PAK 9.8 23.6 n.a. 5.0 5.4 6.5 5.0 12.2% 3.2% 0.0%
EU peer groups
Regulated 14.6 14.6 14.0 10.2 10.1 9.9 5.0 5.2 5.3
Minimum 11.6 12.0 11.3 6.4 6.3 6.0 3.4 3.4 3.6
Maximum 17.8 18.1 17.2 15.8 14.6 14.0 6.4 6.5 6.4
Dirty generation 11.7 12.8 12.0 7.1 7.2 7.0 5.3 5.3 5.6
Minimum 5.9 8.2 8.4 5.2 5.4 4.9 2.7 1.3 2.3
Maximum 18.3 49.5 39.8 9.8 9.4 9.3 8.2 6.9 6.4
Clean generation 14.4 14.9 14.5 7.8 7.9 7.8 6.0 5.8 5.7
Minimum 6.6 7.6 8.2 4.1 4.3 4.3 2.8 2.2 2.2
Maximum 18.4 24.2 20.3 10.0 10.6 11.1 9.0 8.5 8.1
Renewables 28.3 24.9 22.4 9.4 9.0 8.4 1.4 1.6 2.0
Minimum 2.7 2.2 2.3 7.0 7.1 7.0 0.0 0.0 1.0
Maximum 40.1 31.9 27.9 9.7 9.5 9.0 2.6 2.6 22.2
P/E (x) EV/EBITDA (x) Div. Yield (%)

91
UTILITIES (U/W): OVERSOLD AT RATIOS, BUT FOR A VERY GOOD REASON
Source: WSE, Bloomberg, DM BZ WBK Research
Utility: Share price changes [%]
Source: Bloomberg, DM BZ WBK Research
WIG Utility: Divergence vs. P/E 1YR fwd
Utility: Share price performace [rebased to 100]
Source: WSE, Bloomberg, DM BZ WBK Research
WIG Utility: Divergence vs. EV/EBITDA 1YR fwd
Source: Bloomberg, DM BZ WBK Research
3.5
3.7
3.9
4.1
4.3
4.5
4.7
4.9
5.1
5.3
5.5
Jan
-11
Ap
r-11
Jul-1
1
Oct-
11
Jan
-12
Ap
r-12
Jul-1
2
Oct-
12
Jan
-13
Ap
r-13
Jul-1
3
Oct-
13
Jan
-14
Ap
r-14
Jul-1
4
Oct-
14
Jan
-15
Ap
r-15
Jul-1
5
Oct-
15
WIG Utility EV/EBITDA fwd Average
STD +/- 1 STD +/- 2
7.0
8.0
9.0
10.0
11.0
12.0
13.0
Ja
n-1
1
Ap
r-11
Jul-1
1
Oct-
11
Ja
n-1
2
Ap
r-12
Jul-1
2
Oct-
12
Ja
n-1
3
Ap
r-13
Jul-1
3
Oct-
13
Ja
n-1
4
Ap
r-14
Jul-1
4
Oct-
14
Ja
n-1
5
Ap
r-15
Jul-1
5
Oct-
15
WIG Utility PE fwd Average STD +/- 1 STD +/- 2
60
70
80
90
100
110
120
130
140
150
160
Apr
-14
May
-14
Jun-
14
Jul-1
4
Aug
-14
Sep
-14
Oct
-14
Nov
-14
Dec
-14
Jan-
15
Feb-
15
Mar
-15
Apr
-15
May
-15
Jun-
15
Jul-1
5
Aug
-15
Sep
-15
SX6P Index* TPE
PGE ENA
CEZ ENG
ZEP
1.50.0
-8.6
1.8
-2.3 -2.3-4.2
0.4
-9.2-8.0
-10.4
-19.1
-5.5
-15.0
7.5
-19.8
-12.7
-17.6
-30.9
-13.1
-41.3
-50
-40
-30
-20
-10
0
10
SX
6P
TPE
PG
E
EN
A
EN
G
CE
Z
ZEP
1 week 1 month 3 months

92
METALS (U/W): 2016, ANOTHER YEAR OF WEAK INDUSTRIAL METALS?
Source: Bloomberg, DM BZ WBK Research
Copper price to follow Chinese slowdown?
Source: Bloomberg, DM BZ WBK Research
Chinese GDP growth, and forecasts (quarterly, in %) INVESTMENT CASE: In December 2014, we predicted that 2015
would be a weak year for industrial metals and this call unfortunately
turned out to be very correct. What is more, the main rationale behind
our call – a slowdown of the Chinese economy – became even
stronger: what was a risk of deceleration last year is a full-scale
deterioration today. The Chinese PM points to 2016-20E GDP growth
averaging at 6.5% and we continue to suspect that this might be
overly optimistic. All of these factors substantially undermine the
outlook for metals, coke and all-kind coal as a substantial share of
global demand comes from China, which has also been building its
own capacities. Technical analysis shows that an imminent bear
market is possible in copper and silver, but we stick to our overall
SECTOR OUTLOOK: UNDERWEIGHT.
VALUATION: We believe that ENEA’s successful call for a 66% stake
in Bogdanka effectively erased any fundamental appeal of the latter,
not to mention its suddenly worse investability (FF, trading volume).
With the Upper Silesian mines steadily getting support, room for
Bogdanka’s volumes may narrow. JSW has been in technical
bankruptcy for several months now and we expect it to be split up,
acquired or issue new shares ahead. Finally, KGHM will likely suffer
not only from weak metal prices, but also from the most unfortunate
timing of the Sierra Gorda launch. This investment kicked off in an
environment of long-unseen low moly prices, triggering heavy
quarterly losses. Last, but not least, the idea of scrapping the
extraction tax no longer seems to be on the cards for 2016.
MAIN THEMES: Strong investments into the Chinese electric grid
(responsible for a third of China’s total copper demand) are boosting
the copper price. Technical analysis suggests that a natural bear
market rally in copper and silver could be likely soon, with the former
potentially up to USD2.5/lb or USD3.0/lb. Sadly, macroeconomic
indicators (such as, the Chinese Leading Indicator, U.S. and German
indicators) suggest that the world may be slowing down, which would
clearly be bad news for metals, coal and coke.
2,000
3,000
4,000
5,000
6,000
7,000
8,000
9,000
10,000
11,000
12,000
97
98
99
100
101
102
103
104
105
106
107
Ap
r-06
Se
p-0
6
Fe
b-0
7
Jul-0
7
Dec-0
7
Ma
y-0
8
Oct-
08
Ma
r-09
Au
g-0
9
Jan
-10
Jun
-10
Nov-1
0
Ap
r-11
Se
p-1
1
Fe
b-1
2
Jul-1
2
Dec-1
2
Ma
y-1
3
Oct-
13
Ma
r-14
Au
g-1
4
Jan
-15
Jun
-15
China Leading Index (LHS) LME Copper Price USD/t (RHS)
4
6
8
10
12
14
16
Ma
r-92
Ap
r-93
Ma
y-9
4
Ju
n-9
5
Jul-9
6
Au
g-9
7
Se
p-9
8
Oct-
99
Nov-0
0
Dec-0
1
Ja
n-0
3
Fe
b-0
4
Mar-
05
Ap
r-06
Ma
y-0
7
Ju
n-0
8
Jul-0
9
Au
g-1
0
Se
p-1
1
Oct-
12
Nov-1
3
Dec-1
4
Ja
n-1
6
Fe
b-1
7
Ma
r-18
Ap
r-19
Ma
y-2
0

93
METALS (U/W): 2016, ANOTHER YEAR OF WEAK INDUSTRIAL METALS?
Source: Bloomberg, DM BZ WBK Research
SECTOR PICKS: We believe that the aforementioned successful bid of ENEA for the 66% stake in Bogdanka (Sell, TP PLN28) effectively erased any fundamental
appeal of the latter, not to mention its suddenly worse investability (FF, trading volume). Azoty Pulawy had just slashed its mid-term coal purchases from Bogdanka by
half and with the Upper Silesian mines steadily getting support either from the State or the State-run utilities, room for Bogdanka’s volumes beyond +5mt may narrow.
Finally, we would not be surprised to see (1) Bogdanka’s NetFCF invested into the construction of a brand new thermal coal fired unit or (2) an adjustment of ENEA-
Bogdanka coal trading terms from 2018 onwards – both these would erode the company’s fundamental value significantly. JSW (Sell, TP PLN8.50) has been in
technical bankruptcy for several months now (it failed to repay its PLN1.1bn bonds) and the management suggests that there could be a recovery in coking coal and
coke in late 2016 at best. Nevertheless, JSW is running out of cash for salaries. We, therefore, believe the company will be either split up, acquired by a State-owned
company (KGHM would be the best match) or it will have to issue new bonds / shares (potentially convertible bonds) ahead. Still, with the deep-out-cash option in
place, JSW’s share price will certainly be very volatile, offering very decent returns on every rumour of coke / coking coal recovering. Our core scenario for 2016 is
based on flat zloty-denominated copper & silver prices (vs. current levels, implying a double-digit y/y erosion). However, the non-existing copper hedging, vanishing
silver hedging and unfortunate USDPLN exchange rate hedging (at 4.0x) will all depress KGHM (Sell, TP PLN96) parent figures substantially. Finally, KGHM will
suffer not only from weak metal prices, but also from the most unfortunate timing of its Sierra Gorda launch. This investment kicked off in an environment of long-
unseen low moly prices, triggering heavy quarterly losses. Last, but not least, the government is no longer considering scrapping of the extraction tax in 2016, leaving
no chances for a comparable bottom line y/y. We have no top picks in the sector: Bogdanka’s share price will keep trending south, JSW’s eye-striking not-so technical
bankruptcy, while no changes in metal price trends could quickly make KGHM resemble JSW. Technical analysis shows that a bear market rally in copper and silver is
possible, which would certainly trigger a bear market rally in KGHM’s share price in the coming months.
Valuation table TP
(PLN) 2015E 2016E 2017E 2015E 2016E 2017E 2015E 2016E 2017E
Bogdanka 27.80 6.9 9.5 8.6 3.0 3.1 2.8 2.4 2.6 2.5
JSW 8.50 n.a. n.a. n.a. 7.1 5.3 5.3 3.2 2.3 2.1
Mines in Developed Markets 21.0 17.1 7.9 6.3 8.2 5.5 2.2 2.5 1.8
Minimum 14.1 16.5 5.8 5.1 5.7 0.0 0.0 0.0 0.0
Maximum 610.0 43.9 8.6 17.7 20.7 19.3 7.5 19.4 6.7
Mines in Emerging Markets 6.7 7.6 7.6 4.8 8.6 6.0 4.5 4.3 5.1
Minimum 4.4 5.9 5.7 1.3 1.0 1.0 0.0 0.0 3.0
Maximum 28.8 13.3 11.5 21.0 128.8 19.3 14.2 13.1 10.9
KGHM 96.00 4.3 4.4 4.6 3.4 4.0 3.7 2.9 3.0 2.9
Average 14.4 14.1 10.3 7.6 6.9 5.8 5.8 5.6 5.0
Minimum 7.3 7.0 4.1 4.1 5.0 4.0 0.7 1.0 0.8
Maximum 93.7 300.9 16.1 19.4 13.3 10.6 13.9 12.4 12.1
P/E (x) EV/EBITDA (x) P/CE (x)

94
CONSTRUCTION (O/W): GAINING MOMENTUM
INVESTMENT CASE: We maintain our positive stance on
construction companies (as we did in our strategy for 2015). The EU
funds flow remians the key story for the sector. We expect EU funds
to start taking effect this year (scheduled for 2014–2020), whereas the
outlook for 2017-19E is even more optimistic for contractors, in our
view, as EU funds’ allocation should accelerate further. We believe
the supply of road and railway contracts should accelerate rapidly
going forwad. Moreover, sector’s liquidity is improving. On top of that,
the current valuation of construction stocks is not very demanding in
light of the expected healthy mid-term profit growth (2Y forward P/E
estimate for WIG-Construction is 13.6x). SECTOR OUTLOOK:
OVERWEIGHT.
MAIN THEMES: The situation in the sector is improving. The CSO
ratio that measures delays in payments has been gradually
recovering. Capacity utilisation stabilised at a relatively high level of c.
80%, much above the 73% average of the last 15 years. The ratio
measuring the expected employment level also remains in an uptrend.
In our opinion, the coming quarters should bring further improvement
in the performance of the construction business. Contractors have
completed restructuring initiatives and reduced their cost base. The
expected growth in investments should boost their backlog/sales and,
thanks to operating leverage result in some margin and profit
expansion. Potential pressure on margins in the mid term stemming
from shortage of workforce, and recovery of construction costs is the
key risk factor.
STOCK POSITIONING: We definitely prefer companies that are 1)
restructured and cash-generating, 2) have a high operating leverage,
3) offer exposure to investments in transport infrastructure, including
railways and roads. Source: Bloomberg, CSO, DM BZ WBK Research
WIG Constr. P/E 1Y forwards WIG Constr. P/E 2Y forwards
Expected employment in sect. Delay of payments indicator
-4.0
-3.0
-2.0
-1.0
0.0
1.0
2.0
I.0
0
IX.0
0
V.0
1
I.0
2
IX.0
2
V.0
3
I.0
4
IX.0
4
V.0
5
I.0
6
IX.0
6
V.0
7
I.0
8
IX.0
8
V.0
9
I.1
0
IX.1
0
V.1
1
I.1
2
IX.1
2
V.1
3
I.1
4
IX.1
4
V.1
5
Total +250 employees
-80
-60
-40
-20
0
20
40
60
I.0
0V
III.
00
III.
01
X.0
1V
.02
XII.0
2V
II.0
3II.0
4IX
.04
IV.0
5X
I.0
5V
I.0
6I.0
7V
III.
07
III.
08
X.0
8V
.09
XII.0
9V
II.1
0II.1
1IX
.11
IV.1
2X
I.1
2V
I.1
3I.1
4V
III.
14
III.
15
Expected employment
Source: REAS, Bloomberg, DM BZ WBK Research
0
5
10
15
20
25
Ja
n-0
8A
pr-
08
Ju
l-08
Oct-
08
Ja
n-0
9A
pr-
09
Ju
l-09
Oct-
09
Ja
n-1
0A
pr-
10
Ju
l-10
Oct-
10
Ja
n-1
1A
pr-
11
Ju
l-11
Oct-
11
Ja
n-1
2A
pr-
12
Ju
l-12
Oct-
12
Ja
n-1
3A
pr-
13
Ju
l-13
Oct-
13
Ja
n-1
4A
pr-
14
Ju
l-14
Oct-
14
Ja
n-1
5A
pr-
15
Ju
l-15
Oct-
15
WIG Construction PE fwd Average
STD + 1 STD - 1
STD + 2 STD - 2
14.3x P/E
0
5
10
15
20
Ja
n-0
8A
pr-
08
Ju
l-08
Oct-
08
Ja
n-0
9A
pr-
09
Ju
l-09
Oct-
09
Ja
n-1
0A
pr-
10
Ju
l-10
Oct-
10
Ja
n-1
1A
pr-
11
Ju
l-11
Oct-
11
Ja
n-1
2A
pr-
12
Ju
l-12
Oct-
12
Ja
n-1
3A
pr-
13
Ju
l-13
Oct-
13
Ja
n-1
4A
pr-
14
Ju
l-14
Oct-
14
Ja
n-1
5A
pr-
15
Ju
l-15
Oct-
15
WIG Construction PE fwd Average
STD + 1 STD - 1
STD + 2 STD - 2
13.6x P/E
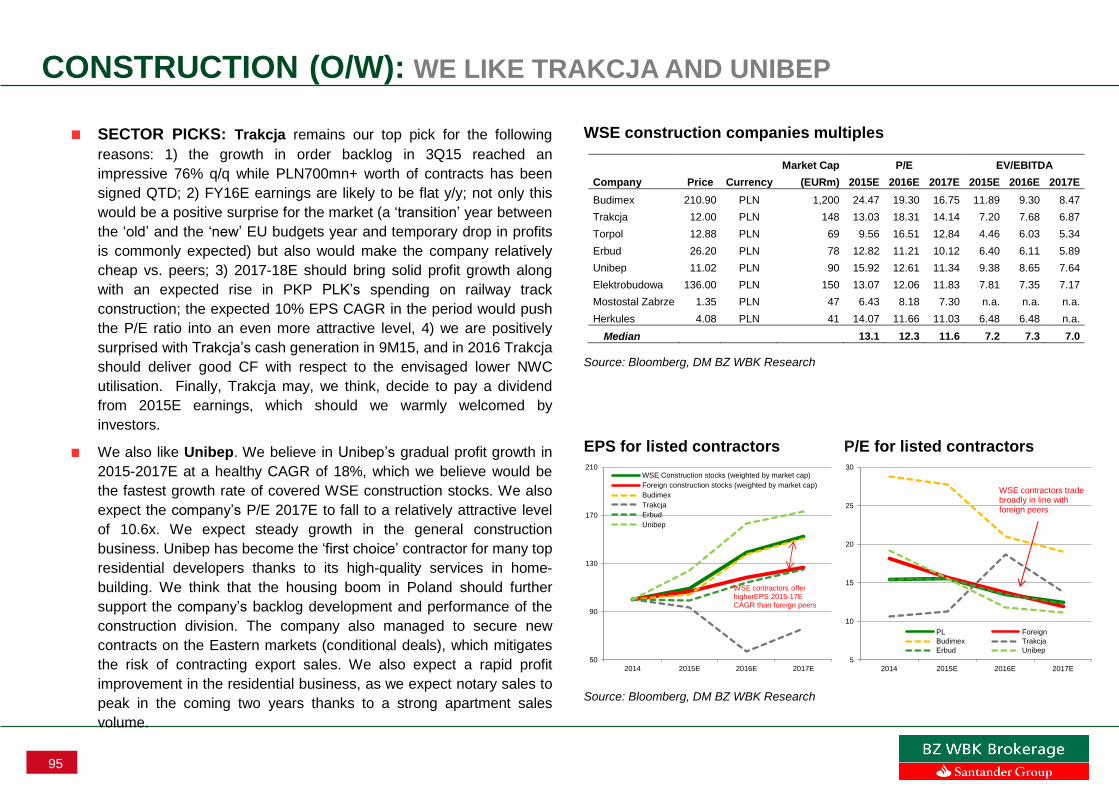
95
CONSTRUCTION (O/W): WE LIKE TRAKCJA AND UNIBEP
SECTOR PICKS: Trakcja remains our top pick for the following
reasons: 1) the growth in order backlog in 3Q15 reached an
impressive 76% q/q while PLN700mn+ worth of contracts has been
signed QTD; 2) FY16E earnings are likely to be flat y/y; not only this
would be a positive surprise for the market (a ‘transition’ year between
the ‘old’ and the ‘new’ EU budgets year and temporary drop in profits
is commonly expected) but also would make the company relatively
cheap vs. peers; 3) 2017-18E should bring solid profit growth along
with an expected rise in PKP PLK’s spending on railway track
construction; the expected 10% EPS CAGR in the period would push
the P/E ratio into an even more attractive level, 4) we are positively
surprised with Trakcja’s cash generation in 9M15, and in 2016 Trakcja
should deliver good CF with respect to the envisaged lower NWC
utilisation. Finally, Trakcja may, we think, decide to pay a dividend
from 2015E earnings, which should we warmly welcomed by
investors.
We also like Unibep. We believe in Unibep’s gradual profit growth in
2015-2017E at a healthy CAGR of 18%, which we believe would be
the fastest growth rate of covered WSE construction stocks. We also
expect the company’s P/E 2017E to fall to a relatively attractive level
of 10.6x. We expect steady growth in the general construction
business. Unibep has become the ‘first choice’ contractor for many top
residential developers thanks to its high-quality services in home-
building. We think that the housing boom in Poland should further
support the company’s backlog development and performance of the
construction division. The company also managed to secure new
contracts on the Eastern markets (conditional deals), which mitigates
the risk of contracting export sales. We also expect a rapid profit
improvement in the residential business, as we expect notary sales to
peak in the coming two years thanks to a strong apartment sales
volume.
Source: Bloomberg, DM BZ WBK Research
Source: Bloomberg, DM BZ WBK Research
EPS for listed contractors P/E for listed contractors
50
90
130
170
210
2014 2015E 2016E 2017E
WSE Construction stocks (weighted by market cap)
Foreign construction stocks (weighted by market cap)
Budimex
Trakcja
Erbud
Unibep
WSE contractors offer higherEPS 2015-17E CAGR than foreign peers
5
10
15
20
25
30
2014 2015E 2016E 2017E
PL Foreign
Budimex Trakcja
Erbud Unibep
WSE contractors trade broadly in line with foreign peers
Market Cap P/E EV/EBITDA
Company Price Currency (EURm) 2015E 2016E 2017E 2015E 2016E 2017E
Budimex 210.90 PLN 1,200 24.47 19.30 16.75 11.89 9.30 8.47
Trakcja 12.00 PLN 148 13.03 18.31 14.14 7.20 7.68 6.87
Torpol 12.88 PLN 69 9.56 16.51 12.84 4.46 6.03 5.34
Erbud 26.20 PLN 78 12.82 11.21 10.12 6.40 6.11 5.89
Unibep 11.02 PLN 90 15.92 12.61 11.34 9.38 8.65 7.64
Elektrobudowa 136.00 PLN 150 13.07 12.06 11.83 7.81 7.35 7.17
Mostostal Zabrze 1.35 PLN 47 6.43 8.18 7.30 n.a. n.a. n.a.
Herkules 4.08 PLN 41 14.07 11.66 11.03 6.48 6.48 n.a.
Median 13.1 12.3 11.6 7.2 7.3 7.0
WSE construction companies multiples

96
HOUSING DEVELOPERS (NEUTRAL): BOOMING BUT GROWTH PRICED IN
INVESTMENT CASE: We are neutral on residential developers. On
the one hand, we expect some further (but insignificant) growth in the
overall apartment sale volumes in Poland in 2016. This should be
helped by 1) a rebound in new mortgages thanks to some GDP
growth rate expansion (as in the past) and 2) investment demand
attracted by interest rates that should remain low. On the other hand,
however, we expect some appreciation of construction costs (due to
an accumulation in new residential developments) and a rise in the
supply of apartments, which is likely to limit growth of apartment
prices. In sum, volumes’ growth should be accompanied with a margin
stabilisation or its drop for the residential developers. Moreover, we
believe that valuation of the largest RE names is an unattractive entry
point for investors at the moment. SECTOR OUTLOOK: NEUTRAL.
VALUATION: We continue to advise neutral positioning on covered
residential developers (Dom Development and Ronson), as both are
trading close to our estimates of their fair P/BVs and our Target
Prices. Both remain Holds. The lack of upside potential seems to be
an overwhelming issue for the whole sector, we note. On consensus
estimates, only Atal (N/R), seem to be trading below its fair P/BV,
derived from average 2015-17E consensus ROE and 7.8% cost of
capital
MAIN THEMES: We believe that growth in land prices and
construction costs are the main risk factors for developers. Prices of
apartments are stabilising/inching up, which may be a sign of margin
contraction of the developers.
Source: REAS, Bloomberg, DM BZ WBK Research
Homes sale volume and WIBOR
Mortgages and sale volumes
Mortgages and GDP
Developers’ offer size
Source: REAS, Bloomberg, DM BZ WBK Research
0
1
2
3
4
5
6
7
8
9
10
11
12
13
14
5
7
9
11
13
15
17
19
1Q
07
3Q
07
1Q
08
3Q
08
1Q
09
3Q
09
1Q
10
3Q
10
1Q
11
3Q
11
1Q
12
3Q
12
1Q
13
3Q
13
1Q
14
3Q
14
1Q
15
3Q
15
Mortgages (in PLNbn, LHS)
Dwellings sale volume (in ths, RHS)
1.2
1.7
2.2
2.7
3.2
3.7
4.2
4.7
5.2
5.7
6.2
6.7
4
5
6
7
8
9
10
11
12
13
14
1Q
07
3Q
07
1Q
08
3Q
08
1Q
09
3Q
09
1Q
10
3Q
10
1Q
11
3Q
11
1Q
12
3Q
12
1Q
13
3Q
13
1Q
14
3Q
14
1Q
15
3Q
15
Dwellings sale volume (in ths, LHS)
WIBOR3M (RHS)
Low interest rates should support sale volumes as history suggests
0
1
2
3
4
5
6
7
8
5
7
9
11
13
15
17
19
1Q
07
3Q
07
1Q
08
3Q
08
1Q
09
3Q
09
1Q
10
3Q
10
1Q
11
3Q
11
1Q
12
3Q
12
1Q
13
3Q
13
1Q
14
3Q
14
1Q
15
3Q
15
1Q
16
E
3Q
16
E
Mortgages (in PLNbn, LHS)
GDP y/y (in %, RHS)
Mortgages should be supported by GDP growth
rate
0
10
20
30
40
50
60
1Q
07
3Q
07
1Q
08
3Q
08
1Q
09
3Q
09
1Q
10
3Q
10
1Q
11
3Q
11
1Q
12
3Q
12
1Q
13
3Q
13
1Q
14
3Q
14
1Q
15
3Q
15
Developers start to freeze projects' development on
gloomy macro outlook and low sale volumes
Relatively strong pre-sale volumes in 3-4Q09 encouraged developers to start new projects
Peak in offer size
Average
Rebound in offer size

97
REAL ESTATE (O/W): LOW T-BOND YIELDS TO SUPPORT STOCKS PERFORMANCE
INVESTMENT CASE: We are positive on real estate companies.
Following the massive drop in 2Y T-bond yields, the spread between
them and property yields remains wide. We believe that such an
environment should support share prices of real estate developers,
just as it tended to do in the past. This is because returns from the
properties have become attractive for investment funds, which may
simply decide to invest in such yielding properties, we think. Having
said that, developers may cash-in on their developed projects more
quickly (and invest the unlocked cash in new developments).
Furthermore, the low cost of money is supportive for ROE generation,
in light of the high leverage of RE names. Finally, valuations of the
WSE developers have turned attractive compared with the foreign
competitors. SECTOR OUTLOOK: OVERWEIGHT.
VALUATION: The valuation of Polish real estate developers has
become relatively attractive. The median P/NAV of 0.56x offers
a discount of approx. 39% to the median for the peer group (western
developers). History would suggest that following the recent
expansion, the valuation divergence between PL and foreign names
should narrow.
MAIN THEMES: Developers are mainly concerned with the imbalance
between demand for new office space and supply, which is resulting
in pressure on rents and increases in vacancy rates. Furthermore,
some regional markets have become quite highly saturated with
modern retail and office space, which limits opportunities for capturing
attractive returns on new developments.
Source: Bloomberg, DM BZ WBK Research
Source: Bloomberg, DM BZ WBK Research
GTC and Echo performance vs. 2Y Treasury bond yields
P/NAV for WSE RE developers and foreign peers
0.3
0.5
0.7
0.9
1.1
1.3
Ja
n-0
9M
ar-
09
Ma
y-0
9Jul-0
9S
ep-0
9N
ov-0
9Ja
n-1
0M
ar-
10
Ma
y-1
0Jul-1
0S
ep-1
0N
ov-1
0Ja
n-1
1M
ar-
11
Ma
y-1
1Jul-1
1S
ep-1
1N
ov-1
1Ja
n-1
2M
ar-
12
Ma
y-1
2Jul-1
2S
ep-1
2N
ov-1
2Ja
n-1
3M
ar-
13
Ma
y-1
3Jul-1
3S
ep-1
3N
ov-1
3Ja
n-1
4M
ar-
14
Ma
y-1
4Jul-1
4S
ep-1
4N
ov-1
4Ja
n-1
5M
ar-
15
Ma
y-1
5Jul-1
5S
ep-1
5N
ov-1
5
WSE listed developers Foreign peers
2009-2015 average for foreign peers = 0.81
1.0
2.0
3.0
4.0
5.0
6.0
7.0
8.0
9.0
40
140
240
340
440
540
640
740
Jan
-05
Jul-0
5
Jan
-06
Jul-0
6
Jan
-07
Jul-0
7
Jan
-08
Jul-0
8
Jan
-09
Jul-0
9
Jan
-10
Jul-1
0
Jan
-11
Jul-1
1
Jan
-12
Jul-1
2
Jan
-13
Jul-1
3
Jan
-14
Jul-1
4
Jan
-15
Jul-1
5
GTC P/NAV
ECHO P/NAV
POLISH 2Y bonds
falling T-bond yields used to support share
prices of RE developers

98
REAL ESTATE (O/W): WE LIKE ECHO AND PHN
SECTOR PICKS: Our coverage includes two real estate developers:
Echo and PHN.
We like PHN for its c. 48% discount to its NAV and the 15%/47%
discount to its PL/western peers. Its recent asset disposal transactions
at prices close to BV offered more credibility to the book value
assessment. The company holds relatively low net debt. We also like
PHN for its dividend profile (c. 4% yield in 2016E).
We are neutral on Echo. The new strategic shareholder has still not
annoucend its strategy for Echo. Moreover, the company is trading
close to our fair value assessment. Finally, the company is trading at a
premium to WSE peers average.
Source: Bloomberg, DM BZ WBK Research
Source: Bloomberg, DM BZ WBK Research
Spread between prime office and 2Y T-bond yields
Valuation matrix: P/BV vs. net debt/equity
Source: Bloomberg, DM BZ WBK Research
Valuation matrix: P/BV vs. market cap
Echo
Globe Trade Centre
LC Corp
Rank Progress
BBI Development PHN
0.0
0.2
0.4
0.6
0.8
1.0
1.2
0
100
200
300
400
500
600
700
P/BV
Market cap
Echo
GTC
LC Corp
BBI
Rank Progress
PHN
Hammerson
Atrium
CA Immobilien
IMMOFINANZ
Segro
Banimmo
Eurocommercial
Land Securities
IFMANF
TAG
British Land
0.0
0.4
0.8
1.2
1.6
-0.3
0.2
0.7
1.2
1.7
2.2
P/BV
Net debt/equity
1
2
3
4
5
6
7
8
9
Jan
-05
Ma
y-0
5S
ep-0
5Jan
-06
Ma
y-0
6S
ep-0
6Jan
-07
Ma
y-0
7S
ep-0
7Jan
-08
May-0
8S
ep-0
8Jan
-09
Ma
y-0
9S
ep-0
9Jan
-10
Ma
y-1
0S
ep-1
0Jan
-11
Ma
y-1
1S
ep-1
1Jan
-12
Ma
y-1
2S
ep-1
2Jan
-13
Ma
y-1
3S
ep-1
3Jan
-14
Ma
y-1
4S
ep-1
4Jan
-15
Ma
y-1
5S
ep-1
5
Warsaw prime office yield Polish Treasury 2Y Bonds Yields

99
INVESTMENT CASE: Based on our macro team’s expectations and
the Bloomberg consensus, Poland’s industrial output should rise 4.7%
y/y and 5.2% y/y, respectively, accompanied by a continuously stable
GDP expansion (3.5% y/y). On the one hand, this points to a
supportive market environment for further growth, but, on the other,
(1) high capacity utilisation (already seen in 2015) and (2) being a
step higher on the economic cycle might bring in potential risks. First,
there is potential of higher pressure on wage growth, which would
weaken margins. Second, the marginal effect of cost-efficiency
projects might start to abate. All these, make us expect no
breakthrough in 2016. That said, and additionally taking into
consideration the heterogeneous sector names, we believe that stock
picking will be crucial for another consecutive year (starting from
2014). Additionally, a potential amendment to the social insurance act
might negatively affect the PFs cash position. All in all, we believe that
a strategy based on U/W industrials with high PFs stakes in the
shareholding and O/W names with geographically diversified sales
might allow for a relatively better performance. SECTOR OUTLOOK:
NEUTRAL
VALUATION: Current valuations of mWIG40 and sWIG80 are near
2016 P/E at 12x and EV/EBITDA at 8x, which point to a discount to
the international peers (MSCI EM Industrials at 2016 P/E at 13x, 2016
EV/EBITDA at 9x). The tracked companies trade at chiefly similar
multiples to the one offered by the broad market (2016 P/E at 11.5x
and EV/EBITDA at 8.2x).
MAIN THEMES: With respect to the economic environment, we
believe that export sales (our macro team forecasts +9.2% y/y) will
remain an important catalyst of financial performance. High capacity
utilisation is a separate issue. Investment projects are under way, but
their impact on 2016 should be limited (bigger in 2H16 and FY17).
Finally, the political risk affecting PFs AuM seems to be quite real.
INDUSTRIALS (NEUTRAL): AT THE CROSSROADS (1/3)
P/E forward is at its long term-average…
…but Polish industrials outperform their EM peers
Source: Bloomberg, DM BZ WBK Research
Source: Bloomberg, DM BZ WBK Research
0
20
40
60
80
100
120
Jan
-08
May-0
8
Se
p-0
8
Jan
-09
May-0
9
Se
p-0
9
Jan
-10
May-1
0
Se
p-1
0
Jan
-11
May-1
1
Se
p-1
1
Jan
-12
May-1
2
Se
p-1
2
Jan
-13
May-1
3
Se
p-1
3
Jan
-14
May-1
4
Se
p-1
4
Jan
-15
May-1
5
Se
p-1
5
mWig40 rebased Small Cap Industrials
MSCI EM Industr. Europe
5
7
9
11
13
15
17
19
Jan
-08
Ma
y-0
8
Se
p-0
8
Jan
-09
Ma
y-0
9
Se
p-0
9
Jan
-10
Ma
y-1
0
Se
p-1
0
Jan
-11
Ma
y-1
1
Se
p-1
1
Jan
-12
Ma
y-1
2
Se
p-1
2
Jan
-13
Ma
y-1
3
Se
p-1
3
Jan
-14
Ma
y-1
4
Se
p-1
4
Jan
-15
Ma
y-1
5
Se
p-1
5
mWIG40 PE fwd LT average
STD +/- 1 STD +/- 2

100
INDUSTRIALS (NEUTRAL): AT A CROSSROADS (2/3)
Source: Bloomberg, DM BZ WBK Research
…as companies might face lack of capacities Investment projects are underway…
Source: Bloomberg, DM BZ WBK Research
-10.0%
-5.0%
0.0%
5.0%
10.0%
15.0%
20.0%
66%
68%
70%
72%
74%
76%
78%
80%
IQ1
1
IIQ
11
IIIQ
11
IVQ
11
IQ1
2
IIQ
12
IIIQ
12
IVQ
12
IQ1
3
IIQ
13
IIIQ
13
IVQ
13
IQ1
4
IIQ
14
IIIQ
14
IVQ
14
IQ1
5
IIQ
15
IIIQ
15
IVQ
15
Capacities utilisation (%; lhs)
Investment outlays y/y (%; rhs)
-60%
-40%
-20%
0%
20%
40%
60%
1H
07
2H
07
1H
08
2H
08
1H
09
2H
09
1H
10
2H
10
1H
11
2H
11
1H
12
2H
12
1H
13
2H
13
1H
14
2H
14
1H
15
Investment outlays y/y Investments newly started y/y
Source: Bloomberg, DM BZ WBK Research
…as environment remains supportive Demand for industrials might push indices up…
Source: Bloomberg, Markit, DM BZ WBK Research
3.0
3.2
3.4
3.6
3.8
4.0
4.2
4.4
4.6
4.8
0
20
40
60
80
100
120
Jan
-08
Ma
y-0
8
Se
p-0
8
Jan
-09
Ma
y-0
9
Se
p-0
9
Jan
-10
Ma
y-1
0
Se
p-1
0
Jan
-11
Ma
y-1
1
Se
p-1
1
Jan
-12
Ma
y-1
2
Se
p-1
2
Jan
-13
Ma
y-1
3
Se
p-1
3
Jan
-14
Ma
y-1
4
Se
p-1
4
Jan
-15
Ma
y-1
5
Se
p-1
5
mWIG40 Index rebased sWIG80 index rebased
EUR/PLN (rhs)
-20%
-15%
-10%
-5%
0%
5%
10%
15%
20%
-80%
-60%
-40%
-20%
0%
20%
40%
60%
80%
100%
Jan
-08
Jun
-08
Nov-0
8
Ap
r-09
Se
p-0
9
Fe
b-1
0
Jul-1
0
Dec-1
0
Ma
y-1
1
Oct-
11
Ma
r-1
2
Au
g-1
2
Jan
-13
Jun
-13
Nov-1
3
Ap
r-14
Se
p-1
4
Fe
b-1
5
Jul-1
5
Dec-1
5
Ma
y-1
6
Oct-
16
mWIG40 Index y/y (lhs) sWIG80 index y/y (lhs)
Industrial output y/y (rhs)

101
INDUSTRIALS (NEUTRAL): AT A CROSSROADS (3/3)
Source: Bloomberg, DM BZ WBK Research
…which is also the case of sWIG80 small caps. mWIG40 names outperform EM peers…
Source: Bloomberg, DM BZ WBK Research
Source: Bloomberg, DM BZ WBK Research
… as well as on EV/EBITDA. MSCI Industrials Europe getting slightly expensive on P/E…
Source: Bloomberg, DM BZ WBK Research
0
1,000
2,000
3,000
4,000
5,000
12
15
18
21
24
27
Ja
n-0
8
Ju
n-0
8
Nov-0
8
Ap
r-09
Se
p-0
9
Fe
b-1
0
Jul-1
0
Dec-1
0
Ma
y-1
1
Oct-
11
Ma
r-12
Au
g-1
2
Ja
n-1
3
Ju
n-1
3
Nov-1
3
Ap
r-14
Se
p-1
4
Feb-1
5
Jul-1
5
Dec-1
5
mWIG40 fwd. PE / MSCI EU fwd. PE
LT average
STD +/- 1
STD +/- 2
mWig40 Index
0
2,000
4,000
6,000
8,000
10,000
12,000
14,000
16,000
18,000
40
60
80
100
120
140
160
180
Jan
-08
May-0
8
Se
p-0
8
Jan
-09
Ma
y-0
9
Se
p-0
9
Jan
-10
Ma
y-1
0
Se
p-1
0
Jan
-11
Ma
y-1
1
Se
p-1
1
Jan
-12
Ma
y-1
2
Se
p-1
2
Jan
-13
Ma
y-1
3
Se
p-1
3
Jan
-14
Ma
y-1
4
Se
p-1
4
Jan
-15
Ma
y-1
5
Se
p-1
5
sWIG80 fwd. PE / MSCI EU fwd. PELT averageSTD +/- 1STD +/- 2sWig80 Index
5
7
9
11
13
15
17
Jan
-08
Ma
y-0
8
Se
p-0
8
Ja
n-0
9
Ma
y-0
9
Se
p-0
9
Ja
n-1
0
Ma
y-1
0
Se
p-1
0
Jan
-11
Ma
y-1
1
Se
p-1
1
Ja
n-1
2
Ma
y-1
2
Se
p-1
2
Ja
n-1
3
Ma
y-1
3
Se
p-1
3
Jan
-14
Ma
y-1
4
Se
p-1
4
Ja
n-1
5
Ma
y-1
5
Se
p-1
5
MSCI Indust. EU PE fwd LT average
STD +/- 1 STD +/- 24.0
5.0
6.0
7.0
8.0
9.0
10.0
Ju
l-0
5
Dec-0
5
Ma
y-0
6
Oct-
06
Ma
r-07
Au
g-0
7
Jan
-08
Jun
-08
Nov-0
8
Ap
r-09
Se
p-0
9
Fe
b-1
0
Ju
l-1
0
Dec-1
0
May-1
1
Oct-
11
Ma
r-12
Au
g-1
2
Jan
-13
Jun
-13
Nov-1
3
Ap
r-14
Se
p-1
4
Feb-1
5
MSCI Industr. EU EV/EBITDA fwd LT average
STD +/- 1 STD +/- 2

102
INDUSTRIALS (NEUTRAL): A GLANCE AT FOREIGN MARKETS
Source: Bloomberg, DM BZWBK Research
EM industrials underperfom not only Europe …
Source: Bloomberg, DM BZWBK Research
P/E valuation at average level, but 12.2 sounds reasonable…
…but WSE-listed names as well
Source: Bloomberg, Markit, DM BZWBK Research
5
7
9
11
13
15
17
19
Jan
-08
Ma
y-0
8
Se
p-0
8
Jan
-09
Ma
y-0
9
Se
p-0
9
Jan
-10
Ma
y-1
0
Se
p-1
0
Jan
-11
Ma
y-1
1
Se
p-1
1
Jan
-12
Ma
y-1
2
Se
p-1
2
Jan
-13
Ma
y-1
3
Se
p-1
3
Jan
-14
Ma
y-1
4
Se
p-1
4
Jan
-15
Ma
y-1
5
Se
p-1
5
mWIG40 PE fwd LT average
STD +/- 1 STD +/- 2
0
20
40
60
80
100
120
Jan
-08
May-0
8
Se
p-0
8
Jan
-09
May-0
9
Se
p-0
9
Jan
-10
May-1
0
Se
p-1
0
Jan
-11
May-1
1
Se
p-1
1
Jan
-12
May-1
2
Se
p-1
2
Jan
-13
May-1
3
Se
p-1
3
Jan
-14
May-1
4
Se
p-1
4
Jan
-15
May-1
5
Se
p-1
5
sWig80 rebased Small Cap Industrials
MSCI EM Industr. Europe0
20
40
60
80
100
120
140
160
Jan
-08
May-0
8
Se
p-0
8
Jan
-09
May-0
9
Se
p-0
9
Jan
-10
May-1
0
Se
p-1
0
Jan
-11
May-1
1
Se
p-1
1
Jan
-12
May-1
2
Se
p-1
2
Jan
-13
May-1
3
Se
p-1
3
Jan
-14
May-1
4
Se
p-1
4
Jan
-15
May-1
5
Se
p-1
5
MSCI EM Industr. Europe MSCI Industr. Europe
0
5
10
15
20
25
30
Dec-0
5
Ma
y-0
6
Oct-
06
Ma
r-07
Au
g-0
7
Jan
-08
Jun
-08
Nov-0
8
Ap
r-09
Se
p-0
9
Fe
b-1
0
Ju
l-1
0
Dec-1
0
Ma
y-1
1
Oct-
11
Ma
r-12
Au
g-1
2
Jan
-13
Jun
-13
Nov-1
3
Ap
r-14
Se
p-1
4
Fe
b-1
5
Ju
l-1
5
mWIG40 EV/EBITDA fwd LT average
STD +/- 1 STD +/- 2
Source: Bloomberg, BZ DM BZWBK Research
…what is also the case of forward EV/EBITDA
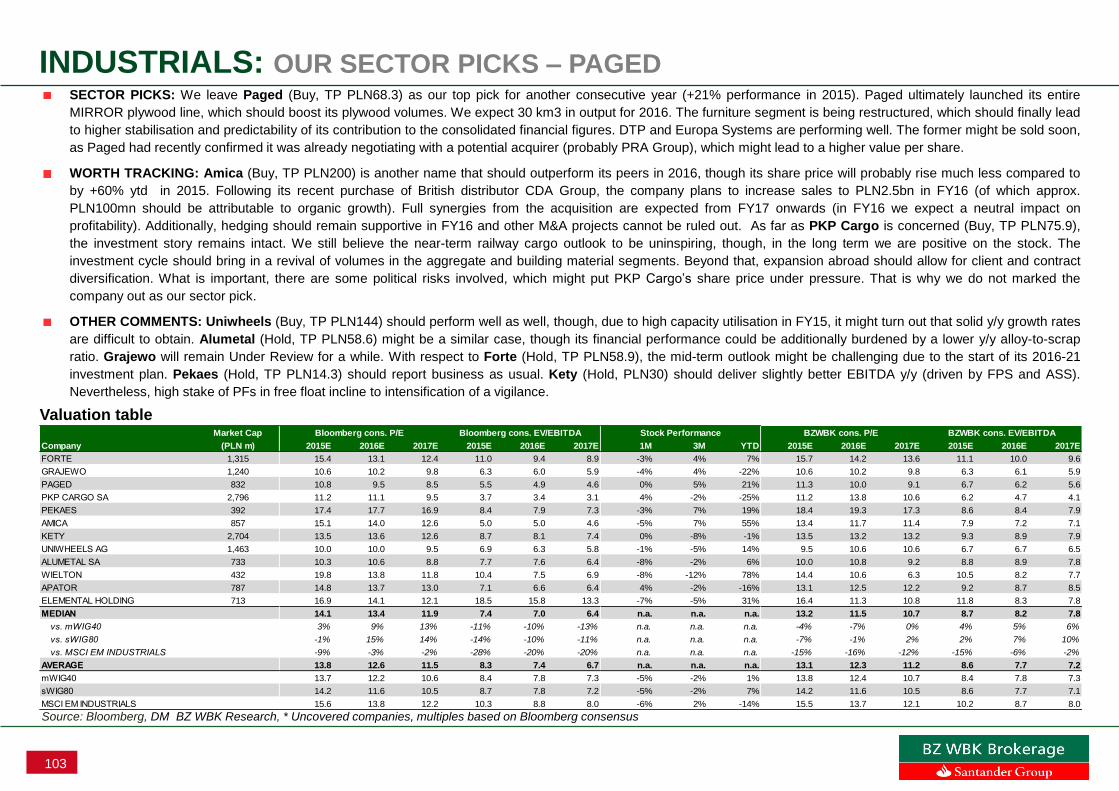
103
INDUSTRIALS: OUR SECTOR PICKS – PAGED
Source: Bloomberg, DM BZ WBK Research, * Uncovered companies, multiples based on Bloomberg consensus
Valuation table Market Cap Bloomberg cons. P/E Bloomberg cons. EV/EBITDA Stock Performance BZWBK cons. P/E BZWBK cons. EV/EBITDA
Company (PLN m) 2015E 2016E 2017E 2015E 2016E 2017E 1M 3M YTD 2015E 2016E 2017E 2015E 2016E 2017E
FORTE 1,315 15.4 13.1 12.4 11.0 9.4 8.9 -3% 4% 7% 15.7 14.2 13.6 11.1 10.0 9.6
GRAJEWO 1,240 10.6 10.2 9.8 6.3 6.0 5.9 -4% 4% -22% 10.6 10.2 9.8 6.3 6.1 5.9
PAGED 832 10.8 9.5 8.5 5.5 4.9 4.6 0% 5% 21% 11.3 10.0 9.1 6.7 6.2 5.6
PKP CARGO SA 2,796 11.2 11.1 9.5 3.7 3.4 3.1 4% -2% -25% 11.2 13.8 10.6 6.2 4.7 4.1
PEKAES 392 17.4 17.7 16.9 8.4 7.9 7.3 -3% 7% 19% 18.4 19.3 17.3 8.6 8.4 7.9
AMICA 857 15.1 14.0 12.6 5.0 5.0 4.6 -5% 7% 55% 13.4 11.7 11.4 7.9 7.2 7.1
KETY 2,704 13.5 13.6 12.6 8.7 8.1 7.4 0% -8% -1% 13.5 13.2 13.2 9.3 8.9 7.9
UNIWHEELS AG 1,463 10.0 10.0 9.5 6.9 6.3 5.8 -1% -5% 14% 9.5 10.6 10.6 6.7 6.7 6.5
ALUMETAL SA 733 10.3 10.6 8.8 7.7 7.6 6.4 -8% -2% 6% 10.0 10.8 9.2 8.8 8.9 7.8
WIELTON 432 19.8 13.8 11.8 10.4 7.5 6.9 -8% -12% 78% 14.4 10.6 6.3 10.5 8.2 7.7
APATOR 787 14.8 13.7 13.0 7.1 6.6 6.4 4% -2% -16% 13.1 12.5 12.2 9.2 8.7 8.5
ELEMENTAL HOLDING 713 16.9 14.1 12.1 18.5 15.8 13.3 -7% -5% 31% 16.4 11.3 10.8 11.8 8.3 7.8
MEDIAN 14.1 13.4 11.9 7.4 7.0 6.4 n.a. n.a. n.a. 13.2 11.5 10.7 8.7 8.2 7.8
vs. mWIG40 3% 9% 13% -11% -10% -13% n.a. n.a. n.a. -4% -7% 0% 4% 5% 6%
vs. sWIG80 -1% 15% 14% -14% -10% -11% n.a. n.a. n.a. -7% -1% 2% 2% 7% 10%
vs. MSCI EM INDUSTRIALS -9% -3% -2% -28% -20% -20% n.a. n.a. n.a. -15% -16% -12% -15% -6% -2%
AVERAGE 13.8 12.6 11.5 8.3 7.4 6.7 n.a. n.a. n.a. 13.1 12.3 11.2 8.6 7.7 7.2
mWIG40 13.7 12.2 10.6 8.4 7.8 7.3 -5% -2% 1% 13.8 12.4 10.7 8.4 7.8 7.3
sWIG80 14.2 11.6 10.5 8.7 7.8 7.2 -5% -2% 7% 14.2 11.6 10.5 8.6 7.7 7.1
MSCI EM INDUSTRIALS 15.6 13.8 12.2 10.3 8.8 8.0 -6% 2% -14% 15.5 13.7 12.1 10.2 8.7 8.0
SECTOR PICKS: We leave Paged (Buy, TP PLN68.3) as our top pick for another consecutive year (+21% performance in 2015). Paged ultimately launched its entire
MIRROR plywood line, which should boost its plywood volumes. We expect 30 km3 in output for 2016. The furniture segment is being restructured, which should finally lead
to higher stabilisation and predictability of its contribution to the consolidated financial figures. DTP and Europa Systems are performing well. The former might be sold soon,
as Paged had recently confirmed it was already negotiating with a potential acquirer (probably PRA Group), which might lead to a higher value per share.
WORTH TRACKING: Amica (Buy, TP PLN200) is another name that should outperform its peers in 2016, though its share price will probably rise much less compared to
by +60% ytd in 2015. Following its recent purchase of British distributor CDA Group, the company plans to increase sales to PLN2.5bn in FY16 (of which approx.
PLN100mn should be attributable to organic growth). Full synergies from the acquisition are expected from FY17 onwards (in FY16 we expect a neutral impact on
profitability). Additionally, hedging should remain supportive in FY16 and other M&A projects cannot be ruled out. As far as PKP Cargo is concerned (Buy, TP PLN75.9),
the investment story remains intact. We still believe the near-term railway cargo outlook to be uninspiring, though, in the long term we are positive on the stock. The
investment cycle should bring in a revival of volumes in the aggregate and building material segments. Beyond that, expansion abroad should allow for client and contract
diversification. What is important, there are some political risks involved, which might put PKP Cargo’s share price under pressure. That is why we do not marked the
company out as our sector pick.
OTHER COMMENTS: Uniwheels (Buy, TP PLN144) should perform well as well, though, due to high capacity utilisation in FY15, it might turn out that solid y/y growth rates
are difficult to obtain. Alumetal (Hold, TP PLN58.6) might be a similar case, though its financial performance could be additionally burdened by a lower y/y alloy-to-scrap
ratio. Grajewo will remain Under Review for a while. With respect to Forte (Hold, TP PLN58.9), the mid-term outlook might be challenging due to the start of its 2016-21
investment plan. Pekaes (Hold, TP PLN14.3) should report business as usual. Kety (Hold, PLN30) should deliver slightly better EBITDA y/y (driven by FPS and ASS).
Nevertheless, high stake of PFs in free float incline to intensification of a vigilance.

104
IT (O/W): IMPROVEMENT SEEN IN 2H16, IT DISTRIBUTORS STILL WEAK
Source: Company data
IT distributors: quarterly revenue dynamics comparison
Source: Company data
Asseco Poland: Quarterly revenue and backlog change INVESTMENT CASE: We maintain our positive stance on the IT sector
for 2016. We believe that the IT sector will benefit from an improving
business environment and higher IT spending. We think that IT
companies should also see higher backlog levels in 2H16 thanks to new,
EU co-funded, major IT investments. Stable cash flows, dividends and
proven business quality even in tough times should support valuations of
the software companies. We favour a more conservative approach to the
IT distributors, however, because we think that their stock prices already
include the impact from changes in the reverse VAT mechanism. AB
should draw suport from its cheap valuation and superior business
performance, while Action and ABC Data should enjoy a limited
downside risk due to their potential high dividend payouts. SECTOR
OUTLOOK: POSITIVE.
REVERSE VAT: The new VAT regulations came into force in July, 2015,
and already took a toll on Poland’s IT distributors: each one of them
suffered a double-digit revenue contraction mainly on export sales. As
expected, ABC Data took the largest hit, though Action was also hurt. In
its case, the higher the share of smartphone/tablet turnover, the bigger
the risk of a revenue drop and, in turn, of the supply chain’s
rearrangement.
FUNDS FROM EU’S NEW PERSPECTIVE: The EU’s new budget
perspective for 2014-2020 should be viewed as an opportunity for the
Polish IT companies. We expect the first IT tenders co-financed with the
EU’s new budget funds to be launched in 2H16, but we see a risk that
this may be subject to delays due to political changes in Poland. As the
old EU budget perspective is practically over, the software companies
could face a transition period between the EU’s two budget perspectives,
pushing their backlog and revenues from the public sector significantly
lower y/y. In case of a rebound in the public sector, Asseco Poland would
benefit the most since it has exposure to the public sector on the
domestic market, in the CEE region and in South Eastern Europe
through Asseco SEE.
0%
5%
10%
15%
20%
25%
1Q
12
2Q
12
3Q
12
4Q
12
1Q
13
2Q
13
3Q
13
4Q
13
1Q
14
2Q
14
3Q
14
4Q
14
1Q
15
2Q
15
3Q
15
Backlog y/y change Sales y/y change
-40%
-30%
-20%
-10%
0%
10%
20%
30%
40%
50%
60%
1Q
12
2Q
12
3Q
12
4Q
12
1Q
13
2Q
13
3Q
13
4Q
13
1Q
14
2Q
14
3Q
14
4Q
14
1Q
15
2Q
15
3Q
15
AB Action ABC Data

105
IT (O/W): ASSECO POLAND, ASSECO SEE AND AB ARE OUR TOP PICKS
SECTOR PICKS: We believe that the IT software companies are an attractive investment for 2016. We think that the sector’s results are bottoming
out and should start recovering in 2H16. Funds from the EU’s new perspective should support results of all the IT companies, though we believe that
investors should for 2016 pick those companies that have a higher exposure in the public sector. Among the large caps, we suggest to O/W Asseco
Poland (Buy, TP PLN65.5) because it delivers decent results (especially in 3Q15) despite the slowdown in the public sector mainly. It benefits,
however, from the good performance of its Israeli companies. On top of that, Asseco Poland generates stable and high FCF, which allows it to
maintain its high dividend payout. In 2016, we expect a DPS of PLN3 (5.2% yield). Among the smaller names, Asseco South Eastern Europe
(Buy, TP PLN12.1) is our pick. Asseco SEE has been improving its earnings immensly in the last couple of quarters, mainly due to the improving
macro situation in the South Eastern European countries, which is supportive of IT spending. Moreover, the company applied slight changes to its
business model in the payment segment, which affected its margins positively. We think these are not one-off factors, which means that Asseco
SEE’s earnings growth should be sustained in the coming quarters. Moreover, the company could get another boost as the region’s EU-member
countries are likely to benefit from cash inflows from the EU’s new budget perspective. Depending on the M&A activity, good cash generation and
lower CAPEX in the upcoming quarters could allow for a higher dividend payout.
In the universe of the IT distributors, we prefer AB (Buy, TP PLN49.0), the cheapest stock on P/E. AB also has the most conservative business
model, which we believe offers the best earnings growth rates in 2016 with the biggest exposure outside Poland. AB is the only company that
reported comparable y/y results in 3Q15 despite the tough market. The biggest disappointment of 2015, Action (Buy, TP PLN44.6), is far from
returning to earnings seen in 2014, though we expect it to post decent 4Q15 results, while a solid dividend payout should support its share price in
the mid-term. Also, the 2016 results of ABC Data (Hold, TP PLN3.50) should come in visibly lower y/y, but the company’s better working capital
management and largest use of factoring should allow for a decent DPS.
Source: Bloomberg, DM BZ WBK Research
IT companies valuation table
Market Cap P/E EV/EBITDA Stock Performance
Company (PLNmn) 2015E 2016E 2017E 2015E 2016E 2017E 1M 3M YTD
Asseco Poland 4813 14.7 13.6 13.4 7.5 7.5 7.5 1.8% 8.6% 13.7%
Asseco BS 551 16.7 16.8 16.3 9.7 9.8 9.5 0.7% 18.7% 21.0%
Asseco SEE 514 11.7 10.8 10.3 5.6 5.1 4.8 -2.0% 2.5% 19.3%
AB 567 8.5 7.7 7.2 7.1 6.5 5.9 4.6% -6.4% 14.4%
Action 460 12.0 11.7 10.4 10.6 10.0 9.3 9.4% 2.5% -39.8%
ABC Data 418 8.6 12.2 11.1 9.8 11.2 10.5 1.2% 31.0% -1.8%

106
TMT (NEUTRAL): M&A STORY AND MARKET STABILISATION FOR TELCOS
Source: Company data, DM BZ WBK Research
Who merges whom – potential 2016 M&A
Source: Company data, Telepolis.pl ,DM BZ WBK Research
Four mobile operators: post-paid subscriber’s base (mn) INVESTMENT CASE: As we expected, the LTE frequency auction was
the major topic of 2015 in the telecom universe. For Orange Polska,
which has to pay over PLN3bn for 2x5MHz bands, the LTE auction has
meant that it had to cut its DPS to PLN0.25. Cyfrowy Polsat withdrew
from the auction at an early stage and has so far not been directly
affected by the auction. On the other hand, we believe that 2016 should
bring the long-awaited flattening-out of ARPU in mobile telephony. Video
game stocks performed very well in 2015, driven by the very good
performance of the global peers and CD Projekt, which has achieved
worldwide success with its latest release - The Witcher 3. In our 2016
strategy, we maintain our neutral stance on the sector. SECTOR
OUTLOOK: NEUTRAL
MAIN THEMES: M&A activity should play an important role in the Polish
telecom universe in the next few months. Play’s owners plan to sell their
stake to a strategic/financial buyer or take the company public (IPO).
Such an acquisition would be an interesting proxy for the other stocks,
especially Cyfrowy Polsat. Deutsche Telekom may also make some
decisions on the future of T-Mobile Polska, which has been recently
underperforming all of its competitors. Finally, Netia and Midas may also
become subjects of an M&A transaction. It is possible that Cyfrowy
Polsat could take over Midas already shortly after the completion of its
debt restructuring in February.
RELEASE CALENDAR: 2016 should be a rather calm year for CD
Projekt, as the company plans no big releases or even announcements
about Cyberpunk 2077. It will focus on the monetising proces of The
Witcher 3. In contrast, CI Games will likely be a hot stock, as it plans to
release the next installment of its most recognisable franchise – Sniper -
in 3Q16. The first enthusiastic previews point to quality improvement vs.
the company’s prior titles, which has certainly built up expectations.
Meeting of these expectations will determine the stock’s performance in
the upcoming months.
0
1
2
3
4
5
6
7
8
9
1Q
09
2Q
09
3Q
09
4Q
09
1Q
10
2Q
10
3Q
10
4Q
10
1Q
11
2Q
11
3Q
11
4Q
11
1Q
12
2Q
12
3Q
12
4Q
12
1Q
13
2Q
13
3Q
13
4Q
13
1Q
14
2Q
14
3Q
14
4Q
14
1Q
15
2Q
15
3Q
15
T-Mobile Orange Polska Cyfrowy Polsat P4

107
TMT (NEUTRAL): CYFROWY POLSAT IS OUR SECTOR’S TOP PICK
SECTOR PICKS: Cyfrowy Polsat (Buy, TP PLN32.0) remains our preferred name in the telco universe. The company had successfully refinanced all of its debt,
which should allow for significant interest savings starting from 2016. We like Cyfrowy Polsat for its broadest multi-play offer on the market, high potential synergies
and strong focus on deleveraging. However, we think that in 2016 Cyfrowy Polsat will likely decide to buy Midas from Mr. Zygmunt Solorz-Zak instead of paying a
dividend. Due to the TV broadcasting segment’s good performance and on-going restructuring after the merger with Polkomtel, we expect Cyfrowy Polsat to be able
to reverse the negative EBITDA trend in 2016.
The European Telco Index climbed to long-term highs in August 2015, posting growth of 25% in the January – August period, in theory offering an upside to all the
Polish telco names (which are all trading at a discount). However, Orange’s (Sell, TP PLN6.40) core business is under persistent competitive pressure, not to
mention the Net Debt to EBITDA ratio growing for certain to some 2x, which will likely cut the company’s DPS to PLN0.25 (DY 3.8%). Netia’s (Hold, TP PLN5.80)
key shareholders are struggling to sell it on favorable terms – maximisation of the EBITDA (via acquisitions) and minimisation of CAPEX should work for yet another
year, in our view. Finally, exponential growth of data volumes keeps supporting Midas’s (Buy, TP PLN0.82) valuation. We believe that Poland’s telecoms may be hot
with M&As this year – unless Orange acquires something or Netia will be finally acquired, almost any transaction mentioned on the slide on the right should have a
strong negative impact on the OPL / NET fixed-skewed businesses. We still believe that MDS will be an acquisition target, with the price as the key question mark.
In 2016, CD Projekt (Hold, TP PLN29.0) will likely be cashing in on the success of The Witcher 3. The game has become an unprecedented success, both in terms
of sales and quality. The Witcher 3 is a ‘must-have’ game on the next gen console, which in 2016, supported by two extension packs and a re-release as GOTY
edition, should allow CD Projekt to generate over PLN100mn in net earnings. Sell-ins should exceed 10mn units. In March, the company is to announce its new
strategy that should sched more light on the company’s future projects. The upcoming months will be very important for CI Games (Buy, TP PLN29.9) valuation
prospects. First, the release of Sniper Ghost Warrior 3, planned for 3Q16, is the biggest challenge for the company. CI Games seems to have learnt its lesson from
a series of low quality and poorly selling games like Alien Fear and Enemy Front and its announcement of Sniper: Ghost Warrior 3 shows that the company is back
on the right path. The game attracted a much better critical response after its first showings on E3 and Gamescom. We also assume that its better quality will
translate into higher sales vs. Sniper 2, while the higher price (USD59.99/EUR59.99), larger share of digital distribution and, finally, better profitability due to the
company’s own distribution office in the U.S. should all translate into record-high results in 2016E. According to the management’s recent guidance, we should
expect the release date of Sniper 3 sometime in 3Q16, likely in September. Consequently, this short delay could affect CI Games’ next AAA title Lords of the Fallen
2 (we now expect its release in 2018E vs. 2017E in our previous report).
Source: Bloomberg, DM BZ WBK Research
Telco and video games stocks valuation and performance
Market Cap P/E EV/EBITDA Stock Performance
Company (PLNmn) 2015E 2016E 2017E 2015E 2016E 2017E 1M 3M YTD
Cyfrowy Polsat 15477 11.6 13.7 13.4 7.1 6.9 6.4 -4.3% 5.4% 3.0%
Orange Polska 8530 19.1 95.9 n.a. 4.3 4.3 4.3 -9.6% -8.5% -21.9%
Netia 1873 51.1 28.9 48.1 4.1 3.9 4.2 -2.2% -1.3% -3.6%
Midas 873 n.a. n.a. n.a. n.a. 104.4 17.9 -4.8% -4.8% 7.3%
CD Projekt 2184 6.3 22.0 55.6 4.3 14.9 42.6 -14.8% -10.0% 37.7%
CI Games 303 n.a. 4.3 34.4 338.7 1.6 15.2 -10.0% 10.6% 180.3%

108
HEALTHCARE (NEUTRAL): M&A STORY TO DOMINATE IN 2016
Source: NFZ, PMR, DM BZ WBK Research
Public and private health care spendings (PLNbn)
Source: NFZ, DM BZ WBK Research
PET/CT market in Poland INVESTMENT CASE: We maintain our neutral stance on the defensive
healthcare sector for 2016. We believe that M&A activity will likely be the
major growth driver for the sector in the coming months. The recently
announced review of strategic options by Voxel’s main shareholder may
suggest that Voxel could soon have a new shareholder – a scenario that
would be positive for the minority shareholders as well. We think that
M&A activity could support the share price of Medicalgorithmics as well.
The company signed a preliminary agreement to buy U.S. distributor
Medi-Lynx. SECTOR OUTLOOK: NEUTRAL.
WEAK RADIOPHARMA MARKET: New regulations in oncology and
lower reimbursement for PET/CT diagnostics affected the radiopharmacy
market negatively in 2015. The cut of reimbursement to PLN3.0-3.3k
from PLN4.1k for one PET/CT procedure caused a similar, c30%, drop in
the FDG dose price and a significant reduction of orders for advanced
radiopharmaceuticals. Moreover, the so called ‘oncology package’
brought no growth in the number of procedures and, more importantly,
caused PET/CT clinics to have problems with fulfilling their contracts with
the NFZ health fund. For 2016, we do not expect any significant rise in
the number of procedures as we do not expect new clinics to enter the
system.
8%
14%
19%
10%
3% 3% 4%6%
4% 4% 4%
0%
5%
10%
15%
20%
25%
0
10
20
30
40
50
60
70
80
20
05
20
06
20
07
20
08
20
09
20
10
20
11
20
12
20
13
20
14
20
15
E
20
16
E
20
17
E
20
18
E
20
19
E
20
20
E
Public Private Growth
PLN4.5k
PLN4.1k
PLN3.3k44.0%
13.6%16.7%
31.9%
13.9%
2.9%
25.4%
2.1%
0%
10%
20%
30%
40%
50%
60%
70%
80%
90%
0
5,000
10,000
15,000
20,000
25,000
30,000
35,000
40,000
45,000
2008 2009 2010 2011 2012 2013 2014 2015E 2016E
Number of PET/CT procedures (lhs)RefundationDynamics y/y (rhs)

109
HEALTHCARE (NEUTRAL): WE FAVOUR VOXEL, MDG OVER SYNEKTIK
SECTOR PICKS: For the last 12 months, Voxel (Hold, TP PLN19.5) has significantly outperformed its major competitor Synektik. It managed to
secure contracts for two PET/CT clinics in Bialystok and Brzozow. This allowed Voxel to raise revenues, which, when coupled with lower SG&A, led
to a significant EBITDA improvement. Moreover, Voxel offers further revenue upside – it is yet to sign contracts for PET/CT and Gamma Knife in
Katowice. It is also finalizing a new PET/CT in Opole. The company trades at a 2016E and 2017E EV/EBITDA of 8.5x and 7.5x, which is
undemanding, in our view. It trades at a discount to Synektik. The stock offers some upside in case of an M&A story and a positive scenario in
PET/CT and Gamma Knife contracting.
Medicalgorithmics (Buy, TP PLN285) announced plans to buy a U.S. company, Medi-Lynx, that sells and provides medical services using the
Medicalgorithmics Pocket ECG hardware. The acquisition would improve the company’s results (it generated US$32.7mn revenues and US$8.0mn
net profit in 2H14 and 1H15). On top of that, we see Medicalgorithmics as a growth stock, selling its services on the basis of the attractive SaaS
model. The company also has the potential to expand further geographically. What is more, it should also be able to take advantage of the strong
USD at the beginning of 2016. Looking at the current valuation, excluding the impact of the potential acquisition, the company is trading at a 2016E
and 2017E P/E of 23.1x and 18.7x, respectively, which is undemanding because the company offers some upside, in our view.
Synektik (Buy, TP PLN23.8) was hit the hardest in 2015 as the FDG dose price fell c30% y/y, while volumes remained unchanged. This led to a
c30% cut in revenues in Synektik’s radiopharmacy segment. The segment’s EBITDA will likely stand at PLN0.5mn in 2015E vs. nearly PLN7mn in
2013. Fortunately, the company signed several large contracts for shipments of diagnostic devices, which should at least partially offset the negative
effect of the poor performance of radiopharma segment in 2015. In our opinion, adjustments to the oncology law, which should differentiate prices of
different procedures, could boost the market for FDG. Moreover, there are still some PET/CT clinics that have no contract with NFZ. A new tender
for medical procedures could include them in the system, which, in consequence, would lead to higher demand for FDG and be positive for Synektik.
The company has so far been the least attractive in the sector, trading with a premium to Voxel. Finally, in 1/2Q16, the company’s cardiac tracer
should complete the first stage of clinical trials. The outcome of this process is likely to affect Synektik’s valuation.
Source: Bloomberg, DM BZ WBK Research
Health Care stocks valuation and performance
Market Cap P/E EV/EBITDA Stock Performance
Company (PLNmn) 2015E 2016E 2017E 2015E 2016E 2017E 1M 3M YTD
Medicalgorithmics 857 42.8 29.4 20.5 33.1 22.3 15.2 6.0% 21.2% 31.2%
Voxel 192 17.2 17.6 14.9 7.9 7.3 6.3 -1.3% 5.8% 97.4%
Synektik 148 n.a. 44.9 34.4 33.3 14.5 11.8 8.3% 2.9% -15.6%
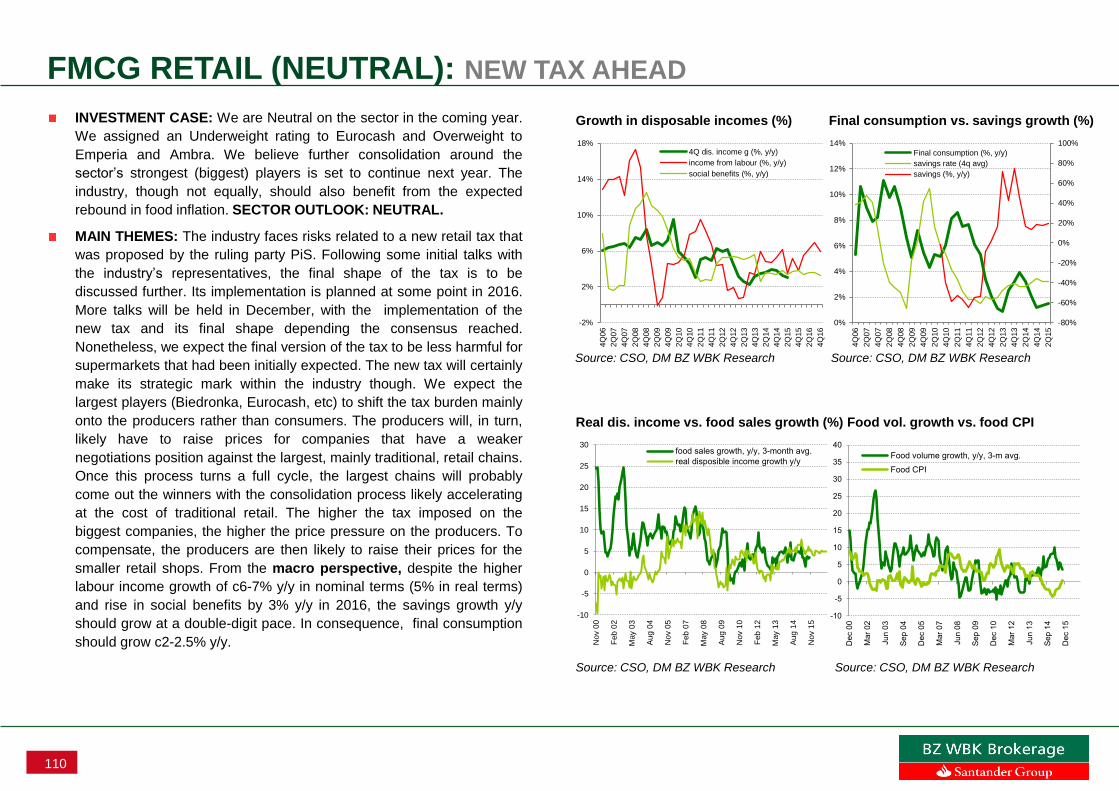
110
FMCG RETAIL (NEUTRAL): NEW TAX AHEAD
Growth in disposable incomes (%) Final consumption vs. savings growth (%)
Real dis. income vs. food sales growth (%) Food vol. growth vs. food CPI
-2%
2%
6%
10%
14%
18%
4Q
06
2Q
07
4Q
07
2Q
08
4Q
08
2Q
09
4Q
09
2Q
10
4Q
10
2Q
11
4Q
11
2Q
12
4Q
12
2Q
13
4Q
13
2Q
14
4Q
14
2Q
15
4Q
15
2Q
16
4Q
16
4Q dis. income g (%, y/y)
income from labour (%, y/y)
social benefits (%, y/y)
-80%
-60%
-40%
-20%
0%
20%
40%
60%
80%
100%
0%
2%
4%
6%
8%
10%
12%
14%
4Q
06
2Q
07
4Q
07
2Q
08
4Q
08
2Q
09
4Q
09
2Q
10
4Q
10
2Q
11
4Q
11
2Q
12
4Q
12
2Q
13
4Q
13
2Q
14
4Q
14
2Q
15
Final consumption (%, y/y)
savings rate (4q avg)
savings (%, y/y)
INVESTMENT CASE: We are Neutral on the sector in the coming year.
We assigned an Underweight rating to Eurocash and Overweight to
Emperia and Ambra. We believe further consolidation around the
sector’s strongest (biggest) players is set to continue next year. The
industry, though not equally, should also benefit from the expected
rebound in food inflation. SECTOR OUTLOOK: NEUTRAL.
MAIN THEMES: The industry faces risks related to a new retail tax that
was proposed by the ruling party PiS. Following some initial talks with
the industry’s representatives, the final shape of the tax is to be
discussed further. Its implementation is planned at some point in 2016.
More talks will be held in December, with the implementation of the
new tax and its final shape depending the consensus reached.
Nonetheless, we expect the final version of the tax to be less harmful for
supermarkets that had been initially expected. The new tax will certainly
make its strategic mark within the industry though. We expect the
largest players (Biedronka, Eurocash, etc) to shift the tax burden mainly
onto the producers rather than consumers. The producers will, in turn,
likely have to raise prices for companies that have a weaker
negotiations position against the largest, mainly traditional, retail chains.
Once this process turns a full cycle, the largest chains will probably
come out the winners with the consolidation process likely accelerating
at the cost of traditional retail. The higher the tax imposed on the
biggest companies, the higher the price pressure on the producers. To
compensate, the producers are then likely to raise their prices for the
smaller retail shops. From the macro perspective, despite the higher
labour income growth of c6-7% y/y in nominal terms (5% in real terms)
and rise in social benefits by 3% y/y in 2016, the savings growth y/y
should grow at a double-digit pace. In consequence, final consumption
should grow c2-2.5% y/y.
Source: CSO, DM BZ WBK Research Source: CSO, DM BZ WBK Research
Source: CSO, DM BZ WBK Research Source: CSO, DM BZ WBK Research
-10
-5
0
5
10
15
20
25
30
35
40
Dec 0
0
Mar
02
Ju
n 0
3
Se
p 0
4
Dec 0
5
Mar
07
Ju
n 0
8
Se
p 0
9
De
c 1
0
Mar
12
Ju
n 1
3
Se
p 1
4
Dec 1
5
Food volume growth, y/y, 3-m avg.
Food CPI
-10
-5
0
5
10
15
20
25
30
No
v 0
0
Feb
02
May 0
3
Au
g 0
4
No
v 0
5
Feb
07
May 0
8
Au
g 0
9
No
v 1
0
Feb
12
May 1
3
Au
g 1
4
No
v 1
5
food sales growth, y/y, 3-month avg.
real disposible income growth y/y

111
FMCG RETAIL (NEUTRAL): O/W EMPERIA/AMBRA; U/W: EUROCASH
FCMG sector – valuation multiples in 2015–17E Market capitalization in PLNmn; 12-m TP and current price in PLN
Name mkt. cap. rating 12-m TP curr. price 2015E 2016E 2017E 2015E 2016E 2017E
CEEMEA 20.7 17.6 15.6 10.2 9.3 8.4
LatAm 19.0 16.3 14.4 9.2 7.6 6.9
w holesalers 28.1 22.2 19.3 10.9 10.4 9.8
Asia ex-Japan 22.8 29.9 26.9 11.8 10.1 9.5
Developed Europe 16.8 16.1 14.1 7.6 7.5 7.1
U.S. 18.0 19.1 17.5 6.8 7.1 7.6
Japan 30.5 26.3 22.5 9.8 9.3 8.9
Eurocash 7,427 Hold 35.2 53.5 32.1 27.8 20.1 14.7 13.7 5.9
Emperia 955 Buy 81.0 66.5 22.0 21.2 10.0 8.7 7.6 5.2
Ambra 189 Buy 12.0 7.5 10.3 11.8 11.1 5.7 5.3 4.8
P/E EV/EBITDA
SECTOR PICKS: For 2016, we assigned an Underweight rating to Eurocash (Hold, TP PLN35.2) as the stock’s surging share price in 2015 has made it
expensive. Based on our estimates, which are close to market consensus, Eurocash is currently trading with a FY’16 PE of 28x and an EV/EBITDA of 14x,
which implies eye-striking premiums to its CEEMEA competitors. Eurocash also looks overvalued vs. Jeronimo Martins since it is trading with a 32% and 40%
premium on PE fwd. and EV/EBTIDA fwd., respectively. This is unjustified, in our view. We also assigned an Overweight to Emperia (Buy, TP PLN81)
because Emperia’s current market price values Stokrotka at c.2.4x monthly sales, which we believe to be too low when compared with the M&A transaction
multiples on the FMCG market. Taking into account Emperia’s other assets, namely its cash account at PLN90mn and PLN368mn for real estate, it significantly
limits the downside in case the new tax turns out to be unfavourable, possibly shaving off c.10% of the company’s EBITDA in the most pessimistic scenario. We
also put an Overweight call on Ambra (Buy, TP PLN12) due to its relatively low valuation, that is EV/EBTIDA16 at c5.3x following the recent slide in the share
price. Please note that Ambra generates a stable OCF (avg. conversion ratio at 0.8x), which, along with the limited CAPEX, makes it possible to deliver an
attractive FcF yield (11.5% in 2008-14 on average). This allows Ambra to pay an attractive DY at c. 5%. The company had recently also reported an insider
buying spree, which is a good omen, in our view.
Source: Bloomberg , DM BZ WBK Research

112
POLISH FMCG: JERONIMO - LONG; EUROCASH - SHORT
Source: Bloomberg, DM BZ WBK Research Source: Bloomberg, DM BZ WBK Research
Eurocash vs. Jeronimo is getting expensive on both PE fwd. and EV/EBITDA fwd.
Source: Bloomberg, DM BZ WBK Research
Emperia still looks cheap vs. Eurocash on 12M PE fwd.
0.6
0.8
1.0
1.2
1.4
1.6
1.8
Jan
-06
May-0
6
Se
p-0
6
Jan
-07
May-0
7
Se
p-0
7
Jan
-08
May-0
8
Se
p-0
8
Jan
-09
May-0
9
Se
p-0
9
Jan
-10
May-1
0
Se
p-1
0
Jan
-11
May-1
1
Se
p-1
1
Jan
-12
May-1
2
Se
p-1
2
Jan
-13
May-1
3
Se
p-1
3
Jan
-14
May-1
4
Se
p-1
4
Jan
-15
May-1
5
Se
p-1
5
Jan
-16
May-1
6
Se
p-1
6
eur/jmt P/E ratio Average
SD+1 SD-1
SD+2 SD-2
0.6
0.8
1.0
1.2
1.4
1.6
1.8
2.0
Jun
-07
Oct-
07
Feb-0
8
Jun
-08
Oct-
08
Feb-0
9
Jun
-09
Oct-
09
Feb-1
0
Jun
-10
Oct-
10
Feb-1
1
Jun
-11
Oct-
11
Feb-1
2
Jun
-12
Oct-
12
Feb-1
3
Jun
-13
Oct-
13
Feb-1
4
Jun
-14
Oct-
14
Feb-1
5
Jun
-15
Oct-
15
Feb-1
6
Jun
-16
eur/jmt EV/EBITDA ratio Average
SD+1 SD-1
SD+2 SD-2
0.2
0.7
1.2
1.7
2.2
2.7
3.2
3.7
4.2
Jun
-07
Oct-
07
Fe
b-0
8
Jun
-08
Oct-
08
Fe
b-0
9
Jun
-09
Oct-
09
Fe
b-1
0
Jun
-10
Oct-
10
Feb-1
1
Jun
-11
Oct-
11
Feb-1
2
Jun
-12
Oct-
12
Fe
b-1
3
Jun
-13
Oct-
13
Fe
b-1
4
Jun
-14
Oct-
14
Fe
b-1
5
Jun
-15
Oct-
15
Fe
b-1
6
Jun
-16
eur/emp EV/EBITDA ratio Average
SD+1 SD-1
SD+2 SD-2

113
EUROCASH: UNDERWEIGHT
Source: Bloomberg, DM BZ WBK Research Source: Bloomberg, DM BZ WBK Research
Eurocash is massively overpriced on 12M PE fwd. Eurocash: 12M EV/EBITDA fwd. looks expensive
Source: Bloomberg, DM BZ WBK Research Source: Bloomberg, DM BZ WBK Research
Eurocash: 12M PE looks expensive vs. WIG index Eurocash: shares are overbought
0
10
20
30
40
50
60
70
9
14
19
24
29
34
Dec-0
5
Ma
y-0
6
Oct-
06
Mar-
07
Au
g-0
7
Jan
-08
Jun
-08
Nov-0
8
Ap
r-09
Se
p-0
9
Fe
b-1
0
Jul-1
0
Dec-1
0
Ma
y-1
1
Oct-
11
Ma
r-12
Au
g-1
2
Jan
-13
Jun
-13
Nov-1
3
Ap
r-14
Se
p-1
4
Fe
b-1
5
Jul-1
5
Dec-1
5
Ma
y-1
6
EUR - PE fwd. avg.
SD 1+ SD 2+
SD 1- SD 2-
3 YR avg. price
0
10
20
30
40
50
60
70
3
5
7
9
11
13
15
17
19
Dec-0
5
May-0
6
Oct-
06
Mar-
07
Au
g-0
7
Jan
-08
Jun
-08
Nov-0
8
Ap
r-09
Se
p-0
9
Feb-1
0
Jul-1
0
Dec-1
0
May-1
1
Oct-
11
Mar-
12
Au
g-1
2
Jan
-13
Jun
-13
Nov-1
3
Ap
r-14
Se
p-1
4
Feb-1
5
Jul-1
5
Dec-1
5
May-1
6
EUR - EV/EBITDA fwd. avg.SD 1+ SD 2+SD 1- SD 2-
0.6
0.8
1.0
1.2
1.4
1.6
1.8
2.0
2.2
2.4
2.6
Ja
n-0
6
May-0
6
Sep
-06
Ja
n-0
7
May-0
7
Sep
-07
Ja
n-0
8
May-0
8
Sep
-08
Ja
n-0
9
May-0
9
Sep
-09
Ja
n-1
0
May-1
0
Sep
-10
Ja
n-1
1
May-1
1
Sep
-11
Ja
n-1
2
May-1
2
Sep
-12
Ja
n-1
3
May-1
3
Sep
-13
Ja
n-1
4
May-1
4
Sep
-14
Ja
n-1
5
May-1
5
Sep
-15
Ja
n-1
6
May-1
6
EUR/WIG P/E ratio Average SD+1
SD-1 SD+2 SD-2
-40%
-30%
-20%
-10%
0%
10%
20%
30%
40%
50%
60%
Jul-0
5
Dec-0
5
May-0
6
Oct-
06
Mar-
07
Au
g-0
7
Jan
-08
Jun
-08
Nov-0
8
Ap
r-09
Se
p-0
9
Fe
b-1
0
Jul-1
0
Dec-1
0
May-1
1
Oct-
11
Mar-
12
Au
g-1
2
Jan
-13
Jun
-13
Nov-1
3
Ap
r-14
Se
p-1
4
Feb-1
5
Jul-1
5
Dec-1
5
May-1
6
EUR % dev from 6m avg. avg.SD 1+ SD 2+SD 2- SD 1-
Overbought
Oversold

114
EMPERIA: OVERWEIGHT
Source: Bloomberg, DM BZ WBK Research Source: Bloomberg, DM BZ WBK Research
Emperia: Neutral at 12M PE fwd., … ... but 12M EV/EBTIDA fwd. below average
Source: Bloomberg, DM BZ WBK Research Source: Bloomberg, DM BZ WBK Research
Emperia: 12M PE fwd. vs. WIG index looks neutral Emperia: shares are getting Oversold
0
20
40
60
80
100
120
140
160
180
4
9
14
19
24
29
34
Jun
-11
Se
p-1
1
Dec-1
1
Ma
r-12
Jun
-12
Se
p-1
2
Dec-1
2
Ma
r-13
Jun
-13
Se
p-1
3
Dec-1
3
Ma
r-14
Jun
-14
Se
p-1
4
Dec-1
4
Ma
r-15
Jun
-15
Se
p-1
5
Dec-1
5
Mar-
16
Jun
-16
emp - PE fwd. avg.
SD 1+ SD 2+
0
50
100
150
200
-2
3
8
13
18
23
Jan
-06
Jun
-06
Nov-0
6
Ap
r-07
Se
p-0
7
Fe
b-0
8
Jul-0
8
Dec-0
8
Ma
y-0
9
Oct-
09
Mar-
10
Au
g-1
0
Jan
-11
Jun
-11
Nov-1
1
Ap
r-12
Se
p-1
2
Fe
b-1
3
Jul-1
3
Dec-1
3
Ma
y-1
4
Oct-
14
Ma
r-15
Au
g-1
5
Jan
-16
Jun
-16
EMP- EV/EBITDA fwd. avg.
SD 1+ SD 2+
SD 1- SD 2-
0.6
1.1
1.6
2.1
2.6
3.1
3.6
Jan
-06
Ma
y-0
6
Se
p-0
6
Jan
-07
Ma
y-0
7
Se
p-0
7
Jan
-08
Ma
y-0
8
Se
p-0
8
Jan
-09
Ma
y-0
9
Se
p-0
9
Jan
-10
Ma
y-1
0
Se
p-1
0
Jan
-11
Ma
y-1
1
Se
p-1
1
Jan
-12
Ma
y-1
2
Se
p-1
2
Jan
-13
Ma
y-1
3
Se
p-1
3
Jan
-14
Ma
y-1
4
Se
p-1
4
Jan
-15
Ma
y-1
5
Se
p-1
5
Jan
-16
Ma
y-1
6
emp/wig P/E ratio Average
SD+1 SD-1
SD+2 SD-2
-80%
-60%
-40%
-20%
0%
20%
40%
60%
80%
100%
120%
Jul-0
5
Dec-0
5
May-0
6
Oct-
06
Mar-
07
Au
g-0
7
Jan
-08
Jun
-08
Nov-0
8
Ap
r-09
Se
p-0
9
Feb-1
0
Jul-1
0
Dec-1
0
May-1
1
Oct-
11
Mar-
12
Au
g-1
2
Jan
-13
Jun
-13
Nov-1
3
Ap
r-14
Se
p-1
4
Feb-1
5
Jul-1
5
Dec-1
5
May-1
6
EMP % dev from 6m avg. avg.SD 1+ SD 2+SD 2- SD 1-
Overbought
Oversold

115
AMBRA: OVERWEIGHT
Source: Bloomberg, DM BZ WBK Research Source: Bloomberg, DM BZ WBK Research
Ambra: 12M PE fwd. looks neutral Ambra: 12M EV/EBITDA fwd. looks cheap
Source: Bloomberg, DM BZ WBK Research Source: Bloomberg, DM BZ WBK Research
Ambra: 12M PE fwd. vs. WIG index is getting cheap Ambra: shares are neither oversold nor overbought
0
2
4
6
8
10
12
14
3
4
5
6
7
8
9
10
Jul-1
1
Oct-
11
Jan
-12
Ap
r-1
2
Jul-1
2
Oct-
12
Jan
-13
Ap
r-1
3
Jul-1
3
Oct-
13
Jan
-14
Ap
r-1
4
Jul-1
4
Oct-
14
Jan
-15
Ap
r-1
5
Jul-1
5
Oct-
15
Jan
-16
Ap
r-1
6
Jul-1
6
Oct-
16
amb - EV/EBITDA fwd. avg.
SD 1+ SD 2+
SD 1- SD 1-
avg. price (rhs)
0
2
4
6
8
10
12
14
4
5
6
7
8
9
10
11
12
13
14
Jun
-11
Se
p-1
1
Dec-1
1
Ma
r-12
Jun
-12
Se
p-1
2
Dec-1
2
Ma
r-13
Jun
-13
Se
p-1
3
Dec-1
3
Ma
r-14
Jun
-14
Se
p-1
4
Dec-1
4
Ma
r-15
Jun
-15
Se
p-1
5
Dec-1
5
Ma
r-16
Jun
-16
AMB - PE fwd. avg. SD 1+
SD 2+ SD 1- SD 1-
avg. price
0.0
0.2
0.4
0.6
0.8
1.0
1.2
1.4
1.6
1.8
Ma
y-0
9
Se
p-0
9
Ja
n-1
0
Ma
y-1
0
Se
p-1
0
Ja
n-1
1
Ma
y-1
1
Se
p-1
1
Ja
n-1
2
Ma
y-1
2
Se
p-1
2
Ja
n-1
3
Ma
y-1
3
Se
p-1
3
Ja
n-1
4
Ma
y-1
4
Se
p-1
4
Ja
n-1
5
Ma
y-1
5
Se
p-1
5
Ja
n-1
6
May-1
6
amb/wig P/E ratio Average
SD+1 SD-1
SD+2 SD-2
-80%
-40%
0%
40%
80%
120%
Jul-0
6
Dec-0
6
Ma
y-0
7
Oct-
07
Mar-
08
Au
g-0
8
Jan
-09
Jun
-09
Nov-0
9
Ap
r-10
Se
p-1
0
Fe
b-1
1
Jul-1
1
Dec-1
1
Ma
y-1
2
Oct-
12
Mar-
13
Au
g-1
3
Jan
-14
Jun
-14
Nov-1
4
Ap
r-15
Se
p-1
5
Fe
b-1
6
AMB % dev from 6m avg. avg.
SD 1+ SD 2+
SD 2- SD 1-
Overbought
Oversold

116
CLOTHING & FOOTWEAR RETAIL (U/W): PRESSURE ON SALES & COST
INVESTMENT CASE: We have an Underweight rating for the Clothing
& Footwear industry in 2016 due to the sector’s relatively high
valuations and emerging risks, which should pressure both sales growth
and costs. We believe that the 1) tough price competition in the sector
due to the promotion-driven client and the lowest price gap between
Inditex and competitors in history , 2) lower traffic in shopping malls due
to the growing savings rate (which diminishes the positive effects of
wage and employment growth), saturation of the market and rising
popularity of e-commerce, 3) persistently strong USDPLN and 4) rising
pressure on wages could all have a negative impact on the mass
fashion clothing market. Combining these factors with the relatively high
valuation of the sector causes us to have a rather negative view of the
sector. We are still cautious on the industry leaders - LPP (Underweight)
and CCC (Neutral), in light of the demanding valuations and risks in
both cases. In our view, some of the smaller names continue to offer
more acceptable valuations. SECTOR OUTLOOK: UNDERWEIGHT.
MAIN THEMES: Investors should be focused on the tough competition
on the mass fashion market, which is caused by 1) aggressive price
policies of the strongest player (Inditex has the lowest price gap vs.
competitors in history) and 2) the continuously promotion-driven client,
accustomed to attractive discounts. All of these factors put pressure on
the industry’s sales growth, which is additionally hit by the growing trend
to save. Moreover, the persistently strong USDPLN and rising pressure
on wages also weigh on the industry’s costs. All of these factors will
likely diminish the possible positive effects of the government’s
additional measures, bigger social support, aimed at stimulating
consumption.
Real dis. income vs. clothing sales gr. (%) Clothing vol. growth vs. clothing CPI
Growth in disposable incomes (%) Final consumption vs. savings growth (%)
Source: CSO, DM BZ WBK Research Source: CSO, DM BZ WBK Research
Source: CSO, DM BZ WBK Research Source: CSO, DM BZ WBK Research
-10
0
10
20
30
40
50
Ma
y 0
6
Ma
y 0
7
Ma
y 0
8
Ma
y 0
9
Ma
y 1
0
May 1
1
Ma
y 1
2
Ma
y 1
3
Ma
y 1
4
Ma
y 1
5
Ma
y 1
6
C&F sales growth, y/y, 3-m avg.real disposible income growth y/y
-9
-7
-5
-3
-1
1
3
-10
0
10
20
30
40
50
Ma
y 0
6
Feb
08
No
v 0
9
Aug
11
Ma
y 1
3
Feb
15
No
v 1
6
C&F volume growth, y/y, 3-m avg.C&F CPI
-2%
2%
6%
10%
14%
1Q
10
3Q
10
1Q
11
3Q
11
1Q
12
3Q
12
1Q
13
3Q
13
1Q
14
3Q
14
1Q
15
3Q
15
1Q
16
3Q
16
4Q dis. income g (%, y/y)
income from labour (%, y/y)
social benefits (%, y/y)
-80%
-60%
-40%
-20%
0%
20%
40%
60%
80%
100%
0%
2%
4%
6%
8%
10%
12%
14%
1Q
10
2Q
10
3Q
10
4Q
10
1Q
11
2Q
11
3Q
11
4Q
11
1Q
12
2Q
12
3Q
12
4Q
12
1Q
13
2Q
13
3Q
13
4Q
13
1Q
14
2Q
14
3Q
14
4Q
14
1Q
15
2Q
15
Final consumption (%, y/y, lhs)
savings rate (4q avg, %, lhs)
savings (%, y/y, rhs)

117
CLOTHING & FOOTWEAR RETAIL (U/W): DEMANDING VALUATION OF LEADERS
SECTOR PICKS: We are still cautious about the industry leaders. We put LPP (Buy, TP PLN9,211) on Underweight and CCC (Buy, TP PLN194) on
Neutral on the back of their demanding valuations in light of the persisting risks. With regards to LPP, the company should struggle with a notable revival of
sales due to the tough market environment, which should also prevent any price increases. On the same note, LPP will find it difficult to push further
pressure on COGS from the strong USD and rising wages onto the consumer. All of these should hamper a more significant rebound in the company’s
profits, which, paired with PE16 at 29x, makes us assign an Underweight rating to the stock. We believe CCC’s valuation to be more attractive following it
recent share price correction vs. LPP, though most of the risks for CCC’s business performance are pretty much the same as for LPP. Among the smaller
names, we favour Monnari and Bytom due to their attractive valuation, though we would rather avoid Gino Rossi in 2016 due to its high leverage.
Clothing&Footwear sector – valuation multiples Market capitalization in PLNmn; 12-m TP and current price in PLN
Source: Bloomberg, DM BZ WBK Research, Company data
P/E EV/EBITDA
Name mkt. cap rating 12-m TP current price 2015E 2016E 2017E 2015E 2016E 2017E
LPP 11,859 Buy 9,211 6,556 35.8 29.2 21.9 18.2 14.8 11.8
Monnari 409 Buy 27.8 13.4 16.1 13.4 12.3 8.0 6.9 6.1
Bytom 220 Buy 4.1 3.1 18.0 16.7 13.0 13.5 11.3 8.9
average 23.3 19.8 15.7 13.2 11.0 8.9
CCC 5,722 Buy 194 149 26.2 24.8 19.4 22.3 17.2 14.1
Wojas 80 Buy 10.8 6.4 14.8 14.3 12.7 8.6 8.0 7.4
Gino Rossi 90 Buy 4.5 1.8 35.7 22.8 19.5 10.6 8.4 7.3
average 25.6 20.6 17.2 13.8 11.2 9.6
Total - average 24.4 20.2 16.5 13.5 11.1 9.3
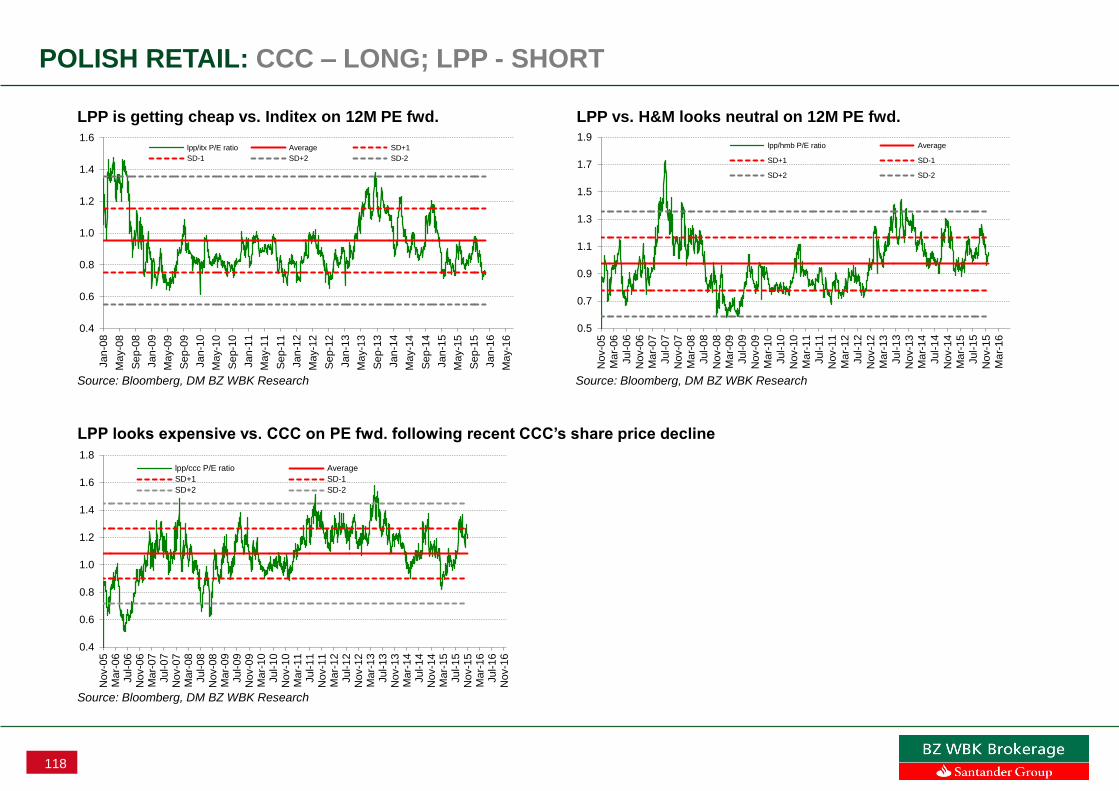
118
POLISH RETAIL: CCC – LONG; LPP - SHORT
LPP is getting cheap vs. Inditex on 12M PE fwd. LPP vs. H&M looks neutral on 12M PE fwd.
LPP looks expensive vs. CCC on PE fwd. following recent CCC’s share price decline
0.4
0.6
0.8
1.0
1.2
1.4
1.6
Jan
-08
May-0
8
Se
p-0
8
Jan
-09
May-0
9
Se
p-0
9
Jan
-10
May-1
0
Se
p-1
0
Jan
-11
May-1
1
Se
p-1
1
Jan
-12
May-1
2
Se
p-1
2
Jan
-13
May-1
3
Se
p-1
3
Jan
-14
May-1
4
Se
p-1
4
Jan
-15
May-1
5
Se
p-1
5
Jan
-16
May-1
6
lpp/itx P/E ratio Average SD+1
SD-1 SD+2 SD-2
0.5
0.7
0.9
1.1
1.3
1.5
1.7
1.9
Nov-0
5
Mar-
06
Jul-0
6
Nov-0
6
Mar-
07
Jul-0
7
Nov-0
7
Mar-
08
Ju
l-0
8
Nov-0
8
Mar-
09
Jul-0
9
Nov-0
9
Mar-
10
Jul-1
0
Nov-1
0
Mar-
11
Jul-1
1
Nov-1
1
Mar-
12
Jul-1
2
Nov-1
2
Mar-
13
Jul-1
3
Nov-1
3
Mar-
14
Jul-1
4
Nov-1
4
Mar-
15
Jul-1
5
Nov-1
5
Mar-
16
lpp/hmb P/E ratio Average
SD+1 SD-1
SD+2 SD-2
0.4
0.6
0.8
1.0
1.2
1.4
1.6
1.8
Nov-0
5M
ar-
06
Jul-0
6N
ov-0
6M
ar-
07
Jul-0
7N
ov-0
7M
ar-
08
Jul-0
8N
ov-0
8M
ar-
09
Jul-0
9N
ov-0
9M
ar-
10
Jul-1
0N
ov-1
0M
ar-
11
Jul-1
1N
ov-1
1M
ar-
12
Jul-1
2N
ov-1
2M
ar-
13
Jul-1
3N
ov-1
3M
ar-
14
Jul-1
4N
ov-1
4M
ar-
15
Jul-1
5N
ov-1
5M
ar-
16
Jul-1
6N
ov-1
6
lpp/ccc P/E ratio Average
SD+1 SD-1
SD+2 SD-2
Source: Bloomberg, DM BZ WBK Research Source: Bloomberg, DM BZ WBK Research
Source: Bloomberg, DM BZ WBK Research

119
LPP: UNDERWEIGHT
LPP: 12M PE fwd. looks demanding LPP: 12M EV/EBITDA fwd. also looks demanding
LPP: 12M PE fwd. vs. WIG index still looks expensive LPP’ share price is getting Oversold
0
2,000
4,000
6,000
8,000
10,000
12,000
5
10
15
20
25
30
35
40
45
Jan
-06
Jul-0
6
Jan
-07
Jul-0
7
Jan
-08
Jul-0
8
Jan
-09
Jul-0
9
Jan
-10
Jul-1
0
Jan
-11
Jul-1
1
Jan
-12
Jul-1
2
Jan
-13
Jul-1
3
Ja
n-1
4
Jul-1
4
Jan
-15
Jul-1
5
Jan
-16
Jul-1
6
LPP- PE fwd. avg.SD 1+ SD 2+SD 1- SD 2-3YR avg. avg. price
0.8
1.0
1.2
1.4
1.6
1.8
2.0
2.2
2.4
2.6
2.8
Ja
n-0
8
May-0
8
Sep
-08
Ja
n-0
9
May-0
9
Sep
-09
Ja
n-1
0
May-1
0
Sep
-10
Ja
n-1
1
May-1
1
Sep
-11
Ja
n-1
2
May-1
2
Sep
-12
Ja
n-1
3
May-1
3
Sep
-13
Ja
n-1
4
May-1
4
Sep
-14
Ja
n-1
5
May-1
5
Sep
-15
Ja
n-1
6
May-1
6
lpp/wig P/E ratio Average SD+1
SD-1 SD+2 SD-2
Source: Bloomberg, DM BZ WBK Research Source: Bloomberg, DM BZ WBK Research
Source: Bloomberg, DM BZ WBK Research Source: Bloomberg, DM BZ WBK Research
0
2,000
4,000
6,000
8,000
10,000
12,000
0
5
10
15
20
25
Ja
n-0
6
Ju
n-0
6
No
v-0
6
Apr-
07
Sep
-07
Feb
-08
Ju
l-08
De
c-0
8
May-0
9
Oct-
09
Mar-
10
Aug
-10
Ja
n-1
1
Ju
n-1
1
No
v-1
1
Apr-
12
Sep
-12
Feb
-13
Ju
l-13
De
c-1
3
May-1
4
Oct-
14
Mar-
15
Aug
-15
Ja
n-1
6
Ju
n-1
6
LPP- EV/EBITDA fwd. avg.SD 1+ SD 2+SD 1- SD 2-avg. price (rhs)
-
2,000
4,000
6,000
8,000
10,000
12,000
-60%
-40%
-20%
0%
20%
40%
60%
80%
100%
120%
Ju
l-05
De
c-0
5
May-0
6
Oct-
06
Mar-
07
Aug
-07
Ja
n-0
8
Ju
n-0
8
No
v-0
8
Apr-
09
Sep
-09
Feb
-10
Ju
l-10
De
c-1
0
May-1
1
Oct-
11
Mar-
12
Aug
-12
Ja
n-1
3
Ju
n-1
3
No
v-1
3
Apr-
14
Sep
-14
Feb
-15
Ju
l-15
De
c-1
5
May-1
6
LPP % dev from 6m avg. avg.SD 1+ SD 2+SD 2- SD 1-LPP price
Overbought
Oversold

120
CCC: NEUTRAL
Source: Bloomberg, DM BZ WBK Research Source: Bloomberg, DM BZ WBK Research
CCC: 12M PE fwd. looks neutral CCC: 12M EV/EBITDA fwd. also looks neutral
Source: Bloomberg, DM BZ WBK Research Source: Bloomberg, DM BZ WBK Research
CCC: 12M PE fwd. vs. WIG index is neutral CCC: shares went to Oversold territory
0
5
10
15
20
25
30
35
40
Ja
n-0
6
May-0
6
Sep
-06
Ja
n-0
7
May-0
7
Sep
-07
Ja
n-0
8
May-0
8
Sep
-08
Ja
n-0
9
May-0
9
Sep
-09
Ja
n-1
0
May-1
0
Sep
-10
Ja
n-1
1
May-1
1
Sep
-11
Ja
n-1
2
May-1
2
Sep
-12
Ja
n-1
3
May-1
3
Sep
-13
Ja
n-1
4
May-1
4
Sep
-14
Ja
n-1
5
May-1
5
Sep
-15
Ja
n-1
6
May-1
6
CCC - PE fwd. avg. SD 1+
SD 2+ SD 1- SD 1-
3 YR
0.6
0.8
1.0
1.2
1.4
1.6
1.8
2.0
2.2
2.4
2.6
No
v-0
5
Mar-
06
Ju
l-06
No
v-0
6
Mar-
07
Ju
l-07
No
v-0
7
Mar-
08
Ju
l-08
No
v-0
8
Mar-
09
Ju
l-09
No
v-0
9
Mar-
10
Ju
l-10
No
v-1
0
Mar-
11
Ju
l-11
No
v-1
1
Mar-
12
Ju
l-12
No
v-1
2
Mar-
13
Ju
l-13
No
v-1
3
Mar-
14
Ju
l-14
No
v-1
4
Mar-
15
Ju
l-15
No
v-1
5
Mar-
16
ccc/wig P/E ratio Average SD+1
SD-1 SD+2 SD-2
-
50
100
150
200
250
-40%
-20%
0%
20%
40%
60%
80%
Ju
l-05
De
c-0
5
May-0
6
Oct-
06
Mar-
07
Aug
-07
Ja
n-0
8
Ju
n-0
8
No
v-0
8
Apr-
09
Sep
-09
Feb
-10
Ju
l-10
De
c-1
0
May-1
1
Oct-
11
Mar-
12
Aug
-12
Ja
n-1
3
Ju
n-1
3
No
v-1
3
Apr-
14
Sep
-14
Feb
-15
Ju
l-15
De
c-1
5
May-1
6
Oct-
16
CCC % dev from 6m avg. avg.SD 1+ SD 2+SD 2- SD 1-CCC price
Overbought
Oversold
0
20
40
60
80
100
120
140
160
180
200
0
5
10
15
20
25
30
Ja
n-0
6
Ju
n-0
6
No
v-0
6
Apr-
07
Sep
-07
Feb
-08
Ju
l-08
De
c-0
8
May-…
Oct-
09
Mar-
10
Aug
-10
Ja
n-1
1
Ju
n-1
1
No
v-1
1
Apr-
12
Sep
-12
Feb
-13
Ju
l-13
De
c-1
3
May-…
Oct-
14
Mar-
15
Aug
-15
Ja
n-1
6
Ju
n-1
6
CCC - EV/EBITDA fwd. avg.
SD 1+ SD 2+
SD 1- SD 1-
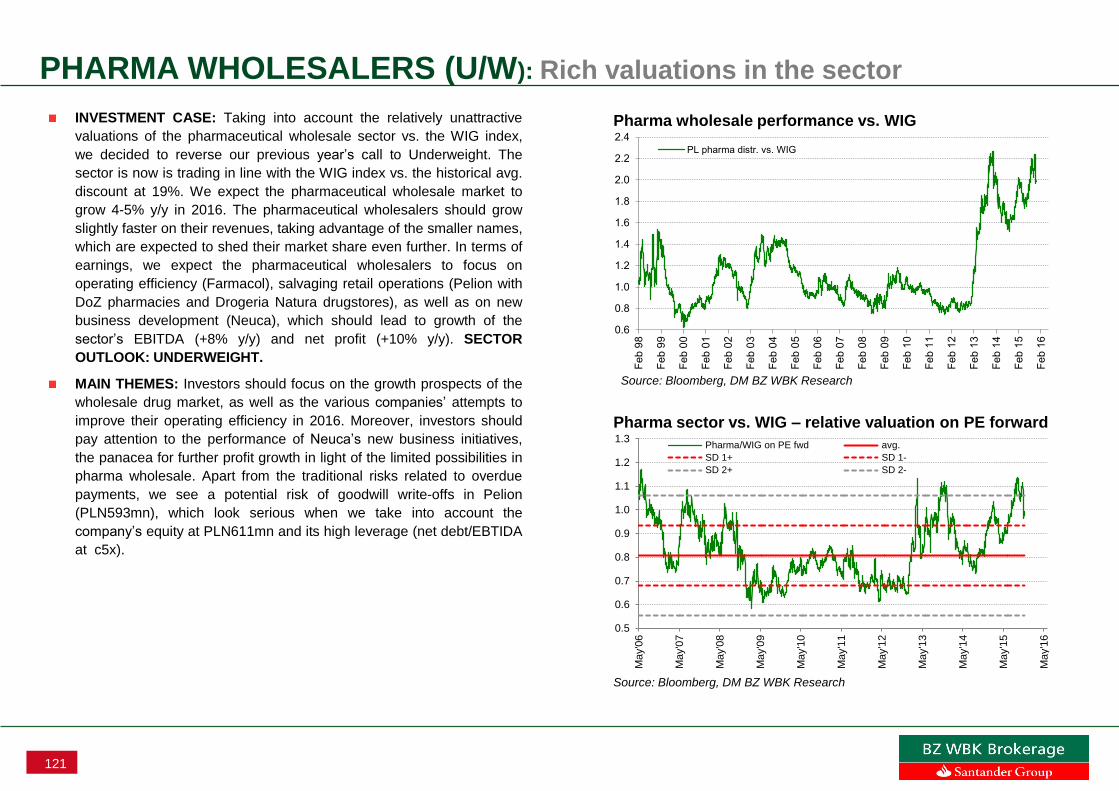
121
PHARMA WHOLESALERS (U/W): Rich valuations in the sector
Source: Bloomberg, DM BZ WBK Research
Source: Bloomberg, DM BZ WBK Research
Pharma wholesale performance vs. WIG
Pharma sector vs. WIG – relative valuation on PE forward
0.6
0.8
1.0
1.2
1.4
1.6
1.8
2.0
2.2
2.4
Feb 9
8
Feb 9
9
Feb 0
0
Feb 0
1
Feb 0
2
Feb 0
3
Feb 0
4
Feb 0
5
Feb 0
6
Feb 0
7
Feb 0
8
Feb 0
9
Feb 1
0
Feb 1
1
Feb 1
2
Feb 1
3
Feb 1
4
Feb 1
5
Feb 1
6
PL pharma distr. vs. WIG
0.5
0.6
0.7
0.8
0.9
1.0
1.1
1.2
1.3
May'0
6
May'0
7
May'0
8
May'0
9
May'1
0
May'1
1
May'1
2
May'1
3
May'1
4
May'1
5
May'1
6
Pharma/WIG on PE fwd avg.
SD 1+ SD 1-
SD 2+ SD 2-
INVESTMENT CASE: Taking into account the relatively unattractive
valuations of the pharmaceutical wholesale sector vs. the WIG index,
we decided to reverse our previous year’s call to Underweight. The
sector is now is trading in line with the WIG index vs. the historical avg.
discount at 19%. We expect the pharmaceutical wholesale market to
grow 4-5% y/y in 2016. The pharmaceutical wholesalers should grow
slightly faster on their revenues, taking advantage of the smaller names,
which are expected to shed their market share even further. In terms of
earnings, we expect the pharmaceutical wholesalers to focus on
operating efficiency (Farmacol), salvaging retail operations (Pelion with
DoZ pharmacies and Drogeria Natura drugstores), as well as on new
business development (Neuca), which should lead to growth of the
sector’s EBITDA (+8% y/y) and net profit (+10% y/y). SECTOR
OUTLOOK: UNDERWEIGHT.
MAIN THEMES: Investors should focus on the growth prospects of the
wholesale drug market, as well as the various companies’ attempts to
improve their operating efficiency in 2016. Moreover, investors should
pay attention to the performance of Neuca’s new business initiatives,
the panacea for further profit growth in light of the limited possibilities in
pharma wholesale. Apart from the traditional risks related to overdue
payments, we see a potential risk of goodwill write-offs in Pelion
(PLN593mn), which look serious when we take into account the
company’s equity at PLN611mn and its high leverage (net debt/EBTIDA
at c5x).

122
PHARMA WHOLESALERS (U/W): Only Pelion is Neutral
Polish pharmaceutical wholesalers: valuation multiples
Source: Bloomberg, DM BZ WBK Research
Market capitalization in PLNmn; 12-m TP and current price in PLN
P/E EV/EBITDA
Company mkt. cap. Rating 12-m TP curr. price 2015E 2016E 2017E 2015E 2016E 2017E
Farmacol 1,289 Buy 66.0 56.0 12.8 12.6 14.6 9.0 7.9 7.9
prem./(disc.) to Pelion 3% 24% 56% -11% -16% -12%
prem./(disc.) to Neuca -24% -17% 0% -28% -28% -21%
Neuca 1,704 Buy 376.0 335.0 17.0 15.2 14.6 12.5 11.0 10.0
prem./(disc.) to Pelion 36% 50% 56% 24% 16% 11%
prem./(disc.) to Farmacol 32% 20% 0% 38% 38% 27%
Pelion 600 Hold 79.0 47.5 12.5 10.1 9.4 10.1 9.5 9.0
prem./(disc.) to Farmacol -3% -20% -36% 12% 20% 14%
prem./(disc.) to Neuca -27% -33% -36% -19% -14% -10%
SECTOR PICKS: We regard Neuca (Buy, TP PLN403) and Farmacol (Buy, TP PLN69) as Underweight purely on their high valuations. Despite the
stock’s very poor quality, we have Pelion as Neutral (Hold, TP PLN88) mainly on the back of the recent share price pullback. Based on our forecasts
for 2016, Neuca trades at a PE’16 of 15x, which implies a 50% premium to Pelion and a 20% premium to Farmacol. Neuca also trades in line with its
fair PE, which we estimate at c.15x. Taking this into account, it will be hard for Neuca to replicate its excellent performance from 2015 (+52%).
Farmacol trades at a PE’16 of 13x, which implies a 24% premium vs. Pelion and a 17% discount vs. Neuca. Please note, however, that Farmacol has
a huge net cash position (PLN220mn), which makes its valuation on the EV/EBITDA much more attractive. On the other hand, the company does not
pay dividends, which lowers the significance of its net cash position, in our view. Pelion trades at a PE’16 of 10x, i.e. at a 33% discount vs. Neuca and
a 20% discount vs. Farmacol. We believe that such a discount should start to limit further falls, though investors should bear in mind the very low
quality of Pelion and the looming risk of a massive goodwill write-off, which could leave it practically without any capital. The PE16 at 10x also remains
above the fair level, which we currently estimate at c. 9.1x.

123
PHARMA WHOLESALERS: PAIR TRADES
Source: Bloomberg, DM BZ WBK Research Source: Bloomberg, DM BZ WBK Research
Neuca looks expensive vs. Farmacol on 12M PE fwd. Neuca looks expensive vs. Pelion on 12M PE fwd.
Source: Bloomberg, DM BZ WBK Research
Farmacol is neutral vs. Pelion on 12M PE fwd.
0.2
0.4
0.6
0.8
1.0
1.2
1.4
1.6
Ma
y-0
6
Se
p-0
6
Jan
-07
May-0
7
Se
p-0
7
Jan
-08
Ma
y-0
8
Se
p-0
8
Jan
-09
Ma
y-0
9
Se
p-0
9
Jan
-10
Ma
y-1
0
Se
p-1
0
Jan
-11
Ma
y-1
1
Se
p-1
1
Jan
-12
Ma
y-1
2
Se
p-1
2
Jan
-13
Ma
y-1
3
Se
p-1
3
Jan
-14
Ma
y-1
4
Se
p-1
4
Jan
-15
Ma
y-1
5
Se
p-1
5
Jan
-16
Ma
y-1
6
neu/fcl P/E ratio AverageSD+1 SD-1SD+2 SD-2
0.5
0.7
0.9
1.1
1.3
1.5
1.7
1.9
2.1
Jan
-07
May-0
7
Se
p-0
7
Jan
-08
May-0
8
Se
p-0
8
Jan
-09
May-0
9
Se
p-0
9
Jan
-10
May-1
0
Se
p-1
0
Jan
-11
May-1
1
Se
p-1
1
Jan
-12
May-1
2
Se
p-1
2
Jan
-13
May-1
3
Se
p-1
3
Jan
-14
May-1
4
Se
p-1
4
Jan
-15
May-1
5
Se
p-1
5
Jan
-16
May-1
6
fcl/pel P/E ratio Average SD+1
SD-1 SD+2 SD-2
0.2
0.4
0.6
0.8
1.0
1.2
1.4
1.6
1.8
2.0
2.2
May-0
6
Se
p-0
6
Jan
-07
Ma
y-0
7
Se
p-0
7
Jan
-08
Ma
y-0
8
Se
p-0
8
Jan
-09
Ma
y-0
9
Se
p-0
9
Jan
-10
Ma
y-1
0
Se
p-1
0
Jan
-11
Ma
y-1
1
Se
p-1
1
Jan
-12
Ma
y-1
2
Se
p-1
2
Jan
-13
Ma
y-1
3
Se
p-1
3
Jan
-14
Ma
y-1
4
Se
p-1
4
Jan
-15
Ma
y-1
5
Se
p-1
5
Jan
-16
May-1
6
Se
p-1
6
neu/pel P/E ratio AverageSD+1 SD-1SD+2 SD-1

124
NEUCA: UNDERWEIGHT
Source: Bloomberg, DM BZ WBK Research Source: Bloomberg, DM BZ WBK Research
Neuca is massively overpriced on 12M PE fwd. … … and 12M EV/EBITDA fwd.
Source: Bloomberg, DM BZ WBK Research Source: Bloomberg, DM BZ WBK Research
Neuca looks extremely expensive vs. WIG index on 12M PE fwd. Neuca: shares are neither Overbought nor Oversold
0.2
0.4
0.6
0.8
1.0
1.2
1.4
1.6
Ma
y-0
6
Se
p-0
6
Jan
-07
Ma
y-0
7
Se
p-0
7
Jan
-08
May-0
8
Se
p-0
8
Jan
-09
Ma
y-0
9
Se
p-0
9
Jan
-10
Ma
y-1
0
Se
p-1
0
Jan
-11
Ma
y-1
1
Se
p-1
1
Jan
-12
Ma
y-1
2
Se
p-1
2
Jan
-13
Ma
y-1
3
Se
p-1
3
Jan
-14
Ma
y-1
4
Se
p-1
4
Jan
-15
Ma
y-1
5
Se
p-1
5
Jan
-16
Ma
y-1
6
neu/wig P/E ratio Average
SD+1 SD-1
SD+2 SD-2
-60%
-40%
-20%
0%
20%
40%
60%
80%
Jul-0
5
Dec-0
5
Ma
y-0
6
Oct-
06
Mar-
07
Au
g-0
7
Ja
n-0
8
Ju
n-0
8
Nov-0
8
Ap
r-09
Se
p-0
9
Fe
b-1
0
Jul-1
0
Dec-1
0
Ma
y-1
1
Oct-
11
Ma
r-12
Au
g-1
2
Ja
n-1
3
Ju
n-1
3
Nov-1
3
Ap
r-14
Se
p-1
4
Fe
b-1
5
Jul-1
5
Dec-1
5
Ma
y-1
6
Neu % dev from 6m avg. avg.
SD 1+ SD 2+
SD 2- SD 1-
Overbought
Oversold
0
50
100
150
200
250
300
350
400
0
2
4
6
8
10
12
14
16
18
20
Sep
-06
Ja
n-0
7
May-0
7
Sep
-07
Ja
n-0
8
May-0
8
Sep
-08
Ja
n-0
9
May-0
9
Sep
-09
Ja
n-1
0
May-1
0
Sep
-10
Ja
n-1
1
May-1
1
Sep
-11
Ja
n-1
2
May-1
2
Sep
-12
Ja
n-1
3
May-1
3
Sep
-13
Ja
n-1
4
May-1
4
Sep
-14
Ja
n-1
5
May-1
5
Sep
-15
Ja
n-1
6
May-1
6
Sep
-16
NEU - PE fwd. avg. SD 1+SD 1- SD 2+ SD 2-avg. price
0
50
100
150
200
250
300
350
400
0
2
4
6
8
10
12
14
Feb-0
7
Jul-0
7
Dec-0
7
May-0
8
Oct-
08
Mar-
09
Au
g-0
9
Jan
-10
Jun
-10
Nov-1
0
Ap
r-11
Se
p-1
1
Feb-1
2
Jul-1
2
Dec-1
2
May-1
3
Oct-
13
Mar-
14
Au
g-1
4
Jan
-15
Jun
-15
Nov-1
5
Ap
r-16
NEU - EV/EBITDA fwd. avg.SD 1+ SD 1-SD 2+ SD 2-avg. price (rhs)

125
PELION: NEUTRAL
Source: Bloomberg, DM BZ WBK Research Source: Bloomberg, DM BZ WBK Research
Pelion: 12M PE fwd. looks neutral Pelion: 12M EV/EBITDA fwd. looks neutral
Source: Bloomberg, DM BZ WBK Research Source: Bloomberg, DM BZ WBK Research
Pelion: 12M PE fwd. vs. WIG index looks neutral Pelion: Shares are Oversold
0
20
40
60
80
100
120
140
0
5
10
15
20
25
Ju
n-0
6
Oct-
06
Feb
-07
Ju
n-0
7
Oct-
07
Feb
-08
Ju
n-0
8
Oct-
08
Feb
-09
Ju
n-0
9
Oct-
09
Feb
-10
Ju
n-1
0
Oct-
10
Feb
-11
Ju
n-1
1
Oct-
11
Feb
-12
Ju
n-1
2
Oct-
12
Feb
-13
Ju
n-1
3
Oct-
13
Feb
-14
Ju
n-1
4
Oct-
14
Feb
-15
Ju
n-1
5
Oct-
15
Feb
-16
Ju
n-1
6
PEL - PE fwd. avg. SD 1+
SD 2+ SD 1- SD 2-
avg. price
0
20
40
60
80
100
120
140
0
5
10
15
20
Ap
r-06
Se
p-0
6
Feb-0
7
Jul-0
7
Dec-0
7
May-0
8
Oct-
08
Mar-
09
Au
g-0
9
Jan
-10
Jun
-10
Nov-1
0
Ap
r-11
Se
p-1
1
Feb-1
2
Jul-1
2
Dec-1
2
May-1
3
Oct-
13
Mar-
14
Au
g-1
4
Jan
-15
Jun
-15
Nov-1
5
Ap
r-16
PEL - EV/EBITDA fwd. avg.SD 1+ SD 2+SD 1- SD 2-avg. price (rhs)
0.3
0.5
0.7
0.9
1.1
1.3
1.5
1.7
1.9
2.1
May-0
6
Se
p-0
6
Jan
-07
May-0
7
Se
p-0
7
Jan
-08
May-0
8
Se
p-0
8
Jan
-09
May-0
9
Se
p-0
9
Jan
-10
May-1
0
Se
p-1
0
Jan
-11
May-1
1
Se
p-1
1
Jan
-12
May-1
2
Se
p-1
2
Jan
-13
May-1
3
Se
p-1
3
Jan
-14
May-1
4
Se
p-1
4
Jan
-15
May-1
5
Se
p-1
5
Jan
-16
May-1
6
PEL/wig P/E ratio AverageSD+1 SD-1SD+2 SD-2
-80%
-60%
-40%
-20%
0%
20%
40%
60%
80%
100%
Jul-0
5
Jan
-06
Jul-0
6
Jan
-07
Jul-0
7
Jan
-08
Jul-0
8
Jan
-09
Jul-0
9
Jan
-10
Jul-1
0
Jan
-11
Jul-1
1
Jan
-12
Jul-1
2
Jan
-13
Jul-1
3
Jan
-14
Jul-1
4
Jan
-15
Jul-1
5
Jan
-16
Jul-1
6
PEL % dev from 6m avg. avg.SD 1+ SD 2+SD 2- SD 1-
Oversold
Overbought

126
FARMACOL: OVERWEIGHT
Source: Bloomberg, DM BZ WBK Research Source: Bloomberg, DM BZ WBK Research
Farmacol: 12M PE fwd. looks neutral Farmacol : 12M EV/EBITDA fwd. looks neutral
Source: Bloomberg, DM BZ WBK Research Source: Bloomberg, DM BZ WBK Research
Farmacol : 12M PE fwd. vs. WIG index looks expensive Farmacol : Shares are getting Oversold
0
10
20
30
40
50
60
70
80
3
5
7
9
11
13
15
17
19
21
Ju
n-0
6
Oct-
06
Feb
-07
Ju
n-0
7
Oct-
07
Feb
-08
Ju
n-0
8
Oct-
08
Feb
-09
Ju
n-0
9
Oct-
09
Feb
-10
Ju
n-1
0
Oct-
10
Feb
-11
Ju
n-1
1
Oct-
11
Feb
-12
Ju
n-1
2
Oct-
12
Feb
-13
Ju
n-1
3
Oct-
13
Feb
-14
Ju
n-1
4
Oct-
14
Feb
-15
Ju
n-1
5
Oct-
15
Feb
-16
Ju
n-1
6
FCL - PE fwd. avg. SD 1+SD 1- SD 2+ SD 2-avg. price
0
10
20
30
40
50
60
70
80
3
5
7
9
11
13
15
Feb-0
6Jun
-06
Oct-
06
Feb-0
7Jun
-07
Oct-
07
Feb-0
8Jun
-08
Oct-
08
Feb-0
9Jun
-09
Oct-
09
Feb-1
0Jun
-10
Oct-
10
Feb-1
1Jun
-11
Oct-
11
Feb-1
2Jun
-12
Oct-
12
Feb-1
3Jun
-13
Oct-
13
Feb-1
4Jun
-14
Oct-
14
Feb-1
5Jun
-15
Oct-
15
Feb-1
6Jun
-16
FCL - EV/EBITDA fwd. avg.SD 1+ SD 1-SD 2+ SD 2-avg. price (rhs)
0.4
0.6
0.8
1.0
1.2
1.4
1.6
May-0
6
Se
p-0
6
Jan
-07
May-0
7
Se
p-0
7
Jan
-08
May-0
8
Se
p-0
8
Jan
-09
May-0
9
Se
p-0
9
Jan
-10
May-1
0
Se
p-1
0
Jan
-11
May-1
1
Se
p-1
1
Jan
-12
May-1
2
Se
p-1
2
Jan
-13
May-1
3
Se
p-1
3
Jan
-14
May-1
4
Se
p-1
4
Jan
-15
May-1
5
Se
p-1
5
Jan
-16
May-1
6
fcl/wig P/E ratio Average SD+1
SD-1 SD+2 SD-2
-60%
-40%
-20%
0%
20%
40%
60%
Jul-0
5
Dec-0
5
May-0
6
Oct-
06
Mar-
07
Au
g-0
7
Jan
-08
Jun
-08
Nov-0
8
Ap
r-09
Se
p-0
9
Feb-1
0
Jul-1
0
Dec-1
0
May-1
1
Oct-
11
Mar-
12
Au
g-1
2
Jan
-13
Jun
-13
Nov-1
3
Ap
r-14
Se
p-1
4
Feb-1
5
Jul-1
5
Dec-1
5
May-1
6
Oct-
16
FCL % dev from 6m avg. avg.
SD 1+ SD 2+
SD 2- SD 1-
Oversold
Overbought

127
WORK SERVICE: UNDERWEIGHT
Source: Bloomberg, DM BZ WBK Research Source: Bloomberg, DM BZ WBK Research
Work Service: 12M PE fwd. looks demanding Work Service : 12M EV/EBITDA fwd. looks neutral
Source: Bloomberg, DM BZ WBK Research Source: Bloomberg, DM BZ WBK Research
Work Service : 12M PE fwd. vs. WIG index looks overvalued Work Service : Shares are Oversold
11
13
15
17
19
21
23
25
27
May-1
3
Se
p-1
3
Jan
-14
May-1
4
Se
p-1
4
Jan
-15
May-1
5
Se
p-1
5
Jan
-16
WSE - PE fwd. avg.
SD 1+ SD 1-
SD2+ SD 2-
7
8
9
10
11
12
13
14
15
May-1
3
Nov-1
3
May-1
4
Nov-1
4
May-1
5
Nov-1
5
WSE - PE fwd. avg.SD 1+ SD 1-SD2+ SD 2-
0.8
0.9
1.0
1.1
1.2
1.3
1.4
1.5
1.6
1.7
1.8
Jun
-13
Jul-1
3
Au
g-1
3
Se
p-1
3O
ct-
13
Nov-1
3D
ec-1
3
Jan
-14
Feb-1
4M
ar-
14
Ap
r-14
Ma
y-1
4
Jun
-14
Ju
l-1
4
Au
g-1
4
Se
p-1
4O
ct-
14
Nov-1
4D
ec-1
4
Jan
-15
Feb-1
5M
ar-
15
Ap
r-15
May-1
5
Jun
-15
Jul-1
5
Au
g-1
5
Se
p-1
5O
ct-
15
Nov-1
5D
ec-1
5
Jan
-16
Feb-1
6M
ar-
16
wse/wig P/E ratio Average SD+1
SD-1 SD+2 SD-2
-30%
-20%
-10%
0%
10%
20%
30%
40%
50%
60%
Jul-1
2
Se
p-1
2
Nov-1
2
Jan
-13
Mar-
13
May-1
3
Jul-1
3
Se
p-1
3
Nov-1
3
Jan
-14
Mar-
14
May-1
4
Jul-1
4
Se
p-1
4
Nov-1
4
Jan
-15
Mar-
15
May-1
5
Jul-1
5
Se
p-1
5
Nov-1
5
Jan
-16
Mar-
16
WSE % dev from 6m avg. avg.
SD 1+ SD 2+
SD 2- SD 1-Overbought
Oversold

Equity Research Department
Dariusz Górski, Director, Equity Research tel. (+48) 22 586 81 00 [email protected] Strategy, Banks, Financials Paweł Puchalski, CFA, Head of Equity Research Team tel. (+48) 22 586 80 95 [email protected] Telecommunications, Metals & Mining, Power
Grzegorz Balcerski, Securities Broker, Investment Adviser tel. (+48) 22 534 16 10 [email protected] Research Associate Andrzej Bieniek, Securities Broker, Investment Adviser tel. (+48) 22 586 85 21 [email protected] Financials, Banks Tomasz Kasowicz tel. (+48) 22 586 81 55 [email protected] Oil&Gas, Chemicals Łukasz Kosiarski tel. (+48) 22 586 82 25 [email protected] Media, IT, IT distribution, Video Games, Health Care
Adrian Kyrcz tel. (+48) 22 586 81 59 [email protected] Construction, Real Estate Tomasz Sokołowski tel. (+48) 22 586 82 36 [email protected] Pharma, Retail Michał Sopiel tel. (+48) 22 586 82 33 [email protected] Industrials, TSL, Quantitative Analysis
Sales & Trading Department
Piotr Żagan, Head tel. (+48) 22 586 80 84 [email protected]
Robert Chudała tel. (+48) 22 586 85 14 [email protected] Kamil Cisło, Securities Broker tel. (+48) 22 586 80 90 [email protected] Alex Kamiński tel. (+48) 22 586 80 63 [email protected]
Marcin Kuciapski, Securities Broker tel. (+48) 22 586 80 96 [email protected] Błażej Leśków, Securities Broker tel. (+48) 22 586 80 83 [email protected]
Michał Stępkowski, Securities Broker tel. (+48) 22 586 85 15 [email protected] Michał Szafraniuk, Securities Broker tel. (+48) 22 586 80 91 [email protected] Marek Wardzyński, Securities Broker tel. (+48) 22 586 80 87 [email protected] Wojciech Wośko, Securities Broker tel. (+48) 22 586 80 82 [email protected]
Dom Maklerski BZ WBK
Jana Pawla II Av. 17
00-854 Warszawa
Tel. (+48) 22 586 81 08

129
DISCLAIMER LIMITATION OF LIABILITY
This material was produced by Dom Maklerski BZ WBK a separate organizational unit of Bank Zachodni WBK S.A. conducting brokerage activity (DM BZ WBK). DM BZ WBK is subject to the regulations of the Act on Trading in Financial
Instruments dated July 29th 2005 (Journal of Laws of 2014, item 94 - consolidated text, further amended), Act on Public Offering, Conditions Governing the Introduction of Financial Instruments to Organised Trading, and Public Companies
dated July 29th 2005 (Journal of Laws of 2013, item 1382 - consolidated text, further amended), Act on Capital Market Supervision dated July 29th 2005 (Journal of Laws of 2005, No.183 item 1537 further amended). It is addressed to
qualified investors and professional clients as defined under the above indicated regulations and to Clients of DM BZ WBK entitled to gain recommendations based on the brokerage services agreements.
All trademarks, service marks and logos used in this report are trademarks or service marks or registered trademarks or service marks of Bank Zachodni WBK or entities belonging to BZ WBK Group.
DM BZ WBK is an author of this document. All copyrights belong to BZ WBK. This document may not be reproduced or published, in part or in whole, without a prior written consent of BZ WBK.
DM BZ WBK may not have taken any steps to ensure that the securities referred to in this report are suitable for any particular investor. The investments and services contained or referred to in this report may not be suitable for particular
investor and it is recommended to consult an independent investment advisor in case of doubts about such investments or investment services. Nothing in this report constitutes investment, legal, accounting or tax advice, or a
representation that any investment or strategy is suitable or appropriate to investor's individual circumstances.
The recipient is responsible for conducting his own investigation and analysis of the information contained or referred to in this document and of evaluating the merits and risks involved in the Financial instruments forming the subject matter
of this document. This document is valid at the time of its preparation and may change. DM BZ WBK may have issued, and may in the future issue, other reports that are inconsistent with, and reach different conclusions from, the
information presented in this report. Those reports reflect the different assumptions, views and analytical methods of the analysts who prepared them and DM BZ WBK is under no obligation to ensure that such other reports are brought to
the attention of any recipient of this report. Information and points of view expressed in this document may change without any notice. DM BZ WBK informs that success in past projections or forecasts is not a guarantee of success in future
ones. Projections, forecasts or estimated data included in the document have hypothetical character and may not be achieved due to multiple risk factors, including the volatility of the market, sector volatility, corporate actions.
Information and opinions contained herein have been compiled or gathered by DM BZ WBK from sources believed to be reliable. The sources of the data include WSE, PAP, Reuters, Bloomberg, EPFR, GUS /Central Statistical Office/, NBP
/National Bank of Poland/, DM BZ WBK, Akcje.net, financial periodicals and business and finance websites.
In the opinion of DM BZ WBK, this document has been prepared with all due diligence. DM BZ WBK is not responsible for any inaccuracy, incompleteness or omissions in this document (in particular if information on which this document
was relied on, turned out to be inaccurate, incomplete or not fully reflected the actual state of facts), if they are the result of circumstances for which the DM BZ WBK shall bear no responsibility, especially when with due diligence they could
not be foreseen at the time of preparing the document.
DM BZ WBK is subject to the supervision of the Financial Supervision Commission and this document has been prepared within the legal scope of the activity of DM BZ WBK.
The date on the first page of this report is the date of preparation and publication of the document.
Explanations of special terminology used:
EBIT - earnings before interest and tax
EBITDA - earnings before interest, taxes, depreciation, and amortization
P/E - price-earnings ratio
EV - enterprise value (market capitalisation plus net debt)
PEG - P/E to growth ratio
EPS - earnings per share
CPI - consumer price index
WACC - weighted average cost of capital
CAGR - cumulative average annual growth
P/CE - price to cash earnings (net profit plus depreciation and amortisation) ratio
NOPAT - net operational profit after taxation
FCF - free cash flows
BV - book value
ROE - return on equity
P/BV - price-book value
Overweight/Underweight/Neutral - means that, according to the authors of this document, the stock price may perform better/worse/neutrally than the WIG20 index in a given month.
DM BZ WBK SA confirms that the adjustment for dividend paid, adjustment for preemptive rights, share split or merger, or any other purely technical adjustments to the share price will result in corresponding changes in the stocks' target
prices - such situations must be considered within purely technical context and should not be considered as changes to recommendations in the meaning of the law.
Recommendation definitions:
Buy - indicates a stock's total return to exceed more than 15% over the next twelve months.
Hold - indicates a stock's total return to be in range of 0%-15% over the next twelve months.
Sell - indicates a stock's total return to be less than 0% over the next twelve months. In preparing this document DM BZ WBK applied at least two of the following valuation methods:
1. discounted cash flows (DCF),
2. comparative,
3. mid-cycle,
4. dividend discount model (DDM),
5. residual income,
6. warranted equity method (WEV),
7. SOTP valuation,
8. liquidation value.

130
DISCLAIMER The discounted cash flows (DCF) valuation method is based on expected future discounted cash flows. One advantage of the DCF valuation method is that it takes into account all cash streams reaching Issuer and the cost of money over
time. Some disadvantages of the DCF valuation method are that a large number of parameters and assumptions need to be estimated; and the valuation is sensitive to changes in those parameters.
The comparative valuation method is based on the economic rule of "one price". Some advantages of the comparative valuation method are that the analyst need only estimate a small number of parameters; the valuation is based on
current market conditions; the relatively large accessibility of indicators for companies being compared; and that there is an extensive knowledge of the comparative method among investors. Some disadvantages of valuation by the
comparative method are the considerable sensitivity of the results of the valuation on the choice of companies to the comparative group; the method can lead to a simplification of the picture of the company which in turn can lead to omitting
certain important factors (e.g. growth dynamics, extra-operational assets, corporate governance, the repeatability of results, differences in applied accounting standards); and the uncertainty of the effectiveness of a market valuation of
companies being compared.
The mid-cycle valuation is based on long-term averages for the two-year forward consensus P/E and EV/EBITDA multiples for the members of the peer group. The methodology is aimed calculating a fair, through the cycle value of cyclical
stocks. Among its shortfalls is that at peaks and/or troughs of the cycle, the implied fair value may deviate substantially from the market's value of an analysed stock as well as the methods' reliance on the quality of external data (we use
Bloomberg consensus here). Simplicity and average through-cycle value allowing to capture over as well as under-valuation of a given stock are the main advantages of this methodology.
The dividend discount model (DDM) valuation is based on the net present value of the future dividends that are expected to be paid out by the company. Some advantages of the DDM valuation method are that it takes into account real
cash flows to equity-owners and that the methodology is used in respect to companies with long dividend payout history. Main disadvantage of the DDM valuation method is that dividend payouts are based on a large number of parameters
and assumptions, including dividend payout ratio.
The residual income method is conceptually close to the discounted cash flows method (DCF) for non-financial stocks, the difference being that it is based on expected residual income (returns over COE) rather than expected future cash
flows. One advantage of this valuation method is that it captures the excess of profit potentially available to shareholders and the cost of money over time. Main disadvantage of the valuation method is that a large number of parameters and
assumptions need to be estimated; and the valuation is sensitive to changes in those parameters.
The warranted equity method (WEV) is based on the formula P/BV = (two year forward ROE less sustainable growth rate)/(Cost of equity less sustainable growth rate) which allows estimating a fair value (FV) of a given stock in two years
time. Subsequently the FV is discounted back to today. The main advantage of the WEV method is that it is a transparent one and based on relatively short term forecasts, hence substantially reducing the margin of forecasting error. The
main disadvantage in our view is that the model is based on the principle that stock price should converge towards its fair value implied by company's ROE and COE.
The SOTP valuation - different assets of a company are being valued according to different valuation methods, and the sum of these valuations represents the final valuation of the company. SOTP valuation advantages / disadvantages are
identical to advantages and disadvantages of the specific valuation methods used.
The Liquidation value method - liquidation value is the estimated amount of money that an asset or company could be quickly sold for, such as if it were to go out of business. Then, the estimated assets value is adjusted for liabilities and
liquidation expenses. One advantage of this valuation method is its simplicity. This method does not account for intangible assets as goodwill, which is the main disadvantage.
DISCLOSURES:
Whenever the document refers to "the Issuer", it shall mean all the companies which are established in it.
Bank Zachodni WBK S.A. (BZ WBK) and/or a company in the BZ WBK Group may, in the period of preparing this document, directly or indirectly, hold more than 1% of the share capital of financial instruments issued by the Issuer or
financial instruments whose value depends on the value of financial instruments issued by the Issuer. Information relating to this is available upon request.
BZ WBK may hold shares of the Issuer or any financial instruments of the Issuer being the subject of this document, in the amount reaching at least 5% of the share capital.
BZ WBK, may be connected with the Issuer and may hold financial instruments being the subject of this document which may cause reaching at least 5% of the share capital.BZ WBK does not rule out that in the period of preparing this
document any Affiliate of BZ WBK might purchase shares of the Issuer or any financial instruments being the subject of this document which may cause reaching at least 5% of the share capital.
The Issuer may hold shares of BZ WBK. The Issuer may hold shares of any entity of BZ WBK Group, in the period of preparing this document, shares of the Issuer, in the amount reaching at least 1% of the share capital and at least 5% of
the share capital.
BZ WBK Group, its affiliates, representatives or employees may occasionally undertake transactions or may be interested in acquiring securities of companies directly or indirectly related to those being analysed (long or short position in
securities of the Issuer or in options, forward transactions or other derivative securities based on them). The information in this subject are available on request.
Among those, who prepared this document, as well as among those who didn't prepare it but had or might have had the access to it, there may be such individuals who hold shares of the Issuer or financial instruments whose value is
connected with the value of the financial instruments issued by the Issuer.
DM BZ WBK may acts as market maker/ Issuer’s market maker for financial instruments issued by the Issuer.
During the last 12 months DM BZ WBK might have been a party to agreements relating to the offering of financial instruments issued by Issuer and connected with the price of financial instruments issued by Issuer. During the last 12
months DM BZ WBK might have been a member of syndicate for financial instruments issued by Issuer.
During the last 12 months DM BZ WBK might have received remuneration for providing services for the Issuer.
It cannot be ruled out that, in the period of the next twelve months or the period in which this document is in force, DM BZ WBK will submit an offer to provide services for the Issuer or will purchase or dispose of financial instruments issued
by the Issuer or whose value depends on the value of financial instruments issued by the Issuer.
Members of the Issuer's authorities or their relatives may be members of the management board or supervisory board of DM BZ WBK
No person engaged in preparing the report or his/her relative is the member of the Issuer's authorities and hold management position in this entity.
DM BZ WBK is a party to the agreement with the Issuer related to issuing recommendations.
Affiliates of BZ WBK may, from time to time, to the extent permitted by law, participate or invest in financing transactions with Issuer, perform services for or solicit business from such Issuer and/or have a position or effect transactions in
the financial instruments issued by the Issuer. This document has not been disclosed to the Issuer. Other important links:
Over the last three months Dom Maklerski BZ WBK issued 28 Buy recommendations, 11 Hold recommendations and 10 Sell recommendations.
THE PRESENTED DOCUMENT IS SUBMITTED TO YOU AND CANNOT BE COPIED OR HANDED OVER TO THIRD PARTIES.
THIS DOCUMENT NOR ANY COPY HEREOF SHALL NOT BE DISTRIBUTED DIRECTLY OR INDIRECTLY IN JURISDICTIONS WHERE SUCH DISTRIBUTION MAY BE RESTRICTED BY LAW.
DM BZ WBK INFORMS THAT INVESTING ASSETS IN FINANCIAL INSTRUMENTS IMPLIES THE RISK OF LOSING PART OR ALL THE INVESTED ASSETS.
DM BZ WBK INDICATES THAT THE PRICE OF THE FINANCIAL INSTRUMENTS IS INFLUENCED BY LOTS OF DIFFERENT FACTORS, WHICH ARE OR CANNOT BE DEPENDENT FROM ISSUER AND ITS BUSINESS RESULTS.
THESE ARE FACTORS SUCH ASCHANGING ECONOMICAL, LAW, POLITICAL OR TAX CONDITION. MORE INFORMATION ON FINANCIAL INSTRUMENTS AND RISK CONNECTED WITH THEM CAN BE FOUND ON
www.dmbzwbk.pl, SECTION DISCLAIMERS AND RISK.
Dom Maklerski BZ WBK is a separate organizational unit of Bank Zachodni WBK S.A. with its registered office in Wrocław, ul. Rynek 9/11, 50-950 Wrocław, registered by the District Court in Wrocław - Fabryczna, VI Commercial Division of
the National Court Register under the number 0000008723. Share capital – PLN 992 345 340 fully paid up. Taxpayer Identification Number (NIP) 896-000-56-73