Equity & ommodity Strategy - gata.org
43
ADM Investor Services Internaonal Limited is authorised and regulated by The Financial Conduct Authority. Member of The London Stock Exchange. Registered office: 4th Floor Millennium Bridge House, 2 Lambeth Hill, London EC4V 3TT. Registered in England No. 2547805 a subsidiary of Archer Daniels Midland Company. Risk Warning: Investments in Equies, CFDs, Futures, Opons, Derivaves and Foreign Exchange can fluctuate in value, investors should therefore be aware that they may not realise the inial amount invested, and indeed may incur addional liabilies. These Investments may entail above average financial risk of loss, and investors should therefore carefully consider whether their financial circumstances and investment experience permit them to invest and, if necessary, seek the advice of an independent Financial Advisor. Some services described are not available to certain customers due to regulatory constraints either in the United Kingdom or elsewhere. © 2014 ADM Investor Services Internaonal Limited 2014. Equity & Commodity Strategy Fulcanelli Report Paul Mylchreest Email: [email protected] Tel: +44 20 7716 8257 4th December 2014 1 Long Nikkei/Short Gold Profitable, dangerous and missed by everybody? Can you see it? Invert the Nikkei axis…now can you see it? Has the market completely missed a huge long/short trade which has helped to drive up the Nikkei and drive down the gold price for more than 2 years? One that puts risk-taking and leveraged specu- laon by our industry in an unfavourable light again.
Transcript of Equity & ommodity Strategy - gata.org
ADM Investor Services International Limited is authorised and regulated by The Financial Conduct Authority. Member of The London Stock Exchange. Registered office: 4th Floor Millennium Bridge House, 2 Lambeth Hill, London EC4V 3TT. Registered in England No. 2547805 a subsidiary of Archer Daniels Midland
Company. Risk Warning: Investments in Equities, CFDs, Futures, Options, Derivatives and Foreign Exchange can fluctuate in val ue, investors should therefore be aware that they may not realise the initial amount invested, and indeed may incur additional li abilities. These Investments may entail above average financial risk of
loss, and investors should therefore carefully consider whether their financial circumstances and investment experience permit them to invest and, if necessary, seek the advice of an independent Financial Advisor. Some services described are not available to certain customers due to regulatory constraints either in the United
Kingdom or elsewhere. © 2014 ADM Investor Services International Limited 2014.
Equity & Commodity Strategy Fulcanelli Report
Paul Mylchreest Email: [email protected] Tel: +44 20 7716 8257
4th December 2014
1
Long Nikkei/Short Gold
Profitable, dangerous and missed by everybody?
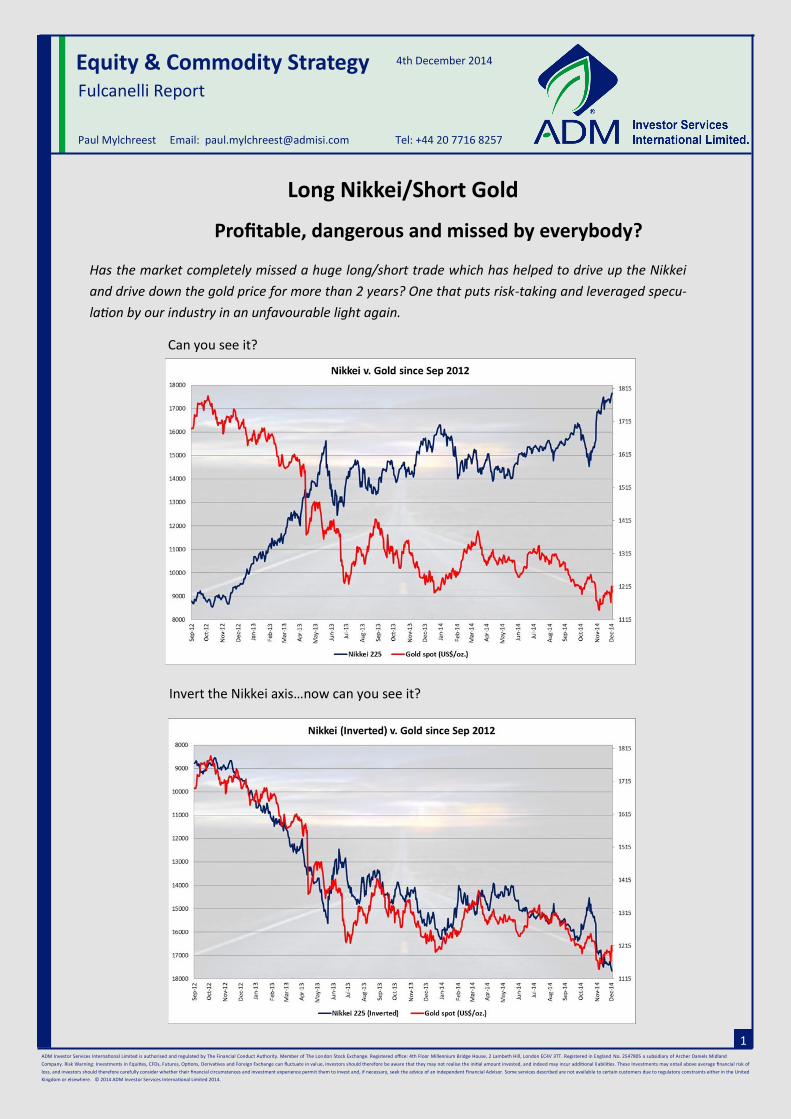
Can you see it?
Invert the Nikkei axis…now can you see it?
Has the market completely missed a huge long/short trade which has helped to drive up the Nikkei
and drive down the gold price for more than 2 years? One that puts risk-taking and leveraged specu-
lation by our industry in an unfavourable light again.

ADM Investor Services International Limited is authorised and regulated by The Financial Conduct Authority. Member of The London Stock Exchange. Registered office: 4th Floor Millennium Bridge House, 2 Lambeth Hill, London EC4V 3TT. Registered in England No. 2547805 a subsidiary of Archer Daniels Midland
Company. Risk Warning: Investments in Equities, CFDs, Futures, Options, Derivatives and Foreign Exchange can fluctuate in value, investors should therefore be aware that they may not realise the initial amount invested, and indeed may incur additional liabilities. These Investments may entail above average financial
risk of loss, and investors should therefore carefully consider whether their financial circumstances and investment experience permit them to invest and, if necessary, seek the advice of an independent Financial Advisor. Some services described are not available to certain customers due to regulatory constraints
either in the United Kingdom or elsewhere. © 2014 ADM Investor Services International Limited 2014.
Equity & Commodity Strategy - Fulcanelli Report Paul Mylchreest Email: [email protected] Tel: +44 20 7716 8257
2
Contents
Executive Summary 3
Clues in the repo market 6
Summer of 2012 9
Shorting the gold market 12
What is the long side of the long/short trade? 16
BoJ meetings - tying together the two sides 19
Physical gold demand 35
Anomalies in silver 40

ADM Investor Services International Limited is authorised and regulated by The Financial Conduct Authority. Member of The London Stock Exchange. Registered office: 4th Floor Millennium Bridge House, 2 Lambeth Hill, London EC4V 3TT. Registered in England No. 2547805 a subsidiary of Archer Daniels Midland
Company. Risk Warning: Investments in Equities, CFDs, Futures, Options, Derivatives and Foreign Exchange can fluctuate in value, investors should therefore be aware that they may not realise the initial amount invested, and indeed may incur additional liabilities. These Investments may entail above average financial
risk of loss, and investors should therefore carefully consider whether their financial circumstances and investment experience permit them to invest and, if necessary, seek the advice of an independent Financial Advisor. Some services described are not available to certain customers due to regulatory constraints
either in the United Kingdom or elsewhere. © 2014 ADM Investor Services International Limited 2014.
Equity & Commodity Strategy - Fulcanelli Report Paul Mylchreest Email: [email protected] Tel: +44 20 7716 8257
3
Executive Summary
In the report we outline a thesis which draws together a complex web of interactions between Japanese equi-
ties, the gold market, repo financing, BoJ monetary policy meetings and anomalies in the silver market.
These interactions began forming in late-2012, specifically around September, as far as we can tell. With hind-
sight, this was a pivotal period in recent financial history, when central banks embarked on a new phase of
aggressive credit creation. We found no evidence of these interactions beforehand and think it is fairly unlike-
ly that they are merely the result of coincidence.
At the centre of this, it looks to us like a large, leveraged long/short trade has been built up which is long the
Nikkei index and short gold. The more the Nikkei has risen, the more the gold price has been pushed down.
It’s a clever trade from a cynical perspective, as we’ll explain. However, it also raises concerns regarding risk
taking and the measurement of risk which have made speculative abuses by some entities in our industry
(especially banks) only too infamous in recent years.
If we are correct about this trade, a shock affecting either the long or short side could roil financial markets if it
was unwound in a disorderly fashion. Potential threats include:
Growing criticism of Abenomics and weak economic performance in Japan;
Increasing signs of schism in gold and silver markets between strong physical demand and price discov-
ery which is dominated by paper instruments and which has almost reached nonsensical levels; and
Interest rates in the repo market have started to rise with the Fed winding down QE3.
Going into a bit more detail…
We suspected that gold might be the short in a long/short trade when we noticed a reasonably close correlation
between gold and interest rates in the repo market. The more the cost of repo funding declined, the more the
price of gold declined.
The repo market is a major part of the aptly-named “shadow banking” sector. It is also the nexus for investment
strategies involving leverage and short selling. If gold was the short in a long/short trade, the next question was
whether there was a corresponding long? We think that the answer is yes, the Nikkei.
If we cast our minds back to September 2012, we had the announcements of “QE3” by the Fed and the “Enhancement of Monetary Easing” by the Bank of Japan (BoJ). The initial reaction of the gold price was positive, which was hardly surprising, although it turned out to be short-lived. The subsequent collapse in gold has been counterintuitive, especially when the demand for physical gold bullion
has remained strong as we show. It has also given the impression that the impact of monetary policies which are
“loose”, to a degree which is unprecedented, is benign. It is much too early to reach that conclusion.
Major upward moves in the Nikkei and coincident weakness in the gold price can, in most cases, be closely tied to BoJ policy meetings for the past more than two years. This is especially true when BoJ meetings have included announcements of more aggressive monetary policy in support of “Abenomics.” We cover examples of such price moves which followed BoJ meetings in January 2013, April 2013, October 2013, May 2014, August 2014 and October 2014.

ADM Investor Services International Limited is authorised and regulated by The Financial Conduct Authority. Member of The London Stock Exchange. Registered office: 4th Floor Millennium Bridge House, 2 Lambeth Hill, London EC4V 3TT. Registered in England No. 2547805 a subsidiary of Archer Daniels Midland
Company. Risk Warning: Investments in Equities, CFDs, Futures, Options, Derivatives and Foreign Exchange can fluctuate in value, investors should therefore be aware that they may not realise the initial amount invested, and indeed may incur additional liabilities. These Investments may entail above average financial
risk of loss, and investors should therefore carefully consider whether their financial circumstances and investment experience permit them to invest and, if necessary, seek the advice of an independent Financial Advisor. Some services described are not available to certain customers due to regulatory constraints
either in the United Kingdom or elsewhere. © 2014 ADM Investor Services International Limited 2014.
Equity & Commodity Strategy - Fulcanelli Report Paul Mylchreest Email: [email protected] Tel: +44 20 7716 8257
4
A number of unpleasant ironies are immediately apparent:
It is helping to drive up equity prices in the country with the most rapidly expanding credit bubble and
credit bubbles don’t tend to have happy endings;
It is simultaneously driving down the price of the ultimate safe-haven asset and thereby silencing price
signals relating to market and financial system risk;
It appears to be a leveraged trade, obtaining the leverage via ultra-low rates in the repo market. The
latter is a source of systemic risk which is known to regulators but remains unaddressed; and
The logical conclusion is that risk across the world’s financial system is even more under-priced than
market participants realise and many believe it is woefully under-priced.
We are in a global credit bubble in which the multi-trillion dollar expansion of central bank balance sheets, their
imposition of near zero (or even negative) interest rates and control of entire yield curves (directly or indirectly)
are at the cutting edge.
This has encouraged more and more speculation in risk assets which, in many cases, is being enhanced by lever-
age and without a commensurate sense of heightened risk.
Japan is the “cutting edge of the cutting edge” of this expanding global credit bubble.
The “Long Nikkei” side of the trade is profiting from what is starting to look like a reckless and failing Japanese
monetary policy which, rather than ending the economic stagnation, has pushed the economy back into reces-
sion. Perhaps the most important indicator to monitor is growth in real household income, which has been nega-
tive for the past thirteen months.
Assets on the BoJ’s balance sheet are already equivalent to 60% of Japanese GDP. They are set to grow at an an-
nual rate of 17% of current GDP after the BoJ’s latest increase in its asset purchase programme. One could argue
that the more that the BoJ’s policy doesn’t work, the more aggressively it’s applied, the more the Yen falls and
the more the Nikkei rises. Prime Minister Shinzo Abe’s special adviser, Koichi Hamada, was honest enough to
call it a “mild Ponzi game” in a recent interview with the Daily Telegraph.
In the meantime, the “Short gold” side of the trade is profiting in a cynical way from structural flaws which are
specific to gold and silver markets. In gold, price discovery is overwhelmingly dominated by an extreme ratio of
paper gold instruments to physical bullion, estimated by official sources at about 90:1. This flaw in price discov-
ery is being stretched to almost nonsensical levels in the face of strong physical demand.
If we are correct, the liquidity in the gold market, with well over US$100.0bn of gold instruments traded daily,
implies that substantial financial firepower has been required to maintain the intense pressure on the short side
of the trade during the last two years. A number of banks and hedge funds are likely to be involved, although it
has undoubtedly attracted large numbers of trend followers.
Gold, and we are specifically referring to physical bullion, is also the only financial asset which has no counter-
party risk. That alone should make it increasingly sought as a hedge in a credit bubble driven by monetary stimu-
lus undertaken on a rolling basis by central banks.

ADM Investor Services International Limited is authorised and regulated by The Financial Conduct Authority. Member of The London Stock Exchange. Registered office: 4th Floor Millennium Bridge House, 2 Lambeth Hill, London EC4V 3TT. Registered in England No. 2547805 a subsidiary of Archer Daniels Midland
Company. Risk Warning: Investments in Equities, CFDs, Futures, Options, Derivatives and Foreign Exchange can fluctuate in value, investors should therefore be aware that they may not realise the initial amount invested, and indeed may incur additional liabilities. These Investments may entail above average financial
risk of loss, and investors should therefore carefully consider whether their financial circumstances and investment experience permit them to invest and, if necessary, seek the advice of an independent Financial Advisor. Some services described are not available to certain customers due to regulatory constraints
either in the United Kingdom or elsewhere. © 2014 ADM Investor Services International Limited 2014.
Equity & Commodity Strategy - Fulcanelli Report Paul Mylchreest Email: [email protected] Tel: +44 20 7716 8257
5
In a normally functioning market, i.e. one where supply and demand for the physical good holds sway, the huge
movement of gold bullion to China, the world’s largest creditor nation, should have dominated gold market
news flow, seen western investors competing with Asia for scarce physical bullion and maybe even raised ques-
tions about the existing monetary order. As things stand, most investors could not care less about gold.
Where do we go from here?
While we have a strong preference for equities over nearly all forms of credit in an inflationary endgame, the
road we are travelling – basically a never-tried-before monetary experiment to avoid debt deflation - is treacher-
ous.
The question is whether deflation comes before inflation, as one of these two unpalatable outcomes will be re-
quired to extinguish the excessive debt burden carried by Japan and the global economy. It’s also ironic that the
only asset which has historically outperformed in either inflationary or deflationary conditions, with a track rec-
ord stretching back more than 400 years, is gold (cf “The Golden Constant” by Roy Jastram).
In Japan, Abenomics could lead to further substantial devaluation of the Yen. In extremis, the long side of the
trade has almost infinite upside, especially if the architects of Abenomics refuse to let up and simply destroy the
Yen. This is another reason why, being cynical, it’s a clever trade.
While the Nikkei could theoretically go to infinity, the gold price (at least in terms of physical metal) does not
have unlimited downside. Consequently, the inherent risk in the trade is asymmetric.
If the gold price keeps falling, offers of physical metal will be withdrawn at some point. That would cause a
schism in the respective pricing of physical bullion versus inferior paper substitutes. The potential for such a
schism is already being foreshadowed, periodically, by negative GOFO rates and backwardation in the gold fu-
tures market.
We have also looked again at anomalies in the silver market which have left us scratching our heads for months.
In contrast to gold, ETF silver holdings and open interest in the futures market remain elevated in spite of the
even bigger decline in the silver price.
We question whether entities which have put on this long/short trade have acknowledged that a rapid exit from
a large short position in gold could be problematic. If so, we wonder whether a short position in gold is being
partially hedged by accumulating long positions in (high beta) silver.
The much smaller size of the silver market, limited above-ground silver inventory, and stretched level of the
gold/silver ratio, means that a sustained reversal in the gold price would have a disproportionate impact on the
silver price.
From a cynical perspective, that would make this trade really clever.

ADM Investor Services International Limited is authorised and regulated by The Financial Conduct Authority. Member of The London Stock Exchange. Registered office: 4th Floor Millennium Bridge House, 2 Lambeth Hill, London EC4V 3TT. Registered in England No. 2547805 a subsidiary of Archer Daniels Midland
Company. Risk Warning: Investments in Equities, CFDs, Futures, Options, Derivatives and Foreign Exchange can fluctuate in value, investors should therefore be aware that they may not realise the initial amount invested, and indeed may incur additional liabilities. These Investments may entail above average financial
risk of loss, and investors should therefore carefully consider whether their financial circumstances and investment experience permit them to invest and, if necessary, seek the advice of an independent Financial Advisor. Some services described are not available to certain customers due to regulatory constraints
either in the United Kingdom or elsewhere. © 2014 ADM Investor Services International Limited 2014.
Equity & Commodity Strategy - Fulcanelli Report Paul Mylchreest Email: [email protected] Tel: +44 20 7716 8257
6
Clues in the repo market
The repo market is a major part of what is aptly named the shadow banking system.
From the perspective of this report, the key aspect of the repo market is that it is the nexus for leverage and
short selling for banks, broker-dealers and hedge funds operating in the financial markets.
In July 2013, the Treasury Borrowing Advisory Committee described repo as nothing less than.
“The silently beating heart of the market”
This was Tyler Durden of Zero Hedge commenting on the significance of the repo market in 2013:
“Most market participants will go through their trading life ignorant of the fact that the leverage in this mar-
ket is what drives their assets up or down in most cases”
The repo market is very large.
The Federal Reserve estimated that the size of the US repo market in January 2014 was US$3.1 trllion. The Euro-
pean repo market is even bigger, estimated to be Eur5.8 trn in June 2014 by ICMA (International Capital Markets
Association).
In the words of Mary Fricker from the Repowatch website. “The repurchase (‘repo’) market is where large financial institutions borrow trillions of dollars from each other
and from central banks every day, using securities as collateral.”
Here is a schematic of the US repo market, showing how securities dealers (including banks) and hedge funds can borrow cash against the provision of collateral. Source: New York Fed

ADM Investor Services International Limited is authorised and regulated by The Financial Conduct Authority. Member of The London Stock Exchange. Registered office: 4th Floor Millennium Bridge House, 2 Lambeth Hill, London EC4V 3TT. Registered in England No. 2547805 a subsidiary of Archer Daniels Midland
Company. Risk Warning: Investments in Equities, CFDs, Futures, Options, Derivatives and Foreign Exchange can fluctuate in value, investors should therefore be aware that they may not realise the initial amount invested, and indeed may incur additional liabilities. These Investments may entail above average financial
risk of loss, and investors should therefore carefully consider whether their financial circumstances and investment experience permit them to invest and, if necessary, seek the advice of an independent Financial Advisor. Some services described are not available to certain customers due to regulatory constraints
either in the United Kingdom or elsewhere. © 2014 ADM Investor Services International Limited 2014.
Equity & Commodity Strategy - Fulcanelli Report Paul Mylchreest Email: [email protected] Tel: +44 20 7716 8257
7
The first time we suspected that the gold price might be caught on the short side of a large, leveraged long/
short trade was in early October this year. This was when we noticed a reasonably close correlation between a
falling gold price and the falling cost of funding in wholesale money (repo) markets.
On checking back, the correlation seemed to kick in from about September 2012 onwards. The summer of
2012 was a critical period when central banks ramped up the use of unconventional monetary policy, both ac-
tual (Fed and BoJ) and threatened (ECB).
Source: Bloomberg, ADM ISI
One way to interpret the chart is that as repo rates fell from around 30bp (0.30%) in late 2012 to as little as 4-
5bp (0.04-0.05%) at times during 2013-14, short sellers of gold used the increased financing capacity to intensi-
fy the downward pressure on the gold price, i.e. by borrowing more paper gold instruments to sell short.
Why did repo rates fall so sharply after the announcement of QE3? It became apparent that the downside of very large QE programmes is that they silo “high quality” collateral, i.e. Treasuries and MBS, on the balance sheet of the central bank. This constrains the flow of collateral which is available to provide liquidity/leverage in the repo market. A consequence of this “squeeze” in the availability of high quality collateral post-QE3 is that traders who were
in possession of high quality collateral were able to increase leverage at increasingly lower interest rates.
If the repo market is being used to finance short positions to push down the price of gold, there is an irony
since the repo market is a source of systemic risk to the financial system while gold is the ultimate safe haven
asset .
The majority of repo funding is overnight and can suddenly evaporate, as Bear Stearns and Lehman discovered,
when counterparty risk is recalibrated. Repo was “ground-zero” in the 2008 financial crisis as David Weidner
outlined in the Wall Street Journal on 29 May 2013.
“The repo market wasn’t just part of the meltdown. It was the meltdown.”

ADM Investor Services International Limited is authorised and regulated by The Financial Conduct Authority. Member of The London Stock Exchange. Registered office: 4th Floor Millennium Bridge House, 2 Lambeth Hill, London EC4V 3TT. Registered in England No. 2547805 a subsidiary of Archer Daniels Midland
Company. Risk Warning: Investments in Equities, CFDs, Futures, Options, Derivatives and Foreign Exchange can fluctuate in value, investors should therefore be aware that they may not realise the initial amount invested, and indeed may incur additional liabilities. These Investments may entail above average financial
risk of loss, and investors should therefore carefully consider whether their financial circumstances and investment experience permit them to invest and, if necessary, seek the advice of an independent Financial Advisor. Some services described are not available to certain customers due to regulatory constraints
either in the United Kingdom or elsewhere. © 2014 ADM Investor Services International Limited 2014.
Equity & Commodity Strategy - Fulcanelli Report Paul Mylchreest Email: [email protected] Tel: +44 20 7716 8257
8
Systemic risk in the repo market has still not been addressed by regulators, despite their full knowledge.
This comment comes from the Federal Reserve Bank of Dallas in a November 2012 report “Understanding the
Risks Inherent in Shadow Banking.”
“Currently, the drivers of systemic risk remain largely intact, and shadow banking appears poised to grow con-
siderably, and dangerously, if it does not acquire the necessary market discipline to shape risk-taking activi-
ties.”
While we can’t offer an opinion on what collateral is being provided in order to borrow funds to short gold, it’s
worth noting that the major banks and securities dealers routinely use re-hypothecation in expanding their repo
activities.
Investopedia defines re-hypothecation thus.
“The practice by banks and brokers of using, for their own purposes, assets that have been posted as collat-
eral by their clients. Clients who permit re-hypothecation of their collateral may be compensated either
through a lower cost of borrowing or a rebate on fees.”
The practice of re-hypothecation increases risk in the repo market itself, adding risk on top of risk.
Having shown the relationship between the gold price and repo rates after September 2012, what was the situa-
tion before then?
The chart below suggests that there was no evidence of any correlation in the prior year, i.e. from September
2011 to August 2012.
Source: Bloomberg, ADM ISI
Going further back, here is the chart from January 2009 to August 2011, which shows no correlation either.

ADM Investor Services International Limited is authorised and regulated by The Financial Conduct Authority. Member of The London Stock Exchange. Registered office: 4th Floor Millennium Bridge House, 2 Lambeth Hill, London EC4V 3TT. Registered in England No. 2547805 a subsidiary of Archer Daniels Midland
Company. Risk Warning: Investments in Equities, CFDs, Futures, Options, Derivatives and Foreign Exchange can fluctuate in value, investors should therefore be aware that they may not realise the initial amount invested, and indeed may incur additional liabilities. These Investments may entail above average financial
risk of loss, and investors should therefore carefully consider whether their financial circumstances and investment experience permit them to invest and, if necessary, seek the advice of an independent Financial Advisor. Some services described are not available to certain customers due to regulatory constraints
either in the United Kingdom or elsewhere. © 2014 ADM Investor Services International Limited 2014.
Equity & Commodity Strategy - Fulcanelli Report Paul Mylchreest Email: [email protected] Tel: +44 20 7716 8257
9
Source: Bloomberg, ADM ISI
Summer of 2012
It’s worth casting our minds back to recap the major events in financial markets around September 2012 when
this repo/gold relationship was established.
Summer 2012 was a very significant period for the implementation of central bank policy.
The Eurozone was in a major (almost terminal) crisis, which was relieved by Draghi’s “Whatever it takes” speech on 26 July 2012. The latter included a verbal threat to use the ECB’s balance sheet in a potentially unlimited fash-ion. The ECB “move” was followed by concrete action in terms of money printing from the Fed and BoJ with their ma-jor QE announcements beginning in September 2012. The Fed’s announcement of QE3 on 13 September 2012; and
The Bank of Japan’s “Enhancement of Monetary Easing” announcement on 19 September 2012.
Summarising these briefly…
The Fed’s QE3 was an open-ended commitment to purchase US$40bn/month of MBS and maintain the Federal
Funds rate near zero “at least through 2015.” In December 2012, the Fed increased its open-ended purchase pro-
gramme by an additional US$45bn/month of Treasury securities, making US$85bn/month in total.
It was around this time that market participants began referring to the Fed’s policy as “QE to infinity” to express
the large and potentially unlimited nature of Federal Reserve money creation.
In September 2012, the BoJ initially increased the size of its then existing Asset Purchase Program from Yen 70
trillion to Yen 80 trillion, which it expected to reach by end-2013. The increased purchases would be achieved on
a 50/50 basis in terms of T-Bills and JGBs.

ADM Investor Services International Limited is authorised and regulated by The Financial Conduct Authority. Member of The London Stock Exchange. Registered office: 4th Floor Millennium Bridge House, 2 Lambeth Hill, London EC4V 3TT. Registered in England No. 2547805 a subsidiary of Archer Daniels Midland
Company. Risk Warning: Investments in Equities, CFDs, Futures, Options, Derivatives and Foreign Exchange can fluctuate in value, investors should therefore be aware that they may not realise the initial amount invested, and indeed may incur additional liabilities. These Investments may entail above average financial
risk of loss, and investors should therefore carefully consider whether their financial circumstances and investment experience permit them to invest and, if necessary, seek the advice of an independent Financial Advisor. Some services described are not available to certain customers due to regulatory constraints
either in the United Kingdom or elsewhere. © 2014 ADM Investor Services International Limited 2014.
Equity & Commodity Strategy - Fulcanelli Report Paul Mylchreest Email: [email protected] Tel: +44 20 7716 8257
On 30 October 2012, the BoJ increased the size of its Asset Purchase Program once again – this time from Yen 80
trillion to Yen 91 trillion by end-2013. Besides T-Bills and JGB, the increased purchases included Commercial Pa-
per, Corporate Bonds, REITs and ETFs.
So from Summer, through the Autumn and into the Winter of 2012, the world’s three largest central banks were
ramping up monetary largesse (actual or threatened).
What was the initial reaction in the gold market?
It was hardly surprising that the initial reaction to these moves from mid-July to early-October was positive.
Source: Bloomberg, ADM ISI
It’s also worth emphasising that financial markets were expecting the Fed to announce QE3 in the run up to the FOMC meeting in September. For example, this was from a Goldman Sachs report on 7 September 2012. “With today’s August employment report showing a nonfarm payroll gain of 96,000 and an unemployment rate of 8.1% because of a drop in the participation rate, we expect a return to unsterilized and probably open-ended asset purchases at the September 12-13 FOMC meeting…We previously forecasted QE3 in December or early 2013.” It was the peak in the gold price shortly after the initial Fed/BoJ announcements which logic suggests was coun-terintuitive…especially in light of the chart below comparing the gold price with the growth in central bank bal-ance sheets since 2009. There was a big trend change in late-2012/early-2013…

ADM Investor Services International Limited is authorised and regulated by The Financial Conduct Authority. Member of The London Stock Exchange. Registered office: 4th Floor Millennium Bridge House, 2 Lambeth Hill, London EC4V 3TT. Registered in England No. 2547805 a subsidiary of Archer Daniels Midland
Company. Risk Warning: Investments in Equities, CFDs, Futures, Options, Derivatives and Foreign Exchange can fluctuate in value, investors should therefore be aware that they may not realise the initial amount invested, and indeed may incur additional liabilities. These Investments may entail above average financial
risk of loss, and investors should therefore carefully consider whether their financial circumstances and investment experience permit them to invest and, if necessary, seek the advice of an independent Financial Advisor. Some services described are not available to certain customers due to regulatory constraints
either in the United Kingdom or elsewhere. © 2014 ADM Investor Services International Limited 2014.
Equity & Commodity Strategy - Fulcanelli Report Paul Mylchreest Email: [email protected] Tel: +44 20 7716 8257
Source: Bloomberg, ADM ISI
The peak in the gold price was followed a few days later by a low in the Nikkei. This made sense when Japanese equities were “bombed out” and investors realised that the BoJ was serious about turning on the “liquidity tap” (even if it had yet to go “nuclear”).
Source: Bloomberg, ADM ISI

ADM Investor Services International Limited is authorised and regulated by The Financial Conduct Authority. Member of The London Stock Exchange. Registered office: 4th Floor Millennium Bridge House, 2 Lambeth Hill, London EC4V 3TT. Registered in England No. 2547805 a subsidiary of Archer Daniels Midland
Company. Risk Warning: Investments in Equities, CFDs, Futures, Options, Derivatives and Foreign Exchange can fluctuate in value, investors should therefore be aware that they may not realise the initial amount invested, and indeed may incur additional liabilities. These Investments may entail above average financial
risk of loss, and investors should therefore carefully consider whether their financial circumstances and investment experience permit them to invest and, if necessary, seek the advice of an independent Financial Advisor. Some services described are not available to certain customers due to regulatory constraints
either in the United Kingdom or elsewhere. © 2014 ADM Investor Services International Limited 2014.
Equity & Commodity Strategy - Fulcanelli Report Paul Mylchreest Email: [email protected] Tel: +44 20 7716 8257
Shorting the gold market
If our thesis about a long/short trade is correct, our contention is that it would take substantial financial firepow-
er to maintain intense downward pressure on the gold price given the liquidity in the gold market.
Let’s consider gold market liquidity, beginning with the LBMA.
Since September 2012, the AVERAGE DAILY NUMBER OF OUNCES TRANSFERRED via the LBMA’s clearing process
is 20.4m oz. That is equivalent to about 656 tonnes, some 20% of annual mine production worldwide and, in dol-
lar terms, $24.5bn.
However, there is an important difference between the amount of gold which is TRANSFERRED on the LBMA and
the amount TRADED. While the 656 tonnes might sound like a large amount of gold, it substantially understates
the true amount of gold TRADED.
LBMA members net out their own and third party trades so that only the level of account transfers between
LBMA clearing members is reported.
From an article in January 1997 when the LBMA first published clearing data:
“traders insisted the association’s statistics were only part of the picture…Mr Jeffrey Rhodes, of Standard Bank,
London, said the 30m ounces should be multiplied by three, and possibly five, to give the full scope of the glob-
al market.”
In a letter to the European Commission from the LBMA’s Chief Executive, Stewart Murray, on 2 March 2007, he
stated that:
“Previous estimates of the daily volumes traded in the London market have suggested that the quantities are a
positive multiple of the clearing volumes with a multiplier of between 5 and 9.”
Let’s be conservative and use a multiple of 4, which means that the average daily amount of gold traded was
80.8m oz. or 2,600 tonnes since September 2012. On that basis, roughly 80% of the entire annual production of
the world’s gold mines is traded on an OTC basis each day.
In dollar terms, the average daily turnover in gold is about US$93.0bn – and that’s just OTC gold. It excludes ex-
changes such as COMEX, TOCOM (Tokyo), Singapore and Shanghai.
The daily average number of gold contracts (100oz. per contract) traded on the COMEX in New York recently has
been approximately 130,000. This is equivalent to a notional gold value of approximately US$15.0bn.
In aggregate, the average daily turnover in gold is well over US$100.0bn.
Most commentators underestimate the size of the gold market.
If we assume that sufficient financial firepower (including leverage) can be mustered to finance a large short posi-
tion in gold, the specific characteristics of the gold market can work to the advantage of this trade…at least over
the short/medium term.
Why?
Because the gold market, as currently structured, is a fractional reserve system, with a comparatively small
amount of bullion supporting a huge amount of speculative trading.

ADM Investor Services International Limited is authorised and regulated by The Financial Conduct Authority. Member of The London Stock Exchange. Registered office: 4th Floor Millennium Bridge House, 2 Lambeth Hill, London EC4V 3TT. Registered in England No. 2547805 a subsidiary of Archer Daniels Midland
Company. Risk Warning: Investments in Equities, CFDs, Futures, Options, Derivatives and Foreign Exchange can fluctuate in value, investors should therefore be aware that they may not realise the initial amount invested, and indeed may incur additional liabilities. These Investments may entail above average financial
risk of loss, and investors should therefore carefully consider whether their financial circumstances and investment experience permit them to invest and, if necessary, seek the advice of an independent Financial Advisor. Some services described are not available to certain customers due to regulatory constraints
either in the United Kingdom or elsewhere. © 2014 ADM Investor Services International Limited 2014.
Equity & Commodity Strategy - Fulcanelli Report Paul Mylchreest Email: [email protected] Tel: +44 20 7716 8257
As we’ve said before, one of the biggest misunderstandings in the history of finance is the mechanism of price
discovery in today’s gold and silver markets
The vast, and we really mean vast, majority of trading in the gold market is in what are nothing more than “paper
facsimiles” purporting to represent gold bullion, rather than actual gold bullion.
When we say “paper facsimiles”, we include things like:
Unallocated gold accounts on the LBMA;
Futures and options contracts on COMEX;
Unbacked ETFs; and
OTC derivatives.
This is a perversion of the investment case for gold and its true role in the financial system. This has been obvious
to forward-thinking people, like monetary scientist, Professor Antal Fekete, for more than four decades.
“The world’s first gold futures market opened in the Winnipeg Commodity Exchange in 1970... In 1971 I went
to Winnipeg to be witness to history. I purchased a seat on the exchange…Buy orders came in a steady stream
from all corners of the world. In the absence of gold futures this demand would have shown up as demand for
cash gold”
There is even a widespread belief among non-specialists that the LBMA is primarily a market for physical gold.
That is only true to a limited extent.
The reality is that less than 5% of gold traded on the LBMA is settled by the delivery of physical metal into what are known as “allocated” gold accounts. In an allocated gold account, specific gold bars are held in clients’ names with full title. The bank is not permitted to use the gold for its own purposes. Instead, more than 95% of gold traded on the LBMA is of “unallocated” gold, which is settled via nothing more than debits/credits in “metal accounts” with bullion banks. The holders of these accounts are merely unsecured creditors of the bank with general claims on an unspecified volume of gold in the bank’s vault. Any gold backing unallocated gold which is actually in the vault is part of the bank’s working capital, to do with it as it wishes. Give the most rudimentary understanding of the investment case for gold, this is another irony in the gold mar-
ket. Why would anybody trade unallocated gold on the long side when they are nothing more than the most jun-
ior of creditors in the banking system? Financial system risk is often one of the risks which gold investors are try-
ing to insure against.
In its January 2013 report “Report of the Working Group to Study the Issues Related to Gold Imports and Gold Loans by NBFCs”, the Reserve Bank of India estimated the ratio of paper gold trading to physical gold trading at 92:1. On page 58 of the RBI’s report is the following data sourced from the CPM Gold Yearbook 2011:

ADM Investor Services International Limited is authorised and regulated by The Financial Conduct Authority. Member of The London Stock Exchange. Registered office: 4th Floor Millennium Bridge House, 2 Lambeth Hill, London EC4V 3TT. Registered in England No. 2547805 a subsidiary of Archer Daniels Midland
Company. Risk Warning: Investments in Equities, CFDs, Futures, Options, Derivatives and Foreign Exchange can fluctuate in value, investors should therefore be aware that they may not realise the initial amount invested, and indeed may incur additional liabilities. These Investments may entail above average financial
risk of loss, and investors should therefore carefully consider whether their financial circumstances and investment experience permit them to invest and, if necessary, seek the advice of an independent Financial Advisor. Some services described are not available to certain customers due to regulatory constraints
either in the United Kingdom or elsewhere. © 2014 ADM Investor Services International Limited 2014.
Equity & Commodity Strategy - Fulcanelli Report Paul Mylchreest Email: [email protected] Tel: +44 20 7716 8257
According to the RBI (with our emphasis): “the traded amount of ‘paper linked to gold’ exceeds by far the actual supply of physical gold: the volume on the London Bullion Market Association (LBMA) OTC market and the major Futures and Options Exchanges was OVER 92 TIMES that of the underlying Physical Market.” Aside from futures trading on COMEX, there is very little real-time, or even close to real-time, data regarding po-sitioning in the gold market. In spite of that, when you look back at the gold bull market during 2001-11, one thing stands out very clearly re-garding the relationship between the gold price and the net positioning of the Commercials (primarily the bullion banks). On the three occasions when the Net Commercials stopped increasing their net short position into a rising mar-
ket, the gold price went parabolic.
Source: Bloomberg, ADM ISI

ADM Investor Services International Limited is authorised and regulated by The Financial Conduct Authority. Member of The London Stock Exchange. Registered office: 4th Floor Millennium Bridge House, 2 Lambeth Hill, London EC4V 3TT. Registered in England No. 2547805 a subsidiary of Archer Daniels Midland
Company. Risk Warning: Investments in Equities, CFDs, Futures, Options, Derivatives and Foreign Exchange can fluctuate in value, investors should therefore be aware that they may not realise the initial amount invested, and indeed may incur additional liabilities. These Investments may entail above average financial
risk of loss, and investors should therefore carefully consider whether their financial circumstances and investment experience permit them to invest and, if necessary, seek the advice of an independent Financial Advisor. Some services described are not available to certain customers due to regulatory constraints
either in the United Kingdom or elsewhere. © 2014 ADM Investor Services International Limited 2014.
Equity & Commodity Strategy - Fulcanelli Report Paul Mylchreest Email: [email protected] Tel: +44 20 7716 8257
Hopefully three things are now clear. The price discovery mechanism in the gold market is dominated by the trading of paper tokens which
are nothing more than gold in “facsimile” form; Given sufficient financial firepower, the trading of paper gold instruments can override underlying sup-
ply and demand trends for actual physical bullion, unless or until there is a limitation in the supply of paper gold OR a problem emerges in delivering sufficient physical bullion; and
In this scenario, vital price signals which could be provided by the gold market regarding financial mar-
ket risk, can be effectively hijacked and nullified.

ADM Investor Services International Limited is authorised and regulated by The Financial Conduct Authority. Member of The London Stock Exchange. Registered office: 4th Floor Millennium Bridge House, 2 Lambeth Hill, London EC4V 3TT. Registered in England No. 2547805 a subsidiary of Archer Daniels Midland
Company. Risk Warning: Investments in Equities, CFDs, Futures, Options, Derivatives and Foreign Exchange can fluctuate in value, investors should therefore be aware that they may not realise the initial amount invested, and indeed may incur additional liabilities. These Investments may entail above average financial
risk of loss, and investors should therefore carefully consider whether their financial circumstances and investment experience permit them to invest and, if necessary, seek the advice of an independent Financial Advisor. Some services described are not available to certain customers due to regulatory constraints
either in the United Kingdom or elsewhere. © 2014 ADM Investor Services International Limited 2014.
Equity & Commodity Strategy - Fulcanelli Report Paul Mylchreest Email: [email protected] Tel: +44 20 7716 8257
What is the long side of the long/short trade? If we are correct about gold being the short side of a large, leveraged long/short trade, the key question is what is on the long side of this trade? It was almost certainly a large, liquid market too. But which one? Here is the chart of Gold versus the Nikkei since September 2012. There is not much to see... Source: Bloomberg, ADM ISI
...until you invert the Nikkei axis and the remarkably close correlation becomes obvious. Source: Bloomberg, ADM ISI

ADM Investor Services International Limited is authorised and regulated by The Financial Conduct Authority. Member of The London Stock Exchange. Registered office: 4th Floor Millennium Bridge House, 2 Lambeth Hill, London EC4V 3TT. Registered in England No. 2547805 a subsidiary of Archer Daniels Midland
Company. Risk Warning: Investments in Equities, CFDs, Futures, Options, Derivatives and Foreign Exchange can fluctuate in value, investors should therefore be aware that they may not realise the initial amount invested, and indeed may incur additional liabilities. These Investments may entail above average financial
risk of loss, and investors should therefore carefully consider whether their financial circumstances and investment experience permit them to invest and, if necessary, seek the advice of an independent Financial Advisor. Some services described are not available to certain customers due to regulatory constraints
either in the United Kingdom or elsewhere. © 2014 ADM Investor Services International Limited 2014.
Equity & Commodity Strategy - Fulcanelli Report Paul Mylchreest Email: [email protected] Tel: +44 20 7716 8257
We doubt that this is merely coincidence. Here is the same chart for the prior year, i.e. from September 2011 to August 2012. As you can see, there is no sign of correlation. Source: Bloomberg, ADM ISI
Here is the same chart for Gold versus the Nikkei (Inverted) from the beginning of the current gold bull market in 2001 to August 2012. Source: Bloomberg, ADM ISI
ADM Investor Services International Limited is authorised and regulated by The Financial Conduct Authority. Member of The London Stock Exchange. Registered office: 4th Floor Millennium Bridge House, 2 Lambeth Hill, London EC4V 3TT. Registered in England No. 2547805 a subsidiary of Archer Daniels Midland
Company. Risk Warning: Investments in Equities, CFDs, Futures, Options, Derivatives and Foreign Exchange can fluctuate in value, investors should therefore be aware that they may not realise the initial amount invested, and indeed may incur additional liabilities. These Investments may entail above average financial
risk of loss, and investors should therefore carefully consider whether their financial circumstances and investment experience permit them to invest and, if necessary, seek the advice of an independent Financial Advisor. Some services described are not available to certain customers due to regulatory constraints
either in the United Kingdom or elsewhere. © 2014 ADM Investor Services International Limited 2014.
Equity & Commodity Strategy - Fulcanelli Report Paul Mylchreest Email: [email protected] Tel: +44 20 7716 8257
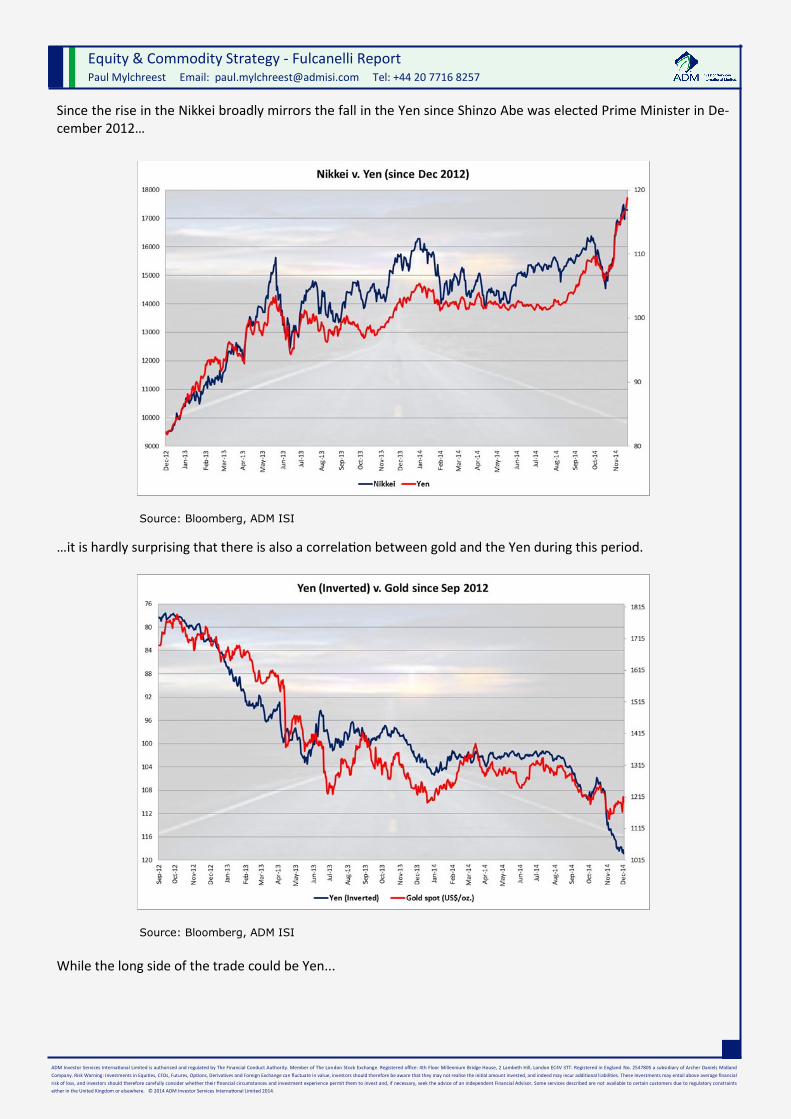
Since the rise in the Nikkei broadly mirrors the fall in the Yen since Shinzo Abe was elected Prime Minister in De-cember 2012… Source: Bloomberg, ADM ISI
…it is hardly surprising that there is also a correlation between gold and the Yen during this period. Source: Bloomberg, ADM ISI While the long side of the trade could be Yen...

ADM Investor Services International Limited is authorised and regulated by The Financial Conduct Authority. Member of The London Stock Exchange. Registered office: 4th Floor Millennium Bridge House, 2 Lambeth Hill, London EC4V 3TT. Registered in England No. 2547805 a subsidiary of Archer Daniels Midland
Company. Risk Warning: Investments in Equities, CFDs, Futures, Options, Derivatives and Foreign Exchange can fluctuate in value, investors should therefore be aware that they may not realise the initial amount invested, and indeed may incur additional liabilities. These Investments may entail above average financial
risk of loss, and investors should therefore carefully consider whether their financial circumstances and investment experience permit them to invest and, if necessary, seek the advice of an independent Financial Advisor. Some services described are not available to certain customers due to regulatory constraints
either in the United Kingdom or elsewhere. © 2014 ADM Investor Services International Limited 2014.
Equity & Commodity Strategy - Fulcanelli Report Paul Mylchreest Email: [email protected] Tel: +44 20 7716 8257
…we think that it is more likely to be the Nikkei where the correlation is arguably superior – shown again for comparison. Source: Bloomberg, ADM ISI
BoJ meetings - tying together the two sides of the trade When we looked back and examined major moves in the Nikkei index and the gold price since September 2012, we found that most of them were closely tied to BoJ monetary policy meetings, especially announcements of increased monetary stimulus. While gold had peaked and the Nikkei bottomed within a few days of each other in early October 2012, the long/short Nikkei versus gold trade really “got going” after Shinzo Abe’s government took office in December 2012. The first major move from the BoJ, bowing to pressure from the new political leadership, was announced with the unusual step of a joint BoJ/Japanese government statement on 22 January 2013. The BoJ doubled its inflation target to 2% “at the earliest possible time” and committed to an open-ended pro-gramme of asset purchases beginning in 2014, which would follow the completion of its existing programme.

ADM Investor Services International Limited is authorised and regulated by The Financial Conduct Authority. Member of The London Stock Exchange. Registered office: 4th Floor Millennium Bridge House, 2 Lambeth Hill, London EC4V 3TT. Registered in England No. 2547805 a subsidiary of Archer Daniels Midland
Company. Risk Warning: Investments in Equities, CFDs, Futures, Options, Derivatives and Foreign Exchange can fluctuate in value, investors should therefore be aware that they may not realise the initial amount invested, and indeed may incur additional liabilities. These Investments may entail above average financial
risk of loss, and investors should therefore carefully consider whether their financial circumstances and investment experience permit them to invest and, if necessary, seek the advice of an independent Financial Advisor. Some services described are not available to certain customers due to regulatory constraints
either in the United Kingdom or elsewhere. © 2014 ADM Investor Services International Limited 2014.
Equity & Commodity Strategy - Fulcanelli Report Paul Mylchreest Email: [email protected] Tel: +44 20 7716 8257
Not surprisingly, the Nikkei responded positively to the BoJ’s announcement. Source: Bloomberg, ADM ISI
The 22 January 2013 BoJ/government announcement marked the peak in the gold price to the day. After that, it fell by US$121.7/oz. during the next six weeks. Source: Bloomberg, ADM ISI
But the “shock and awe” from the BoJ was still to come. The next major “enhancement” to Abenomics in terms of monetary policy was unleashed with the BoJ’s 4 April 2014 policy meeting.

ADM Investor Services International Limited is authorised and regulated by The Financial Conduct Authority. Member of The London Stock Exchange. Registered office: 4th Floor Millennium Bridge House, 2 Lambeth Hill, London EC4V 3TT. Registered in England No. 2547805 a subsidiary of Archer Daniels Midland
Company. Risk Warning: Investments in Equities, CFDs, Futures, Options, Derivatives and Foreign Exchange can fluctuate in value, investors should therefore be aware that they may not realise the initial amount invested, and indeed may incur additional liabilities. These Investments may entail above average financial
risk of loss, and investors should therefore carefully consider whether their financial circumstances and investment experience permit them to invest and, if necessary, seek the advice of an independent Financial Advisor. Some services described are not available to certain customers due to regulatory constraints
either in the United Kingdom or elsewhere. © 2014 ADM Investor Services International Limited 2014.
Equity & Commodity Strategy - Fulcanelli Report Paul Mylchreest Email: [email protected] Tel: +44 20 7716 8257
This was a bigger one. The BoJ’s new plan was for asset purchases at an annual rate of Yen 60-70 trillion which aimed to DOUBLE THE MONETARY BASE in two years from the end-2012 level of Yen 138 trillion, to Yen 200 trillion by end-2013 and Yen 270 trillion by end-2014. The same day Reuters commented.
“The Bank of Japan unleashed the world's most intense burst of monetary stimulus on Thursday, promising to
inject about $1.4 trillion into the economy in less than two years, a radical gamble that sent the yen reeling
and bond yields to record lows. New Governor Haruhiko Kuroda committed the BOJ to open-ended asset buy-
ing and said the monetary base would nearly double to 270 trillion yen ($2.9 trillion) by the end of 2014, a
dose of shock therapy officials hope will end two decades of stagnation. The policy was viewed as a radical
gamble to boost growth and lift inflation expectations and is unmatched in scope even by the U.S. Federal Re-
serve's own quantitative easing program.”
The BoJ’s more aggressive easing saw the Nikkei surge by more than 3,000 points, or a massive 23.7%, in only
seven weeks between 4 April 2013 and 22 May 2013.
Source: Bloomberg, ADM ISI
The “shock and awe” from the BoJ was quickly seen in the gold market…except in reverse.

ADM Investor Services International Limited is authorised and regulated by The Financial Conduct Authority. Member of The London Stock Exchange. Registered office: 4th Floor Millennium Bridge House, 2 Lambeth Hill, London EC4V 3TT. Registered in England No. 2547805 a subsidiary of Archer Daniels Midland
Company. Risk Warning: Investments in Equities, CFDs, Futures, Options, Derivatives and Foreign Exchange can fluctuate in value, investors should therefore be aware that they may not realise the initial amount invested, and indeed may incur additional liabilities. These Investments may entail above average financial
risk of loss, and investors should therefore carefully consider whether their financial circumstances and investment experience permit them to invest and, if necessary, seek the advice of an independent Financial Advisor. Some services described are not available to certain customers due to regulatory constraints
either in the United Kingdom or elsewhere. © 2014 ADM Investor Services International Limited 2014.
Equity & Commodity Strategy - Fulcanelli Report Paul Mylchreest Email: [email protected] Tel: +44 20 7716 8257
The huge upward move in the Nikkei was the mirror image of the collapse in the gold price which began shortly
afterwards.
Source: Bloomberg, ADM ISI
The vast majority of gold’s collapse took place in what is now viewed as an infamous two-day trading period in
the gold market – Friday 12 April 2013 and Monday 15 April 2013 – during which the price fell more than 12%.
This was how Ross Norman at the 230-year old bullion broking firm, Sharps Pixley, described events on the Fri-
day.
“The gold futures markets opened in New York on Friday 12th April to a monumental 3.4 million ounces (100
tonnes) of gold selling of the June futures contract in what proved to be only an opening shot. The selling took
gold to the technically very important level of $1540 which was not only the low of 2012, it was also seen by
many as the level which confirmed the ongoing bull run which dates back to 2000. In many traders’ minds it
stood as a formidable support level... the line in the sand.
“Two hours later the initial selling…(was followed) by a rather more significant blast when the floor was hit by
a further 10 million ounces of selling (300 tonnes) over the following 30 minutes of trading. This was clearly
not a case of disappointed longs leaving the market - it had the hallmarks of a concerted 'short sale', which by
driving prices sharply lower in a display of 'shock & awe' - would seek to gain further momentum by
prompting others to also sell their positions as they hit their maximum acceptable losses…The selling was
timed for optimal impact with New York at its most liquid, while key overseas gold markets including London
were open and able to feel the impact. The estimated 400 tonnes of gold futures selling in total equates to
15% of annual gold mine production - too much for the market to readily absorb
“Futures trading is performed on a margined basis - that is to say you have to stump up about 5% of the actual
cost of the gold itself; making futures trades a highly geared 'opportunity' of about 20:1 - easy profit and also
loss! Futures trading is not a product for widows and orphans. The CME's 10% reduction in the required gold
margins in November 2012 from $9133/contract to just $7425/contract made the market more accessible to
those wishing both to go long or, as it transpired, to go short…”

ADM Investor Services International Limited is authorised and regulated by The Financial Conduct Authority. Member of The London Stock Exchange. Registered office: 4th Floor Millennium Bridge House, 2 Lambeth Hill, London EC4V 3TT. Registered in England No. 2547805 a subsidiary of Archer Daniels Midland
Company. Risk Warning: Investments in Equities, CFDs, Futures, Options, Derivatives and Foreign Exchange can fluctuate in value, investors should therefore be aware that they may not realise the initial amount invested, and indeed may incur additional liabilities. These Investments may entail above average financial
risk of loss, and investors should therefore carefully consider whether their financial circumstances and investment experience permit them to invest and, if necessary, seek the advice of an independent Financial Advisor. Some services described are not available to certain customers due to regulatory constraints
either in the United Kingdom or elsewhere. © 2014 ADM Investor Services International Limited 2014.
Equity & Commodity Strategy - Fulcanelli Report Paul Mylchreest Email: [email protected] Tel: +44 20 7716 8257
We hope that you noted that the selling was specifically gold futures contracts, not physical gold.
Here is an intra-day chart showing the “one-two” hit to the gold price on 12 April 2013.
Source: Sharps Pixley
And let’s remind ourselves that the financial system wasn’t exactly falling apart in April 2013, so if you happened
to have 400 tonnes of gold, even paper rather than “actual” gold, which at the time was worth $20.0bn, you’d
have to be insane to sell it in such fashion.
Unless…
…you were acting for a central bank (lacking the profit motive), OR your aim was to cause the maximum down-
ward pressure on the price because, let’s speculate for a moment…
...it was the short side of a long/short trade?
In such a scenario, events in the gold market start making sense.
Despite its ferocity, another interesting aspect of the collapse in the gold price in mid-April 2013 was that it con-
tradicted free market signals of tightness in physical gold supply at the time.
This was clear from the GOFO rate. GOFO is the Gold Forward Offered Rate on the LBMA and is the cost, in
terms of the interest rate, of borrowing dollars using gold as collateral. GOFO moving close to zero implies that
the market has a greater need to borrow physical gold, i.e. to swap it for dollars.
GOFO had been on a declining trend since the gold price peaked on 4 October 2012, suggesting that investors
(whether official, institutional or retail) had been taking advantage of the falling price to accumulate physical
gold.

ADM Investor Services International Limited is authorised and regulated by The Financial Conduct Authority. Member of The London Stock Exchange. Registered office: 4th Floor Millennium Bridge House, 2 Lambeth Hill, London EC4V 3TT. Registered in England No. 2547805 a subsidiary of Archer Daniels Midland
Company. Risk Warning: Investments in Equities, CFDs, Futures, Options, Derivatives and Foreign Exchange can fluctuate in value, investors should therefore be aware that they may not realise the initial amount invested, and indeed may incur additional liabilities. These Investments may entail above average financial
risk of loss, and investors should therefore carefully consider whether their financial circumstances and investment experience permit them to invest and, if necessary, seek the advice of an independent Financial Advisor. Some services described are not available to certain customers due to regulatory constraints
either in the United Kingdom or elsewhere. © 2014 ADM Investor Services International Limited 2014.
Equity & Commodity Strategy - Fulcanelli Report Paul Mylchreest Email: [email protected] Tel: +44 20 7716 8257
By the time the gold price collapsed on 12 April 2013, the GOFO rate had fallen to only 17 basis points and
briefly went negative the following month.
Source: Bloomberg, ADM ISI
GOFO should not go negative in an efficiently functioning gold market with adequate physical supply. Negative
GOFO implied that the market was so short of physical that it would pay an interest rate to holders of bullion to
borrow their gold (who could also put their swapped dollars on deposit).
The futures market was telling a similar story via the “gold basis.” The gold basis is the difference between the
spot price of gold and its price in the near-month futures contract. The gold market should never move into
backwardation (negative basis), i.e. where the offer price of the near-month future is lower than the bid price of
spot gold, since it implies a risk-free profit. That is, unless the market is concerned about the availability of physi-
cal gold when the futures contract expires.
Sandeep Jaitly and his mentor, Professor Antal Fekete, are the world experts on the gold basis. Below is a chart
from Sandeep Jaitly’s Gold Basis Service on 1 May 2013.

ADM Investor Services International Limited is authorised and regulated by The Financial Conduct Authority. Member of The London Stock Exchange. Registered office: 4th Floor Millennium Bridge House, 2 Lambeth Hill, London EC4V 3TT. Registered in England No. 2547805 a subsidiary of Archer Daniels Midland
Company. Risk Warning: Investments in Equities, CFDs, Futures, Options, Derivatives and Foreign Exchange can fluctuate in value, investors should therefore be aware that they may not realise the initial amount invested, and indeed may incur additional liabilities. These Investments may entail above average financial
risk of loss, and investors should therefore carefully consider whether their financial circumstances and investment experience permit them to invest and, if necessary, seek the advice of an independent Financial Advisor. Some services described are not available to certain customers due to regulatory constraints
either in the United Kingdom or elsewhere. © 2014 ADM Investor Services International Limited 2014.
Equity & Commodity Strategy - Fulcanelli Report Paul Mylchreest Email: [email protected] Tel: +44 20 7716 8257
Source: Sandeep Jaitly
The gold basis (blue line) crossed into negative territory on 5 April 2013 and the backwardation was intensifying
until the price was smashed (light green arrow). As the price fell, gold almost moved out of backwardation be-
fore the latter intensified – essentially telling the same story of tight supply as GOFO.
We’ll return to physical gold supply and demand again below.
After surging from early-April to late-May 2013, the Nikkei experienced a sharp correction from 21 May 2013
through to mid-June 2013. This correction stemmed from the Bernanke “taper tantrum” as it became known,
which hit equity markets around the world.
The correction was short-lived. The bottom in the Nikkei at 12,445 occurred on 13 June 2013, which was two
days after the BoJ’s Monetary Policy Meeting (and eleven days before the bottom in the S&P 500). In little more
than a month, the Nikkei recovered more than 2,000 points to 14,809 on 18 July 2013.
Source: Bloomberg, ADM ISI
ADM Investor Services International Limited is authorised and regulated by The Financial Conduct Authority. Member of The London Stock Exchange. Registered office: 4th Floor Millennium Bridge House, 2 Lambeth Hill, London EC4V 3TT. Registered in England No. 2547805 a subsidiary of Archer Daniels Midland
Company. Risk Warning: Investments in Equities, CFDs, Futures, Options, Derivatives and Foreign Exchange can fluctuate in value, investors should therefore be aware that they may not realise the initial amount invested, and indeed may incur additional liabilities. These Investments may entail above average financial
risk of loss, and investors should therefore carefully consider whether their financial circumstances and investment experience permit them to invest and, if necessary, seek the advice of an independent Financial Advisor. Some services described are not available to certain customers due to regulatory constraints
either in the United Kingdom or elsewhere. © 2014 ADM Investor Services International Limited 2014.
Equity & Commodity Strategy - Fulcanelli Report Paul Mylchreest Email: [email protected] Tel: +44 20 7716 8257
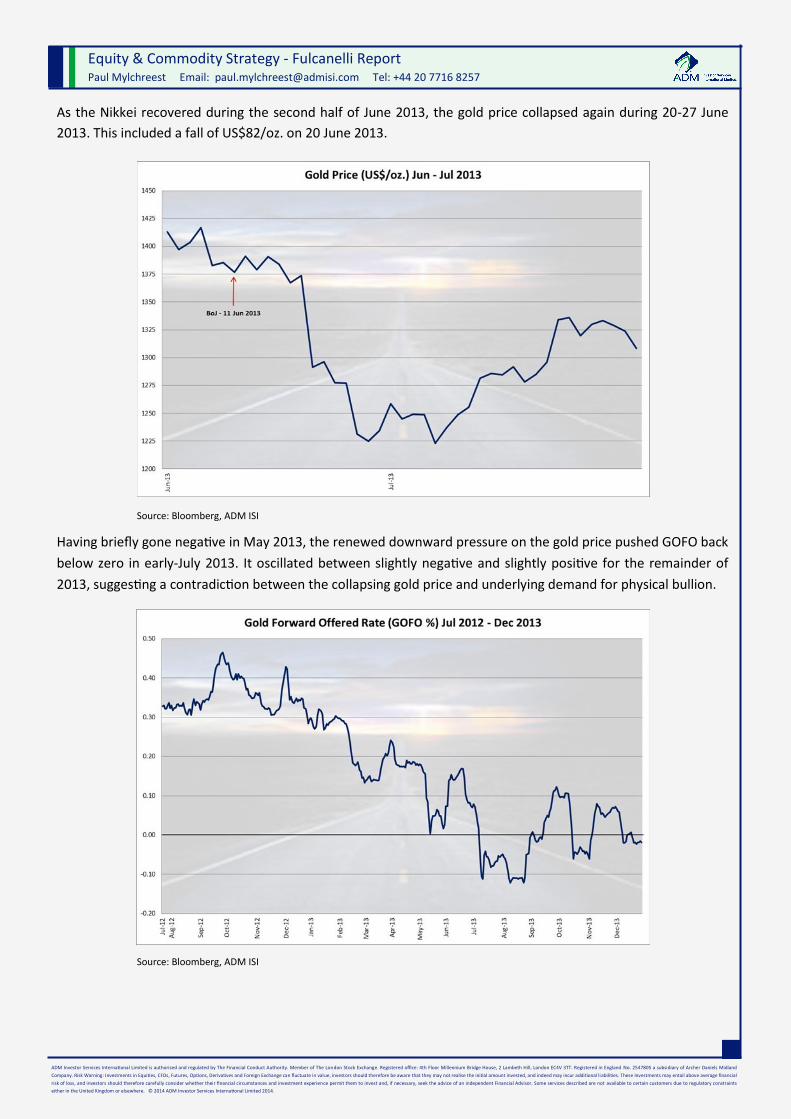
As the Nikkei recovered during the second half of June 2013, the gold price collapsed again during 20-27 June
2013. This included a fall of US$82/oz. on 20 June 2013.
Source: Bloomberg, ADM ISI
Having briefly gone negative in May 2013, the renewed downward pressure on the gold price pushed GOFO back
below zero in early-July 2013. It oscillated between slightly negative and slightly positive for the remainder of
2013, suggesting a contradiction between the collapsing gold price and underlying demand for physical bullion.
Source: Bloomberg, ADM ISI

ADM Investor Services International Limited is authorised and regulated by The Financial Conduct Authority. Member of The London Stock Exchange. Registered office: 4th Floor Millennium Bridge House, 2 Lambeth Hill, London EC4V 3TT. Registered in England No. 2547805 a subsidiary of Archer Daniels Midland
Company. Risk Warning: Investments in Equities, CFDs, Futures, Options, Derivatives and Foreign Exchange can fluctuate in value, investors should therefore be aware that they may not realise the initial amount invested, and indeed may incur additional liabilities. These Investments may entail above average financial
risk of loss, and investors should therefore carefully consider whether their financial circumstances and investment experience permit them to invest and, if necessary, seek the advice of an independent Financial Advisor. Some services described are not available to certain customers due to regulatory constraints
either in the United Kingdom or elsewhere. © 2014 ADM Investor Services International Limited 2014.
Equity & Commodity Strategy - Fulcanelli Report Paul Mylchreest Email: [email protected] Tel: +44 20 7716 8257
The same contradiction was evident in COMEX gold inventories which declined by almost 40% during January-
July 2013.
Source: Bloomberg, ADM ISI
Having traded sideways through August 2013, the Nikkei began its next ascent in early September, which lasted
through to the end of the year.
While maintaining its stimulus programme at the Monetary Policy Meeting on 5 September 2013, the BoJ up-
graded its view on the Japanese economy, stating that it was “recovering moderately.” Here is the Nikkei chart
from September-December 2013.
Source: Bloomberg, ADM ISI

ADM Investor Services International Limited is authorised and regulated by The Financial Conduct Authority. Member of The London Stock Exchange. Registered office: 4th Floor Millennium Bridge House, 2 Lambeth Hill, London EC4V 3TT. Registered in England No. 2547805 a subsidiary of Archer Daniels Midland
Company. Risk Warning: Investments in Equities, CFDs, Futures, Options, Derivatives and Foreign Exchange can fluctuate in value, investors should therefore be aware that they may not realise the initial amount invested, and indeed may incur additional liabilities. These Investments may entail above average financial
risk of loss, and investors should therefore carefully consider whether their financial circumstances and investment experience permit them to invest and, if necessary, seek the advice of an independent Financial Advisor. Some services described are not available to certain customers due to regulatory constraints
either in the United Kingdom or elsewhere. © 2014 ADM Investor Services International Limited 2014.
Equity & Commodity Strategy - Fulcanelli Report Paul Mylchreest Email: [email protected] Tel: +44 20 7716 8257
The BoJ maintained asset purchases at an annual rate of Yen 60-70 trillion on 31 October 2013, but upgraded
their forecast for 2013 inflation from 0.6% to 0.7%. However, at least two of the nine Policy Board members
were known to have expressed doubt as to whether the BoJ could meet its inflation target of 2% by 2015. This
led to market participants anticipating a further loosening of monetary policy in early 2014.
The prospect of more aggressive BoJ policy marked renewed heavy selling in the gold market. Here is the corre-
sponding chart of the gold price for September-December 2013. The price made an intra-day low of US$1182/oz.
in December 2013.
Source: Bloomberg, ADM ISI
On 18 February 2014, the BoJ maintained its annual rate of asset purchases at Yen 60-70 trillion but doubled the
scale of measures to stimulate bank lending, measures which had been due to expire. For example, financial in-
stiuations were permitted to borrow funds up to an amount equivalent to twice as much as the increase in their
net lending. After this there was no change to policy during the March, April and May 2014 meetings.
The Nikkei traded downwards/flat during January to mid-May 2014. This was a relatively good period for gold.
The gold price recovered from c.US$1,200/oz. at the beginning of the year and came close to testing US$1,400/
oz. in March 2014, before easing back to the US$1,300/oz. level.
After bottoming on 19 May 2014, the Nikkei embarked on a major upward move from 14,006 to an intermediate
top of 16,374 on 25 September 2014. This was in tandem with many other equity markets, notably the S&P 500.
The 19 May 2014 was the day before the two-day BoJ Monetary Policy Meeting on 20-21 May 2015.

ADM Investor Services International Limited is authorised and regulated by The Financial Conduct Authority. Member of The London Stock Exchange. Registered office: 4th Floor Millennium Bridge House, 2 Lambeth Hill, London EC4V 3TT. Registered in England No. 2547805 a subsidiary of Archer Daniels Midland
Company. Risk Warning: Investments in Equities, CFDs, Futures, Options, Derivatives and Foreign Exchange can fluctuate in value, investors should therefore be aware that they may not realise the initial amount invested, and indeed may incur additional liabilities. These Investments may entail above average financial
risk of loss, and investors should therefore carefully consider whether their financial circumstances and investment experience permit them to invest and, if necessary, seek the advice of an independent Financial Advisor. Some services described are not available to certain customers due to regulatory constraints
either in the United Kingdom or elsewhere. © 2014 ADM Investor Services International Limited 2014.
Equity & Commodity Strategy - Fulcanelli Report Paul Mylchreest Email: [email protected] Tel: +44 20 7716 8257
Source: Bloomberg, ADM ISI
On 20 May 2014, Zero Hedge had an intriguing report which connected an attack on gold with a movement in
Japanese asset prices.
“An initial dump in gold happened when Europe was getting going late last night but as the US wakes up and
markets get active, someone (panic-seller) decided it was an entirely optimal time to sell $520 million notional
gold futures - sending the price of the precious metal down $7. Intriguingly, though the notional size was
large, the actual move is not as large as we have become used to with the ubiquitous slamdowns (and it's a
Tuesday). At the same time, USDJPY was ramped...”
Source: Zero Hedge

ADM Investor Services International Limited is authorised and regulated by The Financial Conduct Authority. Member of The London Stock Exchange. Registered office: 4th Floor Millennium Bridge House, 2 Lambeth Hill, London EC4V 3TT. Registered in England No. 2547805 a subsidiary of Archer Daniels Midland
Company. Risk Warning: Investments in Equities, CFDs, Futures, Options, Derivatives and Foreign Exchange can fluctuate in value, investors should therefore be aware that they may not realise the initial amount invested, and indeed may incur additional liabilities. These Investments may entail above average financial
risk of loss, and investors should therefore carefully consider whether their financial circumstances and investment experience permit them to invest and, if necessary, seek the advice of an independent Financial Advisor. Some services described are not available to certain customers due to regulatory constraints
either in the United Kingdom or elsewhere. © 2014 ADM Investor Services International Limited 2014.
Equity & Commodity Strategy - Fulcanelli Report Paul Mylchreest Email: [email protected] Tel: +44 20 7716 8257
That relatively modest attack on gold intensified towards the end of May 2014 as the upward move in the Nikkei
accelerated.
As we moved through June/early-July 2014, the Nikkei continued to rise. Meanwhile, the gold price was threat-
ening to break out of the Long Nikkei/Short Gold stranglehold. It rebounded from US$1,244/oz. in early June
2014 to an intermediate high of US$1,339/oz. on 11 July 2014.
Then bang…
Source: Bloomberg, ADM ISI
The peak in the gold price on 11 July 2014 was a Friday. Gold was attacked on the following Monday the 14 July
2014, which (coincidentally) was the first day of the BoJ’s two-day July Monetary Policy Meeting.
Zero Hedge described events in the gold market on 14 July 2014 in an article “Gold Slumps Most in 2014 As
‘Someone’ Dumps $1.37 Billion In Futures At US Open.”
“UPDATE: Gold is down 2.5% - the biggest daily drop since early Dec 2013. In a status-quo reinforcing smack-
down, gold and silver prices have been clubbed lower this morning to one-month lows with the biggest drop
in almost 2 months. The customary USDJPY surge (and risk asset spike) has accompanied this high volume
dump”

ADM Investor Services International Limited is authorised and regulated by The Financial Conduct Authority. Member of The London Stock Exchange. Registered office: 4th Floor Millennium Bridge House, 2 Lambeth Hill, London EC4V 3TT. Registered in England No. 2547805 a subsidiary of Archer Daniels Midland
Company. Risk Warning: Investments in Equities, CFDs, Futures, Options, Derivatives and Foreign Exchange can fluctuate in value, investors should therefore be aware that they may not realise the initial amount invested, and indeed may incur additional liabilities. These Investments may entail above average financial
risk of loss, and investors should therefore carefully consider whether their financial circumstances and investment experience permit them to invest and, if necessary, seek the advice of an independent Financial Advisor. Some services described are not available to certain customers due to regulatory constraints
either in the United Kingdom or elsewhere. © 2014 ADM Investor Services International Limited 2014.
Equity & Commodity Strategy - Fulcanelli Report Paul Mylchreest Email: [email protected] Tel: +44 20 7716 8257
The Zero Hedge chart showed how the selling began at the market open in Europe.
Source: Zero Hedge
Another “one-two” hit.
Moving into August 2014 and there was no change to BoJ policy at its meeting which ended on 8 August 2014. If
you refer back to the charts above, you will notice that this coincided precisely with an intermediate low in the
Nikkei and was only two days before another intermediate high in gold
There was no change to BoJ policy at its meeting which ended on 4 September 2014. Meanwhile, the Nikkei con-
tinued rising while the gold price proceeded to fall US$51/oz. in 11 trading days.
Now…moving (almost) up to date.
After another “no change” meeting in early-October, the BoJ went “nuclear” on 31 October 2014 when it an-
nounced the “Expansion of the Quantitative and Qualitative Monetary Easing.”
In brief, the BoJ committed to increasing its annual rate of asset purchases by an additional Yen 10-20 trillion
from Yen 60-70 trillion to Yen 80 trillion (US$724bn).
Besides the weakness in the economy and slippage versus the 2% inflation target, there also seems to have been
a need to coordinate increased QE with the GPIF (government pension fund) rebalancing its asset allocation. Ku-
roda denied the link, but some of the numbers are almost perfectly aligned. Taking its end-June 2014 asset allo-
cation, GPIF was already down to 55.4% JGBs so the additional sell-off in domestic bonds to cut the allocation to
35% is approximately Yen 28trn.
This dovetailed neatly with the increased JGB purchases by the BoJ.
“The Bank will purchase JGBs so that their amount outstanding will increase at an annual pace of about 80 tril-
lion yen (an addition of about 30 trillion yen compared with the past).”

ADM Investor Services International Limited is authorised and regulated by The Financial Conduct Authority. Member of The London Stock Exchange. Registered office: 4th Floor Millennium Bridge House, 2 Lambeth Hill, London EC4V 3TT. Registered in England No. 2547805 a subsidiary of Archer Daniels Midland
Company. Risk Warning: Investments in Equities, CFDs, Futures, Options, Derivatives and Foreign Exchange can fluctuate in value, investors should therefore be aware that they may not realise the initial amount invested, and indeed may incur additional liabilities. These Investments may entail above average financial
risk of loss, and investors should therefore carefully consider whether their financial circumstances and investment experience permit them to invest and, if necessary, seek the advice of an independent Financial Advisor. Some services described are not available to certain customers due to regulatory constraints
either in the United Kingdom or elsewhere. © 2014 ADM Investor Services International Limited 2014.
Equity & Commodity Strategy - Fulcanelli Report Paul Mylchreest Email: [email protected] Tel: +44 20 7716 8257
The JGB market, parts of which have not even traded on some days, no longer functions as a true market. So one
has to ask what would have happened if the GPIF had sold Yen 28 trillion into an illiquid market…and raised bor-
rowing costs in one of the world’s most indebted countries?
Instead, the BoJ is ready and waiting with an enlarged bid and the relationship between the Japanese MoF, the
BoJ and now the GPIF is, to borrow the description from our colleague, Andy Ash.
“…akin to swapping soccer stickers in the playground.”
The BoJ’s latest move is a major step towards liquefying Japanese financial markets, and effectively much of the
economy, since purchases of equity and real estate ETFs are also being ramped up.
Before we consider the desperation of this move on the part of the BoJ, including Abe’s decision to postpone the
second sales tax increase and call a general election, let’s look at its impact on the Long/Short Nikkei versus Gold
trade.
Firstly, the Nikkei.
Source: Bloomberg, ADM ISI
It seems that some traders might have got wind of the likelihood of more aggressive policy before the 31 Octo-
ber 2014 meeting. James Aitken of Aitken Advisors is someone we admire in terms of his deep knowledge of
credit markets and central bank policy. Writing on 4 November 2014, he explained that Japanese insiders had
been hinting to market participants that the end-October policy meeting could be “live.” So it turned out.
Speculation had also been growing in the Japanese media, e.g. this from Nikkei on 23 October 2014.
“The Bank of Japan now sees a much bigger possibility of inflation slipping below 1%, pushed down by falling
crude oil prices, according to people familiar with the central bank’s thinking, a development that could rekin-
dle market speculation for additional easing. “

ADM Investor Services International Limited is authorised and regulated by The Financial Conduct Authority. Member of The London Stock Exchange. Registered office: 4th Floor Millennium Bridge House, 2 Lambeth Hill, London EC4V 3TT. Registered in England No. 2547805 a subsidiary of Archer Daniels Midland
Company. Risk Warning: Investments in Equities, CFDs, Futures, Options, Derivatives and Foreign Exchange can fluctuate in value, investors should therefore be aware that they may not realise the initial amount invested, and indeed may incur additional liabilities. These Investments may entail above average financial
risk of loss, and investors should therefore carefully consider whether their financial circumstances and investment experience permit them to invest and, if necessary, seek the advice of an independent Financial Advisor. Some services described are not available to certain customers due to regulatory constraints
either in the United Kingdom or elsewhere. © 2014 ADM Investor Services International Limited 2014.
Equity & Commodity Strategy - Fulcanelli Report Paul Mylchreest Email: [email protected] Tel: +44 20 7716 8257
The gold price had peaked on 21 October 2014 and started to fall sharply on 30 October 2014 during Asian hours
(29 October 2014 in London/NY terms).
The price collapsed during the next two days…
Source: Bloomberg, ADM ISI
…taking it through the critical technical level of US$1,180/oz. which was the low in 2013.
This latest attack on gold, coordinated with aggressive BoJ stimulus and a surging Nikkei (again), lasted five days
as Zero Hedge highlighted in an article “Because Nothing Says ‘Best Execution’ Like Dumping $1.5 Billion In Gold
Futures At 0030ET.”
“For the 5th day in a row, "someone" has decided that 0030ET would be an appropriate time (assuming the
'seller' is an investor who prefers best execution rather than the standard non-economically-rational share-
repurchaser in America) to be dumping large amounts of precious metals positions via the futures market. To-
night, with over 13,000 contracts being flushed through Gold - amounting to over $1.5 billion notional, gold
prices tumbled $20 to $1151 (its lowest level since April 2010).”

ADM Investor Services International Limited is authorised and regulated by The Financial Conduct Authority. Member of The London Stock Exchange. Registered office: 4th Floor Millennium Bridge House, 2 Lambeth Hill, London EC4V 3TT. Registered in England No. 2547805 a subsidiary of Archer Daniels Midland
Company. Risk Warning: Investments in Equities, CFDs, Futures, Options, Derivatives and Foreign Exchange can fluctuate in value, investors should therefore be aware that they may not realise the initial amount invested, and indeed may incur additional liabilities. These Investments may entail above average financial
risk of loss, and investors should therefore carefully consider whether their financial circumstances and investment experience permit them to invest and, if necessary, seek the advice of an independent Financial Advisor. Some services described are not available to certain customers due to regulatory constraints
either in the United Kingdom or elsewhere. © 2014 ADM Investor Services International Limited 2014.
Equity & Commodity Strategy - Fulcanelli Report Paul Mylchreest Email: [email protected] Tel: +44 20 7716 8257
The chart says it all.
Source: Zero Hedge
The suspicious trading activity was noticed by Reuters who commented on 20 November 2014.
“Some of the biggest price moves in gold since late October have, unusually, occurred in Asian hours and trad-ers more accustomed to following the lead of their Western counterparts suspect a big increase in algorithmic trading may be to blame. Sensitivity to the dollar-yen exchange rate may also help explain the moves, although some traders speculated that the timing looked suspiciously like attempts to catch Chinese traders off-guard during their lunch break. Liquidity in Asia tends to be thin until Europe wakes up but recent weeks have been different: COMEX gold futures, the busiest gold contract in the world, have suffered sharp sell-offs in Asia, sometimes sparked by the news flow or currency moves but often for no identifiable reason. ‘It is unusual for Asia to be seeing these busy trading sessions,’ said David Govett, head of precious metals at broker Marex Spectron in London. ‘I have spoken to a lot of people about it and the general consensus seems to be that there is a big increase in algorithmic and high-frequency trading in this time zone nowadays as it can be quite easy to push about,’ he said.” It’s not our intention to publish a detailed critique on Abenomics in this report. However, the evidence that it’s not working was brought into sharper focus with the 3Q 2014 GDP decline of 1.6%. This followed the 7.3% reduc-tion the previous quarter and confirmed that the economy had returned to technical recession. Desperation on the part of Abe is behind his decision to delay the rise in the sales tax and his calling of a snap general election. Common sense suggests that the last thing that a society with an ageing demographic needs is the Abenomics
prescription of zero interest rates coupled with rising inflation. Nonetheless, if we exclude the April 2014 tax hike,
Japan’s core CPI is moving in the “wrong” direction, 1.0% versus the 2.0% target.

ADM Investor Services International Limited is authorised and regulated by The Financial Conduct Authority. Member of The London Stock Exchange. Registered office: 4th Floor Millennium Bridge House, 2 Lambeth Hill, London EC4V 3TT. Registered in England No. 2547805 a subsidiary of Archer Daniels Midland
Company. Risk Warning: Investments in Equities, CFDs, Futures, Options, Derivatives and Foreign Exchange can fluctuate in value, investors should therefore be aware that they may not realise the initial amount invested, and indeed may incur additional liabilities. These Investments may entail above average financial
risk of loss, and investors should therefore carefully consider whether their financial circumstances and investment experience permit them to invest and, if necessary, seek the advice of an independent Financial Advisor. Some services described are not available to certain customers due to regulatory constraints
either in the United Kingdom or elsewhere. © 2014 ADM Investor Services International Limited 2014.
Equity & Commodity Strategy - Fulcanelli Report Paul Mylchreest Email: [email protected] Tel: +44 20 7716 8257
The recent fall in the oil price will take CPI even further away from target…
Perhaps a further decline in Japanese inflation in the coming months will be met with even greater monetary
stimulus. Indeed, Kuroda stated on 5 November 2014 that there is potentially no limit to the BoJ’s attempts to
meet its inflation target.
“It’s natural to act should downside risks to prices become substantial…last week’s easing was a true display
of the Bank’s unwavering commitment…As for measures for additional easing, I don’t think there is a limit,
including on bond purchases.”
As a percentage of GDP, the BoJ’s balance sheet is now almost 60%, which even leaves the Fed a long way be-
hind in its wake.
Source: Bloomberg, ADM ISI
At the current rate of asset purchases and assuming growth in Japanese nominal GDP of 2.0% p.a., the BoJ’s bal-
ance sheet will be almost 75% of GDP in a year’s time.
Theoretically, there is no limit to the weakness in the Yen. To the extent that the Nikkei keeps re-pricing itself in
weaker Yen, which helps to obscure the sin, there is no limit to the upside in nominal terms.
This is the beauty of the long side of the long/short Nikkei versus Gold trade, at least in Yen terms.
Of course, Abenomics might still work and the need for monetary stimulus could recede. Alternatively, rising op-
position either from the Japanese political establishment or public opinion could yet halt Abe’s policy.
Physical gold demand
The short Gold part of the trade is obviously very different to being long Nikkei in the sense that the downside, in
this case, is not infinite.
While price discovery in the gold market is almost entirely dependent on supply and demand for paper gold in-
struments, the price cannot go to zero since, at some point, offers of physical gold will dry up.

ADM Investor Services International Limited is authorised and regulated by The Financial Conduct Authority. Member of The London Stock Exchange. Registered office: 4th Floor Millennium Bridge House, 2 Lambeth Hill, London EC4V 3TT. Registered in England No. 2547805 a subsidiary of Archer Daniels Midland
Company. Risk Warning: Investments in Equities, CFDs, Futures, Options, Derivatives and Foreign Exchange can fluctuate in value, investors should therefore be aware that they may not realise the initial amount invested, and indeed may incur additional liabilities. These Investments may entail above average financial
risk of loss, and investors should therefore carefully consider whether their financial circumstances and investment experience permit them to invest and, if necessary, seek the advice of an independent Financial Advisor. Some services described are not available to certain customers due to regulatory constraints
either in the United Kingdom or elsewhere. © 2014 ADM Investor Services International Limited 2014.
Equity & Commodity Strategy - Fulcanelli Report Paul Mylchreest Email: [email protected] Tel: +44 20 7716 8257
A default on some form of paper gold instrument would lead to a fundamental change of the current market
structure and support a re-pricing of physical gold.
Following the most recent sell-off, the gold market is showing renewed signs of tightness in physical supply. The
1-month GOFO rate is -0.298%.
Source: Bloomberg, ADM ISI
This is the lowest it’s been since 2001, which marked the low in the gold price prior to the 2001-11 bull market.
Source: Bloomberg, ADM ISI

ADM Investor Services International Limited is authorised and regulated by The Financial Conduct Authority. Member of The London Stock Exchange. Registered office: 4th Floor Millennium Bridge House, 2 Lambeth Hill, London EC4V 3TT. Registered in England No. 2547805 a subsidiary of Archer Daniels Midland
Company. Risk Warning: Investments in Equities, CFDs, Futures, Options, Derivatives and Foreign Exchange can fluctuate in value, investors should therefore be aware that they may not realise the initial amount invested, and indeed may incur additional liabilities. These Investments may entail above average financial
risk of loss, and investors should therefore carefully consider whether their financial circumstances and investment experience permit them to invest and, if necessary, seek the advice of an independent Financial Advisor. Some services described are not available to certain customers due to regulatory constraints
either in the United Kingdom or elsewhere. © 2014 ADM Investor Services International Limited 2014.
Equity & Commodity Strategy - Fulcanelli Report Paul Mylchreest Email: [email protected] Tel: +44 20 7716 8257
The gold basis is also negative again…which you can see from your Bloomberg or Reuters terminal, i.e. the bid
on spot gold is above the offer on the December 2014 gold future.
Negative GOFO and a negative gold basis are early warning signs that offers of physical gold at the current price
are beginning to dry up.
Forgetting paper gold instruments for a moment, what else can we glean about the market for physical gold?
Despite what you may have read, it is impossible to model supply and demand for physical gold.
The reason for this is the extreme stock-to-flow ratio of monetary metals such as gold (especially) and silver, i.e.
the stock of available gold is many multiples of annual supply. Unlike other commodities which are produced for
consumption, the vast majority of all the gold ever mined remains in a form, e.g. bars, coins, jewellery, etc,
which makes it either very easy or relatively easy to turn it back into supply.
The WGC estimates that there are 177,200 tonnes of gold on the surface of the planet (actually too low) com-
pared with 3,054 tonnes of gold mined in 2013. In contrast, known stocks of other commodities such as industri-
al metals, bulks like iron ore and agricultural commodities like grains are a fraction of annual production. The
situation is completely inverted compared to gold.
Data from the World Gold Council and industry consultants is nothing more than their best guesses for incre-
mental supply in terms of newly-mined gold, together with scrap supply and official sales, and where they think
that incremental supply goes. There is no way to calculate the supply and demand within the existing invento-
ry of, for example, gold bars and coins.
If modelling supply and demand is impossible what can we do?
Besides market indicators, such as GOFO and the gold basis, we look at the net impact of four quantitative indi-
cators which are major swing factors in physical gold demand.
Gold withdrawals on the Shanghai Gold Exchange (data from the SGE);
Gross gold imports into India;
Net change in gold holdings of all-known ETFs (Bloomberg); and
Net change in central bank gold holdings (WGC, quarterly data weighted on a monthly basis according
to the WGC’s incomplete data for the latter).

ADM Investor Services International Limited is authorised and regulated by The Financial Conduct Authority. Member of The London Stock Exchange. Registered office: 4th Floor Millennium Bridge House, 2 Lambeth Hill, London EC4V 3TT. Registered in England No. 2547805 a subsidiary of Archer Daniels Midland
Company. Risk Warning: Investments in Equities, CFDs, Futures, Options, Derivatives and Foreign Exchange can fluctuate in value, investors should therefore be aware that they may not realise the initial amount invested, and indeed may incur additional liabilities. These Investments may entail above average financial
risk of loss, and investors should therefore carefully consider whether their financial circumstances and investment experience permit them to invest and, if necessary, seek the advice of an independent Financial Advisor. Some services described are not available to certain customers due to regulatory constraints
either in the United Kingdom or elsewhere. © 2014 ADM Investor Services International Limited 2014.
Equity & Commodity Strategy - Fulcanelli Report Paul Mylchreest Email: [email protected] Tel: +44 20 7716 8257
The chart below shows the net changes in gold demand from these four sources from January 2010 to October
2014.
Source: Koos Jansen, WGC, SGE
There are several points to note.
Gold demand from these sources can be relatively volatile on a month-to-month basis, anything from
under 150 tonnes to more than 300 tonnes;
Despite the month-to-month volatility, there has been no significant change in the net demand from
these four sources during this period;
The chart understates the strength of demand since the raising of import duties by India (the world’s
largest gold market in 2010-12) has led to a well-documented surge in gold smuggled into the country
since early 2013;
It also likely understates the demand since it EXCLUDES PBoC purchases, as the latter only publishes its
holdings every six years. China’s policy of diversifying its more than US$3.9 trillion of foreign exchange
reserves and its desire to become a gold market hub puts the probability that it hasn’t used the fall in
the gold price to accumulate additional gold reserves at almost zero; and
The most recent aggregate net demand from these sources has been some of the strongest during al-
most four years. This supports market indicators, such as GOFO and the gold basis, which are also indi-
cating tight supply of physical bullion.
We should take a moment to explain the significance of withdrawals on the Shanghai Gold Exchange.
Under Chinese law, all gold either mined domestically or imported has to be sold through the SGE, which allows
the Chinese authorities to monitor non-government gold reserves. Once bars are withdrawn from the SGE, they
are not allowed to be re-deposited (Article 23 of the SGE rule book). Withdrawn SGE bars which are re-sold have
to be recast and assayed as new bars. This gold is counted as scrap supply.

ADM Investor Services International Limited is authorised and regulated by The Financial Conduct Authority. Member of The London Stock Exchange. Registered office: 4th Floor Millennium Bridge House, 2 Lambeth Hill, London EC4V 3TT. Registered in England No. 2547805 a subsidiary of Archer Daniels Midland
Company. Risk Warning: Investments in Equities, CFDs, Futures, Options, Derivatives and Foreign Exchange can fluctuate in value, investors should therefore be aware that they may not realise the initial amount invested, and indeed may incur additional liabilities. These Investments may entail above average financial
risk of loss, and investors should therefore carefully consider whether their financial circumstances and investment experience permit them to invest and, if necessary, seek the advice of an independent Financial Advisor. Some services described are not available to certain customers due to regulatory constraints
either in the United Kingdom or elsewhere. © 2014 ADM Investor Services International Limited 2014.
Equity & Commodity Strategy - Fulcanelli Report Paul Mylchreest Email: [email protected] Tel: +44 20 7716 8257
Consequently, SGE withdrawals are a close proxy for incremental Chinese demand.
The aggregate of SGE withdrawals in 2013 was 2,197 tonnes, which was equivalent to 72% of the world’s newly
mined gold…and that was just Chinese demand (and it excluded PBoC purchases – see below). Chinese demand
of c.2,000 tonnes last year was higher than the WGC’s figure but can also be corroborated by adding net imports
into China from Hong Kong (only) to domestic mine production.
It was also confrimed by official Chinese sources. The China Gold Network reported a speech by the Chairman of
the Shanghai Gold Exchange (SGE), Xu Luode, on 15 May 2014 in which he stated.
“Xu pointed out that the current gold market, especially the physical gold market, is actually in the East, main-
ly in China. Last year China’s own gold-enterprises produced 428 tons; at the same time China imported 1,540
tons of gold, adding up to nearly 2,000 tons.”
Torgny Persson, CEO of BullionStar.com attended the LBMA forum in Singapore in July 2014. He reported on
comments made by Xu Luode in another speech which Koos Jansen published on the “In Gold We Trust” web-
site.
“In the speech Mr Xu mentioned and I quote from the official translation in the headphones ‘as the Chinese
consumption demand of gold hit 2,000 tonnes in 2013.”
Koos Jansen is now publishing on the BullionStar.com website and has kept a tally of gold withdrawals on the
SGE so far in 2014. These have amounted to 1,761 tonnes during the first 46 weeks, putting Chinese demand on
a full year 2014 run rate of about 2,000 tonnes.
Source: Koos Jansen, BullionStar.com
Regarding the PBoC, in a September 2014 report written by Na Liu of CNC Asset Management, and published by
Scotia Bank, Na Liu recounted the comment made during a meeting with the President of the SGE Transaction
Department.
“The PBoC does not buy gold through the SGE.”

ADM Investor Services International Limited is authorised and regulated by The Financial Conduct Authority. Member of The London Stock Exchange. Registered office: 4th Floor Millennium Bridge House, 2 Lambeth Hill, London EC4V 3TT. Registered in England No. 2547805 a subsidiary of Archer Daniels Midland
Company. Risk Warning: Investments in Equities, CFDs, Futures, Options, Derivatives and Foreign Exchange can fluctuate in value, investors should therefore be aware that they may not realise the initial amount invested, and indeed may incur additional liabilities. These Investments may entail above average financial
risk of loss, and investors should therefore carefully consider whether their financial circumstances and investment experience permit them to invest and, if necessary, seek the advice of an independent Financial Advisor. Some services described are not available to certain customers due to regulatory constraints
either in the United Kingdom or elsewhere. © 2014 ADM Investor Services International Limited 2014.
Equity & Commodity Strategy - Fulcanelli Report Paul Mylchreest Email: [email protected] Tel: +44 20 7716 8257
Which means that the PBoC’s purchases of physical gold on international markets are additional to the c.2000
tonnes p.a. of domestic Chinese demand we’ve seen during 2013-14. The last update to Chinese gold reserves
was in April 2009 when it was revealed that China had increased its gold reserves by 76% from 600 to 1,054
tonnes. We await the forthcoming update in 2015 with interest.
Anomalies in the silver market
Has the gold short been partially hedged in silver?
During the writing of this report, we happened to think about two anomalies between the gold and silver mar-
kets which we’d been wrestling with for a long time.
The first one is the divergence between holdings of gold and silver in ETFs.
The volume of gold held in all known ETFs peaked in December 2012. The big declines in gold during the first
half of 2013 helped to shake out many weak holders. Despite the fact that the silver price has fallen far more
than the gold price since its post-QE3 peak in early-October 2012 (53% versus 33%), the volume of silver held in
all known ETFs is very close to an all-time high.
Source: Bloomberg, ADM ISI
Why oh why?
Notice how the divergence kicked in at the end of 2012, shortly after we believe that the long/short Nikkei ver-
sus Gold trade was initiated.
Another coincidence?

ADM Investor Services International Limited is authorised and regulated by The Financial Conduct Authority. Member of The London Stock Exchange. Registered office: 4th Floor Millennium Bridge House, 2 Lambeth Hill, London EC4V 3TT. Registered in England No. 2547805 a subsidiary of Archer Daniels Midland
Company. Risk Warning: Investments in Equities, CFDs, Futures, Options, Derivatives and Foreign Exchange can fluctuate in value, investors should therefore be aware that they may not realise the initial amount invested, and indeed may incur additional liabilities. These Investments may entail above average financial
risk of loss, and investors should therefore carefully consider whether their financial circumstances and investment experience permit them to invest and, if necessary, seek the advice of an independent Financial Advisor. Some services described are not available to certain customers due to regulatory constraints
either in the United Kingdom or elsewhere. © 2014 ADM Investor Services International Limited 2014.
Equity & Commodity Strategy - Fulcanelli Report Paul Mylchreest Email: [email protected] Tel: +44 20 7716 8257
The second anomaly is the divergence between the open interest in gold and silver on the COMEX futures market
in New York.
Source: Bloomberg, ADM ISI
That divergence, depending how you look at it, either began in February 2012 or October 2012. The latter is obvi-
ously very close (here we go again) to when we think the long/short trade was initiated.
We started to question whether the entities which we believe are short gold had concluded that a rapid exit of
the short position could be problematic?
If so, might they have considered hedging part of that position in the silver market?
That might account for the counterintuitive divergences in ETF holdings and COMEX open interest.
Alternatively, what if somebody knew that the gold price was being pushed down on the back of a leveraged
short trade rather than on fundamentals? Might they gradually build up a long position in silver on the basis that
the weakness in the gold price was not sustainable?
We don’t know but…
The much smaller size of the silver market, limited above-ground silver inventory, and stretched level of the gold/
silver ratio, means that a major reversal in the gold price would have a disproportionate impact on the silver
price.
Silver is unique as it is both a monetary metal and an industrial metal. Unlike gold, there are limited above-ground stocks of silver because so much has been consumed in industrial applications. As stated earlier, the offi-cial estimate for the world gold stock is 177,200 tonnes, or 5.7 billion oz. Nobody knows the level of above-ground silver stocks, although the majority of estimates are in the 1.0-2.0bn oz. range, i.e. between 17-35% of the comparable figure for gold.

ADM Investor Services International Limited is authorised and regulated by The Financial Conduct Authority. Member of The London Stock Exchange. Registered office: 4th Floor Millennium Bridge House, 2 Lambeth Hill, London EC4V 3TT. Registered in England No. 2547805 a subsidiary of Archer Daniels Midland
Company. Risk Warning: Investments in Equities, CFDs, Futures, Options, Derivatives and Foreign Exchange can fluctuate in value, investors should therefore be aware that they may not realise the initial amount invested, and indeed may incur additional liabilities. These Investments may entail above average financial
risk of loss, and investors should therefore carefully consider whether their financial circumstances and investment experience permit them to invest and, if necessary, seek the advice of an independent Financial Advisor. Some services described are not available to certain customers due to regulatory constraints
either in the United Kingdom or elsewhere. © 2014 ADM Investor Services International Limited 2014.
Equity & Commodity Strategy - Fulcanelli Report Paul Mylchreest Email: [email protected] Tel: +44 20 7716 8257
Of the estimated 177,200 tonnes of above-ground gold stocks, approximately 31,500 tonnes are reportedly held
by the central banks. These institutions are able to lease this gold into the market to affect the price. Central
banks, as far as we are aware, have divested their silver reserves.
The gold/silver ratio is currently 73.0 having averaged 15-16x for several thousand years. At times, it has even
been considerably lower. For example, the ratio was 12.5 times during the era of Alexander the Great in the
fourth century B.C. and was fixed at 12.0 during the Roman Empire. The ratio started to rise with the progressive
demonetisation across Europe and the US in the late nineteenth century which culminated in China jettisoning
the silver standard in 1935.
During the last 20 years, the ratio has generally traded within the 50-70 range. Having said that, there was only
8.3 times more silver mined than gold in 2013, so some “reversion to the mean” (15-16x) might be justified in
the coming years.

ADM Investor Services International Limited is authorised and regulated by The Financial Conduct Authority. Member of The London Stock Exchange. Registered office: 4th Floor Millennium Bridge House, 2 Lambeth Hill, London EC4V 3TT. Registered in England No. 2547805 a subsidiary of Archer Daniels Midland
Company. Risk Warning: Investments in Equities, CFDs, Futures, Options, Derivatives and Foreign Exchange can fluctuate in value, investors should therefore be aware that they may not realise the initial amount invested, and indeed may incur additional liabilities. These Investments may entail above average financial
risk of loss, and investors should therefore carefully consider whether their financial circumstances and investment experience permit them to invest and, if necessary, seek the advice of an independent Financial Advisor. Some services described are not available to certain customers due to regulatory constraints
either in the United Kingdom or elsewhere. © 2014 ADM Investor Services International Limited 2014.
Equity & Commodity Strategy - Fulcanelli Report Paul Mylchreest Email: [email protected] Tel: +44 20 7716 8257