EuroFundLux GEDI Equity Dividend Strategy
32
October 2019 Euromobiliare AM Sgr EuroFundLux GEDI Equity Dividend Strategy
Transcript of EuroFundLux GEDI Equity Dividend Strategy

October 2019
Euromobiliare AM Sgr
EuroFundLux GEDI
Equity Dividend Strategy

2
Euromobiliare AM SGR – asset management capabilities
OUR HISTORY OUR FIGURES
1984Euromobiliare A.M. is established in Milan (Italy),
where it is still based.
2001The company is granted the proxy to manage
mutual funds of Euromobiliare IF Luxembourg
SICAV.
2007The company is pioneer in multi-manager and
sub-advisories in Italy and in Europe.
2018The company is appointed Management
Company by Euromobiliare IF Lux SICAV.
12,5 BN EURThe company manages 7,4 BN EUR in Italy domiciled
mutual funds and 5,1 BN EUR in Lux SICAV funds.
60 PeopleThe company employs 60 people, 49 in Milan and 11 in
Luxembourg.
56 Mutual FundsThe company manages 56 mutual funds across a
variety of investment strategies.
3 ESG FundsThe company established its ESG process in 2018 and
is developing a full range of ESG funds.

3
Euromobiliare AM SGR is part of Credem Group
Top 10 among the major Italian listed bank
groups
A stable shareholding structure
Rating in line with the Italian rating
Asset solidity with liquidity ratios (Basel 3)
higher than the objectives set for 2018
Credit quality with the lowest exposure among
Italian banks listed with NPL and non-performing
loans
Retail business: a business model with focus on
commercial banking, wealth management and
asset management
CET
NPL Ratio
*Italian average value of the so-called «significant institutions» banks (Source: ECB, Supervisory Banking
Statistics H12019 )
*

4
Our European equity team
Massimo Aloi
Portfolio Manager
Mutual funds
Experience in Euromobiliare AM SGR
Past experiences
Education
Azioni Italiane 150 €/mln
Euro Equity 191 €/mln
Joined in 2008 as lead porfolio manager on Italian equities.
1997 – 2008 ABN Amro, lead portfolio manager Italian and
European equity
1993 – 1997 Banca Popolare di Friuladria, equity portfolio manager
Honours Degree in Economics, University of Venice Ca’ Foscari
PIR Funds 152 €/mln
GEDI 149 €/mln
Pier Luca Bonvicini
Portfolio Manager
Mutual funds
Experience in Euromobiliare AM SGR
Past experiences
Education
Azioni Italiane 150 €/mln
Euro Equity 191 €/mln
1996 – 2007 BNL Gestioni, European equity manager
1992 – 1999 Ernst & Young, senior auditor
PIR Funds 152 €/mln
GEDI 149 €/mln
Joined in 2007 as equity portfolio manager with a focus on
derivatives strategies.
Honours Degree in Economics, University of Modena

5
Our track-record on Italian and Euro equities
Azioni Italiane
0
50
100
150
200
250
300
Jan
-09
Ma
y-0
9
Se
p-0
9
Jan
-10
Ma
y-1
0
Se
p-1
0
Jan
-11
Ma
y-1
1
Se
p-1
1
Jan
-12
Ma
y-1
2
Se
p-1
2
Jan
-13
Ma
y-1
3
Se
p-1
3
Jan
-14
Ma
y-1
4
Se
p-1
4
Jan
-15
Ma
y-1
5
Se
p-1
5
Jan
-16
Ma
y-1
6
Se
p-1
6
Jan
-17
Ma
y-1
7
Se
p-1
7
Jan
-18
Ma
y-1
8
Se
p-1
8
Jan
-19
Ma
y-1
9
Euromobiliare Azioni Italiane MSCI Italy TR
Euro Equity
80
90
100
110
120
130
140
150
Ap
r-1
4
Jun
-14
Au
g-1
4
Oct-
14
De
c-1
4
Fe
b-1
5
Ap
r-1
5
Jun
-15
Au
g-1
5
Oct-
15
De
c-1
5
Fe
b-1
6
Ap
r-1
6
Jun
-16
Au
g-1
6
Oct-
16
De
c-1
6
Fe
b-1
7
Ap
r-1
7
Jun
-17
Au
g-1
7
Oct-
17
De
c-1
7
Fe
b-1
8
Ap
r-1
8
Jun
-18
Au
g-1
8
Oct-
18
De
c-1
8
Fe
b-1
9
Ap
r-1
9
Jun
-19
Euromobiliare IF Euro Equity DJ Euro STOXX 50 TR
Ann. Extra-Perf: 2,6%
Ann. TEV: 1,7%Ann. Extra-Perf: 6,6%
Ann. TEV: 2,4%
Data gross of fees, 31.12.08-31.08.19 Data gross of fees, 30.04.014-31.08.19

6
A new way of thinking of INCOME
Corporate
Bonds
High Dividend
Stocks
GEDI
Interest
Rate RiskLiquidityYield
Equity
Risk
Predictable
Return
LowDecreasing No Good
No HighStable High
High
Low
Stable No No High Good

7
Dividend Yields are compelling vs government and corporate yields
-2
0
2
4
6
8
10
12
dic-
09
mag
-10
ott-1
0
mar
-11
ago-
11
gen-
12
giu-
12
nov-
12
apr-1
3
set-1
3
feb-
14
lug-
14
dic-
14
mag
-15
ott-1
5
mar
-16
ago-
16
gen-
17
giu-
17
nov-
17
apr-1
8
set-1
8
feb-
19
lug-
19
Perc
enta
ge Y
ield
HY
IG
BTP
BUND
European equity dividend
yields are stable amid
collapsing government and
corporate yields

8
-2
0
2
4
6
Dec-
09
May
-10
Oct-1
0
Mar
-11
Aug-
11
Jan-
12
Jun-
12
Nov-
12
Apr-1
3
Sep-
13
Feb-
14
Jul-1
4
Dec-
14
May
-15
Oct-1
5
Mar
-16
Aug-
16
Jan-
17
Jun-
17
Nov-
17
Apr-1
8
Sep-
18
Feb-
19
Jul-1
9
Perc
enta
ge Y
ield
Axis Title
Europe is traditionally the region where dividend yields are most generous
JAPAN TOPIX
US S&P 500
EUROPE STOXX 600

9
However every source of income has risks associated
European HY
European IG
German Bund
Duration* Volatility**Yield* Rating*Max
Drawdown**
3,72,8 BB- -6,1
5,2 2,00,2 A-
3,1
-2,2
-0,7 10,0 AAA 4,8 -5,9
Italy BTP 1,0 8,7 BBB 8,2 -12,5
European
High Dividend3,9 -
IG
Equivalent13,4 -18,4
* As of 31.08.2019 ** Over 5 years, as of 31.08.2019

10
GEDI: an equity income strategy with managed volatility
Growing and sustainable dividend equity portfolio…
High and sustainable income from dividends complemented by the
possibility to sell call options…
Portfolio volatility and equity beta are managed actively through cash,
index futures and put options
Our long term goal is to achieve a total return consistent with the portfolio
dividend yield maintaining a strong control on portfolio volatility.

11
Income and volatility
Strategy highlights
Target dividend yield 4% from a diversified portfolio of growing and sustainable dividend
stocks, eventually complemented with call option premiums.
Expected volatility 4-7% on an annual basis. The fund has a Mifid Risk Profile 4, MAX
Value at Risk 6,7% on a monthly basis, 99% confidence.
Investment universe Focus on Euro Area large cap stocks.
Average exposure to UK stocks is 25%. No exposure to US and Asian stocks.
No bias towards Italy (average weight 10-15%).
Investment process
The stock selection process is the same as for the Euromobiliare flagship equity funds with
a focus on visibility of cash flows and dividend coverage.
The fund managers do not invest in stocks with dividend yield <2,5%.
The fund managers have no «a priori» sector bias and do not exclude any sector, even if
high dividend sectors are overrepresented (energy, utilities, consumer staples, financials).
Liquidity The equity porfolio is very liquid.
The fund managers only employ index futures and listed options on indices and (at a
lower extent) single stocks.

12
Outline of the investment strategy
RETURN
80-90% growing and sustainable dividend European stocks
selected on a bottom-up basis.
10-20% cash, money market instruments or short dated
government bonds as margin for derivatives.
Core portfolio
Sell OTM Calls
ADDITIONAL INCOME
Covered call strategy, sell opportunistically «out of the money»
call options on indices or single stocks within the equity portfolio in
order to generate additional income from premia.
The fund managers sell call options when the upside on the
underlying stock or index is limited.
Beta management
PROTECTION
Manage beta actively in the 0,20-0,70 range through cash, index
futures and put options.
The fund managers build put protection on a non-systematic
and cost efficient way.

13
Investment philosophy of the equity portfolio
• No benchmark positions
• Focus on European stocks, the region that traditionally exhibits higher dividends
• Focus on dividend sustainability rather than dividend maximization
• Buy undervalued stocks
• Moderate portfolio concentration (40-50 stocks)
• Low turnover (10-20%)
• Sector diversification (MAX single sector 20%)
• Single stock diversification (MAX single stock 5%)
• Active hedging of FX exposure (GBP exposure is currently fully hedged)

14
Stock Example 1: MOWI
0,9
1
1,1
1,2
1,3
1,4
1,5
1,6
1,7
1,8
0
20
40
60
80
100
120
140
160
1803
1/1
2/2
01
7
31
/01
/20
18
28
/02
/20
18
31
/03
/20
18
30
/04
/20
18
31
/05
/20
18
30
/06
/20
18
31
/07
/20
18
31
/08
/20
18
30
/09
/20
18
31
/10
/20
18
30
/11
/20
18
31
/12
/20
18
31
/01
/20
19
28
/02
/20
19
31
/03
/20
19
30
/04
/20
19
31
/05
/20
19
30
/06
/20
19
31
/07
/20
19
31
/08
/20
19
Cumulative Rel. Perf. Vs STOXX 600 MOWI
Market leader >20% market share of the global farmed
salmon market
Management good track record, focus on operations,
strong biology background
Macro social trend more protein and omega3
demand
Mid term growth increasing demand should support
mid single digit demand growth
Defensive profile geo sales: EU 50%, USA 20%,
ASIA 5%, EM 15%
Geo origin volumes: Norway 60%, Scotland 15%,
Canada 13%, Chile 12%
Valuation P/E ’20 14x vs «food, beverage & tobacco»
>19x
Dvd yield >5% vs «food, beverage & tobacco» =3%
(sustainable <70% CF)
MOWI is a market leader in salmon production. It offers an
attractive dividend yield with a growing business and attractive
valuations vs consumer staples.

15
Stock Example 2: ENEL
Strategic update in November may be a positive
catalyst
Valuation relative to peers the stock is not expensive
P/E ‘20 13x utilities 15x
Sustainable Dvd yield with a floor of 0,28 (19’) 0,32
(20’) 0,34 (21’) at the end of plan 20’
Strong exposure on renewables with an
accelerating growth a stable margin
Low level of leverage 2,4 Net Debt/Ebitda 2019
Strong operating cash flow that cover all of capex
and stable dvd pay out ratio of 70%
Exposure to Latin America: 1/3 Ebitda
ENEL is an Ieading utility company with a compelling and
sustainable dividend yield.
0,8
0,85
0,9
0,95
1
1,05
1,1
1,15
1,2
1,25
1,3
0
20
40
60
80
100
120
1403
1/1
2/2
01
7
31
/01
/20
18
28
/02
/20
18
31
/03
/20
18
30
/04
/20
18
31
/05
/20
18
30
/06
/20
18
31
/07
/20
18
31
/08
/20
18
30
/09
/20
18
31
/10
/20
18
30
/11
/20
18
31
/12
/20
18
31
/01
/20
19
28
/02
/20
19
31
/03
/20
19
30
/04
/20
19
31
/05
/20
19
30
/06
/20
19
31
/07
/20
19
31
/08
/20
19
Cumulative Rel. Perf. Vs STOXX 600 ENEL

16
Portfolio characteristics: investment rationale and dividend yield
BNP Paribas
Intesa
HSBC
Lloyds
Mediobanca
Endesa
Aviva
BP
Red Electrica
Deutsche Post
Deutsche Tel.
Enav
Koninljke
BASF
Saint Gobain
Sanofi
Unilever
Danone
Terna
Total
Glaxo
Munich RE
Allianz
Amundi
Enel
ERG
Astrazeneca
BAE Systems
Rio Tinto AXA
Nokia
Volkswagen
Reckitt Benckiser
Italgas
MOWI
DVD
>5%
DVD
4-5%
DVD
<4%
Banks
8% of equity ptf
CF generators
54% of equity ptf
Growth stories
27% of equity ptf
Transformation
10% of equity ptf
31%
45%
24%

17
Active management of the net equity exposure
85%88%
86% 86%83%
85%
82% 82% 82% 82% 81% 80% 80% 81% 80% 80%83%
79% 78% 79% 79%82% 82%
38% 39%
35%34%
28%31% 30% 31%
35%33%
38%
31%34% 33%
39% 38%41%
55%
47% 49%47%
36%
45%
750
760
770
780
790
800
810
820
830
840
850
0,0%
10,0%
20,0%
30,0%
40,0%
50,0%
60,0%
70,0%
80,0%
90,0%
100,0%
Equi
ty In
dex L
evel
Allo
catio
n
GROSS EQUITY EXPOSURE NET EQUITY EXPOSURE DJ STOXX 600
Market Risk AversionOpportunity
Increase Net Exposure
Market Risk TakingCaution
Decrease Net Exposure
The net Equity exposure has been managed within the 30-50% range following a contrarian approach.

18
Due to stock selection equity beta is consistently lower than net exposure
77%
85% 85%83%
86%83% 85% 86%
89% 89% 90%87%
85% 84% 85% 85% 84% 83%81%
84%
56%
67% 67%64%
69%
64%66% 68%
74% 73% 74%70%
67%64%
67% 66% 66%63%
59%
64%
0,66
0,68
0,7
0,72
0,74
0,76
0,78
0,8
0,82
0,84
0
0,1
0,2
0,3
0,4
0,5
0,6
0,7
0,8
0,9
1
GROSS EXPOSURE BETA EQUIVALENT GROSS EXPOSURE BETA
The ex-ante beta of the stock portfolio is 0,70-0,80. The beta equivalent gross equity
exposure is therefore about 20% lower.

19
Sector diversification is key
Sector allocation is influenced by the dividend nature of the strategy, however the managers carefully
monitor sector exposure keeping the top sector (utilities) <15% and net short positions (IT and
consumer discretionary) <3%. Net positions are also balanced between cyclicals and defensives.
-10,0%
0,0%
10,0%
20,0%
30,0%
40,0%
50,0%
60,0%
Consumer Staples Consumer Discretionary Energy
Financials Industrials IT
Real Estate Materials Health Care
Utilities Communications

20
Calibration of the option strategy
TRADING RANGE
No Hedging
Yield enhancement
Sell put 5-10% OTM
Sell call 5-10% OTM
RISING MARKET
Hedging
Buy put 5-10% OTM
Yield Enhancement
Sell call ATM
FALLING MARKET
Close Hedging
Eventually buy call
The fund managers define hedging strategies and yield enhancement through options
according to their market view.

21
Daily monitoring of the option and futures hedging strategy
The managers have continuosly under control geographic and sector biases deriving from the
option and futures hedging strategy.
STOCK PORTFOLIOINDEX
FUTURESOPTIONS NET EXPOSURE
Consumer Staples 12,9% -2,8% -1,5% 8,7%
Consumer Discretionary 1,4% -1,1% -2,7% -2,4%
Energy 8,4% -2,6% -1,8% 3,9%
Financials 18,7% -3,3% -4,8% 10,6%
Industrials 5,7% -1,6% -2,4% 1,8%
IT 1,6% -0,2% -1,6% -0,3%
Real Estate 0,0% -0,2% -0,1% -0,3%
Materials 4,3% -1,8% -1,1% 1,4%
Health Care 9,2% -1,7% -1,2% 6,3%
Utilities 15,2% -0,5% -2,6% 12,1%
Communications 3,9% -0,9% -0,8% 2,2%
NA 0,6% 0,6%
Total 81,9% -16,7% -20,5% 44,7%
STOCK
PORTFOLIO
INDEX
FUTURESOPTIONS
NET
EXPOSURE
IT 15,3% -7,7% 7,6%
FR 18,1% -4,0% 14,1%
GE 12,2% -3,2% 9,0%
NE 2,5% -1,2% 1,3%
SP 5,2% -1,0% 4,2%
IE 0,0% -0,1% -0,1%
BE 0,0% -0,3% -0,3%
CZ 0,0% 0,0%
AS 0,0% 0,0%
FI 1,6% -0,1% 1,5%
SZ 0,0% 0,0%
GB 25,0% -16,8% -2,9% 22,1%
NO 2,2% 2,2%
Total 82,1% -16,8% -20,5% 2,2%Portfolio data as of 12.09.19
Portfolio data as of 12.09.19

22
Management history
Low volatility high dividend equity portfolio
Concentrated portfolio (30 stocks) focused
on stable sectors
European focus with US exposure
Covered call strategy on single stocks in
portfolio
Systematic protection through a Put
Spread Strategy
Portfolio average beta 0,25
Growing and sustainable dividend stocks
Diversified portfolio (40-50 stocks), all
sectors are represented
European focus
Opportunistic sale of call options on
single stocks and indices
Opportunistic beta management through
cash, futures and puts
Variable Beta (0,30-0,70)
November 2015 – June 2018 Since June 2018

23
Full track-record
Source Bloomberg. Data as at 27/09/2019.
Return of share class B (inst)
Cumulative Return vs market index – itd
80,0
85,0
90,0
95,0
100,0
105,0
110,0
115,0
120,0
EUROFUNDLUX GB ENH DV GEDI-B DJ STOXX 600
Management change
NOME TR Volatility MAX DD
EUROFUNDLUX GB ENH DV GEDI-B 4,8% 4,9% -5,4%
DJ STOXX 600 14,1% 11,3% -18,4%

24
Euromobiliare track-record
Source Bloomberg. Data as at 29/09/2019.
Return of share class B (inst)
Cumulative Return vs market index – itd
80,0
85,0
90,0
95,0
100,0
105,0
110,0
EUROFUNDLUX GB ENH DV GEDI-B DJ STOXX 600
NOME TR Volatility MAX DD
EUROFUNDLUX GB ENH DV GEDI-B 2,0% 4,0% -4,0%
DJ STOXX 600 4,9% 11,7% -13,7%
25
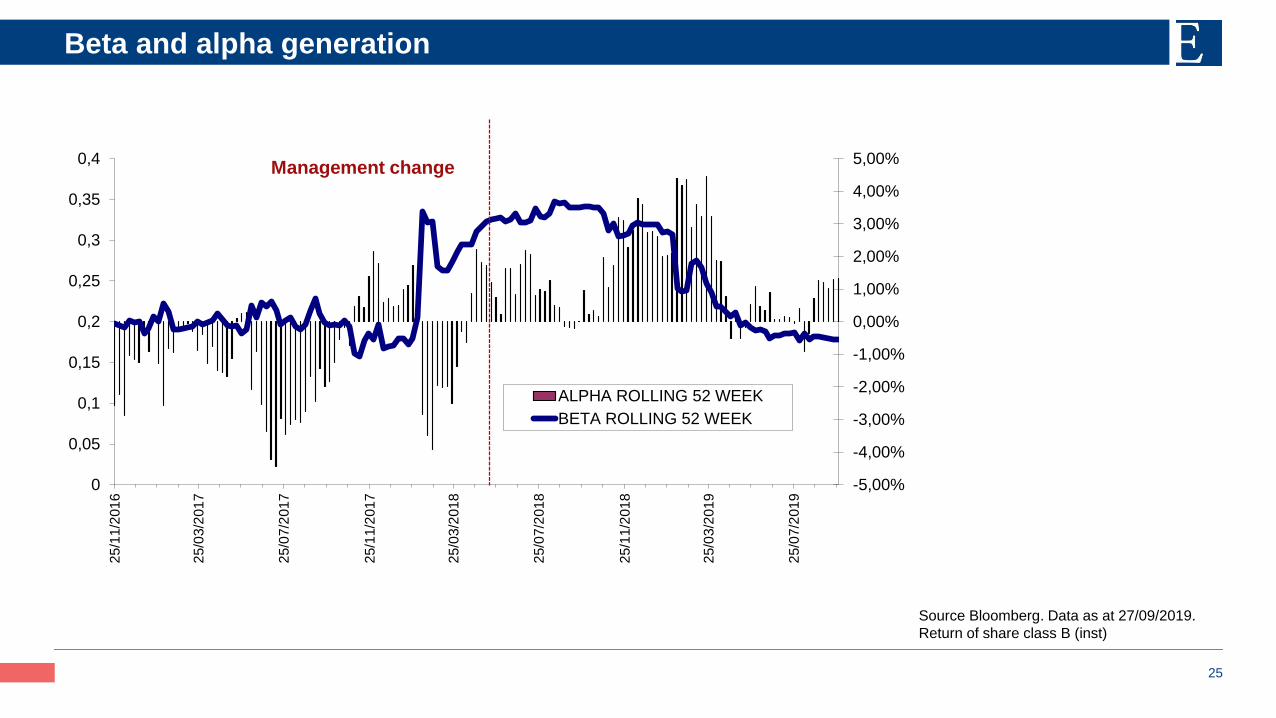
Beta and alpha generation
Source Bloomberg. Data as at 27/09/2019.
Return of share class B (inst)
-5,00%
-4,00%
-3,00%
-2,00%
-1,00%
0,00%
1,00%
2,00%
3,00%
4,00%
5,00%
0
0,05
0,1
0,15
0,2
0,25
0,3
0,35
0,4
25/1
1/2
01
6
25/0
3/2
01
7
25/0
7/2
01
7
25/1
1/2
01
7
25/0
3/2
018
25/0
7/2
01
8
25/1
1/2
01
8
25/0
3/2
01
9
25/0
7/2
01
9
ALPHA ROLLING 52 WEEK
BETA ROLLING 52 WEEK
Management change

26
Max drawdown
Source Bloomberg. Data as at 27/09/2019.
Return of share class B (inst)
-18,00%
-16,00%
-14,00%
-12,00%
-10,00%
-8,00%
-6,00%
-4,00%
-2,00%
0,00%
27
/11
/20
15
27
/01
/20
16
27/0
3/2
016
27
/05
/20
16
27
/07
/20
16
27
/09
/20
16
27
/11
/20
16
27
/01
/20
17
27
/03
/20
17
27
/05
/20
17
27/0
7/2
017
27
/09
/20
17
27
/11
/20
17
27
/01
/20
18
27
/03
/20
18
27
/05
/20
18
27
/07
/20
18
27
/09
/20
18
27
/11
/20
18
27
/01
/20
19
27
/03
/20
19
27
/05
/20
19
27
/07
/20
19
27
/09
/20
19
EUROMOBILIARE TR FLEX 5
DJ STOXX 600
Management change
27
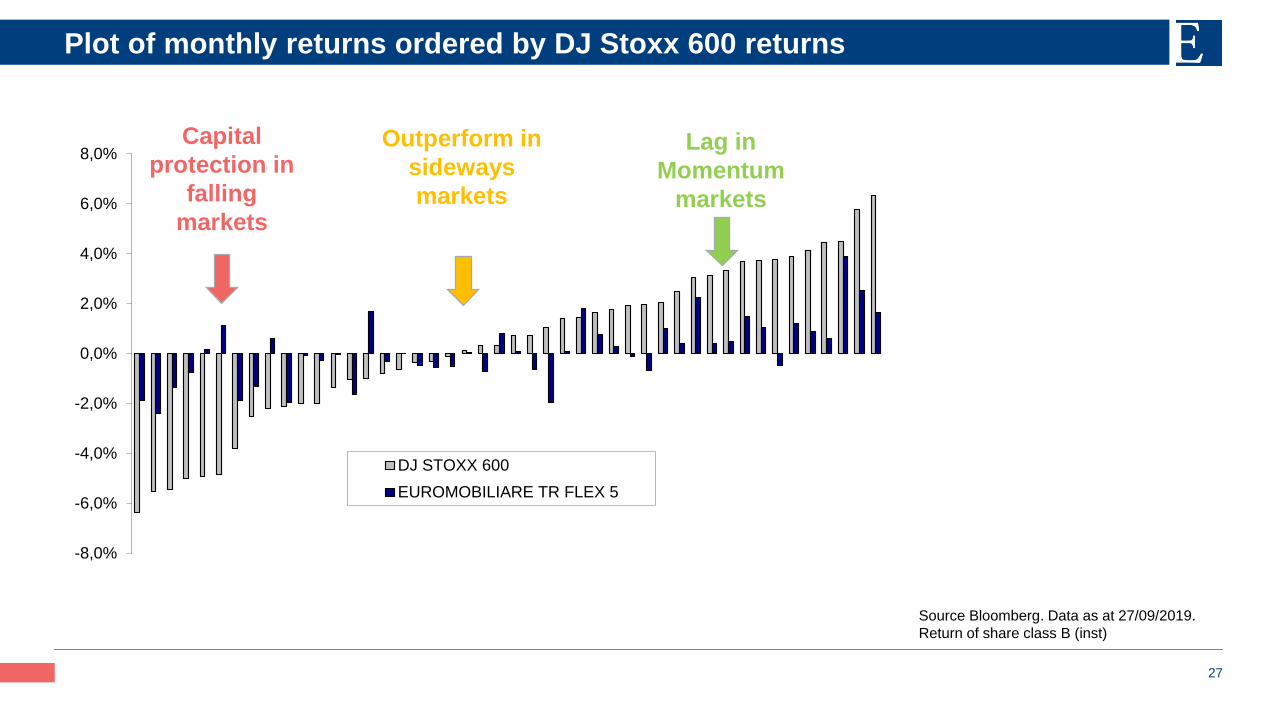
Plot of monthly returns ordered by DJ Stoxx 600 returns
Source Bloomberg. Data as at 27/09/2019.
Return of share class B (inst)
-8,0%
-6,0%
-4,0%
-2,0%
0,0%
2,0%
4,0%
6,0%
8,0%
DJ STOXX 600
EUROMOBILIARE TR FLEX 5
Capital
protection in
falling
markets
Outperform in
sideways
markets
Lag in
Momentum
markets

28
Asset allocation incl. derivatives
Dati al lordo dell’esposizione in strumenti derivati
Elaborazione a cura dell’ufficio MPI
Total Allocation(Net of derivatives)
Gross of Derivatives Allocation
Dividend yield 3,7%Equity derivatives -37,4%Compelling level
Net of
derivatives
Data as of 30.09.2019
75,8%
24,2%
0,0% 10,0% 20,0% 30,0% 40,0% 50,0% 60,0% 70,0% 80,0% 90,0% 100,0%
European Equities
Money Market
38,4%
24,2%
0,0% 10,0% 20,0% 30,0% 40,0% 50,0% 60,0% 70,0% 80,0% 90,0% 100,0%
European Equities
Money Market
29
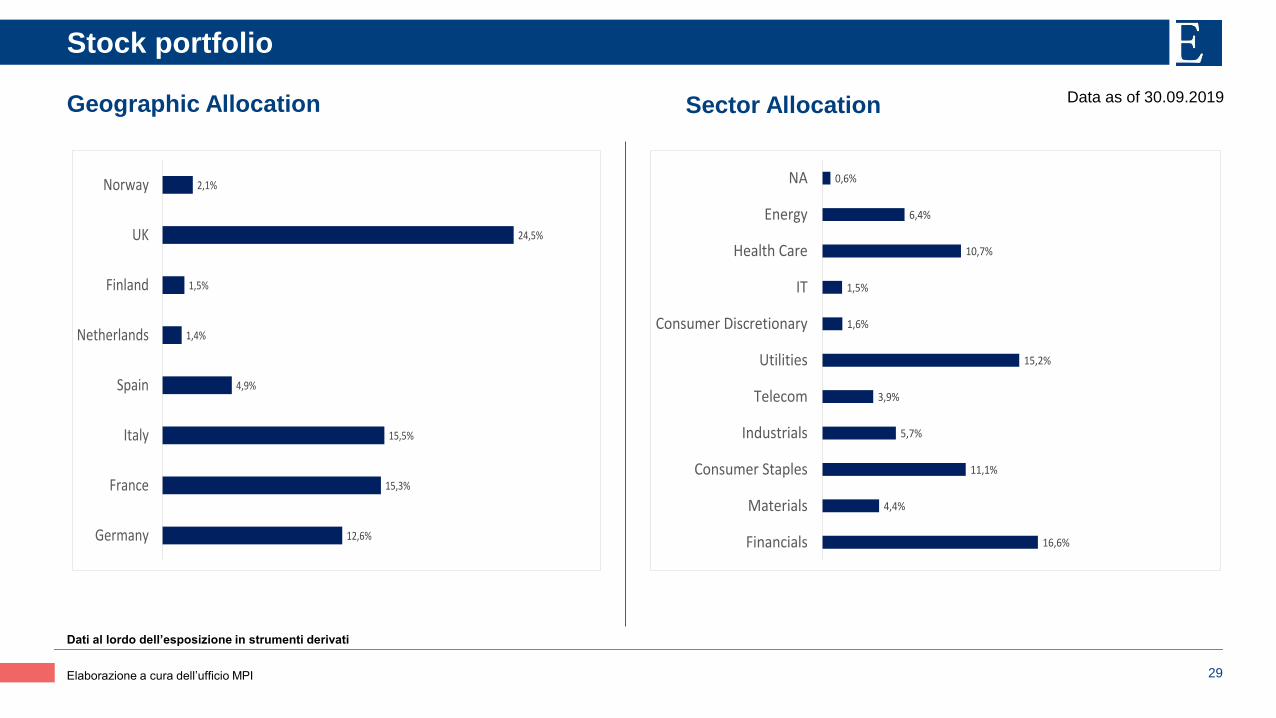
Stock portfolio
Geographic Allocation
Dati al lordo dell’esposizione in strumenti derivati
Elaborazione a cura dell’ufficio MPI
Sector Allocation Data as of 30.09.2019
12,6%
15,3%
15,5%
4,9%
1,4%
1,5%
24,5%
2,1%
Germany
France
Italy
Spain
Netherlands
Finland
UK
Norway
16,6%
4,4%
11,1%
5,7%
3,9%
15,2%
1,6%
1,5%
10,7%
6,4%
0,6%
Financials
Materials
Consumer Staples
Industrials
Telecom
Utilities
Consumer Discretionary
IT
Health Care
Energy
NA

30
EuroFundLux GEDI: stock portfolio 2/2
Top 10 holdings
Elaborazione a cura dell’ufficio MPI
Data as of 30.09.2019
ISIN STOCK WEIGHT
GB0009252882 GLAXOSMITHKLINE PLC 3,9%
GB0009895292 ASTRAZENECA PLC 3,9%
GB00B10RZP78 UNILEVER PLC 3,7%
IT0003128367 ENEL SPA 3,7%
FR0000120271 TOTAL SA 3,2%
GB0007980591 BP PLC 3,1%
IT0003242622 TERNA SPA 3,1%
FR0000120578 SANOFI 2,9%
DE0008404005 ALLIANZ SE-REG 2,9%
FR0000120644 DANONE 2,7%
31
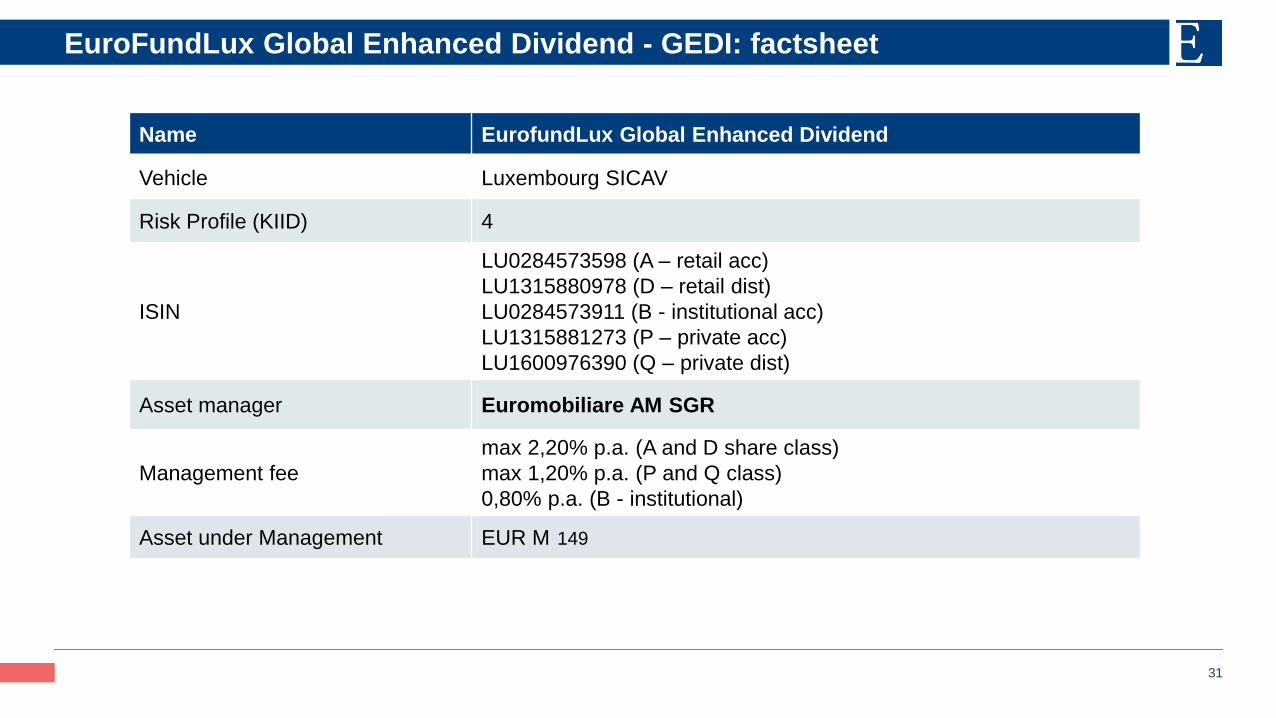
Name EurofundLux Global Enhanced Dividend
Vehicle Luxembourg SICAV
Risk Profile (KIID) 4
ISIN
LU0284573598 (A – retail acc)
LU1315880978 (D – retail dist)
LU0284573911 (B - institutional acc)
LU1315881273 (P – private acc)
LU1600976390 (Q – private dist)
Asset manager Euromobiliare AM SGR
Management fee
max 2,20% p.a. (A and D share class)
max 1,20% p.a. (P and Q class)
0,80% p.a. (B - institutional)
Asset under Management EUR M
EuroFundLux Global Enhanced Dividend - GEDI: factsheet
149

32
Disclaimer
This document is not intended for distribution and is for information purposes only. It is not intended and cannon be construed asan offer or solicitation for the purchase, subscription or sale of any financial instrument or as investment advice. The informationcontained herein are intended solely for professional clients and/or financial intermediaries participating, also through theirrepresentatives or agents, to the presentation mentioned on the cover of this document.
Euromobiliare Asset Management SGR assumes no obligation to update or review the materials included herein regardless ofwhether or not events may occur such as to make an update or review as appropriate.
The information contained in this document are not intended for retail or potential retail clients.
Unless expressly authorized by Euromobiliare Asset Management SGR , the use, reproduction, and/or distribution, in whole or inpart, of the information contained in this document as well as any kind of re-elaboration by the addressees of this document areprohibited.
Euromobiliare Asset Management SGR assumes no liability in the event that this document is make available, even in electronicform, to third parties without its express authorisation.