Poisoning by Race, Gender and Intent in Kansasc.ymcdn.com/sites/ by Race, Gender and Intent in...
23
Poisoning by Race, Gender and Intent in Kansas Dan Dao For Safe States/SAVIR 2013 National For Safe States/SAVIR 2013 National Meeting
Transcript of Poisoning by Race, Gender and Intent in Kansasc.ymcdn.com/sites/ by Race, Gender and Intent in...

Poisoning by Race, Gender and Intent in Kansas
Dan DaoFor Safe States/SAVIR 2013 NationalFor Safe States/SAVIR 2013 National
Meeting


“Drug overdose deaths increased forDrug overdose deaths increased for the 11th consecutive year in 2010”
“Opioid analgesics, such as p goxycodone, hydrocodone, and methadone, were involved in about 3 ,of every 4 pharmaceutical overdose deaths”CDC, Opioids drive continued increase in drug overdose deaths , 02/20/2013

ObjectivesObjectives
• Describe poisoning rates by Race Gender andDescribe poisoning rates by Race, Gender and Intent in Kansas
• How the Injury Surveillance Work Group 7• How the Injury Surveillance Work Group 7 (ISW7, Safe States) work on classifying drugs has changed future poisoning analysishas changed future poisoning analysis

Methods

Full Hospital Discharge Dataset
Centers for Disease Control and Prevention (CDC)Injury Indicators Selection Criteria (2010)Injury Indicators Selection Criteria (2010)
CDC f k f E d G iCDC framework for E‐code Groupings(Cause Coding)
Injury Surveillance Workgroup 7 (ISW7)Framework for Drug Type
Primary E‐CODE used to classify drug type

Methods Cont.Methods Cont.
• Hospital Dischargesosp ta sc a ges– These are stays in the hospital that are 24 hours or longer
• Emergency Department visits, those less than 24 hours, were analyzed but not included in this presentation
– Data is provided to us by the Kansas Hospital p y pAssociation
• Non federal, short stay community or general hospitals in Kansas are not required to report their data to KansasKansas are not required to report their data to Kansas Hospital Association, therefore their databases may not include 100 percent of hospital discharges in Kansas
– Data presented in this analysis are from 2005‐2009Data presented in this analysis are from 2005 2009

Methods Cont. (last one)Methods Cont. (last one)• Cutoff
– A count of 25 HD is used as a cutoff for rate calculation. Subgroups with counts below 25 do not have calculated rates.
• Drug Coding– ISW7 defines 19 drug categories. These 19 categories are
grouped into larger categories in this analysis.• Race Coding
– Not all race groups shown due to small counts– Ethnicity is inclusive within each Race group. For example,
White race group contains both Hispanic White and non‐Hi i WhiHispanic White.
– Asian and Non‐Hawaiian Pacific Islander are combined

RaceSex
Intent

Age-Adjusted (AA) Poisoning Related Hospital Discharge (HD) Rates by Gender, KS 2005-2009
Overall KS 95%CI00k
Overall KS 95%CI90
Rat
e pe
r 10
60
rela
ted
HD
30
A Po
ison
ing
0
Female Male
AA
Female Male
Sex
Source: 2005-2009 Kansas Hospital Discharge Database, Kansas Hospital Assocition
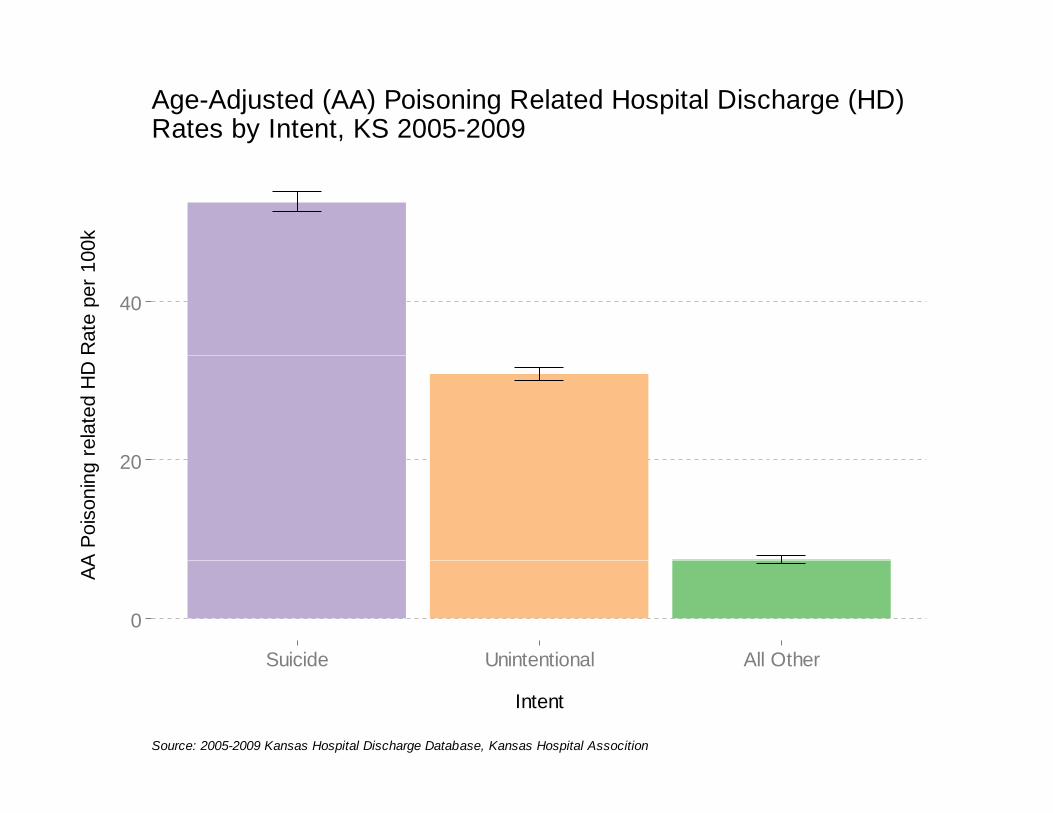
Age-Adjusted (AA) Poisoning Related Hospital Discharge (HD) Rates by Intent, KS 2005-2009
00k
40
Rat
e pe
r 10
20rela
ted
HD
20
A Po
ison
ing
0
Suicide Unintentional All Other
AA
Suicide Unintentional All Other
Intent
Source: 2005-2009 Kansas Hospital Discharge Database, Kansas Hospital Assocition

Age-Adjusted (AA) Poisoning Related Hospital Discharge (HD) Rates by Race, KS 2005-2009
Overall KS 95%CI90
100k
D R
ate
per 1
60
g re
late
d H
D
30
AA P
oiso
ning
0
African-American Asian / NHOPI Native American White
A
African American Asian / NHOPI Native American White
Race
Source: 2005-2009 Kansas Hospital Discharge Database, Kansas Hospital Assocition

Age-Adjusted (AA) Poisoning Related Hospital Discharge (HD) Rates by Gender and Race, KS 2005-2009
African-American White120
k
90
Rat
e pe
r 100
60
elat
ed H
D R
30
Pois
onin
g re
0
F M F M
AA
F M F M
Sex
Source: 2005-2009 Kansas Hospital Discharge Database, Kansas Hospital Assocition

Age-Adjusted (AA) Poisoning Related Hospital Discharge (HD) Rates by Gender and Intent, KS 2005-2009
African-American White
50
k
40
Rat
e pe
r 100
20
30
elat
ed H
D R
10
20
Pois
onin
g re
0
Suicide Unintentional Suicide Unintentional
AA
Suicide Unintentional Suicide Unintentional
Intent
Source: 2005-2009 Kansas Hospital Discharge Database, Kansas Hospital Assocition
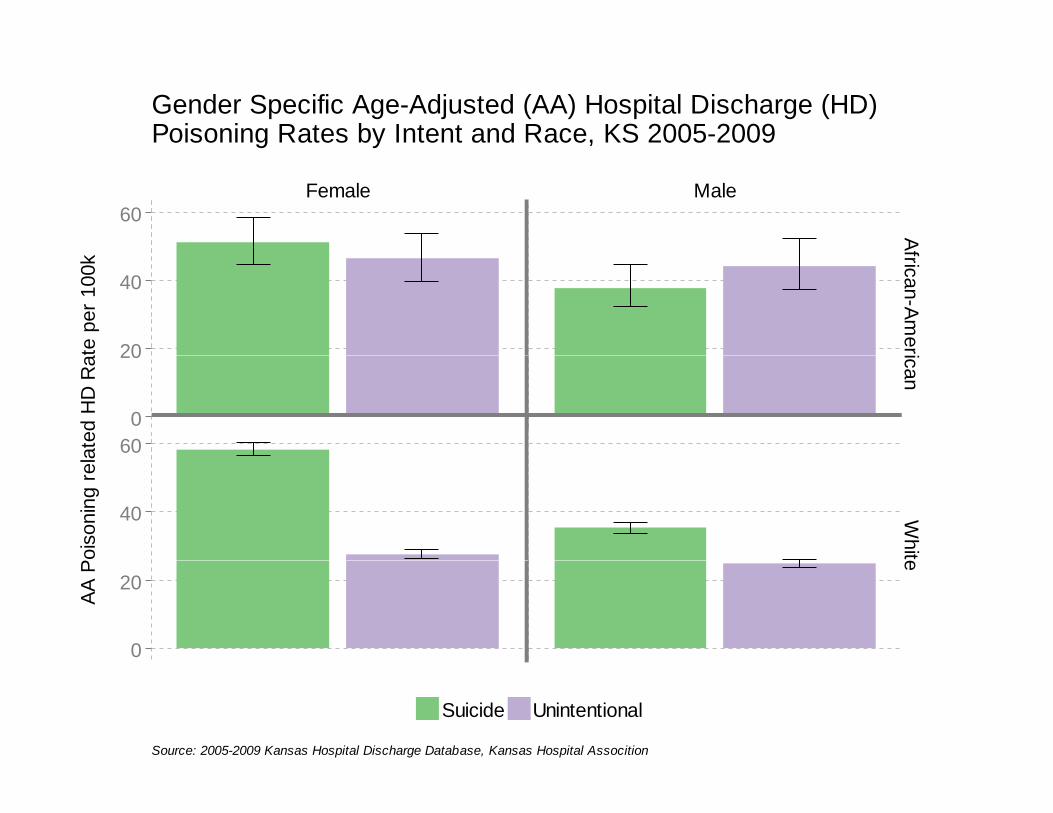
Gender Specific Age-Adjusted (AA) Hospital Discharge (HD)Poisoning Rates by Intent and Race, KS 2005-2009
Female Male60
Af
20
40
frican-Amerte
per
100
k
0
20
60
ican
ated
HD
Ra
40 Whit
Pois
onin
g re
la
0
20
e
AA P
Suicide Unintentional
Source: 2005-2009 Kansas Hospital Discharge Database, Kansas Hospital Assocition

Pink chartUnintentional Poisoning Hospital Discharge (HD) CountsBy Age Group and Race Group, KS 2005-2009Pink chart
African-American White600
nts
75
400ted
HD
Cou
n
50
soni
ng re
lat
25200
entio
nal P
oi
0 0
20 40 60 80 20 40 60 80
Uni
nt
20 40 60 80 20 40 60 80
Age
Source: 2005-2009 Kansas Hospital Discharge Database, Kansas Hospital Assocition

Unintentional Poisoning Hospital Discharge (HD) CountsBy Age Group, Race Group and Drug Type, KS 2005-2009
African-American White600
ount
s
75
400
late
d H
D C
o
50
200Pois
onin
g re
25200
inte
ntio
nal P
0 0
20 40 60 80 20 40 60 80
Age
Un
Age
Other Opiates opioids Cocaine Antidepressants PSY
Source: 2005-2009 Kansas Hospital Discharge Database, Kansas Hospital Assocition
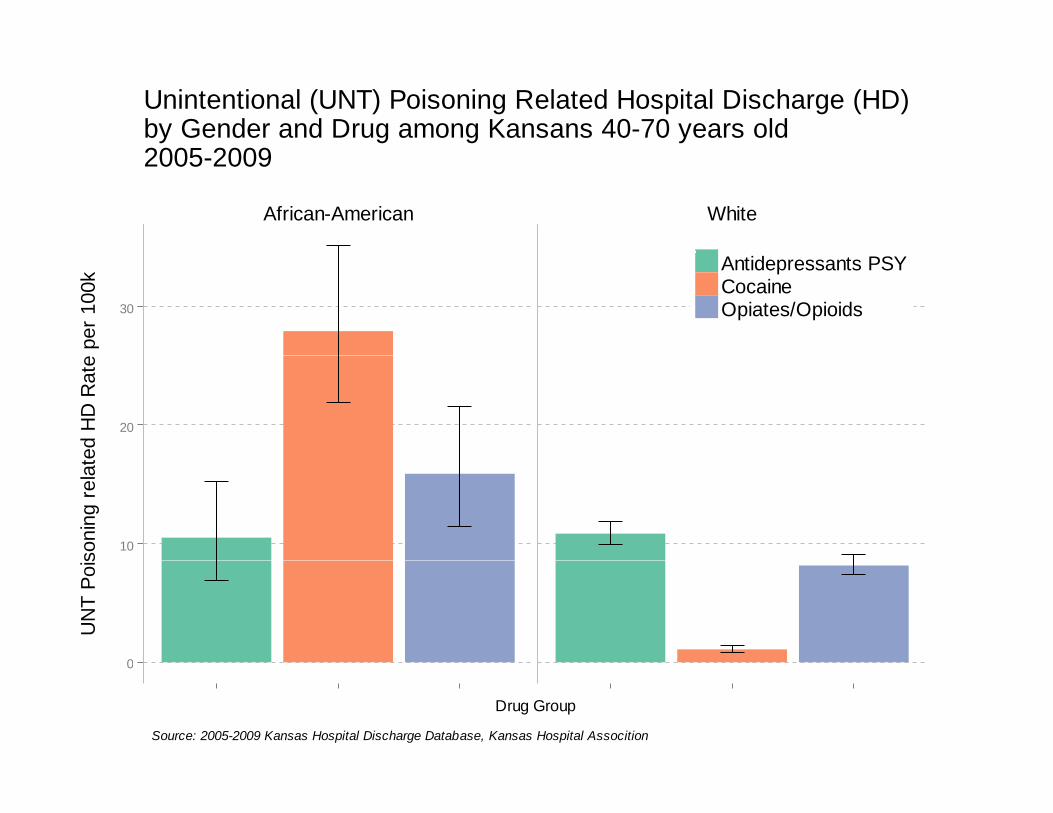
Unintentional (UNT) Poisoning Related Hospital Discharge (HD)by Gender and Drug among Kansans 40-70 years old2005 2009
African-American White
2005-2009
30
per 1
00k Antidepressants PSY
CocaineOpiates/Opioids
20
ed H
D R
ate
10soni
ng re
late
0
UN
T Po
is
0
Drug Group
Source: 2005-2009 Kansas Hospital Discharge Database, Kansas Hospital Assocition
LimitationsLimitations
• Consistency in definitions of “poisoning” hasConsistency in definitions of poisoning has been difficult with so many groups involved.
• Future analysis can include race‐ethnicFuture analysis can include race ethnic combination variable to give clearer measurements (example: Non‐Hispanic White)measurements (example: Non Hispanic White)
• Undercounting could be possible due to only looking at E‐codes to define poisoning, aslooking at E codes to define poisoning, as compared to using any mention of drug type across all diagnosis fields.g

ConclusionsConclusions
• Poisoning related HD rates higher in African‐Americans, g g ,females, and suicide.
• Cocaine poisoning related HD rates in middle age d lt (40 70) i hi h i Af i A iadults (40‐70) is very high in African‐Americans compared to other drug‐race combinations
• Poisoning is a very complex issue that intersects race,Poisoning is a very complex issue that intersects race, intent, sex and age.
• Further subgroup analysis was necessary to pull out a clearer description of the issue.
• Describing drug type adds valuable information to prevention efforts and gives us real focus areasprevention efforts and gives us real focus areas.
Contact Information:
D D MPHDan Dao, [email protected]
Our vision is 'healthy Kansans living in safe and sustainable environments'.