Planning and optimization system for gas ... - neplan.ch · Planning and optimization system for...
22
Planning and optimization system for gas, water and district heating networks Successfully applied all over the world NEPLAN Power System Analysis - one of the most complete planning, optimization and simulation tool for electrical, gas, water and district heating networks Reliable – Efficient – User-friendly
Transcript of Planning and optimization system for gas ... - neplan.ch · Planning and optimization system for...

Planning and optimization system for gas, water and district heating networks
Successfully applied all over the world
NEPLAN Power System Analysis - one of the most complete planning, optimization and simulation tool for electrical, gas, water and district heating networks Reliable – Efficient – User-friendly

Data Management, Interactive Graphics
NEPLAN AG Oberwachtstrasse 2 CH 8700 Küsnacht ZH
Phone +41 44 914 36 66 Fax +41 44 991 19 71 www.neplan.ch
Data management
- All equipment and pipes can be entered graphically and/or table oriented (like in a excel sheet)
- A single line diagram can easily be generated through a very user friendly CAD system.
- There is no restriction on drawing sizes and number of nodes and elements.
- Extensive editing functions like undo, redo, delete, copy, move and zoom for manipulating the network single line diagram are available. A pipe can be moved from a node to a different node without deleting the pipe.
- OLE functionality: Data and graphic can be moved to and from third party software (like MS-Excel, MS-Word). Project documentation has never been easier.
- The element data are entered through dialogs including plausibility of the entered data. A coloring tool helps to show which data fields of the dialog are needed for a certain analysis (e.g. time simulation).
- Integrated Variant Manager (insert, delete, append, compare variants, compare results, etc.).
- ASCII file or SQL database oriented import/export functions for exchanging network data, topology data, load data and single line data are available. That means all data including the graphical data are accessible by the user.
- Interfaces to external programs (e.g. measured data acquisition systems) can be implemented.
- Import of a geographic map as a background graphic, for easier schematic capturing.
- Import of almost any raster and vector graphic files (e.g. PCX and DXF files).
- Graphics can be exported as raster files (e.g. JPG, which can be used in any internet web browser).
- Option for combining and separating networks. Any number of independent network areas and zones are possible. Each element and node may belong to any independent area and zone.
- Extensive functions for network statistics and network documentations are available.
- A state of the art library manager with extensive libraries for each element type facilitates data entry.
- All computation modules access a shared database.
- Integrated chart manager allows analyzing and comparing all results from different variants.
- NEPLAN is available in different languages (e.g. English, French, Spanish, German)

Data Management, Interactive Graphics
NEPLAN AG Oberwachtstrasse 2 CH 8700 Küsnacht ZH
Phone +41 44 914 36 66 Fax +41 44 991 19 71 www.neplan.ch
Variant Management
- Non-redundant storage and management of variants.
- For each network, you may select
- * any desired switch states (topology file)
- * any desired loading states (loading file)
- For each network you can define and store any desired number of variants and sub variants (variant tree). Only the differences from the parent variant are stored in the project.
- Variants can be compared, merged and deleted.
- The diagrams of different projects and variants can be displayed at the same time
- Results from two different variants can be displayed on the diagram in one result label.
- Results of two variants can be compared in the chart manager.
Multi-Diagram and Multi-Layer-Technique
- A network (project) can be entered in several different diagrams (e.g. the high pressure network in one diagram and the low pressure networks in one or more other diagrams.
- Each diagram can have any number of graphic layers. These layers can be colored, locked, hidden or shown (like for example in AutoCAD).
- Zooming into pump stations: in the overview diagram, a station is shown as a black box, while in another diagram it is depicted in detail, with all its equipments.
- Display the main equipments in a separate diagram, to have quick overview of the whole network without zooming around in the big single line diagram.
- Topological linkage of elements over more than one diagram.
- One element can have more than one graphical representation in the same diagram or in different diagrams.
- OLE. Copy/Paste graphic data from and to MS-Word.

Data Management, Interactive Graphics
NEPLAN AG Oberwachtstrasse 2 CH 8700 Küsnacht ZH
Phone +41 44 914 36 66 Fax +41 44 991 19 71 www.neplan.ch
Auxiliary Graphics
- Auxiliary graphics can be used for documenting the diagram. There is no need to export the single line diagram to an other CAD system.
- Input of lines, rectangles, ellipses, arcs, ellipse sections, polygons, poly-lines, any kind of bitmap graphics.
- Input of user text with selectable character set.
- Color for background, foreground, line, outlines and fill patterns is user-selectable.
- Functions available for rendering overlapped symbol elements, rendering, alignment and rotation
Network Diagram Coloring
- Colors and line types can be freely selected.
- Overloaded elements (e.g. v /m/s > vmax m/s) after a calculation are color-highlighted.
- Isolated elements can be highlighted.
- Coloring options to distinguish user-selectable network areas and zones, pressure zones, not feeded networks and separated partial networks.
- Differences to the parent variant or the root net can be colored.
- Each element can be colored individually.
- User defined graphic layers can be colored.
- Coloring according to ranges. Many calculated variables can be colored according to their values (e.g. according to velocities (v m/s) or according to pressure drops)

Data Management, Interactive Graphics
NEPLAN AG Oberwachtstrasse 2 CH 8700 Küsnacht ZH
Phone +41 44 914 36 66 Fax +41 44 991 19 71 www.neplan.ch
Symbol-Editor
- The user can create and define its own symbols for all elements.
- Any number of different symbols per element type or node can be defined.
- All symbols will be displayed while entering the diagram. Just drag and drop the desired symbol to the diagram
- On the diagram the symbols can be flipped, rotated and resized.
SQL Database Connection
- All element data can be imported and exported to any SQL database (like Oracle, MS-Access, etc.)
- The network topology can be stored.
- All graphical data of the elements and nodes can be exported and imported.
- All data of all libraries can be imported and exported.
- Can be used as interface to existing GIS and NIS or DMS/SCADA systems.
- Very flexible storing and import features, like full import or only partial update, storing only the differences of a variant.
- Partial reading of data fields (e.g. import only the pipe length but not the diameter and roughness).
- The database can be simply upgraded to form a NIS using the database functions.

Data Management, Interactive Graphics
NEPLAN AG Oberwachtstrasse 2 CH 8700 Küsnacht ZH
Phone +41 44 914 36 66 Fax +41 44 991 19 71 www.neplan.ch
Library Manager
- A comprehensive library manager is available in NEPLAN.
- For each equipment type a library exists or can be created by the user.
- While entering network data the library data can be accessed. Further more the data entered in the network, can be exported to the library.
- All network data can be updated with changed library data.
- The data can be entered through excel like table sheets.
- Import/export to MS-Excel with drag and drop.
- Import/export to any SQL database. Update functionality from/ to database is provided.
- Part of diagrams with all technical data can be stored in the library.
Chart Manager
- The chart manager allows displaying the results in different chart types (e.g. line, bar, etc.).
- Any number of sub charts can be displayed in one chart.
- A user defined logo (as bitmap) can be added to the header for documentation purposes
- Results from different variants can be compared and displayed in the same chart.
- Export the chart to *.JPG file for any internet browser.
- Copy/Paste to the clipboard for documentation (e.g. MS-Word).

Data Management, Interactive Graphics
NEPLAN AG Oberwachtstrasse 2 CH 8700 Küsnacht ZH
Phone +41 44 914 36 66 Fax +41 44 991 19 71 www.neplan.ch
2.3
7 l/s
Pum
p o
ut
3.5
3 l/s
Res
ervoir
out
2.0
1 l/s
2.3
7 l/s
Pum
p o
ut
3.5
3 l/s
Res
ervoir
out
2.0
1 l/s
1.63 l/sPump out0.47 l/sReservoir out1.99 l/s
1.63 l/sPump out0.47 l/sReservoir out1.99 l/s
2.63 l/s
Pump out
1.47 l/s
Reservoir out
2.99 l/s
2.63 l/s
Pump out
1.47 l/s
Reservoir out
2.99 l/s
5.1
6 l/s
Pum
p o
ut
7.0
1 l/s
Res
ervoir
out
4.4
4 l/s5.1
6 l/s
Pum
p o
ut
7.0
1 l/s
Res
ervoir
out
4.4
4 l/s
5.37 l/s
Pump out
6.53 l/s
Reservoir out
5.01 l/s
5.37 l/s
Pump out
6.53 l/s
Reservoir out
5.01 l/s
9.52 l/s
Pump out
7.34 l/s
Reservoir out
10.30 l/s
9.52 l/s
Pump out
7.34 l/s
Reservoir out
10.30 l/s
8.37 l/sPump out9.53 l/sReservoir out8.01 l/s
8.37 l/sPump out9.53 l/sReservoir out8.01 l/s
P=60.1 mPump outP=48.7 m
Reservoir outP=40.1 m
P=60.1 mPump outP=48.7 m
Reservoir outP=40.1 m
P=60.0 mPump outP=48.4 m
Reservoir outP=40.0 m
P=60.0 mPump outP=48.4 m
Reservoir outP=40.0 m
P=60.3 mPump outP=48.5 m
Reservoir outP=40.4 m
P=60.3 mPump outP=48.5 m
Reservoir outP=40.4 m
P=61.4 mPump outP=50.4 m
Reservoir outP=41.2 m
P=61.4 mPump outP=50.4 m
Reservoir outP=41.2 m
P=60.6 mPump outP=49.4 m
Reservoir outP=40.5 m
P=60.6 mPump outP=49.4 m
Reservoir outP=40.5 m
P=61.7 mPump outP=49.4 m
Reservoir outP=42.0 m
P=61.7 mPump outP=49.4 m
Reservoir outP=42.0 m
P=60.0 mPump outP=48.5 m
Reservoir outP=40.1 m
Leibstadt
Batiaz
Veytaux
Chavalon
La Veyre
Vaux
Banlieu
Foretaille
Mathod
Kerzers
Galmiz
Hauterive
Botterens
Chandolin
Eysins
Stalden
Bitsch
Moerel
Fiesch
Ulrichen
Gstaad
Innertkirchen
Robiei
Bavona
Iragna
BiascaPeccia
Littau
Wimmis
Wattenwil
Cavergno
Avegno
Magadino
GordunoSerra
Ingenbohl
Plattis
Goeschenen
Vallorcine
Ilanz
Rothenbrunnen
Mapragg
Filisur
Montlingen
Moerschwil
Schlattingen
Toess
Wittenwil
Weinfelden
Altgass
Thalwil
Wollishofen
Waldegg
Obfelden
Niederwil
Regensdorf
Pradella
Robbia
Seebach
Auwiesen
Faellanden
Aathal
Birr
Rupp
Sursee
Lindenholz
Oftringen
Ormalingen
Lachmatt
Muenchwilen
Flumenthal
Asphard
Gerlafingen
Pieterlen
Cornier
Gurtweil
Meiningen
Mese
Pallanzeno
Pressy
Koblenz
Engstlatt
Sierentz
Mambeli
Bois Tollot
Piedilago
Musignano
Bulciago
Westtirol
Riet
Sondrio
Ponte
T.Acqua
Valpelline
Avise
Austria
Italy
France
Germany
Visualization of the
results and input data

Data Management, Interactive Graphics
NEPLAN AG Oberwachtstrasse 2 CH 8700 Küsnacht ZH
Phone +41 44 914 36 66 Fax +41 44 991 19 71 www.neplan.ch
HB Erlheim
DEA HöhlPW Paeddemarke
PW Eidinghausen
PW Teichmühle
HB Strother Str.
DEA Kasseler Str.
HB Conti
EQUIPMENT-OVERVIEW
aus Brunnen
Zumischbetrieb
Diagram Equipment
Falleitung v. HB Strotherstr.
HB-Erlheim <- PW Teichmühle
HB Strothe I
HB Strothe II
Ziegelhütter Weg
Ziegelhütter Weg
HB
Erl
hei
m -
> P
W T
eich
mühl
en
Paeddemarke I/II
PW Eidinghausen
HB Conti
An der Strother Straße
Falleitung v. HB Strotherstr.
Ziegelhütter Weg
Ziegelhütter Weg
HB-Erlheim <- PW Teichmühle
HB
Erl
hei
m -
> P
W T
eich
mühl
en
An der Strother Straße
Paeddemarke I/II
PW Eidinghausen
HB Strothe I
HB Conti
HB Strothe II
Strother Str.
Strother Str.
Demand Zone 4a/b
Verbrauchszone 3
Demand Zone 5
65
3
4
2
Demand Zone 1Demand Zone 6
Demand Zone 2
7
1
Overview Demand Zones
Diagram Measurments
Q=185.10 m3/hv=0.71 m/sPl=0.87 m
Q=185.10 m3/hv=0.71 m/sPl=0.87 m
Q=
92.3
0 m
3/h
v=
0.8
1 m
/s
Pl=
0.9
5 m
Q=
92.3
0 m
3/h
v=
0.8
1 m
/s
Pl=
0.9
5 m
Q=47.18 m3/hv=0.33 m/sPl=0.05 m
Q=47.18 m3/hv=0.33 m/sPl=0.05 m
Q=26.31 m3/h
v=0.22 m/s
Pl=0.09 m
Q=26.31 m3/h
v=0.22 m/s
Pl=0.09 m
Q=39.31 m3/hv=0.00 m/sPl=29.03 m
Q=39.31 m3/hv=0.00 m/sPl=29.03 m
Q=102.51 m3/hv=0.00 m/sPl=28.26 m
Q=102.51 m3/hv=0.00 m/sPl=28.26 m
Qcal=0.00 m3/hP=40.8 m
Qcal=0.00 m3/hP=40.8 m
Qcal=0.00 m3/hP=21.6 m
Qcal=0.00 m3/hP=21.6 m
Qcal=1.74 m3/hP=33.4 m
Qcal=1.74 m3/hP=33.4 m
Qcal=0.58 m3/hP=35.9 m
Qcal=0.58 m3/hP=35.9 m
Qcal=0.80 m3/hP=40.9 m
Qcal=0.80 m3/hP=40.9 m
Qcal=1.11 m3/hP=41.2 m
Qcal=1.11 m3/hP=41.2 m
Qcal=3.38 m3/hP=45.1 m
Qcal=3.38 m3/hP=45.1 m
Qcal=0.49 m3/hP=72.6 m
Qcal=0.49 m3/hP=72.6 m
Qcal=0.00 m3/hP=72.0 m
Qcal=0.00 m3/hP=72.0 m
Qcal=0.00 m3/hP=45.2 m
Qcal=0.00 m3/hP=45.2 m
Qcal=0.00 m3/hP=15.3 m
Qcal=0.00 m3/hP=15.3 m
Qcal=0.00 m3/hP=44.3 m
Qcal=0.00 m3/hP=44.3 m
Qcal=0.00 m3/hP=31.4 m
Qcal=0.00 m3/hP=31.4 m
Qcal=0.27 m3/hP=59.7 m
Qcal=0.27 m3/hP=59.7 m
Designed by Gelsenwasser AG

Data Management, Interactive Graphics
NEPLAN AG Oberwachtstrasse 2 CH 8700 Küsnacht ZH
Phone +41 44 914 36 66 Fax +41 44 991 19 71 www.neplan.ch
Data Management, Interactive Graphics
NEPLAN AG Oberwachtstrasse 2 CH 8700 Küsnacht ZH
Phone +41 44 914 36 66 Fax +41 44 991 19 71 www.neplan.ch

Water Pipe Flow Analysis
NEPLAN AG Oberwachtstrasse 2 CH 8700 Küsnacht ZH
Phone +41 44 914 36 66 Fax +41 44 991 19 71 www.neplan.ch
General Characteristics
- Powerful, up-to-date calculation algorithms (including Newton-Raphson and Hardy-Cross)
- Simulation of any kind and size of networks
- No restriction on number of nodes and elements
- Simultaneous calculation of any number of partial networks (independent networks)
- Calculation with load factor profiles (day, week, season, weekdays, Sundays, long term, etc.)
- Import of measured consumption data
- Changing demands through global, regional or simultaneity load factors
- To each pipe any number of line loads can be connected (e.g. houses, industrial , ...)
- Calculation of centrifugal and circulation pumps, reservoirs, valves, fittings etc.
- Sophisticated valve models
- Calculation of multiple pumps, tanks and reservoirs
- Calculation with different water temperatures
- The head loss characteristics of the pipes are calculated according to Darcy, Prandtl-Colebrook and Hagen-Poiseuille
- Time dependent load and reservoir height characteristics (e.g. at night, or at noon, summer, winter etc.)
Q=245.67 m3/h
v=0.88 m/s
Pl=0.43 m
Q=225.16 m3/hv=0.51 m/sPl=0.01 m
HB Strothe IQ=0.00 m3/hv=0.00 m/sPl=0.00 m
HB Strothe IIQ=0.00 m3/hv=0.00 m/sPl=0.00 m
Qcal=0.00 m3/hP=5.2 m
Qcal=0.00 m3/hP=7.6 m
Qcal=0.00 m3/hP=5.2 m
Qcal=0.00 m3/hP=3.0 m
Q=245.67 m3/h
v=0.88 m/s
Pl=0.43 m
Q=225.16 m3/hv=0.51 m/sPl=0.01 m
HB Strothe IQ=0.00 m3/hv=0.00 m/sPl=0.00 m
HB Strothe IIQ=0.00 m3/hv=0.00 m/sPl=0.00 m
Qcal=0.00 m3/hP=5.2 m
Qcal=0.00 m3/hP=7.6 m
Qcal=0.00 m3/hP=5.2 m
Qcal=0.00 m3/hP=3.0 m
Water Pipe Flow Analysis
NEPLAN AG Oberwachtstrasse 2 CH 8700 Küsnacht ZH
Phone +41 44 914 36 66 Fax +41 44 991 19 71 www.neplan.ch
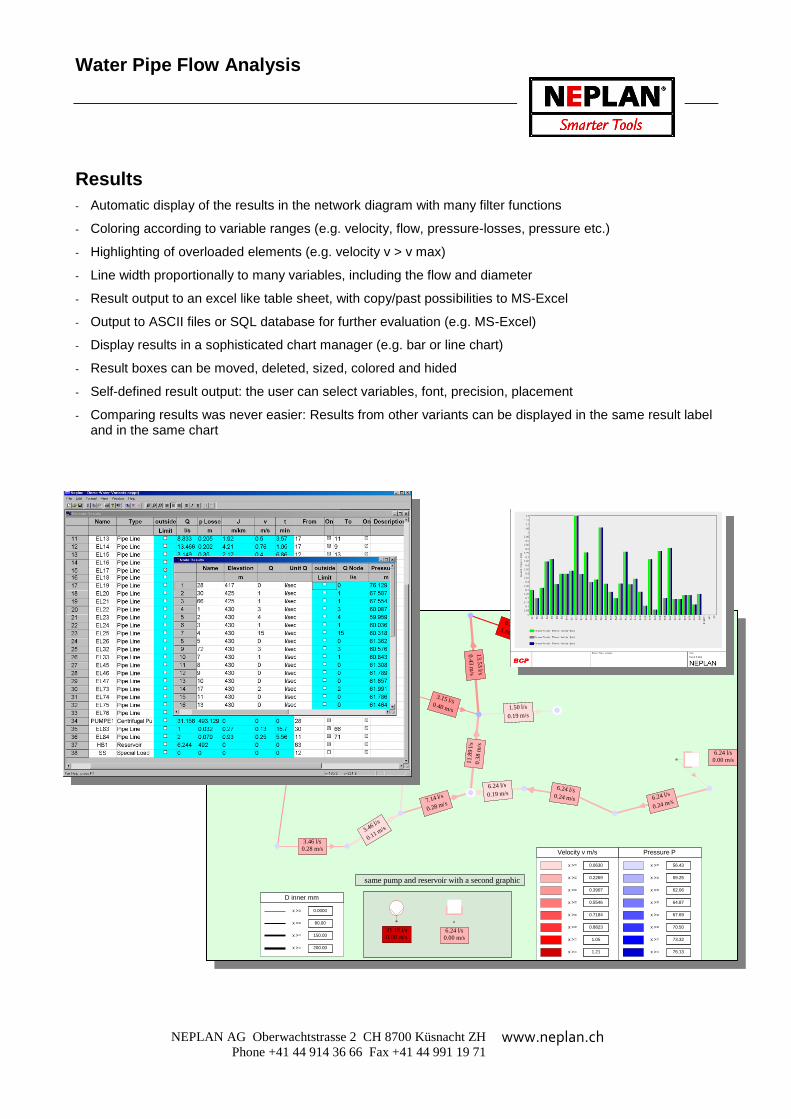
Results
- Automatic display of the results in the network diagram with many filter functions
- Coloring according to variable ranges (e.g. velocity, flow, pressure-losses, pressure etc.)
- Highlighting of overloaded elements (e.g. velocity v > v max)
- Line width proportionally to many variables, including the flow and diameter
- Result output to an excel like table sheet, with copy/past possibilities to MS-Excel
- Output to ASCII files or SQL database for further evaluation (e.g. MS-Excel)
- Display results in a sophisticated chart manager (e.g. bar or line chart)
- Result boxes can be moved, deleted, sized, colored and hided
- Self-defined result output: the user can select variables, font, precision, placement
- Comparing results was never easier: Results from other variants can be displayed in the same result label and in the same chart
5.37 l/s
0.68 m/s5.37 l/s
0.68 m/s
3.15 l/s0.40 m/s
3.15 l/s0.40 m/s
13.5
3 l/s
0.4
3 m
/s13.5
3 l/s
0.4
3 m
/s
8.37 l/s1.06 m/s
8.37 l/s1.06 m/s
11.8
9 l/s
0.3
8 m
/s
11.8
9 l/s
0.3
8 m
/s
7.14 l/s
0.28 m/s7.14 l/s
0.28 m/s
3.6
8 l/s
0.2
0 m
/s
3.6
8 l/s
0.2
0 m
/s
6.8
3 l/s
0.3
8 m
/s6.8
3 l/s
0.3
8 m
/s
2.9
6 l/s
0.3
7 m
/s
3.4
6 l/s
0.4
4 m
/s
3.4
6 l/s
0.4
4 m
/s
3.46 l/s
0.28 m/s
3.46 l/s
0.28 m/s
3.46 l/s
0.11 m/s3.46 l/s
0.11 m/s
6.4
2 l/s
0.2
0 m
/s
6.4
2 l/s
0.2
0 m
/s
6.42 l/s
0.82 m/s
6.42 l/s
0.82 m/s
1.50 l/s
0.19 m/s
1.50 l/s
0.19 m/s
6.24 l/s
0.19 m/s6.24 l/s
0.19 m/s6.24 l/s
0.24 m/s
6.24 l/s0.24 m/s 6.24 l/s
0.24 m/s6.24 l/s
0.24 m/s
2.0
0 l/s
0.2
5 m
/s
2.0
0 l/s
0.2
5 m
/s
6.24 l/s
0.00 m/s
6.24 l/s
0.00 m/s
0.00 l/s
0.00 m/s
0.00 l/s
0.00 m/s
P=60.1 mP=60.1 m
P=61.4 mP=61.4 m
P=60.6 mP=60.6 m
P=61.8 mP=61.8 m
P=61.5 mP=61.5 m
P=56.6 mP=56.6 m
P=56.6 mP=56.6 m
P=57.7 mP=57.7 m
P=56.8 mP=56.8 mP=56.6 mP=56.6 m
P=58.1 mP=58.1 m
P=56.4 mP=56.4 m
P=56.7 mP=56.7 m
P=56.7 mP=56.7 m
P=56.7 mP=56.7 m
P=76.1 mP=76.1 m
P=57.0 mP=57.0 m
P=61.7 mP=61.7 m
Velocity v m/s
x >= 0.06300.0630
x >= 0.22690.2269
x >= 0.39070.3907
x >= 0.55460.5546
x >= 0.71840.7184
x >= 0.88230.8823
x >= 1.051.05
x >= 1.211.21
Pressure P
x >= 56.4356.43
x >= 59.2559.25
x >= 62.0662.06
x >= 64.8764.87
x >= 67.6967.69
x >= 70.5070.50
x >= 73.3273.32
x >= 76.1376.13
D inner mm
x >= 0.00000.0000
x >= 80.0080.00
x >= 150.00150.00
x >= 200.00200.00
31.16 l/s
0.00 m/s
31.16 l/s
0.00 m/s6.24 l/s
0.00 m/s
6.24 l/s
0.00 m/s
same pump and reservoir with a second graphic

Gas Pipe Flow Analysis
NEPLAN AG Oberwachtstrasse 2 CH 8700 Küsnacht ZH
Phone +41 44 914 36 66 Fax +41 44 991 19 71 www.neplan.ch
General Characteristics
- Powerful, up-to-date calculation algorithms (including Newton-Raphson and Hardy-Cross)
- Simulation of any kind and size of networks
- No restriction on number of nodes and pipes
- Simultaneous calculation of any number of partial networks (independent networks)
- Sophisticated valve and regulator models
- Calculation with load factor profiles and profiles for node demands
- Import of measured consumption data
- Changing demands through global, regional or simultaneity load factors
- To each pipe any number of line loads can be connected (e.g. houses, heating, industrial , ...)
- The head loss characteristics of the pipes are calculated according to Darcy, Prandtl-Colebrook and Hagen-Poiseuille
- Simultaneous calculation of different pressure zones (high, medium and low pressure).
- Simultaneous calculation of compressible and incompressible gases (high and low pressure)
- Free definition of load libraries (heating, cookers, industrial loads, ...) with different simultaneity factors
- Temperature dependent loads are considered
Pipe-11Q=76.50 m3/h
v=2.65 m/sPl=1.91 mbar
HP-Node-1Qcal=4.42 km3/h
P=19.6 barBuoy=0.00 mbar
HP-Node-1Qcal=4.42 km3/h
P=19.6 barBuoy=0.00 mbar
LP-Node-1Qcal=11.50 m3/h
P=22.0 mbarBuoy=0.00 mbar
LP-Node-1Qcal=11.50 m3/h
P=22.0 mbarBuoy=0.00 mbar
Reduction-2regulated
Q=88.00 m3/hv=0.00 m/s
Pl=22.00 mbar
Reduction-2regulated
Q=88.00 m3/hv=0.00 m/s
Pl=22.00 mbar
High Pressure (25 bar) Low Pressure (22 mbar)

Gas Pipe Flow Analysis
NEPLAN AG Oberwachtstrasse 2 CH 8700 Küsnacht ZH
Phone +41 44 914 36 66 Fax +41 44 991 19 71 www.neplan.ch
Results
- Automatic display of the results in the network diagram with many filter functions
- Coloring according to variable ranges (e.g. velocity, flow, pressure-losses, pressure etc.)
- Highlighting of overloaded elements (e.g. velocity v > v max)
- Line width proportionally to many variables, including the flow and diameter
- Result output to an excel like table sheet, with copy/past possibilities to MS-Excel
- Output to ASCII files or SQL database for further evaluation (e.g. MS-Excel)
- Display results in a sophisticated chart manager (e.g. bar or line chart)
- Result boxes can be moved, deleted, sized, colored and hided
- Self-defined result output: the user can select units, variables, font, precision, placement
- Comparing results was never easier: Results from other variants can be displayed in the same result label and in the same chart
Water Time Simulation
NEPLAN AG Oberwachtstrasse 2 CH 8700 Küsnacht ZH
Phone +41 44 914 36 66 Fax +41 44 991 19 71 www.neplan.ch
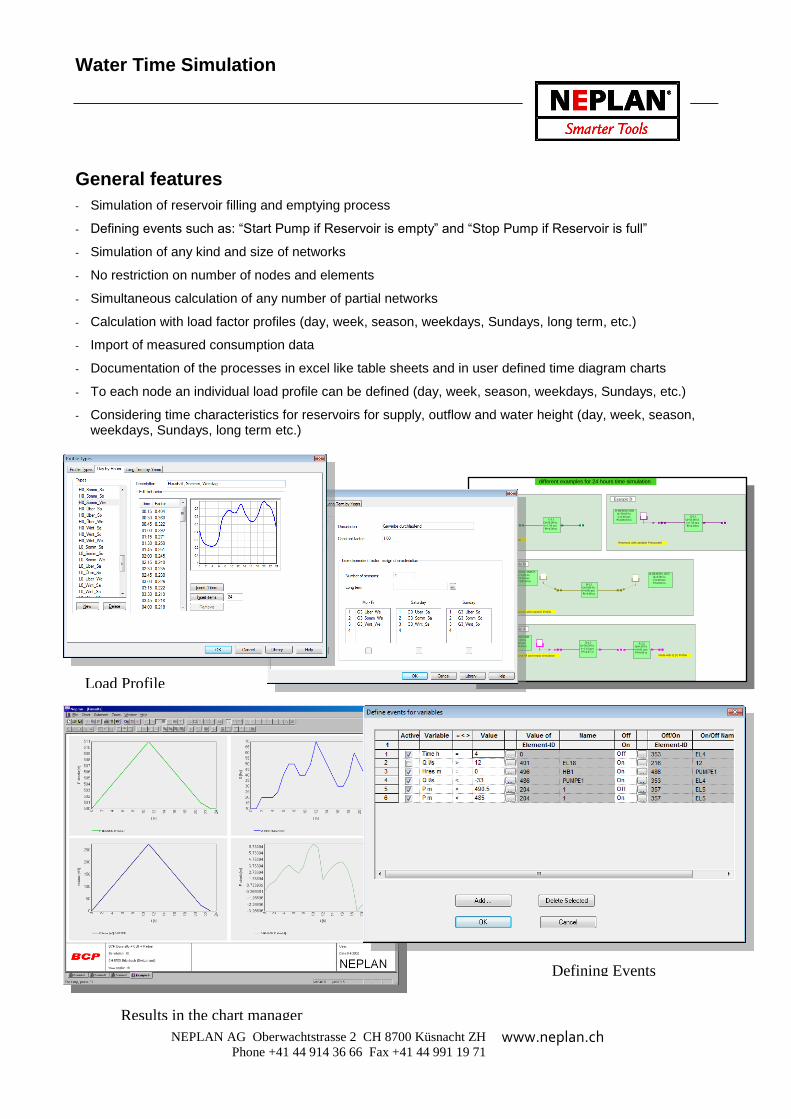
General features
- Simulation of reservoir filling and emptying process
- Defining events such as: “Start Pump if Reservoir is empty” and “Stop Pump if Reservoir is full”
- Simulation of any kind and size of networks
- No restriction on number of nodes and elements
- Simultaneous calculation of any number of partial networks
- Calculation with load factor profiles (day, week, season, weekdays, Sundays, long term, etc.)
- Import of measured consumption data
- Documentation of the processes in excel like table sheets and in user defined time diagram charts
- To each node an individual load profile can be defined (day, week, season, weekdays, Sundays, etc.)
- Considering time characteristics for reservoirs for supply, outflow and water height (day, week, season, weekdays, Sundays, long term etc.)
different examples for 24 hours time simulation
Node with Q (t) Profile
Reservoir with Qsim(t) Profile
Reservoir fill and empty simulation
Reservoir fill and empty simulation
with variable supply(t)Reservoir with variable Pressure(t)
A-L1Q=50.50 l/sv=1.61 m/sPl=4.47 m
A-L1Q=50.50 l/sv=1.61 m/sPl=4.47 m
A-L2Q=0.50 l/sv=0.01 m/sPl=0.00 m
A-L2Q=0.50 l/sv=0.01 m/sPl=0.00 m
B-L1Q=0.00 l/sv=0.00 m/sPl=0.00 m
B-L1Q=0.00 l/sv=0.00 m/sPl=0.00 m
C-L1Q=50.00 l/sv=1.59 m/sPl=4.38 m
C-L1Q=50.00 l/sv=1.59 m/sPl=4.38 m
D-L1Q=50.00 l/sv=1.59 m/sPl=4.38 m
D-L1Q=50.00 l/sv=1.59 m/sPl=4.38 m
A-RESERVOIRQ=50.50 l/sv=0.00 m/s
Pl=600.00 m
A-RESERVOIRQ=50.50 l/sv=0.00 m/s
Pl=600.00 m
B-RESERV-INPUTQ=0.00 l/sv=0.00 m/s
Pl=600.00 m
B-RESERV-INPUTQ=0.00 l/sv=0.00 m/s
Pl=600.00 m
B-RESERV-OUTQ=0.00 l/sv=0.00 m/sPl=0.00 m
B-RESERV-OUTQ=0.00 l/sv=0.00 m/sPl=0.00 m
C-RESERVOIRQ=50.00 l/sv=0.00 m/s
Pl=600.00 m
C-RESERVOIRQ=50.00 l/sv=0.00 m/s
Pl=600.00 m
D-RESERVOIRQ=50.00 l/sv=0.00 m/s
Pl=600.00 m
D-RESERVOIRQ=50.00 l/sv=0.00 m/s
Pl=600.00 m
A-N2-Q-50Qcal=50.00 l/s
P=95.5 m
A-N2-Q-50Qcal=50.00 l/s
P=95.5 m
A-N2-Q-PROFILEQcal=0.50 l/s
P=95.5 m
A-N2-Q-PROFILEQcal=0.50 l/s
P=95.5 m
C-N2-Q-50Qcal=50.00 l/s
P=95.6 m
C-N2-Q-50Qcal=50.00 l/s
P=95.6 m
D-N2-Q-50Qcal=50.00 l/s
P=95.6 m
D-N2-Q-50Qcal=50.00 l/s
P=95.6 m
A-N1Qcal=0.00 l/sP=100.0 m
A-N1Qcal=0.00 l/sP=100.0 m
B-N1Qcal=0.00 l/s
P=0.0 m
B-N1Qcal=0.00 l/s
P=0.0 m
B-N2Qcal=0.00 l/s
P=0.0 m
B-N2Qcal=0.00 l/s
P=0.0 m
C-N1Qcal=0.00 l/sP=100.0 m
C-N1Qcal=0.00 l/sP=100.0 m
D-N1Qcal=0.00 l/s
P=100.0 m
D-N1Qcal=0.00 l/s
P=100.0 m
Example A
Example B
Example C Example D
Defining Events
Results in the chart manager
Load Profile

Water/Gas/Heating Interactive Distribution
NEPLAN AG Oberwachtstrasse 2 CH 8700 Küsnacht ZH
Phone +41 44 914 36 66 Fax +41 44 991 19 71 www.neplan.ch
Interactive Distribution, Portion of Feeders
- Display the minimal and maximal time which the gas/water has to flow from any user defined starting node to all other nodes in the diagram.
- Interactive distribution: Interactive animation of the gas / water / district heating flow through the network (evaluation of water pollution, evaluation of gas odorization). The user can see interactively how the gas/water flows through the network.
- Portion of feeders: Evaluation of the mixture of the medium for every consumer. Each consumer knows exactly from which feeding element (pump, reservoir, compressor or regulator) the gas/water/district heating is supplied. The portion from each feeding element will be displayed in the label of each node of the network.

Water/Gas/Heating 2D-Profile
NEPLAN AG Oberwachtstrasse 2 CH 8700 Küsnacht ZH
Phone +41 44 914 36 66 Fax +41 44 991 19 71 www.neplan.ch
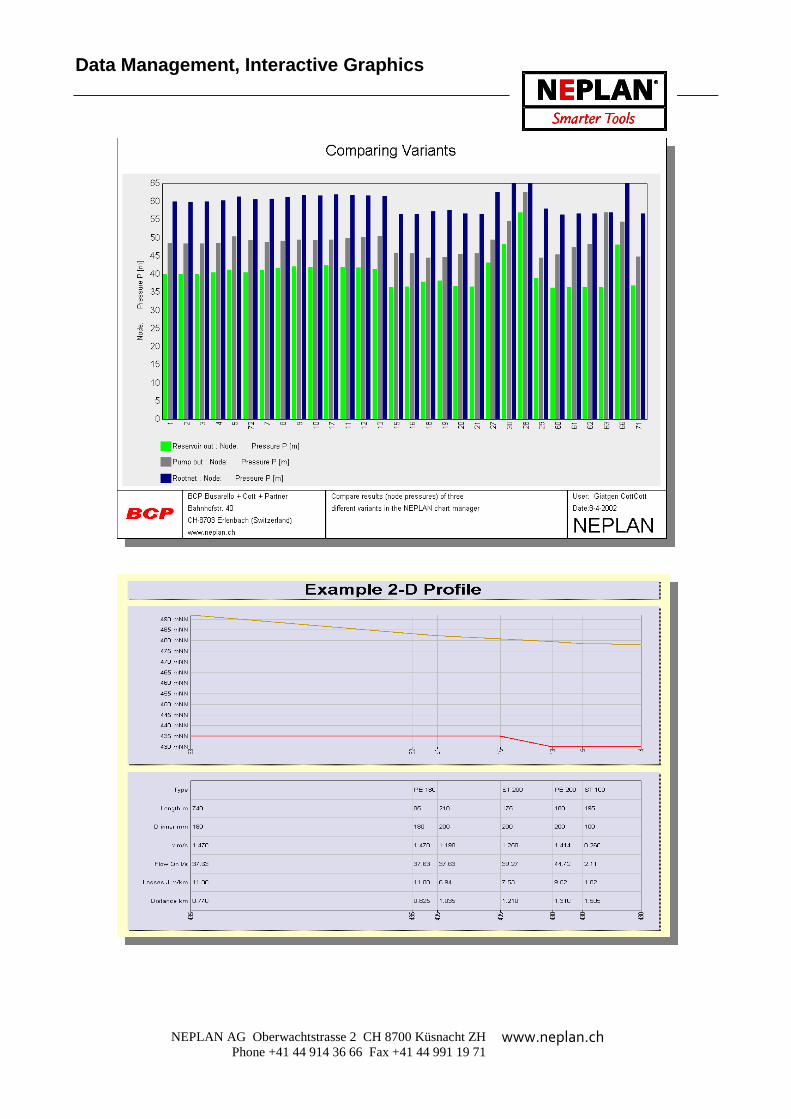
2D-Profiles
- Display a two dimensional profile in a chart of any selected pipes in the network
- Copy/Paste to the clipboard for documentation in MS-Word
- Color the selected pipes in the diagram
- The elevation and the absolute pressure is displayed in the chart
- The chart displays the correct proportion of the line length and the elevation
- Export the chart to a *.JPG file for any internet browser

Fire Fighting Water Plan
NEPLAN AG Oberwachtstrasse 2 CH 8700 Küsnacht ZH
Phone +41 44 914 36 66 Fax +41 44 991 19 71 www.neplan.ch
- Automatic calculation of all node pressures with a given fire water demand Q
- Automatic calculation of all fire water demands of all nodes with a given node pressure P
- Coloring the diagram according to the results (demand Q or pressure P)
- Display the results in Excel like list format for user defined report generation
- Display the result in charts (with copy/paste possibility to MS-Word)
- Calculate all relevant data for one fire fighting water case (e.g. max. velocity and the respective pipe, min pressure and the respective node etc.)
8.10 m3/h
60.9 m
Qlösch=48.00 m3/h
Plösch=54.5 m
Pmin=54.1 m
IDPmin=228
Vmax=1.81 m/s
IDVmax=397
10.80 m3/h
60.8 m
Qlösch=48.00 m3/h
Plösch=53.9 m
Pmin=53.9 m
IDPmin=205
Vmax=1.69 m/s
IDVmax=397
2.70 m3/h
60.9 m
Qlösch=48.00 m3/h
Plösch=54.3 m
Pmin=54.1 m
IDPmin=228
Vmax=1.55 m/s
IDVmax=397
40.50 m3/h
61.0 m
Qlösch=48.00 m3/h
Plösch=56.8 m
Pmin=54.1 m
IDPmin=228
Vmax=1.52 m/s
IDVmax=377
0.00 m3/h
61.6 m
Qlösch=48.00 m3/h
Plösch=58.8 m
Pmin=54.0 m
IDPmin=228
Vmax=1.02 m/s
IDVmax=377
8.10 m3/h
61.2 m
Qlösch=48.00 m3/h
Plösch=56.1 m
Pmin=54.0 m
IDPmin=228
Vmax=2.03 m/s
IDVmax=397
2.70 m3/h
61.3 m
Qlösch=48.00 m3/h
Plösch=55.3 m
Pmin=54.2 m
IDPmin=228
Vmax=1.29 m/s
IDVmax=377
0.00 m3/h
61.6 m
Qlösch=48.00 m3/h
Plösch=56.2 m
Pmin=54.2 m
IDPmin=228
Vmax=1.26 m/s
IDVmax=369
0.00 m3/h
61.9 m
Qlösch=48.00 m3/h
Plösch=58.7 m
Pmin=54.2 m
IDPmin=233
Vmax=1.21 m/s
IDVmax=385
0.00 m3/h
61.8 m
Qlösch=48.00 m3/h
Plösch=58.3 m
Pmin=54.2 m
IDPmin=233
Vmax=1.17 m/s
IDVmax=385
5.40 m3/h
62.0 m
Qlösch=48.00 m3/h
Plösch=59.2 m
Pmin=54.2 m
IDPmin=233
Vmax=0.85 m/s
IDVmax=397
0.00 m3/h
61.9 m
Qlösch=48.00 m3/h
Plösch=59.1 m
Pmin=54.1 m
IDPmin=233
Vmax=0.86 m/s
IDVmax=377
0.00 m3/h
61.7 m
Qlösch=48.00 m3/h
Plösch=59.0 m
Pmin=54.0 m
IDPmin=228
Vmax=0.97 m/s
IDVmax=377
4.05 m3/h
56.8 m
Qlösch=48.00 m3/h
Plösch=54.4 m
Pmin=54.3 m
IDPmin=228
Vmax=0.92 m/s
IDVmax=377
0.00 m3/h
56.8 m
Qlösch=48.00 m3/h
Plösch=54.4 m
Pmin=54.3 m
IDPmin=228
Vmax=0.91 m/s
IDVmax=377
0.00 m3/h
57.2 m
Qlösch=48.00 m3/h
Plösch=54.2 m
Pmin=54.2 m
IDPmin=233
Vmax=0.85 m/s
IDVmax=397
0.00 m3/h
57.4 m
Qlösch=48.00 m3/h
Plösch=54.0 m
Pmin=54.0 m
IDPmin=221
Vmax=1.01 m/s
IDVmax=453
0.00 m3/h
56.9 m
Qlösch=48.00 m3/h
Plösch=53.5 m
Pmin=53.5 m
IDPmin=222
Vmax=0.89 m/s
IDVmax=377
0.00 m3/h
56.8 m
Qlösch=48.00 m3/h
Plösch=54.3 m
Pmin=54.3 m
IDPmin=228
Vmax=0.91 m/s
IDVmax=377
3.78 m3/h
62.4 m
Qlösch=48.00 m3/h
Plösch=59.3 m
Pmin=54.2 m
IDPmin=233
Vmax=0.85 m/s
IDVmax=397
2.70 m3/h
67.4 m
Qlösch=48.00 m3/h
Plösch=63.9 m
Pmin=54.2 m
IDPmin=233
Vmax=0.85 m/s
IDVmax=397
0.00 m3/h
57.7 m
Qlösch=48.00 m3/h
Plösch=54.4 m
Pmin=54.3 m
IDPmin=233
Vmax=0.84 m/s
IDVmax=3974.05 m3/h
56.7 m
Qlösch=48.00 m3/h
Plösch=51.8 m
Pmin=51.8 m
IDPmin=228
Vmax=1.84 m/s
IDVmax=457
0.00 m3/h
56.8 m
Qlösch=48.00 m3/h
Plösch=54.7 m
Pmin=54.6 m
IDPmin=228
Vmax=0.92 m/s
IDVmax=377
0.00 m3/h
56.8 m
Qlösch=48.00 m3/h
Plösch=54.9 m
Pmin=54.8 m
IDPmin=228
Vmax=0.92 m/s
IDVmax=377
2.70 m3/h
67.3 m
Qlösch=48.00 m3/h
Plösch=59.7 m
Pmin=54.2 m
IDPmin=233
Vmax=1.79 m/s
IDVmax=473
5.40 m3/h
56.8 m
Qlösch=48.00 m3/h
Plösch=50.8 m
Pmin=50.8 m
IDPmin=233
Vmax=1.89 m/s
IDVmax=477
0.00 m3/h
75.7 m
Qlösch=0.0 m3/h
Plösch=0.0 m
Pmin=0.0 m
IDPmin=0
Vmax=0.0 m/s
IDVmax=0
0.00 m3/h
57.0 m
Qlösch=0.0 m3/h
Plösch=0.0 m
Pmin=0.0 m
IDPmin=0
Vmax=0.0 m/s
IDVmax=0
0.00 m3/h
61.8 m
Qlösch=48.00 m3/h
Plösch=59.2 m
Pmin=54.2 m
IDPmin=233
Vmax=0.88 m/s
IDVmax=377
BCP Busarello + Cott + Partner AG 12-Aug-2003
Rootnet
Fire fighting water planwith fixed consumption Q = 48 m3/h.
created
changed
Bahnhofstr. 40
CH-8703 Erlenbach (Switzerland)
www.neplan.ch
Project: Demo-FireWater-QFix.nepprj
Variant:
changed
changed
changed
NEPLAN
Date:
Fire fighting water planwith fixed consumption Q = 48 m3/h.
Coloring according to node pressure P [m]
P Löschwasser
x >= 50.8350.83
x >= 52.7052.70
x >= 54.5754.57
x >= 56.4456.44
x >= 58.3158.31
x >= 60.1860.18
x >= 62.0562.05
x >= 63.9263.92
P Fire fighting
x >= 50.8350.83
x >= 52.7052.70
x >= 54.5754.57
x >= 56.4456.44
x >= 58.3158.31
x >= 60.1860.18
x >= 62.0562.05
x >= 63.9263.92
District Heating Analysis
NEPLAN AG Oberwachtstrasse 2 CH 8700 Küsnacht ZH
Phone +41 44 914 36 66 Fax +41 44 991 19 71 www.neplan.ch
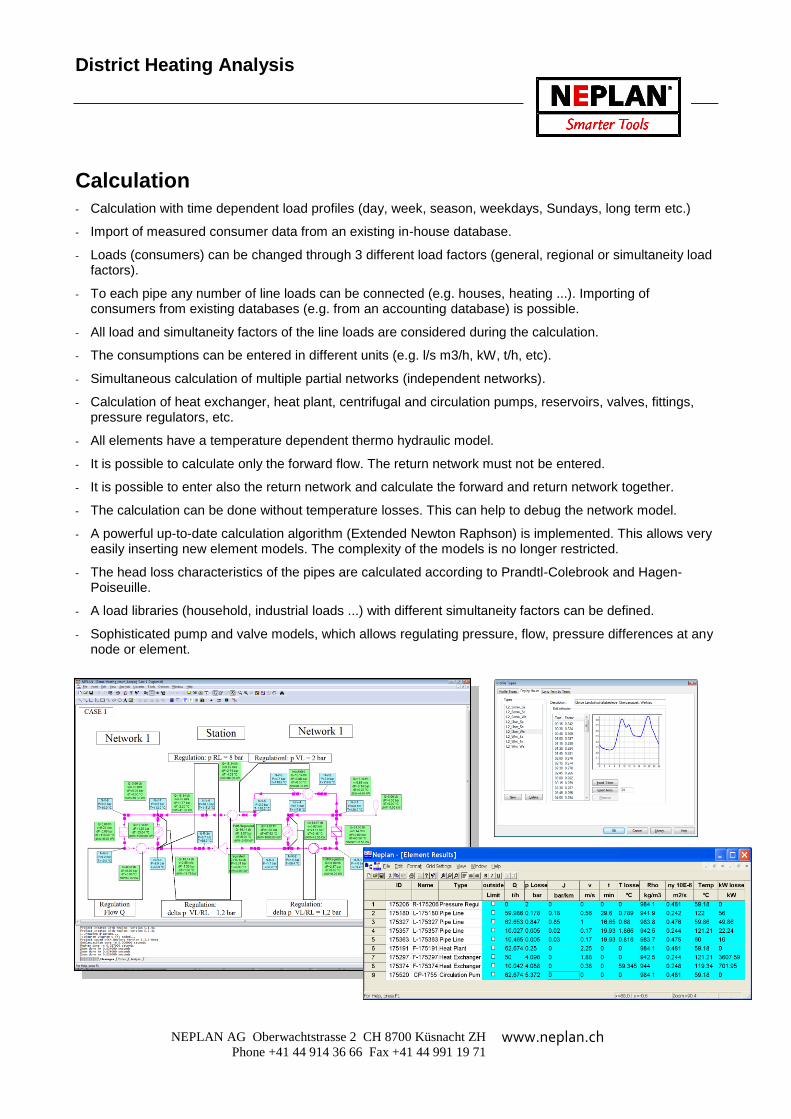
Calculation
- Calculation with time dependent load profiles (day, week, season, weekdays, Sundays, long term etc.)
- Import of measured consumer data from an existing in-house database.
- Loads (consumers) can be changed through 3 different load factors (general, regional or simultaneity load factors).
- To each pipe any number of line loads can be connected (e.g. houses, heating ...). Importing of consumers from existing databases (e.g. from an accounting database) is possible.
- All load and simultaneity factors of the line loads are considered during the calculation.
- The consumptions can be entered in different units (e.g. l/s m3/h, kW, t/h, etc).
- Simultaneous calculation of multiple partial networks (independent networks).
- Calculation of heat exchanger, heat plant, centrifugal and circulation pumps, reservoirs, valves, fittings, pressure regulators, etc.
- All elements have a temperature dependent thermo hydraulic model.
- It is possible to calculate only the forward flow. The return network must not be entered.
- It is possible to enter also the return network and calculate the forward and return network together.
- The calculation can be done without temperature losses. This can help to debug the network model.
- A powerful up-to-date calculation algorithm (Extended Newton Raphson) is implemented. This allows very easily inserting new element models. The complexity of the models is no longer restricted.
- The head loss characteristics of the pipes are calculated according to Prandtl-Colebrook and Hagen-Poiseuille.
- A load libraries (household, industrial loads ...) with different simultaneity factors can be defined.
- Sophisticated pump and valve models, which allows regulating pressure, flow, pressure differences at any node or element.

District Heating Analysis
NEPLAN AG Oberwachtstrasse 2 CH 8700 Küsnacht ZH
Phone +41 44 914 36 66 Fax +41 44 991 19 71 www.neplan.ch
Results
- Automatic display of the results in the network diagram with many filter functions
- Coloring according to variable ranges (e.g. velocity, flow, pressure-losses, pressure etc.)
- Highlighting of overloaded elements (e.g. velocity v > v max)
- Line width proportionally to many variables, including the flow and diameter
- Result output to an excel like table sheet, with copy/past possibilities to MS-Excel
- Output to ASCII files or SQL database for further evaluation (e.g. MS-Excel)
- Display results in a sophisticated chart manager (e.g. bar or line chart)
- Result boxes can be moved, deleted, sized, colored and hided
- Self-defined result output: the user can select units, variables, font, precision, placement
- Comparing results was never easier: Results from other variants can be displayed in the same result label and in the same chart
- Display the temperature, temperature losses and power losses in the diagram and in excel like table sheet
Diagram with
Temperature dependent medium (water) table
Chart with all node pressures
1) Visualization of the temperature
distribution
2) Pipes with high velocities are
especially highlighted, to give the user
a quick overview about the weak
points in the network

Additional Modules Application: Gas – Water – District Heating
NEPLAN AG Oberwachtstrasse 2 CH 8700 Küsnacht ZH
Phone +41 44 914 36 66 Fax +41 44 991 19 71 www.neplan.ch
Height Interpolation
- A sophisticated height interpolation module is able to interpolate the heights (elevations) of the nodes with only a few given predefined heights. These heights can be defined either in some selected nodes, or with a few height reference elements or even from an external XYZ ASCII file.
Line Length Calculation
- The line length calculation module calculates the line length according to the real coordinates of the pipes and the scale of the diagram.
Investment Analysis
- The "Investment analysis" module is available, which calculates the investments according to a present time model.
Auto-Router
- If only the topological data of a network is available without the graphic, then it is possible to use the "Auto-Router" module, which creates the layout of the single line diagram automatically.
Height Interpolation Parameters
Auto-Router Module
Sophisticated Height Interpolation Module

NEPLAN Programming Library (NPL) Application: Gas – Water – District Heating
NEPLAN AG Oberwachtstrasse 2 CH 8700 Küsnacht ZH
Phone +41 44 914 36 66 Fax +41 44 991 19 71 www.neplan.ch
//C ++ NPL Programm
void RunTestNPL()
{
//Open a NEPLAN project file
OpenNeplanProject(_T("NeplanDemoProject.nepprj"));
//run initial load flow
RunAnalysisLF();
//change the line length of line 'Line-1' to 0.5 km
unsigned long ElementID=0;
GetElementByName(_T("LINE"),_T("Line-1"), ElementID);
if (ElementID > 0)
SetParameterDouble(ElementID, _T("Length"), 0.5);
//run load flow with changed line length
RunAnalysisLF();
}
This colour means these are C++ NPL library functions
NPL – C++ Program example
NPL - NEPLAN Programming Library
The NPL – NEPLAN Programming Library is a C/C++ API library, which includes functions to access NEPLAN data and calculation algorithms through a C/C++ user written program. Functions included among others are:
- Access any variable of any component
- Change any variable of any component
- Execute any analysis/calculation function
- Retrieve the calculation results
- Add new components to the network
- Delete components from the network
- Add and change the graphical information (x, y coordinates, symbols, etc.) of any component
NPL - Applications
Many customized applications are possible:
- Implement NEPLAN with a NPL application in a SmartGrid environment
- Use NEPLAN in batch mode (e.g. running several load flows and short circuit calculations cases)
- Build customized interfaces (e.g. GIS, SCADA/DMS, DACF, CIM, etc.)
- Develop a network master controller with events (such as “if u <90% switch on reserve generator”) and run the application in a quasi stationary mode
- Checking protection behavior under various network conditions
- Use NEPLAN as server and connect NEPLAN to a TCP/IP bus. The client may send any NPL command to the NEPLAN server (e.g. run load flow, open switch, change load, etc)
- Use NEPLAN as On-line system and build a DMS application using the NEPLAN graphic editor and the analysis tools
- Researchers may even develop their own calculation algorithms (e.g. OPF, reliability, capacitor placement etc.)
- ….. and much, much more…..
On-line DMS application: Optimal restorations after a fault
TCP/IP Bus
NEPLAN®
working as Server
C/C++ API developed
by the Customer
NPL - Library
SmartGrid
Application
with
NEPLAN
![Análisis en estado estable y transitorio de fuentes de ... · PDF fileEstas unidades fueron caracterizadas usando el software NEPLAN [ 9 ]. Las impedancias de secuencia, transitoria](https://static.fdocuments.us/doc/165x107/5a8cd1fd7f8b9a7f398c7345/anlisis-en-estado-estable-y-transitorio-de-fuentes-de-unidades-fueron-caracterizadas.jpg)