
PILLAR III DISCLOSURE REPORT - UniCredit
31
Disclosure Report as of September 30, 2019 1 PILLAR III DISCLOSURE REPORT Report reference date: 30 September, 2019
Transcript of PILLAR III DISCLOSURE REPORT - UniCredit
Disclosure Report as of September 30, 2019
1
PILLAR III DISCLOSURE REPORT
Report reference date: 30 September, 2019
Disclosure Report as of September 30, 2019
2
CONTENT
1. OVERVIEW ON DISCLOSURES ............................................................................................................... 3
2. SCOPE OF APPLICATION ...................................................................................................................... 5
2.1 RELEVANT SCOPE OF CONSOLIDATION ....................................................................................................................................................................... 5 2.2 ENTITIES DEDUCTED FROM OWN FUNDS .................................................................................................................................................................. 5 2.3 ENTITIES ADDED TO RWA ......................................................................................................................................................................................... 6 2.4 SUBSTANTIAL OR LEGAL IMPEDIMENTS THAT HINDER THE RAPID TRANSFER OF CAPITAL RESOURCES WITHIN THE GROUP .................................. 6
3. OWN FUNDS AND KEY METRICS ........................................................................................................... 8
3.1 REGULATORY CAPITAL - SUMMARY RECONCILIATION AND CHANGES OVER TIME ..................................................................................................... 8 3.2 SUMMARY OF KEY PRUDENTIAL METRICS ............................................................................................................................................................. 12
4. OWN FUNDS REQUIREMENTS ............................................................................................................ 13
4.1 GENERAL COMMENT ................................................................................................................................................................................................ 13 4.2 CAPITAL STRENGTHENING ....................................................................................................................................................................................... 16 4.3 CAPITAL SURCHARGES & BUFFERS.......................................................................................................................................................................... 16
5. CREDIT RISK .................................................................................................................................... 17
5.1 STRATEGIES, POLICIES AND PROCESSES FOR CREDIT RISK MANAGEMENT ............................................................................................................. 17
6. EXCESSIVE LEVERAGE RISK ............................................................................................................... 19
7. LIQUIDITY RISK ................................................................................................................................ 21
7.1 LIQUIDITY ................................................................................................................................................................................................................. 21 7.2 LIQUIDITY BUFFER AND FUNDING STRATEGY ......................................................................................................................................................... 29
ANNEX 1: UNICREDIT BANK SA XLS TEMPLATES...................................................................................... 31
Disclosure Report as of September 30, 2019
3
1. OVERVIEW ON DISCLOSURES
The Report is prepared in accordance with National Bank of Romania Regulation no. 5/2013 regarding prudential requirements for credit institutions, Regulation no. 575/2013 of European Parliament and Council dated 26.06.2013 regarding prudential requirements for credit institution and investment companies and amending Regulation (UE) no.648/2012.
The information disclosed is compliant with the Guideline EBA/GL/2016/11 on disclosure requirements under Part Eight of Regulation (EU) No 575/2013 and with the dedicated Guidelines issued by European Banking Authority and Basel Committee:
• Regulation (EU) No 1423/2013 laying down implementing technical standards with regard to disclosure of own funds requirements for institutions according to Regulation (EU) No 575/2013 of the European Parliament and of the Council Text;
• Regulation (EU) 2295/2017 supplementing Regulation (EU) No 575/2013 of the European Parliament and of the Council with regard to regulatory technical standards for disclosure of encumbered and unencumbered assets;
• Regulation (EU) 200/2016, laying down implementing technical standards with regard to disclosure of the leverage ratio for institutions, according to Regulation (EU) No 575/2013 of the European Parliament and of the Council;
• EBA /GL/2014/14 Guideline on materiality, proprietary and confidentiality and on disclosure frequency under Articles 432(1), 432(2) and 433 of Regulation (EU) No 575/2013;
• Basel Committee Pillar 3. Requirements Disclosures- Consolidated and Updated March 2017;
• EBA/GL/2015/22 Guideline on sound remuneration policies;
• EBA/GL/2017/01 Guideline on LCR disclosure to complement the disclosure of liquidity risk management under Article 435 of Regulation (EU) No 575/2013.
• Revisions to leverage ratio disclosure requirements June 2019 - Basel Committee on Banking Supervision
• Pillar 3 disclosure requirements-updated framework December 2019 - Basel Committee on Banking Supervision
The document is available in electronic format at www.unicredit.ro, area Financial Reports, Basel II-Pillar III Disclosure, following:
https://www.unicredit.ro/en/institutional/the-bank/financial-reports.html#baseliipillariiidisclosure
The quantitative data are presented on consolidated basis, except those flagged at individual level, in RON equivalent, except those flagged in other currencies.
As the UniCredit Bank Romania has been identified as “Other Systemically Important credit Institution (O-SII)” from Romania, the Bank will provide the users with quarterly frequency a relevant bucket of information.
The Pillar III Report is approved by the Supervisory Board of UniCredit Bank Romania.
Disclosure Report as of September 30, 2019
4
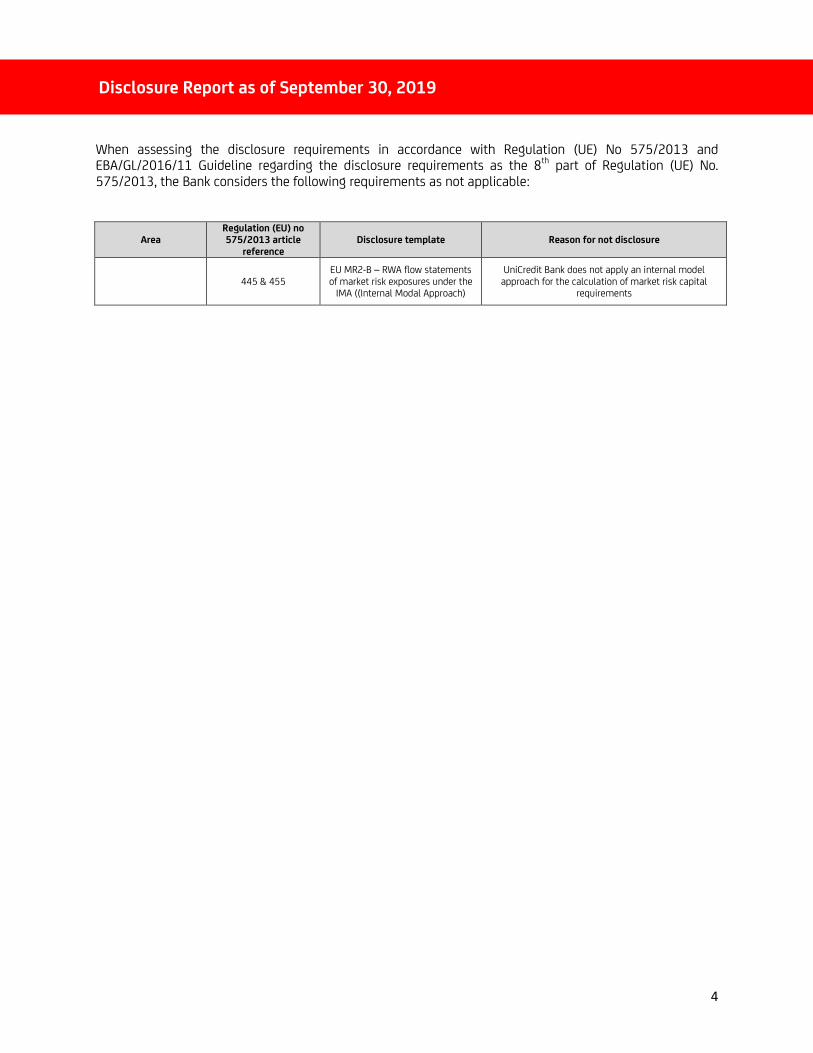
When assessing the disclosure requirements in accordance with Regulation (UE) No 575/2013 and EBA/GL/2016/11 Guideline regarding the disclosure requirements as the 8th part of Regulation (UE) No. 575/2013, the Bank considers the following requirements as not applicable:
Area Regulation (EU) no 575/2013 article
reference
Disclosure template Reason for not disclosure
445 & 455
EU MR2-B – RWA flow statements of market risk exposures under the
IMA ((Internal Modal Approach)
UniCredit Bank does not apply an internal model approach for the calculation of market risk capital
requirements
Disclosure Report as of September 30, 2019
5
2. SCOPE OF APPLICATION
2.1 Relevant scope of consolidation
The institution subject to disclosure is UniCredit Bank SA. (“the Bank”), the report includes Bank information and also information regarding the entities integrated in the consolidated prudential perimeter of UniCredit Bank.
The institution to which is applied transparency and publishing requirement is UniCredit Bank S.A., the report includes information related to the Bank but also related to the entities included into the scope of consolidation of UniCredit Bank.
Starting with August 2015, UniCredit Bank S.A. (the “Bank”) is the new brand name of formerly UniCredit Tiriac Bank SA that was established as a Romanian commercial bank on 1 June 2007 upon the merger by acquisition of the former UniCredit Romania S.A. (the absorbed bank) by Banca Comerciala HVB Tiriac S.A. (the absorbing bank) and is licensed by the National Bank of Romania (“NBR”) to conduct banking activities.
The Bank’s current registered office is 1F, Expozitiei Boulevard, District 1, Bucharest, Romania.
UniCredit Bank S.A. is controlled by UniCredit SpA (Italy), with registered office in Milano (Mi), Italia Piazza Gae Aulenti 3 Cap 20154 Tower A.
The Bank provides retail and commercial banking services in Romanian Lei (“RON”) and in foreign currency for individuals and legal entities. These include: accounts opening, domestic and international payments, foreign exchange transactions, working capital finance, medium and long term facilities, retail loans, bank guarantees, letter of credits and documentary collections, derivative financial instruments.
UniCredit Bank Group is exercising direct and indirect control over the following subsidiaries:
• UniCredit Consumer Financing IFN S.A., having its current registered office at 23-25 Ghetarilor street, 1st and 3rd floor, District 1, Bucharest, Romania, provides consumer finance loans to individual clients. The Bank has a shareholding of 50.1% in UCFIN since January 2013.
• UniCredit Leasing Corporation IFN S.A.(“UCLC”), having its current registered office at 23-25 Ghetarilor Street, 1st, 2nd and 4th floor, District 1, Bucharest, Romania, provides financial lease services to corporate clients and individuals. UCLC, previously associate entity, has become a subsidiary of the Bank starting with April 2014 the Bank having direct and indirect controlling interest (through UCFIN) by 99.977% (Bank indirect controlling interest as of June 30 2019 being of 0.022% and direct control by 99.955%)
• Debo Leasing IFN S.A., having its current registered office in 23-25 Ghetarilor Street, 2nd floor, 1st district, Bucharest, Romania, is a real estate finance lease entity, become Bank branch in February 2014. As of June 30 2019 the Bank have indirect control interest of 99.970% out of 99.963% through UCLC and 0.0069% through UCFIN acting as a sole shareholders of Debo Leasing IFN SA.
2.2 Entities deducted from Own Funds
According to Regulation no. 575/2013 of European Parliament and Council dated 26.06.2013 regarding prudential requirements for credit institutions and investment companies, the holdings in Common Equity Tier 1 (CET1) that are classified as significant investments should be deducted from own funds if the CET1-threshold for deduction is exceeded.
Disclosure Report as of September 30, 2019
6
As at 30 September 2019, UniCredit Bank doesn’t hold at individual level significant investments in financial entities which were not deducted from own funds according to the Article 48 from CRR.
2.3 Entities added to RWA
As at 30 September 2019, the significant investments in financial entities are shown at the individual level with a risk weight of 370% as they are not deducted from own funds, but are included in the consolidated perimeter.
2.4 Substantial or legal impediments that hinder the rapid transfer of capital resources within the Group
At UniCredit Group level, an integrated analysis is done to identify the significant risks. The processes for management, monitoring and reporting of risks are formalized in the Group regulations, aligned and integrated at the local group at UniCredit Bank SA level. In accordance with the rules regarding the analysis process, calibration, approval, adoption, implementation, monitoring and reporting of the Group regulations, UniCredit Bank SA has the responsibility of sending the applicable regulation to its subsidiaries, in order to be analyzed, approved/adopted and implemented. Subsequently, UniCredit Bank SA assesses and decides the applicability at the subsidiaries level taking into account the nature, dimension and complexity of their activities.
In order to ensure the control over implementation of the Group requirements at level of direct controlled entities, there is a frequent reporting process regarding the status of local implementation under the Internal Control Committee of UniCredit Bank SA.
The main potential impediments regarding the rapid transfer of capital resources are addressed below:
2.4.1 The impact of legal status of subsidiaries regarding the prompt transfer of funds and/or debt reimbursement
UniCredit Consumer Finance IFN SA
UniCredit Bank SA (UCB) controls UniCredit Consumer Financing (UCFin) through majority of voting rights held (50.1%), which implies the approval of development plan and strategy of UCFIN in accordance with Bank and UniCredit Group’s strategy.
The control exercised over UCFIN is strengthened by the fact that UCB appoints 4 out of 5 members of UCFIN Supervisory Board in accordance with UCFIN Articles of Association („AoA” or Constitutive Act). In Accordance with AoA, the UCFIN Supervisory Board has the authority to check the Board Member’s activity in respect of the implementation of the Bank’s strategy, aligned with those of UniCredit Group.
As result, there is no impediment which could adversely impact the prompt transfer of funds from UCFIN to UCB and/or the UCFIN capacity for fast reimbursement of debts to UCB.
UniCredit Leasing Corporation IFN SA
UniCredit Bank SA (UCB) controls UniCredit Leasing Corporation IFN S.A. (UCLC) through majority of voting rights held (99.955%), which implies the approval of development plan and strategy of UCLC in accordance with Bank and UniCredit Group’s strategy.
The control exercised over UCLC is strengthened by the fact that UCB appoints all 5 members of UCLC Supervisory Board in accordance with UCLC Articles of Association („AoA” or Constitutive Act). In Accordance
Disclosure Report as of September 30, 2019
7
with AoA, the UCLC Supervisory Board has the authority to check the Board Member’s activity in respect of the implementation of the Bank’s strategy, aligned with those of UniCredit Group.
As a result, there is no impediment which could adversely impact the prompt transfer of funds from UCLC to UCB and/or the UCLC capacity for fast reimbursement of debts to UCB.
Constitutive documents of UCFIN and UCLC do not include limits or restrictions related to the own funds transfer and/or debts reimbursments.
2.4.2 Assessment of the other interests, different from those (controlling interests) of UCB and of their impact. UCB capacity to ask for the funds transfers or debt reimbursements
No other interests were identified except the UCB controlling interests as the control is defined in the Articles of Associations of the 2 subsidiaries.
Meanwhile, we mention that the financing agreements concluded between UCB and their subsidiaries contain contractual clauses regarding the situations where repayments in advance can appear and where collateral guarantees are in place, where all actual and future cash amounts are pledged in the bank’s favour. (credit balances in the bank accounts open at UCB).
2.4.3 Potential unfavorable fiscal impact for UCB or its subsidiaries in case of funds transfer or debt reimbursement
At UniCredit Bank SA level there is no adverse fiscal impact as a result of the potential prompt transfer of funds or debt repayment in advance in accordance with the Fiscal Code provisions in force.
At subsidiaries level, in hypothethical case of share capital distribution, there is no effect that could generate a fiscal impact.
2.4.4 Eventual prejudices could result from the business strategies of subsidiaries regarding the prompt transfer of funds and/or debt reimbursement
The Budget for 2019 and the financial plan for the next 3 years of UCB and its subsidiaries outline the intention of ongoing business activity and to support for the implementation of the subsidiaries strategies. In normal conditions of ongoing business activity, there has not been forecasted any prompt transfer of funds and/or debt repayments in advance in the financial plans.
2.4.5 Analysis of the impact of contractual relationships between the subsidiaries and UCB/other third parties regarding the prompt transfer of funds and/or debts repayment
The contractual relationships between UCB and its subsidiaries are approved and monitored in accordance with the provisions of Articles of Association of subsidiaries and internal procedures which regulates the competencies levels for approval set up by managements and their shareholders.
Taking into account the shareholders structure, there is no negative risk that could impact the contractual business relationships of subsidiaries.
2.4.6 The historical and forecast flows of funds between UCB and its subsidiaries with potential impact on capacity of prompt transfer of funds and/or debt reimbursement
The loan agreements concluded by UniCredit Bank with its subsidiaries include the calculation of penalty interest in case the loans’ payments obligations are not met. The penalty interest is applied at the maturity
Disclosure Report as of September 30, 2019
8
date, until the full payment date and it is applied to outstanding amount. There have been no cases in the past of penalty interest being applied for the credit lines granted to subsidiaries of UCB.
Meanwhile, we have to mention that, in accordance with the provisions of article 26 of NBR Regulation no.5/2013, UCB, as parent credit institution, takes into account and balances the interests of its subsidiaries and analyzes them continuously so that those interests contributes to the objectives and interests of UCB Group and respectively of UniCredit Group, taken together as one objective/interest, on a long term basis.
2.4.7 Intragroup Liquidity Transfers
Intra-group liquidity transfers are subject to restrictions due to legal and regulatory constraints.
With reference to regulatory requirements, it should be noted that UniCredit Bank is subject to rules provided by The Regulation (EU) No 575/2013 on “prudential requirements for credit institutions and investment firms”.
3. OWN FUNDS AND KEY METRICS
3.1 Regulatory capital - summary reconciliation and changes over time
Starting with January 2014, Romanian Banking System is applying the Basel III norms, in accordance with Regulation no. 575/2013 of European Parliament and Council dated 26.06.2013 regarding prudential requirements for credit institutions and investment companies, amended by Regulation (UE) no.648 / 2012 and by Regulation no. 5/2013 regarding prudential requirements for credit institutions issued by National Bank of Romania and Commission Implementing Regulation (EU) No 1423/2013 of 20 December 2013 laying down implementing technical standards with regard to the disclosure of own funds requirements for institutions according to Regulation (EU) No 575/2013 of the European Parliament and of the Council.
The prudential requirements define the eligibility criteria for capital instruments which shall be included in Own Funds – Common Equity Tier 1 Capital, Additional Tier 1 Capital or Own Funds – Tier 2 Capital, as detailed below:
Capital instruments qualify as equity instruments Level 1 if the conditions listed below are fulfilled:
• Instruments are issued directly by the institution with the prior approval of shareholders’ institution or, where permitted under applicable national legislation governing body of the institution;
• Instruments are paid, and their purchase is not funded directly or indirectly by the institution; are classified as equity within the meaning of applicable accounting framework;
• Instruments are presented clearly and distinctly in the balance sheet area in the financial statements of the institution;
• Instruments are perpetual;
• The instruments meet the following conditions in terms of distributions:
- No preferential treatment in terms of distribution order to perform distributions, including in relation to other instruments Tier 1 instruments and the conditions governing the instruments do not provide preferential rights to making distributions;
Disclosure Report as of September 30, 2019
9
- Distributions to holders of the instruments may be made only items that can be distributed;
- The conditions governing the instruments do not include a cap or other restriction on the maximum level of distributions;
- The level of distributions is not determined based on the purchase price of the instruments at issue;
- The conditions governing the instruments do not include any obligation for the institution to make distributions to their owners, and the institution is not otherwise subject to such obligations;
- Failure distributions is not an event of default for the institution;
- Annual distributions do not impose restrictions on the institution.
Capital instruments qualify as equity instruments Level 2 if the conditions for eligibility listed below are fulfilled:
• Subordinated loans are obtained and fully paid;
• Subordinated loans are not issued by a subsidiary or an associate;
• Providing subordinated loans is not funded directly or indirectly by the institution; the principal debt subordinated loans under the provisions governing subordinated loans, is entirely subordinated to the claims of all unsubordinated creditors;
• Subordinated loans have an original maturity of at least five years;
• Provisions governing, subordinated loans do not include any incentive for their principal amount to be refunded or, if applicable, returned by the institution before maturity;
• Subordinated loans can be recognized in the category of Tier 2 items if in the opinion of the National Bank of Romania meet the eligibility conditions listed above.
Disclosure Report as of September 30, 2019
10
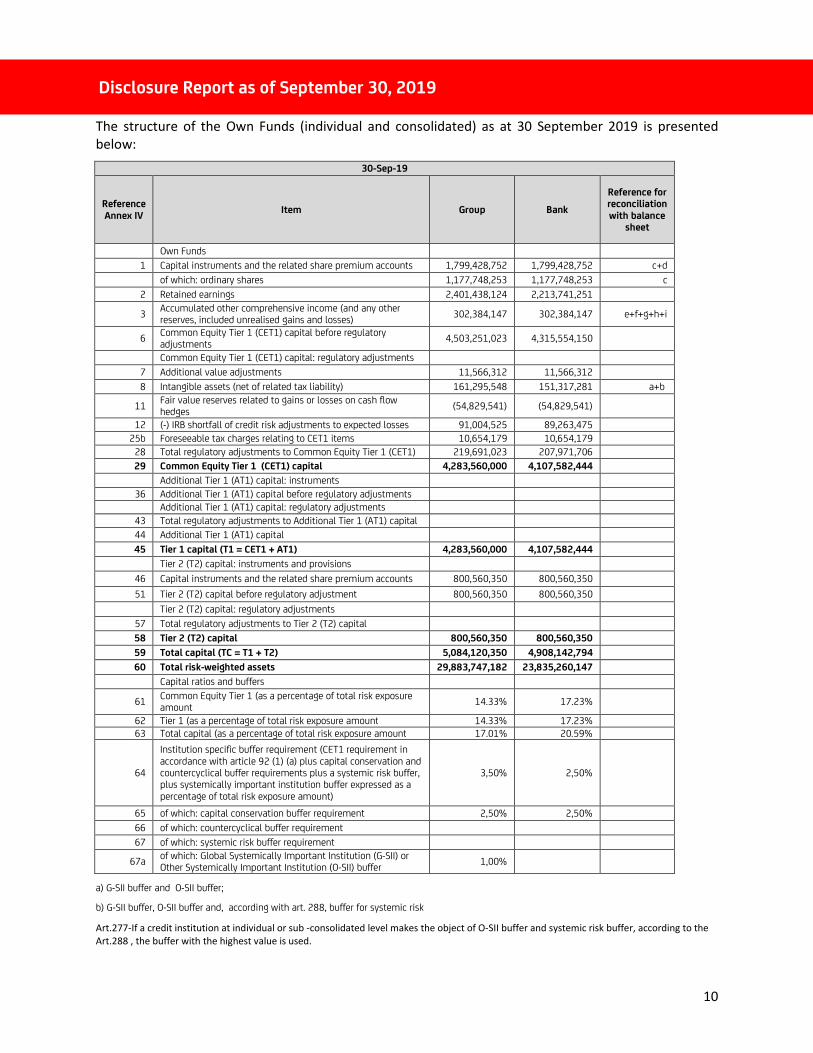
The structure of the Own Funds (individual and consolidated) as at 30 September 2019 is presented
below:
30-Sep-19
Reference
Annex IV Item Group Bank
Reference for reconciliation
with balance sheet
Own Funds
1 Capital instruments and the related share premium accounts 1,799,428,752 1,799,428,752 c+d
of which: ordinary shares 1,177,748,253 1,177,748,253 c
2 Retained earnings 2,401,438,124 2,213,741,251
3 Accumulated other comprehensive income (and any other reserves, included unrealised gains and losses)
302,384,147 302,384,147 e+f+g+h+i
6 Common Equity Tier 1 (CET1) capital before regulatory adjustments
4,503,251,023 4,315,554,150
Common Equity Tier 1 (CET1) capital: regulatory adjustments
7 Additional value adjustments 11,566,312 11,566,312
8 Intangible assets (net of related tax liability) 161,295,548 151,317,281 a+b
11 Fair value reserves related to gains or losses on cash flow hedges
(54,829,541) (54,829,541)
12 (-) IRB shortfall of credit risk adjustments to expected losses 91,004,525 89,263,475
25b Foreseeable tax charges relating to CET1 items 10,654,179 10,654,179
28 Total regulatory adjustments to Common Equity Tier 1 (CET1) 219,691,023 207,971,706
29 Common Equity Tier 1 (CET1) capital 4,283,560,000 4,107,582,444
Additional Tier 1 (AT1) capital: instruments
36 Additional Tier 1 (AT1) capital before regulatory adjustments
Additional Tier 1 (AT1) capital: regulatory adjustments
43 Total regulatory adjustments to Additional Tier 1 (AT1) capital
44 Additional Tier 1 (AT1) capital
45 Tier 1 capital (T1 = CET1 + AT1) 4,283,560,000 4,107,582,444
Tier 2 (T2) capital: instruments and provisions
46 Capital instruments and the related share premium accounts 800,560,350 800,560,350
51 Tier 2 (T2) capital before regulatory adjustment 800,560,350 800,560,350
Tier 2 (T2) capital: regulatory adjustments
57 Total regulatory adjustments to Tier 2 (T2) capital
58 Tier 2 (T2) capital 800,560,350 800,560,350
59 Total capital (TC = T1 + T2) 5,084,120,350 4,908,142,794
60 Total risk-weighted assets 29,883,747,182 23,835,260,147
Capital ratios and buffers
61 Common Equity Tier 1 (as a percentage of total risk exposure amount
14.33% 17.23%
62 Tier 1 (as a percentage of total risk exposure amount 14.33% 17.23%
63 Total capital (as a percentage of total risk exposure amount 17.01% 20.59%
64
Institution specific buffer requirement (CET1 requirement in accordance with article 92 (1) (a) plus capital conservation and countercyclical buffer requirements plus a systemic risk buffer, plus systemically important institution buffer expressed as a percentage of total risk exposure amount)
3,50% 2,50%
65 of which: capital conservation buffer requirement 2,50% 2,50%
66 of which: countercyclical buffer requirement
67 of which: systemic risk buffer requirement
67a of which: Global Systemically Important Institution (G-SII) or Other Systemically Important Institution (O-SII) buffer
1,00%
a) G-SII buffer and O-SII buffer;
b) G-SII buffer, O-SII buffer and, according with art. 288, buffer for systemic risk
Art.277-If a credit institution at individual or sub -consolidated level makes the object of O-SII buffer and systemic risk buffer, according to the
Art.288 , the buffer with the highest value is used.
Disclosure Report as of September 30, 2019
11
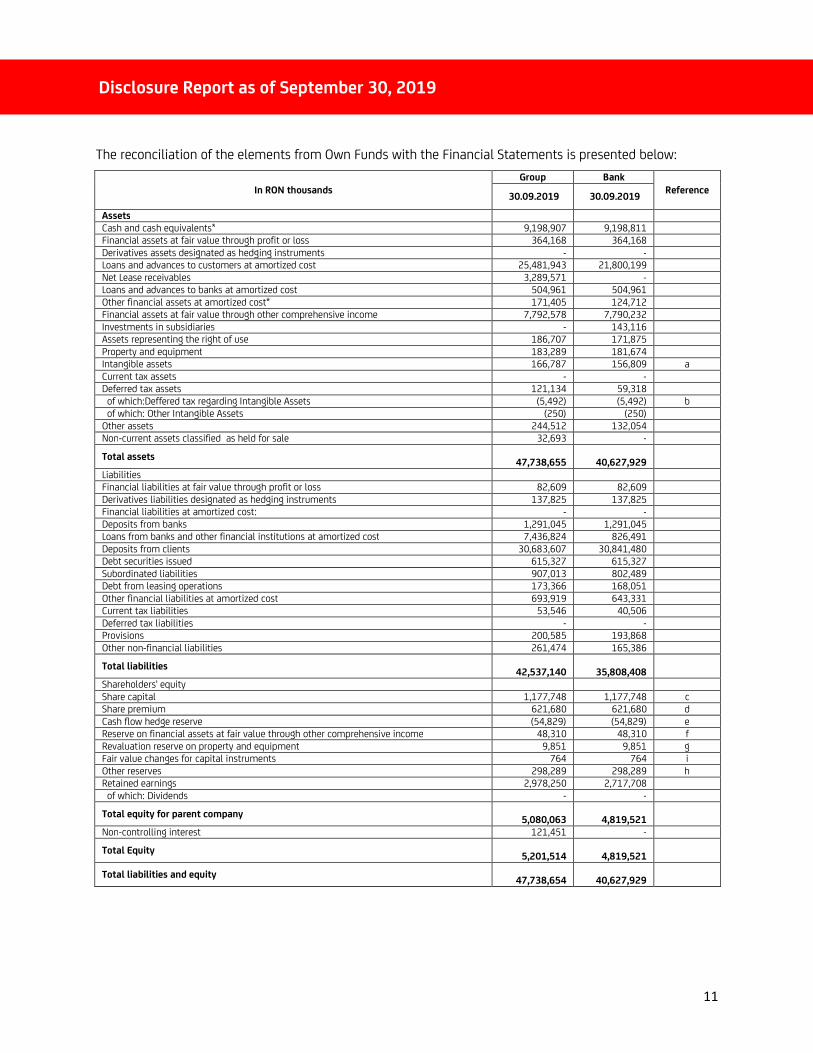
The reconciliation of the elements from Own Funds with the Financial Statements is presented below:
In RON thousands
Group Bank
Reference 30.09.2019 30.09.2019
Assets
Cash and cash equivalents* 9,198,907 9,198,811
Financial assets at fair value through profit or loss 364,168 364,168
Derivatives assets designated as hedging instruments - -
Loans and advances to customers at amortized cost 25,481,943 21,800,199
Net Lease receivables 3,289,571 -
Loans and advances to banks at amortized cost 504,961 504,961
Other financial assets at amortized cost* 171,405 124,712
Financial assets at fair value through other comprehensive income 7,792,578 7,790,232
Investments in subsidiaries - 143,116
Assets representing the right of use 186,707 171,875
Property and equipment 183,289 181,674
Intangible assets 166,787 156,809 a
Current tax assets - -
Deferred tax assets 121,134 59,318
of which:Deffered tax regarding Intangible Assets (5,492) (5,492) b
of which: Other Intangible Assets (250) (250)
Other assets 244,512 132,054
Non-current assets classified as held for sale 32,693 -
Total assets
47,738,655
40,627,929
Liabilities
Financial liabilities at fair value through profit or loss 82,609 82,609
Derivatives liabilities designated as hedging instruments 137,825 137,825
Financial liabilities at amortized cost: - -
Deposits from banks 1,291,045 1,291,045
Loans from banks and other financial institutions at amortized cost 7,436,824 826,491
Deposits from clients 30,683,607 30,841,480
Debt securities issued 615,327 615,327
Subordinated liabilities 907,013 802,489
Debt from leasing operations 173,366 168,051
Other financial liabilities at amortized cost 693,919 643,331
Current tax liabilities 53,546 40,506
Deferred tax liabilities - -
Provisions 200,585 193,868
Other non-financial liabilities 261,474 165,386
Total liabilities
42,537,140
35,808,408
Shareholders' equity
Share capital 1,177,748 1,177,748 c
Share premium 621,680 621,680 d
Cash flow hedge reserve (54,829) (54,829) e
Reserve on financial assets at fair value through other comprehensive income 48,310 48,310 f
Revaluation reserve on property and equipment 9,851 9,851 g
Fair value changes for capital instruments 764 764 i
Other reserves 298,289 298,289 h
Retained earnings 2,978,250 2,717,708 of which: Dividends - -
Total equity for parent company
5,080,063
4,819,521
Non-controlling interest 121,451 -
Total Equity
5,201,514
4,819,521
Total liabilities and equity
47,738,654
40,627,929
Disclosure Report as of September 30, 2019
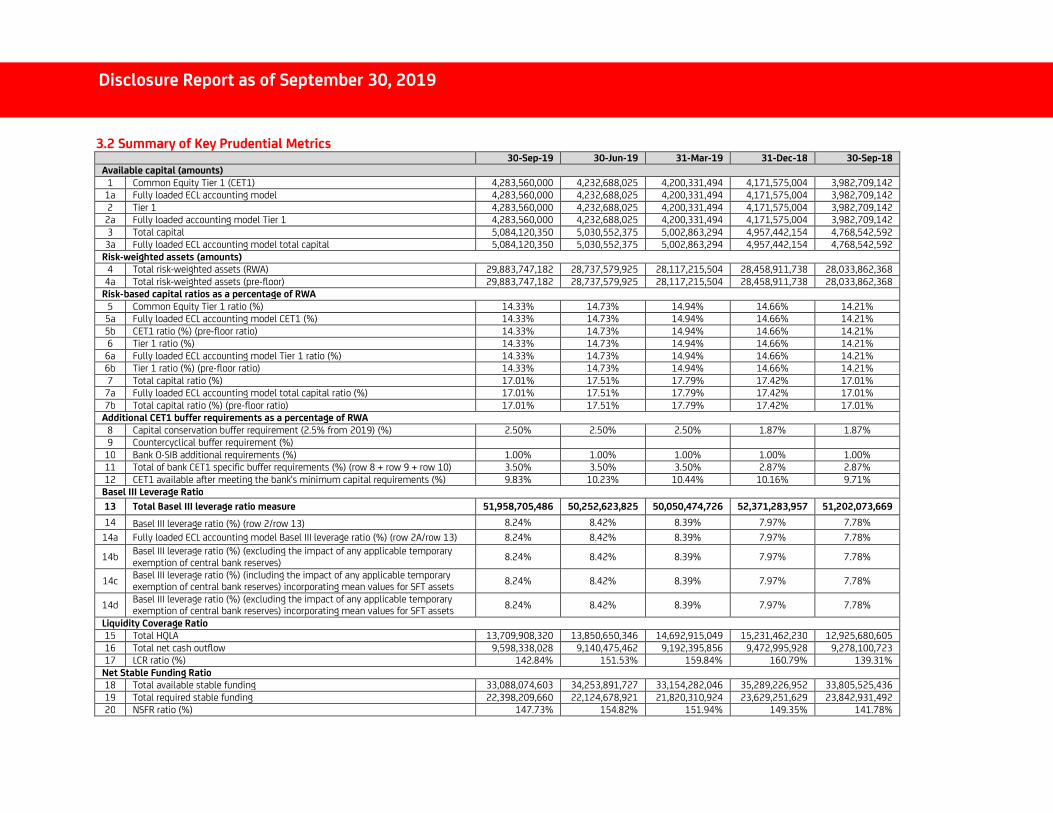
3.2 Summary of Key Prudential Metrics 30-Sep-19 30-Jun-19 31-Mar-19 31-Dec-18 30-Sep-18
Available capital (amounts)
1 Common Equity Tier 1 (CET1) 4,283,560,000 4,232,688,025 4,200,331,494 4,171,575,004 3,982,709,142
1a Fully loaded ECL accounting model 4,283,560,000 4,232,688,025 4,200,331,494 4,171,575,004 3,982,709,142
2 Tier 1 4,283,560,000 4,232,688,025 4,200,331,494 4,171,575,004 3,982,709,142
2a Fully loaded accounting model Tier 1 4,283,560,000 4,232,688,025 4,200,331,494 4,171,575,004 3,982,709,142
3 Total capital 5,084,120,350 5,030,552,375 5,002,863,294 4,957,442,154 4,768,542,592
3a Fully loaded ECL accounting model total capital 5,084,120,350 5,030,552,375 5,002,863,294 4,957,442,154 4,768,542,592
Risk-weighted assets (amounts)
4 Total risk-weighted assets (RWA) 29,883,747,182 28,737,579,925 28,117,215,504 28,458,911,738 28,033,862,368
4a Total risk-weighted assets (pre-floor) 29,883,747,182 28,737,579,925 28,117,215,504 28,458,911,738 28,033,862,368
Risk-based capital ratios as a percentage of RWA
5 Common Equity Tier 1 ratio (%) 14.33% 14.73% 14.94% 14.66% 14.21%
5a Fully loaded ECL accounting model CET1 (%) 14.33% 14.73% 14.94% 14.66% 14.21%
5b CET1 ratio (%) (pre-floor ratio) 14.33% 14.73% 14.94% 14.66% 14.21%
6 Tier 1 ratio (%) 14.33% 14.73% 14.94% 14.66% 14.21%
6a Fully loaded ECL accounting model Tier 1 ratio (%) 14.33% 14.73% 14.94% 14.66% 14.21%
6b Tier 1 ratio (%) (pre-floor ratio) 14.33% 14.73% 14.94% 14.66% 14.21%
7 Total capital ratio (%) 17.01% 17.51% 17.79% 17.42% 17.01%
7a Fully loaded ECL accounting model total capital ratio (%) 17.01% 17.51% 17.79% 17.42% 17.01%
7b Total capital ratio (%) (pre-floor ratio) 17.01% 17.51% 17.79% 17.42% 17.01%
Additional CET1 buffer requirements as a percentage of RWA
8 Capital conservation buffer requirement (2.5% from 2019) (%) 2.50% 2.50% 2.50% 1.87% 1.87%
9 Countercyclical buffer requirement (%)
10 Bank O-SIB additional requirements (%) 1.00% 1.00% 1.00% 1.00% 1.00%
11 Total of bank CET1 specific buffer requirements (%) (row 8 + row 9 + row 10) 3.50% 3.50% 3.50% 2.87% 2.87%
12 CET1 available after meeting the bank's minimum capital requirements (%) 9.83% 10.23% 10.44% 10.16% 9.71%
Basel III Leverage Ratio
13 Total Basel III leverage ratio measure 51,958,705,486 50,252,623,825 50,050,474,726 52,371,283,957 51,202,073,669
14 Basel III leverage ratio (%) (row 2/row 13) 8.24% 8.42% 8.39% 7.97% 7.78%
14a Fully loaded ECL accounting model Basel III leverage ratio (%) (row 2A/row 13) 8.24% 8.42% 8.39% 7.97% 7.78%
14b Basel III leverage ratio (%) (excluding the impact of any applicable temporary exemption of central bank reserves)
8.24% 8.42% 8.39% 7.97% 7.78%
14c Basel III leverage ratio (%) (including the impact of any applicable temporary exemption of central bank reserves) incorporating mean values for SFT assets
8.24% 8.42% 8.39% 7.97% 7.78%
14d Basel III leverage ratio (%) (excluding the impact of any applicable temporary exemption of central bank reserves) incorporating mean values for SFT assets
8.24% 8.42% 8.39% 7.97% 7.78%
Liquidity Coverage Ratio
15 Total HQLA 13,709,908,320 13,850,650,346 14,692,915,049 15,231,462,230 12,925,680,605
16 Total net cash outflow 9,598,338,028 9,140,475,462 9,192,395,856 9,472,995,928 9,278,100,723
17 LCR ratio (%) 142.84% 151.53% 159.84% 160.79% 139.31%
Net Stable Funding Ratio
18 Total available stable funding 33,088,074,603 34,253,891,727 33,154,282,046 35,289,226,952 33,805,525,436
19 Total required stable funding 22,398,209,660 22,124,678,921 21,820,310,924 23,629,251,629 23,842,931,492
20 NSFR ratio (%) 147.73% 154.82% 151.94% 149.35% 141.78%
Disclosure Report as of September 30, 2019
13
4. OWN FUNDS REQUIREMENTS
4.1 General comment
Capital Adequacy Assessment
During 2019 first three quarters, within the Bank it was continued the sustained process for completing the internal methodological framework with specific regulations, mainly as regards to ICAAP general framework, stress tests, setting and monitoring of risk appetite, capital management rules, rules regarding the new risks identified by the Bank as significant.
The Internal Capital Adequacy Assessment Process was performed in accordance with National Bank of Romania Regulation no 5/2013, with subsequent amendments and changes, representing an independent assessment of the current and future internal capital, related to the risks the bank is facing and in line with the Bank’s strategy. That is to say that UCB assesses the balance between the assumed risk and the available capital consistently with the strategy and assumed objectives, respectively the internal capital and the available financial resources.
The internal capital is represented by the sum of the economic capitals calculated for each risk: credit risk, market risk, operational risk, business risk, and Real estate investments risk based on internal models (ex. CVaR, VaR etc).
The ultimate mission of the capital adequacy is to ensure that it forms an integral part of day-to-day management and decision-making processes such as: embedding risk management measures and the capital needed in strategic planning, introduction of risk analysis in strategic planning and budgetary processes.
Thus, the Bank develops and manages its risk management processes, respectively implements processes and tools to assess the level of internal capital adequate to support each type of risk, including those risks not captured by the total capital requirement (i.e. Pillar I risks), within the scope of an assessment of the Bank’s Legal current and future exposure, taking into account its strategies and developments in its business environment.
Necessary regulated own funds requirements at consolidated level
For calculating the regulatory capital requirements for credit risk, the Bank applies the Foundation Internal Rating Based Approach, according to Regulation no. 575/2013 of European Parliament and Council dated 26.06.2013 regarding prudential requirements for credit institutions and investment companies and amending Regulation (UE) no. 648/2012 of the Commission for establishing technical standards for reporting for supervisory purposes and by Regulation no. 5/2013 regarding prudential requirements for credit institutions issued by National Bank of Romania (due to the joint approval received from Bank of Italy, FMA and National Bank of Romania) for the following segments of clients: corporate (except for real estate clients and specialized financing), multinational companies, banks, sovereigns and central banks and financial investments companies. For the rest of the portfolio, the Bank continued to use the standardized approach.
For calculating the regulatory capital requirements for market risk, the Bank uses the Standardized Approach, while, for operational risk, it is used advanced approach in accordance the above mentioned regulations. All tasks related to the calculation and monitoring of capital requirements are performed by specialized units of Finance Division and Risk Division of the Bank.
Disclosure Report as of September 30, 2019
14
For complying with capital adequacy requirements established by Emergency Ordinance 99/2006, the Bank is actively involved in an evaluation process of capital requirements, for sustaining current and future activity, which implies the following processes:
• Budgeting
• Monitoring and analysis
• Stress testing
• Forecasting
Disclosure Report as of September 30, 2019
15
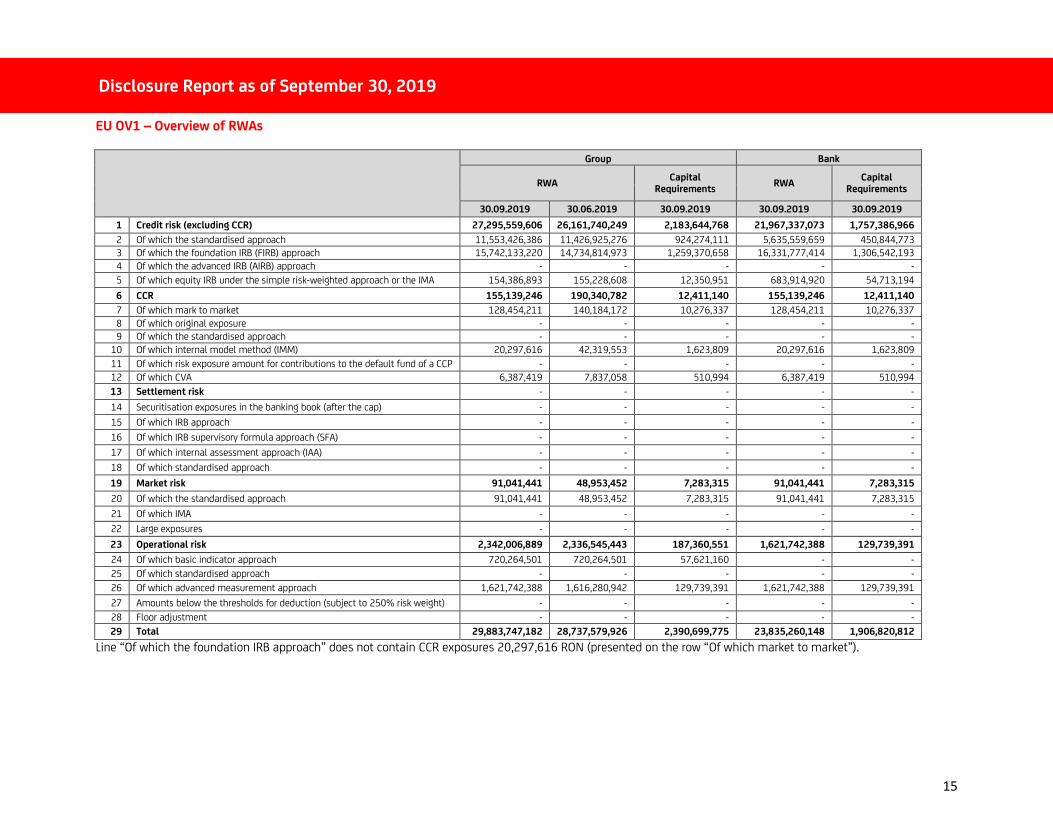
EU OV1 – Overview of RWAs
Group Bank
RWA Capital
Requirements RWA
Capital Requirements
30.09.2019 30.06.2019 30.09.2019 30.09.2019 30.09.2019
1 Credit risk (excluding CCR) 27,295,559,606 26,161,740,249 2,183,644,768 21,967,337,073 1,757,386,966
2 Of which the standardised approach 11,553,426,386 11,426,925,276 924,274,111 5,635,559,659 450,844,773
3 Of which the foundation IRB (FIRB) approach 15,742,133,220 14,734,814,973 1,259,370,658 16,331,777,414 1,306,542,193
4 Of which the advanced IRB (AIRB) approach - - - - -
5 Of which equity IRB under the simple risk-weighted approach or the IMA 154,386,893 155,228,608 12,350,951 683,914,920 54,713,194
6 CCR 155,139,246 190,340,782 12,411,140 155,139,246 12,411,140
7 Of which mark to market 128,454,211 140,184,172 10,276,337 128,454,211 10,276,337
8 Of which original exposure - - - - -
9 Of which the standardised approach - - - - -
10 Of which internal model method (IMM) 20,297,616 42,319,553 1,623,809 20,297,616 1,623,809
11 Of which risk exposure amount for contributions to the default fund of a CCP - - - - -
12 Of which CVA 6,387,419 7,837,058 510,994 6,387,419 510,994
13 Settlement risk - - - - -
14 Securitisation exposures in the banking book (after the cap) - - - - -
15 Of which IRB approach - - - - -
16 Of which IRB supervisory formula approach (SFA) - - - - -
17 Of which internal assessment approach (IAA) - - - - -
18 Of which standardised approach - - - - -
19 Market risk 91,041,441 48,953,452 7,283,315 91,041,441 7,283,315
20 Of which the standardised approach 91,041,441 48,953,452 7,283,315 91,041,441 7,283,315
21 Of which IMA - - - - -
22 Large exposures - - - - -
23 Operational risk 2,342,006,889 2,336,545,443 187,360,551 1,621,742,388 129,739,391
24 Of which basic indicator approach 720,264,501 720,264,501 57,621,160 - -
25 Of which standardised approach - - - - -
26 Of which advanced measurement approach 1,621,742,388 1,616,280,942 129,739,391 1,621,742,388 129,739,391
27 Amounts below the thresholds for deduction (subject to 250% risk weight) - - - - -
28 Floor adjustment - - - - -
29 Total 29,883,747,182 28,737,579,926 2,390,699,775 23,835,260,148 1,906,820,812
Line “Of which the foundation IRB approach” does not contain CCR exposures 20,297,616 RON (presented on the row “Of which market to market”).
Disclosure Report as of September 30, 2019
16
4.2 Capital Strengthening
From the bank’s perspective, Tier 1 capital is the core measure of its financial health and is assessed from the view of its capacity to absorb losses without ceasing business operations. Under Basel III, the minimum tier 1 capital ratio is 6%, which is calculated by dividing the bank's tier 1 capital by its total risk-weighted assets.
As of September 2019, the bank did not hold additional Tier 1 instruments, therefore Core Tier 1 ratio was calculated at the level of tier 1 ratio, with a consolidated level of 14.33% (17.23% at Individual level), significantly higher than the minimum regulatory requirement.
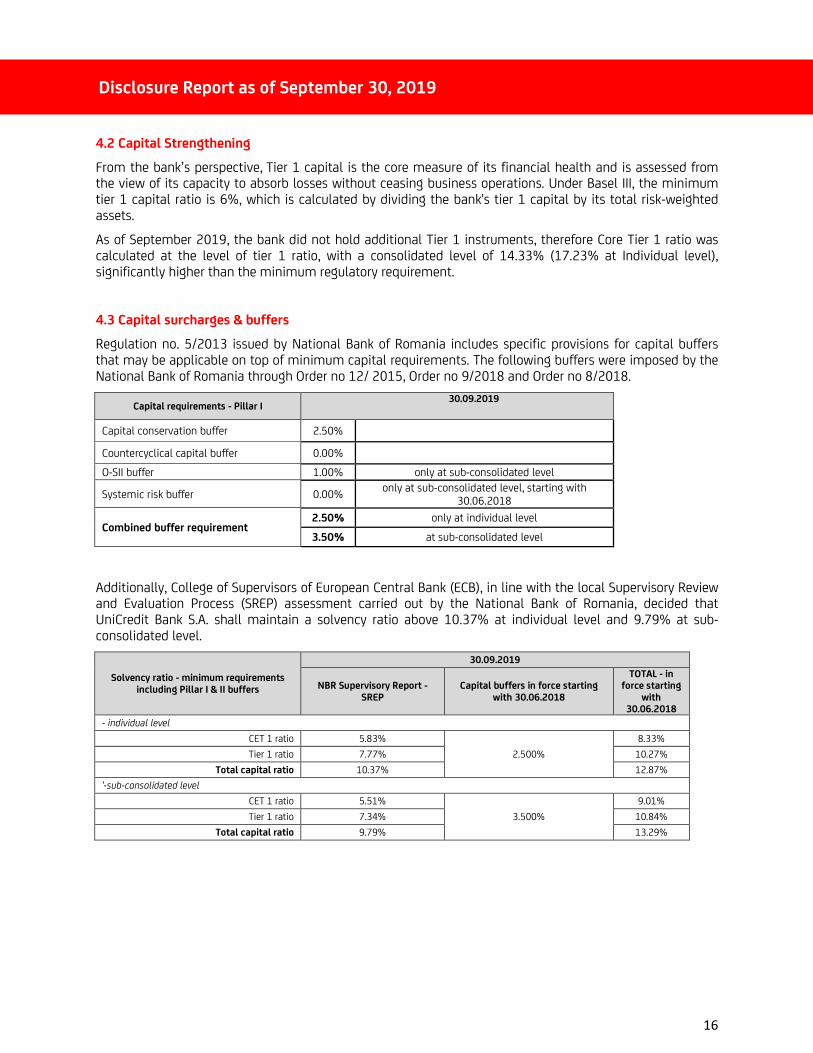
4.3 Capital surcharges & buffers
Regulation no. 5/2013 issued by National Bank of Romania includes specific provisions for capital buffers that may be applicable on top of minimum capital requirements. The following buffers were imposed by the National Bank of Romania through Order no 12/ 2015, Order no 9/2018 and Order no 8/2018.
Capital requirements - Pillar I 30.09.2019
Capital conservation buffer 2.50%
Countercyclical capital buffer 0.00%
O-SII buffer 1.00% only at sub-consolidated level
Systemic risk buffer 0.00% only at sub-consolidated level, starting with
30.06.2018
Combined buffer requirement 2.50% only at individual level
3.50% at sub-consolidated level
Additionally, College of Supervisors of European Central Bank (ECB), in line with the local Supervisory Review and Evaluation Process (SREP) assessment carried out by the National Bank of Romania, decided that UniCredit Bank S.A. shall maintain a solvency ratio above 10.37% at individual level and 9.79% at sub-consolidated level.
Solvency ratio - minimum requirements
including Pillar I & II buffers
30.09.2019
NBR Supervisory Report -
SREP
Capital buffers in force starting
with 30.06.2018
TOTAL - in force starting
with 30.06.2018
- individual level
CET 1 ratio 5.83%
2.500%
8.33%
Tier 1 ratio 7.77% 10.27%
Total capital ratio 10.37% 12.87%
'-sub-consolidated level
CET 1 ratio 5.51%
3.500%
9.01%
Tier 1 ratio 7.34% 10.84%
Total capital ratio 9.79% 13.29%
Disclosure Report as of September 30, 2019
17
5. CREDIT RISK
5.1 Strategies, policies and processes for credit risk management
Credit risk strategy is established by all the Bank's activities that present a significant exposure to credit risk. The Bank’s credit risk strategy is reviewed periodically, but at least once a year and whenever significant changes occur in risk assessment factors, and is approved by the Bank’s management structure. The credit risk strategy reflects the tolerance to risk and the profitability level which the Bank intends to achieve in the conditions of the exposure to the assumed risks.
The Bank assesses the credit risk in all activities affected by this kind of risk, no matter if the results of the respective activities are reflected in the balance sheet or off balance sheet.
The Bank has established risk management processes and has tools in order to identify, measure, monitor and control the credit risk.
The Bank’s credit risk management policy promotes a set of coherent principles and practices, oriented towards the following main directions:
• Establishment of a framework and adequate parameters of credit risk;
• Promotion and operation of a healthy and solid credit granting process;
• Promotion and maintenance of an adequate process for credit administration, measurement and monitoring;
• Permanent control over the quality of the loan portfolio.
The credit risk management is performed taking into consideration the loans both at individual level and at whole portfolio level and includes the consideration of the qualitative and quantitative aspects related to risks.
Credit risk management is realized by limiting credit risk exposures setting limits established in accordance with general strategy of the Bank (limits established by sectors of activity, zones / geographical areas, counterparty categories, type of products, residence, country and currency, etc.). These limits are monitored and periodically reported to relevant committees.
The Bank is exposed in particular to credit risk in credit granting activity, this being the most common type of risk the Bank is confronted with.
The most important activity generating risk is financing, but any other banking activity can potentially generate credit risk (off balance commitments and debts, deposits constitution and other transaction on inter-banking market, hedging on stock/interbank market, etc.)
The Bank has a credit risk management process that takes into account its risk appetite, risk profile and market and macroeconomic conditions. This process includes policies and processes to identify, measure, evaluate, monitor, report, control and mitigate credit risk - including counterparty credit risk and potential future exposure, policies and processes aiming to capture the material risks inherent in individual products or transactions.
Credit risk includes risk derived from credit granting activity and from other transactions initiated for Bank clients, such as: issuance of LGs, opening / confirmation of LC’s, availing, discounting of trade instruments presented by the clients, investments in stocks and other financial assets, other facilities granted to clients.
Disclosure Report as of September 30, 2019
18
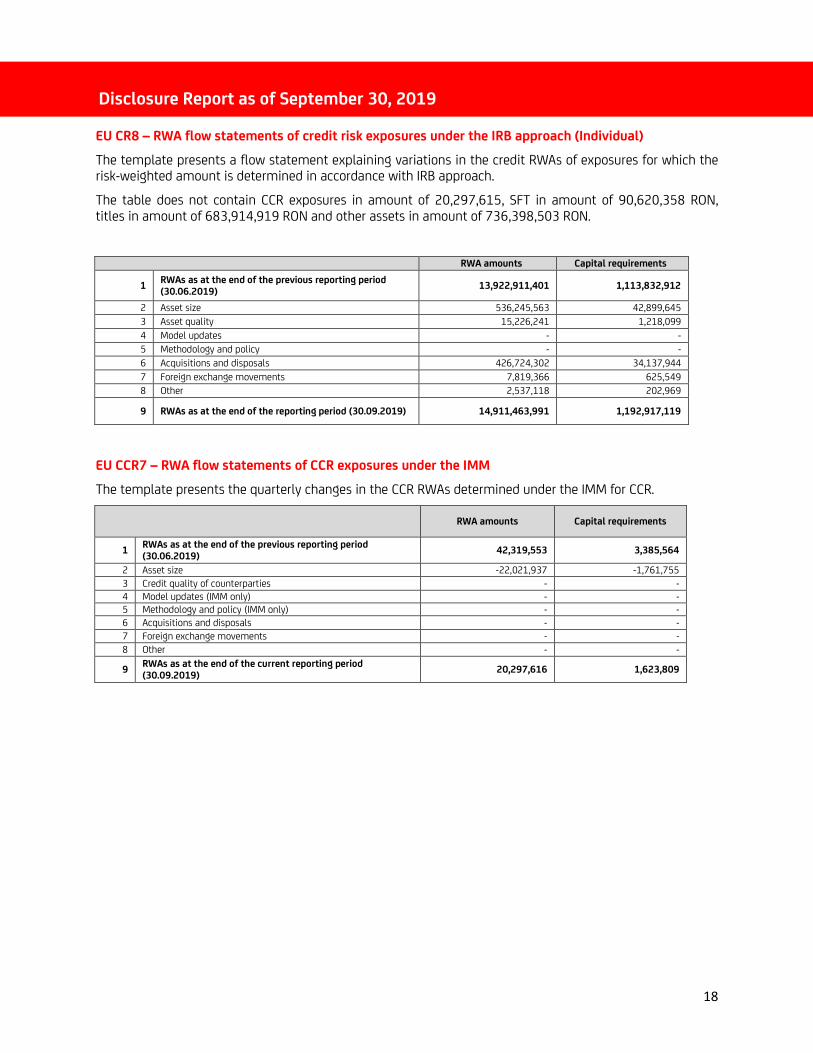
EU CR8 – RWA flow statements of credit risk exposures under the IRB approach (Individual)
The template presents a flow statement explaining variations in the credit RWAs of exposures for which the risk-weighted amount is determined in accordance with IRB approach.
The table does not contain CCR exposures in amount of 20,297,615, SFT in amount of 90,620,358 RON, titles in amount of 683,914,919 RON and other assets in amount of 736,398,503 RON.
RWA amounts Capital requirements
1 RWAs as at the end of the previous reporting period (30.06.2019)
13,922,911,401 1,113,832,912
2 Asset size 536,245,563 42,899,645
3 Asset quality 15,226,241 1,218,099
4 Model updates - -
5 Methodology and policy - -
6 Acquisitions and disposals 426,724,302 34,137,944
7 Foreign exchange movements 7,819,366 625,549
8 Other 2,537,118 202,969
9 RWAs as at the end of the reporting period (30.09.2019) 14,911,463,991 1,192,917,119
EU CCR7 – RWA flow statements of CCR exposures under the IMM
The template presents the quarterly changes in the CCR RWAs determined under the IMM for CCR.
RWA amounts Capital requirements
1 RWAs as at the end of the previous reporting period (30.06.2019)
42,319,553 3,385,564
2 Asset size -22,021,937 -1,761,755
3 Credit quality of counterparties - -
4 Model updates (IMM only) - -
5 Methodology and policy (IMM only) - -
6 Acquisitions and disposals - -
7 Foreign exchange movements - -
8 Other - -
9 RWAs as at the end of the current reporting period (30.09.2019)
20,297,616 1,623,809
Disclosure Report as of September 30, 2019
19
6. EXCESSIVE LEVERAGE RISK
Description of Excessive Leverage Risk
Risk of excessive leverage represents the risk resulting from the Bank’s vulnerability due to leverage or contingent leverage that may require unintended corrective measures to its business plan, including distressed selling of assets which might result in losses or in valuation adjustments to its remaining assets.
The monitoring of risk of excessive leverage is realized based on specific instructions received from the Group and by taking into account the legal provisions in force.
Thus, the Leverage Ratio indicator, calculated according to instructions received from Group is included in the Risk Appetite Framework of the Bank. A system of limits comprising a Target level, a Trigger and a Limit is applied. Monitoring is done on a quarterly basis.
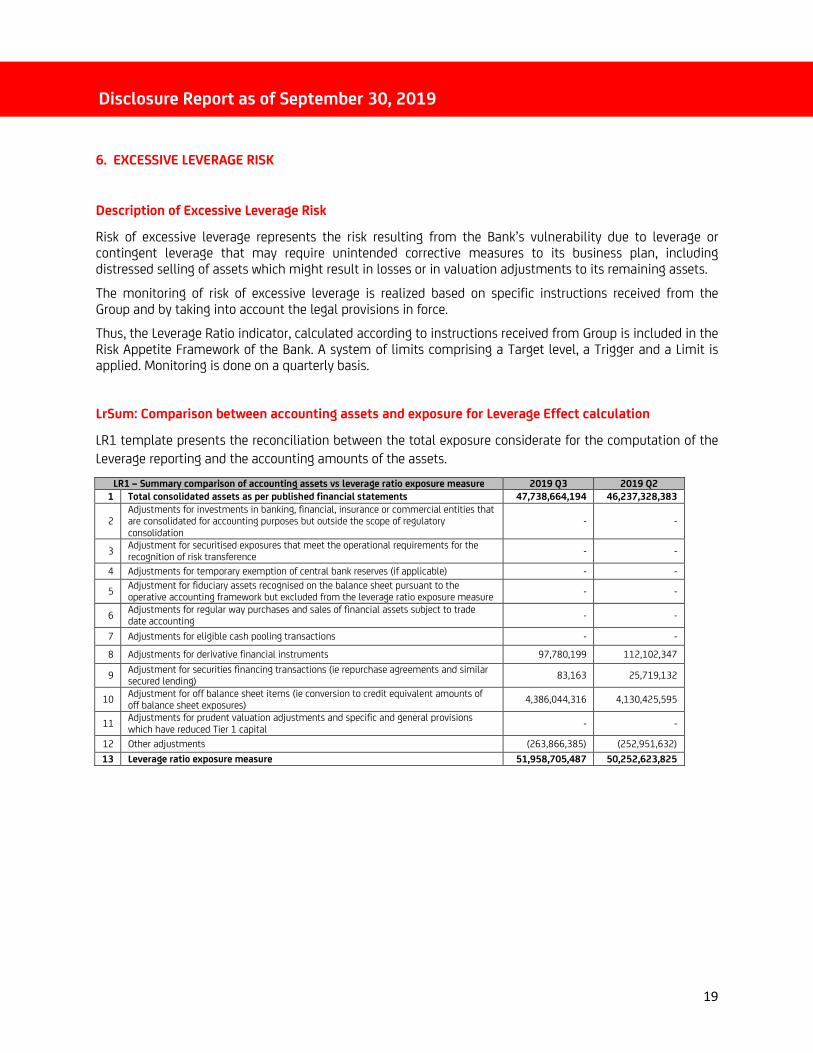
LrSum: Comparison between accounting assets and exposure for Leverage Effect calculation
LR1 template presents the reconciliation between the total exposure considerate for the computation of the
Leverage reporting and the accounting amounts of the assets.
LR1 – Summary comparison of accounting assets vs leverage ratio exposure measure 2019 Q3 2019 Q2
1 Total consolidated assets as per published financial statements 47,738,664,194 46,237,328,383
2 Adjustments for investments in banking, financial, insurance or commercial entities that are consolidated for accounting purposes but outside the scope of regulatory consolidation
- -
3 Adjustment for securitised exposures that meet the operational requirements for the recognition of risk transference
- -
4 Adjustments for temporary exemption of central bank reserves (if applicable) - -
5 Adjustment for fiduciary assets recognised on the balance sheet pursuant to the operative accounting framework but excluded from the leverage ratio exposure measure
- -
6 Adjustments for regular way purchases and sales of financial assets subject to trade date accounting
- -
7 Adjustments for eligible cash pooling transactions - -
8 Adjustments for derivative financial instruments 97,780,199 112,102,347
9 Adjustment for securities financing transactions (ie repurchase agreements and similar secured lending)
83,163 25,719,132
10 Adjustment for off balance sheet items (ie conversion to credit equivalent amounts of off balance sheet exposures)
4,386,044,316 4,130,425,595
11 Adjustments for prudent valuation adjustments and specific and general provisions which have reduced Tier 1 capital
- -
12 Other adjustments (263,866,385) (252,951,632)
13 Leverage ratio exposure measure 51,958,705,487 50,252,623,825
Disclosure Report as of September 30, 2019
20
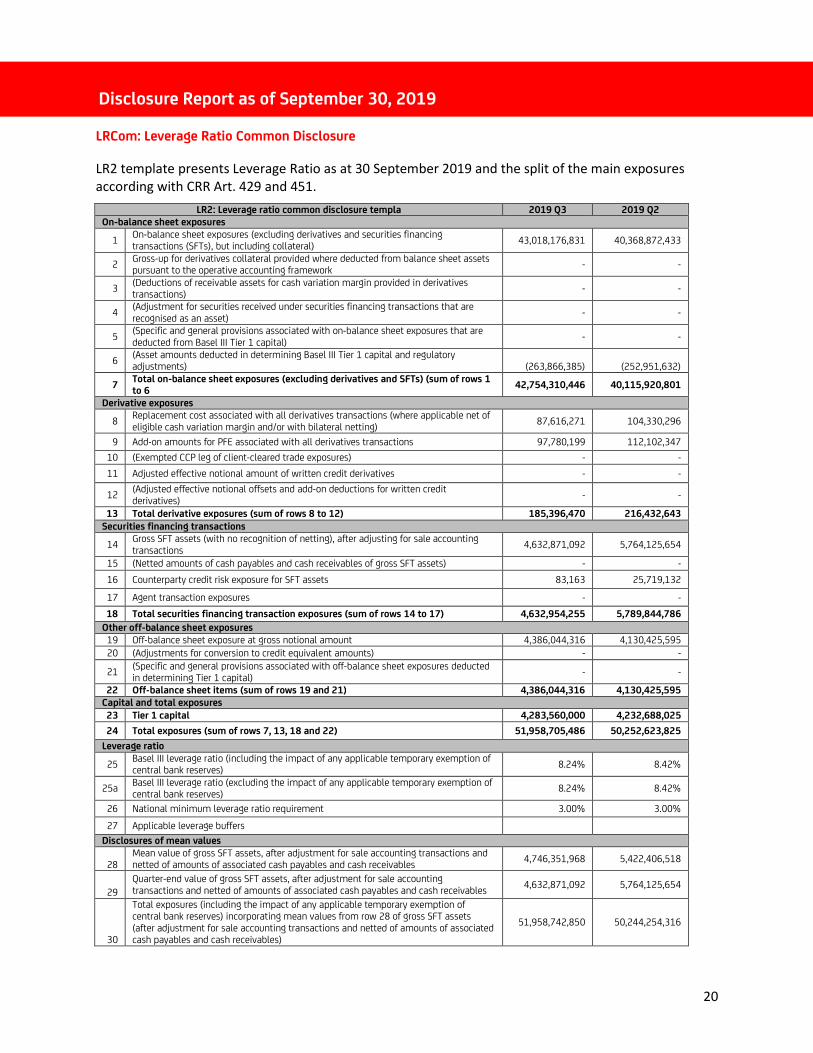
LRCom: Leverage Ratio Common Disclosure
LR2 template presents Leverage Ratio as at 30 September 2019 and the split of the main exposures
according with CRR Art. 429 and 451.
LR2: Leverage ratio common disclosure templa 2019 Q3 2019 Q2
On-balance sheet exposures
1 On-balance sheet exposures (excluding derivatives and securities financing transactions (SFTs), but including collateral)
43,018,176,831 40,368,872,433
2 Gross-up for derivatives collateral provided where deducted from balance sheet assets pursuant to the operative accounting framework
- -
3 (Deductions of receivable assets for cash variation margin provided in derivatives transactions)
- -
4 (Adjustment for securities received under securities financing transactions that are recognised as an asset)
- -
5 (Specific and general provisions associated with on-balance sheet exposures that are deducted from Basel III Tier 1 capital)
- -
6 (Asset amounts deducted in determining Basel III Tier 1 capital and regulatory adjustments)
(263,866,385)
(252,951,632)
7 Total on-balance sheet exposures (excluding derivatives and SFTs) (sum of rows 1 to 6
42,754,310,446 40,115,920,801
Derivative exposures
8 Replacement cost associated with all derivatives transactions (where applicable net of eligible cash variation margin and/or with bilateral netting)
87,616,271 104,330,296
9 Add-on amounts for PFE associated with all derivatives transactions 97,780,199 112,102,347
10 (Exempted CCP leg of client-cleared trade exposures) - -
11 Adjusted effective notional amount of written credit derivatives - -
12 (Adjusted effective notional offsets and add-on deductions for written credit derivatives)
- -
13 Total derivative exposures (sum of rows 8 to 12) 185,396,470 216,432,643
Securities financing transactions
14 Gross SFT assets (with no recognition of netting), after adjusting for sale accounting transactions
4,632,871,092 5,764,125,654
15 (Netted amounts of cash payables and cash receivables of gross SFT assets) - -
16 Counterparty credit risk exposure for SFT assets 83,163 25,719,132
17 Agent transaction exposures - -
18 Total securities financing transaction exposures (sum of rows 14 to 17) 4,632,954,255 5,789,844,786
Other off-balance sheet exposures
19 Off-balance sheet exposure at gross notional amount 4,386,044,316 4,130,425,595
20 (Adjustments for conversion to credit equivalent amounts) - -
21 (Specific and general provisions associated with off-balance sheet exposures deducted in determining Tier 1 capital)
- -
22 Off-balance sheet items (sum of rows 19 and 21) 4,386,044,316 4,130,425,595
Capital and total exposures
23 Tier 1 capital 4,283,560,000 4,232,688,025
24 Total exposures (sum of rows 7, 13, 18 and 22) 51,958,705,486 50,252,623,825
Leverage ratio
25 Basel III leverage ratio (including the impact of any applicable temporary exemption of central bank reserves)
8.24% 8.42%
25a Basel III leverage ratio (excluding the impact of any applicable temporary exemption of central bank reserves)
8.24% 8.42%
26 National minimum leverage ratio requirement 3.00% 3.00%
27 Applicable leverage buffers
Disclosures of mean values
28 Mean value of gross SFT assets, after adjustment for sale accounting transactions and netted of amounts of associated cash payables and cash receivables
4,746,351,968 5,422,406,518
29
Quarter-end value of gross SFT assets, after adjustment for sale accounting transactions and netted of amounts of associated cash payables and cash receivables
4,632,871,092 5,764,125,654
30
Total exposures (including the impact of any applicable temporary exemption of central bank reserves) incorporating mean values from row 28 of gross SFT assets (after adjustment for sale accounting transactions and netted of amounts of associated cash payables and cash receivables)
51,958,742,850 50,244,254,316
Disclosure Report as of September 30, 2019
21
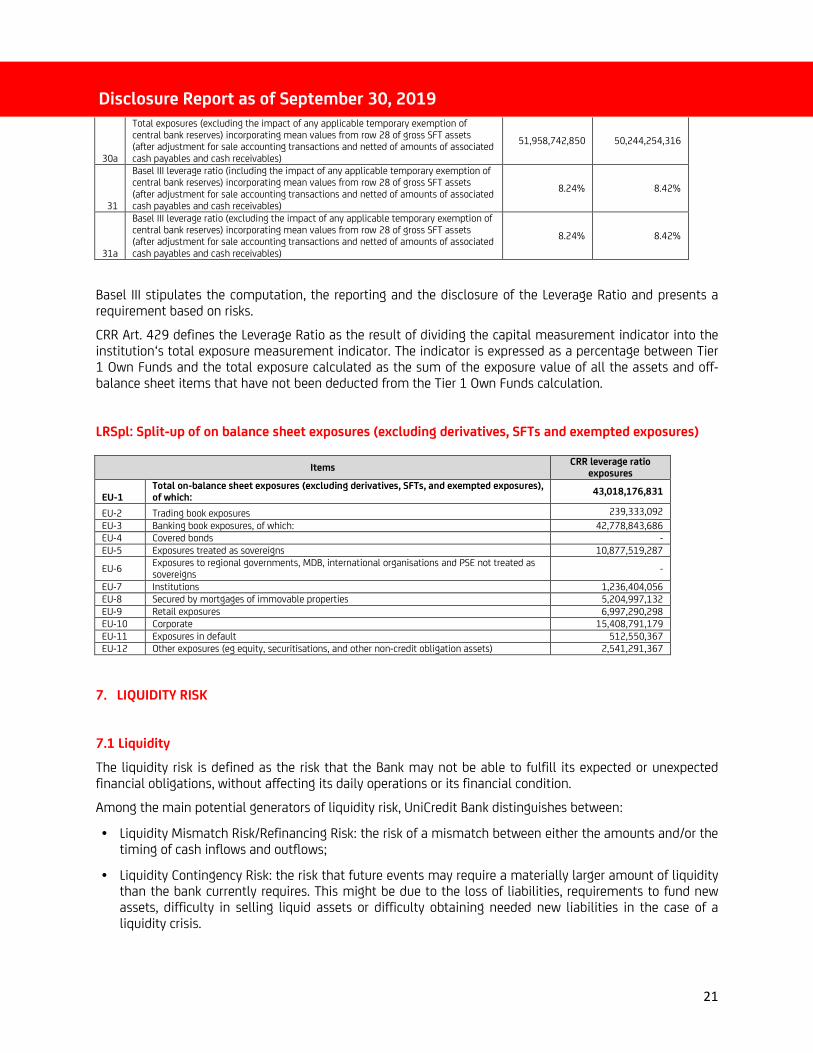
30a
Total exposures (excluding the impact of any applicable temporary exemption of central bank reserves) incorporating mean values from row 28 of gross SFT assets (after adjustment for sale accounting transactions and netted of amounts of associated cash payables and cash receivables)
51,958,742,850 50,244,254,316
31
Basel III leverage ratio (including the impact of any applicable temporary exemption of central bank reserves) incorporating mean values from row 28 of gross SFT assets (after adjustment for sale accounting transactions and netted of amounts of associated cash payables and cash receivables)
8.24% 8.42%
31a
Basel III leverage ratio (excluding the impact of any applicable temporary exemption of central bank reserves) incorporating mean values from row 28 of gross SFT assets (after adjustment for sale accounting transactions and netted of amounts of associated cash payables and cash receivables)
8.24% 8.42%
Basel III stipulates the computation, the reporting and the disclosure of the Leverage Ratio and presents a requirement based on risks.
CRR Art. 429 defines the Leverage Ratio as the result of dividing the capital measurement indicator into the institution‘s total exposure measurement indicator. The indicator is expressed as a percentage between Tier 1 Own Funds and the total exposure calculated as the sum of the exposure value of all the assets and off-balance sheet items that have not been deducted from the Tier 1 Own Funds calculation.
LRSpl: Split-up of on balance sheet exposures (excluding derivatives, SFTs and exempted exposures)
Items CRR leverage ratio
exposures
EU-1 Total on-balance sheet exposures (excluding derivatives, SFTs, and exempted exposures), of which:
43,018,176,831
EU-2 Trading book exposures 239,333,092
EU-3 Banking book exposures, of which: 42,778,843,686
EU-4 Covered bonds -
EU-5 Exposures treated as sovereigns 10,877,519,287
EU-6 Exposures to regional governments, MDB, international organisations and PSE not treated as sovereigns
-
EU-7 Institutions 1,236,404,056
EU-8 Secured by mortgages of immovable properties 5,204,997,132
EU-9 Retail exposures 6,997,290,298
EU-10 Corporate 15,408,791,179
EU-11 Exposures in default 512,550,367
EU-12 Other exposures (eg equity, securitisations, and other non-credit obligation assets) 2,541,291,367
7. LIQUIDITY RISK
7.1 Liquidity
The liquidity risk is defined as the risk that the Bank may not be able to fulfill its expected or unexpected financial obligations, without affecting its daily operations or its financial condition.
Among the main potential generators of liquidity risk, UniCredit Bank distinguishes between:
• Liquidity Mismatch Risk/Refinancing Risk: the risk of a mismatch between either the amounts and/or the timing of cash inflows and outflows;
• Liquidity Contingency Risk: the risk that future events may require a materially larger amount of liquidity than the bank currently requires. This might be due to the loss of liabilities, requirements to fund new assets, difficulty in selling liquid assets or difficulty obtaining needed new liabilities in the case of a liquidity crisis.
Disclosure Report as of September 30, 2019
22
• Market liquidity risk: the risk that the institution cannot easily unwind or offset specific exposures, such as investments held as liquidity reserves, without incurring a loss because of inadequate market depth or market disruptions;
The Bank’s liquidity and funding strategy is centered on the following strategic principles and goals set in coherence with the risk appetite:
Strategic Principles
• Liquidity and funding management is based on clear and strict risk management principles set according to the Risk Appetite Framework (RAF).
• The definition of the desired liquidity profile is fully integrated within the Risk Appetite Framework, in order to drive the evolution of the lending activity consistently with the desired funding profile.
• The self-sufficiency funding strategy is based on a well-diversified funding base due to its commercial banking model, with priority given on the growth of local funding sources out of customer business with a variety of products (sight, savings, term deposits), as well as capital market transactions (e.g. medium- and long-term placements of own issues).
• The strict principle of self-sufficient funding ensures that the proceeds are used primarily for business development, enabling UCB and the Group to calculate funding costs according to own risk profile.
• All strategic goals must be in compliance with UniCredit Group Strategy and Regulatory requirements.
Strategic Goals
• Optimization of the liquidity profile in line with liquidity limits in place and local regulatory framework, maximizing cost savings without sacrificing funding diversification
• Self-sufficiency target fulfillment by achieving a sound commercial funding base and creating a foundation for full compliance with the relevant Risk Appetite Framework metrics
• Achievement of main KPIs for each year in accordance with the Risk Appetite Framework, designed as quantitative targets defined in the yearly Funding Plan for, among others, the Liquidity Coverage Ratio and the Funding Gap
• Achievement of the necessary resilience towards stress scenario through building sufficient stock of the Counter Balancing Capacity
• Exploring the advantage of cheaper sources like Covered Bond or Supranational Funding and evaluating the relevant maturities of medium/long term issuances
• Keeping the funding dependency on short term wholesale external funding to a reasonable level necessary for reciprocity
• Efficient management of the trading/investment book financing (mitigating the use of intragroup funding) in compliance with intragroup rules for bond investments, as well as market risk and credit risk limits.
Disclosure Report as of September 30, 2019
23
Key Principles
Liquidity management is performed by UniCredit Bank in accordance with local binding laws and regulations and UniCredit Group Liquidity Management Framework. Clear and strict risk management principles are set according to the Bank’s Risk Appetite Framework.
The main goal of Unicredit Bank’s overall liquidity management is to keep the liquidity exposure at such a level that the Bank is able to honor its payment obligations on an on-going basis, but also during a crisis without jeopardizing its franchise value or its brand’s name.
Roles and Responsibilities
A clear separation of duties and responsibilities is implemented in UniCredit Bank for an efficient and effective management of liquidity risk. Accordingly, the Bank keeps two governance layers:
• Managing Bodies acting as strategic decision-taking functions (as the Board of Directors, Supervisory Board, Assets and Liabilities Committee)
• Operational units acting as operative liquidity management functions, each being assigned different roles and responsibilities: Finance/ALM, Markets, Financial Risk.
In particular, ALM provides strategic planning, management and supervision of the Bank’s overall liquidity position, whilst Markets ensures operational short-term liquidity management (up to 1 year). Market Risk has the responsibilities of independent controls and reporting of liquidity risk.
Risk Measurement and Reporting
Techniques for risk measurement
Liquidity risk, for its particular nature, is addressed by means of gap analyses, liquidity stress testing, and complementary measures (mainly through a set of indicators: e.g. loan to deposit ratio, liquidity coverage ratio). This tool allows the measurement of liquidity risk over different time horizons and by currencies.
Liquidity Framework
UniCredit Bank’s liquidity framework encompasses: short term liquidity risk management (operational liquidity, up to 1Y) and structural liquidity risk management (liquidity position over 1y).
• Intraday liquidity management,
The focus of intraday liquidity management is on actively managing the Bank’s intraday liquidity obligations
by timely meeting payments and keeping a sustainable intraday liquidity buffer.
• Short-term liquidity risk management (operational liquidity):
Short term liquidity management and reporting focuses on the Bank’s liquidity profile from 1 day up to one
year.
The aim of short term liquidity management is to maintain a sustainable equilibrium between cash inflows
and cash outflows for the purpose of ensuring the normal operational continuity of the UniCredit bank’s
commercial business. The main activities for attaining such purpose are:
- Managing the access to the payment systems and of the cash payments (operational liquidity management)
- Monitoring the level of the liquidity reserves and the extent of their utilization over time, with the objective of maintaining the liquidity reserves at appropriate levels in order to meet potential outflows.
Disclosure Report as of September 30, 2019
24
As indicator of the short term liquidity risk, apart from the Liquidity Coverage Ratio, UniCredit Bank adopted
the Operative Maturity Ladder (OML) by currency, whose main components are the net contractual cash flows
(in/outflows) affecting the cash position of Bank, thus impacting directly the “core liquidity” of the bank over
pre-defined time buckets, and the Counterbalancing capacity.
• Medium and long-term liquidity risk management (structural risk):
Structural liquidity management aims at ensuring the financial stability of the balance sheet, with the
objective of avoiding excessive and unexpected pressures on the funding requirements over the short term,
whilst optimizing the funding sources and related costs. This is achieved maintenance of an adequate
balance between the medium- long term and sticky assets and the respective stable sources of funding.
The main metric used to measure medium-long term liquidity risk is the Net Stable Funding Ratio, along
with managerial structural liquidity ratios/gaps.
Liquidity Stress Testing
Stress testing is a risk management technique used to evaluate the potential effects on an institution’s financial condition of a specific event and/or movement in a set of financial variables.
UniCredit Bank performs regular liquidity stress tests in order to diagnose the Bank’s liquidity risk. The main scenarios of potential liquidity crisis identified are:
• Name Crisis Scenario - defined as a factual or market-hypothesized problem specific to the Bank, expected to cause a substantial reduction in counterparty limits by rating-sensitive costumers and inter-bank markets and possible withdrawal of Sight and Saving Deposits
• Market Downturn Scenario - defined as a generally negative development in the market’s environment (e.g. broad sector, market or economic events) causing an increased stretch on available liquidity
• Combined Scenario - highlights the interconnections that stem from the happening of both economic turmoil and Bank’s specific issues
In particular the results of the stress tests are useful for:
• Assessing the adequacy of liquidity limits
• Assessing the right size of the counterbalancing capacity/liquidity buffer to withstand a given scenario within a defined timeframe
• Providing support to the development of the contingency plan.
Monitoring and Reporting
UniCredit Bank measures and manages liquidity based on monitoring system that envisages different types of restrictions – managerial and regulatory – embedded in risk metrics limits or warning/trigger levels.
In case of limit breach or warning level activation, Financial Risk function investigates the rationale of the events, triggering the proper escalation and reporting them to the relevant committees.
Regulatory reports refer to LCR (liquidity coverage ratio), NSFR (net stable funding ratio) and ALMM (additional liquidity monitoring metrics). In addition are the reports required by the national regulations.
Disclosure Report as of September 30, 2019
25
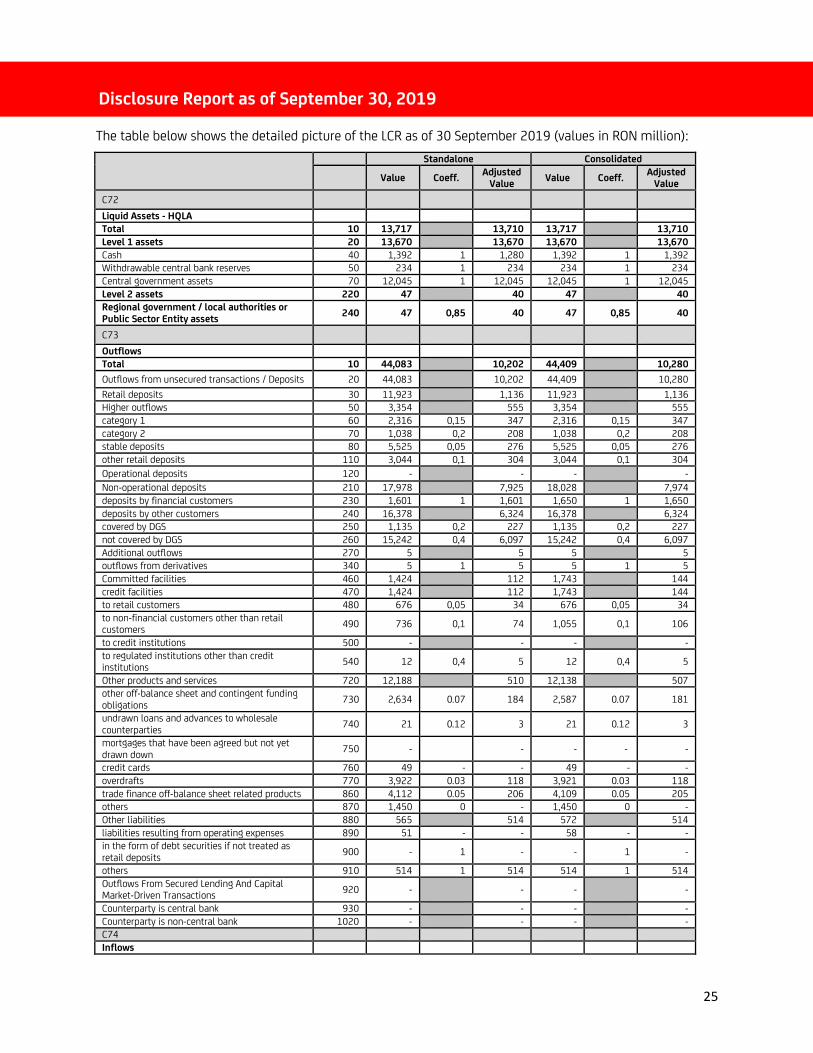
The table below shows the detailed picture of the LCR as of 30 September 2019 (values in RON million):
Standalone Consolidated
Value Coeff.
Adjusted Value
Value Coeff. Adjusted
Value
C72 Liquid Assets - HQLA
Total 10 13,717 13,710 13,717 13,710
Level 1 assets 20 13,670 13,670 13,670 13,670
Cash 40 1,392 1 1,280 1,392 1 1,392
Withdrawable central bank reserves 50 234 1 234 234 1 234
Central government assets 70 12,045 1 12,045 12,045 1 12,045
Level 2 assets 220 47 40 47 40
Regional government / local authorities or
Public Sector Entity assets 240 47 0,85 40 47 0,85 40
C73 Outflows
Total 10 44,083 10,202 44,409 10,280
Outflows from unsecured transactions / Deposits 20 44,083 10,202 44,409 10,280
Retail deposits 30 11,923 1,136 11,923 1,136
Higher outflows 50 3,354 555 3,354 555
category 1 60 2,316 0,15 347 2,316 0,15 347
category 2 70 1,038 0,2 208 1,038 0,2 208
stable deposits 80 5,525 0,05 276 5,525 0,05 276
other retail deposits 110 3,044 0,1 304 3,044 0,1 304
Operational deposits 120 - - - -
Non-operational deposits 210 17,978 7,925 18,028 7,974
deposits by financial customers 230 1,601 1 1,601 1,650 1 1,650
deposits by other customers 240 16,378 6,324 16,378 6,324
covered by DGS 250 1,135 0,2 227 1,135 0,2 227
not covered by DGS 260 15,242 0,4 6,097 15,242 0,4 6,097
Additional outflows 270 5 5 5 5
outflows from derivatives 340 5 1 5 5 1 5
Committed facilities 460 1,424 112 1,743 144
credit facilities 470 1,424 112 1,743 144
to retail customers 480 676 0,05 34 676 0,05 34
to non-financial customers other than retail customers
490 736 0,1 74 1,055 0,1 106
to credit institutions 500 - - - -
to regulated institutions other than credit institutions
540 12 0,4 5 12 0,4 5
Other products and services 720 12,188 510 12,138 507
other off-balance sheet and contingent funding obligations
730 2,634 0.07 184 2,587 0.07 181
undrawn loans and advances to wholesale counterparties
740 21 0.12 3 21 0.12 3
mortgages that have been agreed but not yet drawn down
750 - - - - -
credit cards 760 49 - - 49 - -
overdrafts 770 3,922 0.03 118 3,921 0.03 118
trade finance off-balance sheet related products 860 4,112 0.05 206 4,109 0.05 205
others 870 1,450 0 - 1,450 0 -
Other liabilities 880 565 514 572 514
liabilities resulting from operating expenses 890 51 - - 58 - -
in the form of debt securities if not treated as retail deposits
900 - 1 - - 1 -
others 910 514 1 514 514 1 514
Outflows From Secured Lending And Capital Market-Driven Transactions
920 - - - -
Counterparty is central bank 930 - - - -
Counterparty is non-central bank 1020 - - - -
C74
Inflows
Disclosure Report as of September 30, 2019
26
Total 10 14,267 541 14,530 682
Inflows from unsecured transactions/deposits 20 9,634 541 9,897 682
monies due from non-financial customers 30 234 117 479 239
monies due from financial customers 100 328 328 347 347
monies due from assets with an undefined contractual end date
200 8,976 - - 8,976 0 -
inflows from derivatives 240 6 1 6 6 1 6
other inflows 260 90 1 90 90 1 90
Inflows from secured lending and capital market-driven transactions
270 4,633 - 4,633 -
collateral that qualifies as a liquid asset 280 4,633 - - 4,633 - -
collateral that does not qualify as a liquid asset 370 - - - - - -
Liquidity Coverage Ratio - 141.91% 142.84%
The high quality liquid assets reserve consists of coins and banknotes, withdraw able reserves held at the National Bank and securities issued by the Romanian government and local public authorities. In addition, the high quality assets also include securities received as collateral in reverse repo transactions.
Liquidity outflows are influenced mostly by the evolution of non-operational deposits of corporate and sovereign customers, which is also the main source of funding for the bank.
Liquidity inflows are composed mainly of maturing deposits held at financial institutions and of instalments from client loans. Unicredit Bank has a prudent approach regarding assets with an undefined contractual end date, applying a weight of 0% to these amounts.
During 3nd quarter 2019, the significant currencies for LCR reporting were RON and EUR. From a currency mismatch point of view, during Q3 2019 there were some significant amounts in EUR reverse repo transactions, while the main funding sources are made up of deposits denominated mostly in the national currency from the retail and corporate customers, as well as deposits and credit facilities in EUR received from group entities and supranational institutions. The mentioned reverse repo transactions had short maturities, under30 days, and were collateralised by high quality level 1 government bonds. The liquidity surplus in EUR has been partially generated by short term FX swaps using RON and other currencies which have structural long liquidity position (i.e. USD).
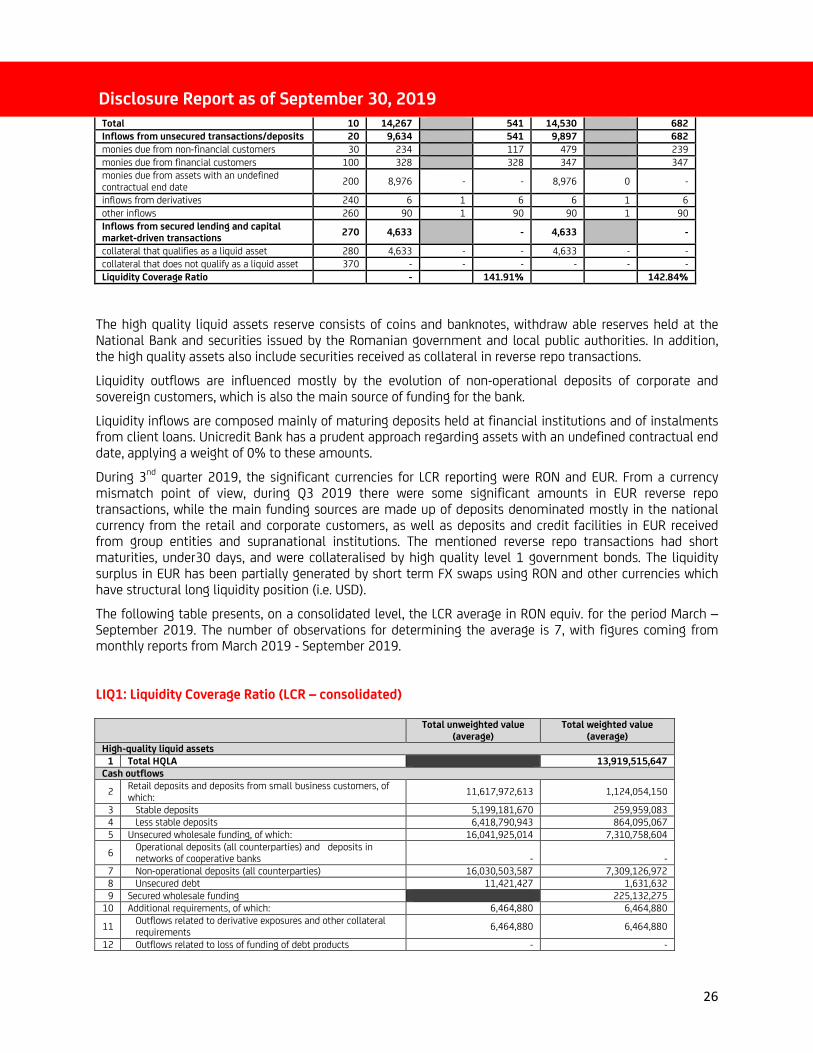
The following table presents, on a consolidated level, the LCR average in RON equiv. for the period March – September 2019. The number of observations for determining the average is 7, with figures coming from monthly reports from March 2019 - September 2019.
LIQ1: Liquidity Coverage Ratio (LCR – consolidated)
Total unweighted value
(average)
Total weighted value
(average)
High-quality liquid assets
1 Total HQLA
13,919,515,647
Cash outflows
2 Retail deposits and deposits from small business customers, of which:
11,617,972,613 1,124,054,150
3 Stable deposits 5,199,181,670 259,959,083
4 Less stable deposits 6,418,790,943 864,095,067
5 Unsecured wholesale funding, of which: 16,041,925,014 7,310,758,604
6 Operational deposits (all counterparties) and deposits in networks of cooperative banks - -
7 Non-operational deposits (all counterparties) 16,030,503,587 7,309,126,972
8 Unsecured debt 11,421,427 1,631,632
9 Secured wholesale funding 225,132,275
10 Additional requirements, of which: 6,464,880 6,464,880
11 Outflows related to derivative exposures and other collateral requirements
6,464,880 6,464,880
12 Outflows related to loss of funding of debt products - -
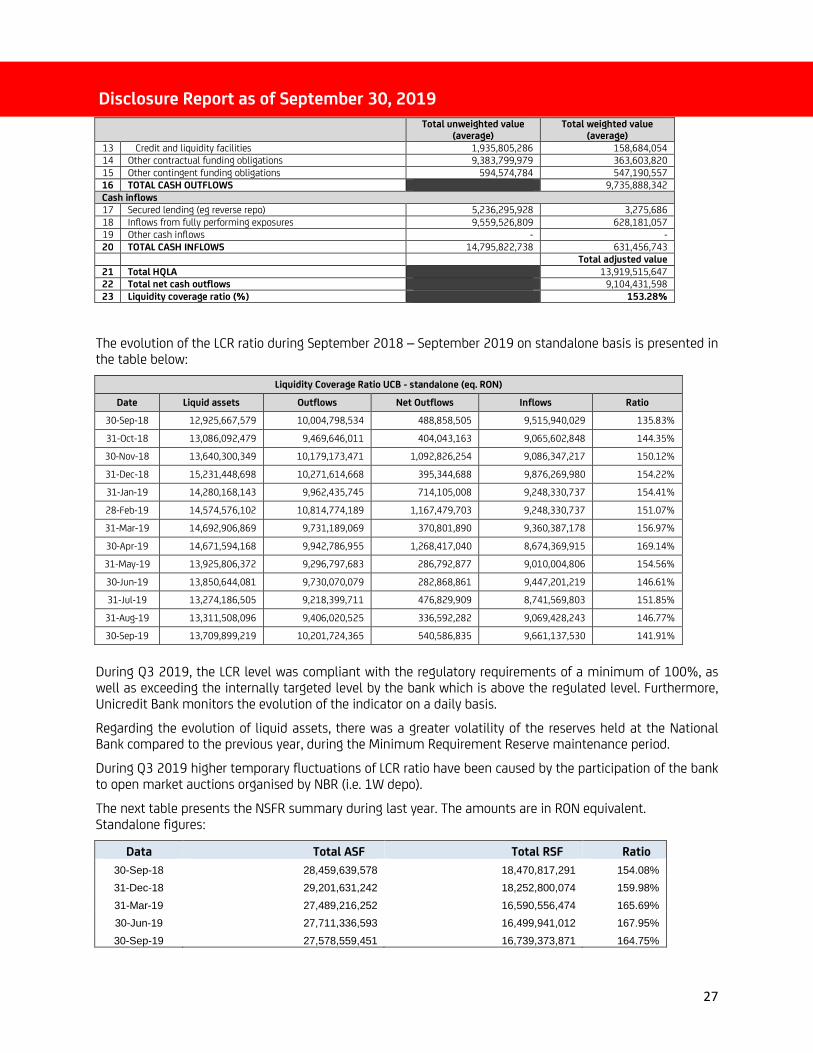
Disclosure Report as of September 30, 2019
27
Total unweighted value
(average) Total weighted value
(average)
13 Credit and liquidity facilities 1,935,805,286 158,684,054
14 Other contractual funding obligations 9,383,799,979 363,603,820
15 Other contingent funding obligations 594,574,784 547,190,557
16 TOTAL CASH OUTFLOWS 9,735,888,342
Cash inflows
17 Secured lending (eg reverse repo) 5,236,295,928 3,275,686
18 Inflows from fully performing exposures 9,559,526,809 628,181,057
19 Other cash inflows - -
20 TOTAL CASH INFLOWS 14,795,822,738 631,456,743
Total adjusted value
21 Total HQLA 13,919,515,647
22 Total net cash outflows 9,104,431,598
23 Liquidity coverage ratio (%) 153.28%
The evolution of the LCR ratio during September 2018 – September 2019 on standalone basis is presented in the table below:
Liquidity Coverage Ratio UCB - standalone (eq. RON)
Date Liquid assets Outflows Net Outflows Inflows Ratio
30-Sep-18 12,925,667,579 10,004,798,534 488,858,505 9,515,940,029 135.83%
31-Oct-18 13,086,092,479 9,469,646,011 404,043,163 9,065,602,848 144.35%
30-Nov-18 13,640,300,349 10,179,173,471 1,092,826,254 9,086,347,217 150.12%
31-Dec-18 15,231,448,698 10,271,614,668 395,344,688 9,876,269,980 154.22%
31-Jan-19 14,280,168,143 9,962,435,745 714,105,008 9,248,330,737 154.41%
28-Feb-19 14,574,576,102 10,814,774,189 1,167,479,703 9,248,330,737 151.07%
31-Mar-19 14,692,906,869 9,731,189,069 370,801,890 9,360,387,178 156.97%
30-Apr-19 14,671,594,168 9,942,786,955 1,268,417,040 8,674,369,915 169.14%
31-May-19 13,925,806,372 9,296,797,683 286,792,877 9,010,004,806 154.56%
30-Jun-19 13,850,644,081 9,730,070,079 282,868,861 9,447,201,219 146.61%
31-Jul-19 13,274,186,505 9,218,399,711 476,829,909 8,741,569,803 151.85%
31-Aug-19 13,311,508,096 9,406,020,525 336,592,282 9,069,428,243 146.77%
30-Sep-19 13,709,899,219 10,201,724,365 540,586,835 9,661,137,530 141.91%
During Q3 2019, the LCR level was compliant with the regulatory requirements of a minimum of 100%, as well as exceeding the internally targeted level by the bank which is above the regulated level. Furthermore, Unicredit Bank monitors the evolution of the indicator on a daily basis.
Regarding the evolution of liquid assets, there was a greater volatility of the reserves held at the National Bank compared to the previous year, during the Minimum Requirement Reserve maintenance period.
During Q3 2019 higher temporary fluctuations of LCR ratio have been caused by the participation of the bank to open market auctions organised by NBR (i.e. 1W depo).
The next table presents the NSFR summary during last year. The amounts are in RON equivalent. Standalone figures:
Data Total ASF Total RSF Ratio
30-Sep-18 28,459,639,578 18,470,817,291 154.08%
31-Dec-18 29,201,631,242 18,252,800,074 159.98%
31-Mar-19 27,489,216,252 16,590,556,474 165.69%
30-Jun-19 27,711,336,593 16,499,941,012 167.95%
30-Sep-19 27,578,559,451 16,739,373,871 164.75%
Disclosure Report as of September 30, 2019
28
During September 2018 – September 2019, UniCredit Bank maintained an adequate level of the NSFR, with an average for the last 4 quarters over 150%, stable funding covering the duration of long term assets. At consolidated level the average NSFR was 149.12%
The items requiring stable funding consisted of investments in securities, loans and credit lines, while stable funding was provided by items such as capital instruments, retail and corporate deposits, intragroup financing and facilities from supranational entities.
Risk Mitigation
The main liquidity mitigation factors for UniCredit Bank are:
• Planning and monitoring of the short-term and medium to long-term liquidity needs;
• An effective Contingency Liquidity Policy (CLP), including a Contingency Action Plan to be executed in case of market crisis;
• A liquidity buffer to face unexpected outflows;
• Liquidity stress testing performed on a regular basis;
• A system of early warning indicators to anticipate increased risk or vulnerabilities in the liquidity position or potential funding needs.
Funding Plan
The Funding Plan plays a fundamental role in overall liquidity management, influencing both the short term and long term liquidity position, It includes the set of the medium long term instruments (with relevant amount, maturity, timing, cost) to be realized in order to cover the expected funding deriving from the planned evolution of the liquidity uses and, avoiding pressure on the short term and ensuring compliance with regulatory and managerial limits.
The Funding Plan is updated at least on a yearly basis and is aligned with the Financial Planning (Budgeting) process and the Risk Appetite Framework.
Contingency Liquidity Management
Contingency Liqudity Management has the objective of ensuring the availability of an effective organizational model in order to manage effectively the negative effects of a liquidity crisis situation, which is achieved through:
• setup of an extraordinary liquidity crisis governance model, linked to a set of early warning indicators, that can be activated in case of a crisis;
• pre-definition of a set of available standby mitigating liquidity actions in order to be able to proceed timely;
• consistent internal and external communication crisis.
A relevant part of the contingency liquidity management is the Contingency Funding Plan, which describes potential, but concrete actions the Bank can take in order to obtain additional funding in contingency situations and is complementary to the yearly Funding Plan, The measures foreseen are described in terms of a menu of actions together with sizes, instruments, and timing of execution aimed at improving the Bank’s liquidity position during times of name or systemic crisis.
Disclosure Report as of September 30, 2019
29
Early warning indicators
In order to identify emerging vulnerabilities in its liquidity risk position or potential funding needs, UniCredit Bank employs a set of early warning indicators linked to macroeconomic or market indicators and specific internal metrics, A specific activation mechanism is adopted in order to have sufficient time to inform senior management of a deteriorating situation and allow putting in place adequate actions aimed at restoring the business-as-usual state.
Concentration of funding and liquidity sources
At the end of September 2019 the customer deposits generated ~86% of the total liabilities (on standalone level). Out of total resources from non-banking customers, 38,5% were deposits from retail customers, The bank made efforts to decrease the share of sovereign, non-financial corporates and other financial customers in total liabilities.
With regard to counterparties, the main fund providers of the bank are other entities from UniCredit Group, consisting of medium and long term deposits and subordinated loans, International financial institutions (supra-nationals) and large non-financial corporates are present in the top of 10 counterparties which generate more than 1% of total liabilities.
7.2 Liquidity Buffer and Funding strategy
Liquidity Buffer
In order to avoid that short-term liquidity crunch or other unexpected events that might lead to potentially serious consequences, the Bank constantly maintains a liquidity reserve, This is a cushion represented by an ample amount of cash and other highly liquid assets to be promptly converted in cash (either through sale or collateralized funding) in case of ordinary or unexpected needs of liquidity, in accordance with regulatory and internal liquidity rules.
Stress testing (regulatory or internal stress scenarios) ensures that there is adequate liquidity both during normal economic cycles, as well as periods of sustained stress and that appropriate excess liquidity buffer is in place.
The major category in the Bank’s liquidity buffer is represented by high quality bonds issued by the Government of Romania, eligible at Central Bank. However we underline that a significant part of liquidity buffer is generated by bonds accepted as guarantee for reverse repo transactions. Entire portfolio of bonds related to reverse repo transaction is represented by extremely high liquidity and credit quality assets.
Liquidity and Funding strategy
UniCredit Bank reviews annualy its liquidity and funding strategy by considering the desired business model, the actual and expected macroeconomic/financial conditions and the funding capacity of the Bank, as well as the overall risk tolerance as reflected by the Risk Appetite Framework, The strategy is implemented in all management stages of liquidity and financing, from financial planning and monitoring to implementation and execution of the process.
The strategic principle of “self-sufficiency” governs the liquidity and funding strategy of the Bank, which targets to achieve a well-diversified funding base, with priority given on the growth of local funding sources out of customer business with a variety of products (sight, savings, term deposits), as well as medium- and long-term placements of own issues.

Disclosure Report as of September 30, 2019
30
In accordance with this principle, the main strategic goals the liquidity and funding strategy encompasses are:
• optimization of the liquidity profile in line with liquidity limits in place and local regulatory framework;
• self-sufficiency target fulfillment by achieving a sound commercial funding base and creating a foundation for full compliance with the relevant Risk Appetite Framework metrics;
• achievement of main KPIs for each year in accordance with the Risk Appetite Framework, designed as quantitative targets defined in the yearly Funding Plan for, among others, the Liquidity Coverage Ratio and the Core Banking Book Funding Gap;
• achievement of the necessary resilience towards stress scenario through building sufficient stock of the Counter Balancing Capacity, as targeted in the yearly Funding Plan;
• exploring the advantage of cheaper sources like Covered Bond or Supranational Funding and evaluating the relevant maturities of medium/long term issuances;
• keeping the funding dependency on short term wholesale external funding to a reasonable level necessary for reciprocity.
The main tool through which the Bank implements its liquidity and funding strategy is the Funding Plan, Finance is responsible for the execution of the Funding Plan, accessing the markets for medium and long term funding, in order to increase Bank’s self-sufficiency, exploit market opportunities and optimize the cost of funds.
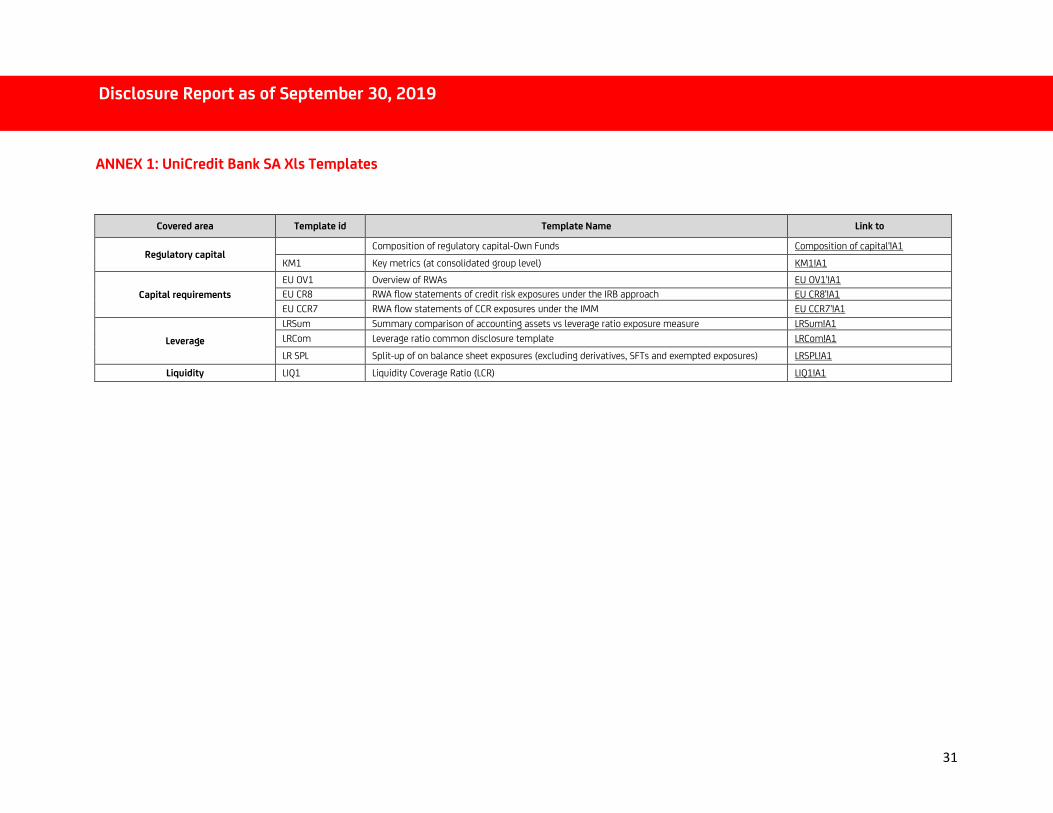
Disclosure Report as of September 30, 2019
31
ANNEX 1: UniCredit Bank SA Xls Templates
Covered area Template id Template Name Link to
Regulatory capital Composition of regulatory capital-Own Funds Composition of capital'!A1
KM1 Key metrics (at consolidated group level) KM1!A1
Capital requirements
EU OV1 Overview of RWAs EU OV1'!A1
EU CR8 RWA flow statements of credit risk exposures under the IRB approach EU CR8'!A1
EU CCR7 RWA flow statements of CCR exposures under the IMM EU CCR7'!A1
Leverage
LRSum Summary comparison of accounting assets vs leverage ratio exposure measure LRSum!A1
LRCom Leverage ratio common disclosure template LRCom!A1
LR SPL Split-up of on balance sheet exposures (excluding derivatives, SFTs and exempted exposures) LRSPL!A1
Liquidity LIQ1 Liquidity Coverage Ratio (LCR) LIQ1!A1