Pillar 3 Disclosure 2019 - Nationwide Building Society › ... › Pillar-3-2019.pdf · Nationwide...
114
Pillar 3 Disclosure 2019 Your Society. Strong today, investing for tomorrow. Jade, member since 2013 Sienna, member since 2016 Jeanette, member since 2013
Transcript of Pillar 3 Disclosure 2019 - Nationwide Building Society › ... › Pillar-3-2019.pdf · Nationwide...

Pillar 3 Disclosure 2019Your Society. Strong today, investing for tomorrow.
Jade, member since 2013 Sienna, member since 2016Jeanette, member since 2013
Nationwide Pillar 3 Disclosure 2019
2
Contents
1 Executive Summary ....................................................................................................................... 6
1.1 Introduction ................................................................................................................................................................... 6
1.2 Summary of key metrics ............................................................................................................................................... 6
2 Introduction .................................................................................................................................... 9
2.1 Background ................................................................................................................................................................... 9
2.2 Scope ............................................................................................................................................................................. 9
2.3 Risk appetite ................................................................................................................................................................ 10
2.4 Individual (Solo) consolidation .................................................................................................................................... 10
2.5 Reporting ...................................................................................................................................................................... 10
2.6 Changes to disclosure requirements .......................................................................................................................... 10
2.7 Location ........................................................................................................................................................................ 10
2.8 Policy, verification and sign off ................................................................................................................................... 10
3 Capital resources .......................................................................................................................... 11
3.1 Total available capital .................................................................................................................................................. 11
3.2 Common Equity Tier 1 capital ..................................................................................................................................... 11
3.3 Tier 1 capital ................................................................................................................................................................. 11
3.4 Tier 2 capital................................................................................................................................................................. 11
3.5 Leverage ratio .............................................................................................................................................................. 15
4 Capital requirements .................................................................................................................... 18
4.1 Introduction .................................................................................................................................................................. 18
4.2 Pillar 1 ........................................................................................................................................................................... 18
Credit risk ......................................................................................................................................................................... 18
Operational risk ................................................................................................................................................................ 18
Market risk ........................................................................................................................................................................ 19
Overview of Pillar 1 RWAs and capital requirements .................................................................................................... 19
Changes in value of minimum capital requirements ................................................................................................... 20
4.3 Pillar 2 .......................................................................................................................................................................... 20
Introduction ...................................................................................................................................................................... 20
Internal Capital Adequacy Assessment Process (ICAAP) ............................................................................................. 20
Pillar 2A .............................................................................................................................................................................. 21
Stress testing ..................................................................................................................................................................... 21
4.4 Regulatory capital buffers .......................................................................................................................................... 22
4.5 Countercyclical capital buffer .................................................................................................................................... 22
4.6 Future regulatory developments ............................................................................................................................... 23
5 Risk management ........................................................................................................................ 24
5.1 Managing risk .............................................................................................................................................................. 24
5.2 Enterprise Risk Management Framework (ERMF) ................................................................................................... 24
Risk appetite ..................................................................................................................................................................... 24
Risk strategy ..................................................................................................................................................................... 25
Nationwide Pillar 3 Disclosure 2019
3
Control environment ........................................................................................................................................................ 25
Risk and control management and governance ........................................................................................................... 26
Risk, incident & control reporting .................................................................................................................................. 26
Risk culture ....................................................................................................................................................................... 27
5.3 Effectiveness of risk management arrangements ..................................................................................................... 27
5.4 Coverage of risks .......................................................................................................................................................... 27
5.5 The Group’s risk committee structure and responsibilities ...................................................................................... 27
6 Credit risk ..................................................................................................................................... 29
6.1 Credit risk overview .................................................................................................................................................... 29
6.2 Exposures .................................................................................................................................................................... 29
6.3 Approach to credit risk ............................................................................................................................................... 30
Credit risk under IRB approach ...................................................................................................................................... 30
Credit risk under the standardised approach ............................................................................................................... 30
6.4 IRB models .................................................................................................................................................................. 33
IRB models overview ....................................................................................................................................................... 33
Model risk management of IRB risk ratings systems ................................................................................................... 33
IRB credit risk model performance ................................................................................................................................. 35
6.5 Retail credit risk ........................................................................................................................................................... 41
Management of retail credit risks................................................................................................................................... 41
Credit risk concentration ................................................................................................................................................. 41
Credit risk mitigation ....................................................................................................................................................... 41
6.6 Commercial credit risk ................................................................................................................................................ 41
Overview ........................................................................................................................................................................... 41
Credit risk concentration ................................................................................................................................................. 47
Credit risk mitigation ....................................................................................................................................................... 47
6.7 Treasury credit risk ..................................................................................................................................................... 47
Introduction ...................................................................................................................................................................... 47
Credit risk concentration .................................................................................................................................................. 51
Credit risk mitigation ........................................................................................................................................................ 51
6.8 Equities ......................................................................................................................................................................... 51
6.9 Impairment of financial assets held at amortised cost or FVOCI .............................................................................. 51
6.10 Further credit quality analysis ................................................................................................................................... 53
7 Counterparty credit risk .............................................................................................................. 58
8 Securitisations .............................................................................................................................. 62
9 Operational risk ............................................................................................................................ 65
9.1 Operational risk profile ............................................................................................................................................... 65
9.2 Operational risk framework........................................................................................................................................ 65
9.3 Operational risk governance ...................................................................................................................................... 65
9.4 Risk measurement ...................................................................................................................................................... 65
10 Market Risk ................................................................................................................................... 66
Nationwide Pillar 3 Disclosure 2019
4
10.1 Introduction ................................................................................................................................................................. 66
10.2 Market risk management ........................................................................................................................................... 66
10.3 Interest rate risk ......................................................................................................................................................... 67
10.4 Basis risk ...................................................................................................................................................................... 67
10.5 Sensitivity of net interest income to interest rate risk ............................................................................................. 67
10.6 Other market risks ...................................................................................................................................................... 68
11 Other principal risks .................................................................................................................... 69
11.1 Business risk ................................................................................................................................................................ 69
11.2 Conduct and compliance risk ..................................................................................................................................... 69
11.3 Liquidity and funding risk ........................................................................................................................................... 69
11.4 Pension risk .................................................................................................................................................................. 71
Appendix 1: Asset encumbrance ......................................................................................................... 72
Appendix 2: Remuneration ................................................................................................................. 75
Appendix 3: EBA own funds disclosure template ............................................................................... 81
Appendix 4: Capital instruments key features ................................................................................... 83
Appendix 5: EAD, RWAs and requirements by exposure class and approach ................................. 86
Appendix 6a: Geographical breakdown of exposures (2019) ........................................................... 87
Appendix 6b: Geographical breakdown of exposures (2018) ........................................................... 88
Appendix 7a: Geographical distribution of credit exposures for the CCyB (2019) .......................... 89
Appendix 7b: Geographical distribution of credit exposures for the CCyB (2018) .......................... 90
Appendix 8a: Concentration of exposures (2019) .............................................................................. 91
Appendix 8b: Concentration of exposures (2018) ............................................................................. 92
Appendix 9a: Maturity of exposures (2019) ......................................................................................... 93
Appendix 9b: Maturity of exposures (2018) ....................................................................................... 94
Appendix 10a: Mapping of financial statement categories with regulatory risk categories ........... 95
Appendix 10b: Differences between regulatory exposures and financial statements ..................... 96
Appendix 10c: Outline of the differences in the scopes of consolidation ........................................ 97
Appendix 11: Compliance appendix .................................................................................................... 98
Appendix 12: Table index .................................................................................................................. 106
Glossary .............................................................................................................................................. 108
Abbreviations ...................................................................................................................................... 114
Nationwide Pillar 3 Disclosure 2019
5
Contacts
Sara Batchelor – Media Relations
T: 01793 657770
Alexander Wall – Treasury Investor Relations
T: 0207 2616568
Certain statements in this document are forward looking with respect to plans, goals and expectations relating to the future financial position,
business performance and results of Nationwide. Although Nationwide believes that the expectations reflected in these forward looking statements
are reasonable, Nationwide can give no assurance that these expectations will prove to be an accurate reflection of actual results. By their nature,
all forward looking statements involve risk and uncertainty because they relate to future events and circumstances that are beyond the control of
Nationwide including, amongst other things, UK domestic and global economic and business conditions, market related risks such as fluctuation
in interest rates and exchange rates, inflation/deflation, the impact of competition, changes in customer preferences, risks concerning borrower
credit quality, delays in implementing proposals, the timing, impact and other uncertainties of future acquisitions or other combinations within
relevant industries, the policies and actions of regulatory authorities, the impact of tax or other legislation and other regulations in the jurisdictions
in which Nationwide operates. The economic outlook also remains unusually uncertain due to Brexit. As a result, Nationwide’s actual future
financial condition, business performance and results may differ materially from the plans, goals and expectations expressed or implied in these
forward-looking statements. Due to such risks and uncertainties Nationwide cautions readers not to place undue reliance on such forward-looking
statements.
Nationwide undertakes no obligation to update any forward-looking statements whether as a result of new information, future events or otherwise.
This document does not constitute or form part of an offer of securities for sale in the United States. Securities may not be offered or sold in the
United States absent registration or an exemption from registration. Any public offering to be made in the United States will be made by means
of a prospectus that may be obtained from Nationwide and will contain detailed information about Nationwide and management as well as
financial statements.
Nationwide Pillar 3 Disclosure 2019
6
1 Executive Summary 1.1 Introduction
Our building society was founded 135 years ago to help people save and buy homes of their own. We were driven by our social purpose, and
our focus on building society is as important to us today as it was then.
We do many of the things that banks do, but we’re owned by, and run for, our members: people who have their mortgages, savings or current
accounts with us. And we measure our success through the things that matter to them: service, value and financial strength.
We need to be profitable to make sure that Nationwide and our members’ money are safe and secure, but – as a building society – we don’t
need to pursue profits to pay ever higher dividends or put shareholders’ needs above those of our members.
This document provides a detailed view of Nationwide’s capital resources, the components of solvency risk and the risk management strategy.
Nationwide targets strong capital ratios relative to regulatory requirements, helping to ensure that Nationwide is built to last.
1.2 Summary of key metrics
The capital disclosures included in this report are on a Capital Requirements Directive IV (CRD IV) end-point basis, unless otherwise stated.
This assumes that all CRD IV requirements are in force during the period, with no CRD IV transitional provisions permitted1. The disclosures
are on a consolidated Group basis, including all subsidiary entities, unless otherwise stated.
Our capital position has strengthened during the period with our CET1 ratio increasing to 32.4% (2018: 30.5%) whilst our UK leverage ratio
remained stable at 4.9% (2018: 4.9%). Both ratios remain in excess of the regulatory capital requirements of 13.2% and 4.0% respectively,
which include the incumbent CRD IV buffers and the updated systemic risk buffer (SRB) that is applicable from August 20192.
CET1 capital resources have increased over the year by £0.6 billion, mainly due to profit after tax for the period of £0.6 billion. Risk weighted
assets (RWAs) remained stable, with increased retail lending and treasury related RWAs offset by run-off in the commercial book and legacy
mortgage portfolios, and the implementation of a new credit card Internal Ratings Based (IRB) model.
The UK leverage ratio remained stable at 4.9% (2018: 4.9%), with an increase in Tier 1 capital driven by profits after tax of £0.6 billion offset
by an increase in UK leverage exposure of £13 billion. The increased leverage exposure was driven by increased net retail lending of £9 billion,
increased treasury exposures (including counterparty credit risk) of £5 billion, increase in other assets of £1 billion, offset by run-off in the
commercial book of £2 billion. On 24 April 2019, Nationwide notified investors of its intention to redeem its outstanding AT1 capital instrument
in full, on 20 June 2019. This will reduce Tier 1 capital resources by £992m, resulting in a 0.4% reduction in the UK leverage ratio, to 4.5%,
based on the year-end balance sheet. The redemption will have no impact on the CET1 ratio.
The total regulatory capital ratio has increased to 44.6% (2018: 42.9%), driven primarily by the additional CET1 resources outlined above.
There has been no issuance or redemption of any capital instruments during the year.
Nationwide has submitted its new hybrid IRB mortgage models to the Prudential Regulatory Authority (PRA) for approval with the expectations
that these will be implemented during 2020, in line with the deadline set out in PS13/17. Our current estimate is that the impact of these
models will be to reduce our reported CET1 ratio by around a third, given the material increase in RWAs, however we expect UK leverage
requirements to continue to be the binding capital constraint.
The Basel Committee published their final reforms to the Basel III framework in December 2017. The amendments include changes to the
standardised approach (SA) for credit and operational risks and the introduction of a new RWA output floor. The rules are subject to a lengthy
transitional period from 2022 to 2027. These reforms will lead to a significant increase in the Group’s risk weights over time. We currently
expect the consequential impact on the reported CET1 ratio to ultimately be a reduction of approximately half relative to the current position.
The change relates to the application of standardised floors which override IRB model outputs. Organic earnings through the transition will
mitigate this impact such that the reported CET1 ratio will in practice remain well in excess of the proforma levels implied by this change, and
leverage requirements will remain the binding constraint based on latest projections. These reforms represent a re-calibration of regulatory
requirements with no underlying change in the capital resources held or the risk profile of assets. Final impacts are subject to uncertainty for
future balance sheet size and mix, and because the final detail of some elements of the regulatory changes remain at the PRA’s discretion.
At 4 April 2019, Nationwide’s Liquidity Coverage Ratio (LCR) was 150% (2018: 130%), which exceeds the 100% regulatory minimum. The
average LCR based on 12 monthly data points was 143% (2018: 132%).
1 Note: IFRS 9 transitional provisions have been applied to the end-point disclosures. See section 3.1 for details. 2 See sections 4.4 and 4.5 for more information on regulatory buffer requirements.
Nationwide Pillar 3 Disclosure 2019
7
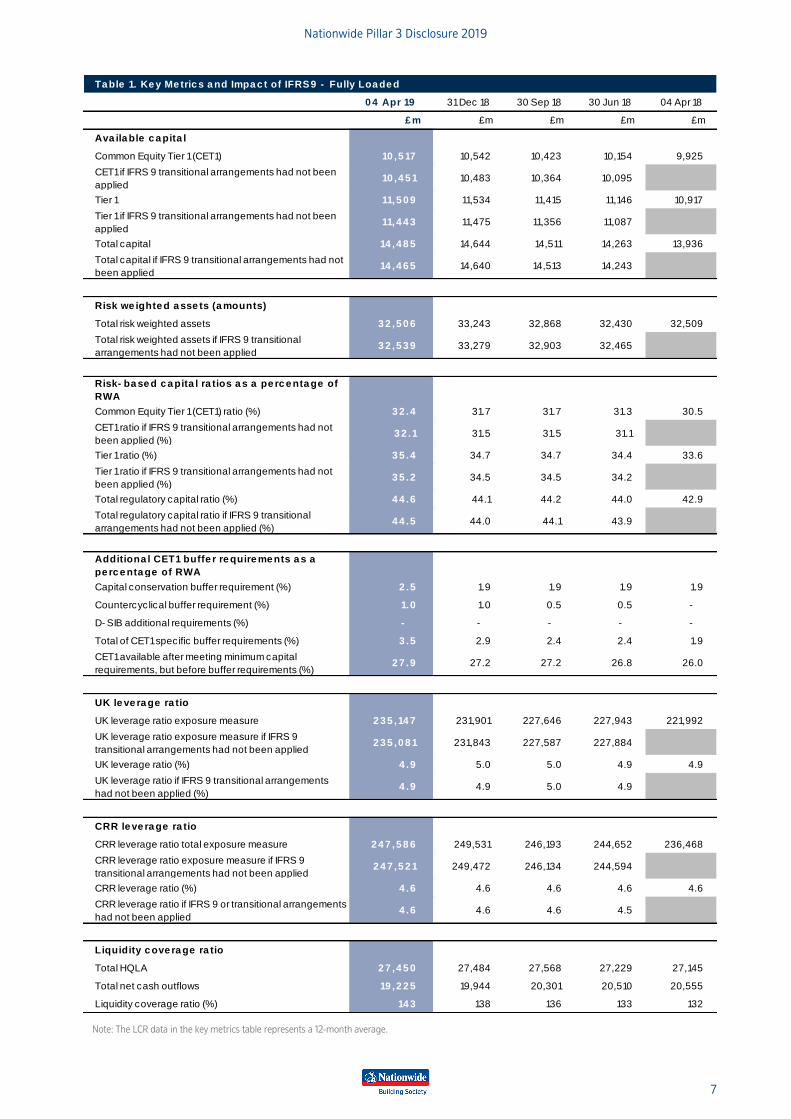
Ta ble 1. Ke y Me tric s a nd Impa c t of IFRS9 - Fully Loa de d
0 4 Apr 19 31 Dec 18 30 Sep 18 30 Jun 18 04 Apr 18
£ m £m £m £m £m
Ava ila ble c a pita l
Common Equity Tier 1 (CET1) 10 ,5 17 10,542 10,423 10,154 9,925
CET1 if IFRS 9 transitional arrangements had not been
applied 10 ,4 5 1 10,483 10,364 10,095
Tier 1 11,5 0 9 11,534 11,415 11,146 10,917
Tier 1 if IFRS 9 transitional arrangements had not been
applied11,4 4 3 11,475 11,356 11,087
Total capital 14 ,4 8 5 14,644 14,511 14,263 13,936
Total capital if IFRS 9 transitional arrangements had not
been applied14 ,4 6 5 14,640 14,513 14,243
Risk we ighte d a sse ts (a mounts)
Total risk weighted assets 3 2 ,5 0 6 33,243 32,868 32,430 32,509
Total risk weighted assets if IFRS 9 transitional
arrangements had not been applied3 2 ,5 3 9 33,279 32,903 32,465
Risk- ba se d c a pita l ra tios a s a pe rc e nta ge of
RWA
Common Equity Tier 1 (CET1) ratio (%) 3 2 .4 31.7 31.7 31.3 30.5
CET1 ratio if IFRS 9 transitional arrangements had not
been applied (%)3 2 .1 31.5 31.5 31.1
Tier 1 ratio (%) 3 5 .4 34.7 34.7 34.4 33.6
Tier 1 ratio if IFRS 9 transitional arrangements had not
been applied (%)3 5 .2 34.5 34.5 34.2
Total regulatory capital ratio (%) 4 4 .6 44.1 44.2 44.0 42.9
Total regulatory capital ratio if IFRS 9 transitional
arrangements had not been applied (%)4 4 .5 44.0 44.1 43.9
Additiona l CET1 buffe r re quire me nts a s a
pe rc e nta ge of RWA
Capital conservation buffer requirement (%) 2 .5 1.9 1.9 1.9 1.9
Countercyclical buffer requirement (%) 1.0 1.0 0.5 0.5 -
D- SIB additional requirements (%) - - - - -
Total of CET1 specific buffer requirements (%) 3 .5 2.9 2.4 2.4 1.9
CET1 available after meeting minimum capital
requirements, but before buffer requirements (%)2 7 .9 27.2 27.2 26.8 26.0
UK le ve ra ge ra tio
UK leverage ratio exposure measure 2 3 5 ,14 7 231,901 227,646 227,943 221,992
UK leverage ratio exposure measure if IFRS 9
transitional arrangements had not been applied2 3 5 ,0 8 1 231,843 227,587 227,884
UK leverage ratio (%) 4 .9 5.0 5.0 4.9 4.9
UK leverage ratio if IFRS 9 transitional arrangements
had not been applied (%)4 .9 4.9 5.0 4.9
CRR le ve ra ge ra tio
CRR leverage ratio total exposure measure 2 4 7 ,5 8 6 249,531 246,193 244,652 236,468
CRR leverage ratio exposure measure if IFRS 9
transitional arrangements had not been applied2 4 7 ,5 2 1 249,472 246,134 244,594
CRR leverage ratio (%) 4 .6 4.6 4.6 4.6 4.6
CRR leverage ratio if IFRS 9 or transitional arrangements
had not been applied4 .6 4.6 4.6 4.5
Liquidity c ove ra ge ra tio
Total HQLA 2 7 ,4 5 0 27,484 27,568 27,229 27,145
Total net cash outflows 19 ,2 2 5 19,944 20,301 20,510 20,555
Liquidity coverage ratio (%) 14 3 138 136 133 132
Note: The LCR data in the key metrics table represents a 12-month average.
Nationwide Pillar 3 Disclosure 2019
8
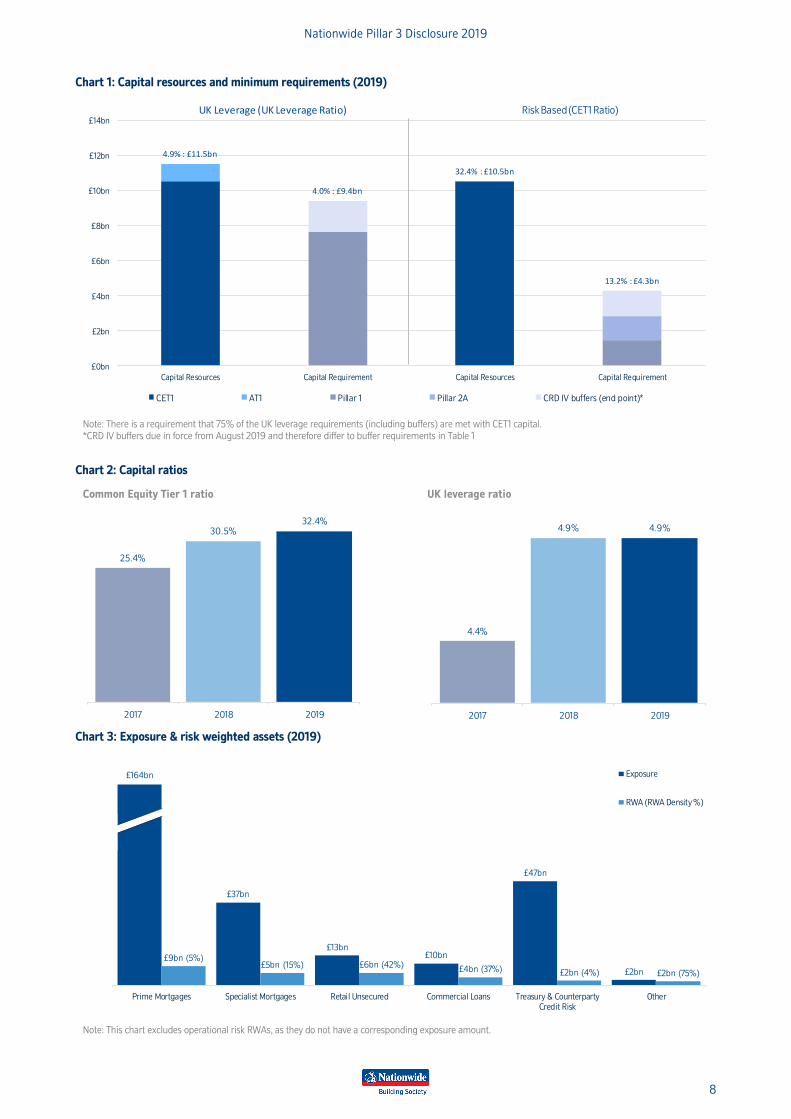
Chart 1: Capital resources and minimum requirements (2019)
4.9% : £11.5bn
4.0% : £9.4bn
32.4% : £10.5bn
13.2% : £4.3bn
£0bn
£2bn
£4bn
£6bn
£8bn
£10bn
£12bn
£14bn
Capital Resources Capital Requirement Capital Resources Capital Requirement
CET1 AT1 Pillar 1 Pillar 2A CRD IV buffers (end point)*
Risk Based (CET1 Ratio)UK Leverage (UK Leverage Ratio)
Note: There is a requirement that 75% of the UK leverage requirements (including buffers) are met with CET1 capital.
*CRD IV buffers due in force from August 2019 and therefore differ to buffer requirements in Table 1
Chart 2: Capital ratios
Common Equity Tier 1 ratio
25.4%
30.5%32.4%
2017 2018 2019
UK leverage ratio
4.4%
4.9% 4.9%
2017 2018 2019
Chart 3: Exposure & risk weighted assets (2019)
£37bn
£13bn£10bn
£47bn
£2bn
£9bn (5%)£5bn (15%) £6bn (42%)
£4bn (37%) £2bn (4%) £2bn (75%)
£0bn
£10bn
£20bn
£30bn
£40bn
£50bn
£60bn
£70bn
£80bn
£90bn
£100bn
Prime Mortgages Specialist Mortgages Retail Unsecured Commercial Loans Treasury & CounterpartyCredit Risk
Other
Exposure
RWA (RWA Density %)
£164bn
Note: This chart excludes operational risk RWAs, as they do not have a corresponding exposure amount.
Nationwide Pillar 3 Disclosure 2019
9
2 Introduction 2.1 Background
The European Union Capital Requirements Directive came into effect on 1 January 2007. This introduced consistent capital adequacy standards
and an associated supervisory framework in the EU based on the Basel II accord. Following publication of the Basel III accord, this was replaced
by the Capital Requirements Regulation (CRR) and the Capital Requirements Directive (together referred to as CRD IV) which came into force
on 1 January 2014 and is enforced in the UK, together with local implementing rules and guidance, by the PRA. The rules include disclosure
requirements known as ‘Pillar 3’ which apply to banks and building societies. These are designed to promote market discipline through the
disclosure of key information about risk exposures and risk management processes. See section 2.6 for details on how these disclosure rules
are evolving.
In May 2008, the Financial Services Authority (FSA) granted Nationwide permission to use IRB approaches for credit risk and capital
management. This permission was updated to become a CRR IRB permission from 1 January 2014. The disclosures in this document are based
on IRB approaches for most portfolios, including the majority of prime mortgages, specialist mortgages, personal loans, credit cards and
overdrafts. The SA is used for the remainder of credit risk and operational risk, as detailed in section 4.2.
As a building society subject to the Building Societies Act, Nationwide is required to maintain at least 75% of its ‘business assets’ (total assets
less fixed assets and liquid assets) in loans that are fully secured on residential property. For this reason, a higher proportion of Nationwide’s
lending is in the form of residential mortgages, when compared with many of the high-street plc banks. As a building society, Nationwide
cannot maintain a trading book and may only use derivatives to hedge risk. For this reason, Nationwide does not maintain RWAs for market
risk, as exposures are below the de minimis threshold in the CRR.
2.2 Scope
Nationwide’s structure
Nationwide is a European Economic Area (EEA) parent institution that is regulated by the PRA and Financial Conduct Authority (FCA). The
CRD IV framework therefore applies to Nationwide Building Society and its subsidiary undertakings (together, the ‘Group’).
There is a requirement to calculate and maintain regulatory capital ratios on both a Group basis and on an individual consolidation (or Solo)
basis. There are no differences between the basis of consolidation of the Group for accounting and prudential purposes. Full details of the
principal subsidiary undertakings are included in the Annual Report and Accounts 2019, Note 33 to the financial statements.
The subsidiaries included on the Individual consolidation basis are:
• The Mortgage Works (UK) plc;
• UCB Home Loans Corporation Limited;
• Derbyshire Home Loans Limited;
• E-Mex Home Funding Limited; and
• Nationwide Syndications Limited.
Unless otherwise stated, all subsidiary undertakings are included in the data provided in our Pillar 3 disclosures, this is referred to throughout
as the ‘Group’ position. Any reference to ‘Nationwide’ also refers to the Group position.
The Group does not see any practical or legal impediments to the transfer of capital resources or the repayment of liabilities within the Group.
Basis and frequency of disclosure
This document sets out the 2019 Pillar 3 disclosures for Nationwide. The purpose of these disclosures is to give information on the basis of
Basel III capital requirements and on the management of risks faced by Nationwide. Disclosures and bases of measurement are therefore in
accordance with the rules laid out in the CRR (Part 8). The disclosures may differ from similar information in the Annual Report and Accounts
2019 which is prepared in accordance with International Financial Reporting Standards (‘IFRS’). Therefore, the information in these disclosures
may not be directly comparable with that information.
Unless otherwise stated, all figures and narrative are as at 4 April 2019, Nationwide’s financial year end, with comparative figures for 4 April
2018 where relevant. Full Pillar 3 disclosures are published annually, and concurrently with the Annual Report and Accounts , in accordance
with regulatory guidelines. Summary Pillar 3 disclosures are published quarterly and semi-annually.
Regulatory balance sheet
There are no entities that are derecognised from the accounting balance sheet for regulatory purposes. For further information please see
Appendix 10.
Nationwide Pillar 3 Disclosure 2019
10
2.3 Risk appetite
A number of tools are employed to support the management of solvency risk. The Board is responsible for setting risk appetite with respect to
solvency risk, which is articulated through its risk appetite statements, and it defines minimum levels for capital ratios, including leverage, that
it is willing to operate with. These are translated into specific risk metrics, which are monitored by the BRC, Executive Risk Committee (ERC)
and Assets and Liabilities Committee (ALCO).
The capital structure is managed to ensure that minimum regulatory requirements are met, based on actuals and forecast stressed
performance, as well as meeting the expectations of key stakeholders and maintaining a robust financial position to protect our members. Any
planned changes to the balance sheet, potential regulatory developments and other factors (such as trading outlook) are all considered.
2.4 Individual (Solo) consolidation
Nationwide calculates capital requirements on a Group and Solo basis. The Solo consolidation includes entities that meet certain criteria as set
out in CRD IV and for Nationwide represent only lending entities. The differences between the Group and Solo consolidations relate primarily
to reserves held by entities that sit outside of the scope of Solo consolidation that are included in the Group consolidation, and a small impact
from the RWAs of these entities. The only Solo disclosures within this document are included in Tables 2 and 74.
2.5 Reporting
Key aspects of Nationwide’s capital position are reported monthly to the Board in Nationwide’s Bus iness Performance Pack. More detailed
reports of capital and risk are considered monthly by ALCO.
A range of Key Risk Indicators and Key Performance Indicators are routinely monitored (in both actual and forecast terms) by management,
and by the Board and its sub-committees (primarily BRC), to ensure that appropriate actions can be taken should triggers be breached.
2.6 Changes to disclosure requirements
This Pillar 3 disclosure includes 2 new tables, resulting from the introduction of a full Advanced Internal Ratings Based (AIRB) model for credit
cards in the year (Table 21) and the implementation of IFRS 9 transitional arrangements (Table 1). A summary of all tables within the document
is included in Appendix 12.
2.7 Location
These disclosures are located on Nationwide’s website: nationwide.co.uk
2.8 Policy, verification and sign off
Nationwide’s Pillar 3 disclosures have been verified and approved through internal governance procedures in line with Nationwide’s Pillar 3
Disclosure Standard. The Pillar 3 Disclosure Standard requires that:
• Solvency data is produced under the Capital Reporting Controls Framework (CRCF), which provides assurance over its accuracy,
integrity and completeness;
• Data outside of the CRCF is subject to appropriate senior review and approval;
• Appropriate reconciliations are performed on the disclosures;
• Narrative content is subject to appropriate senior review and approval;
• Compliance with regulatory requirements, as set out in Part 8 of the CRR, is documented and met;
• Risk-based review activities are performed across the three lines of defence, to provide assurance over the disclosures; and
• The BRC reviews and approves the disclosures.
“We attest that, to the best of our knowledge, Nationwide’s Pillar 3 disclosures have been prepared in accordance with Nationwide’s Pillar 3
Disclosure Standard and the internal controls framework described within it.”
Mark Rennison Julia Dunn
Chief Financial Officer Chief Risk Officer
Nationwide Pillar 3 Disclosure 2019
11
3 Capital resources 3.1 Total available capital
At 4 April 2019 and throughout the financial year, Nationwide complied with the capital requirements that were in force as set out by European
and national legislation. Nationwide continues to use an IRB approach, using its IRB models to calculate capital requirements. The PRA has
confirmed that the original 2008 permission transferred to a CRR IRB permission from 1 January 2014. Section 4.2 outlines the scope of
Nationwide’s IRB permission and which portfolios are calculated under the SA.
All disclosures are on an end-point basis unless otherwise stated as the transitional provisions only relate to grandfathered AT1 and Tier 2
capital. The impact of these can be seen in Table 2, which shows the comparison between the end-point and transitional arrangements. Our
Solo position can also be seen in Table 2.
With effect from 5 April 2018, Nationwide has adopted the IFRS 9 accounting standard. Management have chosen to apply the transitional
arrangements permitted by EU Regulation (2017/2395), which allows relief to capital ratios to reduce the impact of IFRS 9 ECLs. Whilst the
Day 1 impact of IFRS 9 was small from a CET1 perspective, the transitional arrangements have been applied because they provide relief during
the annual Concurrent Stress Testing (CST) exercise. The transitional adjustment is applied by adding back to CET1 capital resources, on a
reducing basis over the five years, the impact of IFRS 9 ECLs and then adjusting any related deferred tax assets and Tier 2 provisions. The
adjustment to CET1 resources at 4th April 2019 was an addback of £66 million, and a reduction of Tier 2 resources of £46 million, based on a
95% factor for year 1 of the IFRS 9 transition.
3.2 Common Equity Tier 1 capital
CET1 capital comprises:
• Core Capital Deferred Shares (CCDS);
• General reserve;
• Revaluation reserve;
• Fair value through other comprehensive income (FVOCI) reserve; and
• Adjustments as set out by the regulatory requirements governing capital resources.
The general reserve represents accumulated accounting profits as well as deductions relating to any pension fund deficit. General Reserves
have increased by £0.5 billion, driven predominantly by profit after tax.
3.3 Tier 1 capital
Tier 1 capital comprises:
• Permanent Interest Bearing Shares (PIBS) - CRD IV transitional basis only; and
• AT1 capital.
On 24 April 2019, Nationwide notified investors of its intention to redeem the outstanding AT1 capital instrument in full, on 20 June 2019. This
will reduce Tier 1 capital resources by £1 billion. These disclosures have been prepared based on the balance sheet position at 4 April 2019,
with the inclusion of the AT1 capital instrument.
3.4 Tier 2 capital
Tier 2 capital comprises:
• Qualifying subordinated notes;
• Qualifying PIBS; and
• Adjustments as set out by the regulatory requirements governing capital resources.
Subordinated notes are unsecured and rank behind the claims of all depositors, creditors and investing members (other than holders of PIBS,
AT1 securities and CCDS) of the Group. More details of the subordinated notes are included in the Annual Report and Accounts 2019, Note 19
to the financial statements.
Overall Tier 2 capital has been maintained at £3 billion. Future liability management options and decisions with respect to capital calls may be
made at Nationwide’s discretion in light of prevailing market, economic and regulatory conditions.
Appendix 4 shows the key features of the capital instruments issued by the Group, and more information can be found in the Annual Report
and Accounts 2019, Notes 19, 20, 31 and 32 to the financial statements.
Nationwide Pillar 3 Disclosure 2019
12
Ta ble 2 . Ca pita l c omposition
2 0 19 2018 2 0 19 2018 2 0 19 2018
£ m £m £ m £m £ m £m
Common e quity tie r 1
General reserve 10 ,4 18 9,951 10 ,4 2 0 9,975 10 ,4 18 9,951
Core capital deferred shares (CCDS) 1,3 2 5 1,325 1,3 2 5 1,325 1,3 2 5 1,325
Revaluation reserve 6 4 68 6 4 68 6 4 68
Foreseeable distributions1 (6 8 ) (68) (6 8 ) (68) (6 8 ) (68)
FVOCI reserve 5 0 75 5 0 75 5 0 75
Prudent valuation adjustment2 (5 0 ) (32) (4 7 ) (30) (5 0 ) (32)
Own credit valuation adjustment3 - (1) - (1) - (1)
Intangible assets4 (1,2 7 4 ) (1,286) (1,2 7 4 ) (1,286) (1,2 7 4 ) (1,286)
Goodwill4 (12 ) (12) (12 ) (12) (12 ) (12)
Excess of expected loss over
impairment5 (2 ) (95) (2 ) (95) (2 ) (95)
IFRS9 transitional arrangements8 6 6 - 6 6 - 6 6 -
Total common equity tier 1 10 ,5 17 9,925 10 ,5 2 2 9,951 10 ,5 17 9,925
Tie r 1
Additional Tier 1 (AT1) capital securities 9 9 2 992 9 9 2 992 9 9 2 992
Permanent Interest Bearing Shares
(PIBS)- - - - 2 3 9 253
Total of Tier 1 and CET1 11,5 0 9 10,917 11,5 14 10,943 11,7 4 8 11,170
Tie r 2
Subordinated debt6 2 ,9 7 6 3,019 2 ,9 7 6 3,019 2 ,9 7 6 3,019
Collective impairment allowance - - - - - -
Excess of impairment over expected
loss4 6 - 4 6 - 4 6 -
IFRS9 transitional arrangements8 (4 6 ) - (4 6 ) - (4 6 ) -
Total tier 2 2 ,9 7 6 3,019 2 ,9 7 6 3,019 2 ,9 7 6 3,019
Total capital 14 ,4 8 5 13,936 14 ,4 9 0 13,962 14 ,7 2 4 14,189
Risk we ighte d a sse ts
Retail mortgages 14 ,0 7 2 13,764 14 ,0 7 2 13,764 14 ,0 7 2 13,764
Retail unsecured lending 5 ,5 8 1 5,805 5 ,5 8 1 5,805 5 ,5 8 1 5,805
Commercial loans 3 ,6 0 4 4,634 3 ,6 0 4 4,634 3 ,6 0 4 4,634
Treasury 7 7 9 540 7 7 9 540 7 7 9 540
Counterparty credit risk 1,5 3 2 1,184 1,5 3 2 1,184 1,5 3 2 1,184
Other 2 ,0 9 5 1,681 2 ,110 1,695 2 ,0 9 5 1,681
Operational risk 4 ,8 4 3 4,901 4 ,8 4 3 4,901 4 ,8 4 3 4,901
Market risk7 - - - - - -
Total risk weighted assets 3 2 ,5 0 6 32,509 3 2 ,5 2 1 32,523 3 2 ,5 0 6 32,509
Ca pita l ra tios
Common equity tier 1 ratio 3 2 .4 30.5 3 2 .4 30.6 3 2 .4 30.5
Tier 1 ratio 3 5 .4 33.6 3 5 .4 33.6 3 6 .1 34.4
Total regulatory capital ratio 4 4 .6 42.9 4 4 .6 42.9 4 5 .3 43.6
8 An IFRS 9 transitional factor of 0.95 is applied during the period 5 April 2018 to 4 April 2019, to correspond to Nationwide's financial year, in line with
paragraph 6 of Article 473a of the CRR.
7 The Group has elected to set this to zero, as permitted by the CRR, as exposure was below the 2% threshold of own funds.
6 Subordinated debt includes fair value adjustments related to changes in market interest rates, adjustments for unamortised premiums and discounts that
are included in the consolidated balance sheet, and any amortisation of the capital value of Tier 2 instruments required by regulatory rules for instruments
with less than five years to maturity.
5 The net regulatory capital expected loss in excess of accounting impairment provisions is deducted from CET1capital, gross of tax. The net excess of
impairment provisions over regulatory capital expected loss is added to Tier 2 capital, gross of tax. The expected loss amounts for equity exposures and
general and specific credit risk adjustments related to these exposures are not included in the calculation, as per Article 159 of CRR. The expected loss
amounts for equity exposures are deducted from CET1 capital, gross of tax.
Group End Point Solo End Point Group Tra nsitiona l
1 Foreseeable distributions in respect o f CCDS and AT1 securities are deducted from CET1 capital under CRD IV.
2 A prudent valuation adjustment is applied in respect o f fair valued instruments with positive fair values as required under regulatory capital rules.
3 Own credit and debit valuation adjustments are applied to remove gains or losses of fair valued liabilities and derivatives with negative fair values that result
from changes in Nationwide's own credit risk, in accordance with CRD IV rules.4 Intangible assets and goodwill are deducted from capital resources after netting deferred tax liabilities associated with the intangible assets.
Nationwide Pillar 3 Disclosure 2019
13
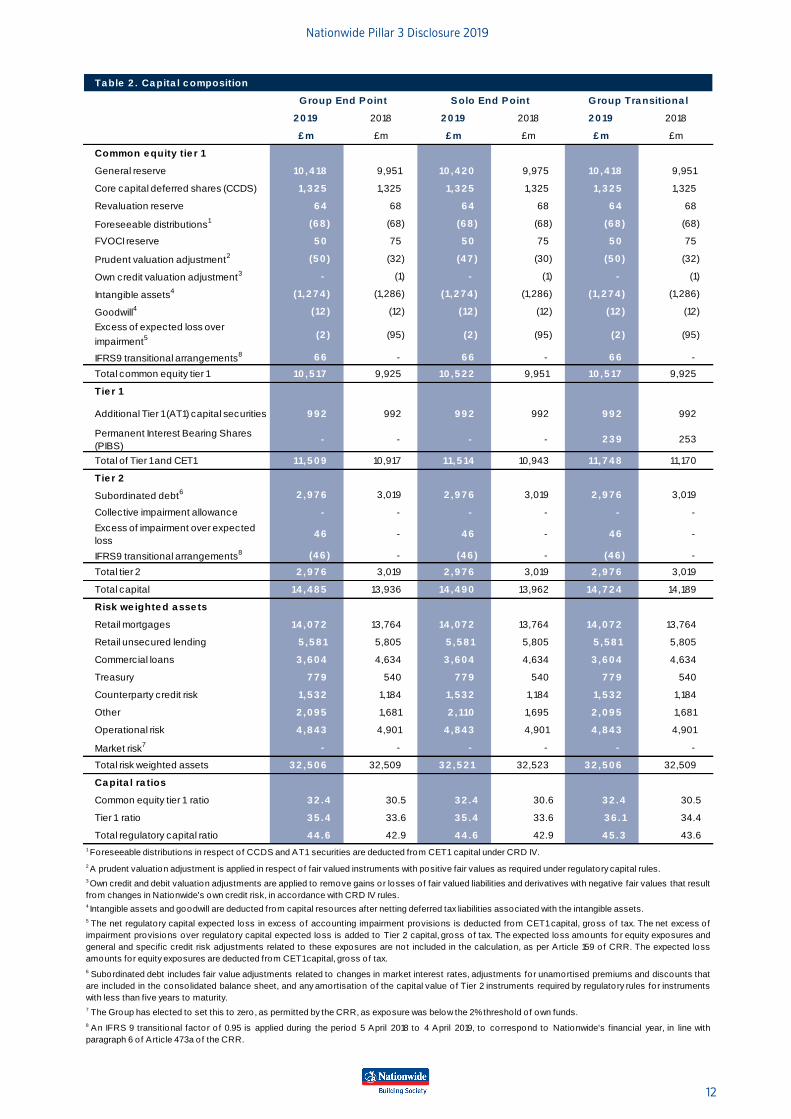
Table 2 shows the composition of capital resources for the Group as at 4 April 2019 on a CRD IV basis, comparing this against the end point
basis for Group and Solo (i.e. assuming all CRD IV requirements were in force in full, with no transitional provisions permitted). See Appendix
3 for the full CRD IV disclosure template as published in the Official Journal of the European Union, 1423/2013.
There are no transitional provisions which apply to Nationwide’s common equity capital, so the CET1 ratio remains the same on a transitional
and end point basis at 32.4% (2018: 30.5%). The total Tier 1 capital ratio and total regulatory capital ratio are 36.1% (2018: 34.4%) and 45.3%
(2018: 43.6%) respectively on a transitional basis, as PIBS qualify under grandfathering provisions under CRD IV.
The CET1 ratio on an individual (Solo) consolidated basis at 4 April 2019 is 32.4% (2018: 30.6%) in line with the Group’s CET1 ratio. The
difference in RWAs is caused by the treatment of derivative instruments, some of which sit outside of the solo consolidation. Hedge accounting
results in differences in the Solo general reserves and solo cash flow hedge reserve, the latter of which is not included in CET1 capital. The Solo
general reserve was £2 million higher at 4 April 2019 (2018: £24 million higher).
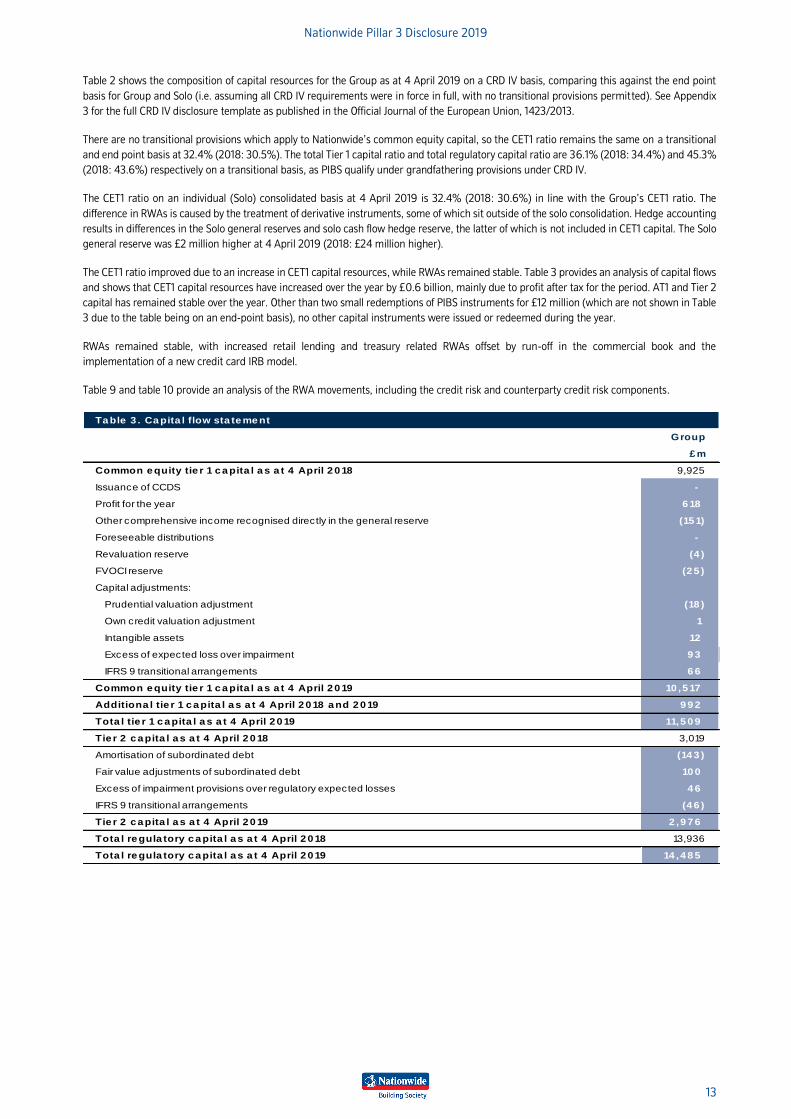
The CET1 ratio improved due to an increase in CET1 capital resources, while RWAs remained stable. Table 3 provides an analysis of capital flows
and shows that CET1 capital resources have increased over the year by £0.6 billion, mainly due to profit after tax for the period. AT1 and Tier 2
capital has remained stable over the year. Other than two small redemptions of PIBS instruments for £12 million (which are not shown in Table
3 due to the table being on an end-point basis), no other capital instruments were issued or redeemed during the year.
RWAs remained stable, with increased retail lending and treasury related RWAs offset by run-off in the commercial book and the
implementation of a new credit card IRB model.
Table 9 and table 10 provide an analysis of the RWA movements, including the credit risk and counterparty credit risk components.
Ta ble 3 . Ca pita l flow sta te me nt
Group
£ m
Common e quity tie r 1 c a pita l a s a t 4 April 2 0 18 9,925
Issuance of CCDS -
Profit for the year 6 18
Other comprehensive income recognised directly in the general reserve (15 1)
Foreseeable distributions -
Revaluation reserve (4 )
FVOCI reserve (2 5 )
Capital adjustments:
Prudential valuation adjustment (18 )
Own credit valuation adjustment 1
Intangible assets 12
Excess of expected loss over impairment 9 3
IFRS 9 transitional arrangements 6 6
Common e quity tie r 1 c a pita l a s a t 4 April 2 0 19 10 ,5 17
Additiona l tie r 1 c a pita l a s a t 4 April 2 0 18 a nd 2 0 19 9 9 2
Tota l tie r 1 c a pita l a s a t 4 April 2 0 19 11,5 0 9
Tie r 2 c a pita l a s a t 4 April 2 0 18 3,019
Amortisation of subordinated debt (14 3 )
Fair value adjustments of subordinated debt 10 0
Excess of impairment provisions over regulatory expected losses 4 6
IFRS 9 transitional arrangements (4 6 )
Tie r 2 c a pita l a s a t 4 April 2 0 19 2 ,9 7 6
Tota l re gula tory c a pita l a s a t 4 April 2 0 18 13,936
Tota l re gula tory c a pita l a s a t 4 April 2 0 19 14 ,4 8 5
Na
tion
wid
e P
illar 3
Disclo
sure
20
19
14
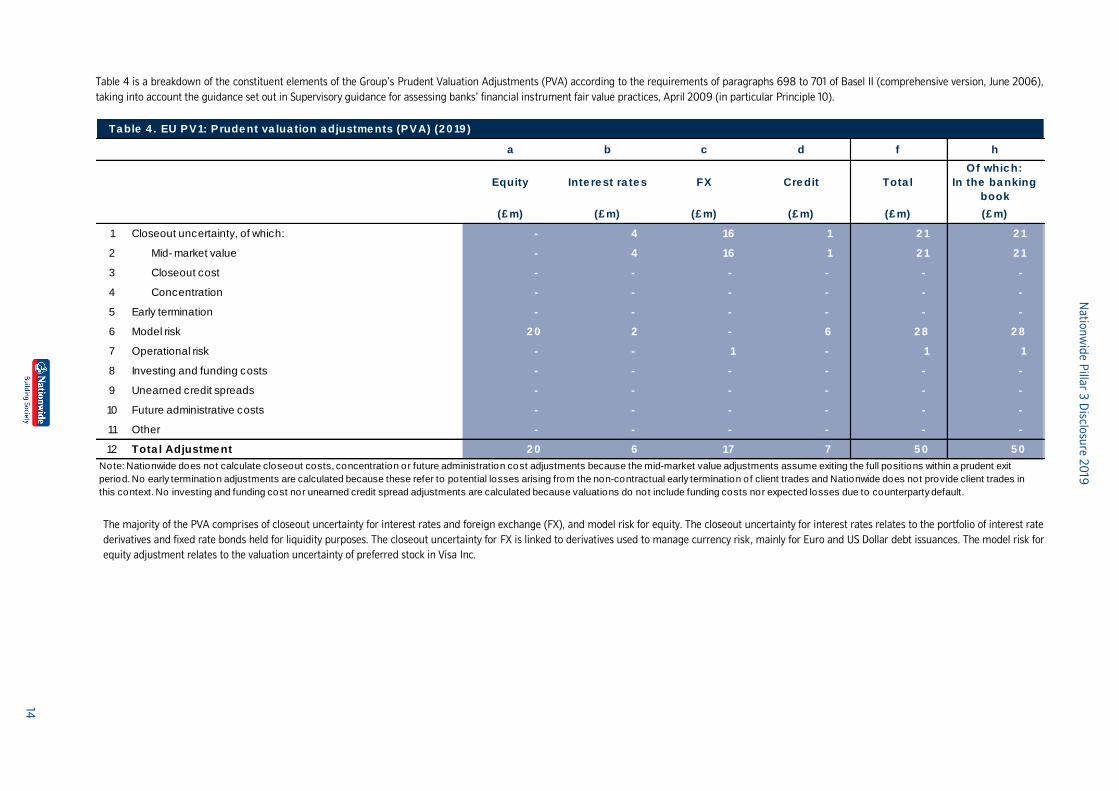
Table 4 is a breakdown of the constituent elements of the Group’s Prudent Valuation Adjustments (PVA) according to the requirements of paragraphs 698 to 701 of Basel II (comprehensive version, June 2006),
taking into account the guidance set out in Supervisory guidance for assessing banks’ financial instrument fair value practices, April 2009 (in particular Principle 10).
Ta ble 4 . EU PV1: Prude nt va lua tion a djustme nts (PVA) (2 0 19 )
a b c d f h
Equity Inte re st ra te s FX Cre dit Tota l
Of whic h:
In the ba nking
book
(£ m) (£ m) (£ m) (£ m) (£ m) (£ m)
1 Closeout uncertainty, of which: - 4 16 1 2 1 2 1
2 Mid- market value - 4 16 1 2 1 2 1
3 Closeout cost - - - - - -
4 Concentration - - - - - -
5 Early termination - - - - - -
6 Model risk 2 0 2 - 6 2 8 2 8
7 Operational risk - - 1 - 1 1
8 Investing and funding costs - - - - - -
9 Unearned credit spreads - - - - - -
10 Future administrative costs - - - - - -
11 Other - - - - - -
12 Tota l Adjustme nt 2 0 6 17 7 5 0 5 0
Note: Nationwide does not calculate closeout costs, concentration or future administration cost adjustments because the mid-market value adjustments assume exiting the full positions within a prudent exit
period. No early termination adjustments are calculated because these refer to potential losses arising from the non-contractual early termination of client trades and Nationwide does not provide client trades in
this context. No investing and funding cost nor unearned credit spread adjustments are calculated because valuations do not include funding costs nor expected losses due to counterparty default.
The majority of the PVA comprises of closeout uncertainty for interest rates and foreign exchange (FX), and model risk for equity. The closeout uncertainty for interest rates relates to the portfolio of interest rate
derivatives and fixed rate bonds held for liquidity purposes. The closeout uncertainty for FX is linked to derivatives used to manage currency risk, mainly for Euro and US Dollar debt issuances. The model risk for
equity adjustment relates to the valuation uncertainty of preferred stock in Visa Inc.
Nationwide Pillar 3 Disclosure 2019
15
3.5 Leverage ratio
Overview
Under CRD IV, firms are required to calculate a leverage ratio, which is not risk sensitive, to complement risk-based capital requirements. The
leverage ratio measures the relationship between a firm’s Tier 1 capital resources and its leverage exposure (total assets, plus certain off balance
sheet exposures). Monitoring and requiring firms to manage this metric allows regulators to limit the accumulation of excessive leverage.
UK leverage framework
Following recommendations from the Financial Policy Committee (FPC) in 2016 the PRA introduced the UK leverage ratio to the leverage
framework. It is calculated in the same way as the CRR leverage ratio, as outlined below, but excludes eligible central bank reserves from the
calculation of the leverage exposure measure. Nationwide has been granted permission to report a UK leverage ratio on the basis of
measurement announced by the PRA in August 2016.
In 2017 the PRA updated the UK leverage ratio framework following recommendations from the FPC. The update allowed for the exclusion of
certain central bank claims from the leverage exposure measure (previously excluded by ‘modification’ by the PRA in June 2016), increasing
the minimum leverage requirement to 3.25%, from 3%, and updating leverage reporting and disclosure requirements. It is calculated using
the CRR definition of Tier 1 for the capital amount.
A firm specific additional leverage ratio buffer will come into effect in August 2019, linked to the individual SRB requirement, which will be set
at 0.35%. In addition, the FPC can set a countercyclical leverage buffer up to 0.9% of leverage exposure for UK exposures; which is currently
set at 0.4%. Therefore, the minimum leverage ratio requirement is 4.0%. Nationwide is confident it is in a strong position to continue to meet
the minimum requirements.
The UK leverage ratio is also a hurdle rate in the annual CST exercise. Management calibrates Nationwide’s risk appetite to ensure our leverage
resources are enough to manage through a severe but plausible stress test. See section 4.3.4 for further detail on Nationwide’s approach to
stress testing.
Given that Nationwide’s balance sheet is focused on residential mortgage lending, it is considered that the risk of material unexpected
movements in the leverage exposure measure is limited, due to the relative stability of mortgage balances. Regular stress tests are undertaken,
which assess the sensitivity of the leverage ratio to stress conditions relative to risk-based capital metrics, which forms part of the risk appetite
framework.
Nationwide maintains a long-run strategic target for the UK leverage ratio of at least 4.5%. On 24 April 2019, Nationwide notified investors of
its intention to redeem its outstanding AT1 capital instrument in full, on 20 June 2019. This will reduce Tier 1 capital resources by £992m,
resulting in a 0.4% reduction in the UK leverage ratio, to 4.5%, based on the year-end balance sheet. Given Nationwide's historic financial
performance, Management remains confident that earnings accretion will be sufficient to meet projected balance sheet growth, such that
Nationwide can continue to meet its long-run strategic target for the UK leverage ratio.
If the leverage ratio were to fall below a defined level, Nationwide may take actions to restore its capital position, which may include actions to
increase capital resources or to reduce the size of the balance sheet based on a timescale deemed appropriate to the situation.
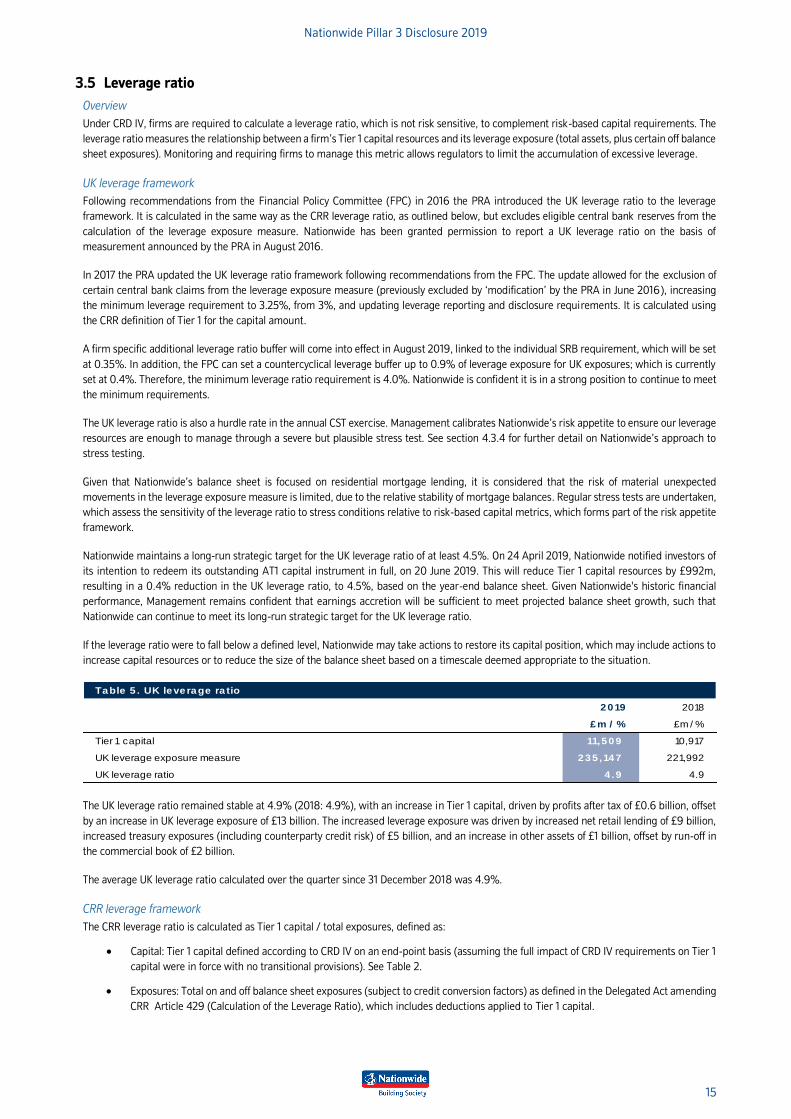
Table 5 . UK leverage ra tio
2019 2018
£m / % £m / %
Tier 1 capital 11,509 10,917
UK leverage exposure measure 235 ,147 221,992
UK leverage ratio 4 .9 4.9
The UK leverage ratio remained stable at 4.9% (2018: 4.9%), with an increase in Tier 1 capital, driven by profits after tax of £0.6 billion, offset
by an increase in UK leverage exposure of £13 billion. The increased leverage exposure was driven by increased net retail lending of £9 billion,
increased treasury exposures (including counterparty credit risk) of £5 billion, and an increase in other assets of £1 billion, offset by run-off in
the commercial book of £2 billion.
The average UK leverage ratio calculated over the quarter since 31 December 2018 was 4.9%.
CRR leverage framework
The CRR leverage ratio is calculated as Tier 1 capital / total exposures, defined as:
• Capital: Tier 1 capital defined according to CRD IV on an end-point basis (assuming the full impact of CRD IV requirements on Tier 1
capital were in force with no transitional provisions). See Table 2.
• Exposures: Total on and off balance sheet exposures (subject to credit conversion factors) as defined in the Delegated Act amending
CRR Article 429 (Calculation of the Leverage Ratio), which includes deductions applied to Tier 1 capital.
Nationwide Pillar 3 Disclosure 2019
16
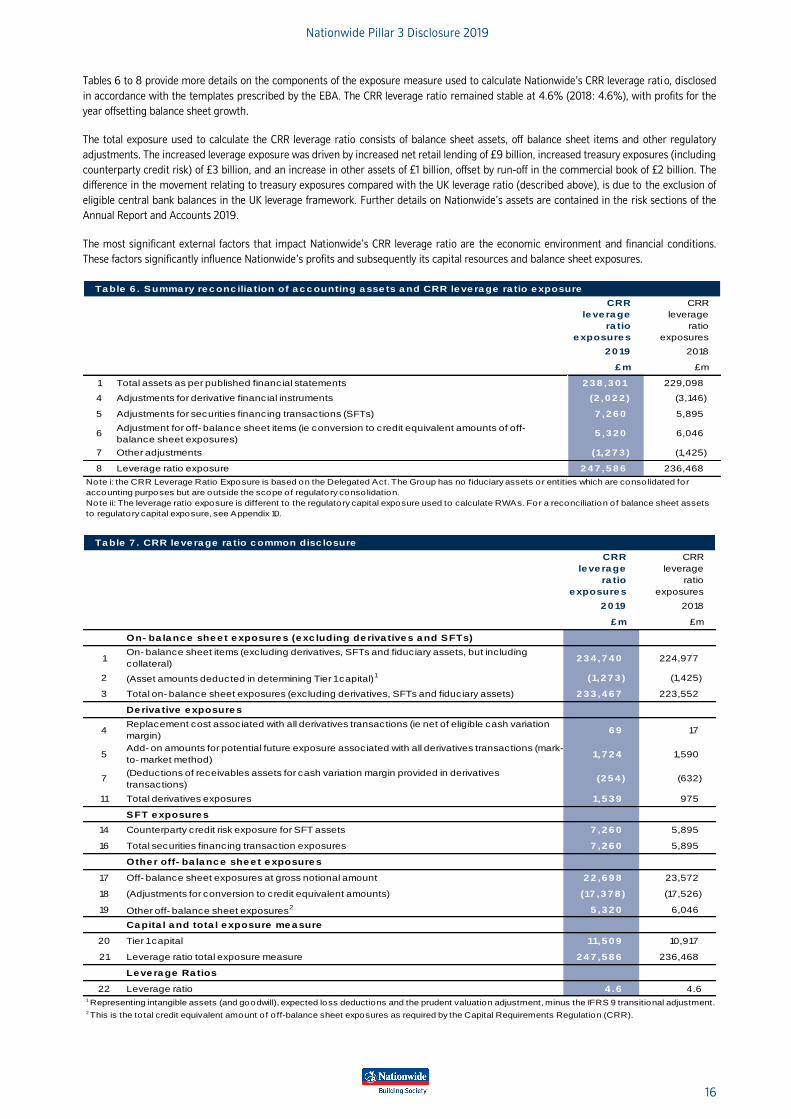
Tables 6 to 8 provide more details on the components of the exposure measure used to calculate Nationwide’s CRR leverage ratio, disclosed
in accordance with the templates prescribed by the EBA. The CRR leverage ratio remained stable at 4.6% (2018: 4.6%), with profits for the
year offsetting balance sheet growth.
The total exposure used to calculate the CRR leverage ratio consists of balance sheet assets, off balance sheet items and other regulatory
adjustments. The increased leverage exposure was driven by increased net retail lending of £9 billion, increased treasury exposures (including
counterparty credit risk) of £3 billion, and an increase in other assets of £1 billion, offset by run-off in the commercial book of £2 billion. The
difference in the movement relating to treasury exposures compared with the UK leverage ratio (described above), is due to the exclusion of
eligible central bank balances in the UK leverage framework. Further details on Nationwide’s assets are contained in the risk sections of the
Annual Report and Accounts 2019.
The most significant external factors that impact Nationwide’s CRR leverage ratio are the economic environment and financial conditions.
These factors significantly influence Nationwide’s profits and subsequently its capital resources and balance sheet exposures.
Ta ble 6 . Summa ry re c onc ilia tion of a c c ounting a sse ts a nd CRR le ve ra ge ra tio e xposure
CRR
le ve ra ge
ra tio
e xposure s
CRR
leverage
ratio
exposures
2 0 19 2018
£ m £m
1 Total assets as per published financial statements 2 3 8 ,3 0 1 229,098
4 Adjustments for derivative financial instruments (2 ,0 2 2 ) (3,146)
5 Adjustments for securities financing transactions (SFTs) 7 ,2 6 0 5,895
6Adjustment for off- balance sheet items (ie conversion to credit equivalent amounts of off-
balance sheet exposures)5 ,3 2 0 6,046
7 Other adjustments (1,2 7 3 ) (1,425)
8 Leverage ratio exposure 2 4 7 ,5 8 6 236,468
Note i: the CRR Leverage Ratio Exposure is based on the Delegated Act. The Group has no fiduciary assets or entities which are consolidated for
accounting purposes but are outside the scope of regulatory consolidation.
Note ii: The leverage ratio exposure is different to the regulatory capital exposure used to calculate RWAs. For a reconciliation of balance sheet assets
to regulatory capital exposure, see Appendix 10.
Ta ble 7 . CRR le ve ra ge ra tio c ommon disc losure
CRR
le ve ra ge
ra tio
e xposure s
CRR
leverage
ratio
exposures
2 0 19 2018
£ m £m
On- ba la nc e she e t e xposure s (e xc luding de riva tive s a nd SFTs)
1On- balance sheet items (excluding derivatives, SFTs and fiduciary assets, but including
collateral)2 3 4 ,7 4 0 224,977
2 (Asset amounts deducted in determining Tier 1 capital)1 (1,2 7 3 ) (1,425)
3 Total on- balance sheet exposures (excluding derivatives, SFTs and fiduciary assets) 2 3 3 ,4 6 7 223,552
De riva tive e xposure s
4Replacement cost associated with all derivatives transactions (ie net of eligible cash variation
margin)6 9 17
5Add- on amounts for potential future exposure associated with all derivatives transactions (mark-
to- market method)1,7 2 4 1,590
7(Deductions of receivables assets for cash variation margin provided in derivatives
transactions)(2 5 4 ) (632)
11 Total derivatives exposures 1,5 3 9 975
SFT e xposure s
14 Counterparty credit risk exposure for SFT assets 7 ,2 6 0 5,895
16 Total securities financing transaction exposures 7 ,2 6 0 5,895
Othe r off- ba la nc e she e t e xposure s 1
17 Off- balance sheet exposures at gross notional amount 2 2 ,6 9 8 23,572
18 (Adjustments for conversion to credit equivalent amounts) (17 ,3 7 8 ) (17,526)
19 Other off- balance sheet exposures2 5 ,3 2 0 6,046
Ca pita l a nd tota l e xposure me a sure
20 Tier 1 capital 11,5 0 9 10,917
21 Leverage ratio total exposure measure 2 4 7 ,5 8 6 236,468
Le ve ra ge Ra tios
22 Leverage ratio 4 .6 4.6 1 Representing intangible assets (and goodwill), expected loss deductions and the prudent valuation adjustment, minus the IFRS 9 transitional adjustment.2 This is the to tal credit equivalent amount o f o ff-balance sheet exposures as required by the Capital Requirements Regulation (CRR).
Nationwide Pillar 3 Disclosure 2019
17
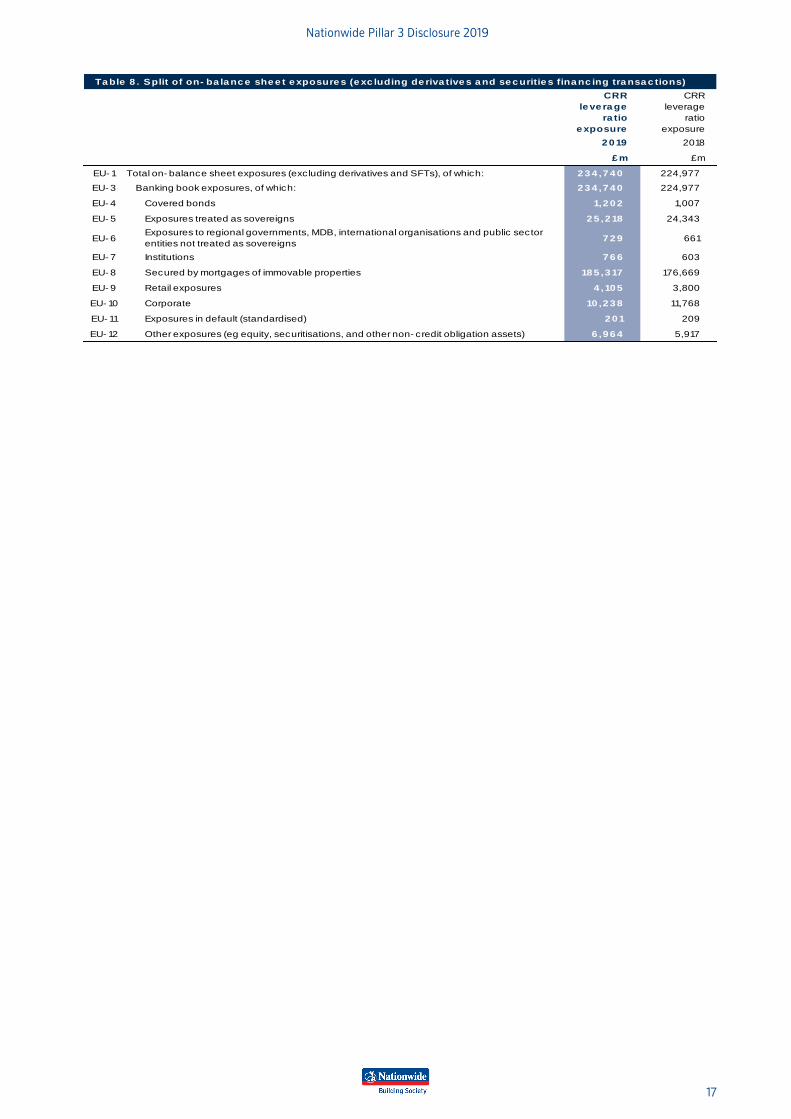
Ta ble 8 . Split of on- ba la nc e she e t e xposure s (e xc luding de riva tive s a nd se c uritie s fina nc ing tra nsa c tions)
CRR
le ve ra ge
ra tio
e xposure
CRR
leverage
ratio
exposure
2 0 19 2018
£ m £m
EU- 1 Total on- balance sheet exposures (excluding derivatives and SFTs), of which: 2 3 4 ,7 4 0 224,977
EU- 3 Banking book exposures, of which: 2 3 4 ,7 4 0 224,977
EU- 4 Covered bonds 1,2 0 2 1,007
EU- 5 Exposures treated as sovereigns 2 5 ,2 18 24,343
EU- 6Exposures to regional governments, MDB, international organisations and public sector
entities not treated as sovereigns7 2 9 661
EU- 7 Institutions 7 6 6 603
EU- 8 Secured by mortgages of immovable properties 18 5 ,3 17 176,669
EU- 9 Retail exposures 4 ,10 5 3,800
EU- 10 Corporate 10 ,2 3 8 11,768
EU- 11 Exposures in default (standardised) 2 0 1 209
EU- 12 Other exposures (eg equity, securitisations, and other non- credit obligation assets) 6 ,9 6 4 5,917
Nationwide Pillar 3 Disclosure 2019
18
4 Capital requirements 4.1 Introduction
Nationwide manages its capital structure to ensure it continues to exceed minimum regulatory requirements, as well as meeting the
expectations of key stakeholders. As part of the risk appetite framework, strong capital ratios relative to regulatory requirements are targeted.
Planned changes to the balance sheet, and potential regulatory developments are all considered.
The capital structure is managed to ensure that minimum regulatory requirements are met, based on actual and forecast stressed performance,
as well as meeting the expectations of key stakeholders and to maintain a robust financial position to protect our members. Any planned
changes to the balance sheet, potential regulatory developments and other factors (such as trading outlook) are all considered.
A number of tools are employed to support the management of solvency risk. The Board is responsible for setting risk appetite with respect to
solvency risk, which is articulated through its risk appetite statements. The Board defines minimum levels of capital (by reference to its capital
and leverage ratios) that it is willing to operate with.
These are translated into specific risk metrics, which are monitored by BRC, ERC and ALCO.
With general reserves forming the majority of capital resources, profitability is an important factor when considering the ability to meet capital
requirements, particularly in the current economic environment where margins are under continued pressure as a result of higher levels of
competition and continued low interest rates. A return on capital framework is in place, based upon an allocation of overall capital
requirements, which monitors targets for individual product segments.
In 2016, Nationwide introduced a financial performance framework with parameters which enable the calibration of future performance to
achieve the right balance between providing value to members and maintaining financial strength. The framework aims to maintain capital at
a prudent level in excess of minimum regulatory leverage ratio requirements. Further information on the financial performance framework can
be found in the financial review within the Strategic Report section of the Annual Report and Accounts 2019.
Nationwide also undertakes an annual Internal Capital Adequacy Assessment Process (ICAAP), and regular Group-wide stress tests are
undertaken to enhance the understanding of any potential vulnerabilities to stressed market conditions or tail-risk events and how management
actions might be deployed in the event of stressed conditions developing.
4.2 Pillar 1
Credit risk
Nationwide uses IRB approaches for certain credit risk portfolios following FSA approval in May 2008. This was updated to a CRR permission
from January 2014 by the PRA which allows Nationwide to continue to use an IRB approach under the CRD IV framework.
The scope of IRB permission for the year ended 4 April 2019 is as follows:
IRB Category Portfolios Percentage of total IRB
exposure
Advanced IRB • Nationwide, TMW and UCB residential mortgages;
• Unsecured lending (personal loans); and
• Qualifying revolving credit risks (personal current accounts and credit cards).
90.0%
Foundation IRB • Exposures to institutions (including derivatives and repurchase/reverse repurchase
agreements); and
• Exposures to housing associations (Registered Social Landlords)
6.8%
Slotting IRB • Income Producing Real estate (IPRE); and
• Project finance
1.1%
Ratings Based
Method
• Securitisations* 1.1%
Other • Non-credit obligation assets; and
• Equity
1.0%
*This relates to positions issued prior to January 2019
All other credit exposures are risk weighted based on the SA.
Operational risk
The SA is adopted for operational risk. Further information concerning operational risk can be found in section 9.
Nationwide Pillar 3 Disclosure 2019
19
Market risk
Market risk arises from foreign exchange risk under Pillar 1 due to foreign currencies in the banking book. The Foreign Exchange Position Risk
Requirement (FX PRR) charge is the amount of regulatory capital required to cover the risk of losses on open foreign currency positions due to
movements in foreign exchange rates. This is calculated in accordance with the SA, and is currently set to zero as it falls below the threshold
of 2% of total own funds capital requirements. Other market risks are not included in regulatory capital requirements under Pillar 1 as
Nationwide does not have a trading book under the CRD IV definition, but are captured in Pillar 2A requirements (see section 4.3 for details).
Further information on market risk can be found in section 10.
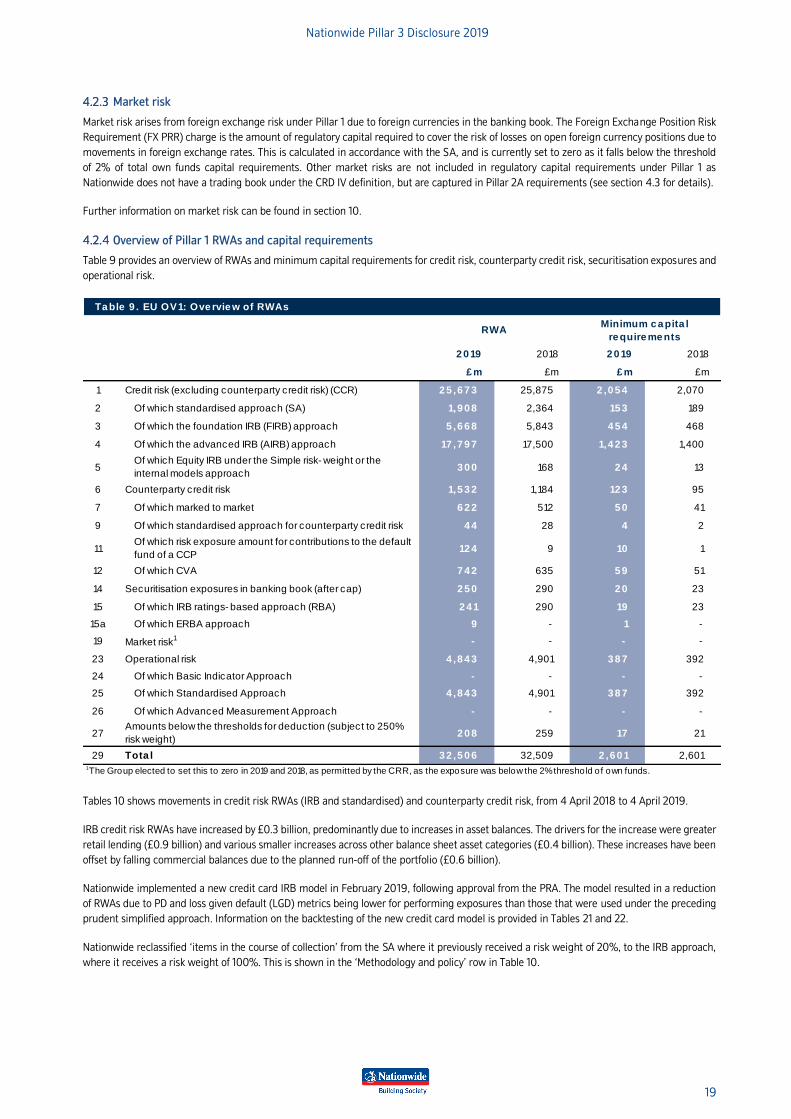
Overview of Pillar 1 RWAs and capital requirements
Table 9 provides an overview of RWAs and minimum capital requirements for credit risk, counterparty credit risk, securitisation exposures and
operational risk.
Ta ble 9 . EU OV1: Ove rvie w of RWAs
2 0 19 2018 2 0 19 2018
£ m £m £ m £m
1 Credit risk (excluding counterparty credit risk) (CCR) 2 5 ,6 7 3 25,875 2 ,0 5 4 2,070
2 Of which standardised approach (SA) 1,9 0 8 2,364 15 3 189
3 Of which the foundation IRB (FIRB) approach 5 ,6 6 8 5,843 4 5 4 468
4 Of which the advanced IRB (AIRB) approach 17 ,7 9 7 17,500 1,4 2 3 1,400
5Of which Equity IRB under the Simple risk- weight or the
internal models approach3 0 0 168 2 4 13
6 Counterparty credit risk 1,5 3 2 1,184 12 3 95
7 Of which marked to market 6 2 2 512 5 0 41
9 Of which standardised approach for counterparty credit risk 4 4 28 4 2
11Of which risk exposure amount for contributions to the default
fund of a CCP12 4 9 10 1
12 Of which CVA 7 4 2 635 5 9 51
14 Securitisation exposures in banking book (after cap) 2 5 0 290 2 0 23
15 Of which IRB ratings- based approach (RBA) 2 4 1 290 19 23
15a Of which ERBA approach 9 - 1 -
19 Market risk1 - - - -
23 Operational risk 4 ,8 4 3 4,901 3 8 7 392
24 Of which Basic Indicator Approach - - - -
25 Of which Standardised Approach 4 ,8 4 3 4,901 3 8 7 392
26 Of which Advanced Measurement Approach - - - -
27Amounts below the thresholds for deduction (subject to 250%
risk weight)2 0 8 259 17 21
29 Tota l 3 2 ,5 0 6 32,509 2 ,6 0 1 2,601
RWAMinimum c a pita l
re quire me nts
1The Group elected to set this to zero in 2019 and 2018, as permitted by the CRR, as the exposure was below the 2% threshold of own funds.
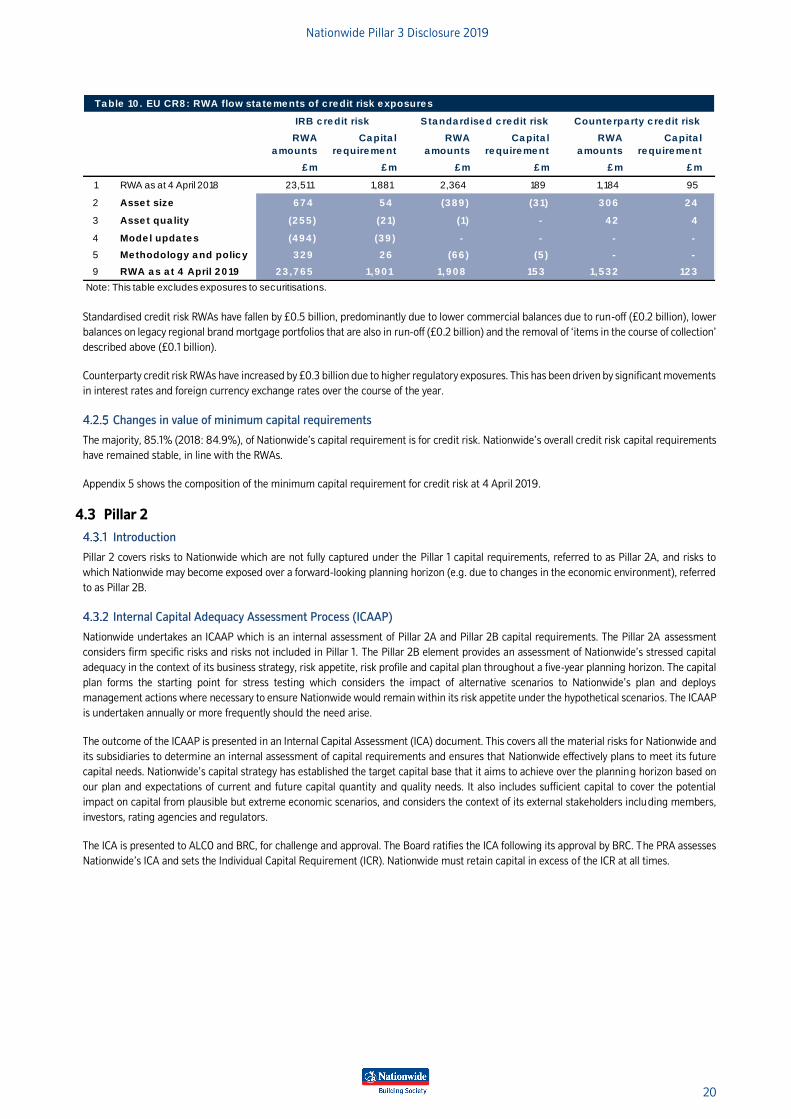
Tables 10 shows movements in credit risk RWAs (IRB and standardised) and counterparty credit risk, from 4 April 2018 to 4 April 2019.
IRB credit risk RWAs have increased by £0.3 billion, predominantly due to increases in asset balances. The drivers for the increase were greater
retail lending (£0.9 billion) and various smaller increases across other balance sheet asset categories (£0.4 billion). These increases have been
offset by falling commercial balances due to the planned run-off of the portfolio (£0.6 billion).
Nationwide implemented a new credit card IRB model in February 2019, following approval from the PRA. The model resulted in a reduction
of RWAs due to PD and loss given default (LGD) metrics being lower for performing exposures than those that were used under the preceding
prudent simplified approach. Information on the backtesting of the new credit card model is provided in Tables 21 and 22.
Nationwide reclassified ‘items in the course of collection’ from the SA where it previously received a risk weight of 20%, to the IRB approach,
where it receives a risk weight of 100%. This is shown in the ‘Methodology and policy’ row in Table 10.
Nationwide Pillar 3 Disclosure 2019
20
Ta ble 10 . EU CR8 : RWA flow sta te me nts of c re dit risk e xposure s
RWA
a mounts
Ca pita l
re quire me nt
RWA
a mounts
Ca pita l
re quire me nt
RWA
a mounts
Ca pita l
re quire me nt
£ m £ m £ m £ m £ m £ m
1 RWA as at 4 April 2018 23,511 1,881 2,364 189 1,184 95
2 Asse t size 6 7 4 5 4 (3 8 9 ) (3 1) 3 0 6 2 4
3 Asse t qua lity (2 5 5 ) (2 1) (1) - 4 2 4
4 Mode l upda te s (4 9 4 ) (3 9 ) - - - -
5 Me thodology a nd polic y 3 2 9 2 6 (6 6 ) (5 ) - -
9 RWA a s a t 4 April 2 0 19 2 3 ,7 6 5 1,9 0 1 1,9 0 8 15 3 1,5 3 2 12 3
Note: This table excludes exposures to securitisations.
IRB c re dit risk Sta nda rdise d c re dit risk Counte rpa rty c re dit risk
Standardised credit risk RWAs have fallen by £0.5 billion, predominantly due to lower commercial balances due to run-off (£0.2 billion), lower
balances on legacy regional brand mortgage portfolios that are also in run-off (£0.2 billion) and the removal of ‘items in the course of collection’
described above (£0.1 billion).
Counterparty credit risk RWAs have increased by £0.3 billion due to higher regulatory exposures. This has been driven by significant movements
in interest rates and foreign currency exchange rates over the course of the year.
Changes in value of minimum capital requirements
The majority, 85.1% (2018: 84.9%), of Nationwide’s capital requirement is for credit risk. Nationwide’s overall credit risk capital requirements
have remained stable, in line with the RWAs.
Appendix 5 shows the composition of the minimum capital requirement for credit risk at 4 April 2019.
4.3 Pillar 2
Introduction
Pillar 2 covers risks to Nationwide which are not fully captured under the Pillar 1 capital requirements, referred to as Pillar 2A, and risks to
which Nationwide may become exposed over a forward-looking planning horizon (e.g. due to changes in the economic environment), referred
to as Pillar 2B.
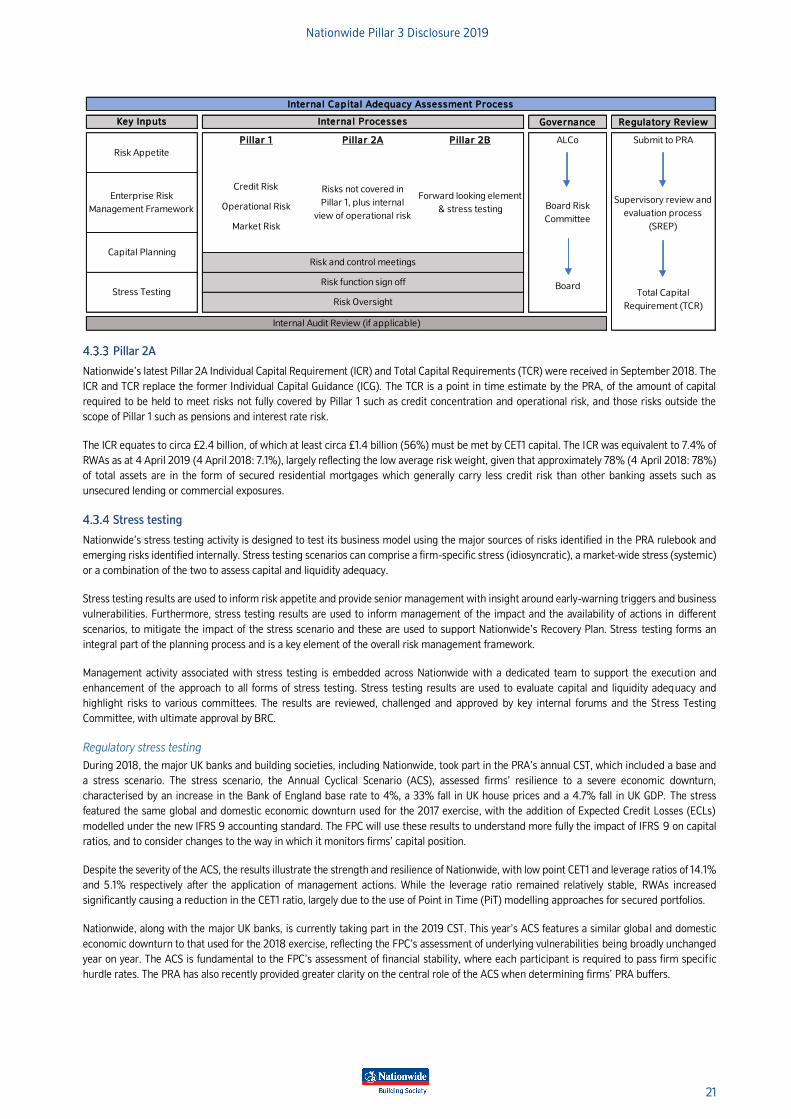
Internal Capital Adequacy Assessment Process (ICAAP)
Nationwide undertakes an ICAAP which is an internal assessment of Pillar 2A and Pillar 2B capital requirements. The Pillar 2A assessment
considers firm specific risks and risks not included in Pillar 1. The Pillar 2B element provides an assessment of Nationwide’s stressed capital
adequacy in the context of its business strategy, risk appetite, risk profile and capital plan throughout a five-year planning horizon. The capital
plan forms the starting point for stress testing which considers the impact of alternative scenarios to Nationwide’s plan and deploys
management actions where necessary to ensure Nationwide would remain within its risk appetite under the hypothetical scenarios. The ICAAP
is undertaken annually or more frequently should the need arise.
The outcome of the ICAAP is presented in an Internal Capital Assessment (ICA) document. This covers all the material risks for Nationwide and
its subsidiaries to determine an internal assessment of capital requirements and ensures that Nationwide effectively plans to meet its future
capital needs. Nationwide’s capital strategy has established the target capital base that it aims to achieve over the planning horizon based on
our plan and expectations of current and future capital quantity and quality needs. It also includes sufficient capital to cover the potential
impact on capital from plausible but extreme economic scenarios, and considers the context of its external stakeholders including members,
investors, rating agencies and regulators.
The ICA is presented to ALCO and BRC, for challenge and approval. The Board ratifies the ICA following its approval by BRC. The PRA assesses
Nationwide’s ICA and sets the Individual Capital Requirement (ICR). Nationwide must retain capital in excess of the ICR at all times.
Nationwide Pillar 3 Disclosure 2019
21
Governance Regulatory Review
Pillar 1 P illar 2A Pillar 2B ALCo Submit to PRA
Credit Risk
Operational Risk
Market Risk
Board
Supervisory review and
evaluation process
(SREP)
Internal Audit Review (if applicable)
Total Capital
Requirement (TCR)
Interna l Cap ita l Adequacy Assessment Process
Forward looking element
& stress testing
Capital PlanningRisk and control meetings
Risk function sign off
Risk OversightStress Testing
Board Risk
Committee
Interna l ProcessesKey Inp uts
Risk Appetite
Enterprise Risk
Management Framework
Risks not covered in
Pillar 1, plus internal
view of operational risk
Pillar 2A
Nationwide’s latest Pillar 2A Individual Capital Requirement (ICR) and Total Capital Requirements (TCR) were received in September 2018. The
ICR and TCR replace the former Individual Capital Guidance (ICG). The TCR is a point in time estimate by the PRA, of the amount of capital
required to be held to meet risks not fully covered by Pillar 1 such as credit concentration and operational risk, and those risks outside the
scope of Pillar 1 such as pensions and interest rate risk.
The ICR equates to circa £2.4 billion, of which at least circa £1.4 billion (56%) must be met by CET1 capital. The ICR was equivalent to 7.4% of
RWAs as at 4 April 2019 (4 April 2018: 7.1%), largely reflecting the low average risk weight, given that approximately 78% (4 April 2018: 78%)
of total assets are in the form of secured residential mortgages which generally carry less credit risk than other banking assets such as
unsecured lending or commercial exposures.
Stress testing
Nationwide’s stress testing activity is designed to test its business model using the major sources of risks identified in the PRA rulebook and
emerging risks identified internally. Stress testing scenarios can comprise a firm-specific stress (idiosyncratic), a market-wide stress (systemic)
or a combination of the two to assess capital and liquidity adequacy.
Stress testing results are used to inform risk appetite and provide senior management with insight around early-warning triggers and business
vulnerabilities. Furthermore, stress testing results are used to inform management of the impact and the availability of actions in different
scenarios, to mitigate the impact of the stress scenario and these are used to support Nationwide’s Recovery Plan. Stress testing forms an
integral part of the planning process and is a key element of the overall risk management framework.
Management activity associated with stress testing is embedded across Nationwide with a dedicated team to support the execution and
enhancement of the approach to all forms of stress testing. Stress testing results are used to evaluate capital and liquidity adequacy and
highlight risks to various committees. The results are reviewed, challenged and approved by key internal forums and the Stress Testing
Committee, with ultimate approval by BRC.
Regulatory stress testing
During 2018, the major UK banks and building societies, including Nationwide, took part in the PRA’s annual CST, which included a base and
a stress scenario. The stress scenario, the Annual Cyclical Scenario (ACS), assessed firms’ resilience to a severe economic downturn,
characterised by an increase in the Bank of England base rate to 4%, a 33% fall in UK house prices and a 4.7% fall in UK GDP. The stress
featured the same global and domestic economic downturn used for the 2017 exercise, with the addition of Expected Credit Losses (ECLs)
modelled under the new IFRS 9 accounting standard. The FPC will use these results to understand more fully the impact of IFRS 9 on capital
ratios, and to consider changes to the way in which it monitors firms’ capital position.
Despite the severity of the ACS, the results illustrate the strength and resilience of Nationwide, with low point CET1 and leverage ratios of 14.1%
and 5.1% respectively after the application of management actions. While the leverage ratio remained relatively stable, RWAs increased
significantly causing a reduction in the CET1 ratio, largely due to the use of Point in Time (PiT) modelling approaches for secured portfolios.
Nationwide, along with the major UK banks, is currently taking part in the 2019 CST. This year’s ACS features a similar globa l and domestic
economic downturn to that used for the 2018 exercise, reflecting the FPC’s assessment of underlying vulnerabilities being broadly unchanged
year on year. The ACS is fundamental to the FPC’s assessment of financial stability, where each participant is required to pass firm specif ic
hurdle rates. The PRA has also recently provided greater clarity on the central role of the ACS when determining firms’ PRA buffers.
Nationwide Pillar 3 Disclosure 2019
22
Reverse stress testing
Nationwide completes an annual Reverse Stress Test to refresh management’s understanding of the point at which the business model and
strategy could be considered as having failed (i.e. ‘Point of Failure’) and to identify the extreme scenarios that may lead to such failure.
Understanding the likelihood of these extreme scenarios assists in determining whether any preventive action should be taken to mitigate such
tail-risk threats.
Other stress testing activity
Nationwide undertakes a broad suite of stress testing exercises each year, ranging from mild stresses such as alternative scenarios for the
Financial Plan (expectation of future business performance) through to more extreme stresses, such as the Reverse Stress Test.
A range of internal stress test scenarios are created, with each of an appropriate severity to ensure that across the stress testing programme,
a sufficiently broad range of risks are tested. The calibration, severity and timing of the stress tests is influenced by the risks identified by
internal central macroeconomic and business forecasts, strategic risk assessment, and existing and future regulatory requirements. These risks
are identified through a qualitative assessment of Nationwide’s risks and vulnerabilities and are assessed in terms of their potential impact and
likelihood of occurring, alongside any second-order impacts. Scenarios are designed by incorporating an individual risk, or combination of risks
identified by the qualitative assessment.
4.4 Regulatory capital buffers
Introduction
Under CRD IV, institutions are required to meet the following own funds requirements: a CET1 capital ratio of 4.5%, a Tier 1 capital ratio of 6%
and a total capital ratio of 8%. These form the institution’s Pillar 1 requirements. Pillar 2A covers firm specific risks and those that are not fully
addressed by Pillar 1. In addition to the minimum capital requirements, CRD IV requires institutions to hold capital buffers, together the
combined capital buffer, that can be utilised to absorb losses in stressed conditions.
Under the PRA’s Pillar 2 framework it may also set a Pillar 2B PRA buffer defining a firm specific capital buffer over and above the combined
buffer that should be maintained in non-stressed conditions as a mitigation against future possible stress periods. The PRA requires that the
level of this buffer is not publicly disclosed.
The PRA buffer is assessed alongside other capital buffers, as described below. All buffers must be met with CET1 resources.
Capital conservation buffer
The capital conservation buffer is designed to ensure that institutions build up capital buffers outside times of stress that can be drawn upon
if required. From January 2019 the capital conservation buffer requirement is 2.5% of RWAs from 2019.
Countercyclical buffer (CCyB)
The CCyB requires financial institutions to hold additional capital to reduce systemic risks associated with the excess build-up of credit by
providing additional loss absorbing capacity and acting as an incentive to limit further credit growth.
Each institution’s specific countercyclical buffer rate is a weighted average of the countercyclical capital buffers that app ly in the jurisdictions
where the relevant credit exposures are located. The FPC is responsible for setting the UK CCyB rate (for credit exposures located in the UK),
and has indicated that this will be set at 1% in normal economic conditions, but can be set up to 2.5%. As of 4 April 2019 the UK CCyB was set
at 1%. The FPC will reconsider the level of the UK CCyB at each quarterly meeting. See section 4.5 for Nationwide’s CCyB.
G-SII buffer
Financial institutions that are considered to represent a higher risk to the global financial system, based on a number of key factors, are defined
as globally systemically important institutions (G-SIIs). G-SIIs are categorised into buckets based on size, interconnectedness, substitutability,
complexity and global activity. As a result of its bucket allocation, each G-SII’s capital requirement is determined from within the range of 1%
to 2.5% of RWAs. Nationwide does not currently meet the definition of a G-SII so this buffer is not applicable.
Systemic risk buffer (SRB)
The SRB will be introduced by the PRA to mitigate long term non-cyclical systemic or macro-prudential risks. The SRB applies to ring fenced
banks and large building societies. The buffer rate is between 0% and 3% depending on balance sheet size. A 1% buffer will be applicable for
Nationwide from August 2019.
4.5 Countercyclical capital buffer
Table 11 shows Nationwide’s specific countercyclical capital buffer rate and requirement as follows:
• The total risk exposure amount across Nationwide for exposures in all countries;
• The institution specific countercyclical buffer rate, which is Nationwide’s weighted-average countercyclical buffer rate, calculated by
multiplying the own funds requirement for each geographical area where the exposure lies by the countercyclical buffer rate set for
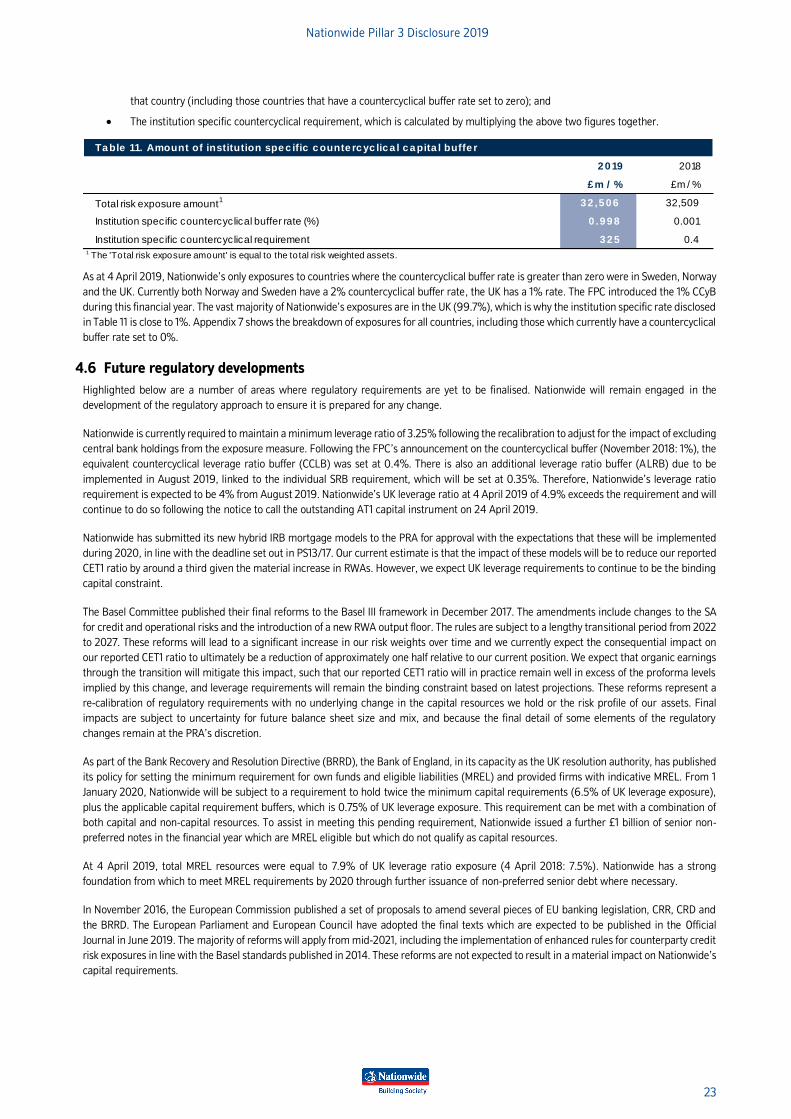
Nationwide Pillar 3 Disclosure 2019
23
that country (including those countries that have a countercyclical buffer rate set to zero); and
• The institution specific countercyclical requirement, which is calculated by multiplying the above two figures together.
Table 11. Amount of institution spec ific counte rcyc lica l capita l buffe r
2019 2018
£m / % £m / %
Total risk exposure amount1 32 ,506 32,509
Institution specific countercyclical buffer rate (%) 0 .998 0.001
Institution specific countercyclical requirement 3 2 5 0.41 The 'Total risk exposure amount' is equal to the total risk weighted assets.
As at 4 April 2019, Nationwide’s only exposures to countries where the countercyclical buffer rate is greater than zero were in Sweden, Norway
and the UK. Currently both Norway and Sweden have a 2% countercyclical buffer rate, the UK has a 1% rate. The FPC introduced the 1% CCyB
during this financial year. The vast majority of Nationwide’s exposures are in the UK (99.7%), which is why the institution specific rate disclosed
in Table 11 is close to 1%. Appendix 7 shows the breakdown of exposures for all countries, including those which currently have a countercyclical
buffer rate set to 0%.
4.6 Future regulatory developments
Highlighted below are a number of areas where regulatory requirements are yet to be finalised. Nationwide will remain engaged in the
development of the regulatory approach to ensure it is prepared for any change.
Nationwide is currently required to maintain a minimum leverage ratio of 3.25% following the recalibration to adjust for the impact of excluding
central bank holdings from the exposure measure. Following the FPC’s announcement on the countercyclical buffer (November 2018: 1%), the
equivalent countercyclical leverage ratio buffer (CCLB) was set at 0.4%. There is also an additional leverage ratio buffer (ALRB) due to be
implemented in August 2019, linked to the individual SRB requirement, which will be set at 0.35%. Therefore, Nationwide’s leverage ratio
requirement is expected to be 4% from August 2019. Nationwide’s UK leverage ratio at 4 April 2019 of 4.9% exceeds the requirement and will
continue to do so following the notice to call the outstanding AT1 capital instrument on 24 April 2019.
Nationwide has submitted its new hybrid IRB mortgage models to the PRA for approval with the expectations that these will be implemented
during 2020, in line with the deadline set out in PS13/17. Our current estimate is that the impact of these models will be to reduce our reported
CET1 ratio by around a third given the material increase in RWAs. However, we expect UK leverage requirements to continue to be the binding
capital constraint.
The Basel Committee published their final reforms to the Basel III framework in December 2017. The amendments include changes to the SA
for credit and operational risks and the introduction of a new RWA output floor. The rules are subject to a lengthy transitional period from 2022
to 2027. These reforms will lead to a significant increase in our risk weights over time and we currently expect the consequential impact on
our reported CET1 ratio to ultimately be a reduction of approximately one half relative to our current position. We expect that organic earnings
through the transition will mitigate this impact, such that our reported CET1 ratio will in practice remain well in excess of the proforma levels
implied by this change, and leverage requirements will remain the binding constraint based on latest projections. These reforms represent a
re-calibration of regulatory requirements with no underlying change in the capital resources we hold or the risk profile of our assets. Final
impacts are subject to uncertainty for future balance sheet size and mix, and because the final detail of some elements of the regulatory
changes remain at the PRA’s discretion.
As part of the Bank Recovery and Resolution Directive (BRRD), the Bank of England, in its capacity as the UK resolution authority, has published
its policy for setting the minimum requirement for own funds and eligible liabilities (MREL) and provided firms with indicative MREL. From 1
January 2020, Nationwide will be subject to a requirement to hold twice the minimum capital requirements (6.5% of UK leverage exposure),
plus the applicable capital requirement buffers, which is 0.75% of UK leverage exposure. This requirement can be met with a combination of
both capital and non-capital resources. To assist in meeting this pending requirement, Nationwide issued a further £1 billion of senior non-
preferred notes in the financial year which are MREL eligible but which do not qualify as capital resources.
At 4 April 2019, total MREL resources were equal to 7.9% of UK leverage ratio exposure (4 April 2018: 7.5%). Nationwide has a strong
foundation from which to meet MREL requirements by 2020 through further issuance of non-preferred senior debt where necessary.
In November 2016, the European Commission published a set of proposals to amend several pieces of EU banking legislation, CRR, CRD and
the BRRD. The European Parliament and European Council have adopted the final texts which are expected to be published in the Official
Journal in June 2019. The majority of reforms will apply from mid-2021, including the implementation of enhanced rules for counterparty credit
risk exposures in line with the Basel standards published in 2014. These reforms are not expected to result in a material impact on Nationwide’s
capital requirements.
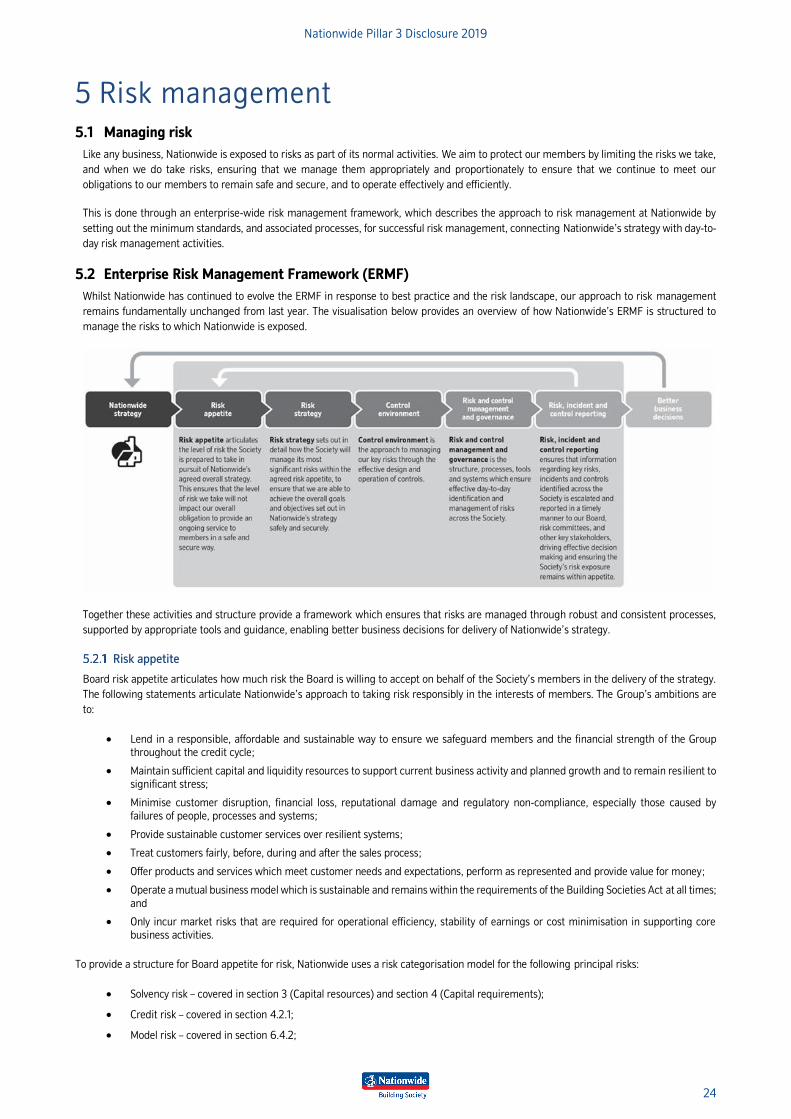
Nationwide Pillar 3 Disclosure 2019
24
5 Risk management 5.1 Managing risk
Like any business, Nationwide is exposed to risks as part of its normal activities. We aim to protect our members by limiting the risks we take,
and when we do take risks, ensuring that we manage them appropriately and proportionately to ensure that we continue to meet our
obligations to our members to remain safe and secure, and to operate effectively and efficiently.
This is done through an enterprise-wide risk management framework, which describes the approach to risk management at Nationwide by
setting out the minimum standards, and associated processes, for successful risk management, connecting Nationwide’s strategy with day-to-
day risk management activities.
5.2 Enterprise Risk Management Framework (ERMF)
Whilst Nationwide has continued to evolve the ERMF in response to best practice and the risk landscape, our approach to risk management
remains fundamentally unchanged from last year. The visualisation below provides an overview of how Nationwide’s ERMF is structured to
manage the risks to which Nationwide is exposed.
Together these activities and structure provide a framework which ensures that risks are managed through robust and consistent processes,
supported by appropriate tools and guidance, enabling better business decisions for delivery of Nationwide’s strategy.
Risk appetite
Board risk appetite articulates how much risk the Board is willing to accept on behalf of the Society’s members in the delivery of the strategy.
The following statements articulate Nationwide’s approach to taking risk responsibly in the interests of members. The Group’s ambitions are
to:
• Lend in a responsible, affordable and sustainable way to ensure we safeguard members and the financial strength of the Group
throughout the credit cycle;
• Maintain sufficient capital and liquidity resources to support current business activity and planned growth and to remain resilient to
significant stress;
• Minimise customer disruption, financial loss, reputational damage and regulatory non-compliance, especially those caused by
failures of people, processes and systems;
• Provide sustainable customer services over resilient systems;
• Treat customers fairly, before, during and after the sales process;
• Offer products and services which meet customer needs and expectations, perform as represented and provide value for money;
• Operate a mutual business model which is sustainable and remains within the requirements of the Building Societies Act at all times;
and
• Only incur market risks that are required for operational efficiency, stability of earnings or cost minimisation in supporting core
business activities.
To provide a structure for Board appetite for risk, Nationwide uses a risk categorisation model for the following principal risks:
• Solvency risk – covered in section 3 (Capital resources) and section 4 (Capital requirements);
• Credit risk – covered in section 4.2.1;
• Model risk – covered in section 6.4.2;

Nationwide Pillar 3 Disclosure 2019
25
• Operational risk – covered in section 4.2.2;
• Market risk – covered in Section 4.2.3;
• Business risk in section 11;
• Conduct and compliance risk in section 11;
• Liquidity and Funding risk in section 11; and
• Pension risk in section 11.
Each of these risks has a defined risk appetite consisting of statements supported by metrics, including rationale, limits and triggers. The
principal risks are further sub-divided into more detailed categories of risk for which management risk appetite is set in the context of the
Board’s risk appetite.
A high-level description of Nationwide’s Board Risk Appetite is set out in the Annual Report and Accounts 2019.
Risk strategy
The risk strategy articulates the anticipated direction of travel for the full risk management agenda. It identifies the risks which result from
Nationwide’s strategy and sets out how these will be managed. This incorporates risk category-specific (Level 1) strategies, focusing on key
challenges and areas of focus. The Nationwide Risk Strategy defines:
• How we manage risk at Nationwide;
• Capability requirements over the strategy period (5 years) so Nationwide's strategy is delivered within appetite;
• Key areas of focus and challenges in the next 12 months; and
• The Board's preferences/tolerances for risks (articulating the amount of, and type of, risk which Nationwide is willing to take in
exchange for a return).
Control environment
The control environment encompasses all the policies and controls we operate on a day-to-day basis to manage our material risks within
appetite. Through the control environment, Nationwide translates our risk appetite and our strategy into specific requirements for which
policies, controls, processes and tools are designed, implemented, operated and tested. This provides assurance that each of the Group’s key
risks are appropriately controlled and enables the assessment and reporting of the Group’s residual exposure to risks compared to appetite.
Policy
The Group has a suite of policies, which set out the rules for managing our risks so that we operate within risk appetite and meet our objectives,
the key purpose of which is to:
• Articulate the desired outcomes for managing a specific risk;
• Translate risk strategy and risk appetite into meaningful actions; and
• Give information to colleagues on how to perform their role.
Internal Control Standard
The Internal Control Standard defines the Group’s approach to control management, defining the expectations and minimum standards for
identification, design, assessment and reporting of all critical controls ensuring:
• Better awareness of the importance of controls;
• Clear, coherent, roles and responsibilities for control management;
• Consistent and transparent control management; and
• Clearer evidence that Senior Management Function’s (SMFs) and Material Risk Taker’s (MRTs) are taking “reasonable steps” to
discharge their accountabilities and meet regulatory expectations.
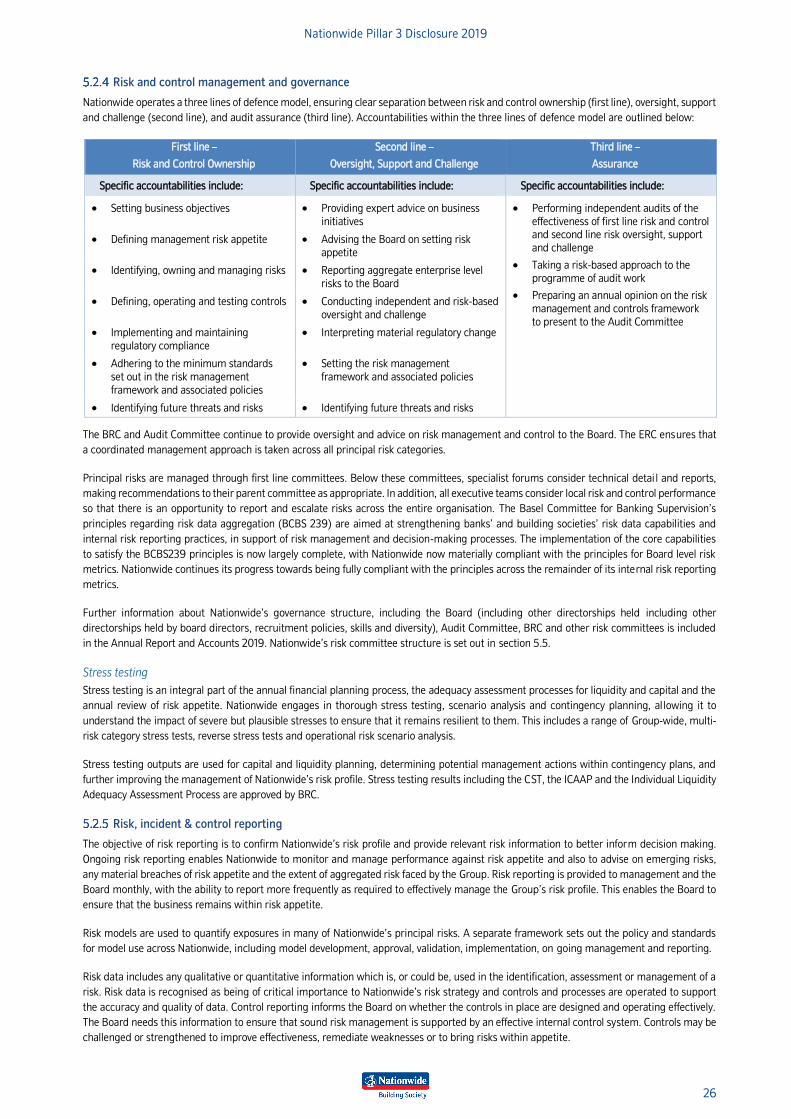
Nationwide Pillar 3 Disclosure 2019
26
Risk and control management and governance
Nationwide operates a three lines of defence model, ensuring clear separation between risk and control ownership (first line), oversight, support
and challenge (second line), and audit assurance (third line). Accountabilities within the three lines of defence model are outlined below:
First line –
Risk and Control Ownership
Second line –
Oversight, Support and Challenge
Third line –
Assurance
Specific accountabilities include: Specific accountabilities include: Specific accountabilities include:
• Setting business objectives • Providing expert advice on business
initiatives
• Performing independent audits of the
effectiveness of first line risk and control and second line risk oversight, support
and challenge
• Taking a risk-based approach to the
programme of audit work
• Preparing an annual opinion on the risk
management and controls framework
to present to the Audit Committee
• Defining management risk appetite • Advising the Board on setting risk
appetite
• Identifying, owning and managing risks • Reporting aggregate enterprise level
risks to the Board
• Defining, operating and testing controls • Conducting independent and risk-based
oversight and challenge
• Implementing and maintaining
regulatory compliance
• Interpreting material regulatory change
• Adhering to the minimum standards
set out in the risk management
framework and associated policies
• Setting the risk management
framework and associated policies
• Identifying future threats and risks • Identifying future threats and risks
The BRC and Audit Committee continue to provide oversight and advice on risk management and control to the Board. The ERC ensures that
a coordinated management approach is taken across all principal risk categories.
Principal risks are managed through first line committees. Below these committees, specialist forums consider technical detai l and reports,
making recommendations to their parent committee as appropriate. In addition, all executive teams consider local risk and control performance
so that there is an opportunity to report and escalate risks across the entire organisation. The Basel Committee for Banking Supervision’s
principles regarding risk data aggregation (BCBS 239) are aimed at strengthening banks’ and building societies’ risk data capabilities and
internal risk reporting practices, in support of risk management and decision-making processes. The implementation of the core capabilities
to satisfy the BCBS239 principles is now largely complete, with Nationwide now materially compliant with the principles for Board level risk
metrics. Nationwide continues its progress towards being fully compliant with the principles across the remainder of its internal risk reporting
metrics.
Further information about Nationwide’s governance structure, including the Board (including other directorships held including other
directorships held by board directors, recruitment policies, skills and diversity), Audit Committee, BRC and other risk committees is included
in the Annual Report and Accounts 2019. Nationwide’s risk committee structure is set out in section 5.5.
Stress testing
Stress testing is an integral part of the annual financial planning process, the adequacy assessment processes for liquidity and capital and the
annual review of risk appetite. Nationwide engages in thorough stress testing, scenario analysis and contingency planning, al lowing it to
understand the impact of severe but plausible stresses to ensure that it remains resilient to them. This includes a range of Group-wide, multi-
risk category stress tests, reverse stress tests and operational risk scenario analysis.
Stress testing outputs are used for capital and liquidity planning, determining potential management actions within contingency plans, and
further improving the management of Nationwide’s risk profile. Stress testing results including the CST, the ICAAP and the Individual Liquidity
Adequacy Assessment Process are approved by BRC.
Risk, incident & control reporting
The objective of risk reporting is to confirm Nationwide’s risk profile and provide relevant risk information to better inform decision making.
Ongoing risk reporting enables Nationwide to monitor and manage performance against risk appetite and also to advise on emerging risks,
any material breaches of risk appetite and the extent of aggregated risk faced by the Group. Risk reporting is provided to management and the
Board monthly, with the ability to report more frequently as required to effectively manage the Group’s risk profile. This enables the Board to
ensure that the business remains within risk appetite.
Risk models are used to quantify exposures in many of Nationwide’s principal risks. A separate framework sets out the policy and standards
for model use across Nationwide, including model development, approval, validation, implementation, on going management and reporting.
Risk data includes any qualitative or quantitative information which is, or could be, used in the identification, assessment or management of a
risk. Risk data is recognised as being of critical importance to Nationwide’s risk strategy and controls and processes are operated to support
the accuracy and quality of data. Control reporting informs the Board on whether the controls in place are designed and operating effectively.
The Board needs this information to ensure that sound risk management is supported by an effective internal control system. Controls may be
challenged or strengthened to improve effectiveness, remediate weaknesses or to bring risks within appetite.
Nationwide Pillar 3 Disclosure 2019
27
Risk culture
Nationwide’s culture plays an important part in risk management. It is informed by Nationwide’s identity, as a member-owned building society,
and core purpose and it impacts the way risk is managed at Nationwide. Risk culture describes the norms, attitudes and behaviours related to
risk management which all employees are expected to embrace to complement Nationwide’s PRIDE values and support its member-centric
objectives. For further information on Nationwide’s risk culture and PRIDE values, see the Annual Report and Accounts 2019.
5.3 Effectiveness of risk management arrangements
The Board is responsible for ensuring that Nationwide maintains a sound system of internal control to support its strategy and objectives. To
achieve this, the Board monitors the Society’s risk management and internal control systems and carries out an annual review of their
effectiveness. On the basis of this year’s review, the Board is satisfied that Nationwide has an adequate system of risk management and internal
control. Further information on risk management is set out in the Annual Report and Accounts 2019.
5.4 Coverage of risks
Pillar 3 disclosures in this document cover the Pillar 1 risks: credit risk (section 6), counterparty credit risk (section 7), securitisations (section
8), operational risk (section 9) and market risk (section 10). Other principal risks are summarised in section 11. Additional information on the
other principal risks, including conduct and compliance risks, can be found in the Annual Report and Accounts 2019. Pillar 2A risks are
discussed in section 4.3.
5.5 The Group’s risk committee structure and responsibilities
The Board is responsible for robustly assessing the principal risks facing Nationwide, including those that could potentially damage its business
model, future performance, solvency or liquidity. These risks are set out in the Business and Risk Report in the Annual Report and Accounts
2019 which explains how they are being managed. To achieve this, the Board approves Nationwide’s risk appetite and metrics, following
consideration by BRC and receives regular reports and assessments of Nationwide’s risk and control processes, and recommendations from
BRC on matters spanning all risk categories and including the appropriate level of risk appetite.
The Board has delegated responsibility to BRC for approval of the ERMF and the Nationwide Risk Strategy. Further information about
Nationwide’s ERMF is set out in the Business and Risk Report of the Annual Report and Accounts 2019. BRC receives reports from the Oversight
teams, which outline the programme of reviews performed during the year and key findings of the work undertaken.
The Board has delegated oversight of the management of the relationship with Nationwide’s external auditors to the Audit Comm ittee, details
of which is set out in the Audit Committee report within the Annual Report and Accounts 2019. Internal Audit provides the Audit Committee
with a report on the audit work carried out during the year.
Individual accountability at Board and senior manager level has been strengthened following the introduction by Nationwide’s regulators of
the Senior Managers and Certification Regime in March 2016. This established a revised framework under which senior managers are
individually and personally accountable for specific areas of Nationwide’s business. It also introduced a certification regime requiring
Nationwide to assess the fitness and propriety of staff in positions where the decisions they make could pose significant harm to the business
or its customers. In support of this, all directors have access to the services and advice of the Group General Counsel and are able to obtain
independent, professional advice on matters relating to their responsibilities.
The committee structure is shown on the following page.
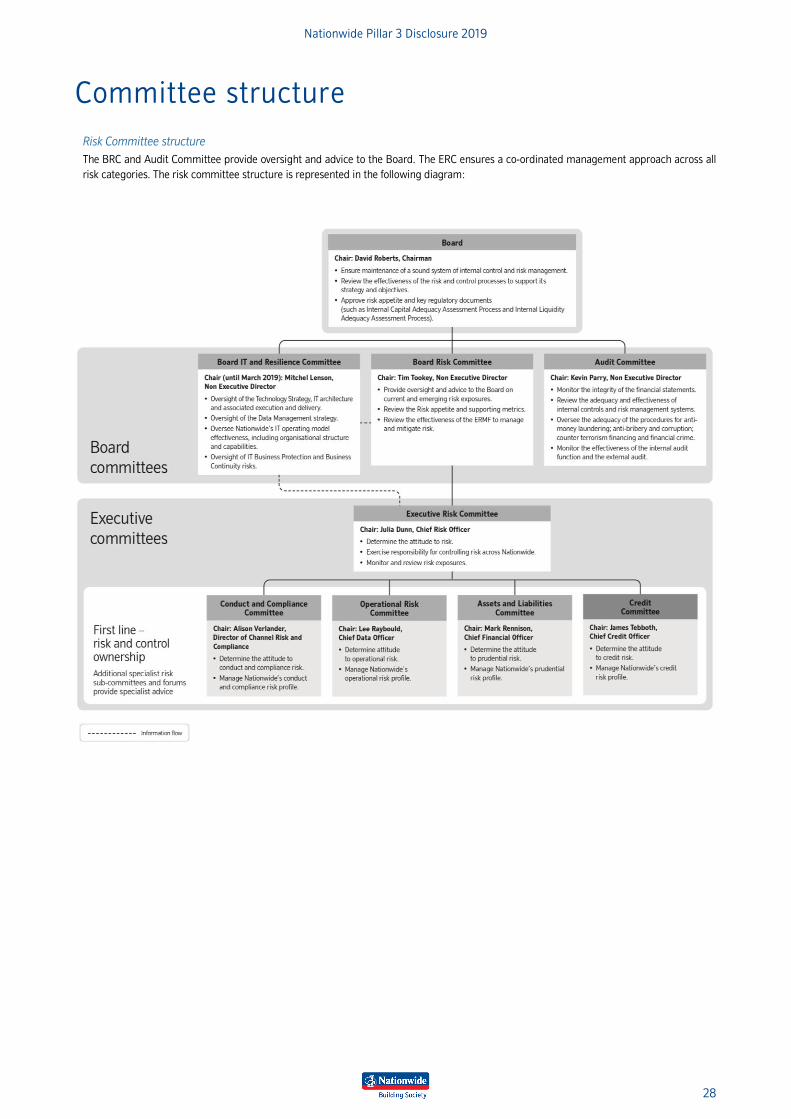
Nationwide Pillar 3 Disclosure 2019
28
Committee structure
Risk Committee structure
The BRC and Audit Committee provide oversight and advice to the Board. The ERC ensures a co-ordinated management approach across all
risk categories. The risk committee structure is represented in the following diagram:
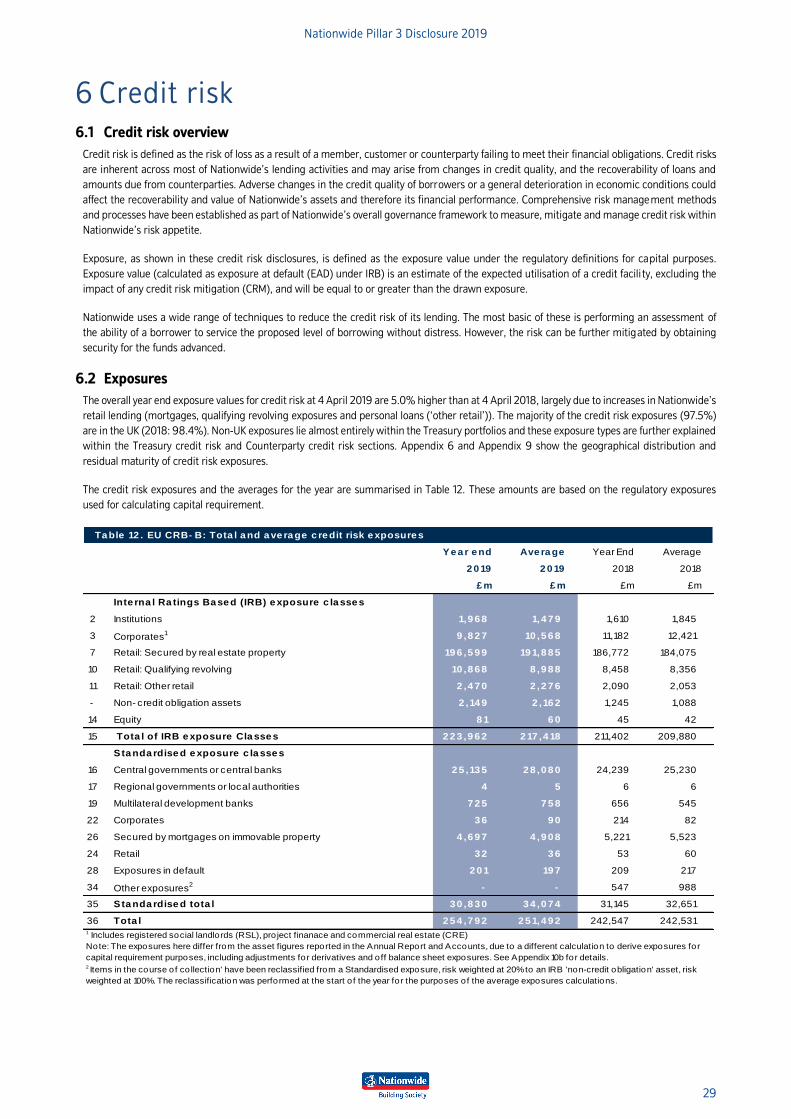
Nationwide Pillar 3 Disclosure 2019
29
6 Credit risk 6.1 Credit risk overview
Credit risk is defined as the risk of loss as a result of a member, customer or counterparty failing to meet their financial obligations. Credit risks
are inherent across most of Nationwide’s lending activities and may arise from changes in credit quality, and the recoverability of loans and
amounts due from counterparties. Adverse changes in the credit quality of borrowers or a general deterioration in economic conditions could
affect the recoverability and value of Nationwide’s assets and therefore its financial performance. Comprehensive risk management methods
and processes have been established as part of Nationwide’s overall governance framework to measure, mitigate and manage credit risk within
Nationwide’s risk appetite.
Exposure, as shown in these credit risk disclosures, is defined as the exposure value under the regulatory definitions for capital purposes.
Exposure value (calculated as exposure at default (EAD) under IRB) is an estimate of the expected utilisation of a credit facili ty, excluding the
impact of any credit risk mitigation (CRM), and will be equal to or greater than the drawn exposure.
Nationwide uses a wide range of techniques to reduce the credit risk of its lending. The most basic of these is performing an assessment of
the ability of a borrower to service the proposed level of borrowing without distress. However, the risk can be further mitigated by obtaining
security for the funds advanced.
6.2 Exposures
The overall year end exposure values for credit risk at 4 April 2019 are 5.0% higher than at 4 April 2018, largely due to increases in Nationwide’s
retail lending (mortgages, qualifying revolving exposures and personal loans (‘other retail’)). The majority of the credit risk exposures (97.5%)
are in the UK (2018: 98.4%). Non-UK exposures lie almost entirely within the Treasury portfolios and these exposure types are further explained
within the Treasury credit risk and Counterparty credit risk sections. Appendix 6 and Appendix 9 show the geographical distribution and
residual maturity of credit risk exposures.
The credit risk exposures and the averages for the year are summarised in Table 12. These amounts are based on the regulatory exposures
used for calculating capital requirement.
Ye a r e nd Ave ra ge Year End Average
2 0 19 2 0 19 2018 2018
£ m £ m £m £m
Inte rna l Ra tings Ba se d (IRB) e xposure c la sse s
2 Institutions IRB 1,9 6 8 1,4 7 9 1,610 1,845
3 Corporates1 IRB 9 ,8 2 7 10 ,5 6 8 11,182 12,421
7 Retail: Secured by real estate property 19 6 ,5 9 9 19 1,8 8 5 186,772 184,075
10 Retail: Qualifying revolving 10 ,8 6 8 8 ,9 8 8 8,458 8,356
11 Retail: Other retail 2 ,4 7 0 2 ,2 7 6 2,090 2,053
- Non- credit obligation assets 2 ,14 9 2 ,16 2 1,245 1,088
14 Equity 8 1 6 0 45 42
15 Tota l of IRB e xposure Cla sse s 2 2 3 ,9 6 2 2 17 ,4 18 211,402 209,880
Sta nda rdise d e xposure c la sse s
16 Central governments or central banks standardised 2 5 ,13 5 2 8 ,0 8 0 24,239 25,230
17 Regional governments or local authorities 4 5 6 6
19 Multilateral development banks 7 2 5 7 5 8 656 545
22 Corporates standardised 3 6 9 0 214 82
26 Secured by mortgages on immovable property 4 ,6 9 7 4 ,9 0 8 5,221 5,523
24 Retail 3 2 3 6 53 60
28 Exposures in default 2 0 1 19 7 209 217
34 Other exposures2 - - 547 988
35 Sta nda rdise d tota l 3 0 ,8 3 0 3 4 ,0 7 4 31,145 32,651
36 Tota l 2 5 4 ,7 9 2 2 5 1,4 9 2 242,547 242,531
Ta ble 12 . EU CRB- B: Tota l a nd a ve ra ge c re dit risk e xposure s
1 Includes registered social landlords (RSL), pro ject finanace and commercial real estate (CRE)
Note: The exposures here differ from the asset figures reported in the Annual Report and Accounts, due to a different calculation to derive exposures for
capital requirement purposes, including adjustments for derivatives and off balance sheet exposures. See Appendix 10b for details.2 Items in the course of co llection' have been reclassified from a Standardised exposure, risk weighted at 20% to an IRB 'non-credit obligation' asset, risk
weighted at 100%. The reclassification was performed at the start o f the year for the purposes of the average exposures calculations.
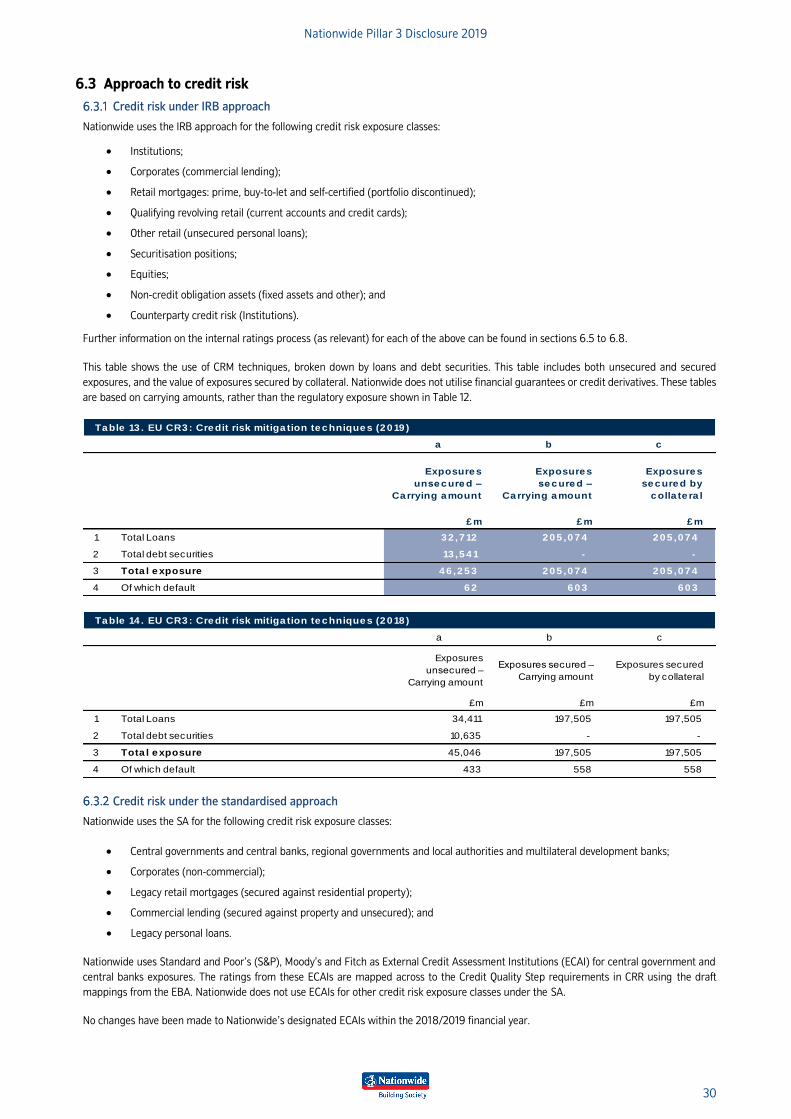
Nationwide Pillar 3 Disclosure 2019
30
6.3 Approach to credit risk
Credit risk under IRB approach
Nationwide uses the IRB approach for the following credit risk exposure classes:
• Institutions;
• Corporates (commercial lending);
• Retail mortgages: prime, buy-to-let and self-certified (portfolio discontinued);
• Qualifying revolving retail (current accounts and credit cards);
• Other retail (unsecured personal loans);
• Securitisation positions;
• Equities;
• Non-credit obligation assets (fixed assets and other); and
• Counterparty credit risk (Institutions).
Further information on the internal ratings process (as relevant) for each of the above can be found in sections 6.5 to 6.8.
This table shows the use of CRM techniques, broken down by loans and debt securities. This table includes both unsecured and secured
exposures, and the value of exposures secured by collateral. Nationwide does not utilise financial guarantees or credit derivatives. These tables
are based on carrying amounts, rather than the regulatory exposure shown in Table 12.
Table 13 . EU CR3: Credit risk mitiga tion techniques (2019 )
a b c
Exposures
unsecured –
Carrying amount
Exposures
secured –
Carrying amount
Exposures
secured by
colla te ra l
£ m £ m £ m
1 Total Loans 32 ,712 205 ,074 205 ,074
2 Total debt securities 13 ,541 - -
3 Tota l exposure 46 ,253 205 ,074 205 ,074
4 Of which default 6 2 6 0 3 6 0 3
Table 14 . EU CR3: Credit risk mitiga tion techniques (2018 )
a b c
Exposures
unsecured –
Carrying amount
Exposures secured –
Carrying amount
Exposures secured
by collateral
£m £m £m
1 Total Loans 34,411 197,505 197,505
2 Total debt securities 10,635 - -
3 Tota l exposure 45,046 197,505 197,505
4 Of which default 433 558 558
Credit risk under the standardised approach
Nationwide uses the SA for the following credit risk exposure classes:
• Central governments and central banks, regional governments and local authorities and multilateral development banks;
• Corporates (non-commercial);
• Legacy retail mortgages (secured against residential property);
• Commercial lending (secured against property and unsecured); and
• Legacy personal loans.
Nationwide uses Standard and Poor’s (S&P), Moody’s and Fitch as External Credit Assessment Institutions (ECAI) for central government and
central banks exposures. The ratings from these ECAIs are mapped across to the Credit Quality Step requirements in CRR using the draft
mappings from the EBA. Nationwide does not use ECAIs for other credit risk exposure classes under the SA.
No changes have been made to Nationwide’s designated ECAIs within the 2018/2019 financial year.
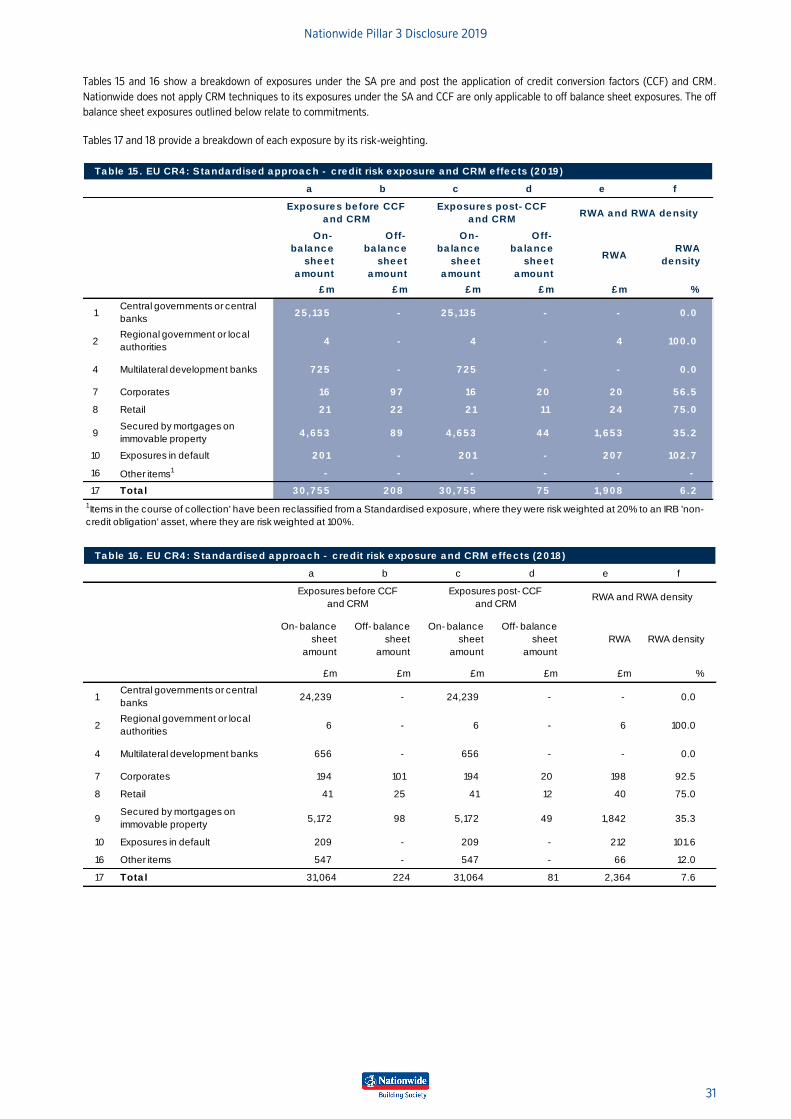
Nationwide Pillar 3 Disclosure 2019
31
Tables 15 and 16 show a breakdown of exposures under the SA pre and post the application of credit conversion factors (CCF) and CRM.
Nationwide does not apply CRM techniques to its exposures under the SA and CCF are only applicable to off balance sheet exposures. The off
balance sheet exposures outlined below relate to commitments.
Tables 17 and 18 provide a breakdown of each exposure by its risk-weighting.
Ta ble 15 . EU CR4 : S ta nda rdise d a pproa c h - c re dit risk e xposure a nd CRM e ffe c ts (2 0 19 )
a b c d e f
On-
ba la nc e
she e t
a mount
Off-
ba la nc e
she e t
a mount
On-
ba la nc e
she e t
a mount
Off-
ba la nc e
she e t
a mount
RWARWA
de nsity
£ m £ m £ m £ m £ m %
1Central governments or central
banks Standardised2 5 ,13 5 - 2 5 ,13 5 - - 0 .0
2Regional government or local
authorities4 - 4 - 4 10 0 .0
4 Multilateral development banks 7 2 5 - 7 2 5 - - 0 .0
7 Corporates Standardised 16 9 7 16 2 0 2 0 5 6 .5
8 Retail 2 1 2 2 2 1 11 2 4 7 5 .0
9Secured by mortgages on
immovable property4 ,6 5 3 8 9 4 ,6 5 3 4 4 1,6 5 3 3 5 .2
10 Exposures in default 2 0 1 - 2 0 1 - 2 0 7 10 2 .7
16 Other items1 - - - - - -
17 Tota l 3 0 ,7 5 5 2 0 8 3 0 ,7 5 5 7 5 1,9 0 8 6 .2
1 Items in the course of collection' have been reclassified from a Standardised exposure, where they were risk weighted at 20% to an IRB 'non-
credit obligation' asset, where they are risk weighted at 100%.
RWA a nd RWA de nsityExposure s be fore CCF
a nd CRM
Exposure s post- CCF
a nd CRM
Ta ble 16 . EU CR4 : S ta nda rdise d a pproa c h - c re dit risk e xposure a nd CRM e ffe c ts (2 0 18 )
a b c d e f
On- balance
sheet
amount
Off- balance
sheet
amount
On- balance
sheet
amount
Off- balance
sheet
amount
RWA RWA density
£m £m £m £m £m %
1Central governments or central
banks Standardised24,239 - 24,239 - - 0.0
2Regional government or local
authorities6 - 6 - 6 100.0
4 Multilateral development banks 656 - 656 - - 0.0
7 Corporates Standardised 194 101 194 20 198 92.5
8 Retail 41 25 41 12 40 75.0
9Secured by mortgages on
immovable property5,172 98 5,172 49 1,842 35.3
10 Exposures in default 209 - 209 - 212 101.6
16 Other items 547 - 547 - 66 12.0
17 Tota l 31,064 224 31,064 81 2,364 7.6
Exposures before CCF
and CRM
Exposures post- CCF
and CRMRWA and RWA density
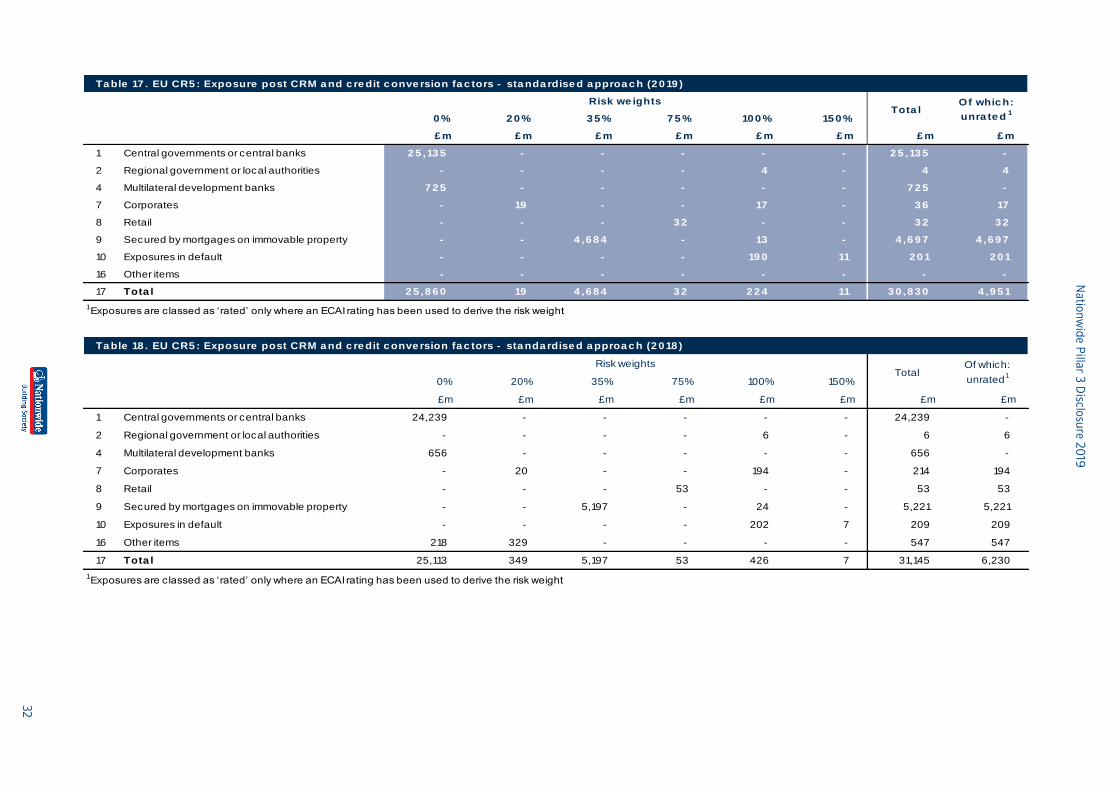
Na
tion
wid
e P
illar 3
Disclo
sure
20
19
32
Ta ble 17 . EU CR5 : Exposure post CRM a nd c re dit c onve rsion fa c tors - sta nda rdise d a pproa c h (2 0 19 )
0 % 2 0 % 3 5 % 7 5 % 10 0 % 15 0 %
£ m £ m £ m £ m £ m £ m £ m £ m
1 Central governments or central banks standardised 2 5 ,13 5 - - - - - 2 5 ,13 5 -
2 Regional government or local authorities - - - - 4 - 4 4
4 Multilateral development banks 7 2 5 - - - - - 7 2 5 -
7 Corporates standardised - 19 - - 17 - 3 6 17
8 Retail - - - 3 2 - - 3 2 3 2
9 Secured by mortgages on immovable property - - 4 ,6 8 4 - 13 - 4 ,6 9 7 4 ,6 9 7
10 Exposures in default - - - - 19 0 11 2 0 1 2 0 1
16 Other items - - - - - - - -
17 Tota l 2 5 ,8 6 0 19 4 ,6 8 4 3 2 2 2 4 11 3 0 ,8 3 0 4 ,9 5 1
1 Exposures are classed as ‘rated’ only where an ECAI rating has been used to derive the risk weight
Tota lOf whic h:
unra te d1
Risk we ights
Ta ble 18 . EU CR5 : Exposure post CRM a nd c re dit c onve rsion fa c tors - sta nda rdise d a pproa c h (2 0 18 )
0% 20% 35% 75% 100% 150%
£m £m £m £m £m £m £m £m
1 Central governments or central banks standardised 24,239 - - - - - 24,239 -
2 Regional government or local authorities - - - - 6 - 6 6
4 Multilateral development banks 656 - - - - - 656 -
7 Corporates standardised - 20 - - 194 - 214 194
8 Retail - - - 53 - - 53 53
9 Secured by mortgages on immovable property - - 5,197 - 24 - 5,221 5,221
10 Exposures in default - - - - 202 7 209 209
16 Other items 218 329 - - - - 547 547
17 Tota l 25,113 349 5,197 53 426 7 31,145 6,230
1 Exposures are classed as ‘rated’ only where an ECAI rating has been used to derive the risk weight
Risk weightsTotal
Of which:
unrated1
Nationwide Pillar 3 Disclosure 2019
33
6.4 IRB models
IRB models overview
As part of its calculation of the capital requirements for credit risk, Nationwide uses a range of IRB models. The key features of these models
are set out in table 19. In addition to calculating regulatory requirements, Nationwide’s IRB models support a number of business activities,
including credit approval, portfolio management, forecasting and stress testing, impairment calculations and the development of risk appetite.
Model risk management of IRB risk ratings systems
The performance and accuracy of IRB models is critical for the calculation of credit risk capital requirements. The effectiveness of the models
is achieved through clear allocation of roles and responsibilities covering model ownership, approval and governance, ongoing model
monitoring, review and independent validation.
Models are required to have a model owner in the first line; for IRB models this is the senior executive accountable for the credit risk portfolio
(i.e. Retail, Commercial and Treasury). The model owner is responsible for ensuring that the models are designed, developed, implemented,
governed and maintained in line with internal standards and regulatory requirements; this includes ensuring a robust control process using
preventative and detective controls throughout each stage of model development and use.
IRB models are required to be built in line with Nationwide’s internal model standards and IRB regulatory requirements. A combination of data
quality assessment, portfolio analysis, statistical assessment and performance testing is undertaken to control the risks associated with model
development. In addition, user acceptance and code testing are required prior to final model review and approval.
Ultimate responsibility for approving the use of Nationwide’s IRB models resides with the Credit Committee, ensuring that the committee
responsible for managing the credit risk is also responsible for ensuring the model risk is managed within appetite.
Regular monitoring of IRB models takes place at specialist credit risk committees and model review forums. Monitoring includes the
comparison of model outputs to observed data to ensure the models continue to operate within expected tolerances. Other features of the
models, such as stability and discrimination, are also closely monitored to ensure models remain fit for purpose. If the performance of a model
falls outside expected criteria, it will be subject to a detailed review. The model may then be modified or recalibrated as a result of the review.
Changes are also subject to review and governance and, dependent on materiality, may require regulatory approval prior to implementation.
A formal review is also required at least annually, the results of which are subject to independent oversight and governance.
As with other risk types, the expectation is that the first line teams should not be reliant upon the second line as part of the control process;
the first line teams are required to undertake a robust modelling approach and the role of second line is to provide independent expert oversight
of models. Independent validation is a key factor in deciding whether a newly developed model, or a model that has been changed, is approved
for use. It assesses whether the model adequately discriminates between different levels of risk and delivers accurate risk estimates. This
includes an evaluation of the quality of the source data, portfolio analysis, model design, assumptions, performance, documentation,
implementation and controls.
The findings of the validation are presented to the Model Risk Oversight Committee (MROC). The MROC is a second line committee with
responsibility for oversight of model risk delegated from the ERC. The MROC, chaired by the Head of Model Risk Oversight, considers whether
a new model is fit-for-purpose, and reviews IRB models at least annually to ensure they are performing within expectations.
Internal Audit, the third line of defence, reports independently to the Audit Committee and undertakes assurance activity on IRB models in
support of regulatory requirements. Examples include reviews of an individual model regulatory compliance, assessing how IRB models are
designed, implemented and monitored and, operational process audits in which IRB models are used to support decision making. Internal
audit also reviews the effectiveness of the risk oversight frameworks and independence of the validation approach used to establish and manage
model risk across the Group.
Models that are used to estimate IRB parameters must be approved for first use by the regulator with material changes also subject to regulatory
approval. Annually the Chief Risk Officer is required to attest compliance with the IRB regulatory requirements. To support this, a detailed,
evidenced based, reassessment of regulatory compliance is undertaken by the model owner, reviewed by Model Risk Oversight, with assurance
provided by Internal Audit.
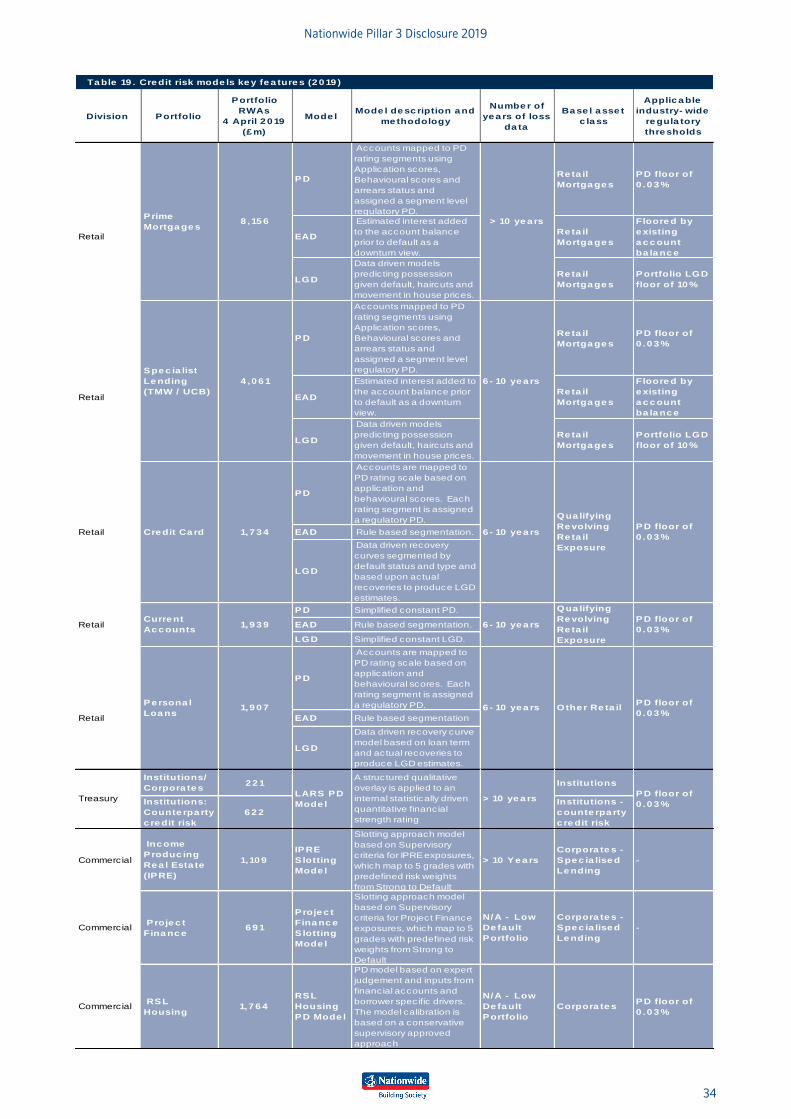
Nationwide Pillar 3 Disclosure 2019
34
Ta ble 19 . Cre dit risk mode ls ke y fe a ture s (2 0 19 )
Division Portfolio
Portfolio
RWAs
4 April 2 0 19
(£ m)
Mode lMode l de sc ription a nd
me thodology
Numbe r of
ye a rs of loss
da ta
Ba se l a sse t
c la ss
Applic a ble
industry- wide
re gula tory
thre sholds
6Prime Mortgages
PD
Accounts mapped to PD
rating segments using
Application scores,
Behavioural scores and
arrears status and
assigned a segment level
regulatory PD.
Re ta il
Mortga ge s
PD floor of
0 .0 3 %
Retail EAD
Estimated interest added
to the account balance
prior to default as a
downturn view.
Re ta il
Mortga ge s
Floore d by
e xisting
a c c ount
ba la nc e
Prime Mortgage RWAs
LGD
Data driven models
predicting possession
given default, haircuts and
movement in house prices.
Re ta il
Mortga ge s
Portfolio LGD
floor of 10 %
PD
Accounts mapped to PD
rating segments using
Application scores,
Behavioural scores and
arrears status and
assigned a segment level
regulatory PD.
Re ta il
Mortga ge s
PD floor of
0 .0 3 %
Retail EAD
Estimated interest added to
the account balance prior
to default as a downturn
view.
Re ta il
Mortga ge s
Floore d by
e xisting
a c c ount
ba la nc e
LGD
Data driven models
predicting possession
given default, haircuts and
movement in house prices.
Re ta il
Mortga ge s
Portfolio LGD
floor of 10 %
PD
Accounts are mapped to
PD rating scale based on
application and
behavioural scores. Each
rating segment is assigned
a regulatory PD.
Retail EAD Rule based segmentation.
LGD
Data driven recovery
curves segmented by
default status and type and
based upon actual
recoveries to produce LGD
estimates.
PD Simplified constant PD.
Retail EAD Rule based segmentation.
LGD Simplified constant LGD.
PD
Accounts are mapped to
PD rating scale based on
application and
behavioural scores. Each
rating segment is assigned
a regulatory PD.
Retail EAD Rule based segmentation
LGD
Data driven recovery curve
model based on loan term
and actual recoveries to
produce LGD estimates.
Institutions/
Corpora te s2 2 1 Institutions
Institutions:
Counte rpa rty
c re dit risk
6 2 2
Institutions -
c ounte rpa rty
c re dit risk
Commercial
Inc ome
Produc ing
Re a l Esta te
(IPRE)
1,10 9
IPRE
S lotting
Mode l
Slotting approach model
based on Supervisory
criteria for IPRE exposures,
which map to 5 grades with
predefined risk weights
from Strong to Default
> 10 Ye a rs
Corpora te s -
Spe c ia lise d
Le nding
-
Commercial P roje c t
Fina nc e 6 9 1
Proje c t
Fina nc e
S lotting
Mode l
Slotting approach model
based on Supervisory
criteria for Project Finance
exposures, which map to 5
grades with predefined risk
weights from Strong to
Default
N/A - Low
De fa ult
Portfolio
Corpora te s -
Spe c ia lise d
Le nding
-
Commercial RSL
Housing 1,7 6 4
RSL
Housing
PD Mode l
PD model based on expert
judgement and inputs from
financial accounts and
borrower specific drivers.
The model calibration is
based on a conservative
supervisory approved
approach
N/A - Low
De fa ult
Portfolio
Corpora te sPD floor of
0 .0 3 %
TreasuryLARS PD
Mode l> 10 ye a rs
PD floor of
0 .0 3 %
Prime
Mortga ge s 8 ,15 6
A structured qualitative
overlay is applied to an
internal statistically driven
quantitative financial
strength rating
> 10 ye a rs
4 ,0 6 1
Spe c ia list
Le nding
(TMW / UCB)
Cre dit Ca rd
Curre nt
Ac c ounts
Pe rsona l
Loa ns
1,7 3 4
1,9 3 9
1,9 0 7
6 - 10 ye a rs
6 - 10 ye a rs
6 - 10 ye a rs
6 - 10 ye a rs
Qua lifying
Re volving
Re ta il
Exposure
PD floor of
0 .0 3 %
Qua lifying
Re volving
Re ta il
Exposure
PD floor of
0 .0 3 %
Othe r Re ta ilPD floor of
0 .0 3 %
Nationwide Pillar 3 Disclosure 2019
35
IRB credit risk model performance
This section provides an analysis of the performance of IRB models over the year to 4 April 2019.
Nationwide operates an ongoing validation process to ensure models are “fit for purpose” and updated where appropriate either through
recalibration or redevelopment. A continuous rolling program of ongoing validation of Nationwide’s IRB models has shown that the models are
performing within expectations. However, as part of normal model management and maintenance the secured IRB model suite is being
redeveloped, in part to reflect pending regulatory changes for firms which use the IRB approach (see section 4.6 for more details regarding
the expected impact). Details of the backtesting of Nationwide’s IRB models can be found in Tables 20, 21 and 22.
Expected Loss is an input to the capital adequacy calculation which represent an expectation of average future loss over the next 12 months,
as a result of applying Nationwide’s PD, LGD and EAD models.
While it can be valuable to compare regulatory models with accounting models, there are material differences between the methodologies and
underlying principles for calculating Expected Loss (EL) according to capital regulatory requirements and the Expected Credit Loss (ECL)
according to the IFRS 9 accounting standard. Notable differences include different definitions of default, the use of ‘downturn’ estimates for
regulatory ELs versus long-run averages for ECLs, and the use of a 12-month forecast horizon for regulatory ELs versus lifetime losses for higher
risk assets under IFRS 9 (stage 2 and 3 assets). Any comparisons must therefore take into consideration these key differences.
Treasury
As Treasury credit risks are measured on a Foundation IRB (FIRB) basis, the only modelled parameter is PD. The estimated PDs for treasury
portfolios can be found in Table 20 (no defaults have been recorded against this portfolio in the year to 4 April 2019).
Commercial
Three IRB models are used to support the commercial lending portfolios: IPRE, Registered Social Landlords (RSL) and project finance. The IPRE
and project finance models adopt the Specialised Lending (Slotting) methodology in PRA Supervisory Statement SS11/13. These models do not
use PD and LGDs to calculate capital, instead they use the risk weights and expected loss values prescribed by the regulator. As a result,
measures of model performance for PD and LGD are not applicable. Regular monitoring appropriate for the Specialised Lending methodology
has been developed and indicates the models continue to perform as expected. Outputs of the model monitoring are shared with internal
committees on a monthly basis, with an expert group meeting quarterly to discuss model monitoring and address any issues arising from the
monitoring.
The RSL model produces PD estimates but to date no defaults have been recorded against the portfolio. The portfolio is on a FIRB approach,
so only PD estimates are modelled. LGD and EAD estimates under the FIRB approach are determined in accordance with standard parameters
set by the regulator rather than on the basis of internal estimates. Table 20 sets out the results of PD backtesting.
Retail secured mortgages
Retail mortgages include both prime and specialist portfolios. The mortgage rating systems utilise a PiT rating scale approach for the estimation
of regulatory capital. Accounts are expected to migrate across grades as the economy moves through the cycle.
The first step in the process is the calculation of the PD component. For early months on book, loans are assigned a PD based on their application
score, thereafter a behavioural score is used. For both scorecards, a range of obligor and transactional characteristics are used including
information like bureau scores, delinquency history, loan to value (LTV), employment type and debt to income ratios.
The final scores derived from either the application or behavioural scorecards are mapped to a PD segment based on pre-defined (calibrated)
threshold values of the score. The application / behavioural scorecard is applied to performing cases only. The delinquent cases are mapped
to the delinquent part of the rating scale based on months in arrears. The behavioural score is recalculated each month and each IRB case is
mapped to the rating scale. Table 21 shows that the PD estimates continue to rank order across the grade range and the distributions are
stable. The back testing demonstrates that the estimated PDs remain closely aligned to the actuals, with marginal overprediction observed
within each band giving an appropriately prudent calibration.
The EAD models predict the exposure at the point of default, taking balances of the accounts adjusted to include the potential for additional
months’ interest and expected payments made prior to default.
LGD is calculated at property level via a “two-stage” modelling process. The first part of the modelling process involves predicting the likelihood
of a defaulted mortgage account flowing into possession which is driven by the LTV of the property. The second part of the process estimates
the forced sale discount, or loss of property value, that will occur in the event of possession and impact the sale price. These two models are
then combined to provide an estimate for LGD. Table 22 shows the results of the LGD back testing and demonstrates that the estimates also
remain appropriately prudent.
Retail unsecured lending
Retail unsecured includes the personal loan and credit card portfolios. The unsecured rating systems utilise a PiT rating scale approach for the
estimation of regulatory capital. Accounts are expected to migrate across grades as the economy moves through the cycle.
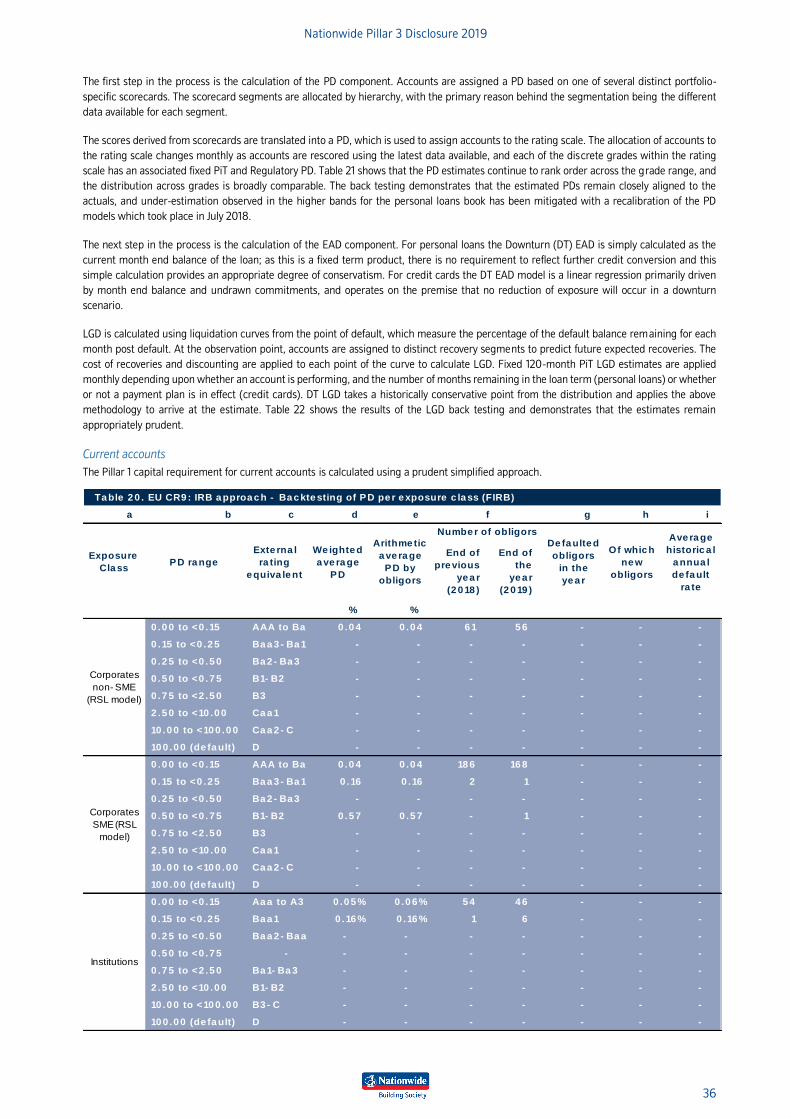
Nationwide Pillar 3 Disclosure 2019
36
The first step in the process is the calculation of the PD component. Accounts are assigned a PD based on one of several distinct portfolio-
specific scorecards. The scorecard segments are allocated by hierarchy, with the primary reason behind the segmentation being the different
data available for each segment.
The scores derived from scorecards are translated into a PD, which is used to assign accounts to the rating scale. The allocation of accounts to
the rating scale changes monthly as accounts are rescored using the latest data available, and each of the discrete grades within the rating
scale has an associated fixed PiT and Regulatory PD. Table 21 shows that the PD estimates continue to rank order across the grade range, and
the distribution across grades is broadly comparable. The back testing demonstrates that the estimated PDs remain closely aligned to the
actuals, and under-estimation observed in the higher bands for the personal loans book has been mitigated with a recalibration of the PD
models which took place in July 2018.
The next step in the process is the calculation of the EAD component. For personal loans the Downturn (DT) EAD is simply calculated as the
current month end balance of the loan; as this is a fixed term product, there is no requirement to reflect further credit conversion and this
simple calculation provides an appropriate degree of conservatism. For credit cards the DT EAD model is a linear regression primarily driven
by month end balance and undrawn commitments, and operates on the premise that no reduction of exposure will occur in a downturn
scenario.
LGD is calculated using liquidation curves from the point of default, which measure the percentage of the default balance remaining for each
month post default. At the observation point, accounts are assigned to distinct recovery segments to predict future expected recoveries. The
cost of recoveries and discounting are applied to each point of the curve to calculate LGD. Fixed 120-month PiT LGD estimates are applied
monthly depending upon whether an account is performing, and the number of months remaining in the loan term (personal loans) or whether
or not a payment plan is in effect (credit cards). DT LGD takes a historically conservative point from the distribution and applies the above
methodology to arrive at the estimate. Table 22 shows the results of the LGD back testing and demonstrates that the estimates remain
appropriately prudent.
Current accounts
The Pillar 1 capital requirement for current accounts is calculated using a prudent simplified approach.
Ta ble 2 0 . EU CR9 : IRB a pproa c h - Ba c kte sting of PD pe r e xposure c la ss (FIRB)
a b c d e g h i
End of
pre vious
ye a r
(2 0 18 )
End of
the
ye a r
(2 0 19 )
% %
0 .0 0 to <0 .15 AAA to Ba a 2 0 .0 4 0 .0 4 6 1 5 6 - - -
0 .15 to <0 .2 5 Ba a 3 - Ba 1 - - - - - - -
0 .2 5 to <0 .5 0 Ba 2 - Ba 3 - - - - - - -
0 .5 0 to <0 .7 5 B1- B2 - - - - - - -
0 .7 5 to <2 .5 0 B3 - - - - - - -
2 .5 0 to <10 .0 0 Ca a 1 - - - - - - -
10 .0 0 to <10 0 .0 0 Ca a 2 - C - - - - - - -
10 0 .0 0 (de fa ult) D - - - - - - -
0 .0 0 to <0 .15 AAA to Ba a 2 0 .0 4 0 .0 4 18 6 16 8 - - -
0 .15 to <0 .2 5 Ba a 3 - Ba 1 0 .16 0 .16 2 1 - - -
0 .2 5 to <0 .5 0 Ba 2 - Ba 3 - - - - - - -
0 .5 0 to <0 .7 5 B1- B2 0 .5 7 0 .5 7 - 1 - - -
0 .7 5 to <2 .5 0 B3 - - - - - - -
2 .5 0 to <10 .0 0 Ca a 1 - - - - - - -
10 .0 0 to <10 0 .0 0 Ca a 2 - C - - - - - - -
10 0 .0 0 (de fa ult) D - - - - - - -
0 .0 0 to <0 .15 Aa a to A3 0 .0 5 % 0 .0 6 % 5 4 4 6 - - -
0 .15 to <0 .2 5 Ba a 1 0 .16 % 0 .16 % 1 6 - - -
0 .2 5 to <0 .5 0 Ba a 2 - Ba a 3 - - - - - - -
0 .5 0 to <0 .7 5 - - - - - - - -
0 .7 5 to <2 .5 0 Ba 1- Ba 3 - - - - - - -
2 .5 0 to <10 .0 0 B1- B2 - - - - - - -
10 .0 0 to <10 0 .0 0 B3 - C - - - - - - -
10 0 .0 0 (de fa ult) D - - - - - - -
Institutions
De fa ulte d
obligors
in the
ye a r
Of whic h
ne w
obligors
Ave ra ge
historic a l
a nnua l
de fa ult
ra te
Corporates
non- SME
(RSL model)
Corporates
SME (RSL
model)
f
Exposure
Cla ssPD ra nge
Exte rna l
ra ting
e quiva le nt
We ighte d
a ve ra ge
PD
Arithme tic
a ve ra ge
PD by
obligors
Numbe r of obligors
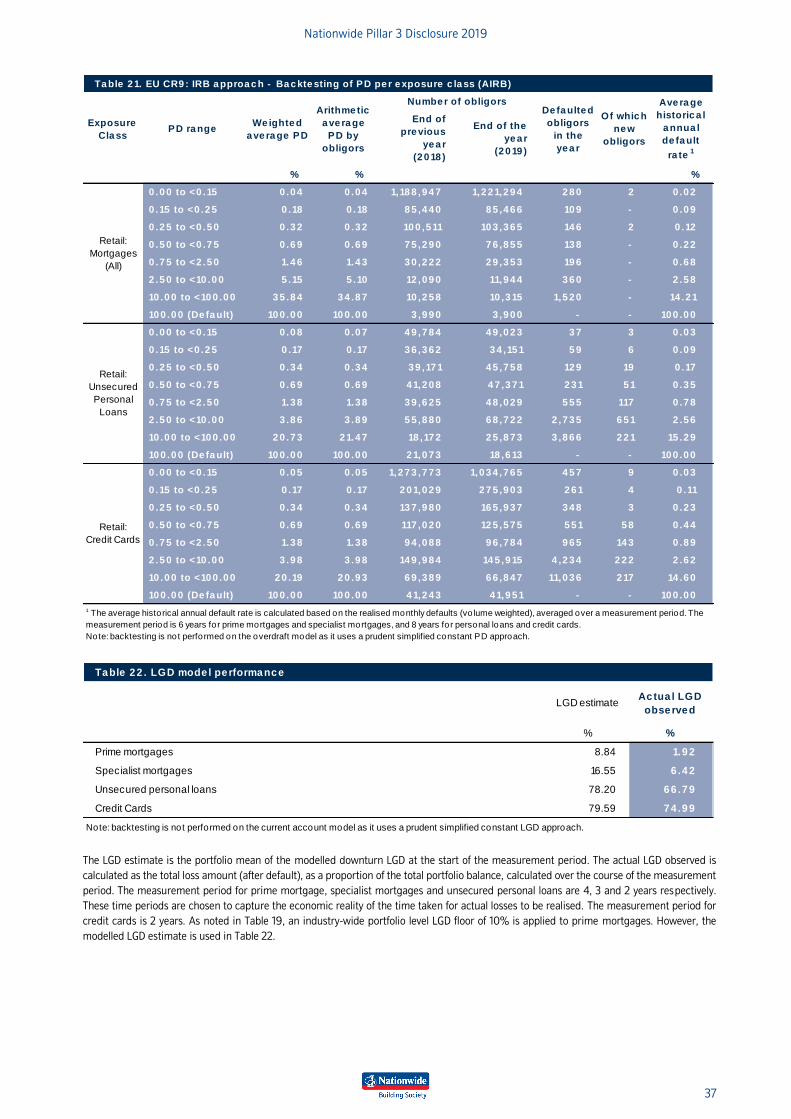
Nationwide Pillar 3 Disclosure 2019
37
Ta ble 2 1. EU CR9 : IRB a pproa c h - Ba c kte sting of PD pe r e xposure c la ss (AIRB)
End of
pre vious
ye a r
(2 0 18 )
End of the
ye a r
(2 0 19 )
% % %
0 .0 0 to <0 .15 0 .0 4 0 .0 4 1,18 8 ,9 4 7 1,2 2 1,2 9 4 2 8 0 2 0 .0 2
0 .15 to <0 .2 5 0 .18 0 .18 8 5 ,4 4 0 8 5 ,4 6 6 10 9 - 0 .0 9
0 .2 5 to <0 .5 0 0 .3 2 0 .3 2 10 0 ,5 11 10 3 ,3 6 5 14 6 2 0 .12
0 .5 0 to <0 .7 5 0 .6 9 0 .6 9 7 5 ,2 9 0 7 6 ,8 5 5 13 8 - 0 .2 2
0 .7 5 to <2 .5 0 1.4 6 1.4 3 3 0 ,2 2 2 2 9 ,3 5 3 19 6 - 0 .6 8
2 .5 0 to <10 .0 0 5 .15 5 .10 12 ,0 9 0 11,9 4 4 3 6 0 - 2 .5 8
10 .0 0 to <10 0 .0 0 3 5 .8 4 3 4 .8 7 10 ,2 5 8 10 ,3 15 1,5 2 0 - 14 .2 1
10 0 .0 0 (De fa ult) 10 0 .0 0 10 0 .0 0 3 ,9 9 0 3 ,9 0 0 - - 10 0 .0 0
0 .0 0 to <0 .15 0 .0 8 0 .0 7 4 9 ,7 8 4 4 9 ,0 2 3 3 7 3 0 .0 3
0 .15 to <0 .2 5 0 .17 0 .17 3 6 ,3 6 2 3 4 ,15 1 5 9 6 0 .0 9
0 .2 5 to <0 .5 0 0 .3 4 0 .3 4 3 9 ,17 1 4 5 ,7 5 8 12 9 19 0 .17
0 .5 0 to <0 .7 5 0 .6 9 0 .6 9 4 1,2 0 8 4 7 ,3 7 1 2 3 1 5 1 0 .3 5
0 .7 5 to <2 .5 0 1.3 8 1.3 8 3 9 ,6 2 5 4 8 ,0 2 9 5 5 5 117 0 .7 8
2 .5 0 to <10 .0 0 3 .8 6 3 .8 9 5 5 ,8 8 0 6 8 ,7 2 2 2 ,7 3 5 6 5 1 2 .5 6
10 .0 0 to <10 0 .0 0 2 0 .7 3 2 1.4 7 18 ,17 2 2 5 ,8 7 3 3 ,8 6 6 2 2 1 15 .2 9
10 0 .0 0 (De fa ult) 10 0 .0 0 10 0 .0 0 2 1,0 7 3 18 ,6 13 - - 10 0 .0 0
0 .0 0 to <0 .15 0 .0 5 0 .0 5 1,2 7 3 ,7 7 3 1,0 3 4 ,7 6 5 4 5 7 9 0 .0 3
0 .15 to <0 .2 5 0 .17 0 .17 2 0 1,0 2 9 2 7 5 ,9 0 3 2 6 1 4 0 .11
0 .2 5 to <0 .5 0 0 .3 4 0 .3 4 13 7 ,9 8 0 16 5 ,9 3 7 3 4 8 3 0 .2 3
0 .5 0 to <0 .7 5 0 .6 9 0 .6 9 117 ,0 2 0 12 5 ,5 7 5 5 5 1 5 8 0 .4 4
0 .7 5 to <2 .5 0 1.3 8 1.3 8 9 4 ,0 8 8 9 6 ,7 8 4 9 6 5 14 3 0 .8 9
2 .5 0 to <10 .0 0 3 .9 8 3 .9 8 14 9 ,9 8 4 14 5 ,9 15 4 ,2 3 4 2 2 2 2 .6 2
10 .0 0 to <10 0 .0 0 2 0 .19 2 0 .9 3 6 9 ,3 8 9 6 6 ,8 4 7 11,0 3 6 2 17 14 .6 0
10 0 .0 0 (De fa ult) 10 0 .0 0 10 0 .0 0 4 1,2 4 3 4 1,9 5 1 - - 10 0 .0 0
Exposure
Cla ssPD ra nge
We ighte d
a ve ra ge PD
Arithme tic
a ve ra ge
PD by
obligors
Numbe r of obligors
1 The average historical annual default rate is calculated based on the realised monthly defaults (vo lume weighted), averaged over a measurement period. The
measurement period is 6 years for prime mortgages and specialist mortgages, and 8 years for personal loans and credit cards.
Note: backtesting is not performed on the overdraft model as it uses a prudent simplified constant PD approach.
De fa ulte d
obligors
in the
ye a r
Of whic h
ne w
obligors
Ave ra ge
historic a l
a nnua l
de fa ult
ra te1
Retail:
Mortgages
(All)
Retail:
Unsecured
Personal
Loans
Retail:
Credit Cards
Table 22 . LGD mode l pe rformance
LGD estimateActua l LGD
observed
% %
Prime mortgages 8.84 1.92
Specialist mortgages 16.55 6 .42
Unsecured personal loans 78.20 66 .79
Credit Cards 79.59 74 .99
Note: backtesting is not performed on the current account model as it uses a prudent simplified constant LGD approach.
The LGD estimate is the portfolio mean of the modelled downturn LGD at the start of the measurement period. The actual LGD observed is
calculated as the total loss amount (after default), as a proportion of the total portfolio balance, calculated over the course of the measurement
period. The measurement period for prime mortgage, specialist mortgages and unsecured personal loans are 4, 3 and 2 years respectively.
These time periods are chosen to capture the economic reality of the time taken for actual losses to be realised. The measurement period for
credit cards is 2 years. As noted in Table 19, an industry-wide portfolio level LGD floor of 10% is applied to prime mortgages. However, the
modelled LGD estimate is used in Table 22.
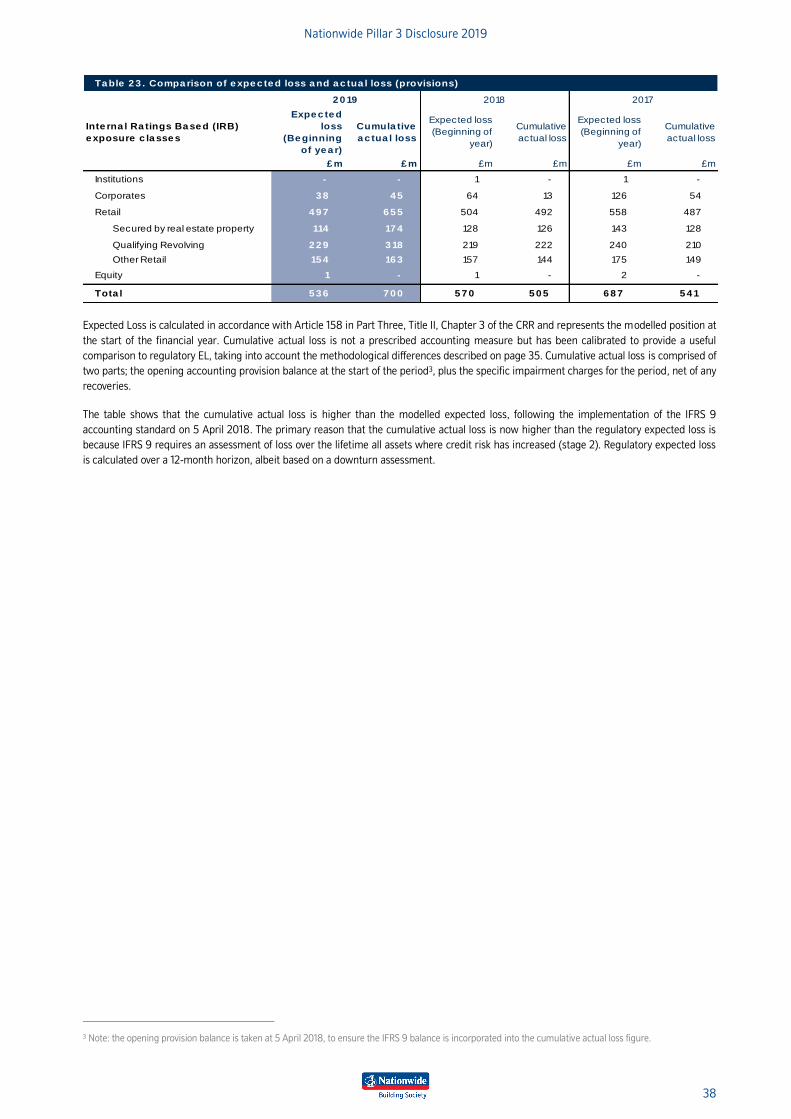
Nationwide Pillar 3 Disclosure 2019
38
Ta ble 2 3 . Compa rison of e xpe c te d loss a nd a c tua l loss (provisions)
Inte rna l Ra tings Ba se d (IRB)
e xposure c la sse s
Expe c te d
loss
(Be ginning
of ye a r)
Cumula tive
a c tua l loss
Expected loss
(Beginning of
year)
Cumulative
actual loss
Expected loss
(Beginning of
year)
Cumulative
actual loss
£ m £ m £m £m £m £m
Institutions - - 1 - 1 -
Corporates 3 8 4 5 64 13 126 54
Retail 4 9 7 6 5 5 504 492 558 487
Secured by real estate property 114 17 4 128 126 143 128
Qualifying Revolving 2 2 9 3 18 219 222 240 210
Other Retail 15 4 16 3 157 144 175 149
Equity 1 - 1 - 2 -
Tota l 5 3 6 7 0 0 5 7 0 5 0 5 6 8 7 5 4 1
2 0 19 2018 2017
Expected Loss is calculated in accordance with Article 158 in Part Three, Title II, Chapter 3 of the CRR and represents the modelled position at
the start of the financial year. Cumulative actual loss is not a prescribed accounting measure but has been calibrated to provide a useful
comparison to regulatory EL, taking into account the methodological differences described on page 35. Cumulative actual loss is comprised of
two parts; the opening accounting provision balance at the start of the period3, plus the specific impairment charges for the period, net of any
recoveries.
The table shows that the cumulative actual loss is higher than the modelled expected loss, following the implementation of the IFRS 9
accounting standard on 5 April 2018. The primary reason that the cumulative actual loss is now higher than the regulatory expected loss is
because IFRS 9 requires an assessment of loss over the lifetime all assets where credit risk has increased (stage 2). Regulatory expected loss
is calculated over a 12-month horizon, albeit based on a downturn assessment.
3 Note: the opening provision balance is taken at 5 April 2018, to ensure the IFRS 9 balance is incorporated into the cumulative actual loss figure.
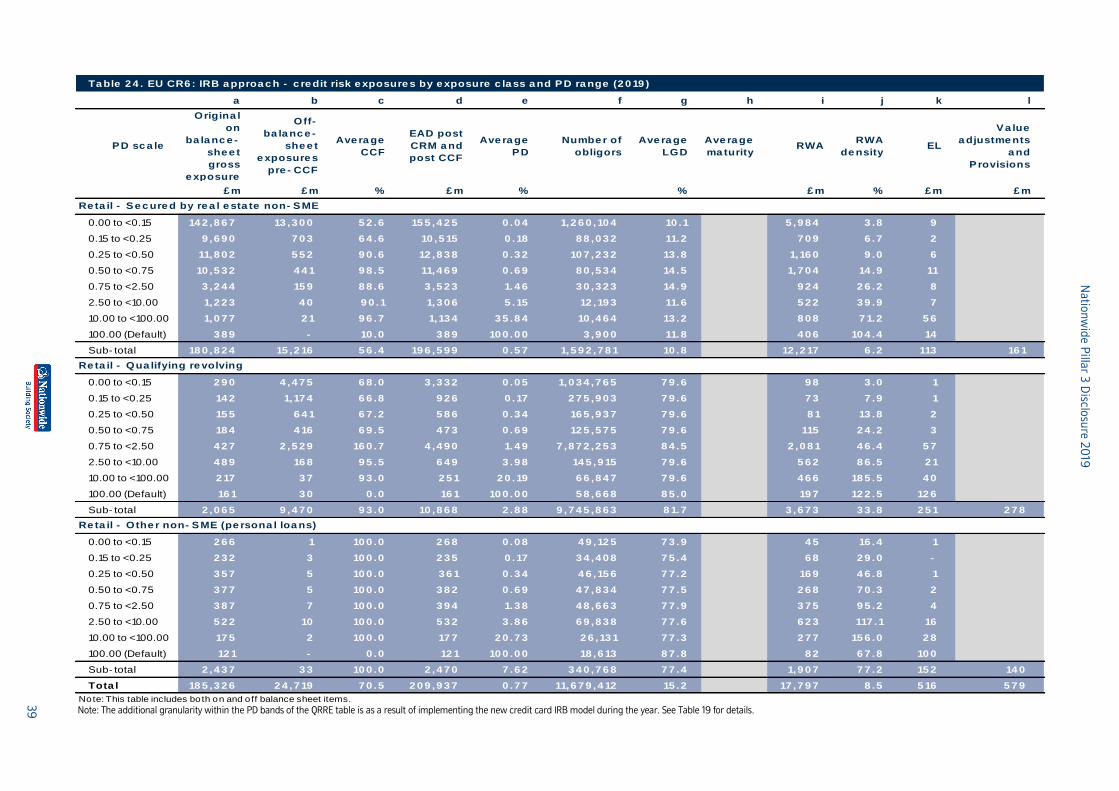
Na
tion
wid
e P
illar 3
Disclo
sure
20
19
39
Ta ble 2 4 . EU CR6 : IRB a pproa c h - c re dit risk e xposure s by e xposure c la ss a nd PD ra nge (2 0 19 )
a b c d e f g h i j k l
PD sc a le
Origina l
on
ba la nc e -
she e t
gross
e xposure
Off-
ba la nc e -
she e t
e xposure s
pre - CCF
Ave ra ge
CCF
EAD post
CRM a nd
post CCF
Ave ra ge
PD
Numbe r of
obligors
Ave ra ge
LGD
Ave ra ge
ma turityRWA
RWA
de nsityEL
Va lue
a djustme nts
a nd
Provisions
£ m £ m % £ m % % £ m % £ m £ m
0.00 to <0.15 14 2 ,8 6 7 13 ,3 0 0 5 2 .6 15 5 ,4 2 5 0 .0 4 1,2 6 0 ,10 4 10 .1 5 ,9 8 4 3 .8 9
0.15 to <0.25 9 ,6 9 0 7 0 3 6 4 .6 10 ,5 15 0 .18 8 8 ,0 3 2 11.2 7 0 9 6 .7 2
0.25 to <0.50 11,8 0 2 5 5 2 9 0 .6 12 ,8 3 8 0 .3 2 10 7 ,2 3 2 13 .8 1,16 0 9 .0 6
0.50 to <0.75 10 ,5 3 2 4 4 1 9 8 .5 11,4 6 9 0 .6 9 8 0 ,5 3 4 14 .5 1,7 0 4 14 .9 11
0.75 to <2.50 3 ,2 4 4 15 9 8 8 .6 3 ,5 2 3 1.4 6 3 0 ,3 2 3 14 .9 9 2 4 2 6 .2 8
2.50 to <10.00 1,2 2 3 4 0 9 0 .1 1,3 0 6 5 .15 12 ,19 3 11.6 5 2 2 3 9 .9 7
10.00 to <100.00 1,0 7 7 2 1 9 6 .7 1,13 4 3 5 .8 4 10 ,4 6 4 13 .2 8 0 8 7 1.2 5 6
100.00 (Default) 3 8 9 - 10 .0 3 8 9 10 0 .0 0 3 ,9 0 0 11.8 4 0 6 10 4 .4 14
Sub- total 18 0 ,8 2 4 15 ,2 16 5 6 .4 19 6 ,5 9 9 0 .5 7 1,5 9 2 ,7 8 1 10 .8 12 ,2 17 6 .2 113 16 1
0.00 to <0.15 2 9 0 4 ,4 7 5 6 8 .0 3 ,3 3 2 0 .0 5 1,0 3 4 ,7 6 5 7 9 .6 9 8 3 .0 1
0.15 to <0.25 14 2 1,17 4 6 6 .8 9 2 6 0 .17 2 7 5 ,9 0 3 7 9 .6 7 3 7 .9 1
0.25 to <0.50 15 5 6 4 1 6 7 .2 5 8 6 0 .3 4 16 5 ,9 3 7 7 9 .6 8 1 13 .8 2
0.50 to <0.75 18 4 4 16 6 9 .5 4 7 3 0 .6 9 12 5 ,5 7 5 7 9 .6 115 2 4 .2 3
0.75 to <2.50 4 2 7 2 ,5 2 9 16 0 .7 4 ,4 9 0 1.4 9 7 ,8 7 2 ,2 5 3 8 4 .5 2 ,0 8 1 4 6 .4 5 7
2.50 to <10.00 4 8 9 16 8 9 5 .5 6 4 9 3 .9 8 14 5 ,9 15 7 9 .6 5 6 2 8 6 .5 2 1
10.00 to <100.00 2 17 3 7 9 3 .0 2 5 1 2 0 .19 6 6 ,8 4 7 7 9 .6 4 6 6 18 5 .5 4 0
100.00 (Default) 16 1 3 0 0 .0 16 1 10 0 .0 0 5 8 ,6 6 8 8 5 .0 19 7 12 2 .5 12 6
Sub- total 2 ,0 6 5 9 ,4 7 0 9 3 .0 10 ,8 6 8 2 .8 8 9 ,7 4 5 ,8 6 3 8 1.7 3 ,6 7 3 3 3 .8 2 5 1 2 7 8
0.00 to <0.15 2 6 6 1 10 0 .0 2 6 8 0 .0 8 4 9 ,12 5 7 3 .9 4 5 16 .4 1
0.15 to <0.25 2 3 2 3 10 0 .0 2 3 5 0 .17 3 4 ,4 0 8 7 5 .4 6 8 2 9 .0 -
0.25 to <0.50 3 5 7 5 10 0 .0 3 6 1 0 .3 4 4 6 ,15 6 7 7 .2 16 9 4 6 .8 1
0.50 to <0.75 3 7 7 5 10 0 .0 3 8 2 0 .6 9 4 7 ,8 3 4 7 7 .5 2 6 8 7 0 .3 2
0.75 to <2.50 3 8 7 7 10 0 .0 3 9 4 1.3 8 4 8 ,6 6 3 7 7 .9 3 7 5 9 5 .2 4
2.50 to <10.00 5 2 2 10 10 0 .0 5 3 2 3 .8 6 6 9 ,8 3 8 7 7 .6 6 2 3 117 .1 16
10.00 to <100.00 17 5 2 10 0 .0 17 7 2 0 .7 3 2 6 ,13 1 7 7 .3 2 7 7 15 6 .0 2 8
100.00 (Default) 12 1 - 0 .0 12 1 10 0 .0 0 18 ,6 13 8 7 .8 8 2 6 7 .8 10 0
Sub- total 2 ,4 3 7 3 3 10 0 .0 2 ,4 7 0 7 .6 2 3 4 0 ,7 6 8 7 7 .4 1,9 0 7 7 7 .2 15 2 14 0
Tota l 18 5 ,3 2 6 2 4 ,7 19 7 0 .5 2 0 9 ,9 3 7 0 .7 7 11,6 7 9 ,4 12 15 .2 17 ,7 9 7 8 .5 5 16 5 7 9
Re ta il - Se c ure d by re a l e sta te non- SME
Re ta il - Othe r non- SME (pe rsona l loa ns)
Re ta il - Qua lifying re volving
Note: This table includes both on and off balance sheet items. Note: The additional granularity within the PD bands of the QRRE table is as a result of implementing the new credit card IRB model during the year. See Table 19 for details.
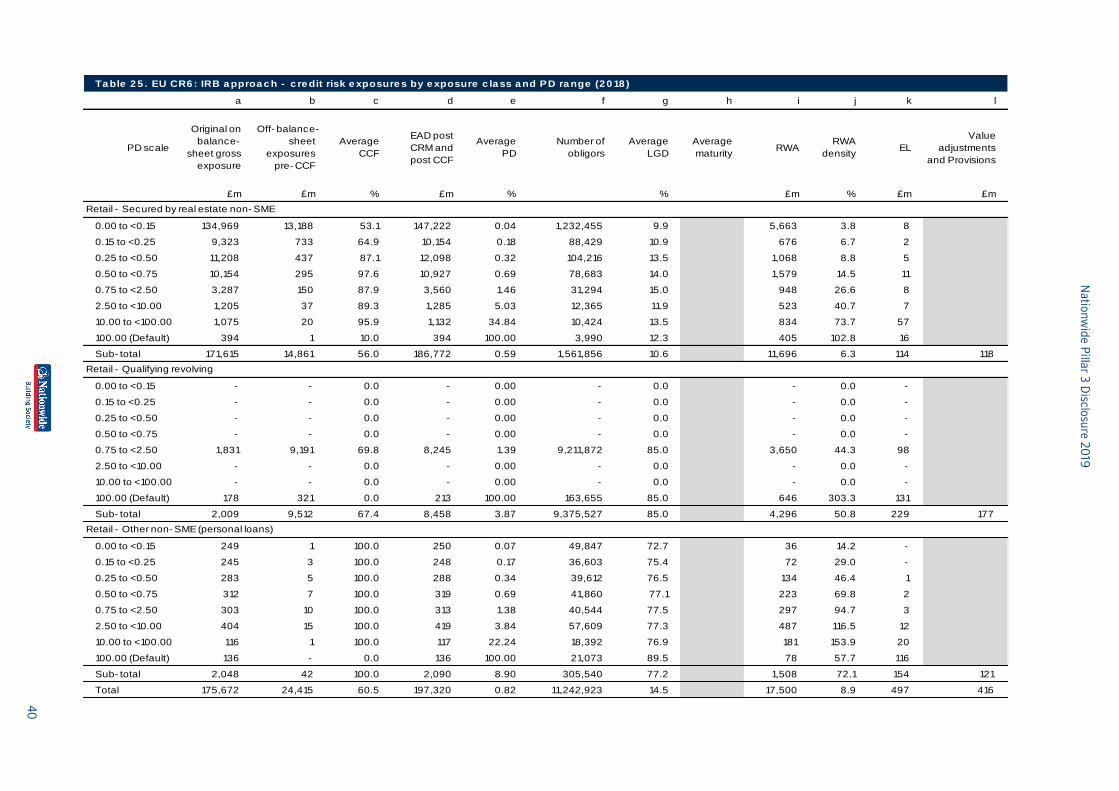
Na
tion
wid
e P
illar 3
Disclo
sure
20
19
40
Ta ble 2 5 . EU CR6 : IRB a pproa c h - c re dit risk e xposure s by e xposure c la ss a nd PD ra nge (2 0 18 )
a b c d e f g h i j k l
PD scale
Original on
balance-
sheet gross
exposure
Off- balance-
sheet
exposures
pre- CCF
Average
CCF
EAD post
CRM and
post CCF
Average
PD
Number of
obligors
Average
LGD
Average
maturityRWA
RWA
densityEL
Value
adjustments
and Provisions
£m £m % £m % % £m % £m £m
0.00 to <0.15 134,969 13,188 53.1 147,222 0.04 1,232,455 9.9 5,663 3.8 8
0.15 to <0.25 9,323 733 64.9 10,154 0.18 88,429 10.9 676 6.7 2
0.25 to <0.50 11,208 437 87.1 12,098 0.32 104,216 13.5 1,068 8.8 5
0.50 to <0.75 10,154 295 97.6 10,927 0.69 78,683 14.0 1,579 14.5 11
0.75 to <2.50 3,287 150 87.9 3,560 1.46 31,294 15.0 948 26.6 8
2.50 to <10.00 1,205 37 89.3 1,285 5.03 12,365 11.9 523 40.7 7
10.00 to <100.00 1,075 20 95.9 1,132 34.84 10,424 13.5 834 73.7 57
100.00 (Default) 394 1 10.0 394 100.00 3,990 12.3 405 102.8 16
Sub- total 171,615 14,861 56.0 186,772 0.59 1,561,856 10.6 11,696 6.3 114 118
0.00 to <0.15 - - 0.0 - 0.00 - 0.0 - 0.0 -
0.15 to <0.25 - - 0.0 - 0.00 - 0.0 - 0.0 -
0.25 to <0.50 - - 0.0 - 0.00 - 0.0 - 0.0 -
0.50 to <0.75 - - 0.0 - 0.00 - 0.0 - 0.0 -
0.75 to <2.50 1,831 9,191 69.8 8,245 1.39 9,211,872 85.0 3,650 44.3 98
2.50 to <10.00 - - 0.0 - 0.00 - 0.0 - 0.0 -
10.00 to <100.00 - - 0.0 - 0.00 - 0.0 - 0.0 -
100.00 (Default) 178 321 0.0 213 100.00 163,655 85.0 646 303.3 131
Sub- total 2,009 9,512 67.4 8,458 3.87 9,375,527 85.0 4,296 50.8 229 177
0.00 to <0.15 249 1 100.0 250 0.07 49,847 72.7 36 14.2 -
0.15 to <0.25 245 3 100.0 248 0.17 36,603 75.4 72 29.0 -
0.25 to <0.50 283 5 100.0 288 0.34 39,612 76.5 134 46.4 1
0.50 to <0.75 312 7 100.0 319 0.69 41,860 77.1 223 69.8 2
0.75 to <2.50 303 10 100.0 313 1.38 40,544 77.5 297 94.7 3
2.50 to <10.00 404 15 100.0 419 3.84 57,609 77.3 487 116.5 12
10.00 to <100.00 116 1 100.0 117 22.24 18,392 76.9 181 153.9 20
100.00 (Default) 136 - 0.0 136 100.00 21,073 89.5 78 57.7 116
Sub- total 2,048 42 100.0 2,090 8.90 305,540 77.2 1,508 72.1 154 121
Total 175,672 24,415 60.5 197,320 0.82 11,242,923 14.5 17,500 8.9 497 416
Retail - Secured by real estate non- SME
Retail - Qualifying revolving
Retail - Other non- SME (personal loans)
Nationwide Pillar 3 Disclosure 2019
41
6.5 Retail credit risk
Management of retail credit risks
Retail credit risks are managed in accordance with limits set out within the Board risk appetite and Secured and Unsecured Credit Risk
Strategies. Detailed policies exist which set out lending criteria and circumstances where expert underwriting may be needed.
The residential and buy-to-let portfolios have their own credit scoring models, policy and underwriting rules to make decisions on applications
for credit and to manage accounts. The principal factors considered in the residential decision are affordability, credit score, nature of income
and LTV, with the principal factors considered in the buy-to-let decision being rental cover, credit score and LTV. In addition, confirmation of
borrower identity is obtained, and an assessment of the value and suitability of the security being taken as collateral is carried out prior to
granting a credit facility.
Each of the unsecured portfolios has its own credit scoring models (including behavioural scoring), policy and underwriting rules to make
decisions on applications for credit and to manage accounts. Credit scoring is used to support the customer account management process in
the following ways: to set maximum lending limits, to segment authorisation decisions and to prioritise collections activity. Nationwide has
continued to develop its member only propositions on credit cards and personal loans to support the deepening of member relationships.
Ongoing monitoring of all retail credit portfolios is undertaken by the Secured and Unsecured Credit Risk functions. Reports are sent to the
Credit Committee on a monthly basis.
Nationwide fully supports the current regulatory focus on vulnerable customers, particularly surrounding persistent debt. The credit policies
and provisioning treatment relating to these activities have been reviewed over the year ended 4 April 2019 to ensure alignment to best
practice.
To support customers in financial difficulty Nationwide offers forbearance options to secured and unsecured borrowers.
More detail on forbearance can be found in the Annual Report and Accounts 2019.
Credit risk concentration
Concentration risk is defined as the risk arising from insufficient diversification, resulting in a single exposure or group of correlated exposures
with the potential to generate severe losses for Nationwide.
All lending books are stress tested quarterly. This may result in a new concentration being identified that is susceptible to a particular form of
stressed scenario.
Credit risk concentration can arise in two forms:
Systemic risk – is the effect of changes in macro-economic and financial conditions on borrower performance. This is measured through the
quarterly stress testing process described above that measures the ECLs of the portfolio in a stressed scenario.
Idiosyncratic risk – is that which affects individual borrowers, which can be reduced through portfolio diversification. The measurement of this
varies depending on the characteristics of the group of borrowers, each specific risk and its scale can change through time.
Board risk appetite and the Credit Risk Strategies detail the metrics we use to report on concentration risk. The intrinsic protection against
more specific local risks such as industry closures or reduced demand is in the diversification of the portfolio across areas and regions
throughout the UK.
Credit risk mitigation
The principal factors outlined in section 6.5.1 are the key controls in mitigating credit risk, with the residential property the main source of
collateral. All mortgage lending activities are supported by an appropriate form of valuation using in-house valuers, an independent firm of
valuers or by an Automated Valuation Model subject to business rules and confidence levels. When experiencing financial difficulty customers
will receive help and support from Collections & Recoveries to manage their debt.
6.6 Commercial credit risk
Overview
Commercial credit risk is defined as the risk that a commercial borrower fails to pay the interest or to repay the principal on a loan, on time.
The commercial portfolio comprises loans which have been provided to meet the funding requirements of RSL, commercial real estate (CRE)
investors and project finance initiatives. Whilst the project finance and commercial real estate portfolios are closed to new business, the
registered social landlord portfolio was re-opened in September 2018.
The strategy for the commercial lending portfolio continues to be to hold and actively manage to maturity in line with contractual terms. The
portfolio is closely monitored and Nationwide’s risk appetite is managed and reported on a monthly basis through a suite of metrics which
have been developed to monitor portfolio performance, as well as limit exposure to high risk segments.
Nationwide Pillar 3 Disclosure 2019
42
All commercial lending decisions are subject to an expert underwriting process, supplemented by a risk rating process which has been
developed to enhance portfolio risk management capabilities and support capital and risk-based pricing models. Risk ratings are reviewed
annually, or more frequently in the event of material change.
All commercial lending relationships are subject to at least an annual review to ensure that the facilities are performing in accordance with the
terms of the original sanction. This provides an opportunity to review the exposure to each counterparty in the light of the most recently
available financial and non-financial information and to refresh risk grading data.
Monitoring of asset quality in the commercial portfolio is based upon a number of measures including rating grade migration, risk
concentrations, market changes and financial covenant monitoring. Reports relating to the profile of the commercial lending portfolio are sent
to the risk committees on a monthly basis.
The commercial lending portfolio adopted a foundation IRB approach in July 2012 for the following sub-portfolios:
• IPRE
• Social Housing
• Project Finance
The IPRE and project finance portfolios adopt the supervisory slotting approach which has been specifically designed for portfolios where PD
estimates do not meet the minimum IRB standards. Under this approach, a number of prescribed factors (financial strength, asset
characteristics, strength of sponsor, security package, transaction structure and political/legal environment) are weighted to produce an overall
model score which is then mapped to one of four supervisory risk grades – Strong, Good, Satisfactory and Weak – with a separate grade for
defaulted borrowers.
The Social Housing portfolio is measured on a foundation IRB basis, where Nationwide estimates the PD of obligors. PD estimates are based
on an expert judgment scorecard to rank order borrowers to one of 21 performance grades. The model contains a range of drivers including
the size of the borrower, strength of management/board, viability ratings and financial ratios based on annual accounts.
Given the lack of default history on the Social Housing portfolio, the model qualifies for treatment as a Low Default Portfol io (LDP) and the PDs
are based on a regulatory prescribed approach designed to produce appropriately conservative PDs. The Basel floor of 0.03% is applied to the
PD scale used for the Housing Portfolio. The CCF and LGD estimates are based on regulatory parameters provided under the foundation IRB
approach and adjusted for CRM benefits.
All three commercial models are subject to a monitoring process to ensure they continue to provide appropriately prudent risk estimates and
that they remain fit for purpose. Over the last 12 months all the models have performed in line with expectations and predetermined standards.
The remainder of the portfolio (see below) is noted as permanent exemptions and measured under the SA for capital purposes. This includes:
• Owner occupied business premises;
• Unsecured/Other; and
• Lease receivables
Table 26 highlights the year end position for the RSL portfolio with the closing position for the previous year outlined in Table 27. The rating
composition and size of the portfolio is broadly stable on a year on year basis.
Tables 28 and 29 describe the IPRE and Project Finance portfolios that utilise the supervisory slotting approach. The tables show that total
exposure has fallen and the average slotting grade and risk weight have improved, reflecting an improvement in credit quality overall, offset
somewhat by a marginal increase in defaulted exposures to £76 million (2018: £25 million). The average risk weight has fallen from 79.1% in
2018 to 73.2% in 2019.
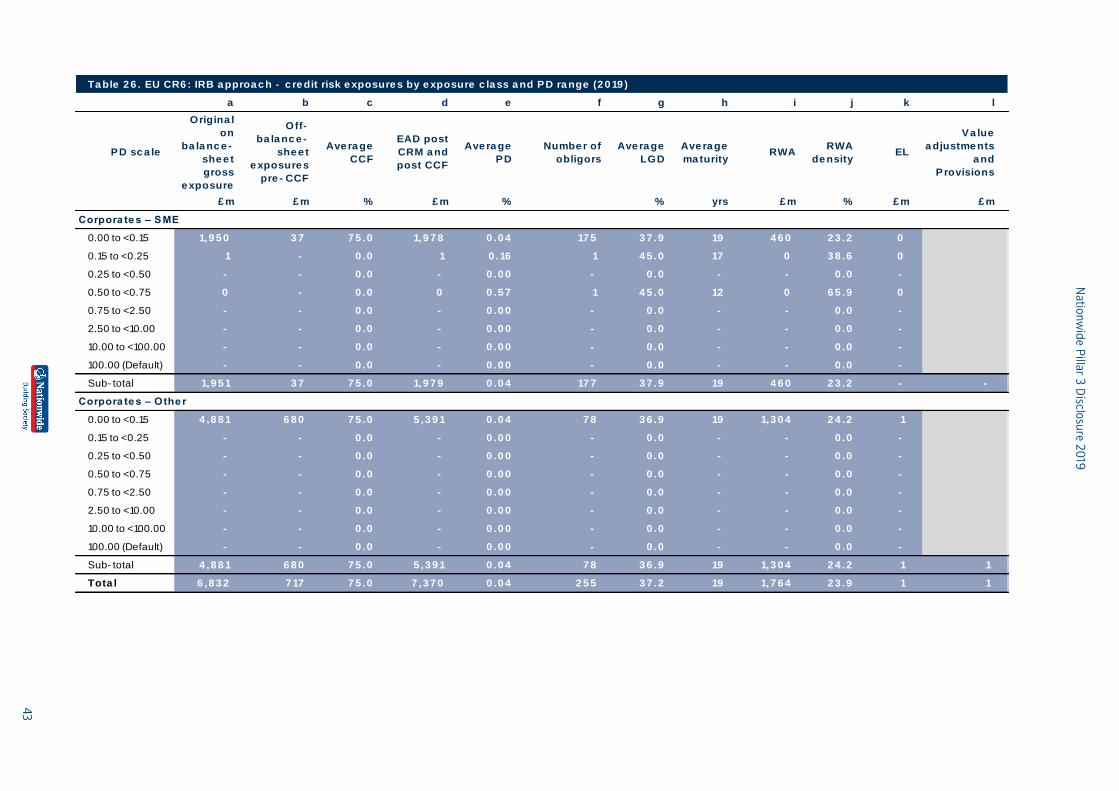
Na
tion
wid
e P
illar 3
Disclo
sure
20
19
43
Ta ble 2 6 . EU CR6 : IRB a pproa c h - c re dit risk e xposure s by e xposure c la ss a nd PD ra nge (2 0 19 )
a b c d e f g h i j k l
PD sc a le
Origina l
on
ba la nc e -
she e t
gross
e xposure
Off-
ba la nc e -
she e t
e xposure s
pre - CCF
Ave ra ge
CCF
EAD post
CRM a nd
post CCF
Ave ra ge
PD
Numbe r of
obligors
Ave ra ge
LGD
Ave ra ge
ma turityRWA
RWA
de nsityEL
Va lue
a djustme nts
a nd
Provisions
£ m £ m % £ m % % yrs £ m % £ m £ m
0.00 to <0.15 1,9 5 0 3 7 7 5 .0 1,9 7 8 0 .0 4 17 5 3 7 .9 19 4 6 0 2 3 .2 0
0.15 to <0.25 1 - 0 .0 1 0 .16 1 4 5 .0 17 0 3 8 .6 0
0.25 to <0.50 - - 0 .0 - 0 .0 0 - 0 .0 - - 0 .0 -
0.50 to <0.75 0 - 0 .0 0 0 .5 7 1 4 5 .0 12 0 6 5 .9 0
0.75 to <2.50 - - 0 .0 - 0 .0 0 - 0 .0 - - 0 .0 -
2.50 to <10.00 - - 0 .0 - 0 .0 0 - 0 .0 - - 0 .0 -
10.00 to <100.00 - - 0 .0 - 0 .0 0 - 0 .0 - - 0 .0 -
100.00 (Default) - - 0 .0 - 0 .0 0 - 0 .0 - - 0 .0 -
Sub- total 1,9 5 1 3 7 7 5 .0 1,9 7 9 0 .0 4 17 7 3 7 .9 19 4 6 0 2 3 .2 - -
0.00 to <0.15 4 ,8 8 1 6 8 0 7 5 .0 5 ,3 9 1 0 .0 4 7 8 3 6 .9 19 1,3 0 4 2 4 .2 1
0.15 to <0.25 - - 0 .0 - 0 .0 0 - 0 .0 - - 0 .0 -
0.25 to <0.50 - - 0 .0 - 0 .0 0 - 0 .0 - - 0 .0 -
0.50 to <0.75 - - 0 .0 - 0 .0 0 - 0 .0 - - 0 .0 -
0.75 to <2.50 - - 0 .0 - 0 .0 0 - 0 .0 - - 0 .0 -
2.50 to <10.00 - - 0 .0 - 0 .0 0 - 0 .0 - - 0 .0 -
10.00 to <100.00 - - 0 .0 - 0 .0 0 - 0 .0 - - 0 .0 -
100.00 (Default) - - 0 .0 - 0 .0 0 - 0 .0 - - 0 .0 -
Sub- total 4 ,8 8 1 6 8 0 7 5 .0 5 ,3 9 1 0 .0 4 7 8 3 6 .9 19 1,3 0 4 2 4 .2 1 1
Tota l 6 ,8 3 2 7 17 7 5 .0 7 ,3 7 0 0 .0 4 2 5 5 3 7 .2 19 1,7 6 4 2 3 .9 1 1
Corpora te s – SME
Corpora te s – Othe r
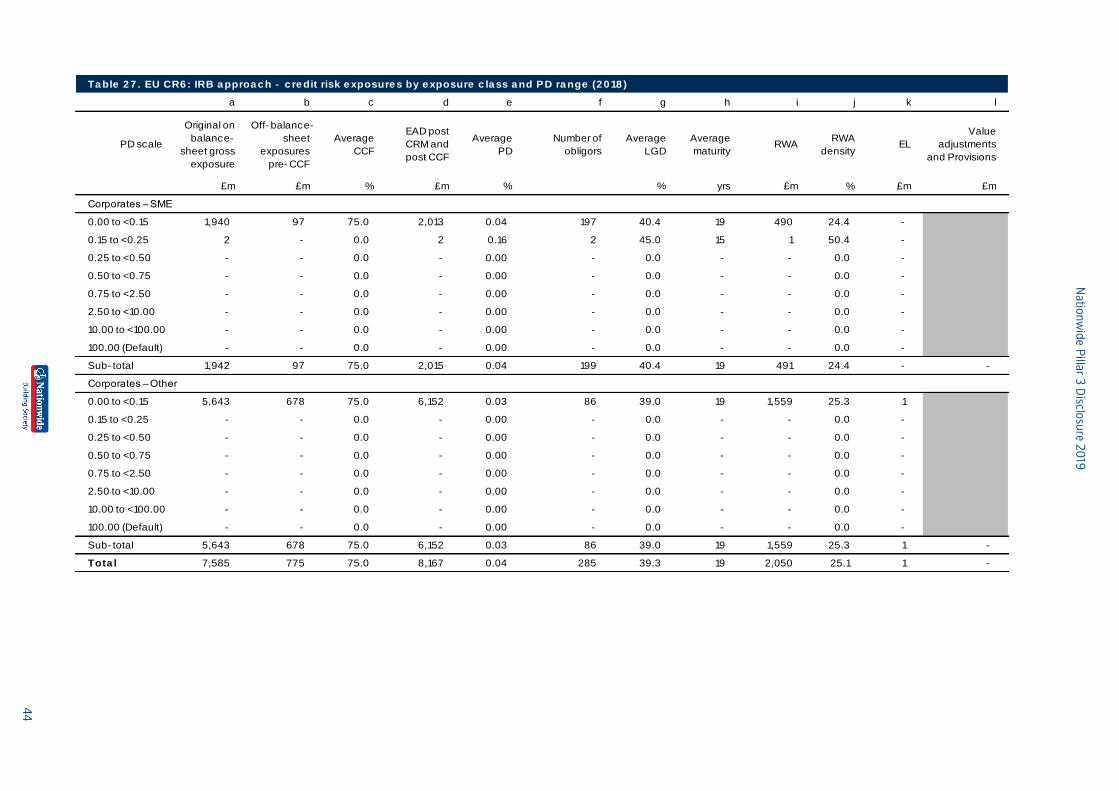
Na
tion
wid
e P
illar 3
Disclo
sure
20
19
44
Ta ble 2 7 . EU CR6 : IRB a pproa c h - c re dit risk e xposure s by e xposure c la ss a nd PD ra nge (2 0 18 )
a b c d e f g h i j k l
PD scale
Original on
balance-
sheet gross
exposure
Off- balance-
sheet
exposures
pre- CCF
Average
CCF
EAD post
CRM and
post CCF
Average
PD
Number of
obligors
Average
LGD
Average
maturityRWA
RWA
densityEL
Value
adjustments
and Provisions
£m £m % £m % % yrs £m % £m £m
0.00 to <0.15 1,940 97 75.0 2,013 0.04 197 40.4 19 490 24.4 -
0.15 to <0.25 2 - 0.0 2 0.16 2 45.0 15 1 50.4 -
0.25 to <0.50 - - 0.0 - 0.00 - 0.0 - - 0.0 -
0.50 to <0.75 - - 0.0 - 0.00 - 0.0 - - 0.0 -
0.75 to <2.50 - - 0.0 - 0.00 - 0.0 - - 0.0 -
2.50 to <10.00 - - 0.0 - 0.00 - 0.0 - - 0.0 -
10.00 to <100.00 - - 0.0 - 0.00 - 0.0 - - 0.0 -
100.00 (Default) - - 0.0 - 0.00 - 0.0 - - 0.0 -
Sub- total 1,942 97 75.0 2,015 0.04 199 40.4 19 491 24.4 - -
0.00 to <0.15 5,643 678 75.0 6,152 0.03 86 39.0 19 1,559 25.3 1
0.15 to <0.25 - - 0.0 - 0.00 - 0.0 - - 0.0 -
0.25 to <0.50 - - 0.0 - 0.00 - 0.0 - - 0.0 -
0.50 to <0.75 - - 0.0 - 0.00 - 0.0 - - 0.0 -
0.75 to <2.50 - - 0.0 - 0.00 - 0.0 - - 0.0 -
2.50 to <10.00 - - 0.0 - 0.00 - 0.0 - - 0.0 -
10.00 to <100.00 - - 0.0 - 0.00 - 0.0 - - 0.0 -
100.00 (Default) - - 0.0 - 0.00 - 0.0 - - 0.0 -
Sub- total 5,643 678 75.0 6,152 0.03 86 39.0 19 1,559 25.3 1 -
Tota l 7,585 775 75.0 8,167 0.04 285 39.3 19 2,050 25.1 1 -
Corporates – SME
Corporates – Other
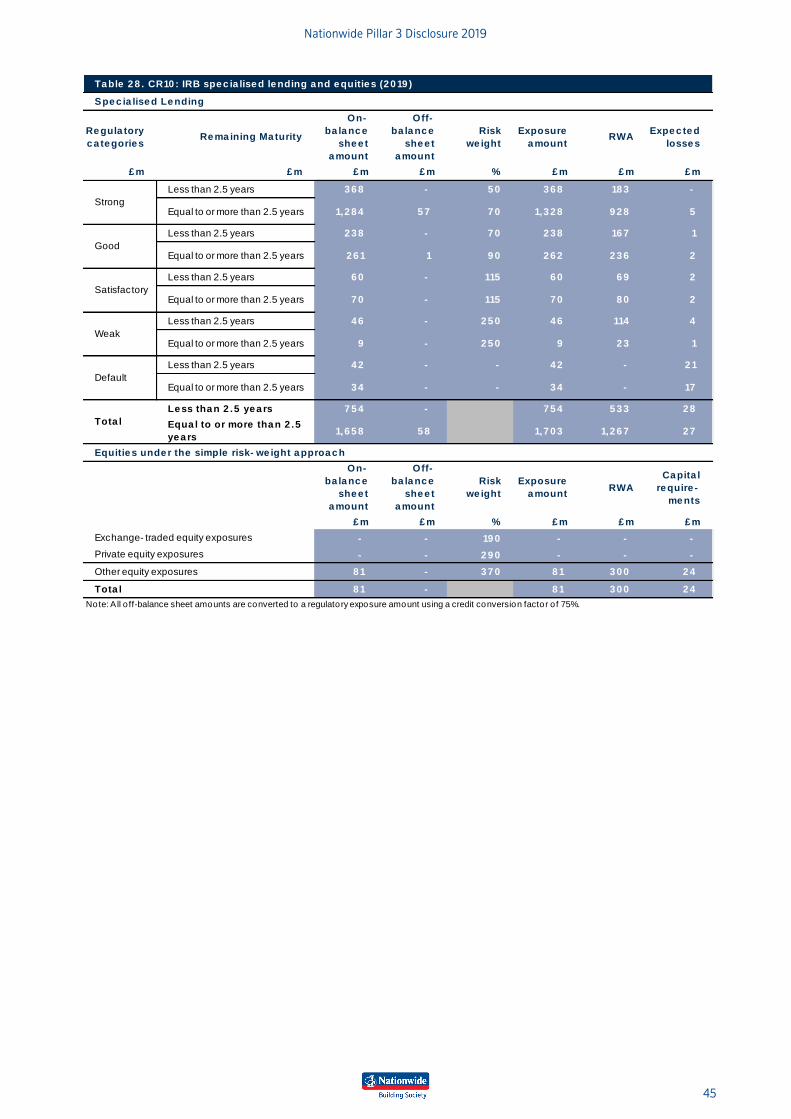
Nationwide Pillar 3 Disclosure 2019
45
Ta ble 2 8 . CR10 : IRB spe c ia lise d le nding a nd e quitie s (2 0 19 )
Re gula tory
c a te gorie sRe ma ining Ma turity
On-
ba la nc e
she e t
a mount
Off-
ba la nc e
she e t
a mount
Risk
we ight
Exposure
a mountRWA
Expe c te d
losse s
£ m £ m £ m £ m % £ m £ m £ m
Less than 2.5 years 3 6 8 - 5 0 3 6 8 18 3 -
Equal to or more than 2.5 years 1,2 8 4 5 7 7 0 1,3 2 8 9 2 8 5
Less than 2.5 years 2 3 8 - 7 0 2 3 8 16 7 1
Equal to or more than 2.5 years 2 6 1 1 9 0 2 6 2 2 3 6 2
Less than 2.5 years 6 0 - 115 6 0 6 9 2
Equal to or more than 2.5 years 7 0 - 115 7 0 8 0 2
Less than 2.5 years 4 6 - 2 5 0 4 6 114 4
Equal to or more than 2.5 years 9 - 2 5 0 9 2 3 1
Less than 2.5 years 4 2 - - 4 2 - 2 1
Equal to or more than 2.5 years 3 4 - - 3 4 - 17
Le ss tha n 2 .5 ye a rs 7 5 4 - 7 5 4 5 3 3 2 8
Equa l to or more tha n 2 .5
ye a rs1,6 5 8 5 8 1,7 0 3 1,2 6 7 2 7
On-
ba la nc e
she e t
a mount
Off-
ba la nc e
she e t
a mount
Risk
we ight
Exposure
a mountRWA
Ca pita l
re quire -
me nts
£ m £ m % £ m £ m £ m
- - 19 0 - - -
- - 2 9 0 - - -
8 1 - 3 7 0 8 1 3 0 0 2 4
8 1 - 8 1 3 0 0 2 4
Note: A ll o ff-balance sheet amounts are converted to a regulatory exposure amount using a credit conversion factor o f 75%.
Private equity exposures
Other equity exposures
Tota l
Satisfactory
Weak
Default
Tota l
Spe c ia lise d Le nding
Equitie s unde r the simple risk- we ight a pproa c h
Strong
Good
Exchange- traded equity exposures
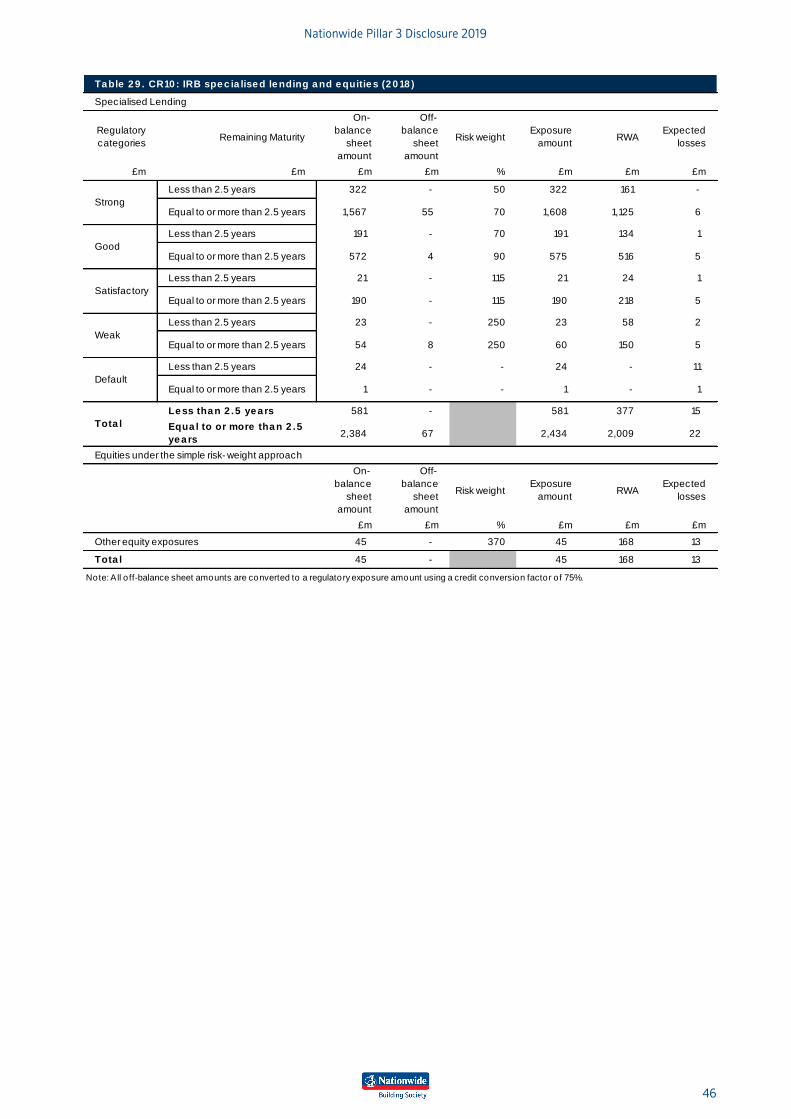
Nationwide Pillar 3 Disclosure 2019
46
Ta ble 2 9 . CR10 : IRB spe c ia lise d le nding a nd e quitie s (2 0 18 )
Regulatory
categoriesRemaining Maturity
On-
balance
sheet
amount
Off-
balance
sheet
amount
Risk weightExposure
amountRWA
Expected
losses
£m £m £m £m % £m £m £m
Less than 2.5 years 322 - 50 322 161 -
Equal to or more than 2.5 years 1,567 55 70 1,608 1,125 6
Less than 2.5 years 191 - 70 191 134 1
Equal to or more than 2.5 years 572 4 90 575 516 5
Less than 2.5 years 21 - 115 21 24 1
Equal to or more than 2.5 years 190 - 115 190 218 5
Less than 2.5 years 23 - 250 23 58 2
Equal to or more than 2.5 years 54 8 250 60 150 5
Less than 2.5 years 24 - - 24 - 11
Equal to or more than 2.5 years 1 - - 1 - 1
Le ss tha n 2 .5 ye a rs 581 - 581 377 15
Equa l to or more tha n 2 .5
ye a rs2,384 67 2,434 2,009 22
On-
balance
sheet
amount
Off-
balance
sheet
amount
Risk weightExposure
amountRWA
Expected
losses
£m £m % £m £m £m
45 - 370 45 168 13
45 - 45 168 13
Note: All o ff-balance sheet amounts are converted to a regulatory exposure amount using a credit conversion factor of 75%.
Tota l
Specialised Lending
Strong
Good
Satisfactory
Weak
Default
Tota l
Equities under the simple risk- weight approach
Other equity exposures
Nationwide Pillar 3 Disclosure 2019
47
Credit risk concentration
The geographic concentration to London by balances has decreased to 57% (2018 68%). Further information can be found in Credit Risk –
Commercial and other lending section within the Annual Accounts and Reports 2019.
Credit risk mitigation
Nationwide utilises collateral as a form of CRM, for determining the regulatory capital requirement on social housing assets.
A first fixed charge over residential real estate is the main source of collateral and means of mitigating credit risk inherent in the RSL portfolio.
Assets are valued by an independent external panel of specialist Royal Institution of Chartered Surveyors valuers, using standard valuation
bases for the social housing sector. Throughout the life of the loan, updated valuations are obtained in accordance with the loan agreement
for each facility, or at Nationwide’s request, where a breach of asset cover may have occurred. Eligible collateral is factored into the LGD
calculation for regulatory capital purposes.
Assessing ongoing compliance with asset cover is an intrinsic part of the regular monitoring of a facility and is tested at specific events including
annual review, drawdown, property releases and charging of additional security. Any facility that is subject to an actual or forecast breach of
asset cover is immediately placed on a watchlist, and negotiations will be undertaken with the borrower to remedy the situation.
Legal documentation, aligned to market standards, is prepared by a specialist panel of legal advisers and a legal opinion is obtained confirming
the agreements are properly executed, legally valid and enforceable. Loan documentation requires borrowers to maintain adequate insurance
throughout the life of the loan.
The exposure a borrower has to interest rate risk is considered, as part of the credit risk assessment, throughout the life of the loan.
6.7 Treasury credit risk
Introduction
Credit risk within the Treasury function arises primarily from the instruments held for operational, liquidity, and investment purposes.
The Treasury Credit Risk (TCR) function manages all aspects of credit risk in accordance with Nationwide’s risk governance framework, under
the supervision of the Credit Committee. It also sets and monitors compliance with policy and limits. Credit Quality Assurance reviews are
undertaken quarterly by a separate risk team with independent oversight and challenge provided by the Compliance and Prudential Risk
function.
In line with the Board’s risk appetite, investment activity is restricted to high quality liquid securities, held primarily for liquidity management:
an annual credit risk strategy is approved by Credit Committee to approve ongoing investment and portfolio management activity. New
investment remains limited to a small number of established asset classes with proven credit performance, predominantly at senior AAA levels.
No exposure to re-securitisations is held.
A monthly review is undertaken of the current and expected future performance of all treasury assets that incorporates underlying collateral
pool performance (arrears, loss, portfolio composition, etc.). An established governance structure identifies and reviews under-performing
assets and assesses the likelihood of future losses. In addition, emerging, and increasing risks are escalated to risk committees for review and
approval of action plans where appropriate.
Review frequencies will be greater for those counterparties perceived to be higher risk or where a significant material change has been seen
that may impact their credit rating. Assets are impaired where there is objective evidence that current events or performance will resu lt in a
loss. There are no watchlist exposures across the Treasury portfolios and no impaired assets.
Nationwide uses Standard and Poor’s (S&P), Moody's and Fitch as ECAIs for Treasury credit risk exposures. The credit assessments and reviews
provided by ECAIs are one of several considerations that form part of the credit assessment process, supported by comprehensive and market
standard procedures and controls.
As part of Nationwide’s risk management, derivatives are used to reduce exposure to market risks that have the potential to create counterparty
credit risk. These instruments are only transacted with highly-rated Financial Institution (FI) counterparties and are collateralised under market
standard documentation.
Limit approvals and investment decisions are subject to a manual, qualitative underwriting process which is supplemented by cash-flow
modelling (via the independent market standard modelling tool, Intex) or from the outputs of an IRB approved financial strength rating model
for FI counterparties. Additional modelling is undertaken with Moody’s Analytics used to support stress testing activity and to enhance TCR
modelling capability.
An IRB model is used to determine PDs for Treasury’s FI exposures. The model consists of two key elements, a statistically dr iven quantitative
financial strength rating and a qualitative overlay. Under the Foundation IRB approach, regulatory parameters are used for LGD and CCF
applicable to commitments. An application has been submitted to the PRA for approval to use an enhanced version of this model, underpinned
by a model application provided by Moody’s (RiskCalcBank).
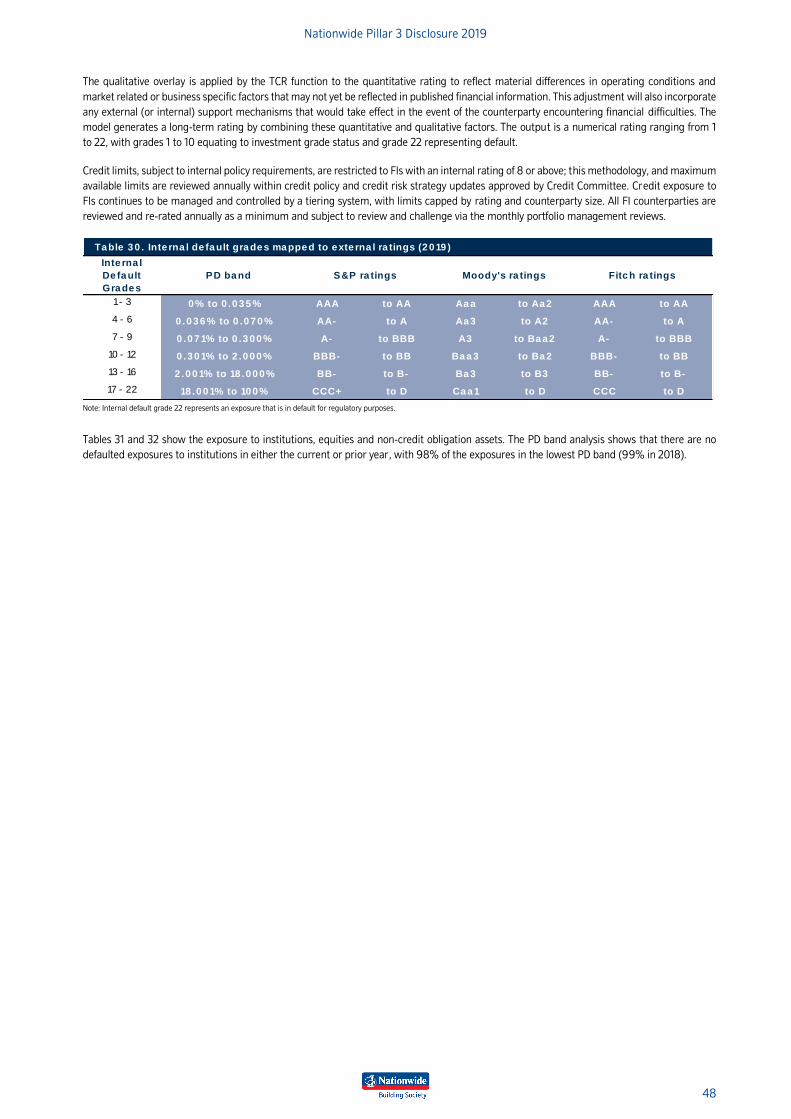
Nationwide Pillar 3 Disclosure 2019
48
The qualitative overlay is applied by the TCR function to the quantitative rating to reflect material differences in operating conditions and
market related or business specific factors that may not yet be reflected in published financial information. This adjustment will also incorporate
any external (or internal) support mechanisms that would take effect in the event of the counterparty encountering financial difficulties. The
model generates a long-term rating by combining these quantitative and qualitative factors. The output is a numerical rating ranging from 1
to 22, with grades 1 to 10 equating to investment grade status and grade 22 representing default.
Credit limits, subject to internal policy requirements, are restricted to FIs with an internal rating of 8 or above; this methodology, and maximum
available limits are reviewed annually within credit policy and credit risk strategy updates approved by Credit Committee. Credit exposure to
FIs continues to be managed and controlled by a tiering system, with limits capped by rating and counterparty size. All FI counterparties are
reviewed and re-rated annually as a minimum and subject to review and challenge via the monthly portfolio management reviews.
Table 30 . Inte rna l de fault grades mapped to exte rna l ra tings (2019 )
Inte rna l
De fault
Grades
PD band
1 - 3 0% to 0 .035% AAA to AA Aaa to Aa2 AAA to AA
4 - 6 0 .036% to 0 .070% AA- to A Aa3 to A2 AA- to A
7 - 9 0 .071% to 0 .300% A- to BBB A3 to Baa2 A- to BBB
10 - 12 0 .301% to 2 .000% BBB- to BB Baa3 to Ba2 BBB- to BB
13 - 16 2 .001% to 18 .000% BB- to B- Ba3 to B3 BB- to B-
17 - 22 18 .001% to 100% CCC+ to D Caa1 to D CCC to D
S&P ra tings Moody's ra tings Fitch ra tings
Note: Internal default grade 22 represents an exposure that is in default for regulatory purposes.
Tables 31 and 32 show the exposure to institutions, equities and non-credit obligation assets. The PD band analysis shows that there are no
defaulted exposures to institutions in either the current or prior year, with 98% of the exposures in the lowest PD band (99% in 2018).
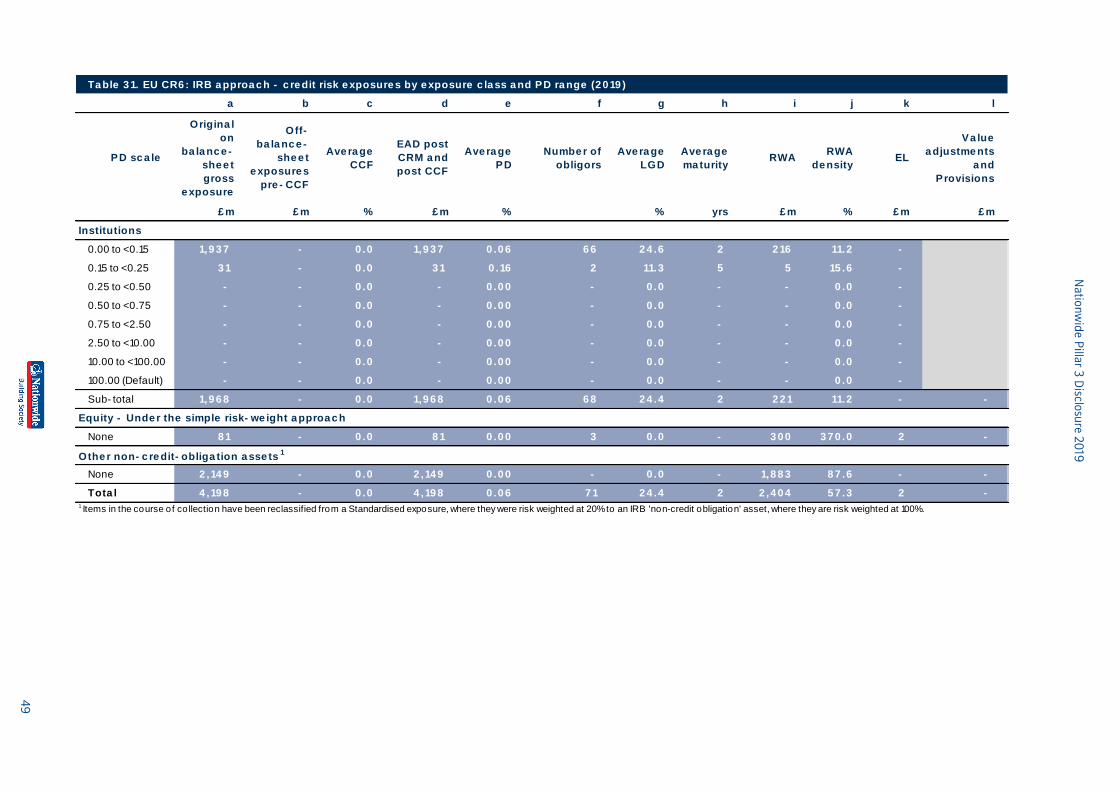
Na
tion
wid
e P
illar 3
Disclo
sure
20
19
49
Ta ble 3 1. EU CR6 : IRB a pproa c h - c re dit risk e xposure s by e xposure c la ss a nd PD ra nge (2 0 19 )
a b c d e f g h i j k l
PD sc a le
Origina l
on
ba la nc e -
she e t
gross
e xposure
Off-
ba la nc e -
she e t
e xposure s
pre - CCF
Ave ra ge
CCF
EAD post
CRM a nd
post CCF
Ave ra ge
PD
Numbe r of
obligors
Ave ra ge
LGD
Ave ra ge
ma turityRWA
RWA
de nsityEL
Va lue
a djustme nts
a nd
Provisions
£ m £ m % £ m % % yrs £ m % £ m £ m
0.00 to <0.15 1,9 3 7 - 0 .0 1,9 3 7 0 .0 6 6 6 2 4 .6 2 2 16 11.2 -
0.15 to <0.25 3 1 - 0 .0 3 1 0 .16 2 11.3 5 5 15 .6 -
0.25 to <0.50 - - 0 .0 - 0 .0 0 - 0 .0 - - 0 .0 -
0.50 to <0.75 - - 0 .0 - 0 .0 0 - 0 .0 - - 0 .0 -
0.75 to <2.50 - - 0 .0 - 0 .0 0 - 0 .0 - - 0 .0 -
2.50 to <10.00 - - 0 .0 - 0 .0 0 - 0 .0 - - 0 .0 -
10.00 to <100.00 - - 0 .0 - 0 .0 0 - 0 .0 - - 0 .0 -
100.00 (Default) - - 0 .0 - 0 .0 0 - 0 .0 - - 0 .0 -
Sub- total 1,9 6 8 - 0 .0 1,9 6 8 0 .0 6 6 8 2 4 .4 2 2 2 1 11.2 - -
None 8 1 - 0 .0 8 1 0 .0 0 3 0 .0 - 3 0 0 3 7 0 .0 2 -
None 2 ,14 9 - 0 .0 2 ,14 9 0 .0 0 - 0 .0 - 1,8 8 3 8 7 .6 - -
Tota l 4 ,19 8 - 0 .0 4 ,19 8 0 .0 6 7 1 2 4 .4 2 2 ,4 0 4 5 7 .3 2 -1 Items in the course of co llection have been reclassified from a Standardised exposure, where they were risk weighted at 20% to an IRB 'non-credit obligation' asset, where they are risk weighted at 100%.
Institutions
Equity - Unde r the simple risk- we ight a pproa c h
Othe r non- c re dit- obliga tion a sse ts1
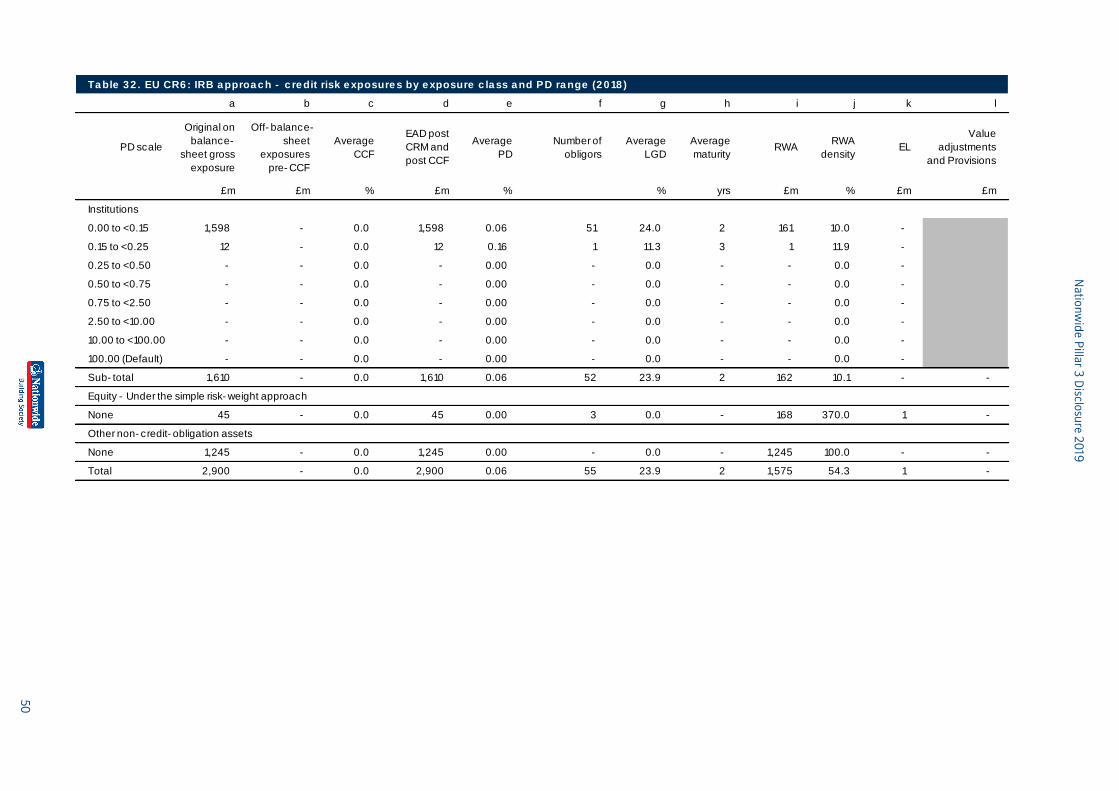
Na
tion
wid
e P
illar 3
Disclo
sure
20
19
50
Ta ble 3 2 . EU CR6 : IRB a pproa c h - c re dit risk e xposure s by e xposure c la ss a nd PD ra nge (2 0 18 )
a b c d e f g h i j k l
PD scale
Original on
balance-
sheet gross
exposure
Off- balance-
sheet
exposures
pre- CCF
Average
CCF
EAD post
CRM and
post CCF
Average
PD
Number of
obligors
Average
LGD
Average
maturityRWA
RWA
densityEL
Value
adjustments
and Provisions
£m £m % £m % % yrs £m % £m £m
0.00 to <0.15 1,598 - 0.0 1,598 0.06 51 24.0 2 161 10.0 -
0.15 to <0.25 12 - 0.0 12 0.16 1 11.3 3 1 11.9 -
0.25 to <0.50 - - 0.0 - 0.00 - 0.0 - - 0.0 -
0.50 to <0.75 - - 0.0 - 0.00 - 0.0 - - 0.0 -
0.75 to <2.50 - - 0.0 - 0.00 - 0.0 - - 0.0 -
2.50 to <10.00 - - 0.0 - 0.00 - 0.0 - - 0.0 -
10.00 to <100.00 - - 0.0 - 0.00 - 0.0 - - 0.0 -
100.00 (Default) - - 0.0 - 0.00 - 0.0 - - 0.0 -
Sub- total 1,610 - 0.0 1,610 0.06 52 23.9 2 162 10.1 - -
None 45 - 0.0 45 0.00 3 0.0 - 168 370.0 1 -
None 1,245 - 0.0 1,245 0.00 - 0.0 - 1,245 100.0 - -
Total 2,900 - 0.0 2,900 0.06 55 23.9 2 1,575 54.3 1 -
Equity - Under the simple risk- weight approach
Other non- credit- obligation assets
Institutions
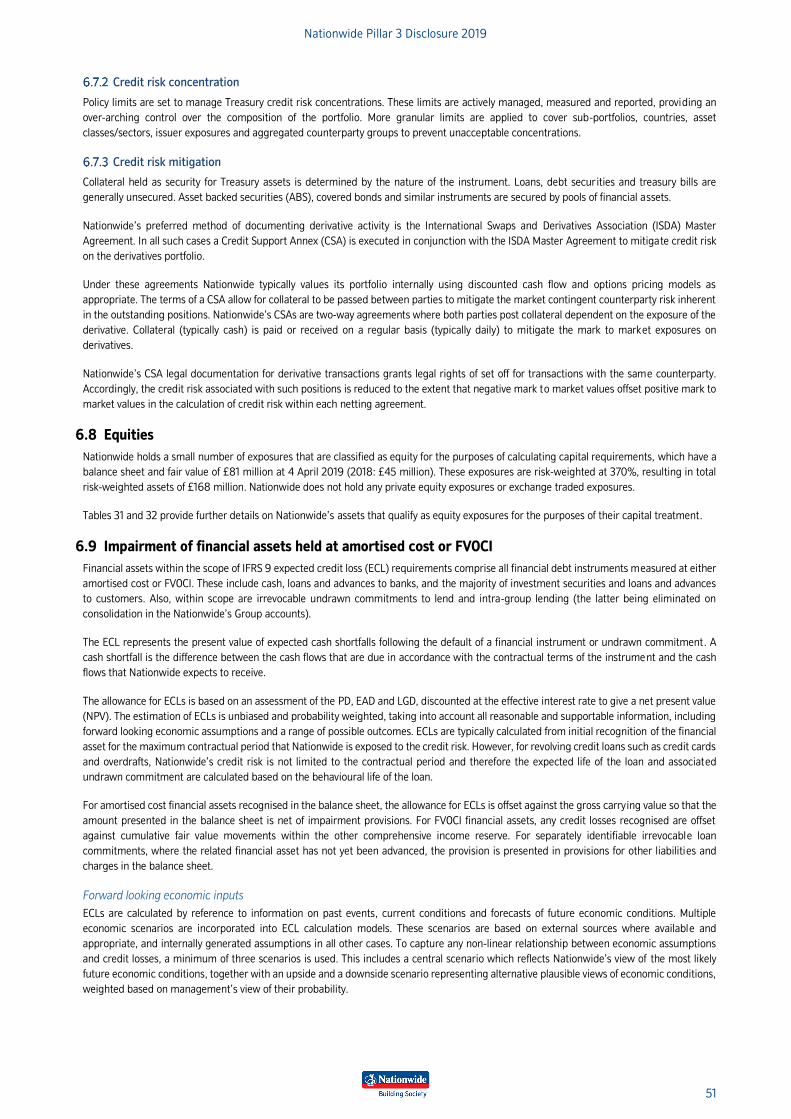
Nationwide Pillar 3 Disclosure 2019
51
Credit risk concentration
Policy limits are set to manage Treasury credit risk concentrations. These limits are actively managed, measured and reported, providing an
over-arching control over the composition of the portfolio. More granular limits are applied to cover sub-portfolios, countries, asset
classes/sectors, issuer exposures and aggregated counterparty groups to prevent unacceptable concentrations.
Credit risk mitigation
Collateral held as security for Treasury assets is determined by the nature of the instrument. Loans, debt secur ities and treasury bills are
generally unsecured. Asset backed securities (ABS), covered bonds and similar instruments are secured by pools of financial assets.
Nationwide’s preferred method of documenting derivative activity is the International Swaps and Derivatives Association (ISDA) Master
Agreement. In all such cases a Credit Support Annex (CSA) is executed in conjunction with the ISDA Master Agreement to mitigate credit risk
on the derivatives portfolio.
Under these agreements Nationwide typically values its portfolio internally using discounted cash flow and options pricing models as
appropriate. The terms of a CSA allow for collateral to be passed between parties to mitigate the market contingent counterparty risk inherent
in the outstanding positions. Nationwide’s CSAs are two-way agreements where both parties post collateral dependent on the exposure of the
derivative. Collateral (typically cash) is paid or received on a regular basis (typically daily) to mitigate the mark to market exposures on
derivatives.
Nationwide’s CSA legal documentation for derivative transactions grants legal rights of set off for transactions with the same counterparty.
Accordingly, the credit risk associated with such positions is reduced to the extent that negative mark to market values offset positive mark to
market values in the calculation of credit risk within each netting agreement.
6.8 Equities
Nationwide holds a small number of exposures that are classified as equity for the purposes of calculating capital requirements, which have a
balance sheet and fair value of £81 million at 4 April 2019 (2018: £45 million). These exposures are risk-weighted at 370%, resulting in total
risk-weighted assets of £168 million. Nationwide does not hold any private equity exposures or exchange traded exposures.
Tables 31 and 32 provide further details on Nationwide’s assets that qualify as equity exposures for the purposes of their capital treatment.
6.9 Impairment of financial assets held at amortised cost or FVOCI
Financial assets within the scope of IFRS 9 expected credit loss (ECL) requirements comprise all financial debt instruments measured at either
amortised cost or FVOCI. These include cash, loans and advances to banks, and the majority of investment securities and loans and advances
to customers. Also, within scope are irrevocable undrawn commitments to lend and intra-group lending (the latter being eliminated on
consolidation in the Nationwide’s Group accounts).
The ECL represents the present value of expected cash shortfalls following the default of a financial instrument or undrawn commitment. A
cash shortfall is the difference between the cash flows that are due in accordance with the contractual terms of the instrument and the cash
flows that Nationwide expects to receive.
The allowance for ECLs is based on an assessment of the PD, EAD and LGD, discounted at the effective interest rate to give a net present value
(NPV). The estimation of ECLs is unbiased and probability weighted, taking into account all reasonable and supportable information, including
forward looking economic assumptions and a range of possible outcomes. ECLs are typically calculated from initial recognition of the financial
asset for the maximum contractual period that Nationwide is exposed to the credit risk. However, for revolving credit loans such as credit cards
and overdrafts, Nationwide’s credit risk is not limited to the contractual period and therefore the expected life of the loan and associated
undrawn commitment are calculated based on the behavioural life of the loan.
For amortised cost financial assets recognised in the balance sheet, the allowance for ECLs is offset against the gross carrying value so that the
amount presented in the balance sheet is net of impairment provisions. For FVOCI financial assets, any credit losses recognised are offset
against cumulative fair value movements within the other comprehensive income reserve. For separately identifiable irrevocable loan
commitments, where the related financial asset has not yet been advanced, the provision is presented in provisions for other liabilities and
charges in the balance sheet.
Forward looking economic inputs
ECLs are calculated by reference to information on past events, current conditions and forecasts of future economic conditions. Multiple
economic scenarios are incorporated into ECL calculation models. These scenarios are based on external sources where available and
appropriate, and internally generated assumptions in all other cases. To capture any non-linear relationship between economic assumptions
and credit losses, a minimum of three scenarios is used. This includes a central scenario which reflects Nationwide’s view of the most likely
future economic conditions, together with an upside and a downside scenario representing alternative plausible views of economic conditions,
weighted based on management’s view of their probability.
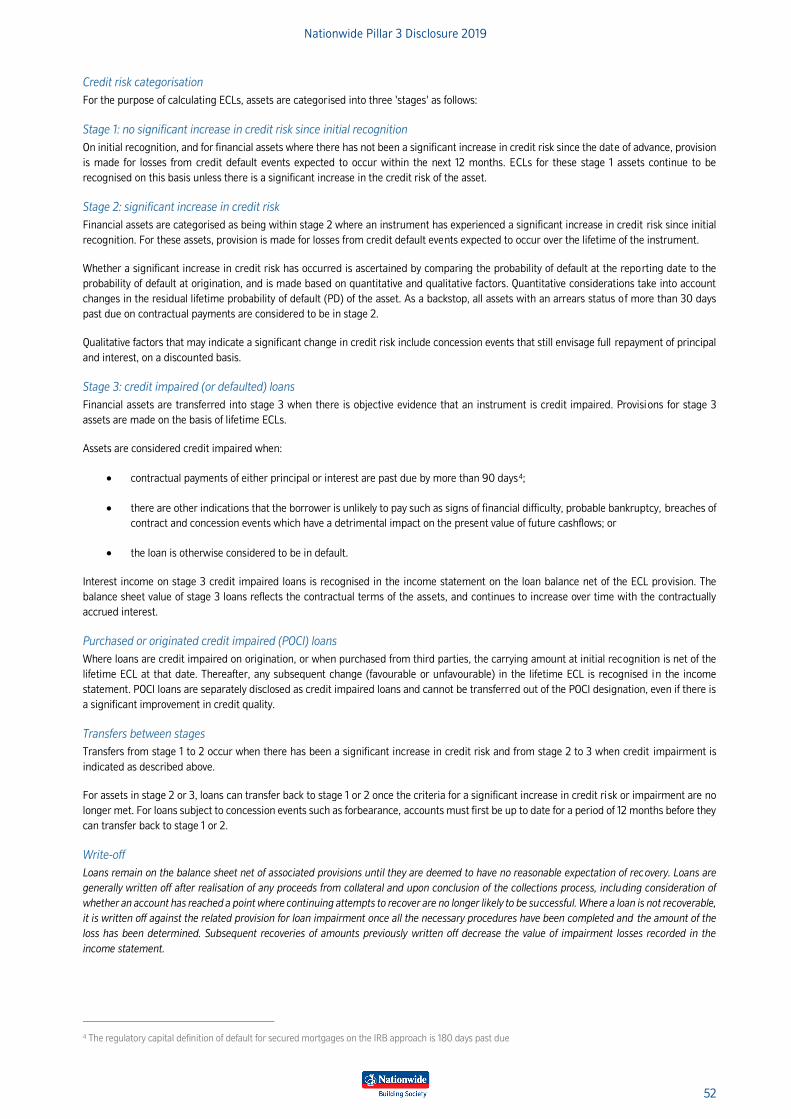
Nationwide Pillar 3 Disclosure 2019
52
Credit risk categorisation
For the purpose of calculating ECLs, assets are categorised into three 'stages' as follows:
Stage 1: no significant increase in credit risk since initial recognition
On initial recognition, and for financial assets where there has not been a significant increase in credit risk since the date of advance, provision
is made for losses from credit default events expected to occur within the next 12 months. ECLs for these stage 1 assets continue to be
recognised on this basis unless there is a significant increase in the credit risk of the asset.
Stage 2: significant increase in credit risk
Financial assets are categorised as being within stage 2 where an instrument has experienced a significant increase in credit risk since initial
recognition. For these assets, provision is made for losses from credit default events expected to occur over the lifetime of the instrument.
Whether a significant increase in credit risk has occurred is ascertained by comparing the probability of default at the reporting date to the
probability of default at origination, and is made based on quantitative and qualitative factors. Quantitative considerations take into account
changes in the residual lifetime probability of default (PD) of the asset. As a backstop, all assets with an arrears status of more than 30 days
past due on contractual payments are considered to be in stage 2.
Qualitative factors that may indicate a significant change in credit risk include concession events that still envisage full repayment of principal
and interest, on a discounted basis.
Stage 3: credit impaired (or defaulted) loans
Financial assets are transferred into stage 3 when there is objective evidence that an instrument is credit impaired. Provisions for stage 3
assets are made on the basis of lifetime ECLs.
Assets are considered credit impaired when:
• contractual payments of either principal or interest are past due by more than 90 days4;
• there are other indications that the borrower is unlikely to pay such as signs of financial difficulty, probable bankruptcy, breaches of
contract and concession events which have a detrimental impact on the present value of future cashflows; or
• the loan is otherwise considered to be in default.
Interest income on stage 3 credit impaired loans is recognised in the income statement on the loan balance net of the ECL provision. The
balance sheet value of stage 3 loans reflects the contractual terms of the assets, and continues to increase over time with the contractually
accrued interest.
Purchased or originated credit impaired (POCI) loans
Where loans are credit impaired on origination, or when purchased from third parties, the carrying amount at initial recognition is net of the
lifetime ECL at that date. Thereafter, any subsequent change (favourable or unfavourable) in the lifetime ECL is recognised in the income
statement. POCI loans are separately disclosed as credit impaired loans and cannot be transferred out of the POCI designation, even if there is
a significant improvement in credit quality.
Transfers between stages
Transfers from stage 1 to 2 occur when there has been a significant increase in credit risk and from stage 2 to 3 when credit impairment is
indicated as described above.
For assets in stage 2 or 3, loans can transfer back to stage 1 or 2 once the criteria for a significant increase in credit risk or impairment are no
longer met. For loans subject to concession events such as forbearance, accounts must first be up to date for a period of 12 months before they
can transfer back to stage 1 or 2.
Write-off
Loans remain on the balance sheet net of associated provisions until they are deemed to have no reasonable expectation of recovery. Loans are
generally written off after realisation of any proceeds from collateral and upon conclusion of the collections process, including consideration of
whether an account has reached a point where continuing attempts to recover are no longer likely to be successful. Where a loan is not recoverable,
it is written off against the related provision for loan impairment once all the necessary procedures have been completed and the amount of the
loss has been determined. Subsequent recoveries of amounts previously written off decrease the value of impairment losses recorded in the
income statement.
4 The regulatory capital definition of default for secured mortgages on the IRB approach is 180 days past due
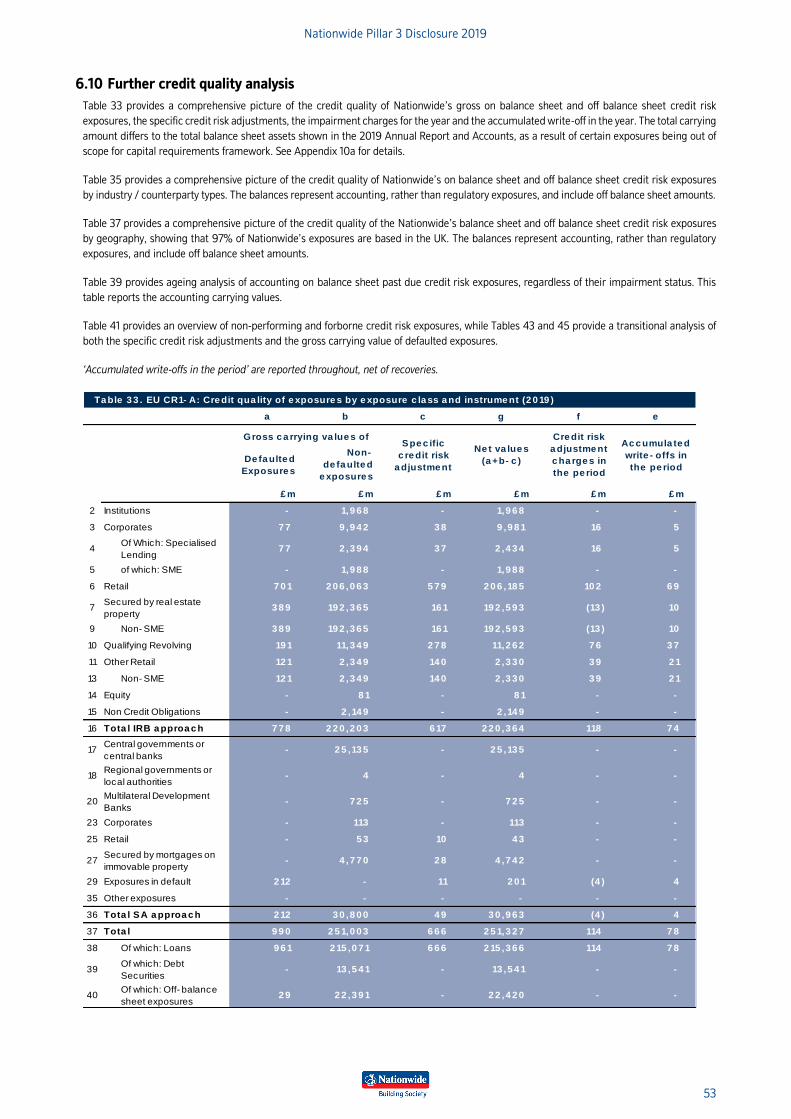
Nationwide Pillar 3 Disclosure 2019
53
6.10 Further credit quality analysis
Table 33 provides a comprehensive picture of the credit quality of Nationwide’s gross on balance sheet and off balance sheet credit risk
exposures, the specific credit risk adjustments, the impairment charges for the year and the accumulated write-off in the year. The total carrying
amount differs to the total balance sheet assets shown in the 2019 Annual Report and Accounts, as a result of certain exposures being out of
scope for capital requirements framework. See Appendix 10a for details.
Table 35 provides a comprehensive picture of the credit quality of Nationwide’s on balance sheet and off balance sheet credit risk exposures
by industry / counterparty types. The balances represent accounting, rather than regulatory exposures, and include off balance sheet amounts.
Table 37 provides a comprehensive picture of the credit quality of the Nationwide’s balance sheet and off balance sheet credit risk exposures
by geography, showing that 97% of Nationwide’s exposures are based in the UK. The balances represent accounting, rather than regulatory
exposures, and include off balance sheet amounts.
Table 39 provides ageing analysis of accounting on balance sheet past due credit risk exposures, regardless of their impairment status. This
table reports the accounting carrying values.
Table 41 provides an overview of non-performing and forborne credit risk exposures, while Tables 43 and 45 provide a transitional analysis of
both the specific credit risk adjustments and the gross carrying value of defaulted exposures.
‘Accumulated write-offs in the period’ are reported throughout, net of recoveries.
Ta ble 3 3 . EU CR1- A: Cre dit qua lity of e xposure s by e xposure c la ss a nd instrume nt (2 0 19 )
a b c g f e
De fa ulte d
Exposure s
Non-
de fa ulte d
e xposure s
£ m £ m £ m £ m £ m £ m
2 Institutions IRB - 1,9 6 8 - 1,9 6 8 - -
3 Corporates IRB 7 7 9 ,9 4 2 3 8 9 ,9 8 1 16 5
4Of Which: Specialised
Lending7 7 2 ,3 9 4 3 7 2 ,4 3 4 16 5
5 of which: SME Corp IRB - 1,9 8 8 - 1,9 8 8 - -
6 Retail 7 0 1 2 0 6 ,0 6 3 5 7 9 2 0 6 ,18 5 10 2 6 9
7Secured by real estate
property3 8 9 19 2 ,3 6 5 16 1 19 2 ,5 9 3 (13 ) 10
9 Non- SME 3 8 9 19 2 ,3 6 5 16 1 19 2 ,5 9 3 (13 ) 10
10 Qualifying Revolving 19 1 11,3 4 9 2 7 8 11,2 6 2 7 6 3 7
11 Other Retail 12 1 2 ,3 4 9 14 0 2 ,3 3 0 3 9 2 1
13 Non- SME 12 1 2 ,3 4 9 14 0 2 ,3 3 0 3 9 2 1
14 Equity - 8 1 - 8 1 - -
15 Non Credit Obligations - 2 ,14 9 - 2 ,14 9 - -
16 Tota l IRB a pproa c h 7 7 8 2 2 0 ,2 0 3 6 17 2 2 0 ,3 6 4 118 7 4
17Central governments or
central banks Standardised- 2 5 ,13 5 - 2 5 ,13 5 - -
18Regional governments or
local authorities- 4 - 4 - -
20Multilateral Development
Banks- 7 2 5 - 7 2 5 - -
23 Corporates Standardised - 113 - 113 - -
25 Retail - 5 3 10 4 3 - -
27Secured by mortgages on
immovable property- 4 ,7 7 0 2 8 4 ,7 4 2 - -
29 Exposures in default 2 12 - 11 2 0 1 (4 ) 4
35 Other exposures - - - - - -
36 Tota l SA a pproa c h 2 12 3 0 ,8 0 0 4 9 3 0 ,9 6 3 (4 ) 4
37 Tota l 9 9 0 2 5 1,0 0 3 6 6 6 2 5 1,3 2 7 114 7 8
38 Of which: Loans 9 6 1 2 15 ,0 7 1 6 6 6 2 15 ,3 6 6 114 7 8
39Of which: Debt
Securities- 13 ,5 4 1 - 13 ,5 4 1 - -
40Of which: Off- balance
sheet exposures2 9 2 2 ,3 9 1 - 2 2 ,4 2 0 - -
Gross c a rrying va lue s ofSpe c ific
c re dit risk
a djustme nt
Ne t va lue s
(a +b- c )
Cre dit risk
a djustme nt
c ha rge s in
the pe riod
Ac c umula te d
write - offs in
the pe riod
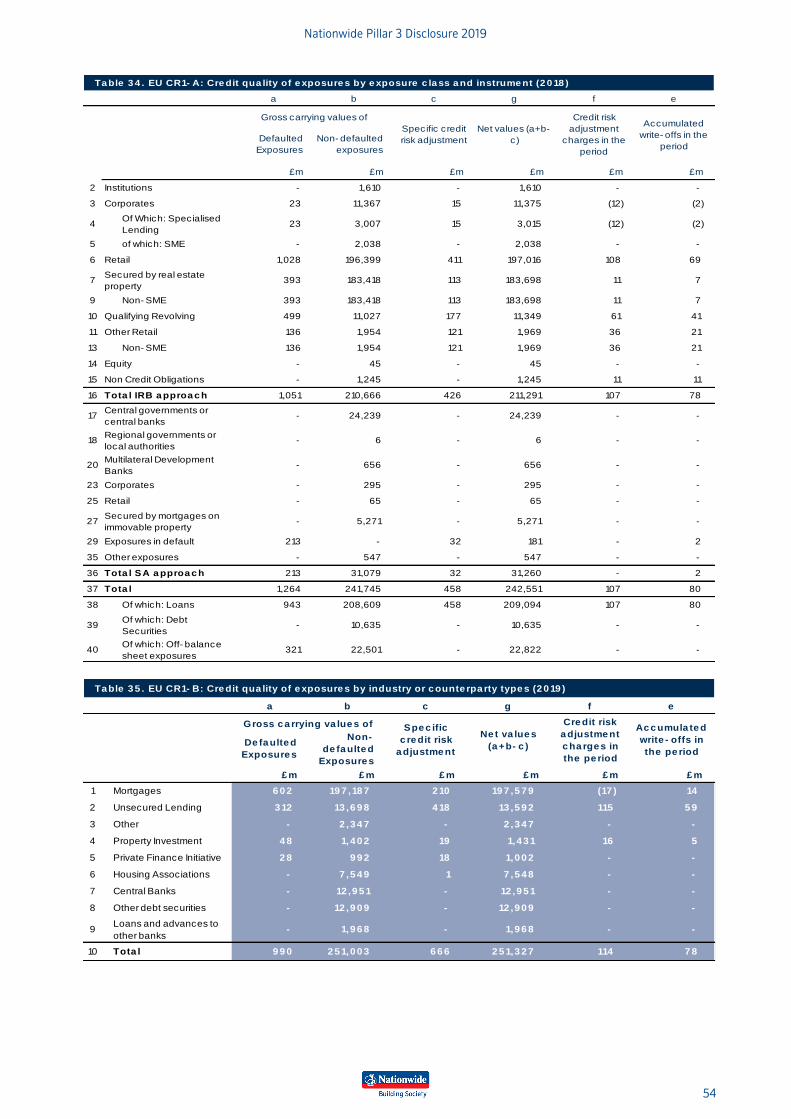
Nationwide Pillar 3 Disclosure 2019
54
Ta ble 3 4 . EU CR1- A: Cre dit qua lity of e xposure s by e xposure c la ss a nd instrume nt (2 0 18 )
a b c g f e
Defaulted
Exposures
Non- defaulted
exposures
£m £m £m £m £m £m
2 Institutions IRB - 1,610 - 1,610 - -
3 Corporates IRB 23 11,367 15 11,375 (12) (2)
4Of Which: Specialised
Lending23 3,007 15 3,015 (12) (2)
5 of which: SME Corp IRB - 2,038 - 2,038 - -
6 Retail 1,028 196,399 411 197,016 108 69
7Secured by real estate
property393 183,418 113 183,698 11 7
9 Non- SME 393 183,418 113 183,698 11 7
10 Qualifying Revolving 499 11,027 177 11,349 61 41
11 Other Retail 136 1,954 121 1,969 36 21
13 Non- SME 136 1,954 121 1,969 36 21
14 Equity - 45 - 45 - -
15 Non Credit Obligations - 1,245 - 1,245 11 11
16 Tota l IRB a pproa c h 1,051 210,666 426 211,291 107 78
17Central governments or
central banks Standardised- 24,239 - 24,239 - -
18Regional governments or
local authorities- 6 - 6 - -
20Multilateral Development
Banks- 656 - 656 - -
23 Corporates Standardised - 295 - 295 - -
25 Retail - 65 - 65 - -
27Secured by mortgages on
immovable property- 5,271 - 5,271 - -
29 Exposures in default 213 - 32 181 - 2
35 Other exposures - 547 - 547 - -
36 Tota l SA a pproa c h 213 31,079 32 31,260 - 2
37 Tota l 1,264 241,745 458 242,551 107 80
38 Of which: Loans 943 208,609 458 209,094 107 80
39Of which: Debt
Securities- 10,635 - 10,635 - -
40Of which: Off- balance
sheet exposures321 22,501 - 22,822 - -
Accumulated
write- offs in the
period
Gross carrying values of
Specific credit
risk adjustment
Net values (a+b-
c)
Credit risk
adjustment
charges in the
period
Ta ble 3 5 . EU CR1- B: Cre dit qua lity of e xposure s by industry or c ounte rpa rty type s (2 0 19 )
a b c g f e
De fa ulte d
Exposure s
Non-
de fa ulte d
Exposure s
£ m £ m £ m £ m £ m £ m
1 Mortgages 6 0 2 19 7 ,18 7 2 10 19 7 ,5 7 9 (17 ) 14
2 Unsecured Lending 3 12 13 ,6 9 8 4 18 13 ,5 9 2 115 5 9
3 Other - 2 ,3 4 7 - 2 ,3 4 7 - -
4 Property Investment 4 8 1,4 0 2 19 1,4 3 1 16 5
5 Private Finance Initiative 2 8 9 9 2 18 1,0 0 2 - -
6 Housing Associations - 7 ,5 4 9 1 7 ,5 4 8 - -
7 Central Banks - 12 ,9 5 1 - 12 ,9 5 1 - -
8 Other debt securities - 12 ,9 0 9 - 12 ,9 0 9 - -
9Loans and advances to
other banks- 1,9 6 8 - 1,9 6 8 - -
10 Tota l 9 9 0 2 5 1,0 0 3 6 6 6 2 5 1,3 2 7 114 7 8
Gross c a rrying va lue s of Ac c umula te d
write - offs in
the pe riod
Cre dit risk
a djustme nt
c ha rge s in
the pe riod
Spe c ific
c re dit risk
a djustme nt
Ne t va lue s
(a +b- c )
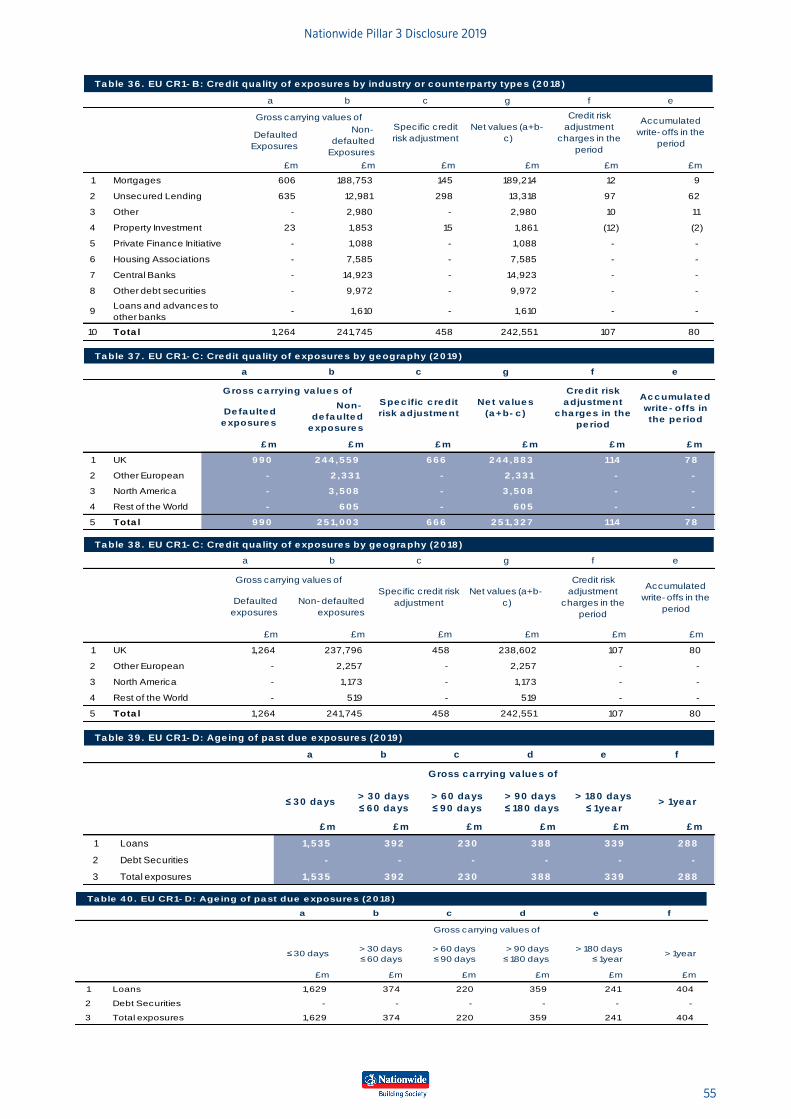
Nationwide Pillar 3 Disclosure 2019
55
Ta ble 3 6 . EU CR1- B: Cre dit qua lity of e xposure s by industry or c ounte rpa rty type s (2 0 18 )
a b c g f e
Defaulted
Exposures
Non-
defaulted
Exposures
£m £m £m £m £m £m
1 Mortgages 606 188,753 145 189,214 12 9
2 Unsecured Lending 635 12,981 298 13,318 97 62
3 Other - 2,980 - 2,980 10 11
4 Property Investment 23 1,853 15 1,861 (12) (2)
5 Private Finance Initiative - 1,088 - 1,088 - -
6 Housing Associations - 7,585 - 7,585 - -
7 Central Banks - 14,923 - 14,923 - -
8 Other debt securities - 9,972 - 9,972 - -
9Loans and advances to
other banks- 1,610 - 1,610 - -
10 Tota l 1,264 241,745 458 242,551 107 80
Accumulated
write- offs in the
period
Gross carrying values ofSpecific credit
risk adjustment
Net values (a+b-
c)
Credit risk
adjustment
charges in the
period
Ta ble 3 7 . EU CR1- C: Cre dit qua lity of e xposure s by ge ogra phy (2 0 19 )
a b c g f e
De fa ulte d
e xposure s
Non-
de fa ulte d
e xposure s
£ m £ m £ m £ m £ m £ m
1 UK 9 9 0 2 4 4 ,5 5 9 6 6 6 2 4 4 ,8 8 3 114 7 8
2 Other European - 2 ,3 3 1 - 2 ,3 3 1 - -
3 North America - 3 ,5 0 8 - 3 ,5 0 8 - -
4 Rest of the World - 6 0 5 - 6 0 5 - -
5 Tota l 9 9 0 2 5 1,0 0 3 6 6 6 2 5 1,3 2 7 114 7 8
Gross c a rrying va lue s of
Spe c ific c re dit
risk a djustme nt
Ne t va lue s
(a +b- c )
Cre dit risk
a djustme nt
c ha rge s in the
pe riod
Ac c umula te d
write - offs in
the pe riod
Ta ble 3 8 . EU CR1- C: Cre dit qua lity of e xposure s by ge ogra phy (2 0 18 )
a b c g f e
Defaulted
exposures
Non- defaulted
exposures
£m £m £m £m £m £m
1 UK 1,264 237,796 458 238,602 107 80
2 Other European - 2,257 - 2,257 - -
3 North America - 1,173 - 1,173 - -
4 Rest of the World - 519 - 519 - -
5 Tota l 1,264 241,745 458 242,551 107 80
Accumulated
write- offs in the
period
Gross carrying values of
Specific credit risk
adjustment
Net values (a+b-
c)
Credit risk
adjustment
charges in the
period
Table 39 . EU CR1- D: Age ing of past due exposures (2019 )
a b c d e f
≤ 3 0 days> 30 days
≤ 6 0 days
> 60 days
≤ 9 0 days
> 90 days
≤ 180 days
> 180 days
≤ 1year> 1year
£ m £ m £ m £ m £ m £ m
1 Loans 1,535 3 9 2 2 3 0 3 8 8 3 3 9 2 8 8
2 Debt Securities - - - - - -
3 Total exposures 1,535 3 9 2 2 3 0 3 8 8 3 3 9 2 8 8
Gross ca rrying va lues of
Table 40 . EU CR1- D: Age ing of past due exposures (2018 )
a b c d e f
≤ 30 days> 30 days
≤ 60 days
> 60 days
≤ 90 days
> 90 days
≤ 180 days
> 180 days
≤ 1year> 1year
£m £m £m £m £m £m
1 Loans 1,629 374 220 359 241 404
2 Debt Securities - - - - - -
3 Total exposures 1,629 374 220 359 241 404
Gross carrying values of
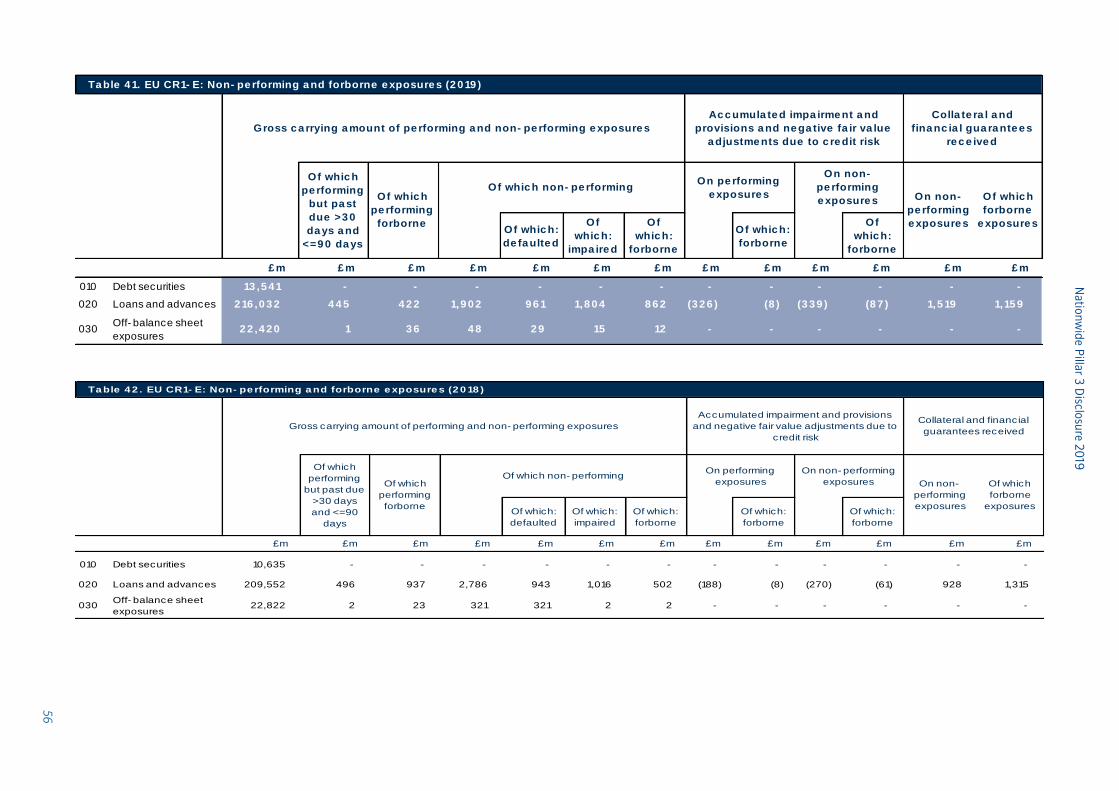
Na
tion
wid
e P
illar 3
Disclo
sure
20
19
56
Ta ble 4 1. EU CR1- E: Non- pe rforming a nd forborne e xposure s (2 0 19 )
Of whic h:
de fa ulte d
Of
whic h:
impa ire d
Of
whic h:
forborne
Of whic h:
forborne
Of
whic h:
forborne
£ m £ m £ m £ m £ m £ m £ m £ m £ m £ m £ m £ m £ m
010 Debt securities 13 ,5 4 1 - - - - - - - - - - - -
020 Loans and advances 2 16 ,0 3 2 4 4 5 4 2 2 1,9 0 2 9 6 1 1,8 0 4 8 6 2 (3 2 6 ) (8 ) (3 3 9 ) (8 7 ) 1,5 19 1,15 9
030Off- balance sheet
exposures2 2 ,4 2 0 1 3 6 4 8 2 9 15 12 - - - - - -
Ac c umula te d impa irme nt a nd
provisions a nd ne ga tive fa ir va lue
a djustme nts due to c re dit risk
On pe rforming
e xposure s
On non-
pe rforming
e xposure s
Colla te ra l a nd
fina nc ia l gua ra nte e s
re c e ive d
Gross c a rrying a mount of pe rforming a nd non- pe rforming e xposure s
Of whic h
pe rforming
but pa st
due >3 0
da ys a nd
<=9 0 da ys
Of whic h
pe rforming
forborne
Of whic h non- pe rformingOn non-
pe rforming
e xposure s
Of whic h
forborne
e xposure s
Ta ble 4 2 . EU CR1- E: Non- pe rforming a nd forborne e xposure s (2 0 18 )
Of which:
defaulted
Of which:
impaired
Of which:
forborne
Of which:
forborne
Of which:
forborne
£m £m £m £m £m £m £m £m £m £m £m £m £m
010 Debt securities 10,635 - - - - - - - - - - - -
020 Loans and advances 209,552 496 937 2,786 943 1,016 502 (188) (8) (270) (61) 928 1,315
030Off- balance sheet
exposures22,822 2 23 321 321 2 2 - - - - - -
Accumulated impairment and provisions
and negative fair value adjustments due to
credit risk
On performing
exposures
On non- performing
exposures
Collateral and financial
guarantees received
Of which
forborne
exposures
Gross carrying amount of performing and non- performing exposures
Of which
performing
but past due
>30 days
and <=90
days
Of which
performing
forborne
Of which non- performingOn non-
performing
exposures
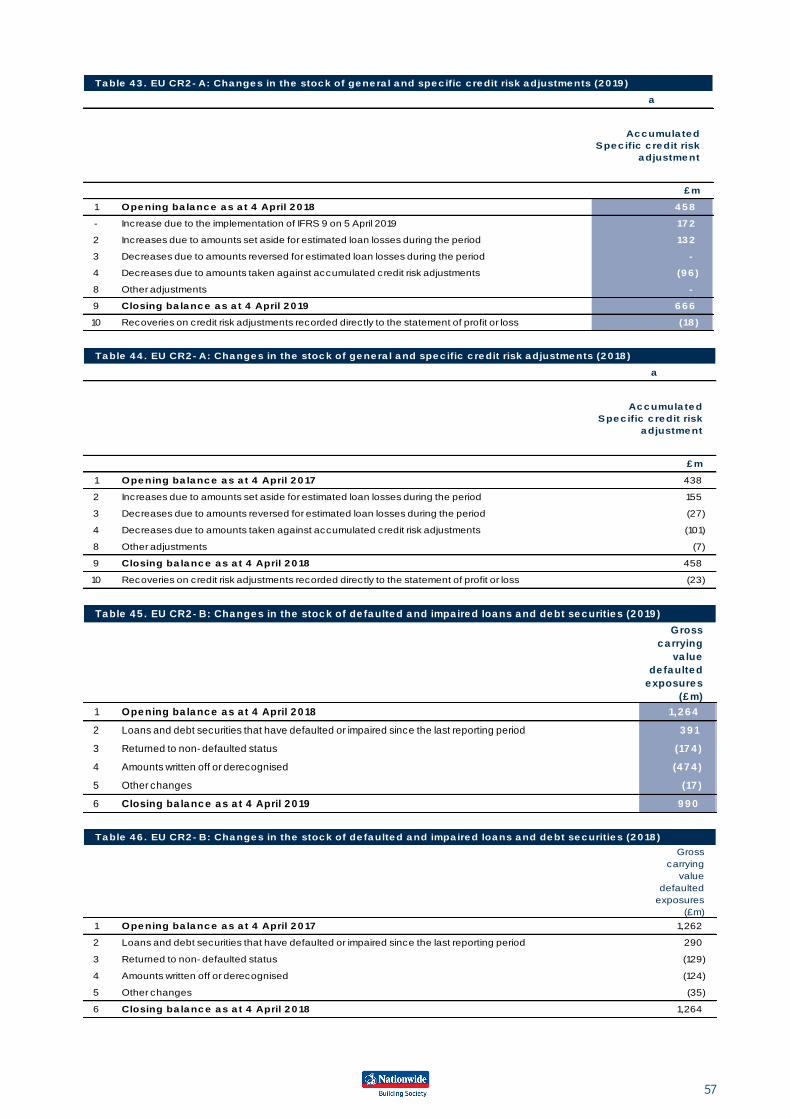
57
Table 43 . EU CR2- A: Changes in the stock of genera l and spec ific c redit risk adjustments (2019 )
a
Accumula ted
Spec ific c redit risk
adjustment
£m
1 Opening ba lance as a t 4 April 2018 458
- Increase due to the implementation of IFRS 9 on 5 April 2019 172
2 Increases due to amounts set aside for estimated loan losses during the period 132
3 Decreases due to amounts reversed for estimated loan losses during the period -
4 Decreases due to amounts taken against accumulated credit risk adjustments (96 )
8 Other adjustments -
9 Closing ba lance as a t 4 April 2019 666
10 Recoveries on credit risk adjustments recorded directly to the statement of profit or loss (18 )
Ta ble 4 4 . EU CR2 - A: Cha nge s in the stoc k of ge ne ra l a nd spe c ific c re dit risk a djustme nts (2 0 18 )
a
Ac c umula te d
Spe c ific c re dit risk
a djustme nt
£ m
1 Ope ning ba la nc e a s a t 4 April 2 0 17 438
2 Increases due to amounts set aside for estimated loan losses during the period 155
3 Decreases due to amounts reversed for estimated loan losses during the period (27)
4 Decreases due to amounts taken against accumulated credit risk adjustments (101)
8 Other adjustments (7)
9 Closing ba la nc e a s a t 4 April 2 0 18 458
10 Recoveries on credit risk adjustments recorded directly to the statement of profit or loss (23)
Ta ble 4 5 . EU CR2 - B: Cha nge s in the stoc k of de fa ulte d a nd impa ire d loa ns a nd de bt se c uritie s (2 0 19 )
Gross
c a rrying
va lue
de fa ulte d
e xposure s
(£ m)
1 Ope ning ba la nc e a s a t 4 April 2 0 18 1,2 6 4
2 Loans and debt securities that have defaulted or impaired since the last reporting period 3 9 1
3 Returned to non- defaulted status (17 4 )
4 Amounts written off or derecognised (4 7 4 )
5 Other changes (17 )
6 Closing ba la nc e a s a t 4 April 2 0 19 9 9 0
Ta ble 4 6 . EU CR2 - B: Cha nge s in the stoc k of de fa ulte d a nd impa ire d loa ns a nd de bt se c uritie s (2 0 18 )
Gross
carrying
value
defaulted
exposures
(£m)
1 Ope ning ba la nc e a s a t 4 April 2 0 17 1,262
2 Loans and debt securities that have defaulted or impaired since the last reporting period 290
3 Returned to non- defaulted status (129)
4 Amounts written off or derecognised (124)
5 Other changes (35)
6 Closing ba la nc e a s a t 4 April 2 0 18 1,264
58
7 Counterparty credit risk Nationwide uses derivatives to reduce exposure to market risks; these are only transacted with highly rated organisations and are collateralised
under market standard documentation. Derivatives are used to reduce exposure to market risks but are not used for trading or speculative
purposes.
Counterparty credit risk is the risk that a counterparty to a derivative instrument to which Nationwide has an exposure could default. This risk
is mitigated by offsetting the amounts due to the same counterparties (‘netting benefits’) and by cash collateral deposited by certain
counterparties (‘collateral held’) to mitigate the mark to market exposures on derivatives.
The net derivative credit exposure represents the credit exposure to derivative transactions after taking account of legally enforceable netting
agreements and CSAs and after including Potential Future Credit Exposure (PFCE) as required in the calculation of exposure. Regular, typically
daily, re-balancing of the collateral requirements reduces the potential increase in future credit exposure.
Collateralisation of derivatives introduces two material changes in credit exposure, namely:
• The posting of collateral reduces the impact of the current market value to the difference between the market value of the derivatives and
the value of the collateral. The use of ‘thresholds’ and ‘minimum transfer amounts’ avoid the movement of small amounts of collateral;
and
• If the counterparty fails to post additional collateral required, a default can be enforced within a very short timeframe resulting in a
substantial reduction in the potential future increases in credit exposure. This rapid default enforcement shortens the timescale within
which future changes in interest rates and foreign exchange rates may occur, which would affect the value of the exposure.
Derivative positions and collateral are valued daily and compared with counterparty valuations to agree collateral settlement . Any disputes in
value are monitored and escalated by the dispute resolution procedures. Market standard CSA collateral allows GBP, EUR and USD cash and in
some cases, extends to high grade sovereign debt securities but cash is the only collateral currently held.
Liquidity is held for both additional collateral that would have to be posted in the event of a credit rating downgrade and adverse movements
in market rates. Collateral requirements following downgrade are assessed on a contractual basis, whereas liquidity for changes in market
rates is assessed using historic market rate volatility.
“Wrong-way risk” may occur when exposure to a counterparty is negatively correlated with the credit quality of that counterparty. Hence, there
is a tendency for the exposure to increase as the creditworthiness decreases. This risk is managed through the Treasury Credit Risk Policy,
which governs the requirements for eligible collateral and counterparty operational limits.
As described in 6.7.3, Nationwide’s preferred method of documenting derivative activity is the ISDA Master Agreement. In all such cases a CSA
is executed in conjunction with the ISDA Master Agreement to mitigate credit risk on the derivatives portfolio. Under these agreements
Nationwide typically values its portfolio in-house using discounted cash flow and options pricing models as appropriate. Any such valuations
are agreed with the relevant counterparties, and collateral is then exchanged to bring the credit exposure within agreed tolerances.
To comply with EU regulatory requirements, Nationwide, is a direct member of a central counterparty (CCP) and is increasing its use of central
clearing for standardised derivatives. This explains the increase in exposure to qualifying central counterparties (QCCP’s) shown in Table 55.
Direct membership necessitates a contribution to the CCP’s default fund. Initial margin (IM) is collected from each member by LCH to cover
potential loss and costs in the event of a default. It reflects the CCP’s calculation of expected stressed market volatility over an assumed time
to find a replacement counterparty (close out period); the margin requested can also cover concentrations, illiquid positions and clearing
members with lower credit ratings. Thereafter, Variation Margin (VM) can be requested with all positions marked-to-market daily; as a stressed
market environment is encountered, both IM and VM will inevitably increase.
The CCP is also used to clear repurchase agreements; these trades are typically short-dated (overnight), and the exposure is relatively small.
Credit exposure to the CCP from derivative and repurchase activity is monitored by the TCR function.
Table 47 & 48 report the accounting asset value of counterparty credit risk exposures (pre-balance sheet netting) and the CRR netting &
collateral offsettable for the purposes of regulatory exposure
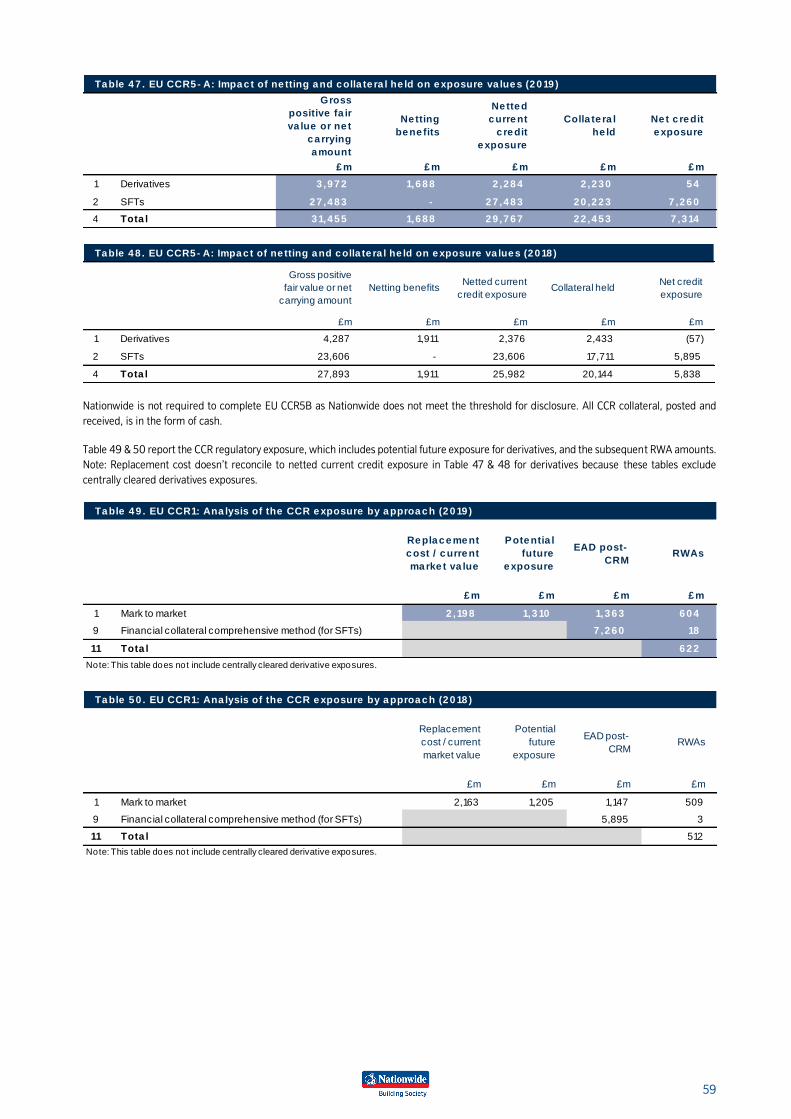
59
Table 47 . EU CCR5- A: Impac t of ne tting and colla te ra l he ld on exposure va lues (2019 )
Gross
positive fa ir
va lue or ne t
ca rrying
amount
Ne tting
bene fits
Ne tted
current
c redit
exposure
Colla te ra l
he ld
Ne t c redit
exposure
£ m £ m £ m £ m £ m
1 Derivatives 3 ,972 1,688 2 ,284 2 ,230 5 4
2 SFTs 27 ,483 - 27 ,483 20 ,223 7 ,260
4 Tota l 31,455 1,688 29 ,767 22 ,453 7 ,314
Table 48 . EU CCR5- A: Impac t of ne tting and colla te ra l he ld on exposure va lues (2018 )
Gross positive
fair value or net
carrying amount
Netting benefitsNetted current
credit exposureCollateral held
Net credit
exposure
£m £m £m £m £m
1 Derivatives 4,287 1,911 2,376 2,433 (57)
2 SFTs 23,606 - 23,606 17,711 5,895
4 Tota l 27,893 1,911 25,982 20,144 5,838
Nationwide is not required to complete EU CCR5B as Nationwide does not meet the threshold for disclosure. All CCR collateral, posted and
received, is in the form of cash.
Table 49 & 50 report the CCR regulatory exposure, which includes potential future exposure for derivatives, and the subsequent RWA amounts.
Note: Replacement cost doesn’t reconcile to netted current credit exposure in Table 47 & 48 for derivatives because these tables exclude
centrally cleared derivatives exposures.
Table 49 . EU CCR1: Ana lysis of the CCR exposure by approach (2019 )
Replacement
cost / current
marke t va lue
Potentia l
future
exposure
EAD post-
CRMRWAs
£ m £ m £ m £ m
1 Mark to market 2 ,198 1,310 1,363 6 0 4
9 Financial collateral comprehensive method (for SFTs) 7 ,260 18
11 Tota l 6 2 2
Note: This table does not include centrally cleared derivative exposures.
Table 50 . EU CCR1: Ana lysis of the CCR exposure by approach (2018 )
Replacement
cost / current
market value
Potential
future
exposure
EAD post-
CRMRWAs
£m £m £m £m
1 Mark to market 2,163 1,205 1,147 509
9 Financial collateral comprehensive method (for SFTs) 5,895 3
11 Tota l 512
Note: This table does not include centrally cleared derivative exposures.
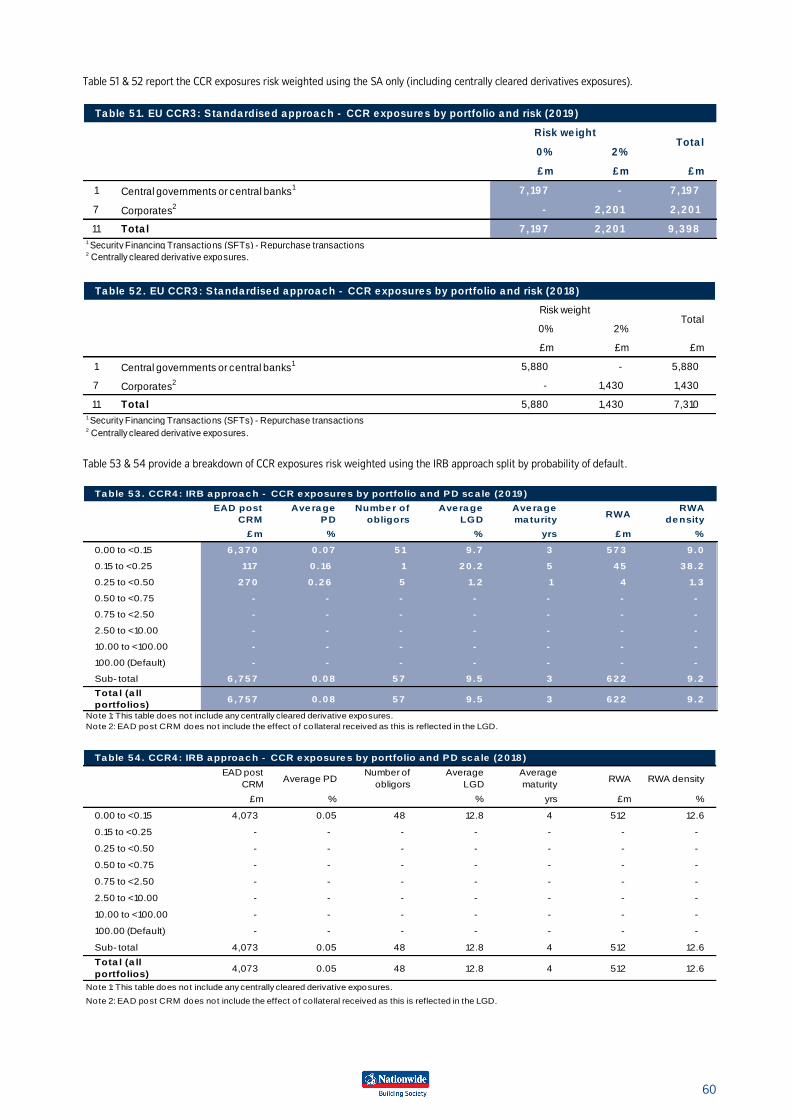
60
Table 51 & 52 report the CCR exposures risk weighted using the SA only (including centrally cleared derivatives exposures).
Table 51. EU CCR3: Standardised approach - CCR exposures by portfolio and risk (2019 )
0 % 2 %
£ m £ m £ m
1 Central governments or central banks1 7 ,197 - 7 ,197
7 Corporates2 - 2 ,201 2 ,201
11 Tota l 7 ,197 2 ,201 9 ,398 1 Security Financing Transactions (SFTs) - Repurchase transactions2 Centrally cleared derivative exposures.
Tota lRisk we ight
Table 52 . EU CCR3: Standardised approach - CCR exposures by portfolio and risk (2018 )
0% 2%
£m £m £m
1 Central governments or central banks1 5,880 - 5,880
7 Corporates2 - 1,430 1,430
11 Tota l 5,880 1,430 7,310 1 Security Financing Transactions (SFTs) - Repurchase transactions2 Centrally cleared derivative exposures.
Risk weightTotal
Table 53 & 54 provide a breakdown of CCR exposures risk weighted using the IRB approach split by probability of default.
Ta ble 5 3 . CCR4 : IRB a pproa c h - CCR e xposure s by portfolio a nd PD sc a le (2 0 19 )
EAD post
CRM
Ave ra ge
PD
Numbe r of
obligors
Ave ra ge
LGD
Ave ra ge
ma turityRWA
RWA
de nsity
£ m % % yrs £ m %
0.00 to <0.15 6 ,3 7 0 0 .0 7 5 1 9 .7 3 5 7 3 9 .0
0.15 to <0.25 117 0 .16 1 2 0 .2 5 4 5 3 8 .2
0.25 to <0.50 2 7 0 0 .2 6 5 1.2 1 4 1.3
0.50 to <0.75 - - - - - - -
0.75 to <2.50 - - - - - - -
2.50 to <10.00 - - - - - - -
10.00 to <100.00 - - - - - - -
100.00 (Default) - - - - - - -
Sub- total 6 ,7 5 7 0 .0 8 5 7 9 .5 3 6 2 2 9 .2
Tota l (a ll
portfolios)6 ,7 5 7 0 .0 8 5 7 9 .5 3 6 2 2 9 .2
Note 1: This table does not include any centrally cleared derivative exposures.
Note 2: EAD post CRM does not include the effect of co llateral received as this is reflected in the LGD.
Ta ble 5 4 . CCR4 : IRB a pproa c h - CCR e xposure s by portfolio a nd PD sc a le (2 0 18 )
EAD post
CRMAverage PD
Number of
obligors
Average
LGD
Average
maturityRWA RWA density
£m % % yrs £m %
0.00 to <0.15 4,073 0.05 48 12.8 4 512 12.6
0.15 to <0.25 - - - - - - -
0.25 to <0.50 - - - - - - -
0.50 to <0.75 - - - - - - -
0.75 to <2.50 - - - - - - -
2.50 to <10.00 - - - - - - -
10.00 to <100.00 - - - - - - -
100.00 (Default) - - - - - - -
Sub- total 4,073 0.05 48 12.8 4 512 12.6
Tota l (a ll
portfolios)4,073 0.05 48 12.8 4 512 12.6
Note 1: This table does not include any centrally cleared derivative exposures.
Note 2: EAD post CRM does not include the effect of co llateral received as this is reflected in the LGD.
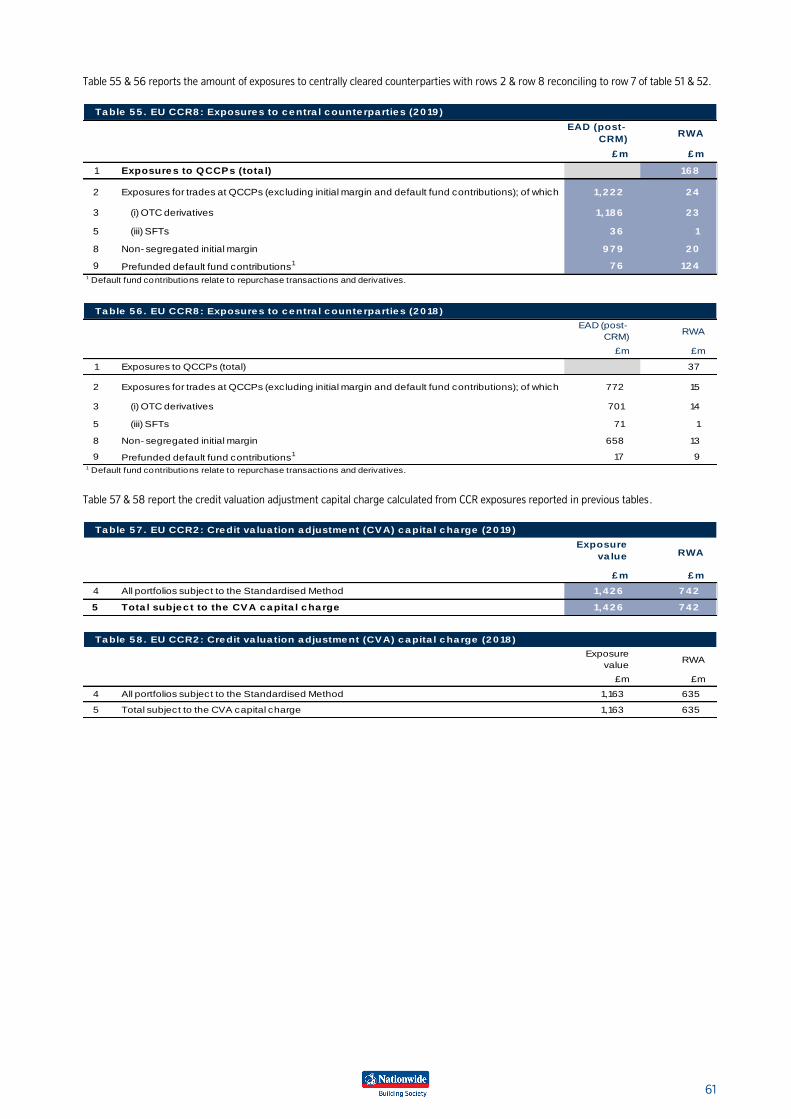
61
Table 55 & 56 reports the amount of exposures to centrally cleared counterparties with rows 2 & row 8 reconciling to row 7 of table 51 & 52.
Table 55 . EU CCR8: Exposures to centra l counte rparties (2019 )
EAD (post-
CRM)RWA
£ m £ m
1 Exposures to QCCPs (tota l) 168
2 Exposures for trades at QCCPs (excluding initial margin and default fund contributions); of which 1,222 2 4
3 (i) OTC derivatives 1,186 2 3
5 (iii) SFTs 3 6 1
8 Non- segregated initial margin 9 7 9 2 0
9 Prefunded default fund contributions1 7 6 124
1 Default fund contributions relate to repurchase transactions and derivatives.
Table 56 . EU CCR8: Exposures to centra l counte rparties (2018 )
EAD (post-
CRM)RWA
£m £m
1 Exposures to QCCPs (total) 37
2 Exposures for trades at QCCPs (excluding initial margin and default fund contributions); of which 772 15
3 (i) OTC derivatives 701 14
5 (iii) SFTs 71 1
8 Non- segregated initial margin 658 13
9 Prefunded default fund contributions1 17 9
1 Default fund contributions relate to repurchase transactions and derivatives.
Table 57 & 58 report the credit valuation adjustment capital charge calculated from CCR exposures reported in previous tables .
Table 57 . EU CCR2: Credit va lua tion adjustment (CVA) capita l charge (2019 )
Exposure
va lue RWA
£m £m
4 All portfolios subject to the Standardised Method 1,426 742
5 Tota l subjec t to the CVA capita l charge 1,426 742
Table 58 . EU CCR2: Credit va lua tion adjustment (CVA) capita l charge (2018 )
Exposure
valueRWA
£m £m
4 All portfolios subject to the Standardised Method 1,163 635
5 Total subject to the CVA capital charge 1,163 635
62
8 Securitisations Nationwide engages in securitisation activities for two purposes:
• To obtain funding from the capital markets; and
• To support Nationwide’s liquidity requirements via the purchase of highly rated securitisation issues.
Retained securitisation positions
Nationwide has securitised certain mortgage loans by transferring the loans to special purpose entities (SPEs) sponsored by the Group. The
SPEs are fully consolidated into the Group accounts.
The Silverstone Master Trust programme for retail mortgages is currently the only vehicle that securitises assets originated by the Group. Notes
are issued by Silverstone Master Issuer plc to external counterparties and to Nationwide to obtain secured funding. Nationwide Building Society
is both originator and servicer of the programme. Other roles fulfilled by Nationwide are fully described in the Silverstone base prospectus.
A total of £6.9 billion (4 April 2018: £8.7 billion) of mortgage loans are currently pledged to the Silverstone programme. As at 4 April 2019,
assets on the balance sheet which meet the eligibility criteria for the Silverstone programme total £65.9 billion of prime mortgages (4 April
2018: £61.6 billion).
The transfers of the mortgage loans to the Silverstone entities are not treated as sales by Nationwide. Nationwide continues to recognise the
mortgage loans on its own balance sheet after the transfer because it substantially retains their risks and rewards through the receipt of
substantially all the profits or losses of the Silverstone entities. The proceeds received from the transfer are accounted for as a deemed loan
repayable to the Silverstone entities.
A summary of Nationwide’s accounting policies for securitisations activities can be found within the Annual Report and Accoun ts 2019, Note
1 to the financial statements.
For residential mortgages securitised by Nationwide, as at 4 April 2019, 305 mortgage accounts were past due (2018: 309), with an
outstanding balance of £25 million (2018: £28 million). Losses incurred in the Silverstone pool in the period amounted to £0.3 million (2018:
£0.5 million) across 27 properties sold (2018: 43).
Silverstone Master Issuer (SMI) issues Class A and unrated Class Z notes (respectively A-notes and Z-notes). Currently all A-notes are held by
third parties and all Z-notes are retained by Nationwide. During the year, SMI issued no A notes to third parties. A-notes issued to third parties
of £0.4 billion, $0.2 billion and €0.1 billion were repaid (sterling equivalent £0.7 billion at maturity). The total value of A-notes issued to third
parties as at 4 April 2019 is £3.0 billion (4 April 2018: £3.6 billion) sterling equivalents.
Z-notes provide subordination required to maintain the rating of the A-notes. No Z-notes issued to Nationwide of were repaid during the
year. The values of Z-notes and the Z-VFN (this variable funding note can be sized according to subordination requirements and will become
the only Z-note when the only remaining ordinary Z-note rolls off in 2020) retained by Nationwide at 4 April 2019 are £0.03 billion and £0.3
billion respectively. The Group is under no obligation to support any losses that may be incurred by the securitisation programme or holders
of the notes issued. The parties holding the notes in issue are only entitled to obtain payment of the principal and interest to the extent that
the resources of the Silverstone Master Trust structure are sufficient to support such payment and the holders of the notes have agreed not to
seek recourse in any other form.
To manage interest rate risk, Nationwide enters into derivative transactions with the SPEs, receiving a rate of interest based on the securitised
mortgages and paying a rate inherent in the debt issuances. In accordance with accounting standards, these internal derivatives are treated
as part of the deemed loan and not separately fair valued because the relevant mortgage loans are not derecognised. Cash flows arising from
these internal derivatives are accounted for on an accruals basis. All other derivatives relating to securitisations are treated as explained in the
derivatives and hedge accounting policy, which can be found in the Annual Report and Accounts 2019.
The Silverstone entities also represent a liquidity risk to the Group due to legal covenants which may need to be fulfilled in the event of a
downgrade of Nationwide. Funds may need to be either deposited with another institution which has the requisite ratings or a guarantee
obtained from a suitable guarantor if Nationwide’s short term and / or long term ratings are downgraded, unless the rating agencies as
appropriate confirm that the ratings of the notes will not be affected. The cash flows resulting from these legal covenants are in respect of
amounts required to collateralise swaps and amounts held in the transaction bank accounts and the Guaranteed Investment Contract (GIC)
accounts, which represent the net cash position arising from the management of the securitisation programme at any point in t ime. The cash
flows required in the event of downgrade are considered in Nationwide’s internal assessment of its liquidity requirements.
As at 4 April 2019, Nationwide held £0.3 billion (2018: £0.3 billion) of self-issued notes in Silverstone of which £nil (2018: £nil) were eligible
for use in repurchase (repo) transactions.
Self-issued notes and the equivalent deemed loan, together with the related income, expenditure and cash flows are not recognised in the
Group’s financial statements. This avoids the ‘grossing-up’ of the financial statements that would otherwise arise. Notes issued to third parties
are held on the Group’s balance sheet at amortised cost.
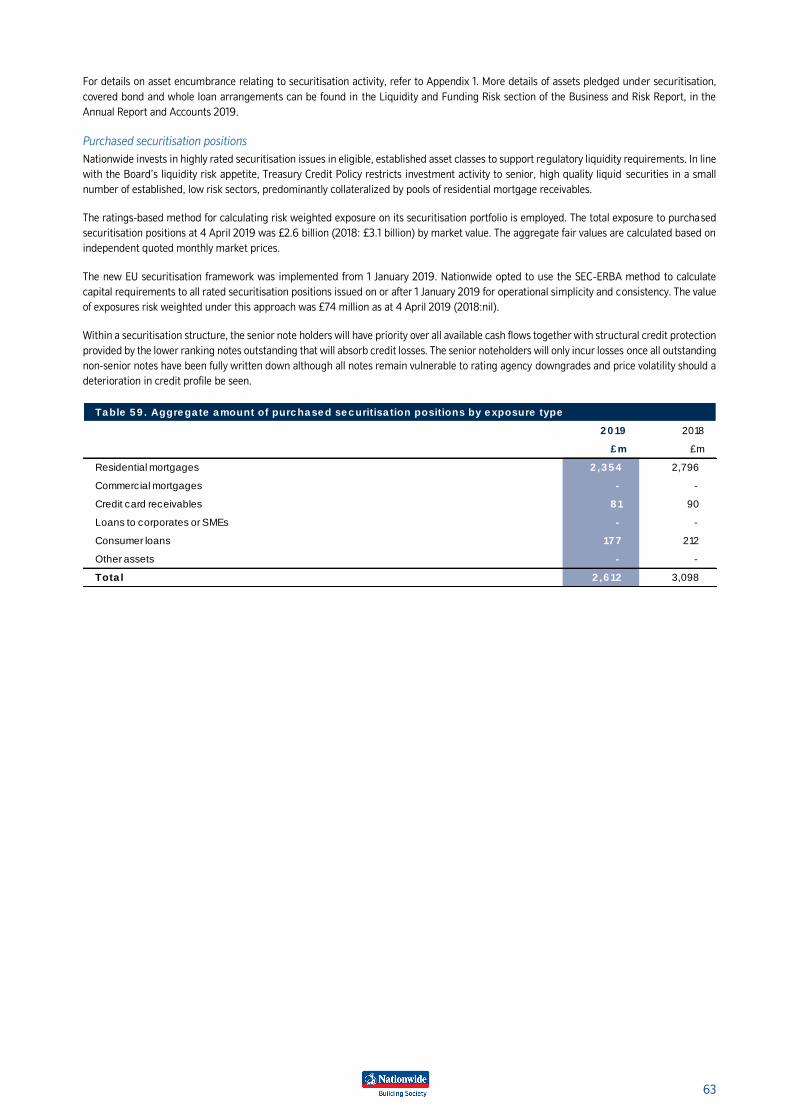
63
For details on asset encumbrance relating to securitisation activity, refer to Appendix 1. More details of assets pledged under securitisation,
covered bond and whole loan arrangements can be found in the Liquidity and Funding Risk section of the Business and Risk Report, in the
Annual Report and Accounts 2019.
Purchased securitisation positions
Nationwide invests in highly rated securitisation issues in eligible, established asset classes to support regulatory liquidity requirements. In line
with the Board’s liquidity risk appetite, Treasury Credit Policy restricts investment activity to senior, high quality liquid securities in a small
number of established, low risk sectors, predominantly collateralized by pools of residential mortgage receivables.
The ratings-based method for calculating risk weighted exposure on its securitisation portfolio is employed. The total exposure to purchased
securitisation positions at 4 April 2019 was £2.6 billion (2018: £3.1 billion) by market value. The aggregate fair values are calculated based on
independent quoted monthly market prices.
The new EU securitisation framework was implemented from 1 January 2019. Nationwide opted to use the SEC-ERBA method to calculate
capital requirements to all rated securitisation positions issued on or after 1 January 2019 for operational simplicity and consistency. The value
of exposures risk weighted under this approach was £74 million as at 4 April 2019 (2018:nil).
Within a securitisation structure, the senior note holders will have priority over all available cash flows together with structural credit protection
provided by the lower ranking notes outstanding that will absorb credit losses. The senior noteholders will only incur losses once all outstanding
non-senior notes have been fully written down although all notes remain vulnerable to rating agency downgrades and price volatility should a
deterioration in credit profile be seen.
Table 59 . Aggrega te amount of purchased securitisa tion positions by exposure type
2019 2018
£ m £m
Residential mortgages 2 ,354 2,796
Commercial mortgages - -
Credit card receivables 8 1 90
Loans to corporates or SMEs - -
Consumer loans 177 212
Other assets - -
Tota l 2 ,612 3,098
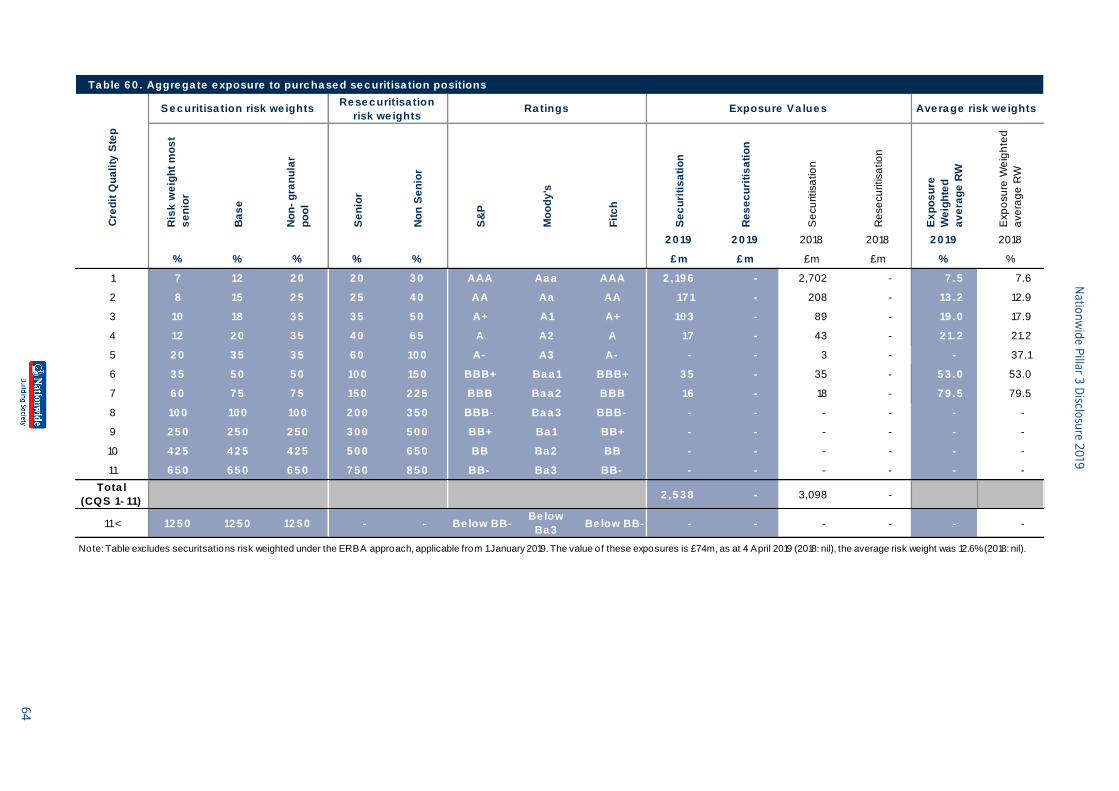
Na
tion
wid
e P
illar 3
Disclo
sure
20
19
64
Ris
k w
eig
ht
mo
st
se
nio
r
Ba
se
No
n-
gra
nu
lar
po
ol
Se
nio
r
No
n S
en
ior
S&
P
Mo
od
y's
Fit
ch
Se
cu
riti
sa
tio
n
Re
se
cu
riti
sa
tio
n
Se
cu
ritisa
tio
n
Re
se
cu
ritisa
tio
n
Ex
po
su
re
We
igh
ted
av
era
ge
RW
Exp
osu
re W
eig
hte
d
ave
rag
e R
W
2 0 19 2 0 19 2018 2018 2 0 19 2018
% % % % % £ m £ m £m £m % %
1 7 12 2 0 2 0 3 0 AAA Aa a AAA 2 ,19 6 - 2,702 - 7 .5 7.6
2 8 15 2 5 2 5 4 0 AA Aa AA 17 1 - 208 - 13 .2 12.9
3 10 18 3 5 3 5 5 0 A+ A1 A+ 10 3 - 89 - 19 .0 17.9
4 12 2 0 3 5 4 0 6 5 A A2 A 17 - 43 - 2 1.2 21.2
5 2 0 3 5 3 5 6 0 10 0 A- A3 A- - - 3 - - 37.1
6 3 5 5 0 5 0 10 0 15 0 BBB+ Ba a 1 BBB+ 3 5 - 35 - 5 3 .0 53.0
7 6 0 7 5 7 5 15 0 2 2 5 BBB Ba a 2 BBB 16 - 18 - 7 9 .5 79.5
8 10 0 10 0 10 0 2 0 0 3 5 0 BBB- Ba a 3 BBB- - - - - - -
9 2 5 0 2 5 0 2 5 0 3 0 0 5 0 0 BB+ Ba 1 BB+ - - - - - -
10 4 2 5 4 2 5 4 2 5 5 0 0 6 5 0 BB Ba 2 BB - - - - - -
11 6 5 0 6 5 0 6 5 0 7 5 0 8 5 0 BB- Ba 3 BB- - - - - - -
Tota l
(CQS 1- 11)2 ,5 3 8 - 3,098 -
11 < 12 5 0 12 5 0 12 5 0 - - Be low BB-Be low
Ba 3Be low BB- - - - - - -
Note: Table excludes securitsations risk weighted under the ERBA approach, applicable from 1 January 2019. The value of these exposures is £74m, as at 4 April 2019 (2018: nil), the average risk weight was 12.6% (2018: nil).
Ta ble 6 0 . Aggre ga te e xposure to purc ha se d se c uritisa tion positions
Cre
dit
Qu
ali
ty S
tep
Ave ra ge risk we ightsSe c uritisa tion risk we ights Ra tings Exposure Va lue sRe se c uritisa tion
risk we ights
Nationwide Pillar 3 Disclosure 2019
65
9 Operational risk 9.1 Operational risk profile
Operational Risk is the risk of loss resulting from failures of internal processes, people and systems, or from external events. Nationwide
manages operational risk across a number of sub-categories, which include cyber, IT resilience and security, business continuity, payments
and fraud.
Nationwide operates a three lines of defence model to manage its operational risk. Details on this approach are set out below and in section
5.2.4. The operational risk profile is informed by risk assessments from across Nationwide, and by review and challenge by both management
and the Risk Oversight function who operate as a second line of defence. Risk Oversight supports management in managing the r isks it faces
in its normal day-to-day activities and when implementing change programmes. Nationwide continues to enhance and embed its operational
and conduct risk framework, expanding the use of techniques such as scenario analysis to support the understanding of current and future
risks and to optimise risk-based decision making across Nationwide.
Nationwide also monitors and reports on the operational risk events that have occurred, to understand better those exposures and drive
sustainable mitigation to prevent recurrence. Nationwide records operational risk events against causal categories, as well as reporting them
against the operational risk categories defined by the Basel Committee on Banking Supervision in Basel II. This allows comparison of operational
risk experience with its peer group.
Over the course of the year, the overall profile of operational risks has remained relatively stable, with the main risks continuing to relate to IT
Resilience, Cyber and manual processes (Execution, delivery and process management). Nationwide continues to meet the high standards
expected by our customers with regards to management of key inherent risks such as cyber-security and IT resilience. Nationwide’s focus is
on being safe, secure and dependable in order to ensure that service availability and customer data are protected. More information regarding
key operational risks, losses and incidents in included in the Operational Risk section in the 2019 AR&A.
9.2 Operational risk framework
Nationwide has a risk framework in place to provide context and guidance for cohesive operational risk management activity across all business
areas. The framework is aligned to Nationwide’s ERMF (section 5.2) and sets the minimum requirements for managing operational and conduct
risks. It sets out mandatory minimum requirements to be followed and signposts further information that is available on these minimum
standards, and associated guidance, to ensure consistent, effective and efficient management of risks.
To give full coverage of risk management activities subject matter specific policies articulate the principles and requirements that must be met
to manage Nationwide’s key risks and support the governance of the Group.
Further information on operational and conduct risk can be found in the Annual Report and Accounts.
9.3 Operational risk governance
As outlined in the Risk Management Section (5.2.4) Nationwide operates a three lines of defence model to manage its operational risks (see
‘Risk and control management and governance’ section) ensuring clear separation between risk and control ownership (f irst line), oversight,
support and challenge (second line), and audit assurance (third line).
Responsibility for managing operational and conduct risk resides within the first line. Risk Management is driven by a positive risk culture and
consists of five core components: risk appetite, risk strategy, control environment, risk and control management and governance, and risk,
incident and control reporting.
The Operational Risk Committee is supported by the First Line Risk Forum, which focuses on ensuring the effectiveness of the framework and
the accuracy and completeness of data used for risk management. Adherence to the framework is monitored by the oversight function as a
second line of defence. Independent assurance is provided by Internal Audit as a third line of defence.
9.4 Risk measurement
Nationwide adopts the SA for the purpose of calculating its operational risk Pillar 1 capital requirement. Nationwide’s capital requirement for
operational risk as at 4 April 2019 was £387 million, a decrease of £5 million from the previous year due to lower average income over a three
year measurement period. Nationwide also undertakes its own modelling, utilising historical internal and external loss data, Business
Environment and Internal Control Factor (BEICF) metrics, and the outputs from scenario analysis. The outputs of the operational risk capital
model are used for Pillar 2A purposes and are monitored quarterly by the capital modelling team with any exceptions reported to the first and
second line committees for challenge and debate.
Nationwide Pillar 3 Disclosure 2019
66
10 Market Risk 10.1 Introduction
Market risk is the risk that the net value of, or net income arising from, assets and liabilities is impacted as a result of changes in market prices
or rates, specifically interest rates, currency rates or equity prices. Nationwide has limited appetite for market risk and does not have a trading
book. Market risk is closely monitored and managed to ensure the level of risk remains within appetite. Market risks are not taken unless they
are essential to core business activities and they provide stability of earnings, minimise costs or enable operational efficiency. Some market
risk arises because of Nationwide’s funding obligations to defined benefit pension schemes. The risks related to these pension schemes are
discussed in section 11.4.
Nationwide’s Pillar 1 capital requirement for market risk is currently set to zero (as Nationwide does not have a trading book and FX exposures
are below the threshold of 2% of total own funds capital requirements) and hence no figures are disclosed.
During the year ended 4 April 2019, general market conditions have been dominated by the political uncertainty primarily caused by Brexit,
despite the optimism at the start of the year that caused rates to rise and sterling to strengthen. At 4 April 2019, sterling was 9% below its
2018 peak. Swap rates fluctuated within a relatively tight band, despite some significant one-day falls. The Bank of England (BoE) raised the
bank rate by 0.25% in August following positive economic data in the first half of the year. The US Federal Reserve has increased interest rates
three times since April 2018.
Globally, economies struggled to maintain the momentum they achieved in 2017 with growth slowing in many countries, including in the
Eurozone. While stock markets traded at record highs in the first few months of the year, in October concerns about growth, both globally and
in the US, together with fears about the impact of a US/China trade war caused indices around the world to fall.
UK regulators have reiterated their intention to transition from LIBOR to alternative benchmark rates by the end of 2021. Nationwide is directly
impacted through exposure to LIBOR linked assets, liabilities and derivative transactions. Nationwide is closely engaged with the Bank of
England’s Working Group on Sterling Risk-Free Reference Rates and other industry bodies and planning is underway to progress and manage
the impacts of this transition.
The European Banking Authority (EBA) published final guidelines on Interest Rate Risk in the Banking Book (IRRBB) in July 2018, which largely
endorse the consultation paper published in 2017. These guidelines specify a prescribed series of standardised interest rate shocks that firms
must use to assess sensitivities on their Economic Value of Equity (EVE) and Net Interest Income (NII). Whilst the final guidelines become
effective from June 2019, Nationwide already monitors its exposures against these prescribed shocks, as well as against internally generated
shock scenarios. Final standardised market disclosures for IRRBB are expected to be implemented through ongoing revisions to the CRD and
CRR.
Market risk appetite
The Board is responsible for setting market risk appetite and ALCO is responsible for managing Nationwide’s market risk profile within this
defined risk appetite. Market risk is managed within a comprehensive risk framework which includes policies, limit setting and monitoring,
stress testing and robust governance controls. Internal risk limits remain low to restrict the potential exposure to market r isk arising from the
daily management of residual positions, with relevant market risk metrics reported monthly to ALCO.
10.2 Market risk management
Nationwide’s market risk only arises in the banking book as it does not have a trading book. Most of the exposure to market r isk arises from
fixed rate mortgages or savings and changes in the market value of the liquidity portfolio. There is a limited amount of currency risk on non-
sterling financial assets and liabilities held.
The principal market risks that affect Nationwide are listed below together with the types of risk reporting measures used:
Risk type Report ing measure Monitoring Frequency
Interest rate risk Value Sensitivity / Value at Risk Daily
Earnings sensitivity Monthly
Basis risk Earnings sensitivity Monthly
Swap spread risk Value at Risk Daily
Currency risk Value Sensitivity / Value at Risk Daily
Product option risk Value at Risk Monthly
In addition, stress analysis is used to evaluate the impact of more extreme, but plausible events. These analytical techniques are described
below together with a review of the exposures during the year.
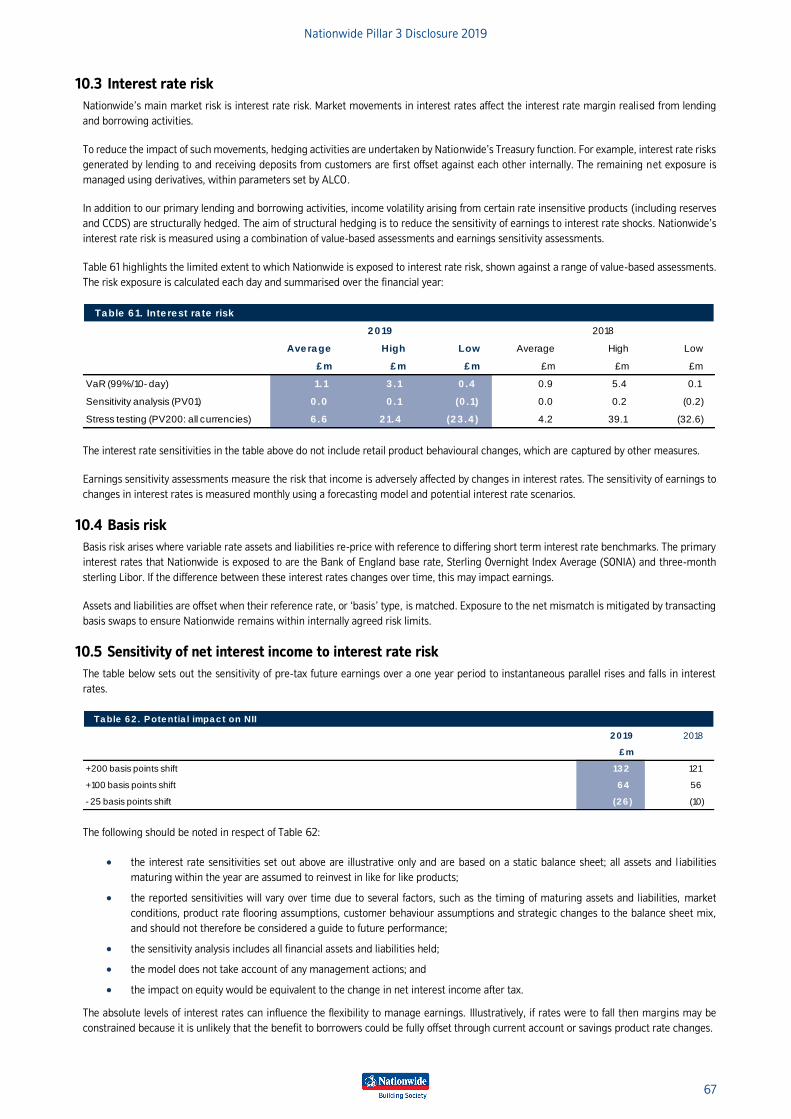
Nationwide Pillar 3 Disclosure 2019
67
10.3 Interest rate risk
Nationwide’s main market risk is interest rate risk. Market movements in interest rates affect the interest rate margin realised from lending
and borrowing activities.
To reduce the impact of such movements, hedging activities are undertaken by Nationwide’s Treasury function. For example, interest rate risks
generated by lending to and receiving deposits from customers are first offset against each other internally. The remaining net exposure is
managed using derivatives, within parameters set by ALCO.
In addition to our primary lending and borrowing activities, income volatility arising from certain rate insensitive products (including reserves
and CCDS) are structurally hedged. The aim of structural hedging is to reduce the sensitivity of earnings to interest rate shocks. Nationwide’s
interest rate risk is measured using a combination of value-based assessments and earnings sensitivity assessments.
Table 61 highlights the limited extent to which Nationwide is exposed to interest rate risk, shown against a range of value-based assessments.
The risk exposure is calculated each day and summarised over the financial year:
Table 61. Inte rest ra te risk
Average High Low Average High Low
£ m £ m £ m £m £m £m
VaR (99%/10- day) 1.1 3 .1 0 .4 0.9 5.4 0.1
Sensitivity analysis (PV01) 0 .0 0 .1 (0 .1) 0.0 0.2 (0.2)
Stress testing (PV200: all currencies) 6 .6 21.4 (23 .4 ) 4.2 39.1 (32.6)
2019 2018
The interest rate sensitivities in the table above do not include retail product behavioural changes, which are captured by other measures.
Earnings sensitivity assessments measure the risk that income is adversely affected by changes in interest rates. The sensitivity of earnings to
changes in interest rates is measured monthly using a forecasting model and potential interest rate scenarios.
10.4 Basis risk
Basis risk arises where variable rate assets and liabilities re-price with reference to differing short term interest rate benchmarks. The primary
interest rates that Nationwide is exposed to are the Bank of England base rate, Sterling Overnight Index Average (SONIA) and three-month
sterling Libor. If the difference between these interest rates changes over time, this may impact earnings.
Assets and liabilities are offset when their reference rate, or ‘basis’ type, is matched. Exposure to the net mismatch is mitigated by transacting
basis swaps to ensure Nationwide remains within internally agreed risk limits.
10.5 Sensitivity of net interest income to interest rate risk
The table below sets out the sensitivity of pre-tax future earnings over a one year period to instantaneous parallel rises and falls in interest
rates.
Table 62 . Potentia l impac t on NII
2019 2018
£m
+200 basis points shift 132 121
+100 basis points shift 64 56
- 25 basis points shift (26 ) (10)
The following should be noted in respect of Table 62:
• the interest rate sensitivities set out above are illustrative only and are based on a static balance sheet; all assets and l iabilities
maturing within the year are assumed to reinvest in like for like products;
• the reported sensitivities will vary over time due to several factors, such as the timing of maturing assets and liabilities, market
conditions, product rate flooring assumptions, customer behaviour assumptions and strategic changes to the balance sheet mix,
and should not therefore be considered a guide to future performance;
• the sensitivity analysis includes all financial assets and liabilities held;
• the model does not take account of any management actions; and
• the impact on equity would be equivalent to the change in net interest income after tax.
The absolute levels of interest rates can influence the flexibility to manage earnings. Illustratively, if rates were to fall then margins may be
constrained because it is unlikely that the benefit to borrowers could be fully offset through current account or savings product rate changes.

Nationwide Pillar 3 Disclosure 2019
68
Nationwide also measures interest rate risk through Net Interest Income (NII) and Economic Value of Equity (EVE) measures, under a range of
shock scenarios which include behavioural assumptions for retail products as interest rates change. These measures are assessed monthly,
based on the standard shocks prescribed in the EBA final guidelines published in July 2018, as well as against internally generated shock
scenarios.
• NII sensitivities assess the impact to earnings in different interest rate scenarios over a one year period. Sensitivities are calculated
based on a static balance sheet, where all assets and liabilities maturing within the year are reinvested in like for like products. The
sensitivity also includes the impact arising on off balance sheet exposures.
• EVE sensitivities measure the change in value of interest rate sensitive items, both on and off balance sheet, under a range of interest
rate shocks. Sensitivities are calculated on a run-off balance sheet basis.
Both NII and EVE sensitivities are measured monthly, with risk limits set against the various shocks.
10.6 Other market risks
Additional detail on swap spread risk, currency risk and product option risk can be found within the Annual Report and Accounts 2019.
Nationwide Pillar 3 Disclosure 2019
69
11 Other principal risks 11.1 Business risk
Nationwide ensures that it can generate sustainable profit through focus on recurrent sources of income commensurate with the risks taken.
Business risk is defined as the risk that volumes decline or margins shrink relative to the cost base affecting the sustainability of the business
and the ability to deliver the strategy due to macro-economic, geopolitical, industry, consumer trends, regulatory and other external events.
For further details of the management of business risk see the Business and Risk Report section of the Annual Report and Accounts 2019.
11.2 Conduct and compliance risk
This is the risk that Nationwide exercises inappropriate judgement or makes errors in the execution of its business activities, leading to:
noncompliance with regulation or legislation; market integrity being undermined; or an unfair outcome being created for customers.
For further details of the management of conduct and compliance risk see the Business and Risk Report section of the Annual Report and
Accounts 2019.
11.3 Liquidity and funding risk
For detailed disclosures of the management of liquidity and funding risk see the Business and Risk Report section of the Annual Report and
Accounts 2019.
Nationwide’s management of liquidity and funding risks aims to ensure that at all times there are sufficient liquid assets, both as to amount
and quality, to cover cash flow mismatches and fluctuations in funding, to retain public confidence and to meet financial obligations as they
fall due, even during episodes of stress.
This is achieved through management and stress testing of business cash flows, setting appropriate risk limits to maintain a prudent funding
mix and maturity profile, and maintaining sufficient levels of high quality liquid assets and appropriate encumbrance levels.
At 4 April 2019, Nationwide’s LCR was above the UK regulatory minimum of 100% and increased to 150% (4 April 2018: 130%). Nationwide
continues to manage its liquidity against its internal risk appetite, which is more prudent than regulatory requirements.
Nationwide currently exceeds the expected 100% minimum future requirement for the Net Stable Funding Ratio (NSFR), with a ratio of 130%
at 4 April 2019 (4 April 2018: 131%). These figures are based on current interpretations of European NSFR requirements.
Table 63 provides disclosure of Nationwide’s LCR and presents an average of Nationwide’s high-quality liquid assets, cash flows and the
resulting LCR for the previous four quarters, as specified by the EBA disclosure guidelines. These values are calculated on a simple average
basis using the preceding 12 month-end LCR observations, on a consolidated currency basis.
Nationwide’s LCR was 150% as at the 4 April 2019, whilst the average LCR over 12 months ending 4 April 2019 was 143% (average LCR over
12 months ending 4 April 2018 was 132%).
Nationwide manages liquidity and funding risks within a comprehensive risk framework which includes its policy, strategy, limit setting and
monitoring, stress testing and robust governance controls.
The size and mix of the liquid asset buffer is defined by the Group’s risk appetite as set by the Board, which is translated into a set of liquidity
risk limits. This includes ensuring the currency composition of the liquid asset buffer is consistent with the currency profile of stressed outflows.
Nationwide’s liquid assets, which predominately comprise reserves held at central banks and highly rated debt securities issued by a restricted
range of governments, central banks and supranationals, are held and managed centrally by its Treasury function.
The Group uses derivatives only to manage and mitigate exposures to market risks, and not for trading or speculative purposes. The LCR net
cash outflows related to derivative transactions primarily reflects the risk of potential collateral outflows due to adverse market rate changes.
Furthermore, ratings downgrades by external credit rating agencies could also lead to collateral outflows, which are taken into account when
determining LCR outflows.
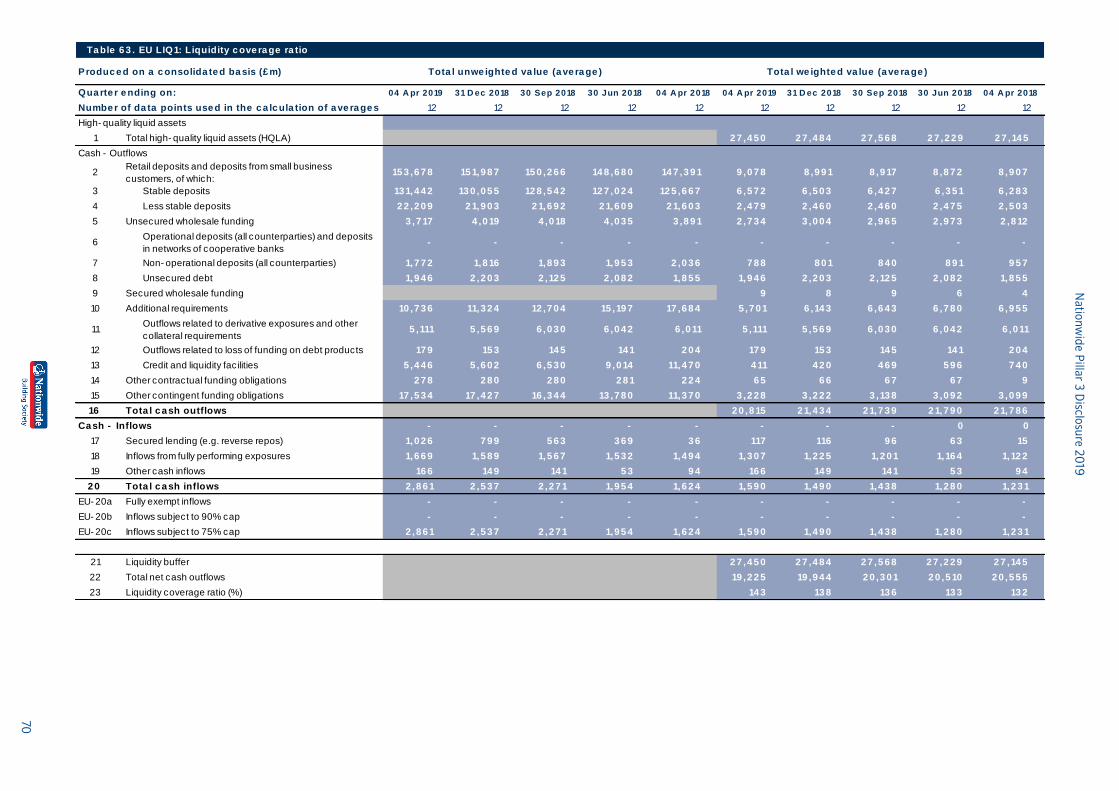
Na
tion
wid
e P
illar 3
Disclo
sure
20
19
70
Ta ble 6 3 . EU LIQ1: Liquidity c ove ra ge ra tio
04 A pr 2019 31 D ec 2018 30 Sep 2018 30 Jun 2018 04 A pr 2018 04 A pr 2019 31 D ec 2018 30 Sep 2018 30 Jun 2018 04 A pr 2018
12 12 12 12 12 12 12 12 12 12
High- quality liquid assets
1 Total high- quality liquid assets (HQLA) 2 7 ,4 5 0 2 7 ,4 8 4 2 7 ,5 6 8 2 7 ,2 2 9 2 7 ,14 5
Cash - Outflows
2Retail deposits and deposits from small business
customers, of which:15 3 ,6 7 8 15 1,9 8 7 15 0 ,2 6 6 14 8 ,6 8 0 14 7 ,3 9 1 9 ,0 7 8 8 ,9 9 1 8 ,9 17 8 ,8 7 2 8 ,9 0 7
3 Stable deposits 13 1,4 4 2 13 0 ,0 5 5 12 8 ,5 4 2 12 7 ,0 2 4 12 5 ,6 6 7 6 ,5 7 2 6 ,5 0 3 6 ,4 2 7 6 ,3 5 1 6 ,2 8 3
4 Less stable deposits 2 2 ,2 0 9 2 1,9 0 3 2 1,6 9 2 2 1,6 0 9 2 1,6 0 3 2 ,4 7 9 2 ,4 6 0 2 ,4 6 0 2 ,4 7 5 2 ,5 0 3
5 Unsecured wholesale funding 3 ,7 17 4 ,0 19 4 ,0 18 4 ,0 3 5 3 ,8 9 1 2 ,7 3 4 3 ,0 0 4 2 ,9 6 5 2 ,9 7 3 2 ,8 12
6Operational deposits (all counterparties) and deposits
in networks of cooperative banks- - - - - - - - - -
7 Non- operational deposits (all counterparties) 1,7 7 2 1,8 16 1,8 9 3 1,9 5 3 2 ,0 3 6 7 8 8 8 0 1 8 4 0 8 9 1 9 5 7
8 Unsecured debt 1,9 4 6 2 ,2 0 3 2 ,12 5 2 ,0 8 2 1,8 5 5 1,9 4 6 2 ,2 0 3 2 ,12 5 2 ,0 8 2 1,8 5 5
9 Secured wholesale funding 9 8 9 6 4
10 Additional requirements 10 ,7 3 6 11,3 2 4 12 ,7 0 4 15 ,19 7 17 ,6 8 4 5 ,7 0 1 6 ,14 3 6 ,6 4 3 6 ,7 8 0 6 ,9 5 5
11Outflows related to derivative exposures and other
collateral requirements5 ,111 5 ,5 6 9 6 ,0 3 0 6 ,0 4 2 6 ,0 11 5 ,111 5 ,5 6 9 6 ,0 3 0 6 ,0 4 2 6 ,0 11
12 Outflows related to loss of funding on debt products 17 9 15 3 14 5 14 1 2 0 4 17 9 15 3 14 5 14 1 2 0 4
13 Credit and liquidity facilities 5 ,4 4 6 5 ,6 0 2 6 ,5 3 0 9 ,0 14 11,4 7 0 4 11 4 2 0 4 6 9 5 9 6 7 4 0
14 Other contractual funding obligations 2 7 8 2 8 0 2 8 0 2 8 1 2 2 4 6 5 6 6 6 7 6 7 9
15 Other contingent funding obligations 17 ,5 3 4 17 ,4 2 7 16 ,3 4 4 13 ,7 8 0 11,3 7 0 3 ,2 2 8 3 ,2 2 2 3 ,13 8 3 ,0 9 2 3 ,0 9 9
16 Tota l c a sh outflows 2 0 ,8 15 2 1,4 3 4 2 1,7 3 9 2 1,7 9 0 2 1,7 8 6
Ca sh - Inflows - - - - - - - - 0 0
17 Secured lending (e.g. reverse repos) 1,0 2 6 7 9 9 5 6 3 3 6 9 3 6 117 116 9 6 6 3 15
18 Inflows from fully performing exposures 1,6 6 9 1,5 8 9 1,5 6 7 1,5 3 2 1,4 9 4 1,3 0 7 1,2 2 5 1,2 0 1 1,16 4 1,12 2
19 Other cash inflows 16 6 14 9 14 1 5 3 9 4 16 6 14 9 14 1 5 3 9 4
2 0 Tota l c a sh inflows 2 ,8 6 1 2 ,5 3 7 2 ,2 7 1 1,9 5 4 1,6 2 4 1,5 9 0 1,4 9 0 1,4 3 8 1,2 8 0 1,2 3 1
EU- 20a Fully exempt inflows - - - - - - - - - -
EU- 20b Inflows subject to 90% cap - - - - - - - - - -
EU- 20c Inflows subject to 75% cap 2 ,8 6 1 2 ,5 3 7 2 ,2 7 1 1,9 5 4 1,6 2 4 1,5 9 0 1,4 9 0 1,4 3 8 1,2 8 0 1,2 3 1
21 Liquidity buffer 2 7 ,4 5 0 2 7 ,4 8 4 2 7 ,5 6 8 2 7 ,2 2 9 2 7 ,14 5
22 Total net cash outflows 19 ,2 2 5 19 ,9 4 4 2 0 ,3 0 1 2 0 ,5 10 2 0 ,5 5 5
23 Liquidity coverage ratio (%) 14 3 13 8 13 6 13 3 13 2
Numbe r of da ta points use d in the c a lc ula tion of a ve ra ge s
Qua rte r e nding on:
Tota l unwe ighte d va lue (a ve ra ge ) Tota l we ighte d va lue (a ve ra ge )Produc e d on a c onsolida te d ba sis (£ m)

Nationwide Pillar 3 Disclosure 2019
71
11.4 Pension risk
Nationwide has funding obligations to several defined benefit pension schemes. Pension risk is defined as the risk that the value of the pension
schemes’ assets will be insufficient to meet the estimated liabilities, creating a pension deficit. Pension risk can adversely impact Nationwide’s
financial performance, capital position and may result in increased cash funding obligations to the defined benefit pension schemes.
The largest pension scheme is the Nationwide Pension Fund (the Fund), which is closed to new employees, although some employees continue
to accrue benefits. In accordance with UK legislation, the assets of the Fund are held in a trust, legally separate from the Group’s assets and
are administered by a board of trustees (the Trustee) which has fiduciary responsibilities to Fund members.
Nationwide has a responsibility to ensure that Fund members are paid the pension they have been promised. To support this aim, Nationwide
has dedicated pension resource that ensures pension risk is appropriately monitored and managed, whilst helping to educate and engage
Fund members about their pension benefits.
Changes in investment returns from the assets and the value of the liabilities both cause volatility in the Fund’s deficit. The key risk factors
impacting the deficit are the realised return on assets, the valuation of liabilities and any underlying actuarial assumptions, including the
discount rate.
For further details of these risk factors, Nationwide’s approach to management of pension risk and the outlook for this risk, see the Business
and Risk Report section of the Annual Report and Accounts 2019.
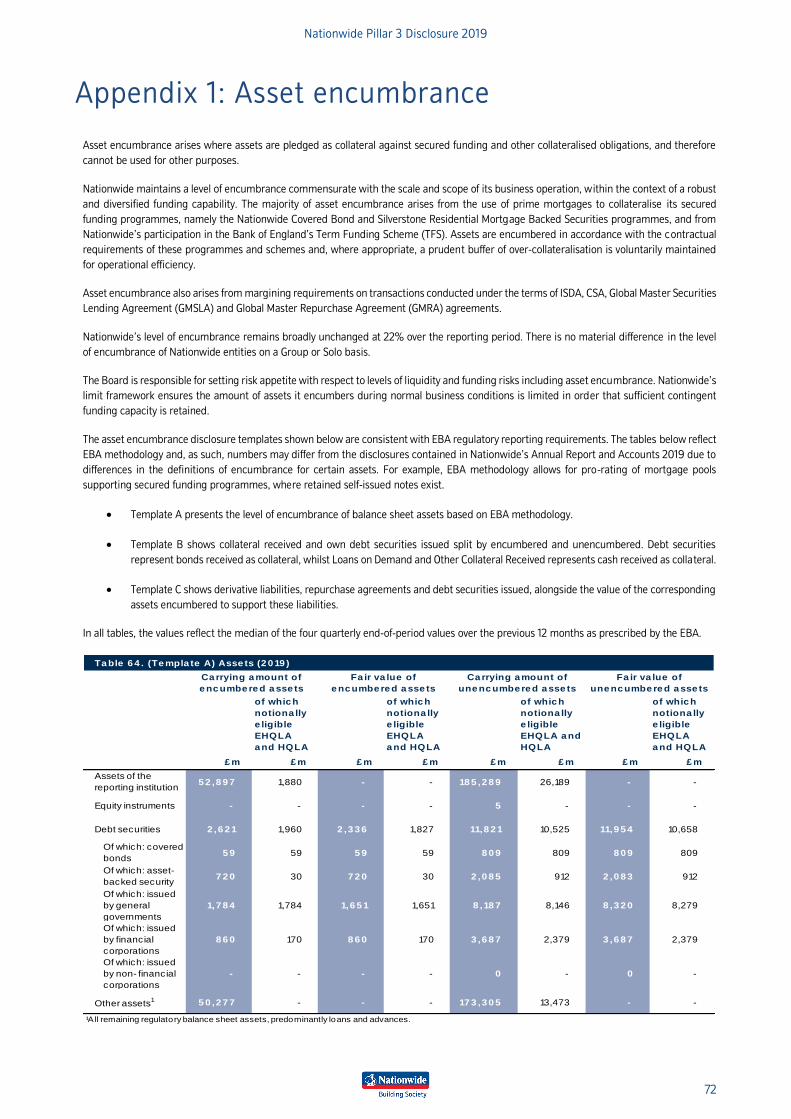
Nationwide Pillar 3 Disclosure 2019
72
Appendix 1: Asset encumbrance
Asset encumbrance arises where assets are pledged as collateral against secured funding and other collateralised obligations, and therefore
cannot be used for other purposes.
Nationwide maintains a level of encumbrance commensurate with the scale and scope of its business operation, within the context of a robust
and diversified funding capability. The majority of asset encumbrance arises from the use of prime mortgages to collateralise its secured
funding programmes, namely the Nationwide Covered Bond and Silverstone Residential Mortgage Backed Securities programmes, and from
Nationwide’s participation in the Bank of England’s Term Funding Scheme (TFS). Assets are encumbered in accordance with the contractual
requirements of these programmes and schemes and, where appropriate, a prudent buffer of over-collateralisation is voluntarily maintained
for operational efficiency.
Asset encumbrance also arises from margining requirements on transactions conducted under the terms of ISDA, CSA, Global Master Securities
Lending Agreement (GMSLA) and Global Master Repurchase Agreement (GMRA) agreements.
Nationwide’s level of encumbrance remains broadly unchanged at 22% over the reporting period. There is no material difference in the level
of encumbrance of Nationwide entities on a Group or Solo basis.
The Board is responsible for setting risk appetite with respect to levels of liquidity and funding risks including asset encumbrance. Nationwide’s
limit framework ensures the amount of assets it encumbers during normal business conditions is limited in order that sufficient contingent
funding capacity is retained.
The asset encumbrance disclosure templates shown below are consistent with EBA regulatory reporting requirements. The tables below reflect
EBA methodology and, as such, numbers may differ from the disclosures contained in Nationwide’s Annual Report and Accounts 2019 due to
differences in the definitions of encumbrance for certain assets. For example, EBA methodology allows for pro-rating of mortgage pools
supporting secured funding programmes, where retained self-issued notes exist.
• Template A presents the level of encumbrance of balance sheet assets based on EBA methodology.
• Template B shows collateral received and own debt securities issued split by encumbered and unencumbered. Debt securities
represent bonds received as collateral, whilst Loans on Demand and Other Collateral Received represents cash received as collateral.
• Template C shows derivative liabilities, repurchase agreements and debt securities issued, alongside the value of the corresponding
assets encumbered to support these liabilities.
In all tables, the values reflect the median of the four quarterly end-of-period values over the previous 12 months as prescribed by the EBA.
Ta ble 6 4 . (Te mpla te A) Asse ts (2 0 19 )
of whic h
notiona lly
e ligible
EHQLA
a nd HQLA
of whic h
notiona lly
e ligible
EHQLA
a nd HQLA
of whic h
notiona lly
e ligible
EHQLA a nd
HQLA
of whic h
notiona lly
e ligible
EHQLA
a nd HQLA
£ m £ m £ m £ m £ m £ m £ m £ m
Assets of the
reporting institution5 2 ,8 9 7 1,880 - - 18 5 ,2 8 9 26,189 - -
Equity instruments - - - - 5 - - -
Debt securities 2 ,6 2 1 1,960 2 ,3 3 6 1,827 11,8 2 1 10,525 11,9 5 4 10,658
Of which: covered
bonds5 9 59 5 9 59 8 0 9 809 8 0 9 809
Of which: asset-
backed security7 2 0 30 7 2 0 30 2 ,0 8 5 912 2 ,0 8 3 912
Of which: issued
by general
governments
1,7 8 4 1,784 1,6 5 1 1,651 8 ,18 7 8,146 8 ,3 2 0 8,279
Of which: issued
by financial
corporations
8 6 0 170 8 6 0 170 3 ,6 8 7 2,379 3 ,6 8 7 2,379
Of which: issued
by non- financial
corporations
- - - - 0 - 0 -
Other assets1 5 0 ,2 7 7 - - - 17 3 ,3 0 5 13,473 - -
¹All remaining regulatory balance sheet assets, predominantly loans and advances.
Ca rrying a mount of
e nc umbe re d a sse ts
Fa ir va lue of
e nc umbe re d a sse ts
Ca rrying a mount of
une nc umbe re d a sse ts
Fa ir va lue of
une nc umbe re d a sse ts
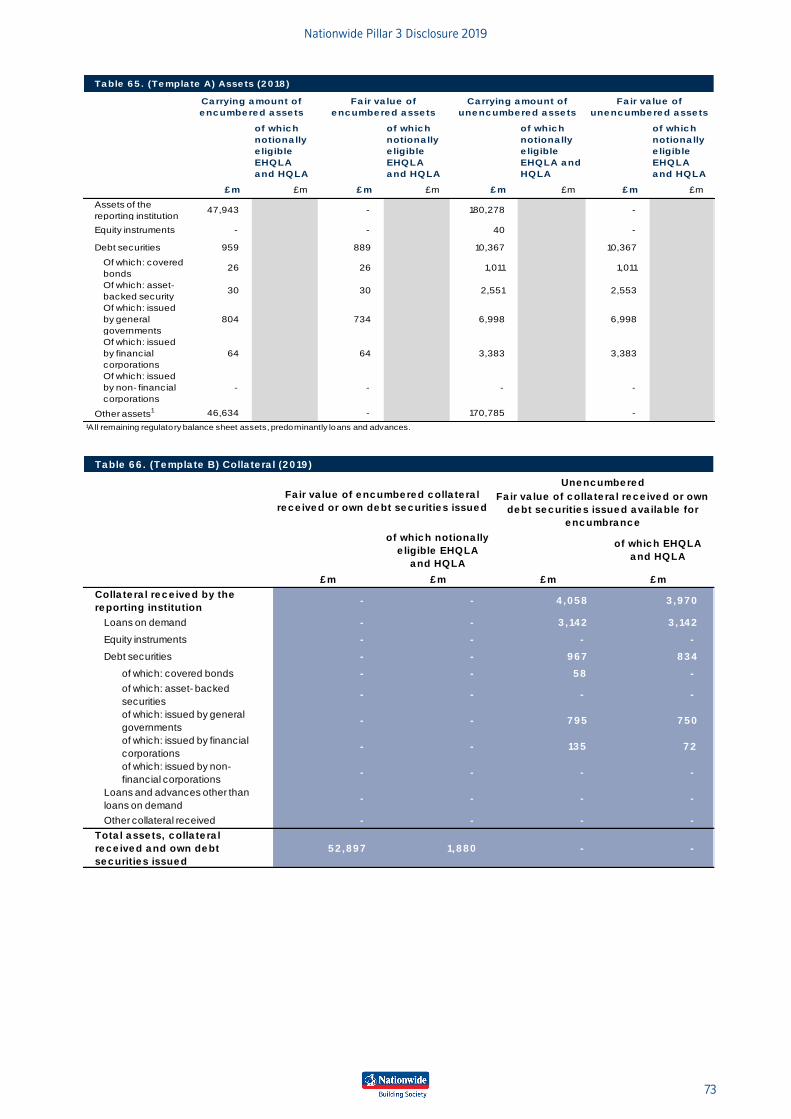
Nationwide Pillar 3 Disclosure 2019
73
Ta ble 6 5 . (Te mpla te A) Asse ts (2 0 18 )
of whic h
notiona lly
e ligible
EHQLA
a nd HQLA
of whic h
notiona lly
e ligible
EHQLA
a nd HQLA
of whic h
notiona lly
e ligible
EHQLA a nd
HQLA
of whic h
notiona lly
e ligible
EHQLA
a nd HQLA
£ m £m £ m £m £ m £m £ m £m
Assets of the
reporting institution47,943 - 180,278 -
Equity instruments - - 40 -
Debt securities 959 889 10,367 10,367
Of which: covered
bonds26 26 1,011 1,011
Of which: asset-
backed security30 30 2,551 2,553
Of which: issued
by general
governments
804 734 6,998 6,998
Of which: issued
by financial
corporations
64 64 3,383 3,383
Of which: issued
by non- financial
corporations
- - - -
Other assets1 46,634 - 170,785 -
¹All remaining regulatory balance sheet assets, predominantly loans and advances.
Fa ir va lue of
une nc umbe re d a sse ts
Ca rrying a mount of
e nc umbe re d a sse ts
Fa ir va lue of
e nc umbe re d a sse ts
Ca rrying a mount of
une nc umbe re d a sse ts
Ta ble 6 6 . (Te mpla te B) Colla te ra l (2 0 19 )
of whic h notiona lly
e ligible EHQLA
a nd HQLA
of whic h EHQLA
a nd HQLA
£ m £ m £ m £ m
Colla te ra l re c e ive d by the
re porting institution - - 4 ,0 5 8 3 ,9 7 0
Loans on demand - - 3 ,14 2 3 ,14 2
Equity instruments - - - -
Debt securities - - 9 6 7 8 3 4
of which: covered bonds - - 5 8 -
of which: asset- backed
securities- - - -
of which: issued by general
governments- - 7 9 5 7 5 0
of which: issued by financial
corporations- - 13 5 7 2
of which: issued by non-
financial corporations- - - -
Loans and advances other than
loans on demand- - - -
Other collateral received - - - -
Tota l a sse ts, c olla te ra l
re c e ive d a nd own de bt
se c uritie s issue d
5 2 ,8 9 7 1,8 8 0 - -
Fa ir va lue of c olla te ra l re c e ive d or own
de bt se c uritie s issue d a va ila ble for
e nc umbra nc e
Fa ir va lue of e nc umbe re d c olla te ra l
re c e ive d or own de bt se c uritie s issue d
Une nc umbe re d
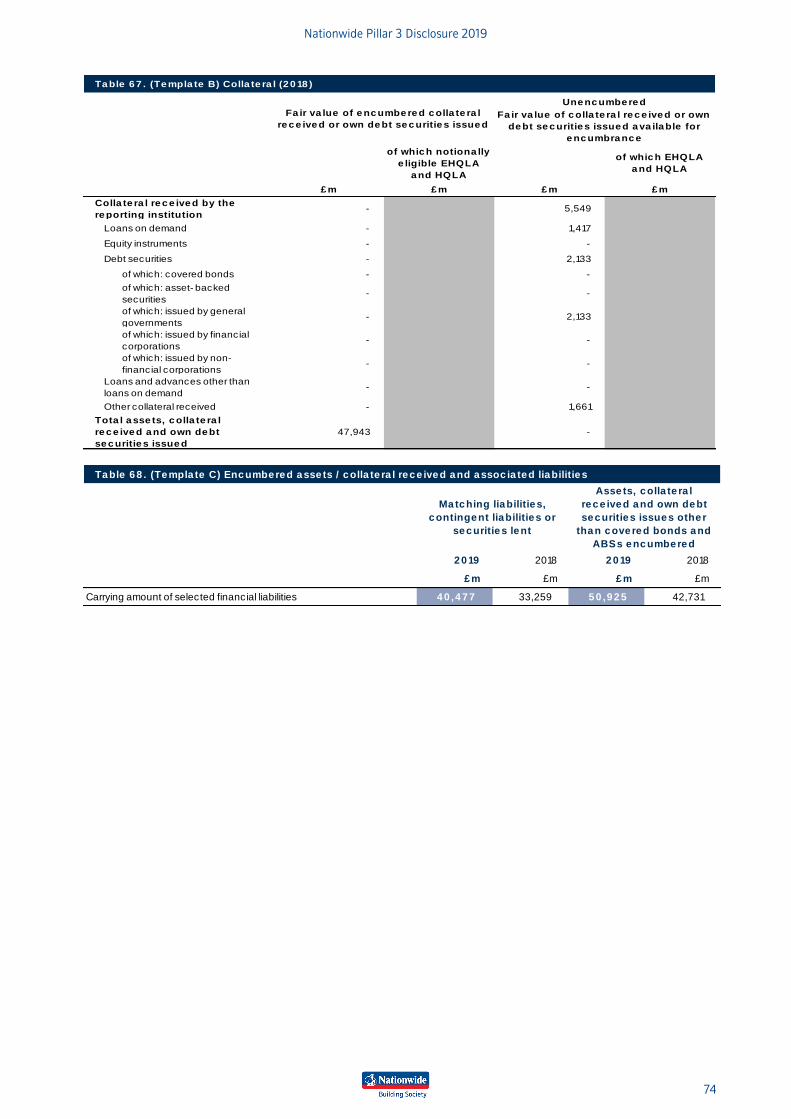
Nationwide Pillar 3 Disclosure 2019
74
Ta ble 6 7 . (Te mpla te B) Colla te ra l (2 0 18 )
of whic h notiona lly
e ligible EHQLA
a nd HQLA
of whic h EHQLA
a nd HQLA
£ m £ m £ m £ m
Colla te ra l re c e ive d by the
re porting institution - 5,549
Loans on demand - 1,417
Equity instruments - -
Debt securities - 2,133
of which: covered bonds - -
of which: asset- backed
securities- -
of which: issued by general
governments- 2,133
of which: issued by financial
corporations- -
of which: issued by non-
financial corporations- -
Loans and advances other than
loans on demand- -
Other collateral received - 1,661
Tota l a sse ts, c olla te ra l
re c e ive d a nd own de bt
se c uritie s issue d
47,943 -
Fa ir va lue of e nc umbe re d c olla te ra l
re c e ive d or own de bt se c uritie s issue d
Une nc umbe re d
Fa ir va lue of c olla te ra l re c e ive d or own
de bt se c uritie s issue d a va ila ble for
e nc umbra nc e
Table 68 . (Templa te C) Encumbered asse ts / colla te ra l rece ived and assoc ia ted liabilities
2019 2018 2019 2018
£ m £m £ m £m
Carrying amount of selected financial liabilities 40 ,477 33,259 50 ,925 42,731
Matching liabilities,
contingent liabilities or
securities lent
Asse ts, colla te ra l
rece ived and own debt
securities issues other
than covered bonds and
ABSs encumbered
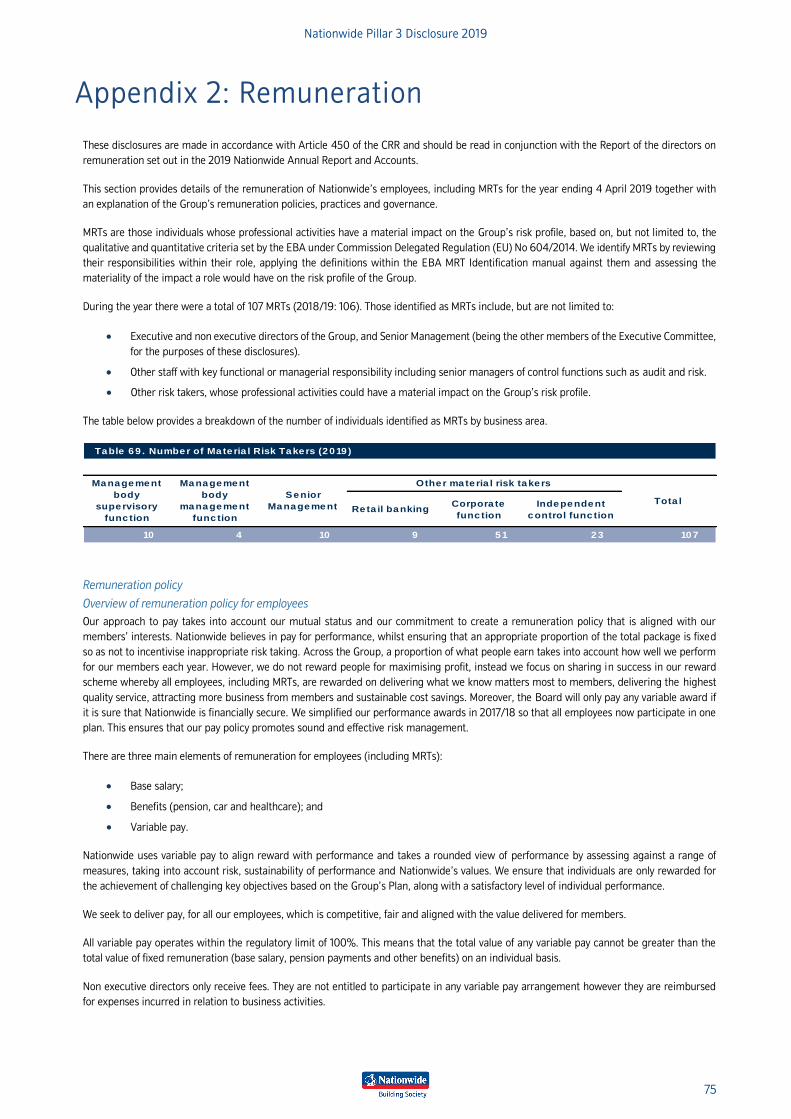
Nationwide Pillar 3 Disclosure 2019
75
Appendix 2: Remuneration
These disclosures are made in accordance with Article 450 of the CRR and should be read in conjunction with the Report of the directors on
remuneration set out in the 2019 Nationwide Annual Report and Accounts.
This section provides details of the remuneration of Nationwide’s employees, including MRTs for the year ending 4 April 2019 together with
an explanation of the Group’s remuneration policies, practices and governance.
MRTs are those individuals whose professional activities have a material impact on the Group’s risk profile, based on, but not limited to, the
qualitative and quantitative criteria set by the EBA under Commission Delegated Regulation (EU) No 604/2014. We identify MRTs by reviewing
their responsibilities within their role, applying the definitions within the EBA MRT Identification manual against them and assessing the
materiality of the impact a role would have on the risk profile of the Group.
During the year there were a total of 107 MRTs (2018/19: 106). Those identified as MRTs include, but are not limited to:
• Executive and non executive directors of the Group, and Senior Management (being the other members of the Executive Committee,
for the purposes of these disclosures).
• Other staff with key functional or managerial responsibility including senior managers of control functions such as audit and risk.
• Other risk takers, whose professional activities could have a material impact on the Group’s risk profile.
The table below provides a breakdown of the number of individuals identified as MRTs by business area.
Table 69 . Number of Ma te ria l Risk Takers (2019 )
Re ta il bankingCorpora te
func tion
Independent
control func tion
10 4 10 9 51 23 107
Management
body
supervisory
func tion
Management
body
management
func tion
Senior
Management
Other mate ria l risk takers
Tota l
Remuneration policy
Overview of remuneration policy for employees
Our approach to pay takes into account our mutual status and our commitment to create a remuneration policy that is aligned with our
members’ interests. Nationwide believes in pay for performance, whilst ensuring that an appropriate proportion of the total package is fixed
so as not to incentivise inappropriate risk taking. Across the Group, a proportion of what people earn takes into account how well we perform
for our members each year. However, we do not reward people for maximising profit, instead we focus on sharing in success in our reward
scheme whereby all employees, including MRTs, are rewarded on delivering what we know matters most to members, delivering the highest
quality service, attracting more business from members and sustainable cost savings. Moreover, the Board will only pay any variable award if
it is sure that Nationwide is financially secure. We simplified our performance awards in 2017/18 so that all employees now participate in one
plan. This ensures that our pay policy promotes sound and effective risk management.
There are three main elements of remuneration for employees (including MRTs):
• Base salary;
• Benefits (pension, car and healthcare); and
• Variable pay.
Nationwide uses variable pay to align reward with performance and takes a rounded view of performance by assessing against a range of
measures, taking into account risk, sustainability of performance and Nationwide’s values. We ensure that individuals are only rewarded for
the achievement of challenging key objectives based on the Group’s Plan, along with a satisfactory level of individual performance.
We seek to deliver pay, for all our employees, which is competitive, fair and aligned with the value delivered for members.
All variable pay operates within the regulatory limit of 100%. This means that the total value of any variable pay cannot be greater than the
total value of fixed remuneration (base salary, pension payments and other benefits) on an individual basis.
Non executive directors only receive fees. They are not entitled to participate in any variable pay arrangement however they are reimbursed
for expenses incurred in relation to business activities.

Nationwide Pillar 3 Disclosure 2019
76
Decision-making process for determining remuneration policy
Nationwide’s Remuneration Committee (the ‘Committee’) is responsible for determining, and agreeing with the Board, the remuneration
strategy, policy and the specific remuneration packages for the Chairman, the executive directors and other members of the Executive
Committee of the Group as well as MRTs.
The Committee also oversees remuneration policy for the wider employee base, with a specific focus on the risks posed by remuneration
policies and practices. The Committee reviewed the Nationwide’s remuneration policies and approaches in 2018/19 and made no material
changes to our approach to MRT remuneration for 2019/20.
Details of the Committee’s composition and activities during 2018/19 can be found in the Report of the directors on remunerat ion set out in
the 2019 Nationwide Annual Report and Accounts and the full terms of reference are available on Nationwide’s website at nationwide.co.uk
Consideration of member views
At recent AGMs we have received a significant majority vote in favour of our remuneration reports. We are also mindful of views expressed by
individual members regarding specific aspects of the policy. When taking decisions on remuneration policy, the Remuneration Committee is
always conscious of the need to ensure executives and our employees are motivated and rewarded to deliver value for our members. In addition,
this year the Committee has received direct feedback from members and considered this as part of its determinations on Senior Management
remuneration.
Design and structure of remuneration
Nationwide distinguishes between fixed pay and variable pay.
Fixed pay
All employees receive salary, or in the case of non executive directors, fees. Salary levels are reviewed at least annually, taking into account
market data, individual skills, experience and performance. Pension and other benefits are provided as part of a competitive reward package.
Fixed pay may also include cash in lieu of pension and other cash allowances, such as location allowance, in accordance with market practice.
These pay elements are categorised as fixed pay as they are based on predetermined criteria, are non-discretionary, are transparent and are
not reduced based on performance.
Non executive directors receive a basic fee, with an additional supplement paid for serving on or chairing a Board Committee or other
responsibilities such as Voice of the Employee. Fees are reviewed annually taking into account practice at other organisations as well as the
time commitment for the role at Nationwide. The Chairman’s fee is reviewed and approved by the Remuneration Committee. The fees paid to
non executive directors are reviewed and approved by the executive directors and by the Chairman.
Variable pay
All employees participate in our Group wide variable pay arrangement which rewards the attainment of challenging strategic and financial
metrics drawn from the Group’s plan. The arrangement is operated on a fully discretionary basis and awards are capped. The key components
of the arrangement include:
• Performance is measured using drivers that are key to us as a building society and which will benefit our members.
• A substantial proportion of payments under the arrangement are deferred over the long-term (other than for individuals who are
not part of our senior population and are not subject to the full Remuneration Code requirements due to the application of
proportionality).
• Where applicable, a portion of both the upfront and deferred award is linked to the value of Nationwide’s CCDS over the relevant
deferral and retention periods.
• Deferred awards are subject to malus and (where applicable) clawback terms.
There are two elements to our variable pay arrangement; one in which all employees, including executive members of the Board and members
of the Executive Committee, participate on the same basis; and a second for a senior population (again, including executive members of the
Board and members of the Executive Committee), that also rewards individual performance. Nationwide’s performance is assessed using the
same equally weighted measures and targets for both elements of the plan.
Three gateways must be passed before any payment is made under the arrangement, based on measures of statutory profit, our capital
strength which is measured by our leverage ratio and conduct risk. If certain thresholds are not met in respect of these gateways, then scale
back may be applied (including reducing awards to zero). The Board must also be satisfied that there are no significant current or future
conduct, reputational, financial, operational risk or other reasons why awards should not be made, taking into account input from the Board
Risk and Audit Committees. For awards made in respect of 2018/19, Nationwide’s performance was assessed against three equally weighted
measures:
Nationwide Pillar 3 Disclosure 2019
77
Cornerstone Measure
Building Thriving Membership Number of committed members
Building Legendary Service FRS customer service satisfaction rating
Built to Last Sustainable cost savings
Details of the measures, targets and performance outcome under the variable pay arrangement can be found in the Report of the directors on
remuneration set out in the 2019 Nationwide Annual Report and Accounts.
To receive an award under either of the two elements of the variable pay arrangement, all employees must meet a satisfactory level of individual
performance, assessed against the delivery of individual goals and individual conduct and behaviours. Awards are scaled back where individuals
are rated as developing. For the most senior population, individual performance is also rewarded, taking into account both the ‘what’ and the
‘how’, with objectives aligned to Nationwide’s strategy, cornerstones and scorecard as well as individual conduct and behaviours. Individual
performance accounts for between 25% to 28% of the overall reward opportunity for these roles.
Control Function pay
The individual performance agreements for all Control Function employees are also linked to delivering the objectives of the Control Function,
with no financial metrics linked to the business areas they control thereby ensuring these individuals are independent from the businesses
they oversee. For our senior population in Control Functions, the majority of the performance pay award is linked to the performance of the
Control Function and their individual performance. In all cases, award levels are set at a level which allows Nationwide to employ qualified and
experienced individuals but does not compromise their objectivity and independence.
Deferral Arrangements
For the senior population, including MRT roles, awards are subject to deferral. The time horizons and level of deferral varies taking into account
seniority, level of remuneration and role.
For executive members of the Board and other PRA/FCA Senior Managers sitting on the Executive Committee, 40% of each individual’s overall
award vests in June 2019 and the remaining 60% is deferred, payable between years three and seven following the date of award. 50% of the
initial payment and 60% of the deferred portion is linked to the performance of Nationwide’s CCDS with distributions paid during the retention
period. These CCDS linked elements are subject to a twelve month retention period and so will be paid to participants, in cash, in the following
June.
For all other directors who serve/have served on the Executive Committee, 40% of each individual’s overall award vests in June 2019 and the
remaining 60% is deferred, payable over five years following the date of award. 50% of the initial payment and 60% of the deferred portion is
linked to the performance of the Nationwide’s CCDS with distributions paid during the retention period. These CCDS linked elements are
subject to a twelve month retention period and so will be paid to participants, in cash, in the following June.
For MRTs who are PRA/FCA Risk Managers and who are subject to the full Remuneration Code requirements, and FCA Senior Managers who
have not served on the Executive Committee, 60% of each individual’s overall award vests in June 2019 and the remaining 40% is deferred,
payable over five years following the date of award. 50% of both the initial payment and 60% of the deferred portion is linked to the
performance of the Nationwide’s CCDS with distributions paid during the retention period. These CCDS linked elements are subject to a twelve
month retention period and so will be paid to participants, in cash, in the following June.
For all other MRTs who are subject to the full Remuneration Code requirements, 60% of each individual’s overall award vests in June 2019 and
the remaining 40% is deferred, payable over three years following the date of award. 50% of both the initial payment and deferred portion is
linked to the performance of Nationwide’s CCDS with distributions paid during the retention period. These CCDS linked elements are subject
to a twelve month retention period and so will be paid to participants in the following June.
For those who are not MRTs, 60% of each individual’s overall award vests in June 2019 and the remaining 40% is deferred, payable over three
years following the date of award. 50% of the deferred portion is linked to the performance of Nationwide’s CCDS with distributions paid during
the retention period. These CCDS linked elements are subject to a twelve month retention period and so will be paid to participants, in cash,
in the following June.
Risk adjustment
Variable pay is subject to risk adjustment, malus and clawback. Our approach to risk adjustment provides for a discretionary assessment of ‘ex
ante’ and ‘ex post’ risk adjustment, based on performance against our risk appetite as set out in Nationwide’s Plan, and taking into account
any risk events during the year from a conduct, reputational, financial or operational perspective. In reaching its determination of an appropriate
level of risk adjustment, the Remuneration Committee considers a range of factors, including evidence from the Audit Committee and BRC.
This includes an assessment of our financial performance provided by the Audit Committee, an assessment of both current and future risk
issues provided by the BRC and any conduct issues on an individual basis provided by the Leader of People & Culture.
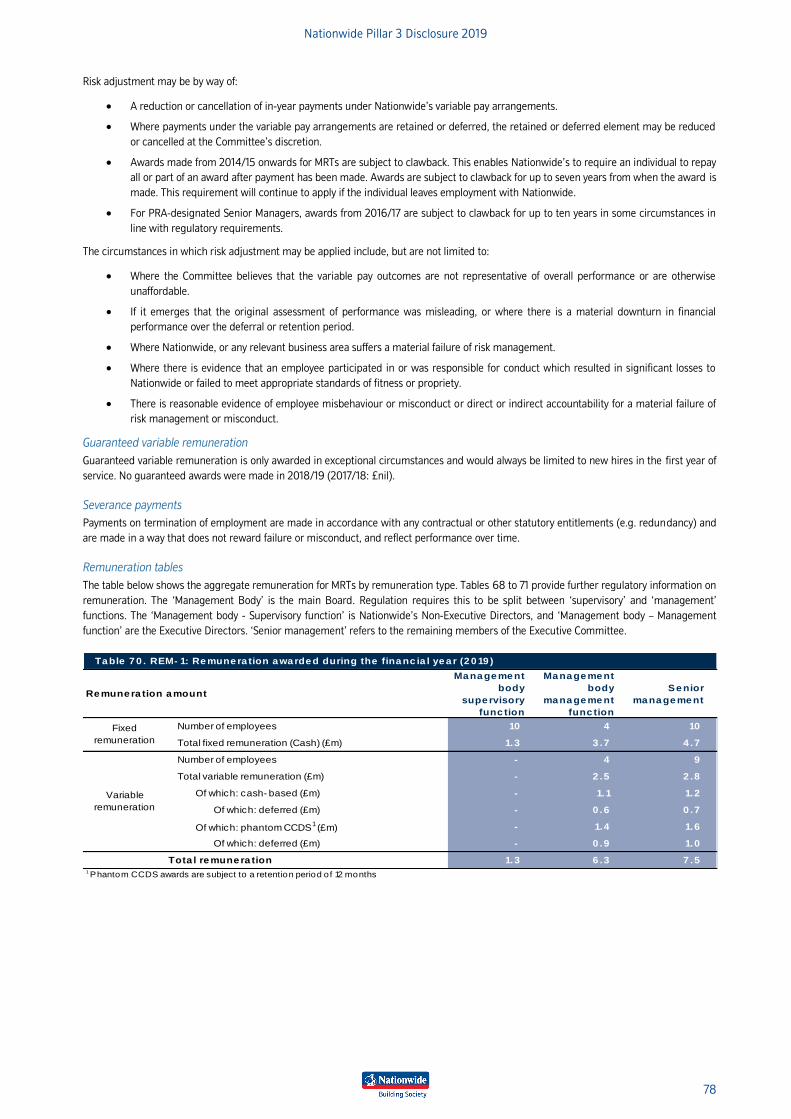
Nationwide Pillar 3 Disclosure 2019
78
Risk adjustment may be by way of:
• A reduction or cancellation of in-year payments under Nationwide’s variable pay arrangements.
• Where payments under the variable pay arrangements are retained or deferred, the retained or deferred element may be reduced
or cancelled at the Committee’s discretion.
• Awards made from 2014/15 onwards for MRTs are subject to clawback. This enables Nationwide’s to require an individual to repay
all or part of an award after payment has been made. Awards are subject to clawback for up to seven years from when the award is
made. This requirement will continue to apply if the individual leaves employment with Nationwide.
• For PRA-designated Senior Managers, awards from 2016/17 are subject to clawback for up to ten years in some circumstances in
line with regulatory requirements.
The circumstances in which risk adjustment may be applied include, but are not limited to:
• Where the Committee believes that the variable pay outcomes are not representative of overall performance or are otherwise
unaffordable.
• If it emerges that the original assessment of performance was misleading, or where there is a material downturn in financial
performance over the deferral or retention period.
• Where Nationwide, or any relevant business area suffers a material failure of risk management.
• Where there is evidence that an employee participated in or was responsible for conduct which resulted in significant losses to
Nationwide or failed to meet appropriate standards of fitness or propriety.
• There is reasonable evidence of employee misbehaviour or misconduct or direct or indirect accountability for a material failure of
risk management or misconduct.
Guaranteed variable remuneration
Guaranteed variable remuneration is only awarded in exceptional circumstances and would always be limited to new hires in the first year of
service. No guaranteed awards were made in 2018/19 (2017/18: £nil).
Severance payments
Payments on termination of employment are made in accordance with any contractual or other statutory entitlements (e.g. redundancy) and
are made in a way that does not reward failure or misconduct, and reflect performance over time.
Remuneration tables
The table below shows the aggregate remuneration for MRTs by remuneration type. Tables 68 to 71 provide further regulatory information on
remuneration. The ‘Management Body’ is the main Board. Regulation requires this to be split between ‘supervisory’ and ‘management’
functions. The ‘Management body - Supervisory function’ is Nationwide’s Non-Executive Directors, and ‘Management body – Management
function’ are the Executive Directors. ‘Senior management’ refers to the remaining members of the Executive Committee.
Ta ble 7 0 . REM- 1: Re mune ra tion a wa rde d during the fina nc ia l ye a r (2 0 19 )
Ma na ge me nt
body
supe rvisory
func tion
Ma na ge me nt
body
ma na ge me nt
func tion
Se nior
ma na ge me nt
Number of employees 10 4 10
Total fixed remuneration (Cash) (£m) 1.3 3 .7 4 .7
Number of employees - 4 9
Total variable remuneration (£m) - 2 .5 2 .8
Of which: cash- based (£m) - 1.1 1.2
Of which: deferred (£m) - 0 .6 0 .7
Of which: phantom CCDS1 (£m) - 1.4 1.6
Of which: deferred (£m) - 0 .9 1.0
Tota l re mune ra tion 1.3 6 .3 7 .51 Phantom CCDS awards are subject to a retention period of 12 months
Re mune ra tion a mount
Fixed
remuneration
Variable
remuneration
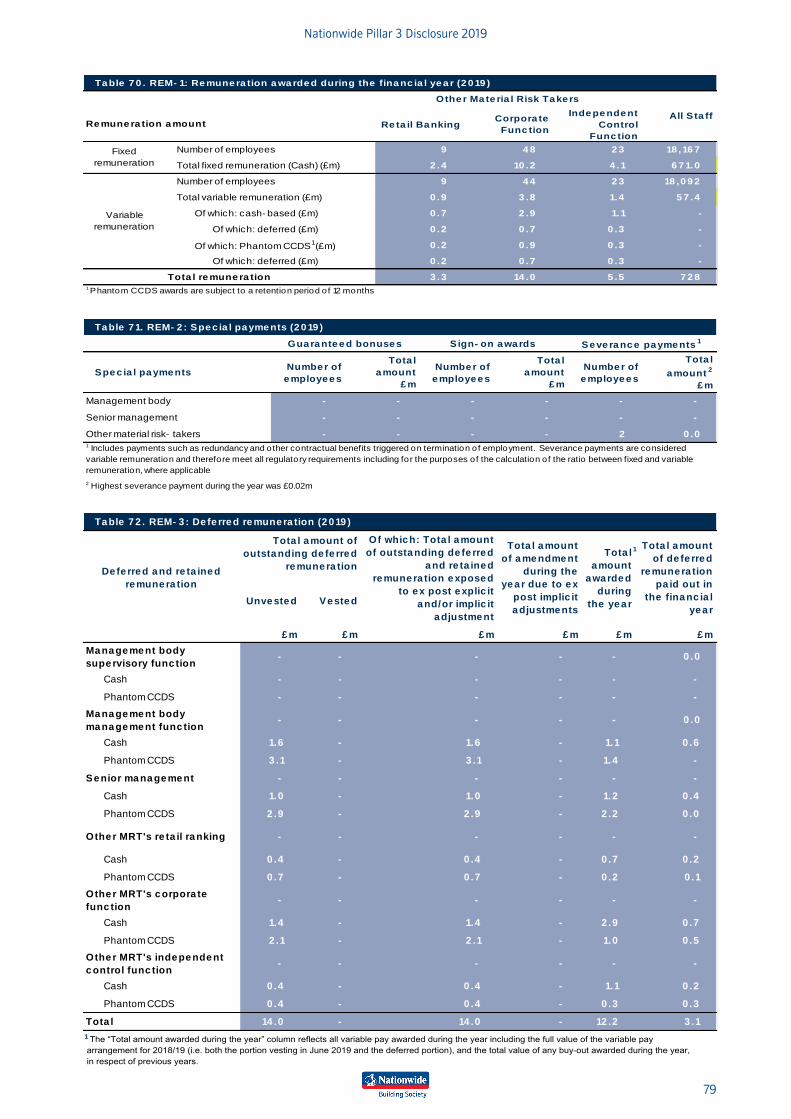
Nationwide Pillar 3 Disclosure 2019
79
Ta ble 7 0 . REM- 1: Re mune ra tion a wa rde d during the fina nc ia l ye a r (2 0 19 )
Re ta il Ba nkingCorpora te
Func tion
Inde pe nde nt
Control
Func tion
Number of employees 9 4 8 2 3 18 ,16 7
Total fixed remuneration (Cash) (£m) 2 .4 10 .2 4 .1 6 7 1.0
Number of employees 9 4 4 2 3 18 ,0 9 2
Total variable remuneration (£m) 0 .9 3 .8 1.4 5 7 .4
Of which: cash- based (£m) 0 .7 2 .9 1.1 -
Of which: deferred (£m) 0 .2 0 .7 0 .3 -
Of which: Phantom CCDS1 (£m) 0 .2 0 .9 0 .3 -
Of which: deferred (£m) 0 .2 0 .7 0 .3 -
Tota l re mune ra tion 3 .3 14 .0 5 .5 7 2 81 Phantom CCDS awards are subject to a retention period of 12 months
Re mune ra tion a mount
Fixed
remuneration
Variable
remuneration
All S ta ff
Othe r Ma te ria l Risk Ta ke rs
Table 71. REM- 2 : Spec ia l payments (2019 )
Spec ia l paymentsNumber of
employees
Tota l
amount
£ m
Number of
employees
Tota l
amount
£ m
Number of
employees
Tota l
amount2
£ m
Management body - - - - - -
Senior management - - - - - -
Other material risk- takers - - - - 2 0 .0
2 Highest severance payment during the year was £0.02m
1 Includes payments such as redundancy and other contractual benefits triggered on termination of employment. Severance payments are considered
variable remuneration and therefore meet all regulatory requirements including for the purposes of the calculation of the ratio between fixed and variable
remuneration, where applicable
Severance payments1Sign- on awardsGuaranteed bonuses
Ta ble 7 2 . REM- 3 : De fe rre d re mune ra tion (2 0 19 )
Unve ste d Ve ste d
£ m £ m £ m £ m £ m £ m
Ma na ge me nt body
supe rvisory func tion- - - - - 0 .0
Cash - - - - - -
Phantom CCDS - - - - - -
Ma na ge me nt body
ma na ge me nt func tion- - - - - 0 .0
Cash 1.6 - 1.6 - 1.1 0 .6
Phantom CCDS 3 .1 - 3 .1 - 1.4 -
Se nior ma na ge me nt - - - - - -
Cash 1.0 - 1.0 - 1.2 0 .4
Phantom CCDS 2 .9 - 2 .9 - 2 .2 0 .0
Othe r MRT's re ta il ra nking - - - - - -
Cash 0 .4 - 0 .4 - 0 .7 0 .2
Phantom CCDS 0 .7 - 0 .7 - 0 .2 0 .1
Othe r MRT's c orpora te
func tion- - - - - -
Cash 1.4 - 1.4 - 2 .9 0 .7
Phantom CCDS 2 .1 - 2 .1 - 1.0 0 .5
Othe r MRT's inde pe nde nt
c ontrol func tion- - - - - -
Cash 0 .4 - 0 .4 - 1.1 0 .2
Phantom CCDS 0 .4 - 0 .4 - 0 .3 0 .3
Tota l 14 .0 - 14 .0 - 12 .2 3 .1
De fe rre d a nd re ta ine d
re mune ra tion
Tota l a mount of
outsta nding de fe rre d
re mune ra tion
Of whic h: Tota l a mount
of outsta nding de fe rre d
a nd re ta ine d
re mune ra tion e xpose d
to e x post e xplic it
a nd/or implic it
a djustme nt
Tota l a mount
of a me ndme nt
during the
ye a r due to e x
post implic it
a djustme nts
Tota l
a mount
a wa rde d
during
the ye a r
Tota l a mount
of de fe rre d
re mune ra tion
pa id out in
the fina nc ia l
ye a r
The “Total amount awarded during the year” column reflects all variable pay awarded during the year including the full value of the variable pay arrangement for 2018/19 (i.e. both the portion vesting in June 2019 and the deferred portion), and the total value of any buy-out awarded during the year, in respect of previous years.
1
1
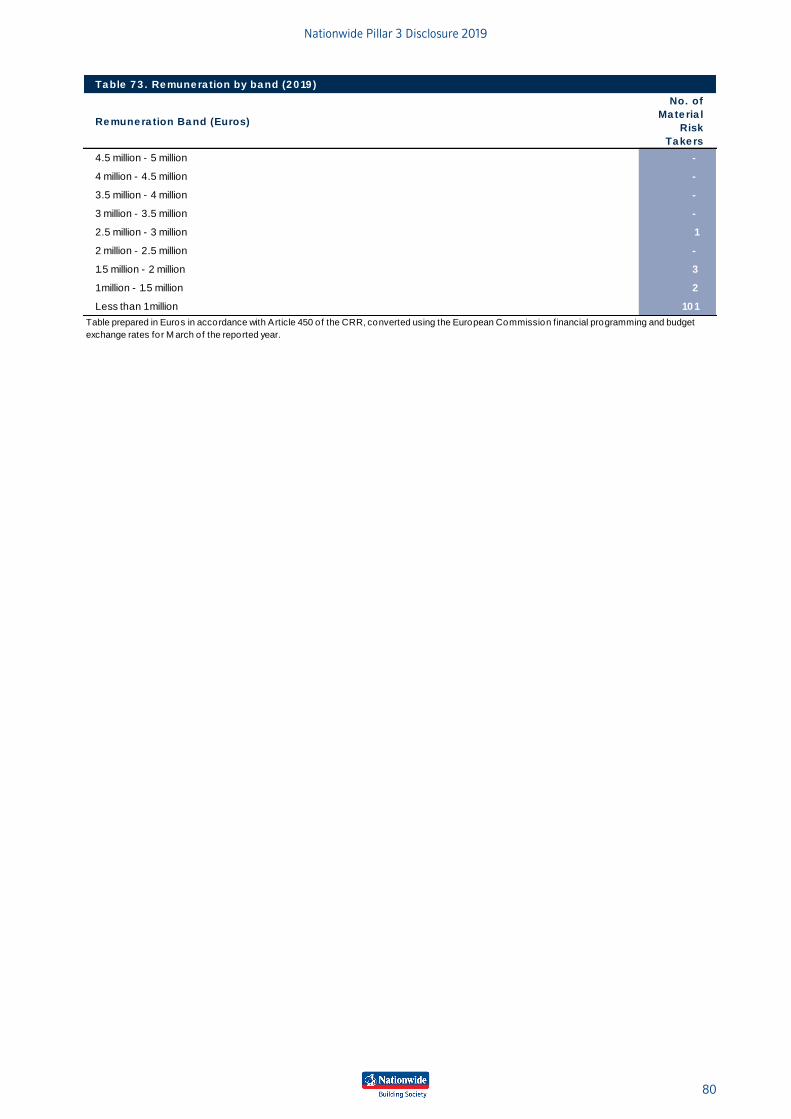
Nationwide Pillar 3 Disclosure 2019
80
Ta ble 7 3 . Re mune ra tion by ba nd (2 0 19 )
Re mune ra tion Ba nd (Euros)
No. of
Ma te ria l
Risk
Ta ke rs
4.5 million - 5 million -
4 million - 4.5 million -
3.5 million - 4 million -
3 million - 3.5 million -
2.5 million - 3 million 1
2 million - 2.5 million -
1.5 million - 2 million 3
1 million - 1.5 million 2
Less than 1 million 10 1
Table prepared in Euros in accordance with Article 450 of the CRR, converted using the European Commission financial programming and budget
exchange rates for M arch of the reported year.
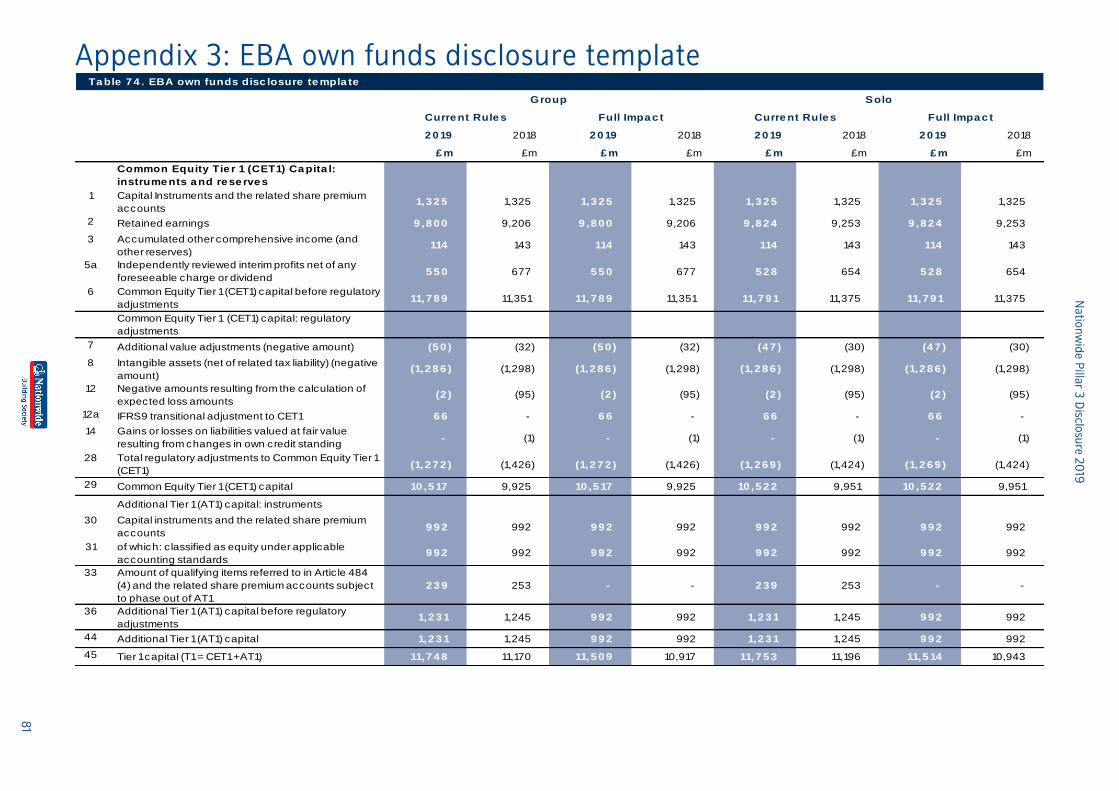
Na
tion
wid
e P
illar 3
Disclo
sure
20
19
81
Appendix 3: EBA own funds disclosure template Ta ble 7 4 . EBA own funds disc losure te mpla te
2 0 19 2018 2 0 19 2018 2 0 19 2018 2 0 19 2018
£ m £m £ m £m £ m £m £ m £m
Common Equity Tie r 1 (CET1) Ca pita l:
instrume nts a nd re se rve s
1 Capital Instruments and the related share premium
accounts1,3 2 5 1,325 1,3 2 5 1,325 1,3 2 5 1,325 1,3 2 5 1,325
2 Retained earnings 9 ,8 0 0 9,206 9 ,8 0 0 9,206 9 ,8 2 4 9,253 9 ,8 2 4 9,253
3 Accumulated other comprehensive income (and
other reserves)114 143 114 143 114 143 114 143
5a Independently reviewed interim profits net of any
foreseeable charge or dividend5 5 0 677 5 5 0 677 5 2 8 654 5 2 8 654
6 Common Equity Tier 1 (CET1) capital before regulatory
adjustments11,7 8 9 11,351 11,7 8 9 11,351 11,7 9 1 11,375 11,7 9 1 11,375
Common Equity Tier 1 (CET1) capital: regulatory
adjustments
7 Additional value adjustments (negative amount) (5 0 ) (32) (5 0 ) (32) (4 7 ) (30) (4 7 ) (30)
8 Intangible assets (net of related tax liability) (negative
amount)(1,2 8 6 ) (1,298) (1,2 8 6 ) (1,298) (1,2 8 6 ) (1,298) (1,2 8 6 ) (1,298)
12 Negative amounts resulting from the calculation of
expected loss amounts(2 ) (95) (2 ) (95) (2 ) (95) (2 ) (95)
12a IFRS9 transitional adjustment to CET1 6 6 - 6 6 - 6 6 - 6 6 -
14 Gains or losses on liabilities valued at fair value
resulting from changes in own credit standing- (1) - (1) - (1) - (1)
28 Total regulatory adjustments to Common Equity Tier 1
(CET1)(1,2 7 2 ) (1,426) (1,2 7 2 ) (1,426) (1,2 6 9 ) (1,424) (1,2 6 9 ) (1,424)
29 Common Equity Tier 1 (CET1) capital 10 ,5 17 9,925 10 ,5 17 9,925 10 ,5 2 2 9,951 10 ,5 2 2 9,951
Additional Tier 1 (AT1) capital: instruments
30 Capital instruments and the related share premium
accounts9 9 2 992 9 9 2 992 9 9 2 992 9 9 2 992
31 of which: c lassified as equity under applicable
accounting standards9 9 2 992 9 9 2 992 9 9 2 992 9 9 2 992
33 Amount of qualifying items referred to in Artic le 484
(4) and the related share premium accounts subject
to phase out of AT1
2 3 9 253 - - 2 3 9 253 - -
36 Additional Tier 1 (AT1) capital before regulatory
adjustments1,2 3 1 1,245 9 9 2 992 1,2 3 1 1,245 9 9 2 992
44 Additional Tier 1 (AT1) capital 1,2 3 1 1,245 9 9 2 992 1,2 3 1 1,245 9 9 2 992
45 Tier 1 capital (T1 = CET1 +AT1) 11,7 4 8 11,170 11,5 0 9 10,917 11,7 5 3 11,196 11,5 14 10,943
Curre nt Rule s Full Impa c t
Group Solo
Curre nt Rule s Full Impa c t
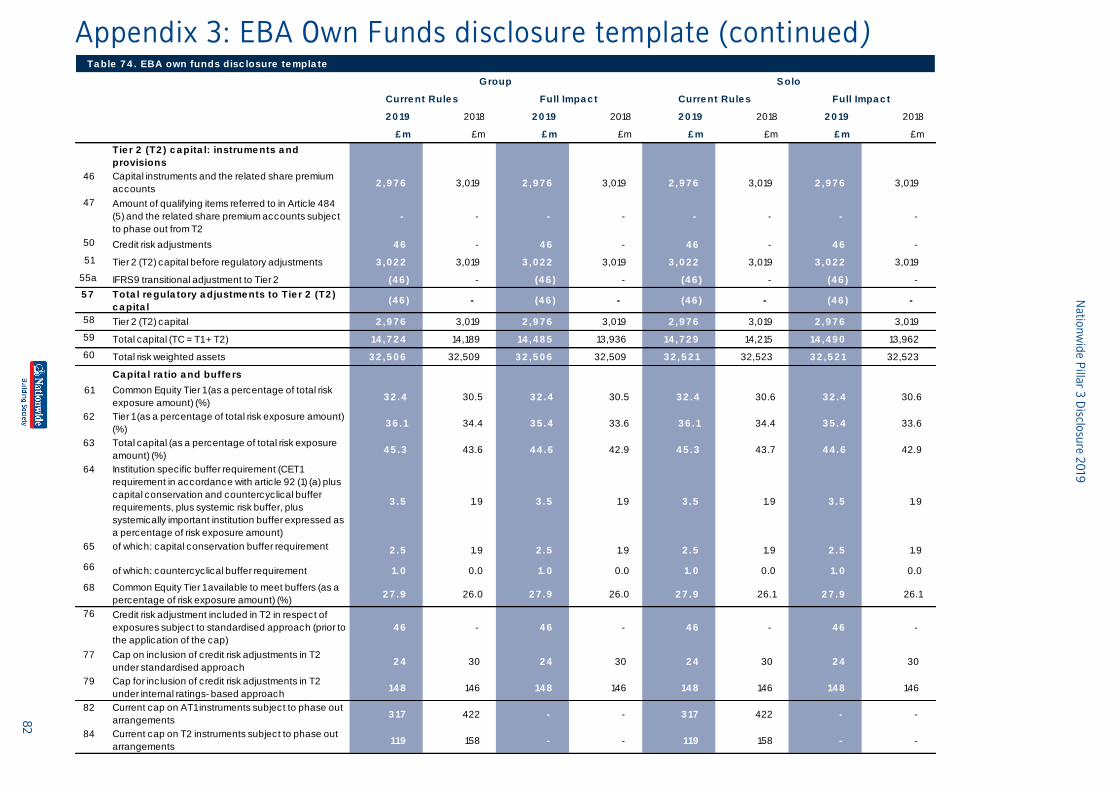
Na
tion
wid
e P
illar 3
Disclo
sure
20
19
82
Appendix 3: EBA Own Funds disclosure template (continued )Ta ble 7 4 . EBA own funds disc losure te mpla te
2 0 19 2018 2 0 19 2018 2 0 19 2018 2 0 19 2018
£ m £m £ m £m £ m £m £ m £m
Tie r 2 (T2 ) c a pita l: instrume nts a nd
provisions
46 Capital instruments and the related share premium
accountsT2 2 ,9 7 6 3,019 2 ,9 7 6 3,019 2 ,9 7 6 3,019 2 ,9 7 6 3,019
47 Amount of qualifying items referred to in Artic le 484
(5) and the related share premium accounts subject
to phase out from T2
- - - - - - - -
50 Credit risk adjustments 4 6 - 4 6 - 4 6 - 4 6 -
51 Tier 2 (T2) capital before regulatory adjustments 3 ,0 2 2 3,019 3 ,0 2 2 3,019 3 ,0 2 2 3,019 3 ,0 2 2 3,019
55a IFRS9 transitional adjustment to Tier 2 (4 6 ) - (4 6 ) - (4 6 ) - (4 6 ) -
5 7 Tota l re gula tory a djustme nts to Tie r 2 (T2 )
c a pita l(4 6 ) - (4 6 ) - (4 6 ) - (4 6 ) -
58 Tier 2 (T2) capital 2 ,9 7 6 3,019 2 ,9 7 6 3,019 2 ,9 7 6 3,019 2 ,9 7 6 3,019
59 Total capital (TC = T1 + T2) 14 ,7 2 4 14,189 14 ,4 8 5 13,936 14 ,7 2 9 14,215 14 ,4 9 0 13,962
60 Total risk weighted assets 3 2 ,5 0 6 32,509 3 2 ,5 0 6 32,509 3 2 ,5 2 1 32,523 3 2 ,5 2 1 32,523
Ca pita l ra tio a nd buffe rs
61 Common Equity Tier 1 (as a percentage of total risk
exposure amount) (%)3 2 .4 30.5 3 2 .4 30.5 3 2 .4 30.6 3 2 .4 30.6
62 Tier 1 (as a percentage of total risk exposure amount)
(%)3 6 .1 34.4 3 5 .4 33.6 3 6 .1 34.4 3 5 .4 33.6
63 Total capital (as a percentage of total risk exposure
amount) (%)4 5 .3 43.6 4 4 .6 42.9 4 5 .3 43.7 4 4 .6 42.9
64 Institution specific buffer requirement (CET1
requirement in accordance with artic le 92 (1) (a) plus
capital conservation and countercyclical buffer
requirements, plus systemic risk buffer, plus
systemically important institution buffer expressed as
a percentage of risk exposure amount)
3 .5 1.9 3 .5 1.9 3 .5 1.9 3 .5 1.9
65 of which: capital conservation buffer requirement 2 .5 1.9 2 .5 1.9 2 .5 1.9 2 .5 1.9
66 of which: countercyclical buffer requirement 1.0 0.0 1.0 0.0 1.0 0.0 1.0 0.0
68 Common Equity Tier 1 available to meet buffers (as a
percentage of risk exposure amount) (%)2 7 .9 26.0 2 7 .9 26.0 2 7 .9 26.1 2 7 .9 26.1
76 Credit risk adjustment included in T2 in respect of
exposures subject to standardised approach (prior to
the application of the cap)
4 6 - 4 6 - 4 6 - 4 6 -
77 Cap on inclusion of credit risk adjustments in T2
under standardised approach2 4 30 2 4 30 2 4 30 2 4 30
79 Cap for inclusion of credit risk adjustments in T2
under internal ratings- based approach14 8 146 14 8 146 14 8 146 14 8 146
82 Current cap on AT1 instruments subject to phase out
arrangements3 17 422 - - 3 17 422 - -
84 Current cap on T2 instruments subject to phase out
arrangements119 158 - - 119 158 - -
Group Solo
Curre nt Rule s Full Impa c t Curre nt Rule s Full Impa c t
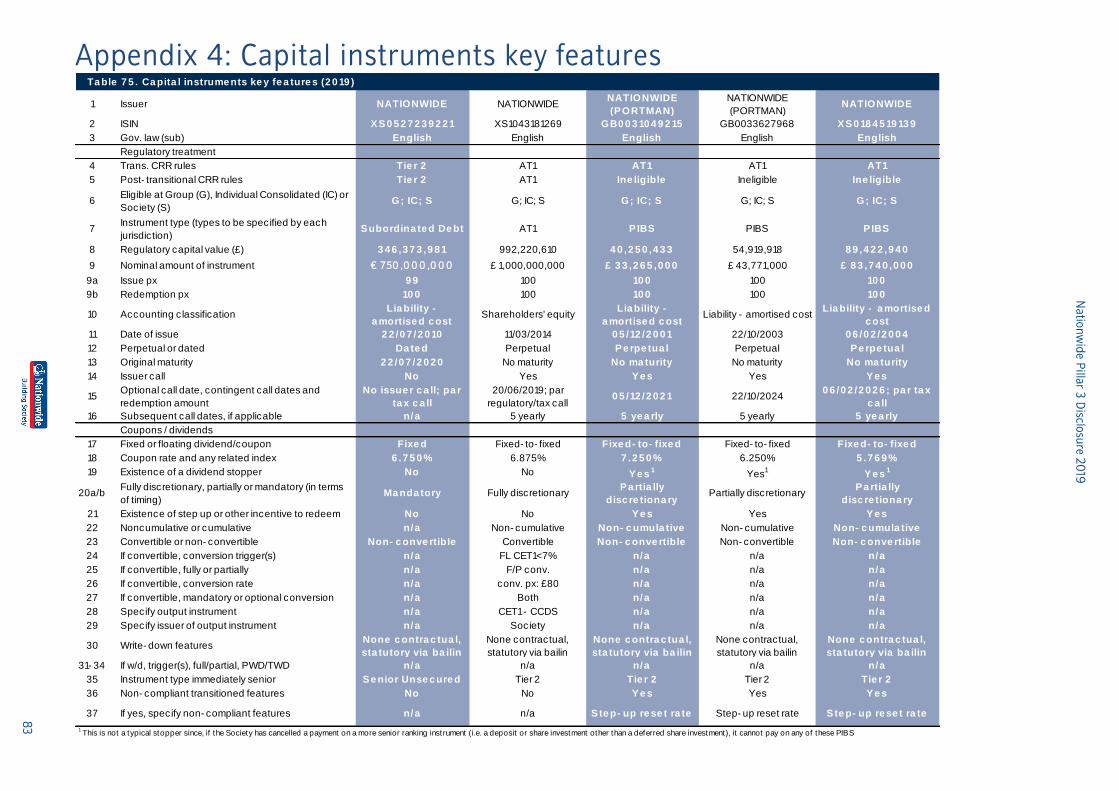
Na
tion
wid
e P
illar 3
Disclo
sure
20
19
83
Appendix 4: Capital instruments key features Ta ble 7 5 . Ca pita l instrume nts ke y fe a ture s (2 0 19 )
1 Issuer NATIONWIDE NATIONWIDENATIONWIDE
(PORTMAN)
NATIONWIDE
(PORTMAN)NATIONWIDE
2 ISIN XS0 5 2 7 2 3 9 2 2 1 XS1043181269 GB0 0 3 10 4 9 2 15 GB0033627968 XS0 18 4 5 19 13 9
3 Gov. law (sub) English English English English English
Regulatory treatment
4 Trans. CRR rules Tie r 2 AT1 AT1 AT1 AT1
5 Post- transitional CRR rules Tie r 2 AT1 Ine ligible Ineligible Ine ligible
6Eligible at Group (G), Individual Consolidated (IC) or
Society (S)G; IC; S G; IC; S G; IC; S G; IC; S G; IC; S
7Instrument type (types to be specified by each
jurisdiction)Subordina te d De bt AT1 PIBS PIBS PIBS
8 Regulatory capital value (£) 3 4 6 ,3 7 3 ,9 8 1 992,220,610 4 0 ,2 5 0 ,4 3 3 54,919,918 8 9 ,4 2 2 ,9 4 0
9 Nominal amount of instrument € 7 50 ,0 0 0 ,0 0 0 £ 1,000,000,000 £ 3 3 ,2 6 5 ,0 0 0 £ 43,771,000 £ 8 3 ,7 4 0 ,0 0 0
9a Issue px 9 9 100 10 0 100 10 0
9b Redemption px 10 0 100 10 0 100 10 0
10 Accounting classificationLia bility -
a mortise d c ostShareholders' equity
Lia bility -
a mortise d c ostLiability - amortised cost
Lia bility - a mortise d
c ost
11 Date of issue 2 2 /0 7 /2 0 10 11/03/2014 0 5 /12 /2 0 0 1 22/10/2003 0 6 /0 2 /2 0 0 4
12 Perpetual or dated Da te d Perpetual Pe rpe tua l Perpetual Pe rpe tua l
13 Original maturity 2 2 /0 7 /2 0 2 0 No maturity No ma turity No maturity No ma turity
14 Issuer call No Yes Ye s Yes Ye s
15Optional call date, contingent call dates and
redemption amount
No issue r c a ll; pa r
ta x c a ll
20/06/2019; par
regulatory/tax call0 5 /12 /2 0 2 1 22/10/2024
0 6 /0 2 /2 0 2 6 ; pa r ta x
c a ll
16 Subsequent call dates, if applicable n/a 5 yearly 5 ye a rly 5 yearly 5 ye a rly
Coupons / dividends
17 Fixed or floating dividend/coupon Fixe d Fixed- to- fixed Fixe d- to- fixe d Fixed- to- fixed Fixe d- to- fixe d
18 Coupon rate and any related index 6 .7 5 0 % 6.875% 7 .2 5 0 % 6.250% 5 .7 6 9 %
19 Existence of a dividend stopper No No Ye s1
Yes1
Ye s1
20a/bFully discretionary, partially or mandatory (in terms
of timing)Ma nda tory Fully discretionary
Pa rtia lly
disc re tiona ryPartially discretionary
Pa rtia lly
disc re tiona ry
21 Existence of step up or other incentive to redeem No No Ye s Yes Ye s
22 Noncumulative or cumulative n/a Non- cumulative Non- c umula tive Non- cumulative Non- c umula tive
23 Convertible or non- convertible Non- c onve rtible Convertible Non- c onve rtible Non- convertible Non- c onve rtible
24 If convertible, conversion trigger(s) n/a FL CET1<7% n/a n/a n/a
25 If convertible, fully or partially n/a F/P conv. n/a n/a n/a
26 If convertible, conversion rate n/a conv. px: £80 n/a n/a n/a
27 If convertible, mandatory or optional conversion n/a Both n/a n/a n/a
28 Specify output instrument n/a CET1 - CCDS n/a n/a n/a
29 Specify issuer of output instrument n/a Society n/a n/a n/a
30 Write- down featuresNone c ontra c tua l,
sta tutory via ba ilin
None contractual,
statutory via bailin
None c ontra c tua l,
sta tutory via ba ilin
None contractual,
statutory via bailin
None c ontra c tua l,
sta tutory via ba ilin
31- 34 If w/d, trigger(s), full/partial, PWD/TWD n/a n/a n/a n/a n/a
35 Instrument type immediately senior Se nior Unse c ure d Tier 2 Tie r 2 Tier 2 Tie r 2
36 Non- compliant transitioned features No No Ye s Yes Ye s
37 If yes, specify non- compliant features n/a n/a Ste p- up re se t ra te Step- up reset rate Ste p- up re se t ra te
1 This is not a typical stopper since, if the Society has cancelled a payment on a more senior ranking instrument (i.e. a deposit or share investment other than a deferred share investment), it cannot pay on any of these PIBS
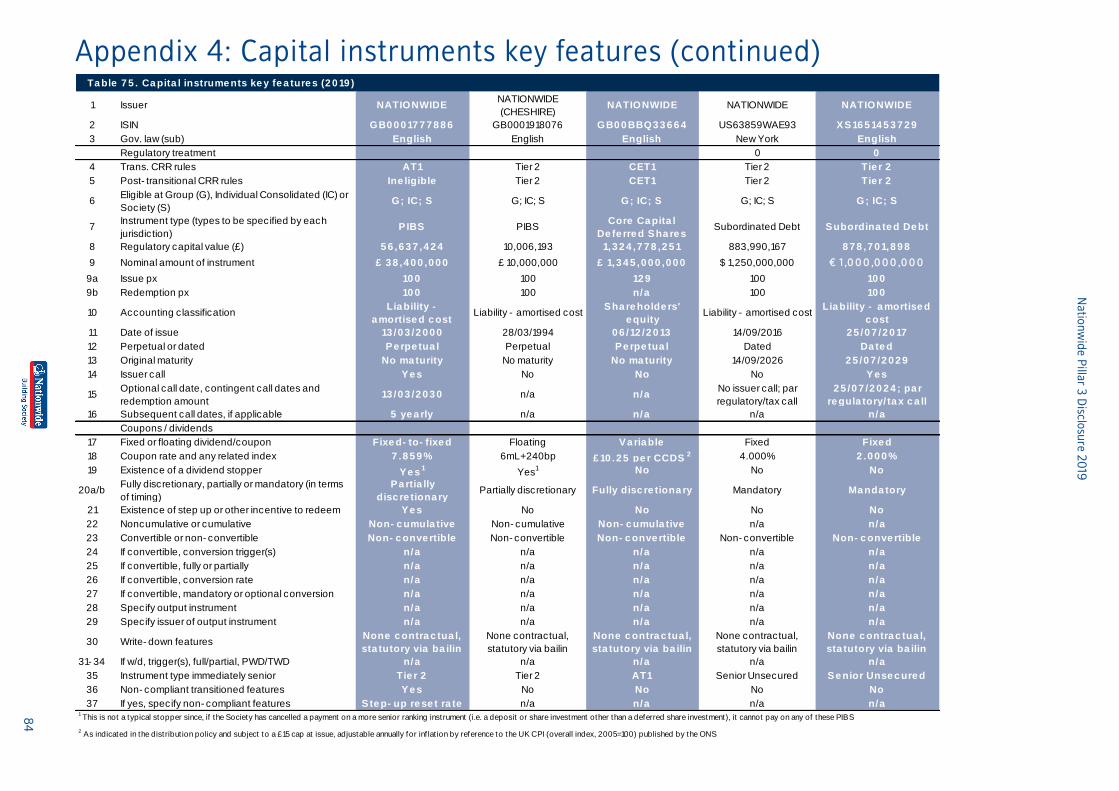
Na
tion
wid
e P
illar 3
Disclo
sure
20
19
84
Appendix 4: Capital instruments key features (continued) Ta ble 7 5 . Ca pita l instrume nts ke y fe a ture s (2 0 19 )
1 Issuer NATIONWIDENATIONWIDE
(CHESHIRE)NATIONWIDE NATIONWIDE NATIONWIDE
2 ISIN GB0 0 0 17 7 7 8 8 6 GB0001918076 GB0 0 BBQ3 3 6 6 4 US63859WAE93 XS16 5 14 5 3 7 2 9
3 Gov. law (sub) English English English New York English
Regulatory treatment 0 0
4 Trans. CRR rules AT1 Tier 2 CET1 Tier 2 Tie r 2
5 Post- transitional CRR rules Ine ligible Tier 2 CET1 Tier 2 Tie r 2
6Eligible at Group (G), Individual Consolidated (IC) or
Society (S)G; IC; S G; IC; S G; IC; S G; IC; S G; IC; S
7Instrument type (types to be specified by each
jurisdiction)PIBS PIBS
Core Ca pita l
De fe rre d Sha re sSubordinated Debt Subordina te d De bt
8 Regulatory capital value (£) 5 6 ,6 3 7 ,4 2 4 10,006,193 1,3 2 4 ,7 7 8 ,2 5 1 883,990,167 8 7 8 ,7 0 1,8 9 8
9 Nominal amount of instrument £ 3 8 ,4 0 0 ,0 0 0 £ 10,000,000 £ 1,3 4 5 ,0 0 0 ,0 0 0 $ 1,250,000,000 € 1 ,0 0 0 ,0 0 0 ,0 0 0
9a Issue px 10 0 100 12 9 100 10 0
9b Redemption px 10 0 100 n/a 100 10 0
10 Accounting classificationLia bility -
a mortise d c ostLiability - amortised cost
Sha re holde rs'
e quityLiability - amortised cost
Lia bility - a mortise d
c ost
11 Date of issue 13 /0 3 /2 0 0 0 28/03/1994 0 6 /12 /2 0 13 14/09/2016 2 5 /0 7 /2 0 17
12 Perpetual or dated Pe rpe tua l Perpetual Pe rpe tua l Dated Da te d
13 Original maturity No ma turity No maturity No ma turity 14/09/2026 2 5 /0 7 /2 0 2 9
14 Issuer call Ye s No No No Ye s
15Optional call date, contingent call dates and
redemption amount13 /0 3 /2 0 3 0 n/a n/a
No issuer call; par
regulatory/tax call
2 5 /0 7 /2 0 2 4 ; pa r
re gula tory/ ta x c a ll
16 Subsequent call dates, if applicable 5 ye a rly n/a n/a n/a n/a
Coupons / dividends
17 Fixed or floating dividend/coupon Fixe d- to- fixe d Floating Va ria ble Fixed Fixe d
18 Coupon rate and any related index 7 .8 5 9 % 6mL+240bp £ 10 .2 5 pe r CCDS2 4.000% 2 .0 0 0 %
19 Existence of a dividend stopper Ye s1
Yes1 No No No
20a/bFully discretionary, partially or mandatory (in terms
of timing)
Pa rtia lly
disc re tiona ryPartially discretionary Fully disc re tiona ry Mandatory Ma nda tory
21 Existence of step up or other incentive to redeem Ye s No No No No
22 Noncumulative or cumulative Non- c umula tive Non- cumulative Non- c umula tive n/a n/a
23 Convertible or non- convertible Non- c onve rtible Non- convertible Non- c onve rtible Non- convertible Non- c onve rtible
24 If convertible, conversion trigger(s) n/a n/a n/a n/a n/a
25 If convertible, fully or partially n/a n/a n/a n/a n/a
26 If convertible, conversion rate n/a n/a n/a n/a n/a
27 If convertible, mandatory or optional conversion n/a n/a n/a n/a n/a
28 Specify output instrument n/a n/a n/a n/a n/a
29 Specify issuer of output instrument n/a n/a n/a n/a n/a
30 Write- down featuresNone c ontra c tua l,
sta tutory via ba ilin
None contractual,
statutory via bailin
None c ontra c tua l,
sta tutory via ba ilin
None contractual,
statutory via bailin
None c ontra c tua l,
sta tutory via ba ilin
31- 34 If w/d, trigger(s), full/partial, PWD/TWD n/a n/a n/a n/a n/a
35 Instrument type immediately senior Tie r 2 Tier 2 AT1 Senior Unsecured Se nior Unse c ure d
36 Non- compliant transitioned features Ye s No No No No
37 If yes, specify non- compliant features Ste p- up re se t ra te n/a n/a n/a n/a
2 As indicated in the distribut ion policy and subject to a £15 cap at issue, adjustable annually for inf lat ion by reference to the UK CPI (overall index, 2005=100) published by the ONS
1 This is not a typical stopper since, if the Society has cancelled a payment on a more senior ranking instrument (i.e. a deposit or share investment other than a deferred share investment), it cannot pay on any of these PIBS
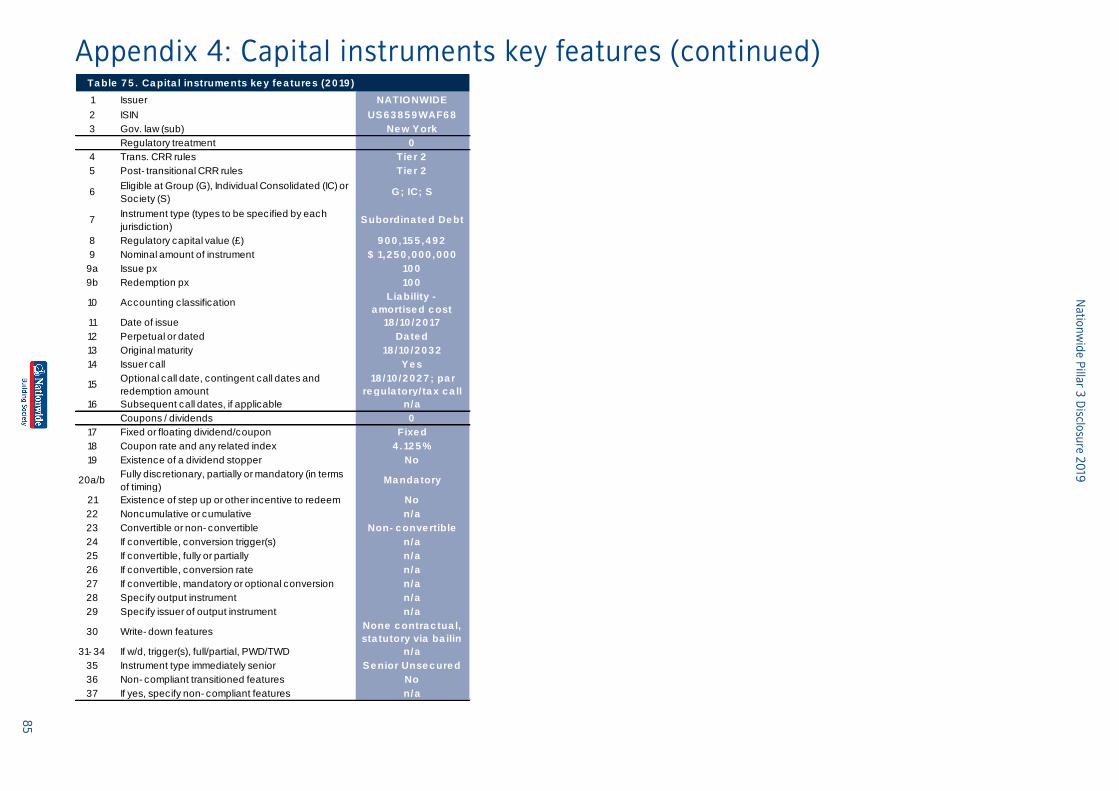
Na
tion
wid
e P
illar 3
Disclo
sure
20
19
85
Appendix 4: Capital instruments key features (continued)Ta ble 7 5 . Ca pita l instrume nts ke y fe a ture s (2 0 19 )
1 Issuer NATIONWIDE
2 ISIN US6 3 8 5 9 WAF6 8
3 Gov. law (sub) Ne w York
Regulatory treatment 0
4 Trans. CRR rules Tie r 2
5 Post- transitional CRR rules Tie r 2
6Eligible at Group (G), Individual Consolidated (IC) or
Society (S)G; IC; S
7Instrument type (types to be specified by each
jurisdiction)Subordina te d De bt
8 Regulatory capital value (£) 9 0 0 ,15 5 ,4 9 2
9 Nominal amount of instrument $ 1,2 5 0 ,0 0 0 ,0 0 0
9a Issue px 10 0
9b Redemption px 10 0
10 Accounting classificationLia bility -
a mortise d c ost
11 Date of issue 18 /10 /2 0 17
12 Perpetual or dated Da te d
13 Original maturity 18 /10 /2 0 3 2
14 Issuer call Ye s
15Optional call date, contingent call dates and
redemption amount
18 /10 /2 0 2 7 ; pa r
re gula tory/ ta x c a ll
16 Subsequent call dates, if applicable n/a
Coupons / dividends 0
17 Fixed or floating dividend/coupon Fixe d
18 Coupon rate and any related index 4 .12 5 %
19 Existence of a dividend stopper No
20a/bFully discretionary, partially or mandatory (in terms
of timing)Ma nda tory
21 Existence of step up or other incentive to redeem No
22 Noncumulative or cumulative n/a
23 Convertible or non- convertible Non- c onve rtible
24 If convertible, conversion trigger(s) n/a
25 If convertible, fully or partially n/a
26 If convertible, conversion rate n/a
27 If convertible, mandatory or optional conversion n/a
28 Specify output instrument n/a
29 Specify issuer of output instrument n/a
30 Write- down featuresNone c ontra c tua l,
sta tutory via ba ilin
31- 34 If w/d, trigger(s), full/partial, PWD/TWD n/a
35 Instrument type immediately senior Se nior Unse c ure d
36 Non- compliant transitioned features No
37 If yes, specify non- compliant features n/a
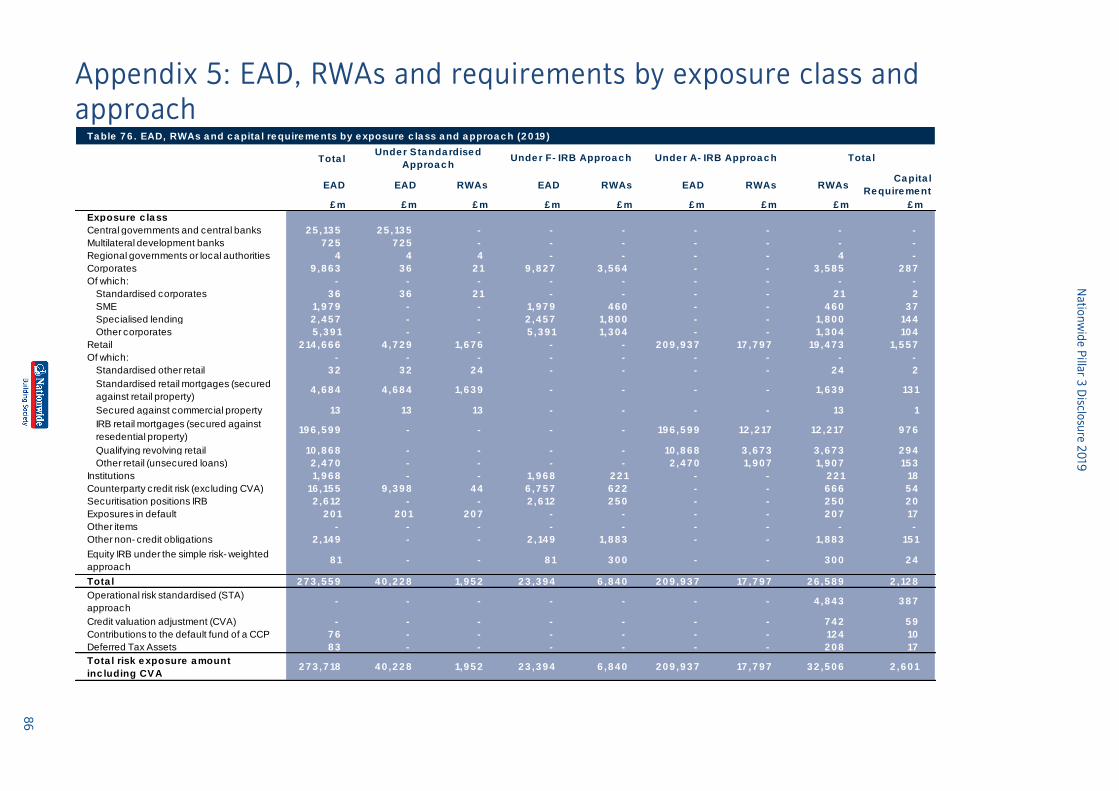
Na
tion
wid
e P
illar 3
Disclo
sure
20
19
86
Appendix 5: EAD, RWAs and requirements by exposure class and
approach Ta ble 7 6 . EAD, RWAs a nd c a pita l re quire me nts by e xposure c la ss a nd a pproa c h (2 0 19 )
Tota l
EAD EAD RWAs EAD RWAs EAD RWAs RWAsCa pita l
Re quire me nt
£ m £ m £ m £ m £ m £ m £ m £ m £ m
Exposure c la ss
Central governments and central banks 2 5 ,13 5 2 5 ,13 5 - - - - - - -
Multilateral development banks 7 2 5 7 2 5 - - - - - - -
Regional governments or local authorities 4 4 4 - - - - 4 -
Corporates 9 ,8 6 3 3 6 2 1 9 ,8 2 7 3 ,5 6 4 - - 3 ,5 8 5 2 8 7
Of which: - - - - - - - - -
Standardised corporates 3 6 3 6 2 1 - - - - 2 1 2
SME 1,9 7 9 - - 1,9 7 9 4 6 0 - - 4 6 0 3 7
Specialised lending 2 ,4 5 7 - - 2 ,4 5 7 1,8 0 0 - - 1,8 0 0 14 4
Other corporates 5 ,3 9 1 - - 5 ,3 9 1 1,3 0 4 - - 1,3 0 4 10 4
Retail 2 14 ,6 6 6 4 ,7 2 9 1,6 7 6 - - 2 0 9 ,9 3 7 17 ,7 9 7 19 ,4 7 3 1,5 5 7
Of which: - - - - - - - - -
Standardised other retail 3 2 3 2 2 4 - - - - 2 4 2
Standardised retail mortgages (secured
against retail property)4 ,6 8 4 4 ,6 8 4 1,6 3 9 - - - - 1,6 3 9 13 1
Secured against commercial property 13 13 13 - - - - 13 1
IRB retail mortgages (secured against
resedential property)19 6 ,5 9 9 - - - - 19 6 ,5 9 9 12 ,2 17 12 ,2 17 9 7 6
Qualifying revolving retail 10 ,8 6 8 - - - - 10 ,8 6 8 3 ,6 7 3 3 ,6 7 3 2 9 4
Other retail (unsecured loans) 2 ,4 7 0 - - - - 2 ,4 7 0 1,9 0 7 1,9 0 7 15 3
Institutions 1,9 6 8 - - 1,9 6 8 2 2 1 - - 2 2 1 18
Counterparty credit risk (excluding CVA) 16 ,15 5 9 ,3 9 8 4 4 6 ,7 5 7 6 2 2 - - 6 6 6 5 4
Securitisation positions IRB 2 ,6 12 - - 2 ,6 12 2 5 0 - - 2 5 0 2 0
Exposures in default 2 0 1 2 0 1 2 0 7 - - - - 2 0 7 17
Other items - - - - - - - - -
Other non- credit obligations 2 ,14 9 - - 2 ,14 9 1,8 8 3 - - 1,8 8 3 15 1
Equity IRB under the simple risk- weighted
approach8 1 - - 8 1 3 0 0 - - 3 0 0 2 4
Tota l 2 7 3 ,5 5 9 4 0 ,2 2 8 1,9 5 2 2 3 ,3 9 4 6 ,8 4 0 2 0 9 ,9 3 7 17 ,7 9 7 2 6 ,5 8 9 2 ,12 8
Operational risk standardised (STA)
approach- - - - - - - 4 ,8 4 3 3 8 7
Credit valuation adjustment (CVA) - - - - - - - 7 4 2 5 9
Contributions to the default fund of a CCP 7 6 - - - - - - 12 4 10
Deferred Tax Assets 8 3 - - - - - - 2 0 8 17
Tota l risk e xposure a mount
inc luding CVA2 7 3 ,7 18 4 0 ,2 2 8 1,9 5 2 2 3 ,3 9 4 6 ,8 4 0 2 0 9 ,9 3 7 17 ,7 9 7 3 2 ,5 0 6 2 ,6 0 1
Unde r S ta nda rdise d
Approa c hUnde r F- IRB Approa c h Unde r A- IRB Approa c h Tota l
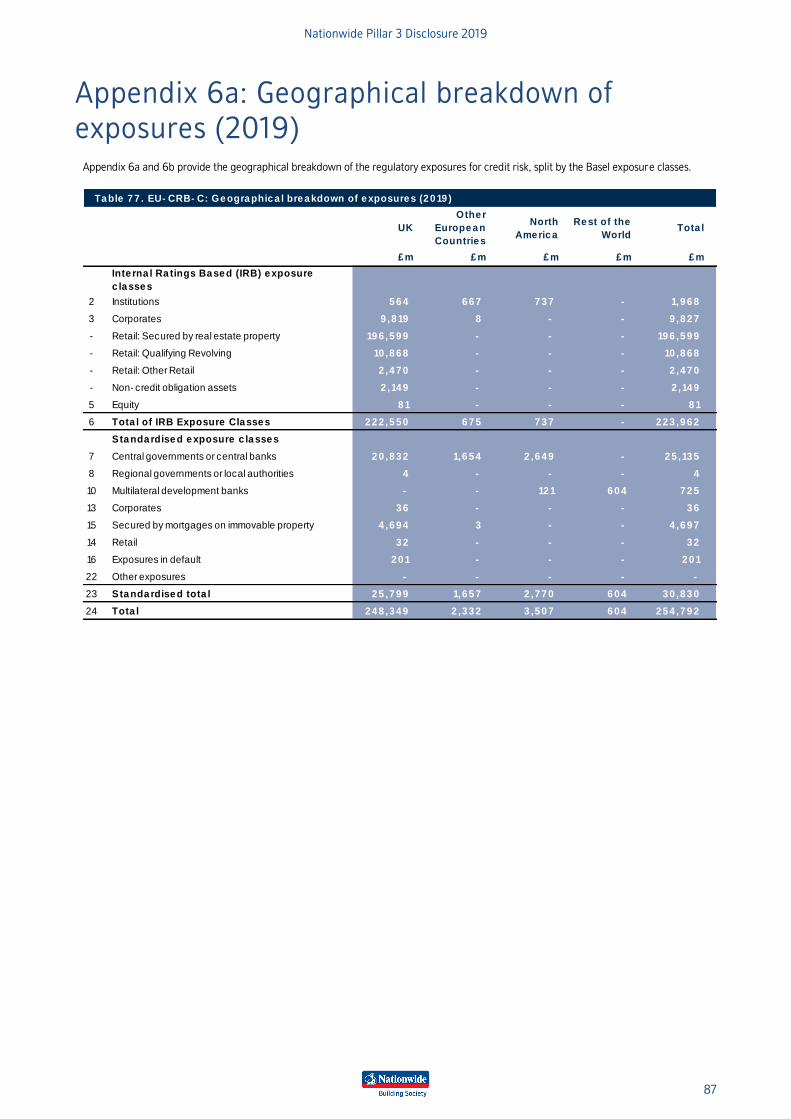
Nationwide Pillar 3 Disclosure 2019
87
Appendix 6a: Geographical breakdown of
exposures (2019)Appendix 6a and 6b provide the geographical breakdown of the regulatory exposures for credit risk, split by the Basel exposure classes.
UK
Othe r
Europe a n
Countrie s
North
Ame ric a
Re st of the
WorldTota l
£ m £ m £ m £ m £ m
Inte rna l Ra tings Ba se d (IRB) e xposure
c la sse s
2 Institutions IRB 5 6 4 6 6 7 7 3 7 - 1,9 6 8
3 Corporates IRB 9 ,8 19 8 - - 9 ,8 2 7
- Retail: Secured by real estate property 19 6 ,5 9 9 - - - 19 6 ,5 9 9
- Retail: Qualifying Revolving 10 ,8 6 8 - - - 10 ,8 6 8
- Retail: Other Retail 2 ,4 7 0 - - - 2 ,4 7 0
- Non- credit obligation assets 2 ,14 9 - - - 2 ,14 9
5 Equity 8 1 - - - 8 1
6 Tota l of IRB Exposure Cla sse s 2 2 2 ,5 5 0 6 7 5 7 3 7 - 2 2 3 ,9 6 2
Sta nda rdise d e xposure c la sse s
7 Central governments or central banks Standardised 2 0 ,8 3 2 1,6 5 4 2 ,6 4 9 - 2 5 ,13 5
8 Regional governments or local authorities 4 - - - 4
10 Multilateral development banks - - 12 1 6 0 4 7 2 5
13 Corporates standardised 3 6 - - - 3 6
15 Secured by mortgages on immovable property 4 ,6 9 4 3 - - 4 ,6 9 7
14 Retail 3 2 - - - 3 2
16 Exposures in default 2 0 1 - - - 2 0 1
22 Other exposures - - - - -
23 Sta nda rdise d tota l 2 5 ,7 9 9 1,6 5 7 2 ,7 7 0 6 0 4 3 0 ,8 3 0
24 Tota l 2 4 8 ,3 4 9 2 ,3 3 2 3 ,5 0 7 6 0 4 2 5 4 ,7 9 2
Ta ble 7 7 . EU- CRB- C: Ge ogra phic a l bre a kdown of e xposure s (2 0 19 )
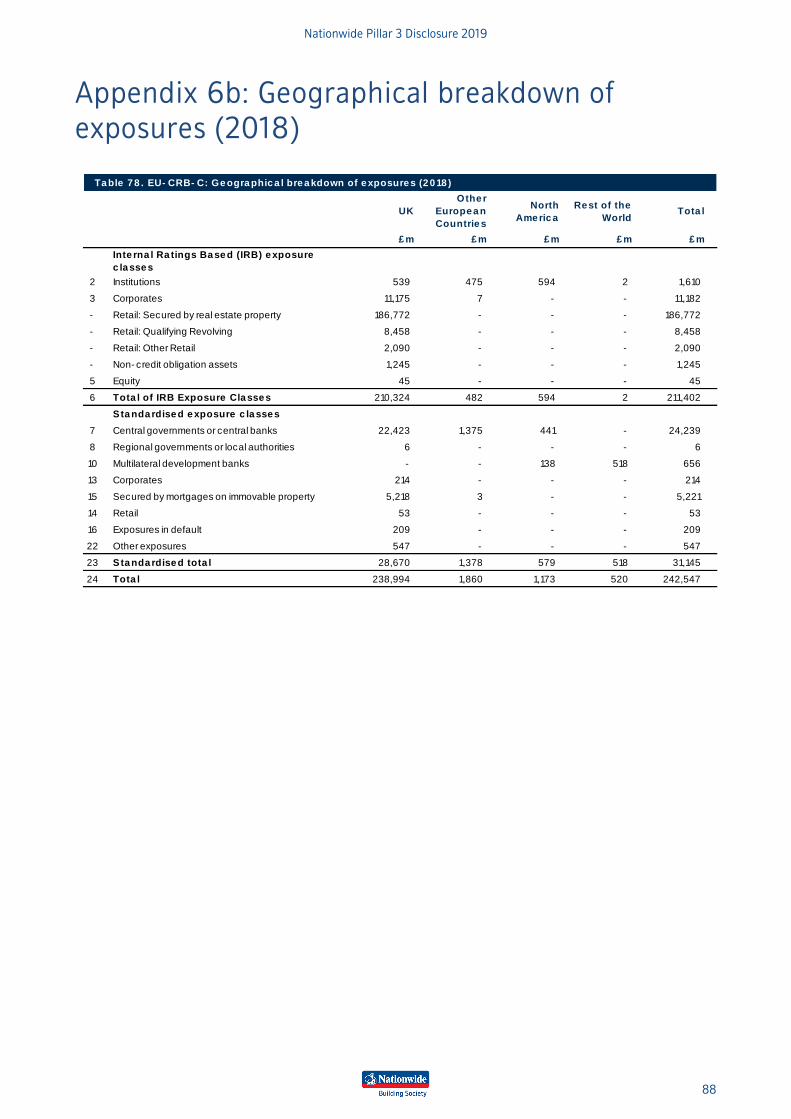
Nationwide Pillar 3 Disclosure 2019
88
Appendix 6b: Geographical breakdown of
exposures (2018)
UK
Othe r
Europe a n
Countrie s
North
Ame ric a
Re st of the
WorldTota l
£ m £ m £ m £ m £ m
Inte rna l Ra tings Ba se d (IRB) e xposure
c la sse s
2 Institutions IRB 539 475 594 2 1,610
3 Corporates IRB 11,175 7 - - 11,182
- Retail: Secured by real estate property 186,772 - - - 186,772
- Retail: Qualifying Revolving 8,458 - - - 8,458
- Retail: Other Retail 2,090 - - - 2,090
- Non- credit obligation assets 1,245 - - - 1,245
5 Equity 45 - - - 45
6 Tota l of IRB Exposure Cla sse s 210,324 482 594 2 211,402
Sta nda rdise d e xposure c la sse s
7 Central governments or central banks Standardised 22,423 1,375 441 - 24,239
8 Regional governments or local authorities 6 - - - 6
10 Multilateral development banks - - 138 518 656
13 Corporates Standardised 214 - - - 214
15 Secured by mortgages on immovable property 5,218 3 - - 5,221
14 Retail 53 - - - 53
16 Exposures in default 209 - - - 209
22 Other exposures 547 - - - 547
23 Sta nda rdise d tota l 28,670 1,378 579 518 31,145
24 Tota l 238,994 1,860 1,173 520 242,547
Ta ble 7 8 . EU- CRB- C: Ge ogra phic a l bre a kdown of e xposure s (2 0 18 )
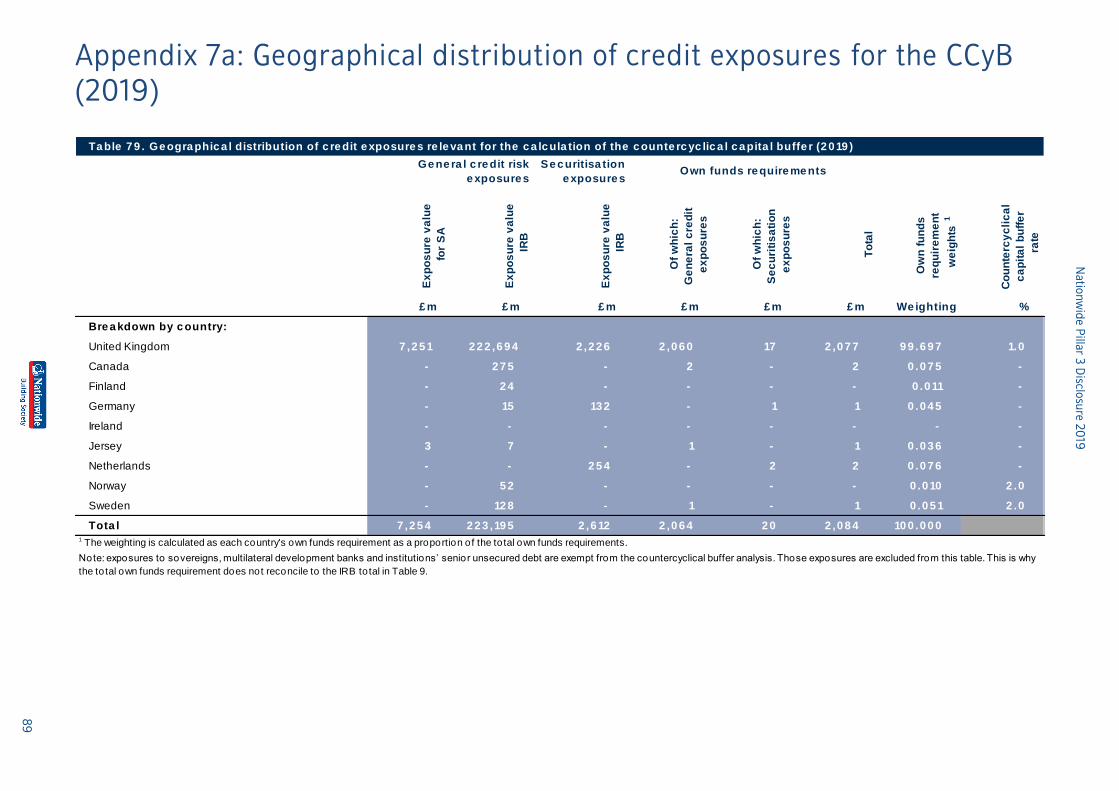
Na
tion
wid
e P
illar 3
Disclo
sure
20
19
89
Appendix 7a: Geographical distribution of credit exposures for the CCyB
(2019)
Ta ble 7 9 . Ge ogra phic a l distribution of c re dit e xposure s re le va nt for the c a lc ula tion of the c ounte rc yc lic a l c a pita l buffe r (2 0 19 )
Ex
po
su
re v
alu
e
for
SA
Ex
po
su
re v
alu
e
IRB
Ex
po
su
re v
alu
e
IRB
Of
wh
ich
:
Ge
ne
ral
cre
dit
ex
po
su
res
Of
wh
ich
:
Se
cu
riti
sa
tio
n
ex
po
su
res
To
tal
Ow
n f
un
ds
req
uir
em
en
t
we
igh
ts1
Co
un
terc
yc
lic
al
ca
pit
al
bu
ffe
r
rate
£ m £ m £ m £ m £ m £ m We ighting %
Bre a kdown by c ountry:
United Kingdom 7 ,2 5 1 2 2 2 ,6 9 4 2 ,2 2 6 2 ,0 6 0 17 2 ,0 7 7 9 9 .6 9 7 1.0
Canada - 2 7 5 - 2 - 2 0 .0 7 5 -
Finland - 2 4 - - - - 0 .0 11 -
Germany - 15 13 2 - 1 1 0 .0 4 5 -
Ireland - - - - - - - -
Jersey 3 7 - 1 - 1 0 .0 3 6 -
Netherlands - - 2 5 4 - 2 2 0 .0 7 6 -
Norway - 5 2 - - - - 0 .0 10 2 .0
Sweden - 12 8 - 1 - 1 0 .0 5 1 2 .0
Tota l 7 ,2 5 4 2 2 3 ,19 5 2 ,6 12 2 ,0 6 4 2 0 2 ,0 8 4 10 0 .0 0 0 1 The weighting is calculated as each country's own funds requirement as a proportion of the total own funds requirements.
Note: exposures to sovereigns, multilateral development banks and institutions’ senior unsecured debt are exempt from the countercyclical buffer analysis. Those exposures are excluded from this table. This is why
the total own funds requirement does not reconcile to the IRB total in Table 9.
Ge ne ra l c re dit risk
e xposure s
Se c uritisa tion
e xposure sOwn funds re quire me nts
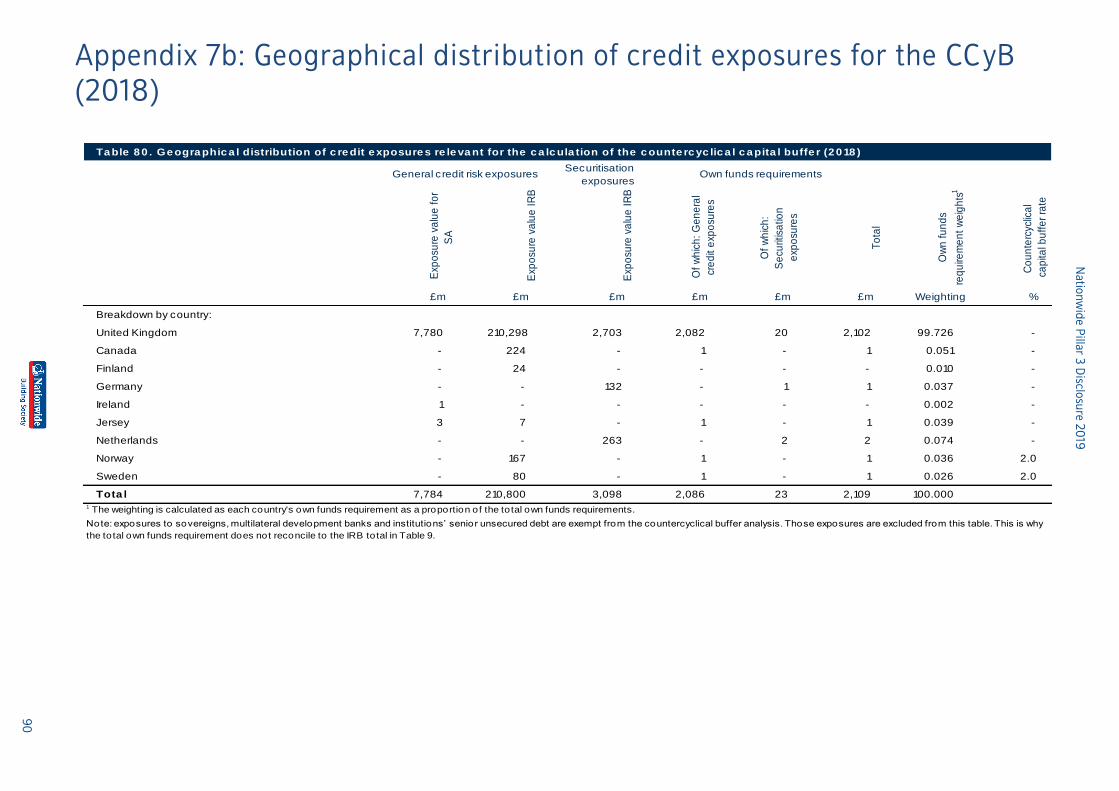
Na
tion
wid
e P
illar 3
Disclo
sure
20
19
90
Appendix 7b: Geographical distribution of credit exposures for the CC yB
(2018)
Ta ble 8 0 . Ge ogra phic a l distribution of c re dit e xposure s re le va nt for the c a lc ula tion of the c ounte rc yc lic a l c a pita l buffe r (2 0 18 )
Exp
osu
re v
alu
e f
or
SA
Exp
osu
re v
alu
e I
RB
Exp
osu
re v
alu
e I
RB
Of
wh
ich
: G
en
era
l
cre
dit
exp
osu
res
Of
wh
ich
:
Se
curit
isa
tion
exp
osu
res
To
tal
Ow
n f
un
ds
req
uire
me
nt
we
igh
ts1
Co
un
terc
yclic
al
cap
ital b
uff
er
rate
£m £m £m £m £m £m Weighting %
Breakdown by country:
United Kingdom 7,780 210,298 2,703 2,082 20 2,102 99.726 -
Canada - 224 - 1 - 1 0.051 -
Finland - 24 - - - - 0.010 -
Germany - - 132 - 1 1 0.037 -
Ireland 1 - - - - - 0.002 -
Jersey 3 7 - 1 - 1 0.039 -
Netherlands - - 263 - 2 2 0.074 -
Norway - 167 - 1 - 1 0.036 2.0
Sweden - 80 - 1 - 1 0.026 2.0
Tota l 7,784 210,800 3,098 2,086 23 2,109 100.000 1 The weighting is calculated as each country's own funds requirement as a proportion of the total own funds requirements.
Note: exposures to sovereigns, multilateral development banks and institutions’ senior unsecured debt are exempt from the countercyclical buffer analysis. Those exposures are excluded from this table. This is why
the total own funds requirement does not reconcile to the IRB total in Table 9.
General credit risk exposuresSecuritisation
exposuresOwn funds requirements
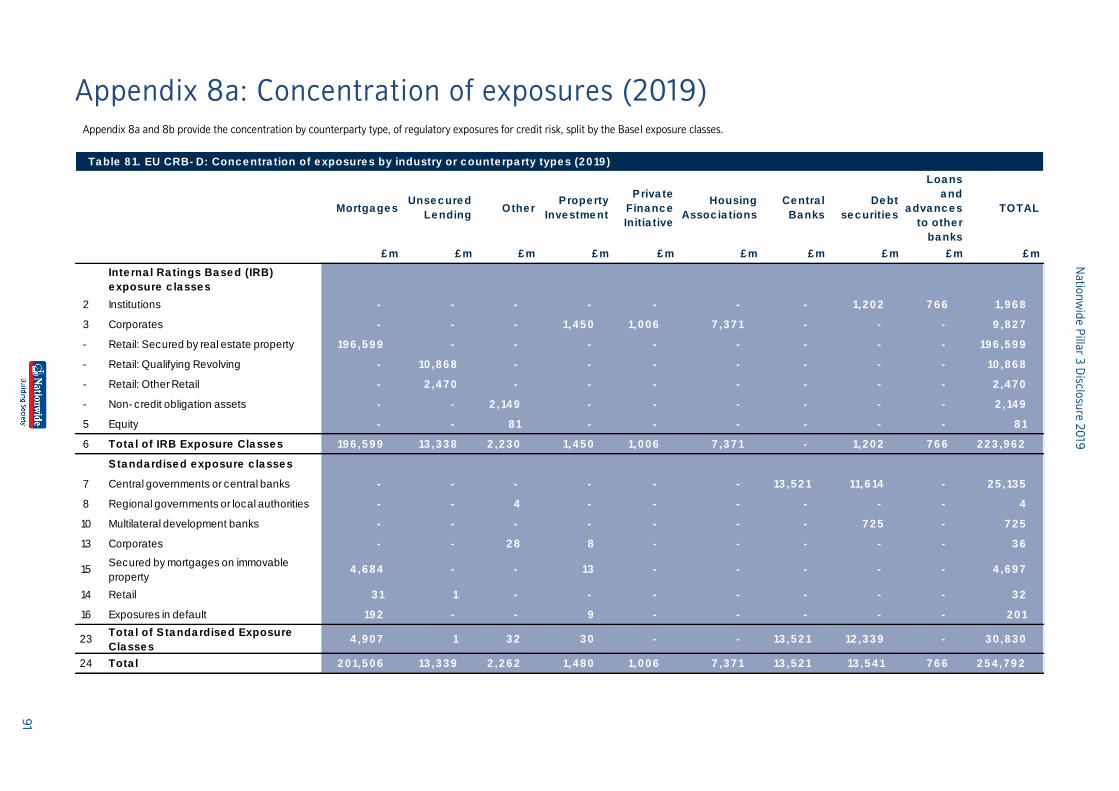
Na
tion
wid
e P
illar 3
Disclo
sure
20
19
91
Appendix 8a: Concentration of exposures (2019) Appendix 8a and 8b provide the concentration by counterparty type, of regulatory exposures for credit risk, split by the Basel exposure classes.
Ta ble 8 1. EU CRB- D: Conc e ntra tion of e xposure s by industry or c ounte rpa rty type s (2 0 19 )
Mortga ge sUnse c ure d
Le ndingOthe r
Prope rty
Inve stme nt
Priva te
Fina nc e
Initia tive
Housing
Assoc ia tions
Ce ntra l
Ba nks
De bt
se c uritie s
Loa ns
a nd
a dva nc e s
to othe r
ba nks
TOTAL
£ m £ m £ m £ m £ m £ m £ m £ m £ m £ m
Inte rna l Ra tings Ba se d (IRB)
e xposure c la sse s
2 Institutions IRB - - - - - - - 1,2 0 2 7 6 6 1,9 6 8
3 Corporates IRB - - - 1,4 5 0 1,0 0 6 7 ,3 7 1 - - - 9 ,8 2 7
- Retail: Secured by real estate property 19 6 ,5 9 9 - - - - - - - - 19 6 ,5 9 9
- Retail: Qualifying Revolving - 10 ,8 6 8 - - - - - - - 10 ,8 6 8
- Retail: Other Retail - 2 ,4 7 0 - - - - - - - 2 ,4 7 0
- Non- credit obligation assets - - 2 ,14 9 - - - - - - 2 ,14 9
5 Equity - - 8 1 - - - - - - 8 1
6 Tota l of IRB Exposure Cla sse s 19 6 ,5 9 9 13 ,3 3 8 2 ,2 3 0 1,4 5 0 1,0 0 6 7 ,3 7 1 - 1,2 0 2 7 6 6 2 2 3 ,9 6 2
Sta nda rdise d e xposure c la sse s
7 Central governments or central banks Standardised - - - - - - 13 ,5 2 1 11,6 14 - 2 5 ,13 5
8 Regional governments or local authorities - - 4 - - - - - - 4
10 Multilateral development banks - - - - - - - 7 2 5 - 7 2 5
13 Corporates Standardised - - 2 8 8 - - - - - 3 6
15Secured by mortgages on immovable
property4 ,6 8 4 - - 13 - - - - - 4 ,6 9 7
14 Retail 3 1 1 - - - - - - - 3 2
16 Exposures in default 19 2 - - 9 - - - - - 2 0 1
23Tota l of S ta nda rdise d Exposure
Cla sse s4 ,9 0 7 1 3 2 3 0 - - 13 ,5 2 1 12 ,3 3 9 - 3 0 ,8 3 0
24 Tota l 2 0 1,5 0 6 13 ,3 3 9 2 ,2 6 2 1,4 8 0 1,0 0 6 7 ,3 7 1 13 ,5 2 1 13 ,5 4 1 7 6 6 2 5 4 ,7 9 2
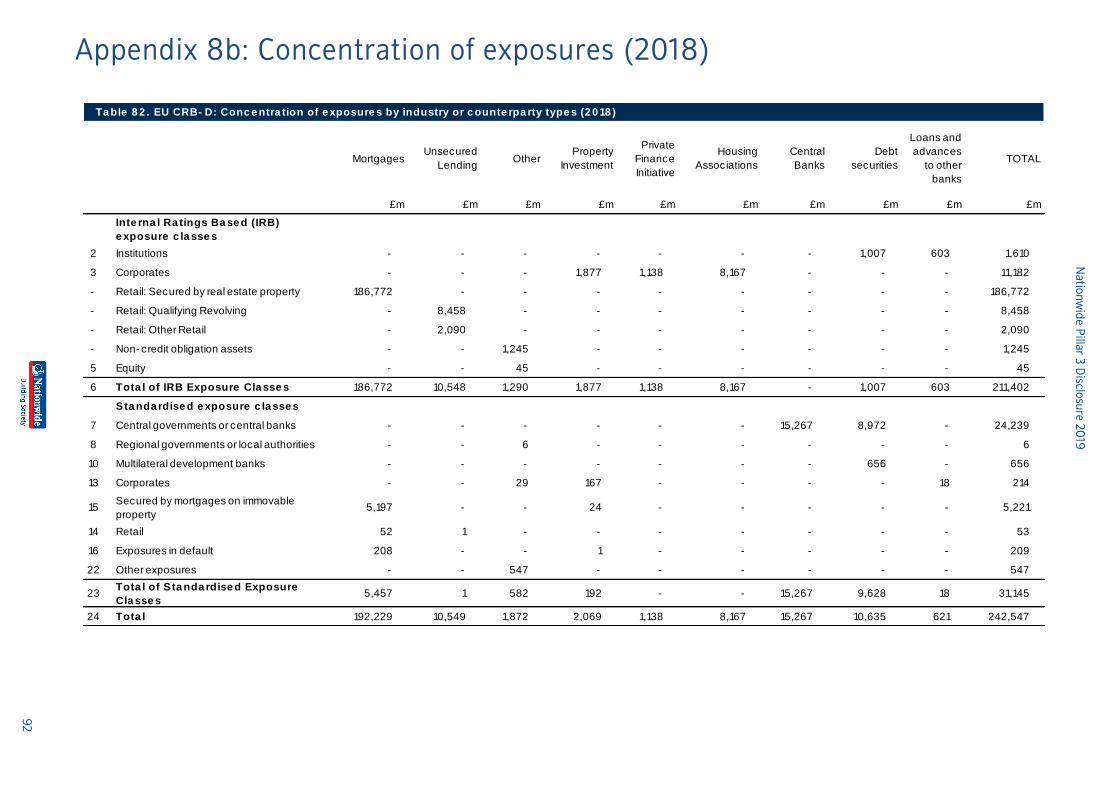
Na
tion
wid
e P
illar 3
Disclo
sure
20
19
92
Appendix 8b: Concentration of exposures (2018)
MortgagesUnsecured
LendingOther
Property
Investment
Private
Finance
Initiative
Housing
Associations
Central
Banks
Debt
securities
Loans and
advances
to other
banks
TOTAL
£m £m £m £m £m £m £m £m £m £m
Inte rna l Ra tings Ba se d (IRB)
e xposure c la sse s
2 Institutions IRB - - - - - - - 1,007 603 1,610
3 Corporates IRB - - - 1,877 1,138 8,167 - - - 11,182
- Retail: Secured by real estate property 186,772 - - - - - - - - 186,772
- Retail: Qualifying Revolving - 8,458 - - - - - - - 8,458
- Retail: Other Retail - 2,090 - - - - - - - 2,090
- Non- credit obligation assets - - 1,245 - - - - - - 1,245
5 Equity - - 45 - - - - - - 45
6 Tota l of IRB Exposure Cla sse s 186,772 10,548 1,290 1,877 1,138 8,167 - 1,007 603 211,402
Sta nda rdise d e xposure c la sse s
7 Central governments or central banks Standardised - - - - - - 15,267 8,972 - 24,239
8 Regional governments or local authorities - - 6 - - - - - - 6
10 Multilateral development banks - - - - - - - 656 - 656
13 Corporates Standardised - - 29 167 - - - - 18 214
15Secured by mortgages on immovable
property5,197 - - 24 - - - - - 5,221
14 Retail 52 1 - - - - - - - 53
16 Exposures in default 208 - - 1 - - - - - 209
22 Other exposures - - 547 - - - - - - 547
23Tota l of S ta nda rdise d Exposure
Cla sse s5,457 1 582 192 - - 15,267 9,628 18 31,145
24 Tota l 192,229 10,549 1,872 2,069 1,138 8,167 15,267 10,635 621 242,547
Ta ble 8 2 . EU CRB- D: Conc e ntra tion of e xposure s by industry or c ounte rpa rty type s (2 0 18 )
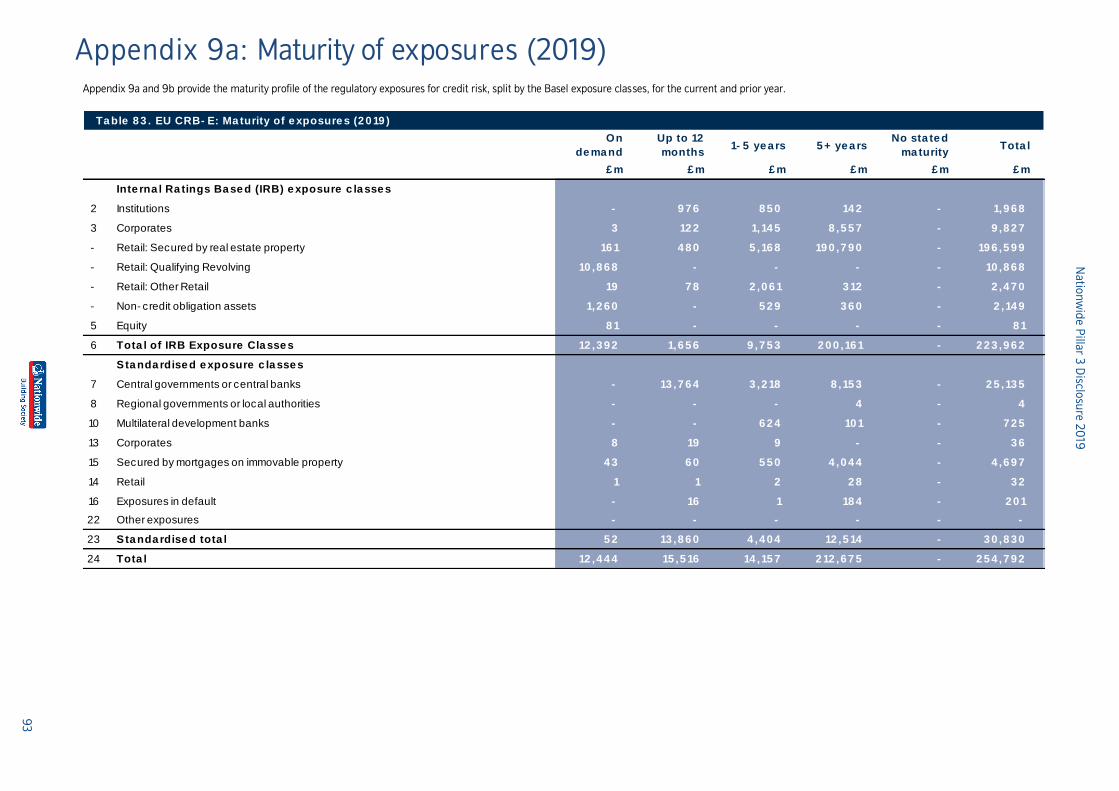
Na
tion
wid
e P
illar 3
Disclo
sure
20
19
93
Appendix 9a: Maturity of exposures (2019)
Appendix 9a and 9b provide the maturity profile of the regulatory exposures for credit risk, split by the Basel exposure classes, for the current and prior year.
Ta ble 8 3 . EU CRB- E: Ma turity of e xposure s (2 0 19 )
On
de ma nd
Up to 12
months1- 5 ye a rs 5 + ye a rs
No sta te d
ma turityTota l
£ m £ m £ m £ m £ m £ m
Inte rna l Ra tings Ba se d (IRB) e xposure c la sse s
2 Institutions IRB - 9 7 6 8 5 0 14 2 - 1,9 6 8
3 Corporates IRB 3 12 2 1,14 5 8 ,5 5 7 - 9 ,8 2 7
- Retail: Secured by real estate property IRB 16 1 4 8 0 5 ,16 8 19 0 ,7 9 0 - 19 6 ,5 9 9
- Retail: Qualifying Revolving IRB 10 ,8 6 8 - - - - 10 ,8 6 8
- Retail: Other Retail IRB 19 7 8 2 ,0 6 1 3 12 - 2 ,4 7 0
- Non- credit obligation assets IRB 1,2 6 0 - 5 2 9 3 6 0 - 2 ,14 9
5 Equity IRB 8 1 - - - - 8 1
6 Tota l of IRB Exposure Cla sse s 12 ,3 9 2 1,6 5 6 9 ,7 5 3 2 0 0 ,16 1 - 2 2 3 ,9 6 2
S ta nda rdise d e xposure c la sse s
7 Central governments or central banks Standardised - 13 ,7 6 4 3 ,2 18 8 ,15 3 - 2 5 ,13 5
8 Regional governments or local authorities - - - 4 - 4
10 Multilateral development banks - - 6 2 4 10 1 - 7 2 5
13 Corporates Standardised 8 19 9 - - 3 6
15 Secured by mortgages on immovable property 4 3 6 0 5 5 0 4 ,0 4 4 - 4 ,6 9 7
14 Retail 1 1 2 2 8 - 3 2
16 Exposures in default - 16 1 18 4 - 2 0 1
22 Other exposures - - - - - -
23 Sta nda rdise d tota l 5 2 13 ,8 6 0 4 ,4 0 4 12 ,5 14 - 3 0 ,8 3 0
24 Tota l 12 ,4 4 4 15 ,5 16 14 ,15 7 2 12 ,6 7 5 - 2 5 4 ,7 9 2
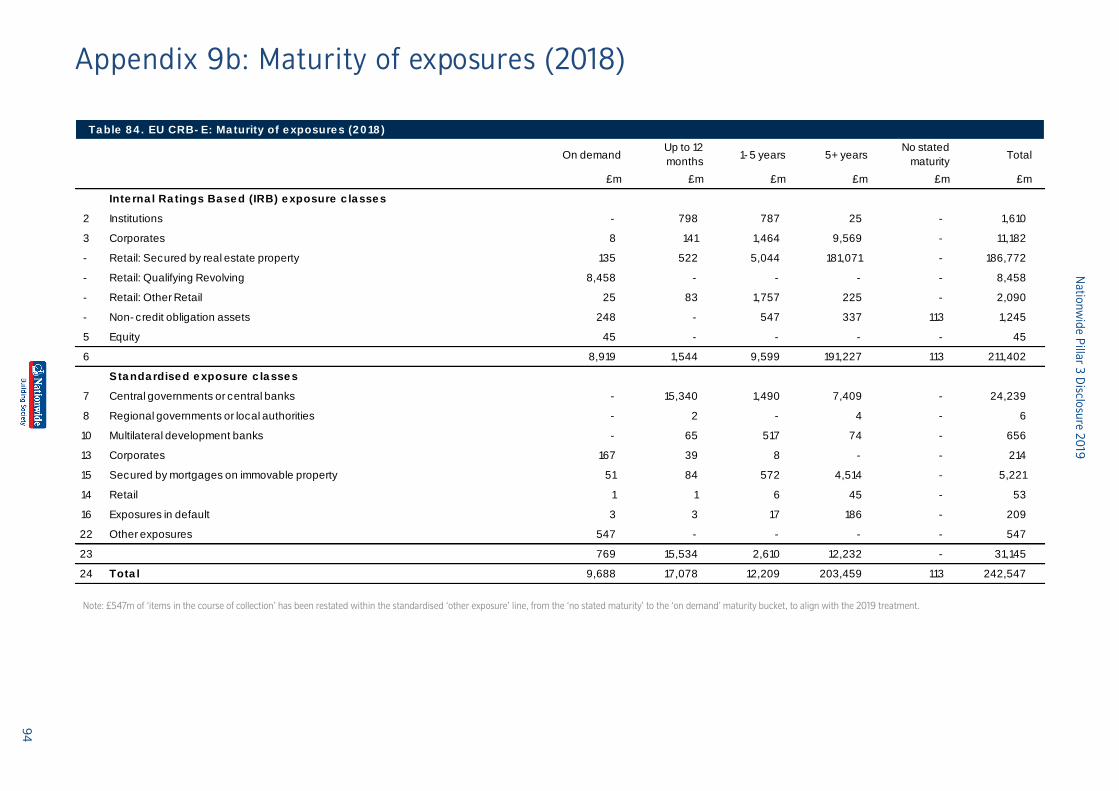
Na
tion
wid
e P
illar 3
Disclo
sure
20
19
94
Appendix 9b: Maturity of exposures (2018)
Ta ble 8 4 . EU CRB- E: Ma turity of e xposure s (2 0 18 )
On demandUp to 12
months1- 5 years 5+ years
No stated
maturityTotal
£m £m £m £m £m £m
Inte rna l Ra tings Ba se d (IRB) e xposure c la sse s
2 Institutions IRB - 798 787 25 - 1,610
3 Corporates IRB 8 141 1,464 9,569 - 11,182
- Retail: Secured by real estate property IRB 135 522 5,044 181,071 - 186,772
- Retail: Qualifying Revolving IRB 8,458 - - - - 8,458
- Retail: Other Retail IRB 25 83 1,757 225 - 2,090
- Non- credit obligation assets IRB 248 - 547 337 113 1,245
5 Equity IRB 45 - - - - 45
6 8,919 1,544 9,599 191,227 113 211,402
Sta nda rdise d e xposure c la sse s
7 Central governments or central banks Standardised - 15,340 1,490 7,409 - 24,239
8 Regional governments or local authorities - 2 - 4 - 6
10 Multilateral development banks - 65 517 74 - 656
13 Corporates Standardised 167 39 8 - - 214
15 Secured by mortgages on immovable property 51 84 572 4,514 - 5,221
14 Retail 1 1 6 45 - 53
16 Exposures in default 3 3 17 186 - 209
22 Other exposures 547 - - - - 547
23 Standardised total 769 15,534 2,610 12,232 - 31,145
24 Tota l 9,688 17,078 12,209 203,459 113 242,547
Note: £547m of ‘items in the course of collection’ has been restated within the standardised ‘other exposure’ line, from the ‘no stated maturity’ to the ‘on demand’ maturity bucket, to align with the 2019 treatment.
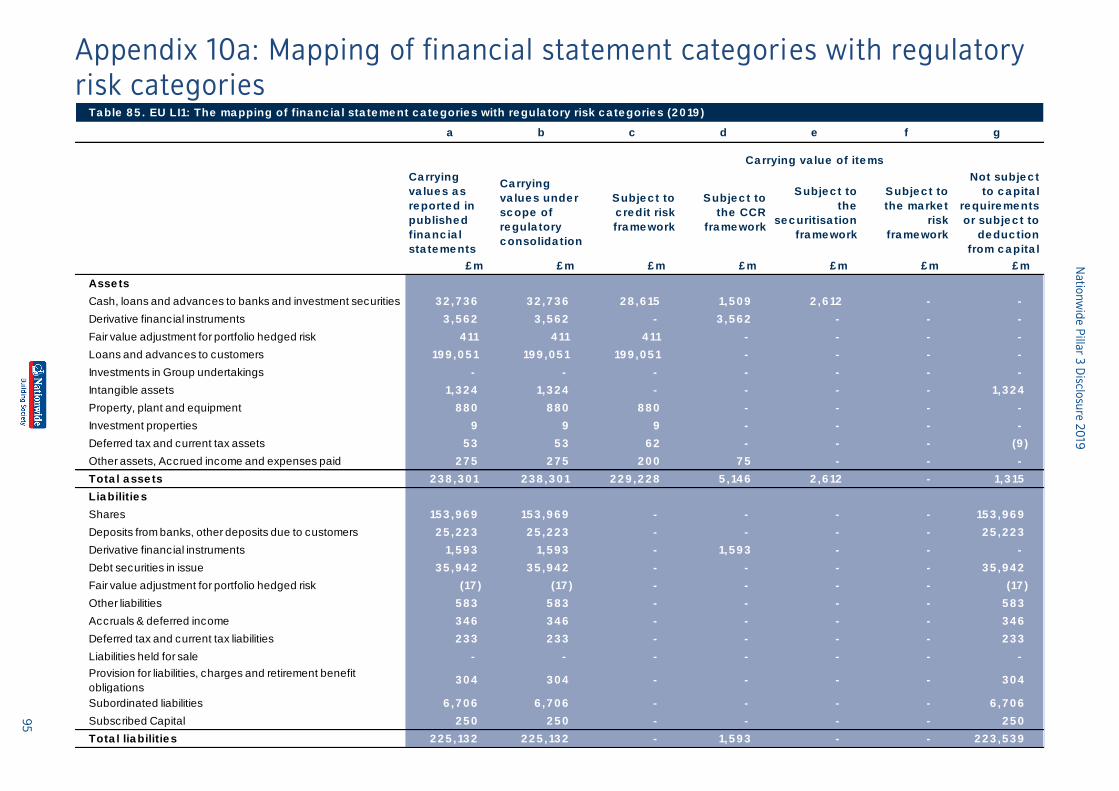
Na
tion
wid
e P
illar 3
Disclo
sure
20
19
95
Appendix 10a: Mapping of financial statement categories with regulatory
risk categories Ta ble 8 5 . EU LI1: The ma pping of fina nc ia l sta te me nt c a te gorie s with re gula tory risk c a te gorie s (2 0 19 )
a b c d e f g
Ca rrying
va lue s a s
re porte d in
publishe d
fina nc ia l
sta te me nts
Ca rrying
va lue s unde r
sc ope of
re gula tory
c onsolida tion
Subje c t to
c re dit risk
fra me work
Subje c t to
the CCR
fra me work
Subje c t to
the
se c uritisa tion
fra me work
Subje c t to
the ma rke t
risk
fra me work
Not subje c t
to c a pita l
re quire me nts
or subje c t to
de duc tion
from c a pita l
£ m £ m £ m £ m £ m £ m £ m
Asse ts
Cash, loans and advances to banks and investment securities 3 2 ,7 3 6 3 2 ,7 3 6 2 8 ,6 15 1,5 0 9 2 ,6 12 - -
Derivative financial instruments 3 ,5 6 2 3 ,5 6 2 - 3 ,5 6 2 - - -
Fair value adjustment for portfolio hedged risk 4 11 4 11 4 11 - - - -
Loans and advances to customers 19 9 ,0 5 1 19 9 ,0 5 1 19 9 ,0 5 1 - - - -
Investments in Group undertakings - - - - - - -
Intangible assets 1,3 2 4 1,3 2 4 - - - - 1,3 2 4
Property, plant and equipment 8 8 0 8 8 0 8 8 0 - - - -
Investment properties 9 9 9 - - - -
Deferred tax and current tax assets 5 3 5 3 6 2 - - - (9 )
Other assets, Accrued income and expenses paid 2 7 5 2 7 5 2 0 0 7 5 - - -
Tota l a sse ts 2 3 8 ,3 0 1 2 3 8 ,3 0 1 2 2 9 ,2 2 8 5 ,14 6 2 ,6 12 - 1,3 15
Lia bilitie s
Shares 15 3 ,9 6 9 15 3 ,9 6 9 - - - - 15 3 ,9 6 9
Deposits from banks, other deposits due to customers 2 5 ,2 2 3 2 5 ,2 2 3 - - - - 2 5 ,2 2 3
Derivative financial instruments 1,5 9 3 1,5 9 3 - 1,5 9 3 - - -
Debt securities in issue 3 5 ,9 4 2 3 5 ,9 4 2 - - - - 3 5 ,9 4 2
Fair value adjustment for portfolio hedged risk (17 ) (17 ) - - - - (17 )
Other liabilities 5 8 3 5 8 3 - - - - 5 8 3
Accruals & deferred income 3 4 6 3 4 6 - - - - 3 4 6
Deferred tax and current tax liabilities 2 3 3 2 3 3 - - - - 2 3 3
Liabilities held for sale - - - - - - -
Provision for liabilities, charges and retirement benefit
obligations3 0 4 3 0 4 - - - - 3 0 4
Subordinated liabilities 6 ,7 0 6 6 ,7 0 6 - - - - 6 ,7 0 6
Subscribed Capital 2 5 0 2 5 0 - - - - 2 5 0
Tota l lia bilitie s 2 2 5 ,13 2 2 2 5 ,13 2 - 1,5 9 3 - - 2 2 3 ,5 3 9
Ca rrying va lue of ite ms
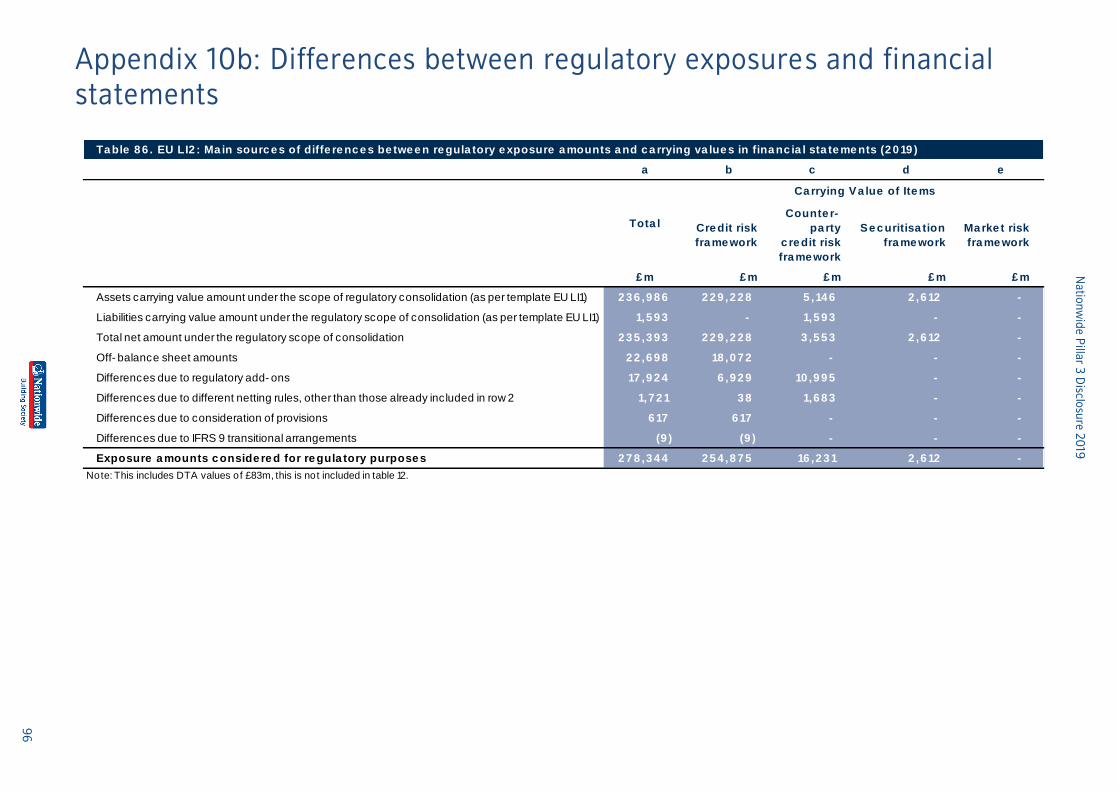
Na
tion
wid
e P
illar 3
Disclo
sure
20
19
96
Appendix 10b: Differences between regulatory exposures and financial
statements
Ta ble 8 6 . EU LI2 : Ma in sourc e s of diffe re nc e s be twe e n re gula tory e xposure a mounts a nd c a rrying va lue s in fina nc ia l sta te me nts (2 0 19 )
a b c d e
Cre dit risk
fra me work
Counte r-
pa rty
c re dit risk
fra me work
Se c uritisa tion
fra me work
Ma rke t risk
fra me work
£ m £ m £ m £ m £ m
Assets carrying value amount under the scope of regulatory consolidation (as per template EU LI1) 2 3 6 ,9 8 6 2 2 9 ,2 2 8 5 ,14 6 2 ,6 12 -
Liabilities carrying value amount under the regulatory scope of consolidation (as per template EU LI1) 1,5 9 3 - 1,5 9 3 - -
Total net amount under the regulatory scope of consolidation 2 3 5 ,3 9 3 2 2 9 ,2 2 8 3 ,5 5 3 2 ,6 12 -
Off- balance sheet amounts 2 2 ,6 9 8 18 ,0 7 2 - - -
Differences due to regulatory add- ons 17 ,9 2 4 6 ,9 2 9 10 ,9 9 5 - -
Differences due to different netting rules, other than those already included in row 2 1,7 2 1 3 8 1,6 8 3 - -
Differences due to consideration of provisions 6 17 6 17 - - -
Differences due to IFRS 9 transitional arrangements (9 ) (9 ) - - -
Exposure a mounts c onside re d for re gula tory purpose s 2 7 8 ,3 4 4 2 5 4 ,8 7 5 16 ,2 3 1 2 ,6 12 -
Note: This includes DTA values of £83m, this is not included in table 12.
Tota l
Ca rrying Va lue of Ite ms
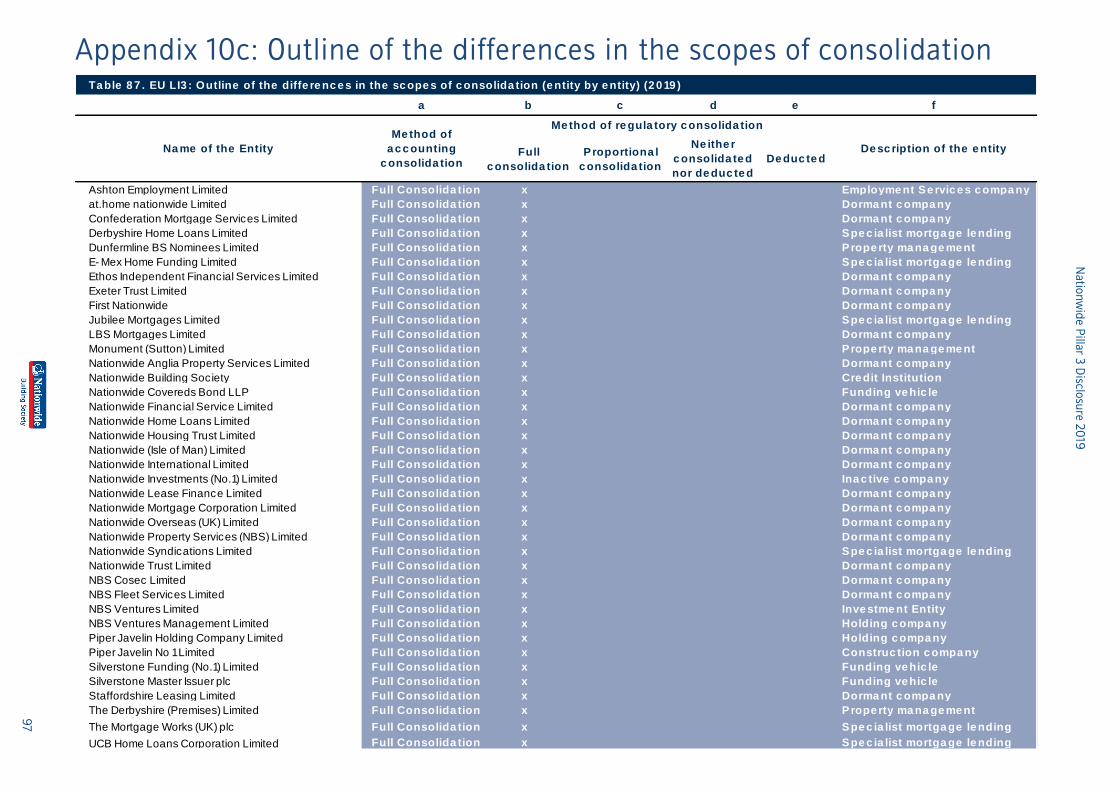
Na
tion
wid
e P
illar 3
Disclo
sure
20
19
97
Appendix 10c: Outline of the differences in the scopes of consolidation Ta ble 8 7 . EU LI3 : Outline of the diffe re nc e s in the sc ope s of c onsolida tion (e ntity by e ntity) (2 0 19 )
a b c d e f
Full
c onsolida tion
Proportiona l
c onsolida tion
Ne ithe r
c onsolida te d
nor de duc te d
De duc te d
Ashton Employment Limited Full Consolida tion x Employme nt Se rvic e s c ompa ny
at.home nationwide Limited Full Consolida tion x Dorma nt c ompa ny
Confederation Mortgage Services Limited Full Consolida tion x Dorma nt c ompa ny
Derbyshire Home Loans Limited Full Consolida tion x Spe c ia list mortga ge le nding
Dunfermline BS Nominees Limited Full Consolida tion x Prope rty ma na ge me nt
E- Mex Home Funding Limited Full Consolida tion x Spe c ia list mortga ge le nding
Ethos Independent Financial Services Limited Full Consolida tion x Dorma nt c ompa ny
Exeter Trust Limited Full Consolida tion x Dorma nt c ompa ny
First Nationwide Full Consolida tion x Dorma nt c ompa ny
Jubilee Mortgages Limited Full Consolida tion x Spe c ia list mortga ge le nding
LBS Mortgages Limited Full Consolida tion x Dorma nt c ompa ny
Monument (Sutton) Limited Full Consolida tion x Prope rty ma na ge me nt
Nationwide Anglia Property Services Limited Full Consolida tion x Dorma nt c ompa ny
Nationwide Building Society Full Consolida tion x Cre dit Institution
Nationwide Covereds Bond LLP Full Consolida tion x Funding ve hic le
Nationwide Financial Service Limited Full Consolida tion x Dorma nt c ompa ny
Nationwide Home Loans Limited Full Consolida tion x Dorma nt c ompa ny
Nationwide Housing Trust Limited Full Consolida tion x Dorma nt c ompa ny
Nationwide (Isle of Man) Limited Full Consolida tion x Dorma nt c ompa ny
Nationwide International Limited Full Consolida tion x Dorma nt c ompa ny
Nationwide Investments (No.1) Limited Full Consolida tion x Ina c tive c ompa ny
Nationwide Lease Finance Limited Full Consolida tion x Dorma nt c ompa ny
Nationwide Mortgage Corporation Limited Full Consolida tion x Dorma nt c ompa ny
Nationwide Overseas (UK) Limited Full Consolida tion x Dorma nt c ompa ny
Nationwide Property Services (NBS) Limited Full Consolida tion x Dorma nt c ompa ny
Nationwide Syndications Limited Full Consolida tion x Spe c ia list mortga ge le nding
Nationwide Trust Limited Full Consolida tion x Dorma nt c ompa ny
NBS Cosec Limited Full Consolida tion x Dorma nt c ompa ny
NBS Fleet Services Limited Full Consolida tion x Dorma nt c ompa ny
NBS Ventures Limited Full Consolida tion x Inve stme nt Entity
NBS Ventures Management Limited Full Consolida tion x Holding c ompa ny
Piper Javelin Holding Company Limited Full Consolida tion x Holding c ompa ny
Piper Javelin No 1 Limited Full Consolida tion x Construc tion c ompa ny
Silverstone Funding (No.1) Limited Full Consolida tion x Funding ve hic le
Silverstone Master Issuer plc Full Consolida tion x Funding ve hic le
Staffordshire Leasing Limited Full Consolida tion x Dorma nt c ompa ny
The Derbyshire (Premises) Limited Full Consolida tion x Prope rty ma na ge me nt
The Mortgage Works (UK) plc Full Consolida tion x Spe c ia list mortga ge le nding
UCB Home Loans Corporation Limited Full Consolida tion x Spe c ia list mortga ge le nding
Me thod of re gula tory c onsolida tionMe thod of
a c c ounting
c onsolida tion
De sc ription of the e ntityNa me of the Entity
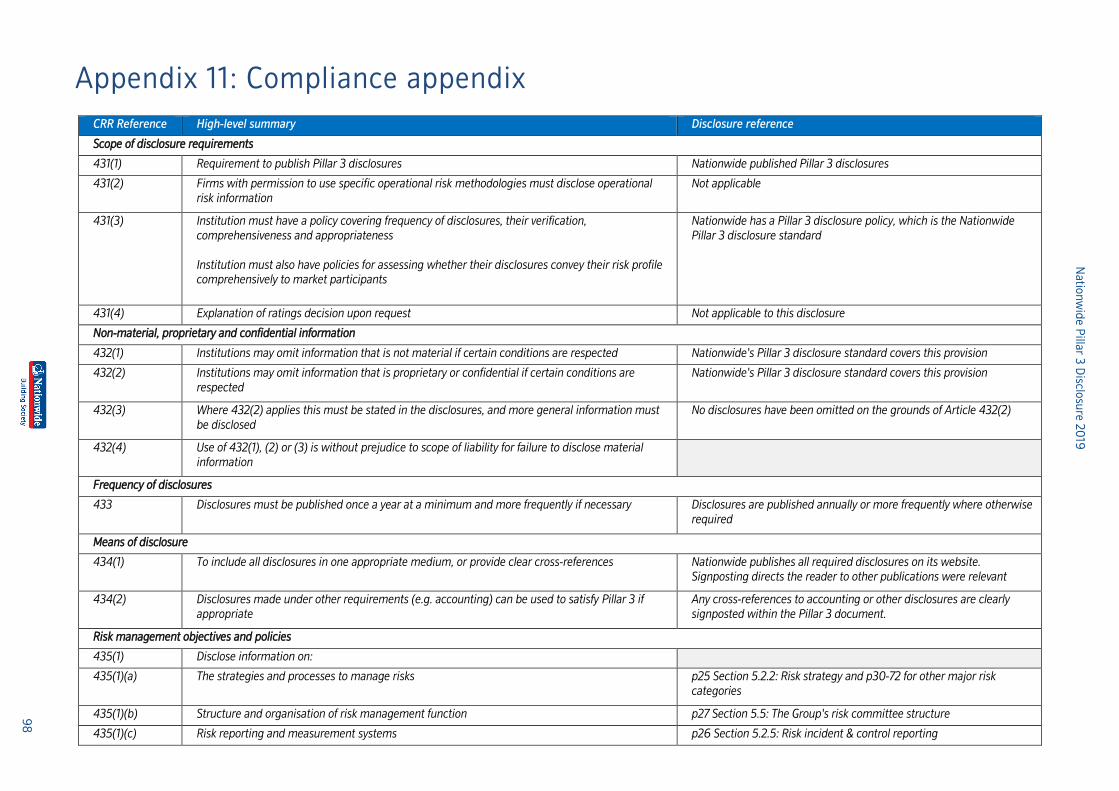
Na
tion
wid
e P
illar 3
Disclo
sure
20
19
98
Appendix 11: Compliance appendix
CRR Reference High-level summary Disclosure reference
Scope of disclosure requirements
431(1) Requirement to publish Pillar 3 disclosures Nationwide published Pillar 3 disclosures
431(2) Firms with permission to use specific operational risk methodologies must disclose operational
risk information
Not applicable
431(3) Institution must have a policy covering frequency of disclosures, their verification,
comprehensiveness and appropriateness
Institution must also have policies for assessing whether their disclosures convey their risk profile
comprehensively to market participants
Nationwide has a Pillar 3 disclosure policy, which is the Nationwide
Pillar 3 disclosure standard
431(4) Explanation of ratings decision upon request Not applicable to this disclosure
Non-material, proprietary and confidential information
432(1) Institutions may omit information that is not material if certain conditions are respected Nationwide's Pillar 3 disclosure standard covers this provision
432(2) Institutions may omit information that is proprietary or confidential if certain conditions are
respected
Nationwide's Pillar 3 disclosure standard covers this provision
432(3) Where 432(2) applies this must be stated in the disclosures, and more general information must
be disclosed
No disclosures have been omitted on the grounds of Article 432(2)
432(4) Use of 432(1), (2) or (3) is without prejudice to scope of liability for failure to disclose material
information
Frequency of disclosures
433 Disclosures must be published once a year at a minimum and more frequently if necessary Disclosures are published annually or more frequently where otherwise
required
Means of disclosure
434(1) To include all disclosures in one appropriate medium, or provide clear cross-references Nationwide publishes all required disclosures on its website.
Signposting directs the reader to other publications were relevant
434(2) Disclosures made under other requirements (e.g. accounting) can be used to satisfy Pillar 3 if
appropriate
Any cross-references to accounting or other disclosures are clearly
signposted within the Pillar 3 document.
Risk management objectives and policies
435(1) Disclose information on:
435(1)(a) The strategies and processes to manage risks p25 Section 5.2.2: Risk strategy and p30-72 for other major risk
categories
435(1)(b) Structure and organisation of risk management function p27 Section 5.5: The Group's risk committee structure
435(1)(c) Risk reporting and measurement systems p26 Section 5.2.5: Risk incident & control reporting
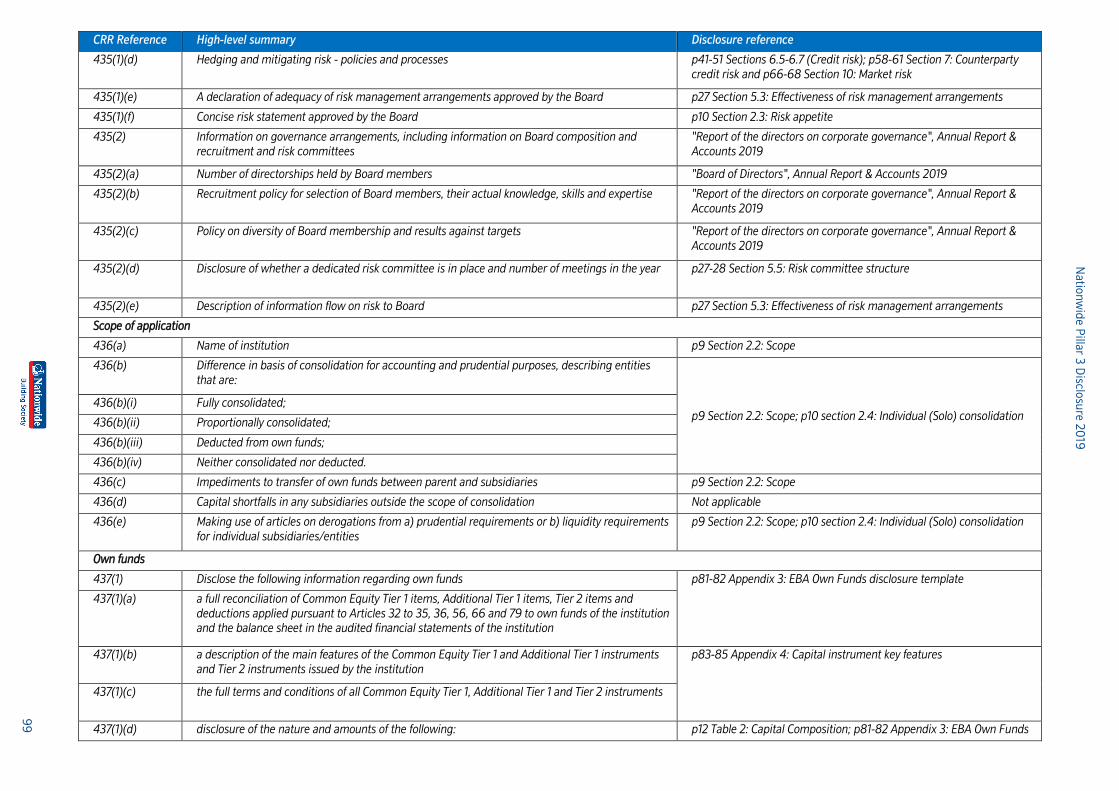
Na
tion
wid
e P
illar 3
Disclo
sure
20
19
99
CRR Reference High-level summary Disclosure reference
435(1)(d) Hedging and mitigating risk - policies and processes p41-51 Sections 6.5-6.7 (Credit risk); p58-61 Section 7: Counterparty
credit risk and p66-68 Section 10: Market risk
435(1)(e) A declaration of adequacy of risk management arrangements approved by the Board p27 Section 5.3: Effectiveness of risk management arrangements
435(1)(f) Concise risk statement approved by the Board p10 Section 2.3: Risk appetite
435(2) Information on governance arrangements, including information on Board composition and
recruitment and risk committees
"Report of the directors on corporate governance", Annual Report &
Accounts 2019
435(2)(a) Number of directorships held by Board members "Board of Directors", Annual Report & Accounts 2019
435(2)(b) Recruitment policy for selection of Board members, their actual knowledge, skills and expertise "Report of the directors on corporate governance", Annual Report &
Accounts 2019
435(2)(c) Policy on diversity of Board membership and results against targets "Report of the directors on corporate governance", Annual Report &
Accounts 2019
435(2)(d) Disclosure of whether a dedicated risk committee is in place and number of meetings in the year p27-28 Section 5.5: Risk committee structure
435(2)(e) Description of information flow on risk to Board p27 Section 5.3: Effectiveness of risk management arrangements
Scope of application
436(a) Name of institution p9 Section 2.2: Scope
436(b) Difference in basis of consolidation for accounting and prudential purposes, describing entities
that are:
p9 Section 2.2: Scope; p10 section 2.4: Individual (Solo) consolidation 436(b)(i) Fully consolidated;
436(b)(ii) Proportionally consolidated;
436(b)(iii) Deducted from own funds;
436(b)(iv) Neither consolidated nor deducted.
436(c) Impediments to transfer of own funds between parent and subsidiaries p9 Section 2.2: Scope
436(d) Capital shortfalls in any subsidiaries outside the scope of consolidation Not applicable
436(e) Making use of articles on derogations from a) prudential requirements or b) liquidity requirements
for individual subsidiaries/entities
p9 Section 2.2: Scope; p10 section 2.4: Individual (Solo) consolidation
Own funds
437(1) Disclose the following information regarding own funds p81-82 Appendix 3: EBA Own Funds disclosure template
437(1)(a) a full reconciliation of Common Equity Tier 1 items, Additional Tier 1 items, Tier 2 items and
deductions applied pursuant to Articles 32 to 35, 36, 56, 66 and 79 to own funds of the institution
and the balance sheet in the audited financial statements of the institution
437(1)(b) a description of the main features of the Common Equity Tier 1 and Additional Tier 1 instruments
and Tier 2 instruments issued by the institution
p83-85 Appendix 4: Capital instrument key features
437(1)(c) the full terms and conditions of all Common Equity Tier 1, Additional Tier 1 and Tier 2 instruments
437(1)(d) disclosure of the nature and amounts of the following: p12 Table 2: Capital Composition; p81-82 Appendix 3: EBA Own Funds
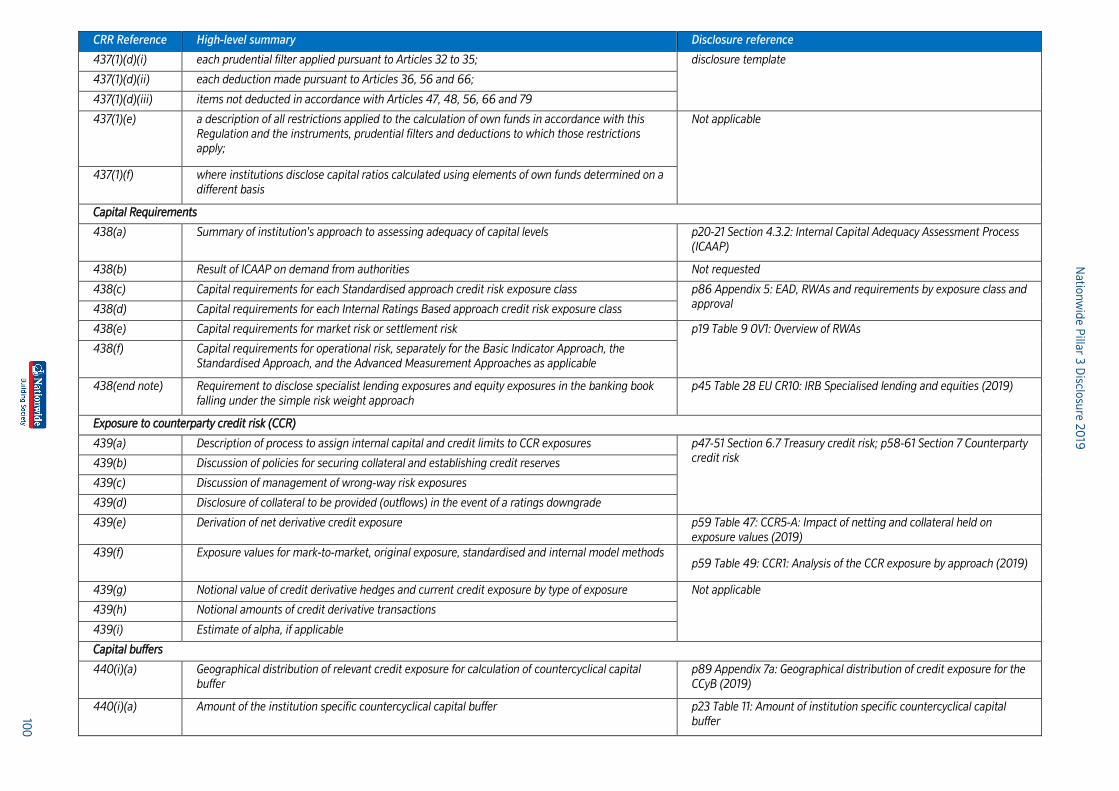
Na
tion
wid
e P
illar 3
Disclo
sure
20
19
100
CRR Reference High-level summary Disclosure reference
437(1)(d)(i) each prudential filter applied pursuant to Articles 32 to 35; disclosure template
437(1)(d)(ii) each deduction made pursuant to Articles 36, 56 and 66;
437(1)(d)(iii) items not deducted in accordance with Articles 47, 48, 56, 66 and 79
437(1)(e) a description of all restrictions applied to the calculation of own funds in accordance with this
Regulation and the instruments, prudential filters and deductions to which those restrictions
apply;
Not applicable
437(1)(f) where institutions disclose capital ratios calculated using elements of own funds determined on a
different basis
Capital Requirements
438(a) Summary of institution's approach to assessing adequacy of capital levels p20-21 Section 4.3.2: Internal Capital Adequacy Assessment Process
(ICAAP)
438(b) Result of ICAAP on demand from authorities Not requested
438(c) Capital requirements for each Standardised approach credit risk exposure class p86 Appendix 5: EAD, RWAs and requirements by exposure class and
approval 438(d) Capital requirements for each Internal Ratings Based approach credit risk exposure class
438(e) Capital requirements for market risk or settlement risk p19 Table 9 OV1: Overview of RWAs
438(f) Capital requirements for operational risk, separately for the Basic Indicator Approach, the
Standardised Approach, and the Advanced Measurement Approaches as applicable
438(end note) Requirement to disclose specialist lending exposures and equity exposures in the banking book
falling under the simple risk weight approach
p45 Table 28 EU CR10: IRB Specialised lending and equities (2019)
Exposure to counterparty credit risk (CCR)
439(a) Description of process to assign internal capital and credit limits to CCR exposures p47-51 Section 6.7 Treasury credit risk; p58-61 Section 7 Counterparty
credit risk 439(b) Discussion of policies for securing collateral and establishing credit reserves
439(c) Discussion of management of wrong-way risk exposures
439(d) Disclosure of collateral to be provided (outflows) in the event of a ratings downgrade
439(e) Derivation of net derivative credit exposure p59 Table 47: CCR5-A: Impact of netting and collateral held on
exposure values (2019)
439(f) Exposure values for mark-to-market, original exposure, standardised and internal model methods p59 Table 49: CCR1: Analysis of the CCR exposure by approach (2019)
439(g) Notional value of credit derivative hedges and current credit exposure by type of exposure Not applicable
439(h) Notional amounts of credit derivative transactions
439(i) Estimate of alpha, if applicable
Capital buffers
440(i)(a) Geographical distribution of relevant credit exposure for calculation of countercyclical capital
buffer
p89 Appendix 7a: Geographical distribution of credit exposure for the
CCyB (2019)
440(i)(a) Amount of the institution specific countercyclical capital buffer p23 Table 11: Amount of institution specific countercyclical capital
buffer
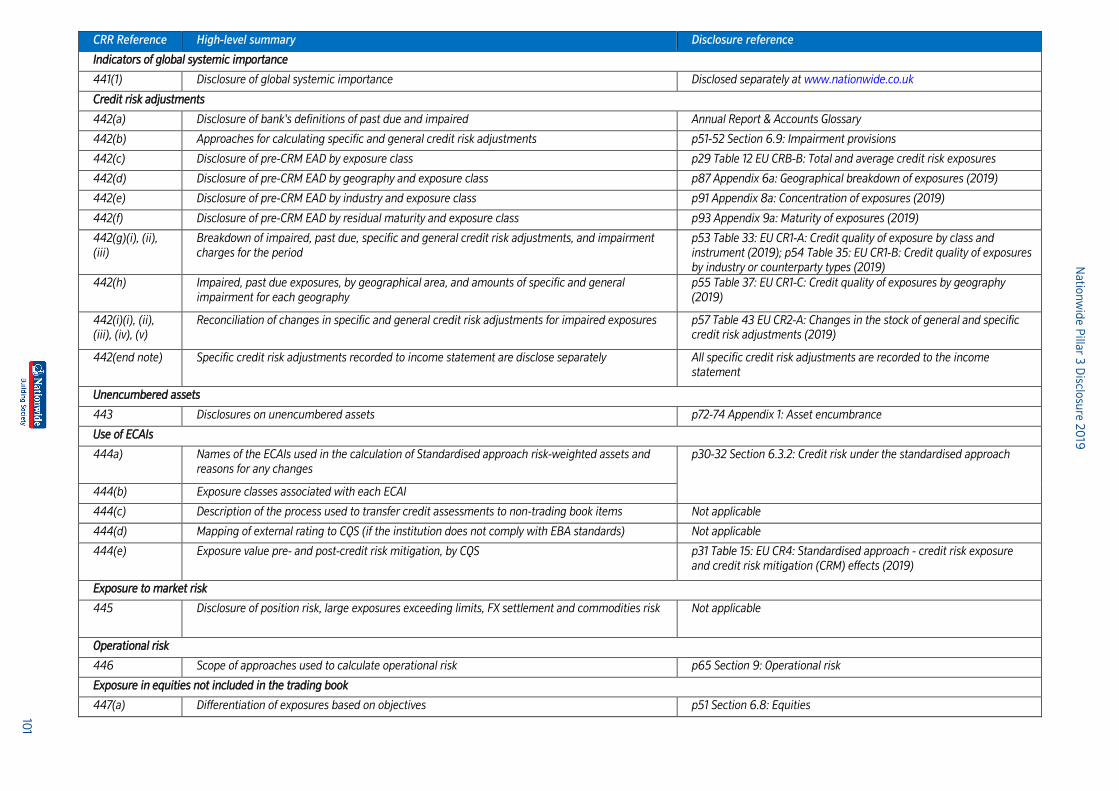
Na
tion
wid
e P
illar 3
Disclo
sure
20
19
101
CRR Reference High-level summary Disclosure reference
Indicators of global systemic importance
441(1) Disclosure of global systemic importance Disclosed separately at www.nationwide.co.uk
Credit risk adjustments
442(a) Disclosure of bank's definitions of past due and impaired Annual Report & Accounts Glossary
442(b) Approaches for calculating specific and general credit risk adjustments p51-52 Section 6.9: Impairment provisions
442(c) Disclosure of pre-CRM EAD by exposure class p29 Table 12 EU CRB-B: Total and average credit risk exposures
442(d) Disclosure of pre-CRM EAD by geography and exposure class p87 Appendix 6a: Geographical breakdown of exposures (2019)
442(e) Disclosure of pre-CRM EAD by industry and exposure class p91 Appendix 8a: Concentration of exposures (2019)
442(f) Disclosure of pre-CRM EAD by residual maturity and exposure class p93 Appendix 9a: Maturity of exposures (2019)
442(g)(i), (ii),
(iii)
Breakdown of impaired, past due, specific and general credit risk adjustments, and impairment
charges for the period
p53 Table 33: EU CR1-A: Credit quality of exposure by class and
instrument (2019); p54 Table 35: EU CR1-B: Credit quality of exposures
by industry or counterparty types (2019)
442(h) Impaired, past due exposures, by geographical area, and amounts of specific and general
impairment for each geography
p55 Table 37: EU CR1-C: Credit quality of exposures by geography
(2019)
442(i)(i), (ii),
(iii), (iv), (v)
Reconciliation of changes in specific and general credit risk adjustments for impaired exposures p57 Table 43 EU CR2-A: Changes in the stock of general and specific
credit risk adjustments (2019)
442(end note) Specific credit risk adjustments recorded to income statement are disclose separately All specific credit risk adjustments are recorded to the income
statement
Unencumbered assets
443 Disclosures on unencumbered assets p72-74 Appendix 1: Asset encumbrance
Use of ECAIs
444a) Names of the ECAIs used in the calculation of Standardised approach risk-weighted assets and
reasons for any changes
p30-32 Section 6.3.2: Credit risk under the standardised approach
444(b) Exposure classes associated with each ECAI
444(c) Description of the process used to transfer credit assessments to non-trading book items Not applicable
444(d) Mapping of external rating to CQS (if the institution does not comply with EBA standards) Not applicable
444(e) Exposure value pre- and post-credit risk mitigation, by CQS p31 Table 15: EU CR4: Standardised approach - credit risk exposure
and credit risk mitigation (CRM) effects (2019)
Exposure to market risk
445 Disclosure of position risk, large exposures exceeding limits, FX settlement and commodities risk Not applicable
Operational risk
446 Scope of approaches used to calculate operational risk p65 Section 9: Operational risk
Exposure in equities not included in the trading book
447(a) Differentiation of exposures based on objectives p51 Section 6.8: Equities
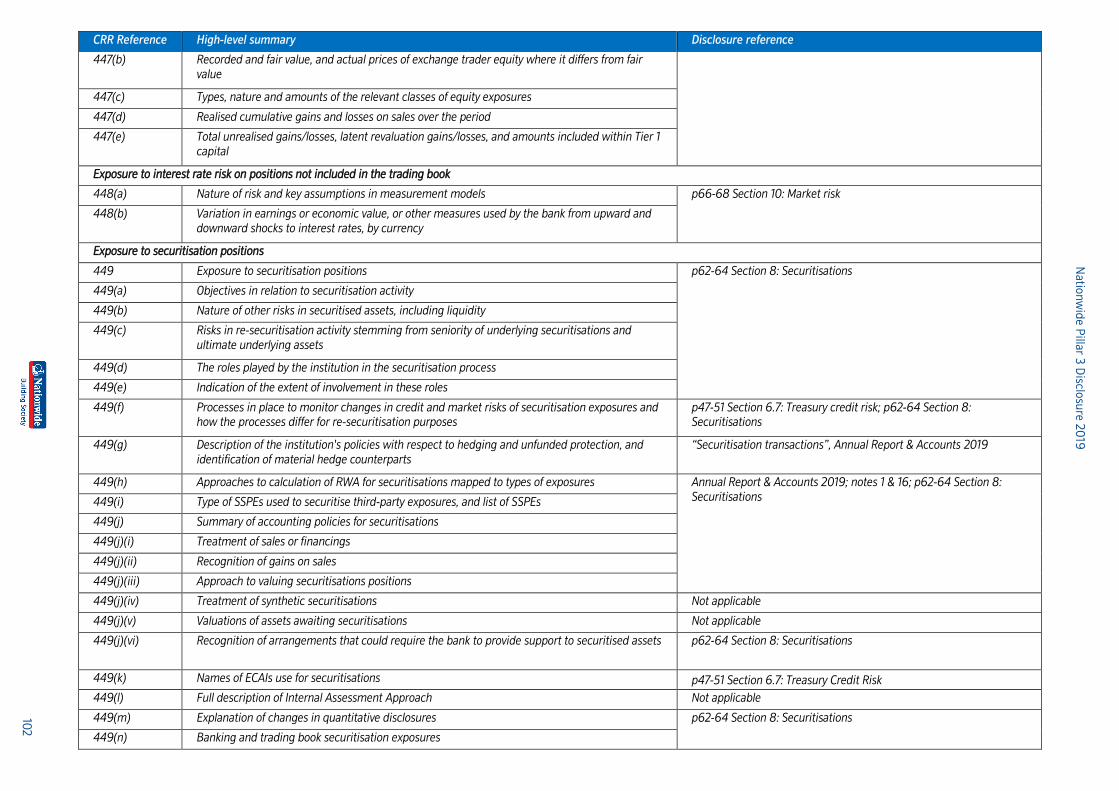
Na
tion
wid
e P
illar 3
Disclo
sure
20
19
102
CRR Reference High-level summary Disclosure reference
447(b) Recorded and fair value, and actual prices of exchange trader equity where it differs from fair
value
447(c) Types, nature and amounts of the relevant classes of equity exposures
447(d) Realised cumulative gains and losses on sales over the period
447(e) Total unrealised gains/losses, latent revaluation gains/losses, and amounts included within Tier 1
capital
Exposure to interest rate risk on positions not included in the trading book
448(a) Nature of risk and key assumptions in measurement models p66-68 Section 10: Market risk
448(b) Variation in earnings or economic value, or other measures used by the bank from upward and
downward shocks to interest rates, by currency
Exposure to securitisation positions
449 Exposure to securitisation positions p62-64 Section 8: Securitisations
449(a) Objectives in relation to securitisation activity
449(b) Nature of other risks in securitised assets, including liquidity
449(c) Risks in re-securitisation activity stemming from seniority of underlying securitisations and
ultimate underlying assets
449(d) The roles played by the institution in the securitisation process
449(e) Indication of the extent of involvement in these roles
449(f) Processes in place to monitor changes in credit and market risks of securitisation exposures and
how the processes differ for re-securitisation purposes
p47-51 Section 6.7: Treasury credit risk; p62-64 Section 8:
Securitisations
449(g) Description of the institution's policies with respect to hedging and unfunded protection, and
identification of material hedge counterparts
“Securitisation transactions”, Annual Report & Accounts 2019
449(h) Approaches to calculation of RWA for securitisations mapped to types of exposures Annual Report & Accounts 2019; notes 1 & 16; p62-64 Section 8:
Securitisations 449(i) Type of SSPEs used to securitise third-party exposures, and list of SSPEs
449(j) Summary of accounting policies for securitisations
449(j)(i) Treatment of sales or financings
449(j)(ii) Recognition of gains on sales
449(j)(iii) Approach to valuing securitisations positions
449(j)(iv) Treatment of synthetic securitisations Not applicable
449(j)(v) Valuations of assets awaiting securitisations Not applicable
449(j)(vi) Recognition of arrangements that could require the bank to provide support to securitised assets p62-64 Section 8: Securitisations
449(k) Names of ECAIs use for securitisations p47-51 Section 6.7: Treasury Credit Risk
449(l) Full description of Internal Assessment Approach Not applicable
449(m) Explanation of changes in quantitative disclosures p62-64 Section 8: Securitisations
449(n) Banking and trading book securitisation exposures
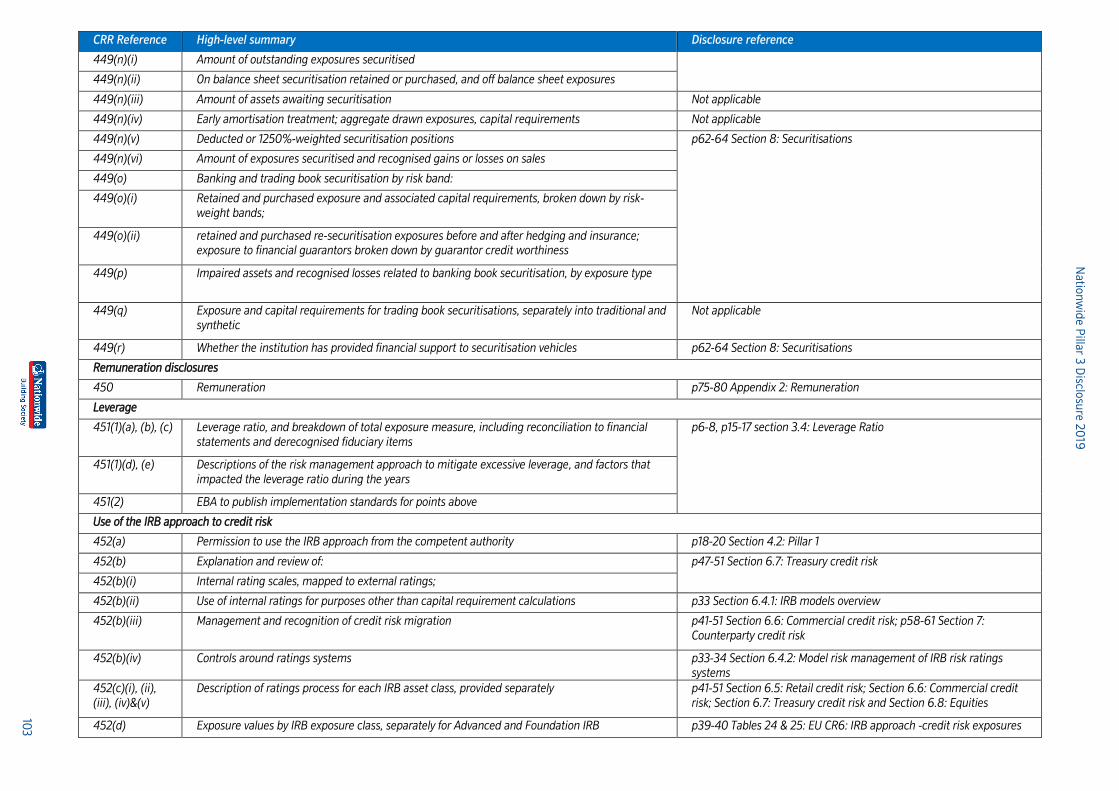
Na
tion
wid
e P
illar 3
Disclo
sure
20
19
103
CRR Reference High-level summary Disclosure reference
449(n)(i) Amount of outstanding exposures securitised
449(n)(ii) On balance sheet securitisation retained or purchased, and off balance sheet exposures
449(n)(iii) Amount of assets awaiting securitisation Not applicable
449(n)(iv) Early amortisation treatment; aggregate drawn exposures, capital requirements Not applicable
449(n)(v) Deducted or 1250%-weighted securitisation positions p62-64 Section 8: Securitisations
449(n)(vi) Amount of exposures securitised and recognised gains or losses on sales
449(o) Banking and trading book securitisation by risk band:
449(o)(i) Retained and purchased exposure and associated capital requirements, broken down by risk-
weight bands;
449(o)(ii) retained and purchased re-securitisation exposures before and after hedging and insurance;
exposure to financial guarantors broken down by guarantor credit worthiness
449(p) Impaired assets and recognised losses related to banking book securitisation, by exposure type
449(q) Exposure and capital requirements for trading book securitisations, separately into traditional and
synthetic
Not applicable
449(r) Whether the institution has provided financial support to securitisation vehicles p62-64 Section 8: Securitisations
Remuneration disclosures
450 Remuneration p75-80 Appendix 2: Remuneration
Leverage
451(1)(a), (b), (c) Leverage ratio, and breakdown of total exposure measure, including reconciliation to financial
statements and derecognised fiduciary items
p6-8, p15-17 section 3.4: Leverage Ratio
451(1)(d), (e) Descriptions of the risk management approach to mitigate excessive leverage, and factors that
impacted the leverage ratio during the years
451(2) EBA to publish implementation standards for points above
Use of the IRB approach to credit risk
452(a) Permission to use the IRB approach from the competent authority p18-20 Section 4.2: Pillar 1
452(b) Explanation and review of: p47-51 Section 6.7: Treasury credit risk
452(b)(i) Internal rating scales, mapped to external ratings;
452(b)(ii) Use of internal ratings for purposes other than capital requirement calculations p33 Section 6.4.1: IRB models overview
452(b)(iii) Management and recognition of credit risk migration p41-51 Section 6.6: Commercial credit risk; p58-61 Section 7:
Counterparty credit risk
452(b)(iv) Controls around ratings systems p33-34 Section 6.4.2: Model risk management of IRB risk ratings
systems
452(c)(i), (ii),
(iii), (iv)&(v)
Description of ratings process for each IRB asset class, provided separately p41-51 Section 6.5: Retail credit risk; Section 6.6: Commercial credit
risk; Section 6.7: Treasury credit risk and Section 6.8: Equities
452(d) Exposure values by IRB exposure class, separately for Advanced and Foundation IRB p39-40 Tables 24 & 25: EU CR6: IRB approach -credit risk exposures
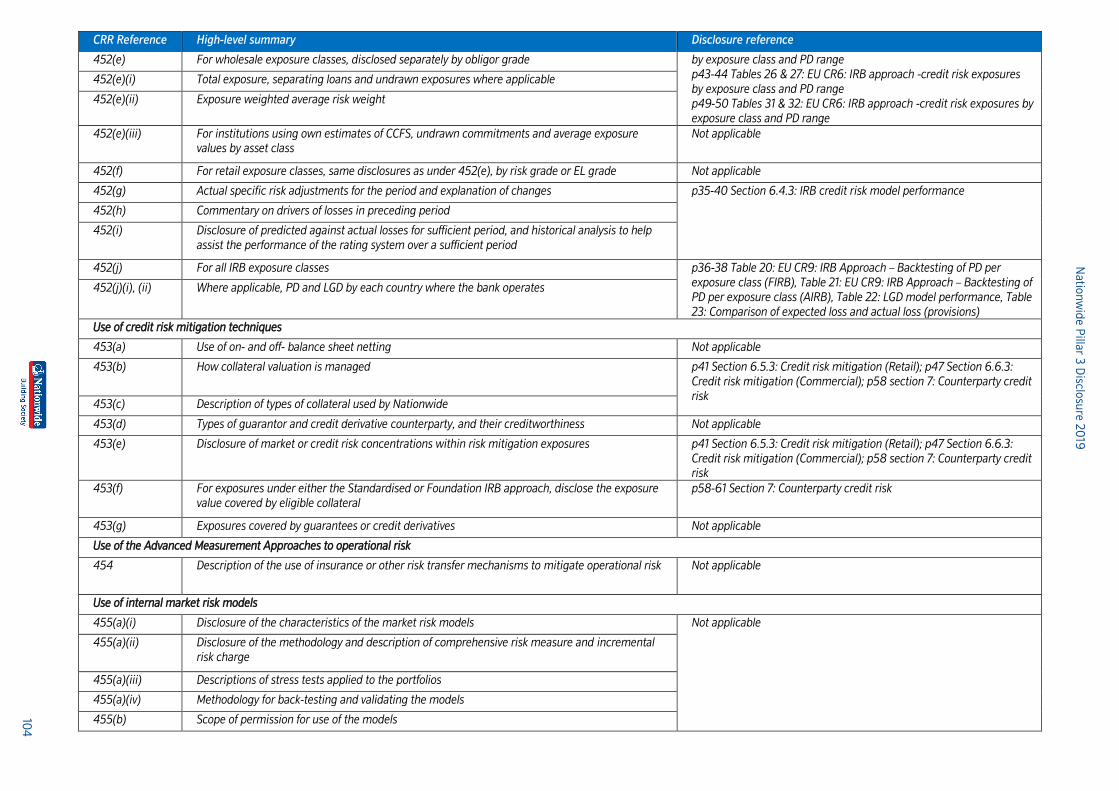
Na
tion
wid
e P
illar 3
Disclo
sure
20
19
104
CRR Reference High-level summary Disclosure reference
452(e) For wholesale exposure classes, disclosed separately by obligor grade by exposure class and PD range
p43-44 Tables 26 & 27: EU CR6: IRB approach -credit risk exposures
by exposure class and PD range
p49-50 Tables 31 & 32: EU CR6: IRB approach -credit risk exposures by
exposure class and PD range
452(e)(i) Total exposure, separating loans and undrawn exposures where applicable
452(e)(ii) Exposure weighted average risk weight
452(e)(iii) For institutions using own estimates of CCFS, undrawn commitments and average exposure
values by asset class
Not applicable
452(f) For retail exposure classes, same disclosures as under 452(e), by risk grade or EL grade Not applicable
452(g) Actual specific risk adjustments for the period and explanation of changes p35-40 Section 6.4.3: IRB credit risk model performance
452(h) Commentary on drivers of losses in preceding period
452(i) Disclosure of predicted against actual losses for sufficient period, and historical analysis to help
assist the performance of the rating system over a sufficient period
452(j) For all IRB exposure classes p36-38 Table 20: EU CR9: IRB Approach – Backtesting of PD per
exposure class (FIRB), Table 21: EU CR9: IRB Approach – Backtesting of
PD per exposure class (AIRB), Table 22: LGD model performance, Table
23: Comparison of expected loss and actual loss (provisions)
452(j)(i), (ii) Where applicable, PD and LGD by each country where the bank operates
Use of credit risk mitigation techniques
453(a) Use of on- and off- balance sheet netting Not applicable
453(b) How collateral valuation is managed p41 Section 6.5.3: Credit risk mitigation (Retail); p47 Section 6.6.3:
Credit risk mitigation (Commercial); p58 section 7: Counterparty credit
risk 453(c) Description of types of collateral used by Nationwide
453(d) Types of guarantor and credit derivative counterparty, and their creditworthiness Not applicable
453(e) Disclosure of market or credit risk concentrations within risk mitigation exposures p41 Section 6.5.3: Credit risk mitigation (Retail); p47 Section 6.6.3:
Credit risk mitigation (Commercial); p58 section 7: Counterparty credit
risk
453(f) For exposures under either the Standardised or Foundation IRB approach, disclose the exposure
value covered by eligible collateral
p58-61 Section 7: Counterparty credit risk
453(g) Exposures covered by guarantees or credit derivatives Not applicable
Use of the Advanced Measurement Approaches to operational risk
454 Description of the use of insurance or other risk transfer mechanisms to mitigate operational risk Not applicable
Use of internal market risk models
455(a)(i) Disclosure of the characteristics of the market risk models Not applicable
455(a)(ii) Disclosure of the methodology and description of comprehensive risk measure and incremental
risk charge
455(a)(iii) Descriptions of stress tests applied to the portfolios
455(a)(iv) Methodology for back-testing and validating the models
455(b) Scope of permission for use of the models
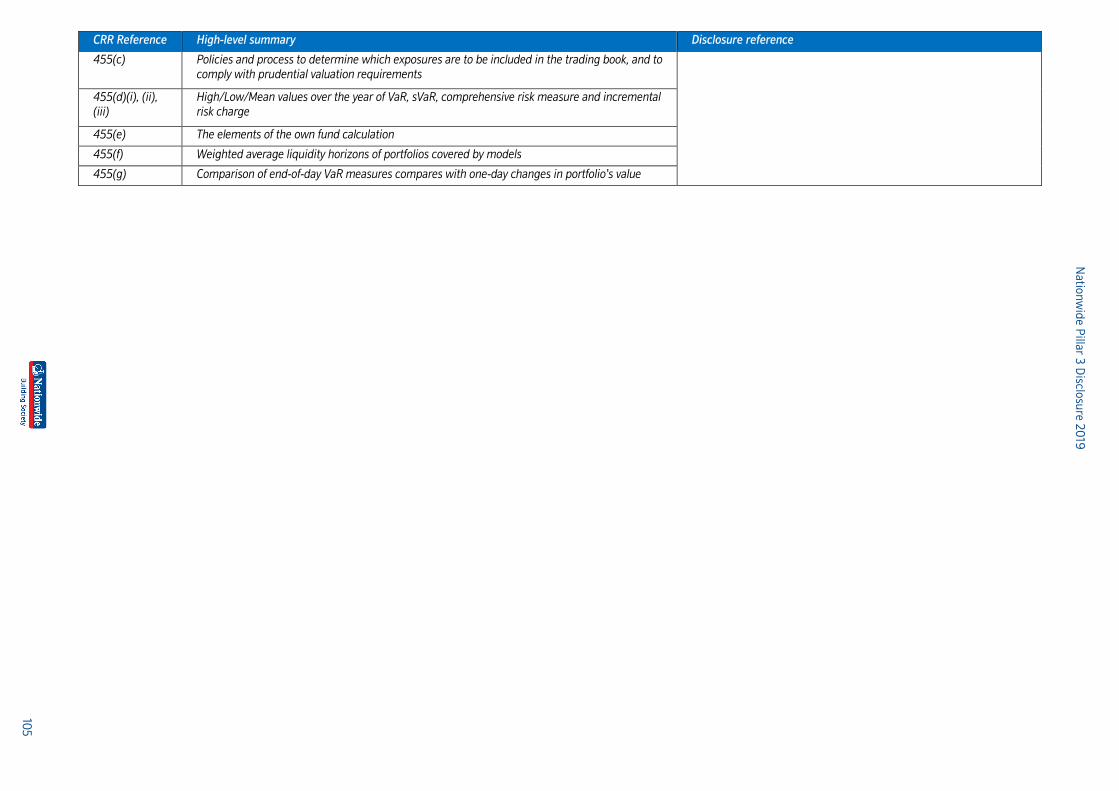
Na
tion
wid
e P
illar 3
Disclo
sure
20
19
105
CRR Reference High-level summary Disclosure reference
455(c) Policies and process to determine which exposures are to be included in the trading book, and to
comply with prudential valuation requirements
455(d)(i), (ii),
(iii)
High/Low/Mean values over the year of VaR, sVaR, comprehensive risk measure and incremental
risk charge
455(e) The elements of the own fund calculation
455(f) Weighted average liquidity horizons of portfolios covered by models
455(g) Comparison of end-of-day VaR measures compares with one-day changes in portfolio's value
Nationwide Pillar 3 Disclosure 2019
106
Appendix 12: Table index
Table
Number
Table description Page
Number
1 Key metrics and Impact of IFRS9 – Fully Loaded 7
2 Capital composition 12
3 Capital flow statement 13
4 EU PV1: Prudent valuation adjustments (PVA) (2019) 14
5 UK leverage ratio 15
6 Summary reconciliation of accounting assets and CRR leverage ratio exposure 16
7 CRR leverage ratio common disclosure 16
8 Split of on-balance sheet exposures (excluding derivatives and securities financing transactions) 17
9 EU OV1: Overview of RWAs 19
10 EU CR8: RWA flow statements of credit risk exposures 20
11 Amount of institution specific countercyclical capital buffer 23
12 EU CRB-B: Total and average credit risk exposures 29
13 EU CR3: CRM techniques – Overview (2019) 30
14 EU CR3: CRM techniques – Overview (2018) 30
15 EU CR4: Standardised approach - credit risk exposure and credit risk mitigation (CRM) effects (2019) 31
16 EU CR4: Standardised approach - credit risk exposure and credit risk mitigation (CRM) effects (2018) 31
17 EU CR5: Exposure post CRM and credit conversion factors - standardised approach (2019) 32
18 EU CR5: Exposure post CRM and credit conversion factors - standardised approach (2018) 32
19 Credit risk models key features (2019) 34
20 EU CR9: IRB approach - Backtesting of PD per exposure class (FIRB) 36
21 EU CR9: IRB approach - Backtesting of PD per exposure class (AIRB) 37
22 LGD model performance 37
23 Comparison of expected loss and actual loss (provisions) 38
24 EU CR6: IRB approach - credit risk exposures by exposure class and PD range (2019) 39
25 EU CR6: IRB approach - credit risk exposures by exposure class and PD range (2018) 40
26 EU CR6: IRB approach - credit risk exposures by exposure class and PD range (2019) 43
27 EU CR6: IRB approach - credit risk exposures by exposure class and PD range (2018) 44
28 CR10: IRB specialised lending and equities (2019) 45
29 CR10: IRB specialised lending and equities (2018) 46
30 Internal default grades mapped to external ratings (2019) 48
31 EU CR6: IRB approach - credit risk exposures by exposure class and PD range (2019) 49
32 EU CR6: IRB approach - credit risk exposures by exposure class and PD range (2018) 50
33 EU CR1-A: Credit quality of exposures by exposure class and instrument (2019) 53
34 EU CR1-A: Credit quality of exposures by exposure class and instrument (2018) 54
35 EU CR1-B: Credit quality of exposures by industry or counterparty types (2019) 54
36 EU CR1-B: Credit quality of exposures by industry or counterparty types (2018) 55
37 EU CR1-C: Credit quality of exposures by geography (2019) 55
38 EU CR1-C: Credit quality of exposures by geography (2018) 55
39 EU CR1-D: Ageing of past due exposures (2019) 55
40 EU CR1-D: Ageing of past due exposures (2018) 55
41 EU CR1-E: Non-performing and forborne exposures (2019) 56
42 EU CR1-E: Non-performing and forborne exposures (2018) 56
43 EU CR2-A: Changes in the stock of general and specific credit risk adjustments (2019) 57
44 EU CR2-A: Changes in the stock of general and specific credit risk adjustments (2018) 57
45 EU CR2-B: Changes in the stock of defaulted and impaired loans and debt securities (2019) 57
Nationwide Pillar 3 Disclosure 2019
107
Table
Number
Table description Page
Number
46 EU CR2-B: Changes in the stock of defaulted and impaired loans and debt securities (2018) 57
47 EU CCR5-A: Impact of netting and collateral held on exposure values (2019) 59
48 EU CCR5-A: Impact of netting and collateral held on exposure values (2018) 59
49 EU CCR1: Analysis of the CCR exposure by approach (2019) 59
50 EU CCR1: Analysis of the CCR exposure by approach (2018) 59
51 EU CCR3: Standardised approach - CCR exposures by regulatory portfolio and risk (2019) 60
52 EU CCR3: Standardised approach - CCR exposures by regulatory portfolio and risk (2018) 60
53 CCR4: IRB approach - CCR exposures by portfolio and PD scale (2019) 60
54 CCR4: IRB approach - CCR exposures by portfolio and PD scale (2018) 60
55 EU CCR8: Exposures to central counterparties (2019) 61
56 EU CCR8: Exposures to central counterparties (2018) 61
57 EU CCR2: Credit valuation adjustment (CVA) capital charge (2019) 61
58 EU CCR2: Credit valuation adjustment (CVA) capital charge (2018) 61
59 Aggregate amount of purchased securitisation positions by exposure type 63
60 Aggregate exposure to purchased securitisation positions 64
61 Interest rate risk 67
62 Potential impact on NII 67
63 EU LIQ1: Liquidity coverage ratio 70
64 (Template A) Assets (2019) 72
65 (Template A) Assets (2018) 73
66 (Template B) Collateral (2019) 73
67 (Template B) Collateral (2018) 74
68 (Template C) Encumbered assets / collateral received and associated liabilities 74
69 Number of Material Risk Takers (2019) 75
70 REM-1: Remuneration awarded during the financial year (2019) 78-79
71 REM-2: Special payments (2019) 79
72 REM-3: Deferred remuneration (2019) 79
73 Remuneration by band (2019) 80
74 EBA own funds disclosure template 81-82
75 Capital instruments key features (2019) 83-85
76 EAD, RWAs and capital requirements by exposure class and approach (2019) 86
77 EU-CRB-C: Geographical breakdown of exposures (2019) 87
78 EU-CRB-C: Geographical breakdown of exposures (2018) 88
79 Geographical distribution of credit exposures relevant for the calculation of the countercyclical capital buffer
(2019)
89
80 Geographical distribution of credit exposures relevant for the calculation of the countercyclical capital buffer
(2018)
90
81 EU CRB-D: Concentration of exposures by industry or counterparty types (2019) 91
82 EU CRB-D: Concentration of exposures by industry or counterparty types (2018) 92
83 EU CRB-E: Maturity of exposures (2019) 93
84 EU CRB-E: Maturity of exposures (2018) 94
85 EU LI1: The mapping of financial statement categories with regulatory risk categories (2019) 95
86 EU LI2: Main sources of differences between regulatory exposure amounts and carrying values in financial
statements (2019)
96
87 EU LI3: Outline of the differences in the scopes of consolidation (entity by entity) (2019) 97
Nationwide Pillar 3 Disclosure 2019
108
Glossary
AIRB Advanced Internal Ratings Based (see Internal ratings based approach).
Asset Backed Securities (ABS) Securities that represent an interest in an underlying pool of referenced assets. The
referenced pool can comprise any assets which attract a set of associated cash flows,
including credit card assets, but are commonly pools of residential or commercial
mortgages. Investors in these securities have the right to cash received from future
payments (interest and / or principal) on the underlying asset pool.
Basel III The Basel Committee rules text, issued in December 2010, which presents the details of
strengthened global regulatory standards on bank capital adequacy and liquidity. This
has been implemented via the Capital Requirements Directive IV (CRD IV) legislation.
Capital Requirements Directive (CRD) The supervisory framework in the European Commission which reflects the Basel II and
Basel III rules on capital measurement and capital standards.
Capital Requirements Directive IV (CRD IV) European legislation to implement Basel III, which includes the Capital Requirements
Regulation (CRR) and Capital Requirements Directive (CRD).
Capital Requirements Regulation (CRR) European regulation that is directly applicable to European Union member states defining
prudential capital requirements for credit institutions and investment firms.
Capital Resources Requirement The amount of capital that Nationwide is required to hold based upon the risks to which the
business is exposed.
Collectively assessed impairments Where a portfolio comprises assets with similar characteristics, collective impairment
assessment takes place using appropriate statistical techniques. The collective
assessment takes account of losses that will have taken place but are not yet identified.
Commercial lending Loans secured on commercial property, loans to registered social landlords and loans
relating to project finance.
Common Equity Tier 1 capital The highest quality form of capital as defined by CRD IV, comprising accumulated
reserves and qualifying instruments after regulatory deductions.
Common Equity Tier 1 (CET1) ratio Common Equity Tier 1 capital expressed as a percentage of risk weighted assets.
Counterparty credit risk Counterparty credit risk is the risk that the counterparty to a transaction could default before
the final settlement of the transaction's cash flows.
Covered Bonds Debt securities backed by a portfolio of mortgages that are segregated from the issuer’s
other assets to be solely for the benefit of the holders of the covered bonds.
Credit quality steps A credit quality assessment scale as set out in CRD IV.
Credit risk The risk of loss as a result of a member, customer or counterparty failing to meet their
financial obligations.
Credit risk mitigation Techniques to reduce the potential loss in the event that a customer (borrower or
counterparty) becomes unable to meet its obligations. This may include the taking of
financial or physical security, the assignment of receivables or the use of credit derivatives,
guarantees, credit insurance, set-off or netting.
Nationwide Pillar 3 Disclosure 2019
109
Default Circumstances in which the probability of default is taken as 100% for the purposes of
the calculation of regulatory capital and compliance with the Capital Requirements
Directive IV (CRD IV) legislation. This is defined as when a borrower reaches a predefined
arrears status or where a borrower is considered unlikely to repay the credit obligation in
full without the lender taking action such as realising security.
Delegated Act Commission delegated regulation (EU) 2015/62 of 10 October 2014 amending Regulation
(EU) No 575/2013 (CRR) of the European Parliament and of the Council with regard to the
leverage ratio.
EEA parent institution A parent financial institution situated in a Member State of the European Economic Area
which is not a subsidiary of another financial institution also situated in the EEA.
Exposure at Default (EAD) An estimation of the amount of exposure that will be outstanding at the time of default.
European Banking Authority (EBA) The independent EU authority which works to ensure effective and consistent prudential
regulation and supervision across the European banking sector.
Expected credit loss (ECL) The present value of all cash shortfalls over the expected life of the financial instrument.
Term is used for the accounting for impairment provisions under the new IFRS 9 standard.
ECL – 12 Month Cash shortfalls resulting from default events that are possible in the next 12
months weighted by the probability of the default occurring.
ECL – lifetime Cash shortfalls resulting from default events that are possible over the
remaining expected life of the loan, weighted by the probability of that default
occurring.
Expected loss (EL) A calculation to estimate the potential losses on current exposures due to potential defaults.
It is the product of probability of default (PD), loss given default (LGD) and exposure at
default (EAD).
Exposure The maximum loss that a financial institution might suffer if a borrower, counterparty or
group fails to meet their obligations or if assets and off balance sheet positions have to be
realised.
Exposure Value A parameter used in IRB approaches to estimate the exposure (amount outstanding) at the
time of default.
External Credit Assessment Institution External Credit Assessment Institution (ECAI). An ECAI (e.g. Moody’s, Standard and
Poor’s, Fitch) is an institution that assigns credit ratings to issuers of certain types of debt
obligations as well as the debt instruments themselves.
Financial Conduct Authority (FCA) The statutory body responsible for conduct of business regulation and supervision of UK
authorised firms from 1 April 2013. The FCA also has responsibility for the prudential
regulation of firms that do not fall within the Prudential Regulation Authority’s (PRA’s) scope.
Financial Services Authority (FSA) The financial services industry regulator in the UK, before transition to the PRA and FCA in
April 2013.
Foundation internal ratings based (FIRB)
approach
A method of calculating credit risk capital requirements using internal probability of
default (PD) models but with regulators’ supervisory estimates of loss given default (LGD)
and conversion factors for the calculation of exposure at default. (EAD).
Funding Risk Funding risk is the risk that Nationwide is unable to maintain diverse funding sources in
wholesale and retail markets and manage retail funding risk that can arise from excessive
concentrations of higher risk deposits.
Nationwide Pillar 3 Disclosure 2019
110
Fair Value through other comprehensive
income (FVOCI)
Financial assets held at fair value on the balance sheet with changes in fair value recognized
through other comprehensive income.
Fair value through profit or loss (FVTPL) Financial assets held at fair value on the balance sheet with changes in fair value being
recognised through the income statement.
FX PRR Foreign Exchange Position Risk Requirement. The capital requirement under CRR (Market
risk) as part of the calculation of the market risk capital requirement.
Guarantee An agreement by a third party to cover the potential loss to a credit institution should
a specified counterparty default on their obligations.
ICA Internal Capital Assessment – the document produced as a result of the ICAAP.
ICG Individual Capital Guidance. The minimum amount of capital the Group should hold as set
by the PRA under Pillar 2 and informed by ICAAP.
Internal capital adequacy assessment
process (ICAAP)
The Group’s own assessment of the levels of capital that it needs to hold in respect of
its regulatory capital requirements for credit, market and operational risks as well as for
other risks including stress events.
Impaired loans Loans which are three or more months in arrears, or which have individual provisions raised
against them.
Individually assessed impairments Residential loans are assessed individually for impairment when they are in possession.
Commercial loans are assessed individually for impairment when there is objective
evidence that an impairment loss has occurred.
Interest rate risk Interest rate risk is the exposure of a firm's financial condition to adverse movements in
interest rates.
Internal ratings based approach (IRB) An approach for measuring exposure to credit risks. IRB approaches are more
sophisticated and risk sensitive than the Standardised approach and may be Foundation
or Advanced. IRB approaches may only be used with Prudential Regulation Authority (PRA)
permission.
International Swaps and Derivatives
Association (ISDA) master agreement
A standardised contract developed by ISDA and used to enter into bilateral derivatives
transactions. The contracts grant legal rights of set off for derivative transactions with the
same counterparty. This reduces the credit risk of the derivatives to the extent that negative
values offset positive values.
LIBOR (London Interbank Offered Rate) A benchmark interest rate at which banks can borrow funds from other banks in the London
interbank market.
Liquid assets Total of cash in hand and balances with the Bank of England, loans and advances to banks
and investment securities.
Liquidity risk Liquidity risk is the risk that the Nationwide is unable to meet its liabilities as they fall due
and maintain member and stakeholder confidence.
Long-run average PD Probability of default based on a long-run average default rate which would be expected
over a full economic cycle.
Nationwide Pillar 3 Disclosure 2019
111
Loan to value ratio (LTV) A ratio which expresses the amount of exposure as a percentage of the value of the property
on which it is secured. Nationwide calculates LTV on an indexed basis such that the value
of the property is updated on a regular basis to reflect changes in the market using
either the house price or commercial real estate indices.
Loss given default (LGD) An estimate of the difference between exposure at default (EAD) and the net amount of
the expected recovery expressed as a percentage of EAD.
Market risk The risk that the net value of, or net income arising from, the Nationwide’s assets and
liabilities is impacted as a result of market prices or rate changes.
Maturity The remaining time in years that a borrower is permitted to take to fully discharge their
contractual obligation (principal, interest and fees) under the terms of a loan agreement.
Medium Term Performance Pay Plan The Medium Term Performance Pay Plan rewards sustained performance and the
achievement of challenging financial targets over a three year performance cycle.
Minimum capital requirement The minimum amount of regulatory capital that a financial institution must hold to
meet the Pillar 1 requirements for credit, market and operational risk.
Model validation The process of assessing how well a risk model performs, using a predefined set of
criteria including the discriminatory power of the model, the appropriateness of the inputs
and expert opinion.
Netting The ability to reduce credit risk exposures by offsetting the value of any deposits against
loans to the same counterparty.
Operational risk The risk of loss arising from failures of internal processes, people and systems or from
external events.
Probability of default (PD) An estimate of the probability that a borrower will default on their credit obligations in the
next 12 months.
Permanent Interest Bearing Shares (PIBS ) Unsecured, deferred shares of Nationwide that, in the event of insolvency, rank equally
with the claims of Additional Tier 1 (AT1) securities, behind the claims of all subordinated
debt holders, depositors, creditors and investing members of Nationwide, and ahead of the
claims of core capital deferred shares (CCDS) investors. PIBS are also known as subscribed
capital.
Pillar 1 – Minimum capital requirements The regulatory minimum capital requirements for credit, market and operational risk.
Pillar 2 – The supervisory review process Sets out the processes by which financial institutions review their overall capital adequacy.
Supervisors then evaluate how well financial institutions are assessing their risks and
take appropriate actions in response to the assessments. This includes all risks (including
Pillar 1 risks) – ICG is an outcome from Pillar 2.
Pillar 3 – Market discipline Disclosure requirements for firms to publish details of their risks, capital and risk
management. The aims are greater transparency and strengthening market discipline.
PiT Point-in-time. A modelling approach which assesses the credit risk of an exposure at a single
point in time.
Prime residential mortgages Mainstream residential loans, which typically have a higher credit quality and fit standard
underwriting processes. As such, they are likely to have a good credit history, and pass a
standard affordability assessment at the point of origination.
Nationwide Pillar 3 Disclosure 2019
112
Project Finance Loans advanced to provide financial support for public-private partnerships between the
public and private sectors under the Private Finance Initiative.
Provisions Amounts set aside to cover incurred losses associated with credit risks.
Present Value 01/200 (PV01 / PV200) A calculation to assess the change in value of the net present value (NPV) of financial
instruments with 1 basis point / 200 basis points parallel shifts in interest rates. PV01
shows the sensitivity while PV200 applies a more severe stress test.
Prudential Regulation Authority (PRA) The statutory body responsible for the prudential supervision of banks, building societies,
insurers and a small number of significant investment firms in the UK from 1 April 2013.
The PRA is a subsidiary of the Bank of England.
Qualifying Revolving Retail Exposures Facilities to retail customers that provide a revolving facility e.g. credit cards and
overdrafts from which credit risks arise. Nationwide ’s main current account is the
FlexAccount.
Rating system A system for assessing and ranking customers and accounts by risk. A rating system
comprises all of the methods, processes, controls, data collection and IT systems that
support the assessment of credit risk, the assignment of exposures to grades or pools
(rating), and the quantification of default and loss estimates for credit risk exposures.
Repurchase agreement (repo) / reverse
repurchase agreement (reverse repo)
An agreement that allows a borrower to use a financial security as collateral for a
cash loan. In a repo, the borrower agrees to sell a security to the lender subject to a
commitment to repurchase the asset at a specified price on a given date. For the party
selling the security (and agreeing to repurchase it in the future) it is a repo; for the
counterparty to the transaction (buying the security and agreeing to sell in the future) it is a
reverse repurchase agreement or reverse repo.
Resecuritisation A securitisation where the risk associated with an underlying pool of exposures is
tranched and at least one of the underlying exposures is a securitisation position.
Revaluation reserve The revaluation reserve represents the cumulative gains, and associated deferred taxation,
arising on the revaluation of certain property assets held by Nationwide.
Retail loans Loans to individuals rather than institutions, including residential mortgage lending and
consumer banking.
Reverse stress tests Regulatory stress tests that require a firm to assess scenarios and circumstances that would
render its business model unviable, thereby identifying potential business vulnerabilities.
Risk appetite The level and type of risk that Nationwide is willing to assume in pursuit of its strategic
goals.
Risk weighted assets (RWA) The value of assets, after adjustment under the capital rules to reflect the degree of risk
they represent.
RWA density Risk-weighted assets divided by exposure after default (post credit risk mitigation and
the application of credit conversion factors).
Securitisation A process by which a group of assets, usually loans, are aggregated into a pool, which
is used to back the issuance of new securities. A company transfers assets to a special
purpose entity (SPE) which then issues securities backed by the assets. The cash flows
from the assets are used to pay interest on and repay the debt securities.
Nationwide Pillar 3 Disclosure 2019
113
Senior non-preferred debt A form of wholesale funding that is unsecured and ranks behind the claims of all depositors,
creditors and other investing members, but before the claims of holders of regulatory capital
instruments (instruments qualifying as CET1, AT1 or Tier 2 capital).
Society Nationwide Building Society.
Specialist residential lending Consists of buy to let, self-certified and other non-standard mortgages.
SREP Supervisory Review and Evaluation Process, the PRA assessment of a firm’s own capital
assessment (ICA) under Pillar 2.
Standardised approach The basic method used to calculate credit risk capital requirements. In this approach the
risk weights used in the capital calculation are determined by regulators’ supervisory
parameters. The Standardised approach is less risk-sensitive than the internal ratings
based (IRB) approach.
Stress testing A process which involves identifying possible future adverse events or changes in
economic conditions that could have unfavourable effects on Nationwide (either financial
or non-financial), assessing Nationwide’s ability to withstand such changes, and identifying
management actions to mitigate the impact.
Subordinated debt A form of Tier 2 capital that is unsecured and ranks behind the claims of all depositors,
creditors and investing members but before the claims of holders of Additional Tier 1
securities (AT1), permanent interest bearing shares (PIBS) and core capital deferred shares
(CCDS).
Subordinated Liabilities Unsecured debt instruments issued by the Society consisting of non preferred senior debt,
and subordinated debt qualifying as Tier 2 capital.
The Standardised Approach (operational
risk)
The standardised approach to operational risk, calculated using three-year historical net
income multiplied by a factor of between 12-18%, depending on the underlying business
being considered.
Tier 1 capital A measure of the Nationwide’s financial strength. Tier 1 capital comprises Common Equity
Tier 1 capital and additional Tier 1 capital instruments.
Tier 2 capital A further measure of the Nationwide’s financial capital that meets the Tier 2 requirements
set out in the Capital Requirements Regulation (CRR), comprising qualifying
subordinated debt and other securities and eligible impairment allowances after regulatory
deductions.
Total Capital Requirements (TCR) The minimum amount of capital the Group should hold as set by the PRA under Pillar 2 and
informed by ICAAP (replaced the Individual Capital Guidance (ICG) in 2017).
Value at Risk (VaR) A technique that estimates the potential loss that could occur on risk positions as a
result of future movements in market rates and prices over a specified time horizon
and to a given level of statistical confidence. In its day to day monitoring, Nationwide
uses a 10 day horizon and a 99% confidence level.
Wrong-way risk Defined by the PRA as a situation where there is an adverse correlation between the
counterparty’s probability of default and the mark-to- market value of the underlying
transaction.
Nationwide Pillar 3 Disclosure 2019
114
Abbreviations
Abbreviation Brief description
ABS Asset Backed Securities
ACS Annual Cyclical Scenario
AIRB Advanced Internal Ratings Based
ALCO Assets and Liabilities Committee
AT1 Additional Tier 1
BRC Board Risk Committee
BRRD Bank Recovery and Resolution Directive
CCDS Core Capital Deferred Shares
CCF Credit Conversion Factors
CCP Central Counterparty
CCyB Countercyclical Capital Buffer
CET1 Common Equity Tier 1
CRD Capital Requirements Directive
CRE Commercial Real Estate
CRM Credit Risk Mitigation
CRR Capital Requirements Regulation
CSA Credit Support Annex
CST Concurrent Stress Testing
CVA Credit Valuation Adjustment
EAD Exposure at Default
EBA European Banking Authority
ECAI External Credit Assessment Institution
ECL Expected Credit Losses
EEA European Economic Area
ERC Executive Risk Committee
ERMF Enterprise Risk Management Framework
FCA Financial Conduct Authority
FI Financial Institution
FIRB Foundation Internal Ratings Based
FPC Financial Policy Committee
FSA Financial Services Authority
FVOCI Fair Value through Other Comprehensive Income
FVP&L Fair value through profit or loss (FVTPL)
FX PRR Foreign Exchange Position Risk Requirement
GIC Guaranteed Investment Contract
GMRA Global Master Repurchase Agreement
Abbreviation Brief description
GMSLA Global Master Securities Lending Agreement
G-SII Globally Systemically Important Institutions
ICA Internal Capital Assessment
ICAAP Internal Capital Adequacy Assessment Process
ICG Individual Capital Guidance
IFRS International Financial Reporting Standards
IPRE Income Producing Real Estate
IRB Internal Ratings Based
IRRBB Interest Rate Risk in the Banking Book
ISDA International Swaps and Derivatives Association
LARS Limits and Ratings System
LCR Liquidity Coverage Ratio
LGD Loss Given Default
LTV Loan to Value
MDB Multilateral Development Bank
MRT Material Risk Taker
NPV Net Present Value
NSFR Net Stable Funding Ratio
PD Probability of Default
PFE/PFCE Potential Future Credit Exposure
PIBS Permanent Interest Bearing Shares
PiT Point in Time
PRA Prudential Regulatory Authority
QCCP Qualifying Central Counterparty
RWA Risk Weighted Assets
RSL Registered Social Landlords
SMI Silverstone Master Issuer
SA Standardised Approach
SFT Security financing transaction
SRB Systemic Risk Buffer
TCR Total Capital Requirements
TFS Term Funding Scheme
VM Variation Margin
Z-VFN Z Variable Funding Note