Pillar 3 Disclosure Report 2019 - Clearstream · /pillar-iii-disclosure-report • This disclosure...
97
Clearstream Banking S.A. Pillar 3 Disclosure Report 2019
Transcript of Pillar 3 Disclosure Report 2019 - Clearstream · /pillar-iii-disclosure-report • This disclosure...

Clearstream Banking S.A.
Pillar 3 Disclosure Report 2019

I
Pillar III Disclosure Report 2019 of Clearstream Banking S.A.
In accordance with Part Eight of Regulation (EU) No. 575/2013 (Capital Requirements Regulation
(CRR)) and the EBA Guidelines on disclosure requirements under Part Eight of Regulation (EU) No.
575/2013 of 14 December 2016
April 2020
Document number: 7244
Information in this document is valid at the time of its publication. It does not represent any commitment on
the part of Clearstream Banking S.A. or any entity belonging to Clearstream Banking S.A. No part of this report
may be reproduced or transmitted in any form or by any means, electronic or mechanical, including
photocopying and recording, for any purposes without the express written consent of Clearstream Banking S.A.
© Copyright Clearstream Banking S.A. (2019). All rights reserved.
Clearstream Banking S.A. is a Clearstream Holding AG company, which in turn is a Deutsche Börse Group
company.

I
Foreword The purpose of this document is to fulfil regulatory disclosure requirements based on the
revised Basel banking framework commonly known as “Basel III”. Within the European
Union (EU), the current disclosure framework covers the “Basel III” requirements and
includes additional components as laid down by Directive 2013/36/EU (Capital
Requirements Directive, CRD IV) and Regulation (EU) No. 575/2013 (Capital Requirements
Regulation, CRR), commonly known as the CRD IV package.
Clearstream Banking S.A. (CBL) is part of Clearstream Holding AG (CH), which is a financial
holding company as defined in Art. 4 Paragraph 1.20 CRR and, together with its
subordinated companies, forms a financial holding Group under German law.
As of 1 January 2018, CBL is classified as an “Other Systemically Important Institution” (O-
SII). This is in line with the EBA Guidelines 2014/10 “on criteria to determine the conditions
of application of Art. 131(3) of Directive 2013/36/EU (CRD) in relation to the assessment of
other systemically important institutions (O-SIIs)” and CSSF Regulation N° 18-06. Due to this
classification, CBL is required to comply with the EBA Guidelines 2016/11 “on disclosure
requirements under Part Eight of Regulation (EU) No. 575/2013”.
CBL has also applied to be recognised as a Central Securities Depository (CSD) under EU
Regulation No. 909/2014 “on improving securities settlement in the European Union and on
central securities depositories and amending Directive 98/26/EC and 2014/65/EU and
Regulation (EU) No. 236/2012”.
The supervision of CBL lies with Commission de Surveillance du Secteur Financier (CSSF)
and Banque centrale du Luxembourg (BCL).
The financial statements of Clearstream Banking S.A. are prepared in a mixed accounting
regime of the Luxembourg Generally Accepted Accounting Principles (Lux GAAP) with IAS
options. The relevant IAS options are the following:
• Presentation of the balance sheet and of the income statement;
• Recognition, measurement and impairment of financial instruments as per IFRS 9 as at 1 January 2018;
• Recognition and measurement of leases as per IFRS 16 as at 1 January 2019;
• IAS 19 revised June 2011;
• Application of IFRS 2.43A – 43D to share-based payments. For regulatory purposes, the figures follow the International Financial Reporting Standards
(IFRS).
If not explicitly stated otherwise, all amounts are denominated in € thousands ('000).
Clearstream Banking S.A. fulfils the disclosure requirements detailed in Part Eight CRR and
the EBA Guidelines 2016/11, as well as Art. 38 of the Luxembourg Law of 5 April 1993, as
amended (in the following: Luxembourg Banking Act), which has transposed the disclosure
requirements of Art. 89 and 96 CRD IV into Luxembourg law, as follows:
• A remuneration report that fulfils the requirements of Art. 450 CRR. That report is
disclosed by year on the Clearstream Group website.
https://www.clearstream.com/clearstream-en/about-clearstream/regulation-1-
/remuneration-information/from-2014-onwards

II
• All other disclosure requirements as defined in Part Eight CRR and the related
technical standards are published within this Pillar III Disclosure Report, which can
also be found by year on the Clearstream Group website.
https://www.clearstream.com/clearstream-en/about-clearstream/regulation-1-
/pillar-iii-disclosure-report
• This disclosure report contains information about governance arrangements as
stipulated in Art. 38-1 of the Luxembourg Banking Act1 (implementation of Art. 88
CRD IV into Luxembourg law).
• Information about the return on assets (RoA) according to Art. 38-4 of the
Luxembourg Banking Act is disclosed by CBL under Note 9.3 in the notes to its
financial statements, which are published in the Luxembourg Trade and Companies
Register (Registre de Commerce and des Sociétés).
In the following, if not stated otherwise, we always refer to the respective laws in place
during the reporting period – that is, 2019 – and basically valid on 31 December 2019.
How this document is organised The report is presented over 12 chapters, as follows:
1. Introduction
2. Governance arrangements
3. Risk management overview
4. Linkages between financial statements and regulatory exposures
5. Composition of capital
6. Leverage ratio
7. Operational risk
8. Credit risk
9. Counterparty credit risk
10. Liquidity risk
11. Market risk
12. Remuneration
1 Law of 5 April 1993 as amended

III
Table of contents Foreword ...................................................................................................................................... I
How this document is organised......................................................................................................... II
Figures ........................................................................................................................................ VI
Tables ........................................................................................................................................ VII
1. Introduction ......................................................................................................................... 1
1.1 Regulatory framework ............................................................................................................ 1
1.1.1 Objective of the report ................................................................................................... 3
1.1.2 Scope of application (Art. 436 CRR) ................................................................................ 3
1.1.3 Frequency and means of disclosure (Art. 433 & 434 CRR) ............................................. 3
1.2 Clearstream Banking S.A. (Art. 436 CRR) ................................................................................ 3
1.2.1 Corporate structure ........................................................................................................ 4
1.2.2 Business operations ........................................................................................................ 4
1.2.3 Regulatory supervision .................................................................................................... 6
2. Governance arrangements (Art. 435 (2) CRR) ......................................................................... 8
2.1 General arrangements ............................................................................................................ 8
2.2 Supervisory board ................................................................................................................... 9
2.3 Committees ........................................................................................................................... 10
2.4 Executive Board .................................................................................................................... 12
3. Risk management overview ................................................................................................ 14
3.1 Risk Management Framework (Art. 435 (1) CCR .................................................................. 14
3.1.1 Risk statement .............................................................................................................. 14
3.1.2 Risk culture .................................................................................................................... 14
3.2 Risk management process .................................................................................................... 15
3.2.1 Risk identification .......................................................................................................... 15
3.2.2 Risk notification ............................................................................................................. 16
3.2.3 Risk assessment ............................................................................................................ 16
3.2.4 Risk mitigation and control ........................................................................................... 16
3.2.5 Risk monitoring and reporting ...................................................................................... 16
3.3 Risk profile............................................................................................................................. 17
3.4 Key prudential metrics .......................................................................................................... 18
4. Linkages between financial statements and regulatory exposures ....................................... 19
5. Composition of capital ........................................................................................................ 23
5.1 Capital components .............................................................................................................. 23
5.2 Reconciliation of regulatory capital to balance sheet .......................................................... 24
5.3 Description of the main features of capital instruments ...................................................... 24

IV
5.4 Regulatory capital requirements .......................................................................................... 25
5.5 Countercyclical capital buffer ............................................................................................... 26
6. Leverage ratio .................................................................................................................... 30
7. Operational risk .................................................................................................................. 32
7.1 Governance ........................................................................................................................... 32
7.2 Measurement ........................................................................................................................ 33
7.2.1 General concept ............................................................................................................ 33
7.2.2 Aggregate loss distribution ........................................................................................... 34
7.2.3 Monte Carlo simulation ................................................................................................ 35
7.2.4 Stress testing of operational risk .................................................................................. 36
7.3 Operational risk mitigation ................................................................................................... 37
7.3.1 Internal control system ................................................................................................. 37
7.3.2 Business continuity management ................................................................................. 37
7.3.3 Insurance ....................................................................................................................... 39
7.4 Monitoring and reporting ..................................................................................................... 39
8. Credit risk ........................................................................................................................... 40
8.1 Governance ........................................................................................................................... 40
8.2 Credit risk exposures ............................................................................................................. 41
8.2.1 Application of the standardised approach .................................................................... 41
8.2.2 Detailed information and distribution of credit risk exposure ..................................... 42
8.2.3 Stress testing of credit risk ............................................................................................ 50
8.3 Credit risk mitigation ............................................................................................................. 50
8.3.1 Collateral ....................................................................................................................... 52
8.4 Repurchase agreements ....................................................................................................... 53
8.5 ASL ......................................................................................................................................... 54
8.5.1 Risk guarantee ............................................................................................................... 55
8.5.2 Coverage value .............................................................................................................. 55
8.5.3 Collateral eligibility........................................................................................................ 55
8.6 ASLplus .................................................................................................................................. 55
8.7 Monitoring and reporting ..................................................................................................... 56
8.8 Asset encumbrance ............................................................................................................... 56
9. Counterparty credit risk ...................................................................................................... 59
9.1 Governance ........................................................................................................................... 59
9.2 Measurement and mitigation ............................................................................................... 59
9.3 Derivatives CCR ..................................................................................................................... 61
10. Liquidity risk ....................................................................................................................... 62

V
10.1 Governance ........................................................................................................................... 62
10.2 Strategy ................................................................................................................................. 63
10.3 Objectives.............................................................................................................................. 63
10.4 Measurement ........................................................................................................................ 64
10.5 Liquidity risk mitigation ......................................................................................................... 67
10.6 Stress tests ............................................................................................................................ 69
10.7 Medium-term liquidity sources ........................................................................................ 71
10.8 Permanently available liquidity ......................................................................................... 71
10.9 Contingency funding plan ................................................................................................. 72
10.10 Monitoring and reporting ................................................................................................. 72
11. Market risk ......................................................................................................................... 73
11.1 Governance ........................................................................................................................... 73
11.2 Measurement ........................................................................................................................ 73
11.3 Market risk mitigation ........................................................................................................... 74
11.4 Monitoring and reporting ..................................................................................................... 74
11.5 Specific disclosures per market risk type .............................................................................. 74
11.5.1 Foreign exchange risk.................................................................................................... 74
11.5.2 Interest rate risk in the banking book ........................................................................... 75
12. Remuneration .................................................................................................................... 78
12.1 Governance ........................................................................................................................... 78
12.2 Remuneration systems ......................................................................................................... 79
12.2.1 Appropriateness of remuneration ................................................................................ 79
12.2.2 Total amount of variable remuneration ....................................................................... 81
12.2.3 Individual performance ................................................................................................. 81
12.3 Rules on remuneration systems for members of the Executive Board, risk takers and
employees in charge of a control unit .............................................................................................. 81
12.3.1 Risk analysis................................................................................................................... 81
12.3.2 Criteria in determining variable remuneration ............................................................. 82
12.3.3 Deferral of variable remuneration ................................................................................ 82
12.3.4 Link to the Group’s long-term performance ................................................................. 83
Appendix A – Abbreviations used in this document ..................................................................... 84

VI
Figures Figure 1 - Overview regulatory framework ............................................................................................. 1
Figure 2 - Overview corporate structure ................................................................................................ 4
Figure 3 - Five-level risk management system with central and decentralised responsibilities .......... 15
Figure 4 - Risk profile of Clearstream .................................................................................................... 17

VII
Tables Table 1 - Number of directorships held per Supervisory Board member ............................................. 10
Table 2 - Number of directorships held per Executive Board member ................................................ 13
Table 3 - Key prudential metrics ........................................................................................................... 18
Table 4 - Differences between accounting and regulatory scopes of consolidation and the mapping of
financial statement categories with regulatory risk categories............................................................ 20
Table 5 - Main sources of differences between regulatory exposure amounts and carrying values in
financial statements .............................................................................................................................. 21
Table 6 - Outline of the differences in the scope of consolidation (entity by entity) ........................... 22
Table 7 - Composition of regulatory capital.......................................................................................... 24
Table 8 - Reconciliation of regulatory capital to balance sheet ............................................................ 24
Table 9 - Main feature of regulatory capital instruments and other TLAC-eligible instruments ......... 25
Table 10 - Overview of RWAs ................................................................................................................ 26
Table 11 - Geographical distribution of credit exposures relevant to the calculation of the
countercyclical capital buffer ................................................................................................................ 29
Table 12 - Amount of institution-specific countercyclical capital buffer .............................................. 29
Table 13 - Summary comparison of accounting assets vs. leverage ratio exposure measure ............. 30
Table 14 - Leverage ratio common disclosure template ...................................................................... 31
Table 15 - Standardised approach - risk weights .................................................................................. 42
Table 16 - Total and average net amount of exposure ......................................................................... 44
Table 17 - Geographical breakdown of exposures ............................................................................... 44
Table 18 - Concentration of exposures by industry or counterparty types .......................................... 45
Table 19 - Maturity of exposures .......................................................................................................... 46
Table 20 - Credit quality of exposures by exposure class and instrument ........................................... 47
Table 21 - Credit quality of exposures by industry or counterparty types ........................................... 48
Table 22 - Credit quality of exposures by geography ........................................................................... 48
Table 23 - Ageing of past-due exposures .............................................................................................. 48
Table 24 - Non-performing and forborne exposures ............................................................................ 49
Table 25 - Changes in the stock of general and specific credit risk adjustments ................................. 49
Table 26 - Changes in the stock of defaulted and impaired loans and debt securities ........................ 50
Table 27 - Standardised approach - credit risk exposures and CRM effect .......................................... 52
Table 28 - CRM techniques - on-balance sheet .................................................................................... 53
Table 29- CRM techniques - off-balance sheet ..................................................................................... 53
Table 30 - Encumbered and unencumbered assets .............................................................................. 57
Table 31 - Collateral received ............................................................................................................... 58
Table 32 - Sources of encumbrance ...................................................................................................... 58
Table 33 - Analysis of CCR exposure by approach ................................................................................ 60
Table 34 - CVA capital charge ............................................................................................................... 60
Table 35 - Standardised approach - CCR exposures by regulatory portfolio and risk .......................... 60
Table 36 - Impact of netting and collateral held on exposure values ................................................... 61
Table 37 A - Liquidity Coverage Ratio (LCR) .......................................................................................... 65
Table 37 B - Liquidity Coverage Ratio (LCR) .......................................................................................... 66
Table 38 - Internal liquidity ratio I ........................................................................................................ 67
Table 39 - Internal liquidity ratio II ....................................................................................................... 67
Table 40 - Liquidity buffer ..................................................................................................................... 68
Table 41 - Open currency positions ...................................................................................................... 74
Table 42 - Limits for CBL in line with Treasury Policy ........................................................................... 76

VIII
Table 43 - Interest rate risk in the banking book – Clearstream Banking S.A. ...................................... 77

1
1. Introduction
1.1 Regulatory framework In 2004, the Basel Committee on Banking Supervision (“BCBS”) published its standards
governing the capital adequacy of internationally active banks (“Basel II”). The Basel
framework consists of three mutually reinforcing pillars, as outlined below.
• Pillar 1 concerns the minimum quantitative (capital) requirements related to credit,
operational and market risks
• Pillar 2 requires banks to integrate the risks of Pillar 1 and further significant and
substantial risks into integrated capital management and risk management
considerations. Additionally, the interaction between the banks’ own assessments and the banking supervisors’ review is prescribed
• Pillar 3 promotes market discipline through disclosure and thereby transparency to
the public
Figure 1 - Overview regulatory framework
In December 2010, BCBS published its revised regulatory banking framework commonly
known as “Basel III”2, which is an internationally agreed set of measures to strengthen the
regulation, supervision and risk management of banks. The Basel III framework is translated
into European law through Regulation (EU) No. 575/2013 of the European Parliament and
the Council of 26 June 2013 on prudential requirements for credit institutions and
investment firms (“CRR”) and Directive 2013/36/EU of the European Parliament and of the
Council of 26 June 2013 on access to the activity of credit institutions and the prudential
supervision of credit institutions and investment firms (“CRD IV”). Furthermore, the
requirements outlined in Art. 89 to 96 CRD IV have been transposed into Luxembourg law in
2 The main documents of this package are: "Basel III: A global regulatory framework for more resilient banks and banking
systems": http://www.bis.org/publ/bcbs189.htm, "Basel III: The Liquidity Coverage Ratio and liquidity risk monitoring tools":
http://www.bis.org/publ/bcbs238.pdf and "Basel III: the net stable funding ratio": http://www.bis.org/bcbs/publ/d295.pdf

2
Art. 38 of the Luxembourg Law of 5 April 1993, as amended (in the following: Luxembourg
Banking Act).
Furthermore, modified as well as new disclosure requirements have been outlined in the
revised banking package – the amended Capital Requirements Regulation (“CRR II”) and
Capital Requirements Directive (“CRD V”) that still need to be transposed into national law.
These new disclosure requirements take effect on 28 June 2021.
In addition to the previously mentioned regulation and directive, this report considers the
following regulatory publications:
− Commission Implementing Regulation (EU) No. 1423/2013 of 20 December 2013 laying
down implementing technical standards with regard to disclosure of own funds
requirements for institutions according to Regulation 575/2013 of the European Parliament and Council
− Commission Implementing Regulation (EU) 2016/200 of 15 February 2016 laying down implementing technical standards with regard to disclosure of the leverage ratio for institutions, according to Regulation (EU) No. 575/2013 of the European Parliament and
of the Council
− Commission Delegated Regulation (EU) 2015/1555 of 28 May 2015 supplementing
Regulation (EU) No. 575/2013 of the European Parliament and of the Council with regard to regulatory technical standards for the disclosure of information in relation to the compliance of institutions with the requirement for a countercyclical capital buffer in
accordance with Art. 440
− Commission Delegated Regulation (EU) 2017/2295 of 4 September 2017 supplementing
Regulation (EU) No. 575/2013 of the European Parliament and of the Council with regard to regulatory technical standards for disclosure of encumbered and unencumbered
assets
− EBA/GL/2014/03 of 27 June 2014: Guidelines on Disclosure on Encumbered Assets
− EBA/GL/2014/14 of 23 December 2014: Guidelines on materiality, proprietary and confidentiality and on disclosure frequency under Art. 432(1), 432(2) and 433 of Regulation (EU) No. 575/2013
− EBA/GL/2016/11 of 14 December 2016: Guidelines on disclosure requirements under Part Eight of Regulation (EU) No. 575/2013
− EBA/GL/2017/01 of 21 June 2017: Guidelines on LCR disclosure to complement the disclosure of liquidity risk management under Art. 435 of Regulation (EU) No. 575/2013
− EBA/GL/2018/01 of 16 January 2018: Guidelines on uniform disclosures under Art. 473a of Regulation (EU) No. 575/2013 as regards the transitional period for mitigating the
impact of the introduction of IFRS 9 on own funds
− CSSF Circular 17/673 referring to Guidelines on Disclosure Requirements under part eight of Regulation (EU) of 14 December 2016 as amended on 9 June 2017
− CSSF Circular 18/676 referring to Guidelines on LCR Disclosure to complement the disclosure of Liquidity Risk Management under Art. 435 of Regulation (EU) No. 575/2013 and EBA/GL/2017/01 of 8 March 2017
− CSSF Circular 18/687 Adoption of the EBA Guidelines on uniform disclosures under Art. 473a of Regulation (EU) No. 575/2013 as regards the transitional period for mitigating
the impact of the introduction of IFRS 9 on own funds (EBA/GL/2018/01

3
In the following, we refer to the respective laws in place as of 31 December 2019 if not
stated otherwise.
1.1.1 Objective of the report The objective of this Disclosure Report is to fulfil the disclosure requirements detailed in
Part 8 CRR and Art. 38 of the Luxembourg Law of 5 April 1993 (“Luxembourg Banking Act”),
at the legal entity level of Clearstream Banking S.A. (“CBL”). More specifically, the report
intends to provide a detailed overview on Clearstream Baking S.A.’s
• Legal structure
• Capital structure
• Risk management framework including governance arrangements, risk management methodology and risk reporting
• Risk management in terms of identified risk types
To ensure adequate application of the disclosure requirements a Disclosure Policy has been
established, which is reviewed and adapted, where necessary, on a yearly basis. Further,
the Disclosure Policy allocates responsibilities and defines processes.
1.1.2 Scope of application (Art. 436 CRR) CBL has 4 subsidiaries, however, on grounds of no-materiality these are not consolidated
for accounting purposes and CBL has also been exempted of consolidation for regulatory
reporting purposes.
As such, this Disclosure Report only covers CBL on a stand-alone basis.
All disclosed information is reported in CBL’s accounting and reporting currency, Euro, if
not otherwise specified.
1.1.3 Frequency and means of disclosure (Art. 433 & 434 CRR) In accordance with Art. 434 CRR, CBL publishes its Disclosure Report on its website:
www.clearstream.com/clearstream-en/about-clearstream/regulation-1-/pillar-iii-
disclosure-report
The report is updated once a year. In addition to the Pillar 3 report, the following
documents are also made available:
− A remuneration report that fulfils the requirements according to Art. 450 CRR. That report
is disclosed by year on the website of Clearstream Group: www.clearstream.com/clearstream-en/about-clearstream/regulation-1-/remuneration-
information
− Information about the return on assets (RoA) according to Art. 38-4 of the Luxembourg Banking Act is disclosed by CBL under Note 9.3 in the notes to its financial statements, which are published in the Luxembourg Trade and Companies Register (Registre de Commerce and des Sociétés).
1.2 Clearstream Banking S.A. (Art. 436 CRR) Clearstream Banking S.A. (“CBL”) was founded in 1970 in Luxembourg and has its registered
office at 42 Avenue J.F. Kennedy, L-1855 Luxembourg.
CBL is classified as a public limited company (Société Anonyme). It is governed by its
Articles of Incorporation and Luxembourg company law.

4
1.2.1 Corporate structure As at 31 December 2019, the Bank was directly fully owned by Clearstream Holding AG
(2018: by Clearstream International S.A.). Following (i) the merger of Clearstream
Participations S.A. into Clearstream Beteiligungs AG and (ii) the merger of Clearstream
Holding AG into Clearstream Beteiligungs AG (which was renamed into Clearstream Holding
AG), the participations previously held by Clearstream International S.A. have been
transferred to Clearstream Holding AG with effective date 12 November 2019. Clearstream
Holding AG is itself directly fully owned by Deutsche Börse AG, the ultimate parent of the
Bank. The ownership structure of CBL as part of DBG is shown below.
Figure 2 - Overview corporate structure
1.2.2 Business operations CBL acts as an International Central Securities Depository (ICSD) which provides settlement
and custody services for international securities.
These services include:
• Delivery versus payment and delivery free of payment settlement transactions;
• Comprehensive custody management;
• Value-added services, such as securities lending, collateral management etc.; and
• Transactional information distribution.
Further services offered by CBL include the issuance of securities, Investment Funds
Services and Global Securities Financing, consisting of securities lending as well as collateral
management services. In addition, CBL provides operative treasury services for CBF as well
as for CI and Clearstream Services S.A. (“CS”).

5
Moreover, due to the cross-border merger of Clearstream Fund Centre ltd (“CFCL”) into
Clearstream Banking S.A on 1 March 2019, CFCL’s assets, debts, rights, obligations and
liabilities (including contracts) moved by process of law to CBL. The merger was carried out
in order to ensure the continued smooth operation of business activities over the period of
political uncertainty caused by Brexit and to allow the distribution support services for
Investment Funds, that was the principle activity of CFCL, to be offered in association with
CBL’s other services. In May 2019, CBL launched an enhanced distribution support service –
called Fund Desk – for all its customers.
Additionally, CBL applied for an authorisation as CSD according to Art. 17 including
providing banking-type ancillary services according to Art. 54 Paragraph (2) lit. (a) of
Regulation (EU) No. 909/2014 (“Central Securities Depositories Regulation”, “CSDR”). The
authorisation is expected to be provided in spring 2021.
CBL holds the following branches/participations:
CBL Singapore branch (“CBS”)
CBS is a branch of CBL and its first operational centre outside Europe. In November 2009,
CBL obtained a banking licence, which has been updated in October 2017. All of CBL’s
products and services, including Global Securities Financing, Investment Funds Services and
Issuance and Distribution, are offered locally to customers in the Asia-Pacific region.
CBL London branch
In January 2016, Clearstream transformed its representative office in London into a fully-
fledged branch, which took over the activities of the representative office.
Clearstream Banking Japan Ltd, Tokyo (“CBJ”)
In 2009, CBL established a fully owned subsidiary in Tokyo, Japan. The purpose of
Clearstream Banking Japan Ltd (“CBJ”) is to engage in marketing, information provision and
advertising; holding financial seminars and other education and training courses; support of
existing customers of group companies and any other business activities relating to any of
the preceding.
Clearstream London Limited (“CLL”)
On 27 December 2018 CBL established a fully owned subsidiary called Clearstream London
Limited (“CLL”) in London, UK. CLL is a dormant entity that has submitted an application for
an Arranger licence to the Financial Conduct Authority. CLL considers that the Arranger
licence is sufficient to cover the full extent of its UK-based activity, which therefore
represents a viable contingency path at the conclusion of the temporary permissions
regimes under which it intends to operate in the period following exit day.
REGIS-TR S.A., Luxembourg (“REGIS-TR“)
REGIS-TR S.A. is a public limited liability company (“Société Anonyme”) organised and
existing under the laws of Luxembourg. The Company was launched on 9 December 2010
by the Spanish Central Securities Depository, Sociedad de Gestión de los Sistemas de
Registro, Compensación y Liquidación de Valores, S.A. and Clearstream Banking S.A. as a
50/50 joint venture, and is headquartered in the Grand Duchy of Luxembourg, with a
branch in Madrid.

6
REGIS-TR is a European Trade Repository (TR) for reporting trades and transactions across
multiple product classes and jurisdictions. The TR is open to financial and non-financial
institutions, and services the major regulatory reporting obligations in Europe.
REGIS-TR has been registered by the European Markets and Securities Authority (ESMA) on
14 November 2013 in accordance with Regulation (EU) No. 648/2012 of the European
Parliament and of the Council of 4 July 2012 on OTC derivatives, central counterparties and
trade repositories (European Market Infrastructure Regulation), for the provision of
reporting services commonly referred to as “EMIR”.
In addition, REGIS-TR was recognised by the Swiss Financial Market Supervisory Authority
(FINMA) on 1 April 2017 as a foreign trade repository in accordance with Art. 80 FMIA for
the receipt of reports about derivatives transactions from persons subject to reporting
requirements in accordance with Art. 104 FMIA and Art. 105 paragraph 2 FMIA in
conjunction with Art. 93 FMIO, for the provision of reporting services commonly to as
“FinfraG”.
In addition to its existing core services, REGIS-TR is progressing well towards its goal of
becoming a one-stop shop for regulatory reporting requirements and has developed its
Securities Financing Transaction Reporting service which is expected to enter into force on
13 July 2020. REGIS-TR applied to ESMA for a service extension enabling it to perform Trade
Repository services pertaining to the Securities Finance Transaction Reporting regulation
2015/2365 of 25 November 2015 (SFTR).
Since 2010, REGIS-TR is fully consolidated in the DB Group financial statements. With
regard to the consolidation provisions set out in the CRR/KWG, REGIS-TR has been
classified as an “other undertaking” and is therefore not included in regulatory
consolidation.
Ausmaq Limited, Sydney, Australia
Clearstream Banking S.A., successfully completed the acquisition of Ausmaq Limited,
Sydney, Australia, during the third quarter of 2019. With this acquisition, Clearstream is
further expanding its offering in the investment funds space and has entered the Australian
market. Ausmaq Limited has been a wholly owned subsidiary of Clearstream Banking
Luxembourg since 31 July 2019. Due to the expansion of its geographical footprint,
Clearstream expects the transaction to deliver revenue synergies.
1.2.3 Regulatory supervision Commission de Surveillance du Secteur Financier (“CSSF”) is the competent authority for
the supervision of CBL as a credit institution according to Art. 42 and 43 of the Luxembourg
Banking Act. Furthermore, Banque Centrale du Luxembourg (“BCL”) has a shared
responsibility for liquidity supervision on the basis of Art. 2 (4) of the Law of 23 December
1998 concerning the monetary status.
Moreover, CBL is subject to regulatory supervision in relation to the securities settlement
system (“SSS”) according to Title V of the Luxembourg Law of 10 November 2009 relating
to payment services. BCL is responsible for the oversight of SSSs, as per Art. 110 of the Law
of 10 November 2009. The oversight focuses on the operational and financial stability of
each system individually, the participants in such systems as well as the stability of the
financial system as a whole. Furthermore, specific regulations for SSSs must be considered
(e.g. circulars BCL 2001/163 and 2001/168). Additionally, being in the scope of Regulation

7
(EU) No. 909/2014 (CSDR), CBL applied for authorisation as a CSD according to Art. 17 in
September 2017 (including providing banking-type ancillary services according to Art. 54
Paragraph (2) lit. a.). CBL does not expect to receive the authorisation before 2020.
As of 1 January 2018, Clearstream Banking S.A. is classified as Other Systemically Important
Institution (“O-SII”) as per CSSF Regulation N° 18-06 since the competent authorities
comply with the EBA Guidelines 2014/10 on criteria to determine the conditions of
application of Art. 131(3) of Directive 2013/36/EU (CRD IV) in relation to the assessment of
other systemically important institutions. Due to its classification as an O-SII, CBL must
produce a stand-alone Pillar 3 disclosure report.
Clearstream Holding as the superordinate company of the financial holding Group
according to §10a (1) KWG, is responsible for fulfilling the regulatory obligations on a
consolidated/Group level vis-à-vis the German supervisory authorities and presents a Pillar
3 report in compliance with the disclosure requirements pursuant to Part Eight CRR and §
26a KWG.

8
2. Governance arrangements (Art. 435 (2) CRR)
2.1 General arrangements Clearstream Banking S.A. (the “Company”) is incorporated in Luxembourg in the form of a
public limited company (Société Anonyme). According to its Articles of Incorporation,
Clearstream Banking S.A. has an Executive and a Supervisory Board. The members of the
Executive Board and the Supervisory Board conduct the business of the Company in
accordance with all applicable laws and regulations, notably the Law of 10 August 1915 on
commercial companies, as amended, as well as the Law of 5 April 1993 on the financial
sector, as amended, CSSF circulars, notably the CSSF Circular 12/552, as amended, the
relevant EU framework, notably the Central Securities Depositories Regulation (CSDR)
including its implementing acts, the Articles of Incorporation and these Internal Rules &
Regulations.
CBL maintains a comprehensive suitability assessment policy and a corresponding side-
letter defining specific job descriptions of Supervisory Board and Executive Board members.
The objective of this policy is to ensure that members of the Executive Board of CBL, the
members of the Supervisory Board and key function holders of CBL are suitable in terms of
reputation, experience and governance criteria, as stipulated in the joint ESMA and EBA
“Guidelines on the assessment of the suitability of members of the management body and
key function holders under Directive 2013/36/EU and Directive 2014/65/EU”
(EBA/GL/2017/12/ESMA71-99-598) as well as in the Luxembourg Banking Act and Central
Securities Depositories Regulation (“CSDR”).
In addition to the suitability assessment policy, CBL has defined several diversity principles
that govern the selection of Executive Board and Supervisory Board members. The
principles, listed below in detail, refer to educational and professional background, gender,
age and geographical provenance with the aim to achieve a variety of views and
experiences and to facilitate independent opinions within the Executive Board and the
Supervisory Board.
− CBL aims to achieve a balanced representation of women and men.
− The age structure of the Boards should be of an appropriately broad range.
− An appropriately broad range of educational and professional backgrounds should be present in the Boards.
− The composition of the Boards should reflect CBL’s international profile.
The suitability assessment is initiated when it is intended to appoint or elect a new member
of the Executive Board or the Supervisory Board, if a member resigns from the mandate
causing material changes to the composition of the management body, in case of any
material changes (e.g. reduction of work time, change regarding the scope or nature of the
mandate or negative event with regard to the reputation) and on a regular basis, at least
once a year.
To benefit from a balanced gender diversity and to fulfil the requirement of Art. 27 (4) of
the Regulation (EU) No. 909/2014 the Supervisory Board of Clearstream Banking S.A. has
approved the Gender Diversity Policy as published on Clearstream’s website and decided
on a target to increase the number of the under-represented gender in the management
body.

9
The members of the Supervisory Board of Clearstream Banking S.A. agreed on the
proposed 20% target quota for the representation of the under-represented gender
(currently female) in both the Supervisory Board and the Executive Board until 31
December 2021.
Since 2018, the rules of the limitation of mandates in accordance with Art. 38-2 of the
Luxembourg Banking Act must be complied with. Under this definition, and in
consideration of the legal permissibility of the aggregation of mandates, on 31 December
2019 all members of the Executive Board and the Supervisory Board of CBL complied with
these rules.
In the following paragraphs, the composition of all boards and committees is reflected as at
the end of the reporting period, being 31 December 2019.
2.2 Supervisory board According to the Articles of Incorporation of CBL, the Supervisory Board consists of at least
three members. The members of the Supervisory Board are required to fulfil certain criteria,
as laid down in the Suitability Assessment Policy, and to comply with regulatory
requirements, as set out in the section above. Furthermore, the Supervisory Board in its
entirety must have the necessary skills, capabilities and experience to supervise and control
the Executive Board of CBL. This requires understanding of the business of a credit
institution/central securities depositor. Such criteria include but are not limited to:
Members of the management body should have an up-to-date understanding of the
business of the Company and its risks. The assessment of a member’s knowledge, skills and
experience should consider both the theoretical experience attained through education
and training and the practical experience gained in previous occupations.
A member of the management body should be considered to be of good repute, honesty
and integrity if there are no objective and demonstrable grounds to suggest otherwise and
no reason to have reasonable doubt about his or her good repute, honesty and integrity.
The Nomination Committee prepares a job description and a candidate profile for a specific
position, which is resolved by the Supervisory Board. Subsequently, the Nomination
Committee identifies and recommends suitable candidates, who are sent for approval to
the General Meeting of Shareholders. Following selection and nomination, Boards and
Committees Clearstream prepares the formal decision of the General Meeting of
Shareholders to appoint the candidate as new member. The appointments of members to
the Supervisory Board require prior express approval by the competent authority (CSSF).
As at 31 December 2019, the Supervisory Board consisted of the persons displayed in Table
1, which also discloses the number of directorships held by each member as required by
Art. 435 (2) of CRR.

10
Name/position Number of directorships
Stephan Leithner – Chairman 10
Gregor Pottmeyer – Vice Chairman 6
Oliver Engels 4
Marc Robert-Nicoud 2
Ernst Wilhelm Contzen 2
Wolfgang Gaertner 2
Marie-Jeanne Chevremont 7 Table 1 - Number of directorships held per Supervisory Board member
The Supervisory Board typically meets four times per year, with additional meetings
possible at the discretion of the Chairman. In these meetings, it is informed about normal
business activities as well as all substantial business events. In case of extraordinary
incidents, the CBL Supervisory Board is informed immediately.
2.3 Committees In 2019, the CBL Supervisory Board Committees comprised the Audit Committee, Risk
Committee, Nomination Committee and Remuneration Committee. All four committees
have three members each and the Audit Committee is chaired by an independent member
of the Supervisory Board.
Audit Committee
Members Tasks and responsibilities
▪ Ernst-Wilhelm Contzen – Chairman
▪ Marc Robert-Nicoud – Vice
Chairman
▪ Wolfgang Gaertner
▪ Marie-Jeanne Chevremont (Q4)
▪ Karl van Gestel (Q1-Q2)
▪ Monitors accounting and financial reporting processes;
▪ Monitors the effectiveness of the risk management process, in
particular, the Internal Control System (ICS), the risk
management system and internal audit;
▪ Monitors the execution of audits, in particular, in relation to
the selection and independence of the auditor and the
services provided by the auditor (for example, scope,
frequency or reports);
▪ Submits recommendations to the Supervisory Board to ensure
the integrity of the reporting and accounting processes.
Nomination Committee
Members Tasks and responsibilities
▪ Wolfgang Gaertner – Chairman
▪ Stephan Leithner
▪ Ernst Wilhelm Contzen
▪ Identifies, recommends and promotes, for the approval of the
Supervisory Board (SB) and General Meeting of Shareholders,
candidates to fill vacancies in the Executive Board (EB) and SB,
with the objective to reach a balance and diversity of
knowledge, skills and experience, as well as gender diversity
amongst the respective members;
▪ Periodically assesses the general structure and performance
of EB and SB and provides related recommendations to the SB

11
Members Tasks and responsibilities
for improvements;
▪ Assesses the knowledge, skills and experience of respective
boards, on an individual and collective basis.
Remuneration Committee
Members Tasks and responsibilities
▪ Stephan Leithner – Chairman
▪ Gregor Pottmeyer – Vice Chairman
▪ Wolfgang Gaertner
▪ Supervises the reasonableness of the remuneration system of
executive management members. In particular, it supervises the
appropriateness of the compensation of the Head of the risk
function and of the compliance function as well as employees
having a substantial influence on the overall risk profile of the
institution. It also supports the Supervisory Board in monitoring
the reasonableness of the remuneration system of employees
as well as the institution. At the same time, it assesses the
impacts of the remuneration system on the risk, capital and
liquidity management;
▪ Supports the Supervisory Board in overseeing the internal
control system and all other relevant areas in the structuring of
the remuneration system
Risk Committee
Members Tasks and responsibilities
▪ Oliver Engels – Chairman
▪ Stephan Leithner – Vice Chairman
▪ Marc Robert-Nicoud
▪ Advises the Supervisory Board on the institution’s overall
current and future risk appetite, risk tolerance and risk strategy
and assists the Supervisory Board in overseeing the
implementation of that strategy;
▪ Reviews whether the conditions offered to customers take into
account the institution’s business model and risk structure. If
this is not the case, the Risk Committee submits proposals to
the Executive Board, about how the conditions applied to
customers in accordance with the business model and the risk
structure could be created;
▪ Examines whether incentives provided by the remuneration
system take into consideration the risk, capital and liquidity
structure of the institution and the likelihood and timing of
earnings;
▪ Takes advice from external experts, if necessary. It determines
type, comprehensiveness, format and frequency of information
to be provided by the Executive Board with regard to strategy
and risk.
12
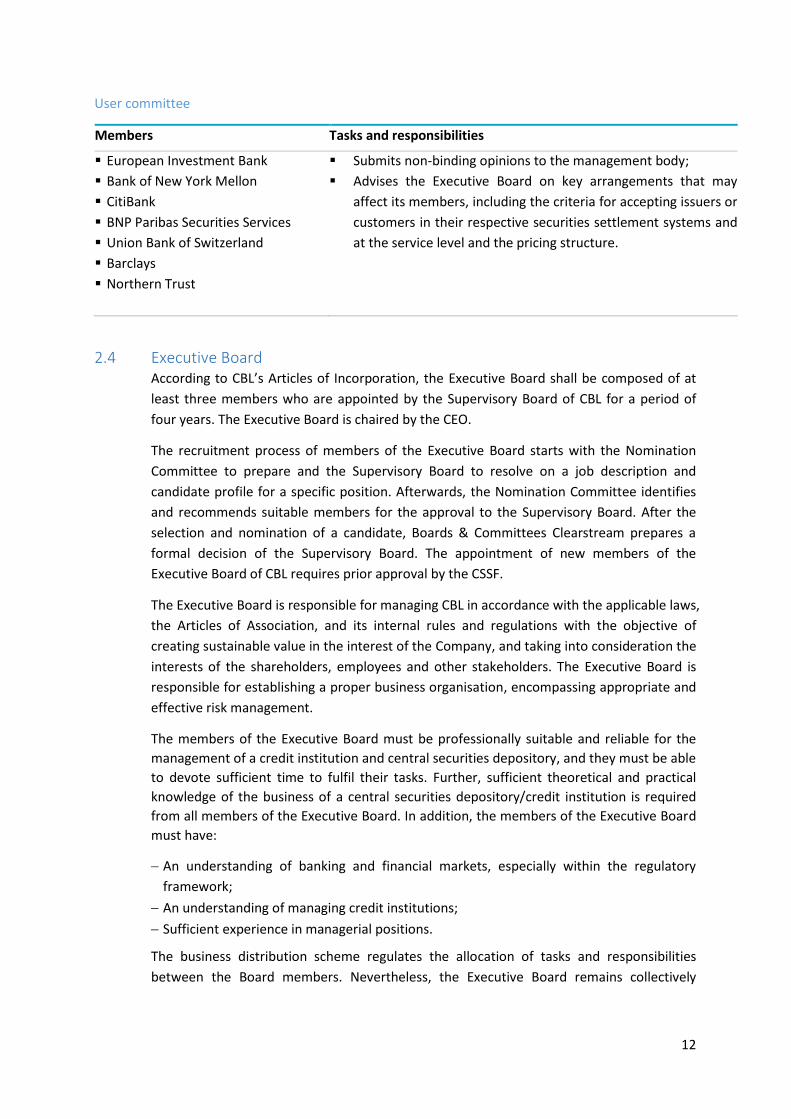
User committee
Members Tasks and responsibilities
▪ European Investment Bank
▪ Bank of New York Mellon
▪ CitiBank
▪ BNP Paribas Securities Services
▪ Union Bank of Switzerland
▪ Barclays
▪ Northern Trust
▪ Submits non-binding opinions to the management body;
▪ Advises the Executive Board on key arrangements that may
affect its members, including the criteria for accepting issuers or
customers in their respective securities settlement systems and
at the service level and the pricing structure.
2.4 Executive Board According to CBL’s Articles of Incorporation, the Executive Board shall be composed of at
least three members who are appointed by the Supervisory Board of CBL for a period of
four years. The Executive Board is chaired by the CEO.
The recruitment process of members of the Executive Board starts with the Nomination
Committee to prepare and the Supervisory Board to resolve on a job description and
candidate profile for a specific position. Afterwards, the Nomination Committee identifies
and recommends suitable members for the approval to the Supervisory Board. After the
selection and nomination of a candidate, Boards & Committees Clearstream prepares a
formal decision of the Supervisory Board. The appointment of new members of the
Executive Board of CBL requires prior approval by the CSSF.
The Executive Board is responsible for managing CBL in accordance with the applicable laws,
the Articles of Association, and its internal rules and regulations with the objective of
creating sustainable value in the interest of the Company, and taking into consideration the
interests of the shareholders, employees and other stakeholders. The Executive Board is
responsible for establishing a proper business organisation, encompassing appropriate and
effective risk management.
The members of the Executive Board must be professionally suitable and reliable for the
management of a credit institution and central securities depository, and they must be able
to devote sufficient time to fulfil their tasks. Further, sufficient theoretical and practical
knowledge of the business of a central securities depository/credit institution is required
from all members of the Executive Board. In addition, the members of the Executive Board
must have:
− An understanding of banking and financial markets, especially within the regulatory
framework;
− An understanding of managing credit institutions;
− Sufficient experience in managerial positions.
The business distribution scheme regulates the allocation of tasks and responsibilities
between the Board members. Nevertheless, the Executive Board remains collectively

13
responsible for the fulfilment of the duties as defined by law and set out in the Articles of
Incorporation (overall responsibility).
Meetings of the Executive Board are held monthly or more frequently if required.
As at 31 December 2019, the Executive Board consisted of the persons displayed in Table 2,
which also discloses the number of directorships held by each member, as required by Art.
435 (2) CRR.
Name/position Number of directorships
Philippe Seyll – Chief Executive Officer 7
João Amaral 1
Maurice Lamy 4
Mathias Papenfuß 5
Denis Schloremberg 1
Guido Wille 1 Table 2 - Number of directorships held per Executive Board member

14
3. Risk management overview
3.1 Risk Management Framework (Art. 435 (1) CCR Risk management is a fundamental component of Clearstream’s management and control
framework. Effective and efficient risk management is vital to protect Clearstream's
interests and simultaneously enables Clearstream to achieve its corporate goals.
Clearstream has therefore established a Group-wide risk management system comprising
roles, processes and responsibilities applicable to all employees and organisational units of
Clearstream. This ensures that emerging risks are identified and managed as early as
possible.
Clearstream’s risk strategy is based upon the business strategy and regulates the extent of
risks taken throughout the various business activities carried out. This is ensured by
determining conditions for risk management, control and limitation. Thus, Clearstream
gives considerable attention to its risk mitigation process and ensures that appropriate
measures are taken to avoid, reduce and transfer risk or, alternatively, to intentionally
accept it. Therefore, timely and adequate control of risk must be ensured. More specifically,
information required for controlling risk is assessed using structured and consistent
methods and processes. The results are collated and incorporated into a reporting system
enabling measurement and control of risks. Consequently, risk reporting is based on
reliable information and carried out on a regular basis and ad hoc, if necessary.
All members of the Executive Board of Clearstream are ultimately responsible for the risk
strategy, which reflects Clearstream’s risk appetite defining the maximum loss the
Executive Board is willing to assume in one year, the risk tolerance as well as desired
performance levels. It is Clearstream’s intention to maintain risk at an appropriate and
acceptable level. Moreover, the members of the Executive Board ensures that the risk
strategy is integrated into the business activities throughout the entire Group and that
adequate measures are in place to implement the strategies, policies and procedures. The
risk strategy is implemented as follows:
3.1.1 Risk statement Based on its business strategy Clearstream has adopted a corresponding risk strategy which
describes the overall risk profile. The risk strategy includes statements concerning risk
appetite and sets limits to the Risk-Bearing Capacity per risk type. Required Economic
Capital is compared with the available Risk-Bearing Capacity which is defined as regulatory
own funds. The allocation of Risk-Bearing Capacity for 2019 for Clearstream was as follows:
Operational Risk 51%, Financial Risk 41% and Business Risk 8%.
The risk strategy was approved by the Executive Board of Clearstream in May 2019. The
overall risk profile as defined, adopted and approved via the risk strategy links to the
business strategy outlined above. The main part consists of the risk strategy statement, the
risk management approach and risk types which are quantified in the risk appetite
framework based on tools and concepts used to manage risk. Those tools and concepts are,
inter alia, Risk-Bearing Capacity as mentioned above and Value at Risk.
3.1.2 Risk culture Risk awareness and a corresponding risk-conscious culture are encouraged, amongst other
things, through appropriate organisational structures and responsibilities, adequate
processes and the knowledge of employees. The appropriateness of the risk management

15
and controlling systems is regularly checked. Overall, Clearstream’s risk culture is based on
the Financial Stability Board’s four indicators of a sound risk culture: Tone from the top,
accountability, effective communication and challenge, and incentives, thereby striving for
clear risk ownership and accountability.
3.2 Risk management process Overall, the risk management process aims at ensuring that all threats, causes of loss and
potential disruptions are:
− Properly identified as soon as possible;
− Centrally recorded;
− Assessed (that is, quantified in financial terms to the largest possible extent);
− Controlled; and
− Reported in a timely manner and consistently, together with suitable recommendations
to the respective Executive Board.
These five key processes, as well as adequate quality standards, are defined in the Group
Risk Management Policy and are reviewed on an ongoing basis by an independent audit
function, which ensures the suitability and effectiveness of the risk management process.
Controlling risks is performed in the decentralised business areas, that is, where the risks
occur. Risk control in the Clearstream operational units is ensured by nominating
“Operational Risk Representatives” who are responsible for identifying, notifying and
controlling any risk in their area. Clearstream Risk Management, a central function within
Clearstream, assesses all existing and potential new risks and reports on a quarterly basis
and, if necessary, ad hoc to the relevant Executive Board (see Error! Reference source not
found.).
Figure 3 - Five-level risk management system with central and decentralised responsibilities
3.2.1 Risk identification Risk identification includes the identification of all threats, causes of loss and potential
disruptions with regards to existing or new processes as well as internal activities or
external factors.
More specifically, the risk identification process is, on the one hand, proactive, based on
regular review of processes in order to identify weak areas and points of failure (e.g.
manual processes, processes without double keying or four-eyes controls in place, specific
procedures subject to high volumes or tight deadlines) or based on scenarios of disruption
or failure taking into consideration all sources of issues (e.g. unavailability of systems,
human error). For the purpose of properly identifying potential risks for Clearstream, a risk
inventory process has been established, which is carried out at least on a yearly basis by

16
Clearstream Risk Management. On the other hand, the risk identification process is also
reactive, as a consequence of an incident.
The identification phase includes the quantification of risks in the form of parameters
based either on statistical data, in the case of actual process monitoring, or on subjective
expert judgement when insufficient statistics are available.
All organisational units and individual employees are obliged to identify and quantify
potential risks within their area of responsibility.
3.2.2 Risk notification The process step of risk notification ensures that risks are centrally recorded. To do so, all
organisational units and individual employees must notify Clearstream Risk Management in
a timely manner of the risks that they have identified.
3.2.3 Risk assessment The assessment of an incident or a potential risk development includes not only a
quantification of risk using the “Value at Risk” (“VaR”) methodology but also a comparison
of the result with the available Risk-Bearing Capacity. The purpose is to allow the overall
risk appetite to be expressed in a comprehensive and easily understandable way and to
facilitate the prioritisation of risk management actions.
The VaR quantifies the risks to which a company is exposed to and indicates the maximum
cumulative loss Clearstream could face if certain independent loss events materialise over a
specific time horizon for a given probability. Clearstream's internal models are based on a
confidence level of 99.98% and a one-year time horizon.
Clearstream also performs stress test calculations, which consider even more conservative
parameters than the regular VaR calculations. Risk-wide stress tests, which incorporate the
interaction of all material risk types, are carried out as well and reported to the Executive
Board on a quarterly basis.
In addition to classical stress tests that analyse the impacts of predefined stress scenarios,
Clearstream calculates reverse stress tests, where stress scenarios that would exceed the
Available Risk-Bearing Capacity are identified. The findings of reverse stress tests can give
rise to further analyses as well as to implementation of additional measures to reduce risks.
Moreover, Clearstream calculates VaR at 99% confidence level for the determination of the
Earnings at Risk (“EaR”).
3.2.4 Risk mitigation and control Risk mitigation and control involves the determination and implementation of the most
appropriate reaction to the identified risk. It encompasses risk avoidance, risk reduction,
risk transfer and intentional risk acceptance, as outlined above.
All organisational units and employees must perform risk control and implement mitigating
actions.
3.2.5 Risk monitoring and reporting Risk reports are provided by Clearstream Risk Management to the Executive Management
and Risk Committee on a regular basis.
Regular risk reports contain risk quantification results in comparison with the limits, risk

17
related qualitative information, information about stress tests and capital adequacy
information.
Clearstream Risk Management may issue ad-hoc reports whenever a new risk situation
arises or, alternatively, the development of an existing risk requires reporting to the
Executive Management. This is the case when a risk has a material impact on the risk
profile.
Ultimately, the internal Audit function as a third line of defence provides further assurance
by conducting independent audits which verify that risk control and risk management is
performed adequately. The results of these audits are also part of the risk management
system.
In the Executive Board meeting on 25 March 2019 the Executive Board concluded that the
Risk Management System is effective.
3.3 Risk profile Clearstream defines risk as a potential negative impact on its financial, revenue and
liquidity situation. Clearstream differentiates between three major risk types that are
managed and controlled with distinct methods. These risk types are operational risk,
financial risk and business risk. Project risk also exists but is not specifically quantified, as
the impact is already reflected in the three traditional risk types. The risk types are
illustrated in figure 4 and are described in more detail in the following sections.
The risk profile of Clearstream differs fundamentally from those of other financial services
providers. Operational risk is assessed as major risk type within Clearstream. Market risk
(as part of financial risk) and business risk are considered non-material.
Figure 4 - Risk profile of Clearstream

18
3.4 Key prudential metrics The following table provides an overview of the bank’s key prudential metrics for 2019 and
will be elaborated in detail in the remainder of the report:
31 December 2019
31 December 2018
Available capital (amounts)
1 Common Equity Tier 1 (CET1) 1,149,360 1,111,991
2 Tier 1 1,149,360 1,111,991
3 Total capital 1,149,360 1,111,991 Risk-weighted assets (amounts)
4 Total risk-weighted assets (RWA) 4,720,932 5,074,928 Risk-based capital ratios as a percentage of RWA
5 Common Equity Tier 1 ratio (%) 24.35 21.91
6 Tier 1 ratio (%) 24.35 21.91
7 Total capital ratio (%) 24.35 21.91 Own funds requirements as a percentage of RWA
8 Total capital ratio requirement before
8.00 8.00 Supervisory Review and Evaluation Process (“SREP”) (%)
9 SREP requirement (%) 1.00 0.00
10 Total SREP capital requirement ratio (row 8 + row 9) (%) 9.00 8.00
11 Capital conservation buffer requirement (%) 2.50 2.50
12 Countercyclical buffer requirement (%) 0.04 0.04
13 Bank G-SIB and/or O-SII additional requirements (%) 0.50 0.38
14 Total of bank CET1 specific buffer requirements (%)
3.04 2.92 (row 11 + row 12 + row 13)
15 Overall capital requirement (%) (row 10 + row 14) 12.04 10.92
16 CET1 available after meeting the bank’s minimum capital
12.31 10.99 requirements (%) (row 7 – row 15)
Basel III leverage ratio
17 Total Basel III leverage ratio exposure measure 15,826 18,830
18 Basel III leverage ratio (%) (row 2 / row 17) 7.26 5.91 Liquidity Coverage Ratio
19 Total HQLA 14,493 13,753
20 Total net cash outflow 12,207 11,228
21 LCR ratio (%) 118.73 122.49
Table 3 - Key prudential metrics

19
4. Linkages between financial statements and regulatory
exposures This paragraph specifies the requirements included in Art. 436 of Part Eight CRR regarding
the scope of application of Part Eight.
In the application of Art. 436 (b), institutions are required to disclose an outline of the
differences in the basis of consolidation for accounting and prudential purposes.
As at 31 December 2019, Clearstream Banking S.A. had four subsidiaries and two branches.
In particular, these were the direct subsidiaries:
• Clearstream Banking Japan, Ltd. (created in 2009). Registered office: 27F, Marunouchi Kitaguchi Building, 1-6-5, Marunouchi, Chiyoda-ku, Tokyo, Japan. Clearstream Banking Japan is directly 100% owned by the bank;
• REGIS-TR S.A. (created in 2010). Registered office: 42 Avenue J.F. Kennedy, L-1855 Luxembourg. The bank holds 50% of the subsidiary. Since the bank has the right to appoint the Chairman of the Board of directors, who in turn has a casting vote, there is a presumption of control;
• Clearstream London Limited, incorporated on 27 December 2018. Registered office: 11 Westferry Circus Canary Wharf, London E14 4HE, United Kingdom. Clearstream London Limited is directly 100% owned by the bank;
• Ausmaq Limited incorporated in 1994. Registered office: Level 4, 107 Pitt St, Sydney, New South Wales 2000, Australia. Ausmaq Limited is directly 100% owned by the Bank.
And the two following branches:
• Clearstream Banking S.A., Singapore branch (created in 2009). Registered office: 9 Raffles Place #55-01 Republic Plaza Singapore, 048619 Singapore;
• Clearstream Banking S.A., UK branch (opened on 4 January 2016), which took over the activities of the bank’s former representative office. Registered office: Westferry House, 2nd Floor, 11 Westferry Circus, Canary Wharf, London E14 4HE, United Kingdom.
As per Art. 83 of the Law of 17 June 1992, as amended, CBL does not prepare consolidated
financial statements because Clearstream Banking S.A. only has subsidiary undertakings
that are not material for the purpose of Art. 85(3) of the Law of 17 June 1992, as amended
(consolidated accounts shall give a true and fair view of the assets, liabilities, financial
position, and profit or loss of the undertakings included therein taken as a whole), both
individually and as a whole.
The table below shows a breakdown of the differences in the scope of consolidation along
accounting and regulatory lines and allocates the different amounts to the regulatory risk
categories, namely, credit risk, counterparty credit risk and market risk, as well as the part
that is not subject to capital requirements or subject to deduction from capital.

20
Carrying values as
reported in published financial
statements
Carrying values under
scope of regulatory
consolidation
Carrying values of items
Subject to the credit
risk framework
Subject to the CCR
framework
Subject to the
securitization framework
Subject to the market
risk framework
Not subject to capital
requirements or subject to
deduction from capital
Assets
Cash, cash balances at central banks and other demand deposits
8,765,759 7,425,574 7,425,574 0 0 7,425,574 0
Financial assets held for trading
8,515 6,240 0 6,240 0 6,240 0
Financial assets at fair value through other comprehensive income
5,558 5,558 5,558 0 0 0 0
Financial assets at amortized cost
6,514,086 7,856,074 7,856,074 0 0 7,856,074 0
Derivatives – hedge accounting
159 159 0 159 0 0 0
Investments in subsidiaries, joint ventures and associates
31,646 31,646 31,646 0 0 31,646 0
Tangible assets 13,081 13,086 13,086 0 0 0 0
Intangible assets
88,790 92,248 92,248 0 0 0 0
Tax assets 1,158 9,677 0 0 0 0 9,677
Other assets 46,018 36,265 36,265 0 0 0 0
Total assets 15,474,770 15,476,527 15,460,451 6,399 0 15,319,534 9,677
Liabilities
Financial liabilities held for trading
17,056 18,239 18,239
Financial liabilities measured at amortised cost
13,809,654 13,850,459 13,850,459
Derivatives – hedge accounting
0 0
Provisions 32,554 32,969
Tax liabilities 942 517
Other liabilities 75,662 33,689 33,689
Total liabilities 13,935,868 13,935,873 13,902,387
Table 4 - Differences between accounting and regulatory scopes of consolidation and the mapping of financial statement categories with regulatory risk categories
The main differences between the financial statement and the regulatory scope arise due
to the following reasons:

21
• The difference in demand deposits and loans and advances is caused, in part, by a different classification of overnight repos, i.e. classification of overnight repos as demand deposits in the financial statement and classification as loans and advances in FINREP;
• Another part of the difference in demand deposits is due to a reclassification of interest from cash overdrafts between assets and liabilities;
• Revaluation accounts for derivatives, which are recognised as other assets for regulatory purposes, are responsible for the difference in financial assets held for trading;
• Further minor causes of differences for financial assets at amortized costs and other assets between the financial statement and the regulatory scope arise from the reclassification of fee receivables from other assets to loans and advances, and the reclassification of debtor amounts with assets;
• Minor differences are caused by the use of different foreign exchange rates, i.e. SAP uses Bloomberg rates whilst ECB rates are used for FINREP.
The following table provides information on the main sources of differences (other than
those due to different scopes of consolidation):
Total Items subject to
Credit risk framework
CCR framework
Securitization framework
Market risk framework
1
Assets carrying value amount under the scope of regulatory consolidation (as per template EU LI1)
15,476,528 15,460,451 6,399 15,319,534
2
Liabilities carrying value amount under the regulatory scope of consolidation (as per template EU LI1)
13,935,873 0 0 13,902,387
3 Total net amount under the regulatory scope of consolidation
15,476,528 15,460,451 6,399 1,417,147
4 Off-balance sheet amounts 58,522,051 58,459,794 0 62,257
5 Differences in valuations 223,812 207,735 -55,858 1,454,750
10 Exposure amounts considered for regulatory purposes
73,774,767 73,712,510 62,257 24,654
Table 5 - Main sources of differences between regulatory exposure amounts and carrying values in financial statements
The differences between the assets carrying amount under regulatory scope and the actual
risk exposures used in COREP are caused by the following factors:
• Intangible assets are directly deducted from own funds, hence, they are included in the carrying amount under regulatory scope, but not in the credit risk exposure for risk reporting;
• The difference in the CCR framework is due to the different value in derivatives exposure, since the Current Exposure Method (CEM) in conjunction with the Basel Committee’s standard on the “standardised approach for measuring counterparty credit risk exposures”3 is used for risk reporting whereas the carrying value is recognised for the purpose of FINREP;
• The difference for the market risk framework exposure arises due to the netting of long and short positions for foreign exchange exposures in the risk reporting.
3 Basel Committee on Banking Supervision: “The standardised approach for measuring counterparty credit risk exposures”: https://www.bis.org/publ/bcbs279.pdf

22
The information on the consolidation method applied for each entity within the accounting
and regulatory scopes of consolidation is provided in the following table:
Name of the entity
Method of accounting
consolidation
Method of regulatory
consolidation
Description of the entity
Full consolidation
Proportional consolidation
Neither consolidated
nor deducted
Deducted
Clearstream Banking Japan Ltd., Tokyo
Fair value through other comprehensive income
X Ancillary services undertaking
REGIS-TR S.A., Luxembourg
Fair value through other comprehensive income
X "Other" undertaking
Clearstream London Limited
Fair value through other comprehensive income
X Ancillary services undertaking
Ausmaq Limited
Fair value through other comprehensive income
X Ancillary services undertaking
Table 6 - Outline of the differences in the scope of consolidation (entity by entity)

23
5. Composition of capital Following the disclosure requirements in Art. 437 CRR, as specified in the Implementing
Regulation (EU) No. 1423/2013 of December 2013, institutions are required to provide
information concerning the capital composition, including reconciliation with their balance
sheet and the main features of the regulatory capital instruments.
Furthermore, Art. 438 of Part Eight CRR requires disclosure of an overview of the total RWA
and the related minimum capital requirements. Further breakdowns of RWAs are
presented in subsequent parts of this report.
5.1 Capital components The following table summarises the total amount of Clearstream Banking S.A.’s regulatory
capital.
Amounts Regulation (EU) No. 575/2013 Article reference
Common Equity Tier 1 capital: instruments and reserves
Directly issued qualifying common share (and equivalent for non-joint stock companies) capital plus related stock surplus
321,935 26 (1), 27, 28, 29, EBA list 26 (3)
Retained earnings -512 26 (1) c)
Accumulated other comprehensive income (and other reserves) 937,887 26 (1)
Common Equity Tier 1 capital before regulatory adjustments 1,259,310
Common Equity Tier 1 capital: regulatory adjustments
Cash flow hedge reserve 119
Value adjustments due to the requirements for prudent valuation -63
Goodwill (net of related tax liability) -41,492
Other intangibles other than mortgage servicing rights (net of related tax liability)
-50,755 36 (1) (b), 37, 472 (4)
Deferred tax assets arising from temporary differences (amount above 10% threshold, net of related tax liability)
-1,239 36 (1) (b), 37
Regulatory adjustments applied to Common Equity Tier 1 due to insufficient Additional Tier 1 and Tier 2 to cover deductions
-16,520 36 (1) (j)
Total regulatory adjustments to Common Equity Tier 1 -109,950
Common Equity Tier 1 capital (CET1) 1,149,360
Additional Tier 1 capital (AT1) 0
Tier 1 capital (T1 = CET1 + AT1) 1,149,360
Tier 2 capital (T2) 0
Total regulatory capital (TC = T1 + T2) 1,149,360
Total risk exposure amount 4,720,932
Capital ratios and buffers
Common Equity Tier 1 (as a percentage of risk-weighted assets) 24.35 92 (2) (a)
Tier 1 (as a percentage of risk-weighted assets) 24.35 92 (2) (b)
Total capital (as a percentage of risk-weighted assets) 24.35 92 (2) (c)
Institution-specific buffer requirement (capital conservation buffer plus countercyclical buffer requirements plus higher loss absorbency requirement, expressed as a percentage of risk-weighted assets)
3.0395 CRD 128, 129, 130,
131, 133
Of which: capital conservation buffer requirement 2.5000
Of which: bank-specific countercyclical buffer requirement 0.0395
Of which: higher loss absorbency requirement 0.5000

24
Common Equity Tier 1 (as a percentage of risk-weighted assets) available after meeting the bank’s minimum capital requirements 12.3065 CRD 128
Amounts below the thresholds for deduction (before risk weighting)
Non-significant investments in the capital and other TLAC liabilities of other financial entities
5,558 36 (1) (h), 46, 45, 56 (c), 59, 60, 66
(c), 69, 70
Significant investments in the common stock of financial entities 31,646 36 (1) (i), 45, 48
Table 7 - Composition of regulatory capital
The total regulatory capital of Clearstream Banking S.A. consists of Common Equity Tier 1
(CET1) capital, which is comprised of subscribed capital, share premium, reserves and
retained earnings. Deductions of CET1 arise from intangible assets, deferred tax assets and
regulatory adjustments.
5.2 Reconciliation of regulatory capital to balance sheet In compliance with Art. 437 (1)(a) CRR, a full reconciliation of own funds to financial
statements is disclosed in the following table, as laid out in the Implementing Regulation
(EU) No. 1423/2013:
Balance Sheet Reconciliation
Own Funds elements in the Annual Financial Statements
Subscribed Capital 92,000
Share premium 229,935
Accumulated other comprehensive income -1,691
Legal Reserve 9,200
Other reserves and retained earnings 930,363
Profits for the financial year and accumulated profits 279,096
Total Own Funds Elements in Audited Financial Statements 1,538,903
Profits allocated to other reserves with the approval of financial statements (i.e. after reporting of Own Funds)
-141
Profits for the financial year and accumulated profits (i.e. after reporting of Own Funds)
-279,096
Eligible Capital (CET1) before regulatory adjustments 1,259,666
Regulatory adjustments
Goodwill -41,492
Deduction other intangible assets -50,755
Other CET 1 capital adjustments -18,059
Common Equity Tier 1 Capital/Total Eligible Own Funds 1,149,360
Table 8 - Reconciliation of regulatory capital to balance sheet
The own funds of the financial statement of Clearstream Banking S.A. consider profits
allocated to retained earnings with the approval of the financial statement and year-end
profits, neither of which qualify for the regulatory own funds as at 31 December 2019. The
profits allocated to retained earnings do not count as CET1 capital if the financial statement
is not approved or if prior permission by the competent authority according to Art. 26
paragraph 2 CRR is not granted.
5.3 Description of the main features of capital instruments Disclosure under point (b) of Art. 437 CRR is shown in the next table, in line with the
disclosure templates set out in the Implementing Regulation (EU) No. 1423/2013.

25
Quantitative/qualitative information
1 Issuer Clearstream Banking S.A.
2 Unique identifier (e.g. CUSIP, ISIN or Bloomberg identifier for private placement)
NA
3 Governing law(s) of the instrument Luxembourg Company Law: Law of 10th August 1915 on commercial companies
4 Transitional Basel III rules Common Equity Tier 1
5 Post-transitional Basel III rules Common Equity Tier 1
6 Eligible at solo/group/group and solo Solo
7 Instrument type (types to be specified by each jurisdiction) Ordinary Shares
8 Amount recognised in regulatory capital (currency in millions, as of most recent reporting date)
€ m 229
9 Par value of instrument € m 92
10 Accounting classification Shareholders' equity
11 Original date of issuance 1970
12 Perpetual or dated perpetual
13 Original maturity date NA
14 Issuer call subject to prior supervisory approval No
15 Optional call date, contingent call dates and redemption amount NA
16 Subsequent call dates, if applicable NA
Coupons/dividends
17 Fixed or floating dividend/coupon Floating
18 Coupon rate and any related index NA
19 Existence of a dividend stopper No
20 Fully discretionary, partially discretionary or mandatory Fully discretionary
21 Existence of step-up or other incentive to redeem No
22 Non-cumulative or cumulative Non-cumulative
23 Convertible or non-convertible Non-convertible
24 If convertible, conversion trigger(s) NA
25 If convertible, fully or partially NA
26 If convertible, conversion rate NA
27 If convertible, mandatory or optional conversion NA
28 If convertible, specify instrument type convertible into NA
29 If convertible, specify issuer of instrument it converts into NA
30 Write-down feature No
31 If write-down, write-down trigger(s) NA
32 If write-down, full or partial NA
33 If write-down, permanent or temporary NA
34 If temporary write-own, description of write-up mechanism NA
35 Position in subordination hierarchy in liquidation (specify instrument type immediately senior to instrument in the insolvency creditor hierarchy of the legal entity concerned).
NA
36 Non-compliant transitioned features No
37 If yes, specify non-compliant features NA
Table 9 - Main feature of regulatory capital instruments and other TLAC-eligible instruments
5.4 Regulatory capital requirements Following Art. 438 (c) to (f) CRR, institutions should disclose an overview of total RWA
forming the denominator of the risk-based capital requirements calculated per Art. 92 CRR
and summary of the institution’s calculation approaches chosen.
The following table summarises the capital requirements of Clearstream Banking S.A. for
the different types of risks and the relevant calculation method:

26
RWAs Minimum capital
requirements
31 December 2019
31 December 2018
31 December 2019
1 Credit risk (excluding CCR) 625,894 1,153,983 50,072
Art. 438 (c) (d) 2 Of which the standardised approach 625,894 1,153,983 50,072
Art. 438 (c) (d) 3 Of which the foundation IRB (FIRB) approach
Art. 438 (c) (d) 4 Of which the advanced IRB (AIRB) approach
Art. 438 (d) 5 Of which equity IRB under the simple risk-weighted approach or the IMA
Art. 107 Art. 438 (c) (d)
6 CCR 14,519 14,744 1,162
Art. 438 (c) (d) 7 Of which mark to market
Art. 438 (c) (d) 8 Of which original exposure 12,451 13,559 996
9 Of which the standardised approach
10 Of which internal model method (IMM)
Art. 438 (c) (d) 11 Of which risk exposure amount for contributions to the default fund of a CCP
331 314 27
Art. 438 (c) (d) 12 Of which CVA 1,736 871 139
Art. 438 (e) 13 Settlement risk 0 0 0
Art. 449 (o) (i) 14 Securitisation exposures in the banking book (after the cap)
Art. 438 (e) 19 Market risk 24,654 0 1,972
20 Of which the standardised approach 24,654 0 1,972
21 Of which IMA
Art. 438 (e) 22 Large exposures 0 0 0
Art. 438 (f) 23 Operational risk 4,055,865 3,906,201 324,469
24 Of which basic indicator approach
25 Of which standardised approach
26 Of which advanced measurement
approach 4,055,865 3,906,201 324,469
29 Total 4,720,932 5,074,928 377,675
Table 10 - Overview of RWAs
5.5 Countercyclical capital buffer The countercyclical capital buffer aims to ensure that banking sector capital requirements
take account of the macro-financial environment in which banks operate. According to
Delegated Regulation (EU) 2015/1555 on the disclosure of information concerning the
compliance of institutions with the requirement for a countercyclical buffer, which
implements Art. 440 CRR, institutions need to disclose the following tables:

27
General credit exposures
Trading book exposure
Securitisation exposure
Own funds requirements
Ow
n f
un
ds
req
uir
eme
nt
wei
ghts
Co
un
terc
yclic
al c
apit
al b
uff
er r
ate
Exp
osu
re v
alu
e fo
r SA
Exp
osu
re v
alu
e IR
B
Sum
of
lon
g an
d s
ho
rt p
osi
tio
n
of
trad
ing
bo
ok
Val
ue
of
trad
ing
bo
ok
exp
osu
re
for
inte
rnal
mo
de
ls
Exp
osu
re v
alu
e fo
r SA
Exp
osu
re v
alu
e fo
r IR
B
Of
wh
ich
: Gen
eral
cre
dit
exp
osu
res
Of
wh
ich
: Tra
din
g b
oo
k
exp
osu
res
Of
wh
ich
: Sec
uri
tisa
tio
n
exp
osu
res
Tota
l
010 020 030 040 050 060 070 080 090 100 110 120
Breakdown by country
Andorra 5 0 0 0 0 0 0 0 0 0 0.000 0.000
United Arab Emirates
861 0 0 0 0 0 69 0 0 69 0.005 0.000
Armenia 7 0 0 0 0 0 1 0 0 1 0.000 0.000
Argentina 20 0 0 0 0 0 2 0 0 2 0.000 0.000
Austria 307 0 0 0 0 0 12 0 0 12 0.001 0.000
Australia 27,680 0 0 0 0 0 5,504 0 0 5,504 0.374 0.000
Aruba 2 0 0 0 0 0 0 0 0 0 0.000 0.000
Bosnia and Herzegovina
2 0 0 0 0 0 0 0 0 0 0.000 0.000
Belgium 5,603 0 0 0 0 0 448 0 0 448 0.030 0.000
Bulgaria 1 0 0 0 0 0 0 0 0 0 0.000 0.500
Bahrain 50 0 0 0 0 0 4 0 0 4 0.000 0.000
Bermuda 119 0 0 0 0 0 9 0 0 9 0.001 0.000
Brunei Darussalam
3 0 0 0 0 0 0 0 0 0 0.000 0.000
Brazil 65 0 0 0 0 0 8 0 0 8 0.001 0.000
Bahamas 1 0 0 0 0 0 0 0 0 0 0.000 0.000
Canada 101 0 0 0 0 0 8 0 0 8 0.001 0.000
Switzerland 6,119 0 0 0 0 0 679 0 0 679 0.046 0.000
Chile 40 0 0 0 0 0 3 0 0 3 0.000 0.000
Cameroon 765 0 0 0 0 0 12 0 0 12 0.001 0.000
China 3 0 0 0 0 0 0 0 0 0 0.000 0.000
Colombia 74 0 0 0 0 0 6 0 0 6 0.000 0.000
Costa Rica 33 0 0 0 0 0 3 0 0 3 0.000 0.000
Curaçao 23 0 0 0 0 0 2 0 0 2 0.000 0.000
Cyprus 9 0 0 0 0 0 1 0 0 1 0.000 0.000
Czech Republic
1,507 0 0 0 0 0 121 0 0 121 0.008 1.500
Germany 21,274 0 0 0 0 0 1,718 0 0 1,718 0.117 0.000
Denmark 0 0 0 0 0 0 0 0 0 0 0.000 0.000
Dominican Republic
10 0 0 0 0 0 1 0 0 1 0.000 0.000
Ecuador 9 0 0 0 0 0 1 0 0 1 0.000 0.000

28
Egypt 53 0 0 0 0 0 4 0 0 4 0.000 0.000
Spain 306 0 0 0 0 0 5 0 0 5 0.000 0.000
Finland 0 0 0 0 0 0 0 0 0 0 0.000 0.000
France 1,091 0 0 0 0 0 21 0 0 21 0.001 0.250
United Kingdom
2,996 0 0 0 0 0 244 0 0 244 0.017 1.000
Georgia 7 0 0 0 0 0 1 0 0 1 0.000 0.000
Guernsey 168 0 0 0 0 0 17 0 0 17 0.001 0.000
Gibraltar 2 0 0 0 0 0 0 0 0 0 0.000 0.000
Greece 6 0 0 0 0 0 1 0 0 1 0.000 0.000
Guatemala 13 0 0 0 0 0 1 0 0 1 0.000 0.000
Hong Kong 454 0 0 0 0 0 37 0 0 37 0.002 2.000
Indonesia 17 0 0 0 0 0 1 0 0 1 0.000 0.000
Ireland 1,174 0 0 0 0 0 98 0 0 98 0.007 1.000
Israel 0 0 0 0 0 0 0 0 0 0 0.000 0.000
Isle of Man 29 0 0 0 0 0 2 0 0 2 0.000 0.000
India 7 0 0 0 0 0 1 0 0 1 0.000 0.000
Iran, Islamic Republic of
28 0 0 0 0 0 3 0 0 3 0.000 0.000
Italy 1,449 0 0 0 0 0 33 0 0 33 0.002 0.000
Jersey 30 0 0 0 0 0 3 0 0 3 0.000 0.000
Japan 2,910 0 0 0 0 0 311 0 0 311 0.021 0.000
Kenya 4 0 0 0 0 0 0 0 0 0 0.000 0.000
Korea, Republic of
326 0 0 0 0 0 26 0 0 26 0.002 0.000
Kuwait 45 0 0 0 0 0 4 0 0 4 0.000 0.000
Cayman Islands
527 0 0 0 0 0 9 0 0 9 0.001 0.000
Kazakhstan 49 0 0 0 0 0 4 0 0 4 0.000 0.000
Lebanon 139 0 0 0 0 0 17 0 0 17 0.001 0.000
Liechtenstein 23 0 0 0 0 0 3 0 0 3 0.000 0.000
Luxembourg 50,134 0 0 0 0 0 4,402 0 0 4,402 0.299 0.000
Latvia 13 0 0 0 0 0 1 0 0 1 0.000 0.000
Libya 16 0 0 0 0 0 2 0 0 2 0.000 0.000
Morocco 5 0 0 0 0 0 0 0 0 0 0.000 0.000
Monaco 1 0 0 0 0 0 0 0 0 0 0.000 0.000
Macedonia, the Former Yugoslav Republic of
5 0 0 0 0 0 0 0 0 0 0.000 0.000
Macao 48 0 0 0 0 0 4 0 0 4 0.000 0.000
Malta 12 0 0 0 0 0 1 0 0 1 0.000 0.000
Mauritius 0 0 0 0 0 0 0 0 0 0 0.000 0.000
Mexico 276 0 0 0 0 0 5 0 0 5 0.000 0.000
Malaysia 3,037 0 0 0 0 0 243 0 0 243 0.017 0.000
Nigeria 285 0 0 0 0 0 5 0 0 5 0.000 0.000
Netherlands 1,647 0 0 0 0 0 35 0 0 35 0.002 0.000
Norway 34 0 0 0 0 0 3 0 0 3 0.000 2.500

29
Oman 2,744 0 0 0 0 0 219 0 0 219 0.015 0.000
Panama 58 0 0 0 0 0 5 0 0 5 0.000 0.000
Peru 201 0 0 0 0 0 4 0 0 4 0.000 0.000
Philippines 302 0 0 0 0 0 24 0 0 24 0.002 0.000
Poland 21 0 0 0 0 0 2 0 0 2 0.000 0.000
Puerto Rico 36 0 0 0 0 0 4 0 0 4 0.000 0.000
Qatar 76 0 0 0 0 0 6 0 0 6 0.000 0.000
Romania 23 0 0 0 0 0 2 0 0 2 0.000 0.000
Russian Federation
175 0 0 0 0 0 14 0 0 14 0.001 0.000
Saudi Arabia 1 0 0 0 0 0 0 0 0 0 0.000 0.000
Sweden 474 0 0 0 0 0 8 0 0 8 0.001 0.000
Singapore 566 0 0 0 0 0 45 0 0 45 0.003 0.000
Slovenia 720 0 0 0 0 0 12 0 0 12 0.001 0.000
San Marino 23 0 0 0 0 0 2 0 0 2 0.000 0.000
Suriname 143 0 0 0 0 0 2 0 0 2 0.000 0.000
El Salvador 6 0 0 0 0 0 0 0 0 0 0.000 0.000
Thailand 83 0 0 0 0 0 7 0 0 7 0.000 0.000
Turkey 60 0 0 0 0 0 5 0 0 5 0.000 0.000
Trinidad and Tobago
9 0 0 0 0 0 1 0 0 1 0.000 0.000
Taiwan, Province of China
989 0 0 0 0 0 79 0 0 79 0.005 0.000
Ukraine 130 0 0 0 0 0 16 0 0 16 0.001 0.000
United States 1,182 0 0 0 0 0 43 0 0 43 0.003 0.000
Uruguay 129 0 0 0 0 0 10 0 0 10 0.001 0.000
Venezuela, Bolivarian Republic of
276 0 0 0 0 0 33 0 0 33 0.002 0.000
Virgin Islands, British
87 0 0 0 0 0 2 0 0 2 0.000 0.000
Vietnam 4 0 0 0 0 0 1 0 0 1 0.000 0.000
South Africa 107 0 0 0 0 0 9 0 0 9 0.001 0.000
Total 140,684 0 0 0 0 0 14,714 0 0 14,714 1 0.040
Table 11 - Geographical distribution of credit exposures relevant to the calculation of the countercyclical capital buffer
Row Column
010 Total risk exposure amount 4,720,932
020 Institution specific countercyclical buffer rate 0.04
030 Institution specific countercyclical buffer requirement 1,865 Table 12 - Amount of institution-specific countercyclical capital buffer

30
6. Leverage ratio The disclosure requirements concerning the leverage ratio are laid out in Art. 451 of the
CRR and specified in the Commission Implementing Regulation (EU) No. 2016/200 of 15
February 2016.
In the following table, Clearstream Banking S.A. shows the reconciliation of the leverage
ratio total exposure with the relevant information in the published financial statements as
at 31 December 2019, including any adjustments made in compliance with Art. (1) (b) CRR:
1 Total consolidated assets as per published financial statements 15,474,770
2 Adjustment for investments in banking, financial, insurance or commercial entities that are consolidated for accounting purposes but outside the scope of regulatory consolidation
0
3 Adjustment for fiduciary assets recognised on the balance sheet pursuant to the operative accounting framework but excluded from the leverage ratio exposure measure
0
4 Adjustments for derivative financial instruments 55,858
5 Adjustment for securities financing transactions (i.e. repos and similar secured lending) 175,861
6 Adjustment for off-balance sheet items (i.e. conversion to credit equivalent amounts of off-balance sheet exposures)
304,479
7 Other adjustments -184,826
8 Leverage ratio exposure measure 15,826,142
Table 13 - Summary comparison of accounting assets vs. leverage ratio exposure measure
The table below shows the leverage ratio common disclosure template in accordance with
Commission Implementing Regulation (EU) No. 575/2013, which lays down implementation
technical standards with regard to disclosure of the leverage ratio for institutions. The on-
balance sheet exposures are the biggest part of the leverage ratio total exposure measure.
In addition to the on-balance sheet items, off-balance sheet items and derivatives as well
as SFT exposures are considered to determine the leverage ratio exposure measure as well
as the leverage ratio itself.
2019 2018
On-balance sheet exposures
1 On-balance sheet exposures (excluding derivatives and securities financing
transactions (SFTs), but including collateral) 8,860,574 11,733,296
2 (Asset amounts deducted in determining Basel III Tier 1 capital) -93,430 -13,379
3 Total on-balance sheet exposures (excluding derivatives and SFTs) (sum of rows
1 and 2) 8,767,144 11,719,917
Derivative exposures
4 Replacement cost associated with all derivatives transactions (where applicable
net of eligible cash variation margin and/or with bilateral netting) 62,257 67,794
5 Add-on amounts for PFE associated with all derivatives transactions 0 0
6 Gross-up for derivatives collateral provided where deducted from the balance
sheet assets pursuant to the operative accounting framework 0 0
7 (Deductions of receivables assets for cash variation margin provided in
derivatives transactions) 0 0
8 (Exempted CCP leg of client-cleared trade exposures) 0 0

31
9 Adjusted effective notional amount of written credit derivatives 0 0
10 (Adjusted effective notional offsets and add-on deductions for written credit
derivatives) 0 0
11 Total derivative exposures (sum of rows 4 to 10) 62,257 67,794
Securities financing transactions exposures
12 Gross SFT assets (with no recognition of netting), after adjusting for sale
accounting transactions 6,516,401 6,517,499
13 (Netted amounts of cash payables and cash receivables of gross SFT assets) 0 0
14 CCR exposure for SFT assets 175,861 86,229
15 Agent transaction exposures 15,841 26,257
16 Total securities financing transaction exposures (sum of rows 12 to 15) 6,708,103 6,629,985
Other off-balance sheet exposures
17 Off-balance sheet exposure at gross notional amount 288,638 413,162
18 (Adjustments for conversion to credit equivalent amounts) 0 0
19 Off-balance sheet items (sum of rows 17 and 18) 288,638 413,162
Capital and total exposure
20 Tier 1 capital 1,149,360 1,111,991
21 Total exposures (sum of rows 3, 11, 16 and 19) 15,826,142 18,830,858
Leverage ratio
22 Basel III leverage ratio 7.26% 5.91%
Table 14 - Leverage ratio common disclosure template
In accordance with Art. 451 (1) (d) and (e) in conjunction with Art. 6 of Regulation (EU) No.
2016/200, Clearstream Banking S.A. provides the following descriptions for processes used
to manage the risk of excessive leverage:
Clearstream processes large daily volumes of client transactions, which are collateralised by
either cash or pledged securities. Cash collateral received is reinvested in short maturity
transactions with low credit and market risk. This increases the total leverage exposure of
Clearstream. The resulting leverage ratio therefore reflects both transaction volume at the
reporting date and client use of cash (rather than pledged securities) as collateral.
Clearstream is able to manage its leverage ratio relative to prudential norms through
balance sheet and client collateral allocation strategies. CBL continues to monitor CRD V
developments as part of its medium-term planning.
The leverage exposure, and therefore ratio, is primarily influenced by the volume of client
deposits and the corresponding actions taken by Clearstream to place these funds in the
market in as low risk a way as possible through on-balance sheet placements and securities
financing transactions.

32
7. Operational risk The following chapter discloses the requirements laid down in Art. 446 CRR concerning the
approach for the assessment of own-funds requirements for operational risk and Art. 454
CRR on the use of the Advanced Measurement Approach to operational risk.
7.1 Governance Operational risk represents a significant risk class for Clearstream and one that is
systemically managed and controlled. Clearstream follows an Advanced Measurement
Approach (AMA) for calculating the regulatory capital requirement for operational risk.
Thus, Clearstream established a comprehensive framework and set of instruments meeting
the requirements from both a regulatory and a business perspective.
Since receiving regulatory approval in January 2008, CBL applies the AMA to calculate the
capital requirements for operational risk.
Clearstream’s risk strategy, as described in 3. Risk management overview, also applies to
the management of operational risk and the other two risk categories, financial risk and
business risk. Defined in this risk strategy is the risk capital dedicated to cover losses
resulting from operational risk, setting a limit for this risk type.
Operational risk can be differentiated according to the severity and frequency of losses. As
operational risk management depends on the risk position of Clearstream, the general
principles are as follows:
• All main risks are identified and analysed regarding the expected or real effect on
frequency and severity.
• For risks with a low frequency but high severity, risk transfers are considered – for
example, through insurance contracts.
• For risks with high frequency but low severity, risk reduction is considered – for
example, by optimising processes.
The ultimate responsibility for operational risk management lies with the members of the
Executive Board of Clearstream Banking S.A., who are supported by different units and
functions.
The five steps of the risk management process are key to the framework.
It is the responsibility of line management units to control operational risk within their area
on a day-to-day basis. This includes the identification of suitable measures to mitigate
operational risk and to improve the effectiveness and efficiency of operational risk
management. To achieve this target, the Executive Board appoints “operational risk
representatives” for their respective area with a direct reporting line to the ultimate risk
owner on the Executive Board.
The operational risk representative is the key contact for both the employees in the
respective organisational unit as well as for Clearstream Risk Management. They also
support their line management with all tasks regarding operational risk and are especially
responsible for the collection of operational risk event data within their organisational unit.
In addition to this, the operational risk representatives take an active role in further
developing operational risk tools and instruments. They also coordinate operational risk
training for their respective organisational unit.

33
It is the responsibility of the employees to support Clearstream Risk Management, line
management, and the operational risk representative of their organisational unit regarding
any operational risk matters. Every employee is required to participate in the collection of
operational risk event data. Furthermore, individual employees may be asked by line
management, their operational risk representative or Clearstream Risk Management to
take an active role in the operational risk management process, for example, as experts
within the scenario analysis process.
7.2 Measurement Operational risk capital is intended to represent the required risk capital for unexpected
operational risk losses. As part of the AMA within Clearstream, a model for calculating
operational risk capital requirements has been developed, based on the individual risk
profile of the bank.
In line with common practice in other risk areas, capital requirements are calculated using
the Value at Risk (VaR) concept. Based on a statistical analysis of relevant data, a loss
distribution is determined, which enables calculation of the required figures.
The model has been designed to have the following features:
• Capital requirements reflect the risk profile of Clearstream Banking S.A.
• Confidence levels can be adjusted according to the risk appetite of the bank.
• Incentives for proper risk management can be included in the model.
• Major risk drivers can be identified.
• Risk mitigation effects can be considered.
Input data for the model are results of structured scenario analysis, as well as
internal/external loss data as indirect factors. If loss data is sufficiently available, the
application of a statistical model gives a reliable estimate of the underlying risk represented
by the data. However, some operational risk losses are not sufficiently available for all risk
drivers. Additionally, internal loss data usually does not cover extreme events as so far such
cases have not occurred in the bank.
It is often assumed that banks doing similar business also have similar risk profiles. If this
assumption holds, publicly available losses or losses from a banking consortium could be
used to fill the gap of missing internal loss information. However, Clearstream has a unique
business model that, as of today, is not sufficiently represented in any bank consortium or
public database. Therefore, Clearstream decided to use external loss data only where
appropriate. Furthermore, in cases where appropriate internal or external loss data is
available, Clearstream decided to apply a statistical model to scenario losses that are
created in a structured process by business experts.
7.2.1 General concept The VaR model for the calculation of the operational risk capital uses internal and external
loss data, Key Risk Indicators (KRIs), Risk Indicators (RIs) and scenarios as input. Internal and
external loss data, as well as KRIs and RIs, enter the model indirectly by serving as the
foundation of the Operational Risk scenario framework. The scenarios, which are subject to
permanent validation, are the source of the parameters that determine the aggregate loss

34
distribution generated by a Monte Carlo simulation. The quantile of that distribution
represents the Value at Risk at the corresponding confidence level.
7.2.2 Aggregate loss distribution The overall objective of the operational risk model is to simulate a loss distribution for a
given time frame, which is one year (for regulatory purposes referred to as holding period
in regulatory publications).
Combining the loss distributions for all scenarios by Monte Carlo simulation gives the
required aggregate loss distribution. From the aggregate loss distribution, the required risk
figures are derived.
• Expected loss: The expected loss is generally defined as the actual monthly
statistical mean of the aggregated loss distribution (it indicates which annual loss
the Company has to face on average over a long period of time).
• Value at Risk: The Value at Risk (VaR) is defined as the amount that is not exceeded
in q percentile cases of all years. For internal purposes, 99.98 percentile, as well as
the 99 percentile, are calculated. Any other percentile can also be derived from the
aggregate loss distribution.
• Unexpected loss: The unexpected loss for regulatory purposes is defined as the
difference between the 99.9 percentile VaR and the expected loss. The unexpected
loss determines the regulatory capital requirements of CBL for operational risk
• Expected shortfall to the q-percentile: defined as the statistical mean of the loss
distribution above the q-percentile. It is used as a proxy for the loss amount the
specific unit/entity could face if the q-percentile is exceeded.
For effective day-to-day management of OpRisk, Clearstream differentiates OpRisk into
four risk classes (“cells”), which have been found best suited for Clearstream’s business
model:
• Availability (AV)
• Service Deficiency (SD)
• Damage to Physical Assets (PA)
• Legal Offences and Business Practices (LOBP)
The distributions of all operational risk scenarios in a “cell” need to be combined to derive
the aggregate loss distribution for a “cell” and, based on that, the total loss distribution for
operational risk. Clearstream implemented a Monte Carlo simulation, which enables the
highly precise numerical determination of the loss distribution.
Assume that there are n operational risk scenarios in a simulation “cell”, where for each
scenario i(1 ≤ i ≤ n):
• The frequency distribution follows a Poisson distribution with mean λᵢ (calculated
as 1 / “frequency estimation”), and
• The severity distribution follows a continuous uniform distribution with boundaries
aᵢ < bᵢ (which are a minimum and maximum loss of the scenario).
A single Monte Carlo simulation cycle is carried out in three steps:

35
• Generate for each operational risk scenario i(1 ≤ i ≤ n) a random number for the
number Lᵢ of events for this scenario from a Poisson distribution with mean λᵢ;
• Generate for each operational risk scenario i(1 ≤ i ≤ n) loss amounts lᵢ,j (1 ≤ r ≤ Lᵢ)
from a continuous uniform distribution with boundaries aᵢ < bᵢ. The loss amounts
should be mutually independent; and
• Sum all loss amounts lᵢ,j(1 ≤ i ≤ n, 1 ≤ j ≤ Lᵢ) to calculate the total loss amount of one
year.
Repeating the Monte Carlo cycles numerous times gives a loss distribution for a “cell” with
the required accuracy. The current implementation of the model uses 25 million simulation
trials.
7.2.3 Monte Carlo simulation The underlying assumption that justifies this procedure is the independence of OpRisk
scenarios, which describe concrete loss events. The severity of an event depends on its
direct financial impact and on subsequent losses that are caused by this event. In principle,
two reasons for dependence between individual events exist. One, events triggered by
preceding events could be captured separately. These events depend on each other, which
needs to be considered in the model. Two, different events could have the same underlying
cause. Any change for the cause would affect all events, but not necessarily to the same
extent. These two types of dependence need to be treated separately.
As part of the loss data collection and scenario analysis, the total impact of an event is
considered, including the losses generated in other areas of the bank because of the
scenario event. These subsequent losses are estimated and documented within the risk
scenario template as “related effects” and taken into consideration when estimating the
severity of a risk scenario. During the scenario analysis process, the scenarios are not
captured separately. Therefore, none of the scenarios depend on each other and can be
treated in the model accordingly.
On the one hand, scenarios can be triggered by a variety of root causes. On the other,
different scenarios can have root causes that are similar in nature and fall in the same root
cause categories. To meet the criterion of independence, root causes must be assigned
uniquely to a single scenario. As an example, a terrorist attack leads to damage of physical
assets (respective risk class is “damage to physical assets”) and subsequently also causes a
business interruption with consequential claims from customers and loss of revenues
(respective risk class would be “availability”). Also, stress situations like a long-lasting
system interruption (“availability” risk) could cause human errors and omissions leading to
additional subsequent losses. However, these cross-driver events are captured within a loss
scenario. This approach ensures that the individual risk classes are independent and is
essential for the zero-correlation assumption amongst different risk classes.
This means, from a statistical point of view, that neither linear nor higher order
dependencies exist. An appropriate model for this situation is a zero-correlation model, in
which the occurrence and the size of losses belonging to different risk types are generated
completely randomly.
Risk management carries out a regular monthly check of the reasonability of the quantified
required capital. Therefore, monthly and yearly safeguards have been defined as follows.
Whenever the total 99.9% VaR moves up or down by:

36
• at least 3% of its previous month value or
• at least 10% of its previous year value,
the input data and the result must be examined to ensure the correctness of the figure.
Explanation of any variation above the safeguards is included in the quarterly risk report.
7.2.4 Stress testing of operational risk To achieve a better understanding of the most significant risks and to adequately model
capital requirements, Clearstream Risk Management runs stress tests every quarter. The
stress testing aims to gauge the potential capital vulnerability to exceptional but plausible
events. The stress test process is defined as follows:
• All scenarios agreed during the scenario analysis are generally considered when
performing the stress test. When a stress test is not passed, it is repeated whilst
excluding the scenario that caused the breach, to identify all scenarios that lead to
a failure to pass the corresponding stress test. In general, quite unlikely scenarios
with a frequency rarer than one loss in 1,000 years are disregarded.
• The risk scenario with the biggest maximum loss is benchmarked with 80% of the
available Risk-Bearing Capacity (RBC) as defined in the Clearstream risk strategy.
• A combined occurrence of several risk scenarios within one year is considered. In
principle, any combination of existing risk scenarios is possible. However, the focus
is on plausible events, considering the respective frequency of occurrence per risk
scenario. The approach is to combine the two extreme scenarios with the biggest
maximum loss and a frequency not lower than one loss in 100 years.
• In order not to focus only on extreme scenarios, the combination of non-extreme
scenarios (high frequency/low severity) is also assessed. In this respect, three non-
extreme risk scenarios with the biggest maximum loss are combined, and the total
loss amount is benchmarked with 80% of the RBC.
These stress tests are carried out when validating the outcome of the scenario analysis
review. If the specific stress tests defined above exceed 85% of the available Risk-Bearing
Capacity reporting threshold, the Executive Board is informed. In addition to the stress
tests defined above, Clearstream Risk Management might test other combinations of
scenarios to obtain a better understanding of the appropriateness of the calculated capital
requirements.
If the outcome of the regular or the ad hoc scenario review changes the OpRisk stress test
according to the above-explained methodology, then ad hoc stress tests are performed as
well. These changes involve altering a scenario already included in OpRisk stress tests or
changing the composition of the stress tests, i.e. including a new scenario and excluding
one scenario.
A reverse stress test for operational risk is performed as well. It assumes the
materialisation of several operational risk scenarios (frequency not rarer than one loss in
1,000 years). A sufficient number of operational risk scenarios are chosen so that the losses
would exceed the total RBC. Scenarios that already exceeded the RBC in the first stress test
are not considered.

37
7.3 Operational risk mitigation As laid out in its risk strategy, Clearstream gives considerable attention to its risk mitigation
process. The aim is to reduce the frequency and severity of potential operational risk
events. The process comprises several quality and control initiatives whose objective is to
ensure that Clearstream’s operations have sufficient controls to prevent any fraud or
operational service deficiency. If an event of this kind occurs in Clearstream’s operations, a
thorough analysis is performed to be in the position to define measures to reduce the
probability of recurrence.
The key preventive measures of risk mitigation consist of robust internal control processes
and ongoing initiatives to further reduce errors and omissions. This is supported by many
measures that will take effect at the time or after an incident, such as Business Continuity
Management (BCM) and insurance programs.
7.3.1 Internal control system The Executive Board of CBL has implemented an internal control system, designed to
ensure the effectiveness and profitability of the business operations, prevent or detect
financial loss and thus protect all its business assets. Clearstream’s internal control system,
an integral part of the risk management system, is continuously developed and adjusted to
reflect changing conditions. It comprises both integrated and independent control and
safety measures. In 2018, Clearstream established the Control Assurance & Monitoring
(CAM) function to further enhance the documentation and monitoring of the internal
control system.
Internal Audit carries out risk-oriented and process-independent controls to assess the
effectiveness and appropriateness of the internal control system.
7.3.2 Business continuity management Because the unavailability of core processes and resources represents a substantial risk for
Clearstream and potential systemic risk to the markets, Clearstream has implemented a
comprehensive Business Continuity Management (BCM) approach as key mitigation of
availability risk. Related tests are performed throughout the year.
BCM organisation at Clearstream
The Executive Board is responsible for ensuring the continuity of business at Clearstream
Banking S.A. This responsibility is delegated to the various organisational units, which are
directly responsible for the operational resilience and disaster tolerance of their respective
business areas. Reporting to executive management, the Business Continuity Management
function is responsible for the overall coordination, monitoring and assessment of
Clearstream’s preparedness to deal with incidents and crises.
The organisational roles and responsibilities and the guiding principles to ensure
operational resilience are documented in a formal BCM policy.
BCM arrangements
The implemented BCM arrangements aim to minimise the impact of the unavailability of
key resources and address the unavailability of systems, workspace, staff and suppliers to
ensure the continuity of the most critical operations even in cases of catastrophic events.

38
Clearstream thereby makes use of its operational locations in Cork, Eschborn, London,
Luxembourg, Prague and Singapore to maintain the continuity of its services.
Systems unavailability
Data centres are geographically distributed to form active centres, acting as backups of
each other. Data is mirrored in real time across the data centres. The infrastructure is
designed to ensure the online availability and integrity of all transactions at the time of
disruption.
Workspace unavailability
Exclusively dedicated work facilities provide backup office space for mission-critical
functions if an office location becomes unavailable. These backup facilities are fully
equipped and networked with the distributed data centres and always operational. Also,
business transfer plans between Clearstream’s different operations locations can be used
to mitigate workspace unavailability.
Staff unavailability
Business continuity solutions also cover the significant unavailability of staff, e.g. during a
pandemic-related incident or terrorist attacks. Solutions are designed to ensure that the
minimum staff and skills required are available outside the impacted location. Staff
dispersal and business transfer plans between Clearstream’s different operations locations
are in place so that, if one of these locations is impacted, mission-critical activities can be
continued by staff in other locations.
Supplier unavailability
Clearstream ensures the continuous provision of critical supplier services by several means,
such as regular due diligence reviews of suppliers’ BCM arrangements, provision of services
by alternative suppliers where possible, and service level agreements describing minimum
service levels and contingency procedures.
Incident and crisis management process
Clearstream has implemented a Group-wide incident and crisis management process that,
in a controlled and effective manner, facilitates a coordinated response and rapid reaction
to an incident or crisis. The process aims to minimise business and market impact, enabling
a swift return to regular business activity.
Incident managers have been appointed in their respective business areas as single points
of contact in case of incidents and crises to ensure the appropriate response, including
escalation up to the Executive Board and the notification of customers and other relevant
external parties.
“Real-life” simulation testing
Clearstream adopts a comprehensive and ambitious business-continuity testing approach
that simulates scenarios as close as possible to real-life situations whilst reducing
associated risks and avoiding customer impacts. BCM plans are tested regularly, at least
annually and mostly unannounced.
BCM test results are validated against the following objectives:

39
• Functional effectiveness: validating all technical functionalities.
• Execution ability: staff must be familiar with and knowledgeable in the execution of
BCM procedures.
• Recovery time: the functions in the scope of the BCM plans must be operational
within the defined recovery time objective.
Test results are reported to the Executive Board. Customers are regularly invited to
participate in Clearstream’s BCM tests to provide them with the direct assurance of
Clearstream’s BCM preparedness.
7.3.3 Insurance Insurance is an additional tool used by Clearstream to mitigate the impact of operational
risk by transferring risks above a certain threshold to third parties through a
comprehensive insurance programme.
To achieve the optimum risk/benefit versus premium ratio, insurance policies are
negotiated either through insurance brokers or directly with highly rated insurers to
purchase tailor-made policies reflecting the specificities of CBL’s business.
Although the risk mitigating effect of insurance policies is not considered in the OpRisk
capital model, the insurance programme is an important measure for mitigation
management purposes.
7.4 Monitoring and reporting The reporting approach laid out in 3.2.5 Risk monitoring and reporting also applies to the
management of operational risk. Furthermore, Clearstream produces a summary report on
the Internal Capital Adequacy Assessment Process (ICAAP) on an annual basis, which is
reviewed by Compliance and Internal Audit.
This report includes not only additional summary statistics and trend analyses of
operational risk events, but also a summary of major changes to the operational risk model,
concept and methodology, as well as quality improvements in operational risk
management.

40
8. Credit risk In accordance with Art. 435(1), 442 and 453 CRR, the following paragraph will provide
required information on credit risk and credit risk mitigation as laid down in section 4.8 –
Credit risk and general information on CRM in the EBA Guidelines on disclosure
requirements under Part Eight of Regulation (EU) No. 575/2013.
8.1 Governance Clearstream’s general risk management structure, organisation and process, as well as its
risk strategy, are specified in Chapter 3 (Risk management overview). The present status
and the business direction for credit risk are stated in a credit risk strategy. The Executive
Board periodically examines and adjusts the credit risk strategy as necessary.
The credit risk strategy is set in accordance with the Risk Management Policy and reported
annually to the supervisory board. The credit risk strategy represents the framework and
defines, amongst other things, the principles, credit risk appetite, the credit authorities,
collateral eligibility, the basic counterparty quality, as well as the fundamental country and
currency risk categories.
Regarding credit risk, the credit risk strategy is translated into a limit system, which is also
monitored regularly and ad hoc.
Clearstream may grant credit limits used to facilitate the settlement of securities
transactions and support the securities financing business. Credit is granted exclusively on a
collateralised basis where prudent haircuts are applied to the pertinent collateral, apart
from certain unsecured settlement limits granted to sovereign and supranational
institutions (as per the exemption provided for in Art. 23.2 CSDR (EU) No. 2017/390).
Borrowers with respect to Clearstream are principally central banks, banks and financial
institutions. Furthermore, credit limits are set for the placement of funds with
counterparties. Credit processing is arranged in guidelines and work instructions.
Credit limits are set in accordance with the customer’s financial standing, as indicated by
factors such as the customer’s credit rating and net worth taking into account the level of
activity in the customer’s accounts and level of collateralisation.
The evaluation of counterparties and the credit risk classification takes place within the
“credit assessment”, which is performed by the Credit section. A quarterly benchmarking
exercise with regard to external sources is performed, and internal ratings are adjusted
when deemed necessary.
Collateral recoverability is also part of the tests performed by the Credit Default
Management Team.
The credit section manages country risk by setting limits for each country based on the
country’s internal credit rating. Exceptions are reported to the Executive Board monthly.
Currency limits are established for non-major currencies to cover currency exposure.
Any exception to the Credit Risk Policy must be approved by the Executive Board.
All credit risk exposures are regularly reviewed and monitored. Clearstream also conducts
special reviews when information indicating an adverse change in the risk assessment of
the exposure or collateral is received from external and internal sources.

41
The exposure limit, mentioned above, is set to ensure that Clearstream does not take too
large an exposure, and therefore risk, on too few participants or counterparties.
Luxembourg banking regulations also impose risk concentration limits that must be
respected for each applicable exposure.
In principle, exposures after credit risk mitigation techniques to an individual customer or
group of connected customers above 25% of own funds are reported as a breach under the
Large Exposures regulation.
Credit risk control is performed by the Credit section, an independent function. The Credit
section is responsible for issuing the monthly credit report to the Executive Board and
Group Risk Monitoring, as well as for credit exposure reporting to Group Risk Monitoring,
which forms the basis of the credit VaR calculations.
8.2 Credit risk exposures
8.2.1 Application of the standardised approach For the exposure class pertaining to central governments and central banks, Clearstream
uses the credit assessments by the OECD4. Clearstream also nominated the external credit
assessment institution (ECAI) Standard & Poor’s for the same exposure class, because OECD
stopped assessing so-called “high-income countries” in 2013. For the “regional
governments or local authorities” and “public sector entities” and “institutions” (credit
institutions, investment firms and other dedicated financial counterparties) exposure
classes, the dedicated risk weight is derived from that of the respective country of domicile.
The use of these credit assessments by the OECD and Standard & Poor’s ratings has been
reported to the Luxembourg supervisor.
The exposures of Clearstream belong mainly to the exposure classes of central
governments, central banks and institutions. The current exposures to central governments
and central banks are mainly risk-weighted at 0%. Exposures to institutions generally have
a short original maturity of less than or equal to three months; therefore, under Art. 120
paragraph 2 CRR the risk weight is 20%.
The risk weighting for multilateral development banks is in most cases 0%.
Covered bonds obtain a risk weighting based on the risk weightings assigned to senior
unsecured claims on the credit institution that issues them.
All other exposures in the different exposure classes mostly achieve the prescribed risk
weighting of an unrated position (“unrated” implies that no credit rating by an eligible ECAI
exists or no ECAI has been nominated for that purpose).
Clearstream complies with the risk weighting as defined in Section 2, Chapter 2 of Part 3,
Title II CRR.
4 Country risk classification: http://www.oecd.org/tad/xcred/crc.htm.

42
The table below shows the applied risk weights for each exposure class:
Exposure classes Risk weight
Total 0% 2% 20% 50% 100% 150% 250% Others
Central governments or central banks
6,156,704 0 1,600 4,273 859 0 0 0 6,163,436
Regional government or local authorities
261,843 0 0 0 0 0 0 0 261,843
Public sector entities
234,795 0 0 0 0 0 0 0 234,795
Multilateral development banks
708,842 0 0 0 0 0 0 0 708,842
International organisations
20,392 0 0 0 0 0 0 0 20,392
Institutions 0 125,038 62,782,955 0 24,576 0 0 0 62,932,569
Corporates 0 0 3,321,462 0 72,895 647 0 0 3,395,004
Exposures in default
0 0 0 0 0 6,849 0 0 6,849
Equity 0 0 0 0 5,558 0 31,646 0 37,204
Other items 5 0 0 0 13,086 0 0 0 13,091
Total 7,382,581 125,038 66,106,017 4,273 116,974 7,496 31,646 0 73,774,025
Table 15 - Standardised approach - risk weights
8.2.2 Detailed information and distribution of credit risk exposure Value adjustments and provisions
Clearstream assesses, at each balance sheet date, whether there is objective evidence that
a financial asset or group of financial assets is impaired, where appropriate applying the
expected loss model as introduced by IFRS 9 Financial Instruments.
Clearstream does not have material amounts of value adjustments and provisions for credit
risk exposures at present, mainly because of its business model, which is focused on short-
term lending activities to enable efficient settlement processes and the possibility to
directly collect trade receivables within a couple of days.
Past due items and default or non-performing exposures
According to the definitions stated below, Clearstream had no material past due items or
defaulted exposures on its books on the reporting date or during the year under review.
Definition of past due:
The CRR classifies an exposure as “past due” if a counterparty has failed to make a payment
when contractually due, when the debtor has exceeded an external limit communicated to
it, as well as when the debtor has utilised credit without prior consent.
Definition of default or non-performing:
According to Art. 178 CRR, a debtor is in default when either or both of the following
conditions apply:

43
• The institution has material reason to consider that the obligor is unlikely to pay its
(credit) obligations in full, without recourse by the institution to actions such as
realising collateral (if held).
• The obligor is past due more than 90 successive calendar days on any material part
of its overall credit obligation to the institution.
Clearstream’s internal definition of “impairment” according to the International Financial
Reporting Standards (IFRS) is compliant with the definition of “default” outlined in Art. 178
CRR.I have
Credit risk mainly arises in the short term and with credit institutions or governmental
counterparties. Treasury counterparties, as well as CCBs for the operational network, are
selected based on a high degree of creditworthiness and operational reliability. Due to the
short-term nature of the business performed by Clearstream, strict internal guidelines and
close monitoring of business, there have been no material credit losses at Clearstream
since 1970.
Distribution of credit risk exposures
In the following, the distribution of the credit risk exposures is broken down by exposure
classes (Art. 442 (c) CRR), geographical area (Art. 442 (d) CRR), industry (Art. 442 (e) CRR),
and residual maturity (Art. 442 (f) CRR).
As at 31 December 2019, the allocation per exposure class was as shown in the following
table. Most of the exposures held by Clearstream are with central governments and
institutions, which account for more than 93% of exposures. Compared with the year-end
amount, the table also shows the average exposure during the year under review.
The net value of exposures at
the end of the period Average net exposures over
the period
15 Total IRB approach
16 Central governments or central banks
6,163,438 7,118,016
17 Regional governments or local authorities
261,843 271,299
18 Public sector entities 234,795 338,976
19 Multilateral development banks 708,842 615,407
20 International organisations 20,392 5,226
21 Institutions 62,932,568 57,682,200
22 Corporates 3,395,005 1,377,487
23 Of which: SMEs 0 0
24 Retail 0 0
25 Of which: SMEs 0 0
26 Secured by mortgages on immovable property
0 0
27 Of which: SMEs 0 0
28 Exposures in default 6,849 3,057
29 Items associated with particularly high risk
0 0
30 Covered bonds 0 0
31 Claims on institutions and corporates with a short-term credit assessment
0 0

44
32 Collective investments undertakings 0 0
33 Equity exposures 37,203 22,650
34 Other exposures 13,092 20,913
35 Total standardised approach 73,774,027 67,455,231
36 Total 73,774,027 67,455,231
Table 16 - Total and average net amount of exposure
As shown in the table, CBL holds most of its exposures with central and regional
governments, central banks, PSEs, MDBs and institutions. No retail or SME exposure was
held during the year under review. In accordance with IFRS 9, CBL recognised exposures in
default.
The following table provides information about the geographical allocation of credit risk
exposures broken down by exposure classes. As shown below, most exposures of
Clearstream are in the European Union.
Net value
European Union Rest of Europe North America
Rest of world Total
6 Total IRB approach
7 Central governments or central banks
6,121,116 34,053 1,918 6,351 6,163,438
8 Regional governments or local authorities
261,843 0 0 0 261,843
9 Public sector entities 234,795 0 0 0 234,795 10 Multilateral
development banks 335,870 0 372,918 54 708,842
11 International organisations
20,281 111 0 0 20,392
12 Institutions 59,161,156 1,290,634 514,481 1,966,298 62,932,568
13 Corporates 3,379,421 1,718 668 13,197 3,395,005
16 Exposures in default 1,884 4,858 19 88 6,849
21 Equity exposures 9,057 0 0 28,146 37,203
22 Other exposures 13,088 0 0 3 13,092
23 Total standardised approach
69,538,511 1,331,374 890,004 2,014,137 73,774,026
24 Total 69,538,511 1,331,374 890,004 2,014,137 73,774,026 Table 17 - Geographical breakdown of exposures
The next table shows a breakdown of exposures by industry or counterparty type and
exposure classes. The financial industry is the most important for Clearstream Banking S.A.,
as most of the exposures consist of securities financing transactions with large financial
institutions. Finance and banking amounts to 98% of the total exposure of Clearstream
Banking S.A.

45
Fin
ance
an
d b
anki
ng
Oth
er
Pu
blic
ad
min
istr
atio
n a
nd
def
en
ce,
com
pu
lso
ry s
oci
al s
ecu
rity
Rea
l est
ate
acti
viti
es
Co
nst
ruct
ion
Wh
ole
sale
an
d r
etai
l tra
de
Info
rmat
ion
an
d c
om
mu
nic
atio
n
Ad
min
istr
ativ
e an
d s
up
po
rt s
ervi
ce
acti
viti
es
Hu
man
hea
lth
se
rvic
es a
nd
so
cial
wo
rk a
ctiv
itie
s
Man
ufa
ctu
rin
g
Tran
spo
rt a
nd
sto
rage
Elec
tric
ity,
gas
, ste
am a
nd
air
con
dit
ion
ing
sup
ply
Tota
l
Total IRB approach
Central governments or central banks 6,135,412 0 23,514 0 0 0 0 4,512 0 0 0 0 6,163,438
Regional governments or local authorities 261,803 0 40 0 0 0 0 0 0 0 0 0 261,843
Public sector entities 234,795 0 0 0 0 0 0 0 0 0 0 0 234,795
Multilateral development banks 708,842 0 0 0 0 0 0 0 0 0 0 0 708,842
International organisations 20,392 0 0 0 0 0 0 0 0 0 0 0 20,392
Institutions 62,932,568 0 0 0 0 0 0 0 0 0 0 0 62,932,568
Corporates 3,387,360 7,314 0 0 0 0 96 175 7 11 40 2 3,395,004
Exposures in default 6,619 211 0 0 0 0 1 0 0 0 16 0 6,847.00
Equity exposures 0 37,203 0 0 0 0 0 0 0 0 0 0 37,203
Other exposures 13,092 0 0 0 0 0 0 0 0 0 0 0 13,092
Total standardised approach
73,700,883 44,728 23,554 0 0 0 97 4,686 7 11 56 2 73,774,025
Table 18 - Concentration of exposures by industry or counterparty types

46
The following table provides information about the residual contract maturity, broken
down by exposure classes. Most exposures are short term with a significant part being
intraday exposures.
Net exposure value
≤ 3 months Between 3
months and 1 year
> 1 year Total
6 Total IRB approach
7 Central governments or central banks
86,676 0 6,076,761 6,163,437
8 Regional governments or local authorities
1 0 261,842 261,843
9 Public sector entities 0 0 234,795 234,795
10 Multilateral development banks
0 0 708,842 708,842
11 International organisations 0 0 20,392 20,392
12 Institutions 1,278,159 0 61,654,409 62,932,568
13 Corporates 5,968 0 3,389,036 3,395,004
16 Exposures in default 6,849 0 0 6,849
21 Equity exposures 37,203 0 0 37,203
22 Other exposures 0 0 13,092 13,092
23 Total standardised approach
1,414,856 0 72,359,169 73,774,025
24 Total 1,414,856 0 72,359,169 73,774,025
Table 19 - Maturity of exposures
The next seven tables provide a closer view on the quality of the exposures and more
specifically to the exposures in default. The first table shows the defaulted exposures next
to the ones not defaulted per exposure class.
Gross carrying values of
Specific credit risk
adjustment
General credit risk
adjustment
Accumulated write-
offs
Credit risk adjustment charges of
the period Net values
Defaulted exposures
Non-defaulted exposures
Central governments or central banks 0 6,163,438 0 0 0 0 6,163,438
Regional governments or local authorities 0 261,843 0 0 0 0 261,843
Public sector entities 0 234,824 -29 0 0 -29 234,795
Multilateral development banks 0 708,842 0 0 0 0 708,842
International organisations 0 20,392 0 0 0 0 20,392
Institutions 0 62,932,568 0 0 0 0 62,932,568
Corporates 0 3,395,005 0 0 0 0 3,395,005
Retail 0 0 0 0 0 0 0
Secured by mortgages on immovable property 0 0 0 0 0 0 0

47
Exposures in default 7,538 0 -689 0 0 -689 6,849
Items associated with particularly high risk 0 0 0 0 0 0 0
Covered bonds 0 0 0 0 0 0 0
Claims on institutions and corporates with a short-term credit assessment 0 0 0 0 0 0 0
Collective investments undertakings 0 0 0 0 0 0 0
Equity exposures 0 37,203 0 0 0 0 37,203
Other exposures 0 13,092 0 0 0 0 13,092
Total standardised approach 7,538 73,767,207 -718 0 0 -718 73,774,027
Total 7,538 73,767,207 -718 0 0 -718 73,774,027
Table 20 - Credit quality of exposures by exposure class and instrument
The next table shows the split of the defaulted and non-defaulted exposure per economic
sector of the counterparty. As the largest part of exposures is vis-à-vis counterparties of the
“Finance and banking” sector, it follows that also the largest part of the defaulted
exposures is vis-à-vis counterparties of the same industry.
Gross carrying values of
Specific credit risk
adjustment
General credit risk
adjustment Accumulated
write-offs
Credit risk adjustment charges of
the period Net values
Defaulted exposures
Non-defaulted exposures
Finance and banking 7,096 73,694,294 -506 -506 73,700,884
Other 442 44,499 -212 -212 44,729
Public administration and defence, compulsory social security 0 23,554 0 0 0 0 23,554
Real estate activities 0 0 0 0 0 0 0
Construction 0 0 0 0 0 0 0
Wholesale and retail trade 0 0 0 0 0 0 0
Information and communication 0 97 0 0 0 0 97
Administrative and support service activities 0 4,687 0 0 0 0 4,687

48
Human health services and social work activities 0 7 0 0 0 0 7
Manufacturing 0 11 0 0 0 0 11
Transport and storage 0 57 0 0 0 0 57
Electricity, gas, steam and air conditioning supply 0 2 0 0 0 0 2
Total 7,538 73,767,208 -718 0 0 -718 73,774,028
Table 21 - Credit quality of exposures by industry or counterparty types
Just like above the next table also shows the breakdown of exposure in default and
exposures non-defaulted, but this time per geographical area, and here the European
Union is the most important region in terms of exposures, but the rest of Europe
represents a bigger share in terms of defaulted exposures.
Gross carrying values of
Specific credit risk
adjustment
General credit risk
adjustment Accumulated
write-offs
Credit risk adjustment charges of
the period Net values
Defaulted exposures
Non-defaulted exposures
European Union 2,275 69,536,653 -407 0 0 -407 69,538,521
Rest of Europe 5,131 1,326,516 -279 0 0 -279 1,331,368
North America 33 889,986 -14 0 0 -14 890,005
Rest of world 99 2,014,049 -18 0 0 -18 2,014,130
Total 7,538 73,767,204 -718 0 0 -718 73,774,024
Table 22 - Credit quality of exposures by geography
The following table illustrates the aging of past-due exposures.
Gross carrying values
≤ 30 days
> 30 days ≤ 90 day
> 90 days ≤ 180 days
> 180 days ≤ 1 year
> 1 year
Debt securities 1,225,362 0 0 0 0
Loans and advances 14,048,979 503,711 961 5,697 880
Off-balance-sheet exposures
337,597 0 0 0 0
Table 23 - Ageing of past-due exposures
The following table provides information about the non-performing and the forborne.
The vast majority of the exposures has been performing.
Gross carrying values of performing and non-performing exposures
Accumulated impairment and provisions and negative fair value adjustments due to credit risk
Collaterals and financial guarantees received

49
Of
wh
ich
per
form
ing
bu
t p
ast
du
e >
30
day
s
and
<=
90
day
s
Of
wh
ich
per
form
ing
forb
orn
e
Of which non-performing On performing exposures
On non-performing exposures
On
per
form
ing
exp
osu
res
Of
wh
ich
fo
rbo
rne
exp
osu
res
Of
wh
ich
def
ault
ed
Of
wh
ich
imp
aire
d
Of
wh
ich
fo
rbo
rne
Of
wh
ich
fo
rbo
rne
Of
wh
ich
fo
rbo
rne
10 Debt securities
1,225,362 0 0 0 0 0 0 -30 0 0 0 0 0
20 Loans and advances
14,057,021 504 0 7,538 0 0 0 -21,701 0 -689,040 0 0 0
30 Off-balance sheet exposures
337,596,951 0 0 0 0 0 0 0 0 0 0 0 0
Table 244 - Non-performing and forborne exposures
The following table provides information about the specific and general credit adjustments.
Accumulated
specific credit risk
adjustment
Accumulated
general credit risk
adjustment
Opening balance 362 0
Increases due to amounts set aside for estimated loan losses during the period
466 0
Decreases due to amounts reversed for estimated loan losses during the period
-88 0
Decreases due to amounts taken against accumulated credit risk adjustments
0 0
Transfers between credit risk adjustments 0 0
Impact of exchange rate differences 0 0
Business combinations, including acquisitions and disposals of subsidiaries
0 0
Other adjustments 0 0
Closing balance 740 0
Recoveries on credit risk adjustments recorded directly to the statement of profit or loss
88 0
Specific credit risk adjustments directly recorded to the statement of profit or loss
466 0
Table 25 - Changes in the stock of general and specific credit risk adjustments
The following table provides information about the changes in the stock of defaulted and
impaired loans and debt securities.

50
Gross carrying
value defaulted exposures
Opening balance 527
Loans and debt securities that have defaulted or impaired since the last reporting period 7,021
Returned to non-defaulted status -10
Amounts written off 0
Other changes 0
Closing balance 7,538
Table 26 - Changes in the stock of defaulted and impaired loans and debt securities
8.2.3 Stress testing of credit risk The term “stress test” comprises the entirety of qualitative and quantitative analysis
methods of rare but plausible events. There are two stress tests performed for credit risk:
• The “Default of the Largest Counterparty Group Stress Test”, where the default of
the counterparty Group with the largest unsecured exposure is simulated monthly,
after utilisation of all respective collateral and after taking the recovery rate into
account.
• The “Economic Deterioration Stress Test”, where the impact on Clearstream of a
deterioration of the economic environment is simulated monthly. To capture the
worsening of the economy, certain credit risk model parameters are adjusted
compared to the standard VaR simulation.
The results of the “Default of the Largest Counterparty Group Stress Test” and the
“Economic Deterioration Stress Test” are compared to limits, which are defined as a
fraction of the available Risk-Bearing Capacity. The stress test results are reported to the
Executive Board every quarter and semi-annually to the supervisory board.
In addition to the stress tests defined above, a “Reverse Credit Stress Test” is also
performed, which aims to identify the number of unsecured credit lines that exceed the
available risk-bearing capacity.
In the year under review, the stress tests did not reveal any risks endangering the going
concern of Clearstream’s business.
8.3 Credit risk mitigation Disclosure requirements concerning credit risk mitigation are laid down in Section C EBA
Guidelines on disclosure requirements under Part Eight of Regulation (EU) No. 575/2013 in
conjunction with Art. 453 CRR.
The credit risk mitigation technique used by Clearstream Banking S.A. for solvency
purposes is collateralisation. Furthermore, a variety of account relation is maintained on a
current account basis, and therefore only net positions are relevant.
The companies of Deutsche Börse Group are highly integrated and perform a variety of
services for each other. Therefore, respective fees are invoiced, resulting in payables and

51
receivables. To optimise cash flows and reduce payment efforts in situations with material
cash flows in both directions, positions are held in current accounts based on netting
agreements. Debits and credits are netted immediately, and net positions are settled once
a month.
Accounts with customers or CCBs are generally maintained on a current account basis.
Therefore, all movements in these accounts and currencies are immediately netted to
single account balances.
For credit purposes, except as otherwise agreed between the customer and Clearstream,
all customer accounts with Clearstream, in whatever currency they are held, are deemed to
form elements of a single, indivisible current account, and Clearstream may at any time set
off, in whole or in part, credit and debit balances standing to any accounts held by the
customer with Clearstream.
Despite these netting options, no netting takes place for regulatory and risk management
purposes. For credit purposes, cash credit positions from these arrangements are taken as
cash collateral. For solvency purposes, this collateral is not considered (see 9.3.1 Collateral).
The following table shows the respective total credit risk exposure for on-balance, and off-
balance sheet amounts in the standardised approach, before and after applying credit risk
mitigation techniques and CCF, as well as the RWA applied for each relevant exposure class:
Exposures before CCF and CRM Exposures post CCF and CRM RWAs and RWA density
Exposure classes
On-balance sheet
amount
Off-balance sheet amount
On-balance sheet amount
Off-balance sheet amount
RWAs RWA
density
1 Central governments or central banks
6,114,479 48,959 6,114,479 0 3,316 0.05%
2 Regional government or local authorities
261,843 0 261,843 0 0 0.00%
3 Public sector entities
234,825 0 234,795 0 0 0.00%
4 Multilateral development banks
708,842 0 708,842 0 0 0.00%
5 International organisations
20,392 0 20,392 0 0 0.00%
6 Institutions 1,389,537 61,543,032 1,389,536 864,398 451,133 20.02%
7 Corporates 73,563 3,321,462 73,542 9,995 75,865 90.82%
8 Retail 0 0 0 0 0 0.00%
9
Secured by mortgages on immovable property
0 0 0 0 0 0.00%
10 Exposures in default
7,538 0 6,849 0 10,273 149.99%
11
Exposures associated with particularly high risk
0 0 0 0 0 0.00%
12 Covered bonds 0 0 0 0 0 0.00%
13
Institutions and corporates with a short-term credit assessment
0 0 0 0 0 0.00%

52
14 Collective investment undertakings
0 0 0 0 0 0.00%
15 Equity 37,203 0 37,203 0 84,672 227.59%
16 Other items 13,092 0 13,092 0 13,086 99.95%
17 Total 8,861,314 64,913,453 8,860,574 874,393 638,345 6.56%
Table 277 - Standardised approach - credit risk exposures and CRM effect
8.3.1 Collateral
8.3.1.1 Settlement credit limits
The purpose of the settlement credit limit is to facilitate the clearance of securities
transactions against payment. Two types of credit limit are currently available, the
Technical Overdraft Facility (TOF) and the Unconfirmed Funds Facility (UCF). Under the
terms and conditions of the TOF contract and the General Terms and Conditions,
Clearstream Banking S.A. has a pledge on all customer assets held in the customer
account(s) defined as pledge account(s) to secure customer obligations to CBL for the
services rendered by CBL to this customer. These contracts are complemented by netting
provisions permitting the offset of credit and debit balances standing to customer accounts.
Collateral eligibility is defined and approved by the Credit section within the boundaries of
the Credit Policy as approved by the Executive Board. Eligibility and haircut are dependent
on the security’s credit, market, liquidity and legal risks.
Eligible collateral securities are subject to a margin deduction from their market value;
haircuts range from 2% to 100% depending on the issue type and credit quality. The
following instruments are eligible as collateral to support cash financing facilities:
• Fixed income securities with a minimum S&P, Fitch or Moody’s rating of BBB-/Baa3,
issued by sovereigns and central banks, local and regional governments,
government agencies and supranational institutions, corporate and credit
institutions;
• European covered bonds;
• Select equities included in STOXX Europe 50 and STOXX North America 50 indices.
In general, all securities not classified as eligible are ineligible as collateral, including the
following:
• Investment funds;
• Warrants;
• Structured securities, for example, CDO, CLO, CLN, MBS;
• Own paper;
• Subordinated securities.
Collateral haircuts are automatically recalculated daily; collateral policy is reviewed at least
once a year.
Customers’ collateral positions are evaluated daily, based on prices received from various
data vendors. The system automatically blocks any transaction on a given account whose
settlement requires more than the available collateral.
In the application of Art. 453(f) and (g), information on exposure value covered by financial
collateral, other collateral, guarantees and credit derivatives is to be understood as

53
information on outstanding secured exposures and the secured amount within those
exposures. Please find the required information in the two tables here below:
Exposures unsecured – carrying amount
Exposures secured – carrying amount
Exposures secured by collateral
Exposures secured by financial guarantees
Exposures secured by credit derivatives
1 Total loans 114,177 0 0 0 0
2 Total debt securities
1,225,333 0 0 0 0
3 Total exposures 1,339,510 0 0 0 0
4 Of which, defaulted
0 0 0 0 0
Table 288 - CRM techniques - on-balance sheet
Exposures unsecured – carrying amount
Exposures secured – carrying amount
Exposures secured by collateral
Exposures secured by financial guarantees
Exposures secured by credit derivatives
1 Guarantees and commitments
64,799 272,798 272,798 0 0
2 Total exposures 64,799 272,798 272,798 0 0
3 Of which, defaulted
0 0 0 0 0
Table 299- CRM techniques - off-balance sheet
As explained above, for loans provided to customers, exposures are secured by pledges on
customers’ accounts and all assets held with Clearstream Banking S.A. and not with
guarantees or credit derivatives. The debt instruments are of high quality, issued by central
and regional governments, PSE, MDBs or large credit institutions. As shown in the second
table, the major part of the off-balance sheet guarantees and commitments are secured by
eligible financial collateral.
8.4 Repurchase agreements Clearstream Banking S.A. bases a significant part of the Group’s liquidity on reverse repo
agreements with a maximum maturity of one year, but usually with maturities of three
months or less. Repo transactions must be governed by a Global Master Repurchase
Agreement (GMRA) and are only concluded with banking counterparties fulfilling minimum
rating criteria.
Repo transactions are settled via Clearstream’s settlement system, or the Euroclear system
via the “Bridge”, or the domestic settlement systems of Clearstream’s depositories. All
settlement systems used are proven for that type of transaction.
Securities taken as collateral in repo-style transactions must fulfil specific requirements:
• Only the most liquid, least volatile and daily priced debt instruments with a defined
credit rating (minimum long-term credit rating of Moody’s [Aa3] or Standard &
Poor’s [AA-] or Fitch [AA-]); in the absence of a rating for the issue, the issuer rating
(lowest available is relevant) are eligible as collateral for repo transactions;
• Issuers are limited to sovereigns, local governments, government agencies
explicitly guaranteed by national governments, supranational banks, and all issuers
with an explicit sovereign or local government guaranty;

54
• Not acceptable as collateral are: ABS, MBS (RMBS and CMBS) and other forms of
non-standard collateral (such as CDOs, derivative bonds, credit-linked bonds,
callable bonds, perpetual bonds, warrants);
• All collateral must have an active market and must be liquid;
• Subordinated securities are not eligible;
• Transactions in which the securities given as collateral are issued by either the
counterparty (“own assets”) or an affiliate of the counterparty are not allowed. For
this reason, specific wrong way risk is not a factor for Clearstream;
• The maximum remaining life to maturity of the accepted securities is ten years.
Cross-currency collateralisation is generally possible. It was not used for bilateral
transactions but in the context of tri-party repos. Bilateral transactions must be “plain
vanilla” on a single fixed-income security. In tri-party transactions (including Eurex Repo GC
Pooling transactions), multiple fixed-income securities may be taken as collateral.
Structured transactions are not allowed.
Haircuts on the securities are applied within tri-party repo transactions (including Eurex
Repo GC Pooling transactions). All collateral is valued daily. To secure the cash lent through
reverse repurchase agreements, CBL agrees on margin calls with the repo counterparty
daily to keep cash and collateral in balance.
For solvency purposes, according to Art. 227 CRR, the application of zero volatility
adjustments is possible in most cases. Where the conditions of the regulation stated above
are not fulfilled, supervisory haircuts as laid down in Art. 224 CRR apply. In cases of FX
mismatch, further cross-currency haircuts are to be applied.
8.5 ASL ASL (Automated Securities Lending) is a lending programme that allows customers who are
short of securities due to settlement failure to borrow securities from other Clearstream
customers (lenders).
CBL acts as:
• Lending agent, offering:
➢ Automatic detection of loan requirements to cover a failed trade;
➢ Automatic identification of loan supply from ASL lenders;
➢ Anonymous transfer of securities to the ASL borrower (the undisclosed
relationship between lender and borrower);
➢ Administration of the loan.
• Collateral agent, monitoring the quality and sufficiency of collateral regarding:
➢ Eligibility;
➢ Collateral value;
➢ Concentration limits;
➢ Fluctuations in the market values of positions pledged as collateral (mark-to-
market of the loan and the collateral);
➢ Securities prices, reviewed several times a day depending on the closing time of
the market;
➢ Automatic collateral substitution.
• Guarantor for the collateralised loans:
➢ Underwriting the risk involved if the borrower defaults on its obligations;

55
➢ Managing collateral securities pledged by the borrower to CBL;
➢ Assigning loan limits to borrowers to avoid any new loan opening if the limit is
reached.
8.5.1 Risk guarantee In the ASL programme, each loan position is guaranteed by CBL. The guarantee is backed by
securities pledged by the borrower, as follows:
• Collateral securities are pledged by the borrower to CBL under a first-ranking
pledge under Luxembourg law. Collateral quality and sufficiency are monitored by
CBL daily;
• A second-ranking pledge on collateral in favour of the lender – in the unlikely event
of a simultaneous default by CBL and the borrower, the right to the collateral
passes to the lender.
8.5.2 Coverage value The coverage value of the guarantee related to an ASL loan is equal to the market value of
the securities plus an additional margin. Standard margins, varying from 0% to 15%, are
applied depending on the securities lent.
8.5.3 Collateral eligibility The collateral eligibility criteria of the ASL programme are the same as those for
Clearstream’s settlement engine.
Collateral eligibility is defined and approved by the Credit section. Eligibility and haircut are
dependent on the credit, market, liquidity and legal risks of the security.
Eligible securities are subject to a margin deduction from their market value; haircuts range
from 2% to 100% depending on the issue type and credit quality.
Securities issued by or correlated to the customer are not eligible as collateral.
Collateral haircuts are automatically recalculated daily; collateral policy is reviewed at least
once a year.
Customers’ collateral positions are evaluated daily, based on prices received from various
data vendors. The system automatically blocks any transaction on a given account whose
settlement requires more than the available collateral.
8.6 ASLplus The ASLplus programme is a securities lending programme that enables customers to
enhance the revenues that can be realised as a lender by offering access to the wholesale
trading market. Clearstream Banking S.A. acts as a principal to the lenders in ASLplus and
lends on securities to market participants through various counterparties.
The Credit section defines collateralised securities borrowing limits for each borrower and
credit limits are agreed based on standard framework agreements between CBL and each
borrower. Generally, apart from limited exceptions, only securities rated A+5 and above are
eligible for collateral with haircuts ranging from 2% to 15% depending on the issuer type.
5 Securities rated below A+ are accepted with restrictive concentration limits for certain collateral schedules.

56
Furthermore, both the exposure and the collateral are subject to daily valuation and re-
margining; the exposure and the collateral may be denominated in a different currency.
Mortgage-backed and other structured securities are not eligible as collateral.
To mitigate cross-currency risk in ASLplus, additional coverage is requested where there is a
currency mismatch between a customer’s loan and collateral portfolios. The add-on haircut
ranges from 0.5% (if the currency mismatch represents more than 20% of the exposure
amount) to 2% (if it exceeds 80%) for three business days.
The additional haircut requirement may be increased to the following levels if the foreign
exchange mismatch amount exceeds the indicated thresholds:
• 3% for FX mismatch amount between EUR 2 billion and EUR 2.75 billion;
• 4% for FX mismatch amount between EUR 2.75 billion and EUR 3.5 billion;
• 6% for FX mismatch amount above EUR 3.5 billion.
Collateral for ASLplus business is delivered in a collateral pool serving several loans. Out of
the pool, collateral with a value of at least the requested collateral value based on internal
credit rules is blocked for the total of the associated loans. No allocation on a loan-by-loan
basis is done for credit purposes.
As for the collateralised placing, a zero weighting as per the application of Art. 227 CRR is
generally possible. As the lending business covers a broader range of securities that do not
fulfil the criteria laid down in Art. 227 CRR, and the collateral given by the ultimate lender
only partially fulfils these criteria, only a portion is zero weighted. For the remainder, the
supervisory haircuts are applied. Since there is a notable portion of cross-currency
collateralisation, additional FX haircuts are applied.
8.7 Monitoring and reporting The Credit section reports new credit lines and changes of credit lines (increases as well as
reductions), changes of the internal rating for customers and credit exposures to Group
Risk Monitoring. Besides that, limit breaches – if any – are reported to the Executive Board
and Group Risk Monitoring.
The reporting approach described under 3.3.5 Risk monitoring and reporting also applies to
the management of credit risk. On this basis, Group Risk Monitoring assesses the credit risk
and reports VaR results as well as risk issues to the Executive Board. Besides the
assessment of the VaR, Group Risk Monitoring also measures credit risk concentration and
performs stress test calculations on credit risk (see 9.2.3 Stress testing of credit risk).
8.8 Asset encumbrance The EBA specified the disclosure of information on asset encumbrance under Art. 443 CRR
with the EBA Guidelines on the disclosure of encumbered and unencumbered assets on 26
June 20146. The disclosures described below are made on the basis of this guideline.
The following table discloses the amount of encumbered and unencumbered assets
according to the EBA regulatory technical standards on the disclosure of encumbered and
unencumbered assets under Art. 443 CCR7 (EBA/RTS/2017/03):
6 Guidelines on disclosure of encumbered and unencumbered assets:
http://www.eba.europa.eu/documents/10180/741903/EBA-GL-2014-
03+Guidelines+on+the+disclosure+of+asset+encumbrance.pdf/c65a7f66-9fa5-435b-b843-3476a8b58d66 .

57
Carrying amount of encumbered assets
The fair value of encumbered assets
Carrying amount of unencumbered assets
The fair value of unencumbered assets
Of which, notionally eligible EHQLA and HQLA
Of which, notionally eligible EHQLA and HQLA
Of which, EHQLA and HQLA
Of which, EHQLA and HQLA
010 030 040 050 060 080 090 100
010 Assets of the reporting institution
361,288 0 15,115,241 781,438
020 Loans on demand 357,404 0 7,068,165 0
030 Equity instruments 0 0 5,558 0
040 Debt securities 0 0 0 0 1,225,333 781,438 1,226,711 781,959
050 of which: covered bonds
0 0 0 0 0 0 0 0
060 of which: asset-backed securities
0 0 0 0 0 0 0 0
070 of which: issued by general governments
0 0 0 0 496,598 282,084 327,653 282,697
080 of which: issued by financial corporations
0 0 0 0 728,735 499,354 899,058 499,261
090 of which: issued by non-financial corporations
0 0 0 0 0 0 0 0
100 Loans and advances other than loans on demand
0 0 0 0 6,630,741 0 0 0
110 of which: mortgage loans
0 0 0 0 0 0 0 0
120 Other assets 3,884 0 185,444 0
Table 30 - Encumbered and unencumbered assets
The primary sources of encumbrance are blocked accounts (Argentinean and Iranian nostro
accounts and cash overdrafts) and the reserve amount at the BCL.
However, as shown in the table above, the overall level of encumbrance is low.
Unencumbered assets are mainly related to the following positions:
• Loans on-demand account for around 54%, which mainly consists of customer
liquidity that is placed overnight;
• Other loans and advances that are mainly made up of repurchase agreements as
described in 10.5 Repurchase agreements account for 37% of unencumbered
assets;
• 8% of unencumbered assets consist of debt securities, mostly high-quality liquid
assets;
• The remaining minor part is mainly other receivables and intangible assets.
The next table shows the fair value of encumbered or unencumbered collateral received:
7 Regulatory technical standards on disclosure of encumbered and unencumbered assets under Art. 443 of the CCR: https://eba.europa.eu/documents/10180/1771929/Final+draft+RTS+on+Encumbered+and+Unencumbered+Assets+%28EBA-
RTS-2017-03%29.pdf/8b3f847a-4f7c-4ad9-a058-92f1209b0e3d

58
The fair value of encumbered collateral received or own debt securities issued
Unencumbered
The fair value of collateral received or own debt securities issued available for encumbrance
Of which, notionally eligible EHQLA and HQLA
Of which, EHQLA and HQLA
010 030 040 060
130 Collateral received by the reporting institution 946,420 943,536 5,575,983 912,481
140 Loans on demand 0 0 0 0
150 Equity instruments 0 0 0 0
160 Debt securities 946,420 943,536 5,575,983 912,481
170 of which: covered bonds 0 0 0 0
180 of which: asset-backed securities 0 0 0 0
190 of which: issued by general governments 511,760 508,876 3,976,475 620,155
200 of which: issued by financial corporations 399,642 399,642 1,593,479 292,326
210 of which: issued by non-financial corporations 35,018 35,018 6,028 0
220 Loans and advances other than loans on demand
0 0 0 0
230 Other collateral received 0 0 0 0
240 Own debt securities issued other than own covered bonds or asset-backed securities
0 0 0 0
250 TOTAL ASSETS, COLLATERAL RECEIVED, AND OWN DEBT SECURITIES ISSUED
1,307,707 943,536
Table 31 - Collateral received
The sources of encumbrance are shown in the following table:
Matching liabilities, contingent liabilities or securities lent
Assets, collateral received and owned debt securities issued other than covered bonds and ABSs encumbered
010 030
010 Carrying amount of selected financial liabilities 892,404 954,449
020 Derivatives 14,440 8,029
030 of which: over-the-counter 14,440 8,029
040 Deposits 877,964 946,420
050 Repurchase agreements 877,964 946,420
060 of which: central banks 0 0
070 Collateralised deposits other than repurchase agreements
0 0
080 of which: central banks 0 0
090 Debt securities issued 0 0
100 of which: covered bonds issued 0 0
110 of which: asset-backed securities issued 0 0
120 Other sources of encumbrance 58,128 353,258
130 Nominal of loan commitments received 0 0
140 Nominal of financial guarantees received 0 0
150 The fair value of securities borrowed with non-cash-collateral
0 0
160 Other 58,128 353,258
170 TOTAL SOURCES OF ENCUMBRANCE 950,532 1,307,707
Table 32 - Sources of encumbrance

59
9. Counterparty credit risk As per Art. 439, 444 and 452 CRR, banks are required to disclose the counterparty credit
risk regarding instruments referred to in Part Three, Title II, Chapter 6 CRR.
9.1 Governance In Clearstream Banking S.A., exposure to CCR arises from both over-the-counter (OTC) and
centrally cleared derivatives.
As previously mentioned, the general risk management structure, organisation and process,
and the risk strategy are described in 3. Risk management overview. As with credit risk,
business directives for counterparty credit risk are stated in the credit risk strategy, which is
set in accordance with the Risk Management Policy and reported annually to the
supervisory board. The credit risk strategy sets the operating limits for counterparty credit
exposure, which are regularly monitored as per the Credit Policy. Moreover, the Credit
Policy defines the risk controlling (incl. wrong-way risk) and risk mitigation techniques.
Clearstream Banking S.A. is not generally involved in the derivatives business. CBL has
modest derivatives positions to hedge interest rate or foreign exchange risk. There were
limited positions in place at the end of 2019.
9.2 Measurement and mitigation Following points 114, 115, 116 and 117 of the guidelines on disclosure requirements,
institutions are supposed to disclose information regarding the methods used to measure
the exposure value of instruments subject to capital requirements for CCR and a
comprehensive picture of the institution’s exposure to CCPs.
The following table discloses a comprehensive view of the methods used to calculate CCR
regulatory requirements and the main parameters used within each method.
Notional Replacement cost/current market value
Potential future credit
exposure
EEPE Multiplier EAD
post CRM RWAs
1 Mark to market
0 0 0 0
2 Original exposure
2,192,274 62,257 12,451
3 Standardised approach
0 0 0 0
4 IMM (for derivatives and SFTs)
0 0 0 0
5
Of which securities financing transactions
0 0 0 0
6
Of which derivatives and long settlement transactions
0 0 0 0
7
Of which from contractual cross-product netting
0 0 0 0

60
8
Financial collateral simple method (for SFTs)
0 0
9
Financial collateral comprehensive method (for SFTs)
0 0
10 VaR for SFTs 0 0
11 Total 12,451
Table 33 - Analysis of CCR exposure by approach
The next table provides a summary of the CVA regulatory calculations.
Exposure value RWAs
1 Total portfolios subject to the advanced method 0 0
2 (i) VaR component (including the 3× multiplier) 0
3 (ii) SVaR component (including the 3× multiplier) 0
4 All portfolios subject to the standardised method 67,794 871
EU4 Based on the original exposure method 0 0
5 Total subject to the CVA capital charge 67,794 871
Table 34 - CVA capital charge
As per point 117 of the EBA Guidelines on the disclosure requirements for this report, the
following table discloses a breakdown of CCR exposures by exposure class and by risk
weight (riskiness attributed):
Exposure classes Risk weight
Total 20%
1 Central governments or central banks 0 0
2 Regional government or local authorities 0 0
0 0
3 Public sector entities 0 0
4 Multilateral development banks 0 0
5 International organisations 0 0
6 Institutions 62,257 62,257
7 Corporates 0 0
8 Retail 0 0
9 Institutions and corporates with a short-term credit assessment
0 0
10 Other items 0 0
11 Total 62,257 62,257
Table 35 - Standardised approach - CCR exposures by regulatory portfolio and risk
As at 31 December 2019, CBL did not hold any exposure to central counterparties. Hence,
the table as per Part Three, Title II, Chapter 6, Section 9 CRR is not disclosed.

61
In addition to the overall information on counterparty credit risk, Art. 439 CRR also requires
disclosure of risk mitigation concerning CCR as laid out in points 120 and 121 of EBA
Guidelines on disclosure requirements under Part Eight of Regulation (EU) No. 575/2013.
The following table provides an overview of the impact of netting and collateral held on
exposures:
Gross positive fair value or
net carrying amount
Netting benefits
Netted current credit exposure
Collateral held Net credit exposure
1 Derivatives 62,257 0 62,257 0 62,257
4 Total 62,257 0 62,257 0 62,257
Table 36 - Impact of netting and collateral held on exposure values
Collateral received should then be disaggregated by types of instruments. But as no
collateral is held in derivatives, the table is not disclosed.
9.3 Derivatives CCR At Clearstream, derivative instruments are only used to a small extent, primarily for
hedging purposes. Such instruments can only be used in established and regularly tested
operational procedures. Hedging documentation is maintained to IAS 39 standards. The
dealings with interest rate or foreign exchange risks (measurement, assignment of internal
capital and limits, etc.) are described in detail in 12. Market risk.
In cases where a certain level of foreign exchange exposure, and therefore risk, is exceeded,
the risk of each currency exposure should be hedged. For Clearstream, the level of
materiality is expressed as 10% of consolidated EBITDA of the budget year to be hedged for
each currency exposure. For the protection of Clearstream’s budgeted interest income, the
Treasury section may hedge the budgeted interest income for up to 50% of the customer
credit balances for the upcoming budget period(s) through approved hedging instruments.
Foreign exchange outright contracts hedging the foreign exchange risk are settled via
Continuous Linked Settlement (CLS)8 to minimise settlement risk and executed with
counterparties only where a Credit Support Annex (CSA) is signed to mitigate credit risk
resulting from market movements.
The original exposure method under Art. 275 CRR is used by Clearstream to calculate the
exposure value for OTC derivative instruments and long settlement transactions. The
original exposure thus obtained is the exposure value.
FX swaps are considered as a funding or an investment vehicle for currencies where no or
limited deposit market exists (overnight swaps) or for the conversion of USD liquidity
(overnight and/or term FX swaps) into EUR used to purchase/repo against highly liquid
paper delivered to BCL serving as a liquidity buffer.
As at 31 December 2019, Clearstream Banking S.A. did not hold any credit derivatives on its
books. Hence, the report does not include a table containing information in conjunction
with Art. 439 (g) and (h) CRR concerning credit derivatives.
8 CLS (Continuous Linked Settlement): CLS is a global multi-currency settlement system that aims to eliminate foreign exchange (FX) settlement risk due to time-zone differences by settling both legs of an FX transaction simultaneously (payment vs. payment).

62
10. Liquidity risk According to point 55 of the EBA Guidelines on disclosure requirements under Part Eight of
Regulation (EU) No. 575/2013, for liquidity risk, institutions should refer to the EBA
Guidelines 2017/01 on LCR disclosure to complement the disclosure of liquidity risk
management.
10.1 Governance Liquidity risk management is incorporated into Clearstream’s governance set-up. Treasury
performs the day-to-day liquidity risk management for Clearstream Banking S.A. (CBL) and
Clearstream Banking AG (CBF) on a consolidated basis. Clearstream Risk Management and
Treasury Middle Office are regularly reporting on the liquidity risk of Clearstream and the
results of stress tests.
Clearstream Risk Management oversees the liquidity risk exposure from the second-line of
defence perspective and supports Treasury with assessment, monitoring and reporting
activities.
CBL’s Risk Committee monitors and oversees those activities and makes recommendations
to the Executive Board.
Clearstream’s liquidity risk appetite represents the level of liquidity risk that Clearstream
accepts in order to pursue its business objectives and in meeting its regulatory obligations.
The risk acceptance criteria are translated into a limit system, and liquidity stress test
scenarios are defined in accordance with the risk appetite.
Regarding the limit systems and in addition to regulatory ratios, Clearstream has defined
prudent internal liquidity limits to ensure conservative assumptions about a changing
liquidity situation. These limits prohibit the creation of mismatch positions if there is a
sudden or temporary decrease of available cash until this is permitted again by the liquidity
risk exposure. Liquid assets should amount to at least a minimum percentage (depending
on the currency or group of currencies) of the last 30-day average net customer cash
balances.
Treasury Middle Office is responsible for issuing daily and monthly reports to CBL Executive
Management and Clearstream Risk Management. Treasury Middle Office monitors daily
limit observances and routinely reports breaches to CBL Executive Management and
Clearstream Risk Management.
A variety of stress tests are used as the main control tool for liquidity risk. A liquidity stress
test is always described by identifying the liquidity needs in case of a certain event and
analysing whether enough liquidity sources are available to cover those needs within a
certain time frame. The design of a stress test scenario is such that the assumptions are
extreme, but plausible. The stress tests are calculated and reported regularly by Risk
Management. Where the liquidity stress tests result in breaches, Clearstream Risk
Management (CRM) will report to CBL’s Risk Committee and the Executive Board of
Clearstream Banking S.A. Jointly with CRM, Treasury will review and adjust its contingency
plan, and/or funding plan, and inform the Executive Board of CBL. CRM and Treasury will
evaluate and adjust the adequacy of its liquidity risk management framework and liquidity
providers per the results and analysis of the stress tests.

63
Following CSSF Circular 09/403, Clearstream has formulated its Clearstream Banking
Treasury Liquidity Management Policy, approved by the Executive Boards of Clearstream
Banking S.A. and Clearstream Banking AG. The liquidity parameters stated in the liquidity
policy are reviewed every quarter.
This policy contains specific requirements to implement a liquidity risk strategy that
includes contingency planning, governance and the definition of senior management
responsibilities. Required changes are proposed to CBL Executive Management within the
annual update for approval.
Day-to-day implementation of the liquidity management strategy is the responsibility of
the Head of Treasury, reporting to the member of the CBL Executive Board responsible for
Treasury.
10.2 Strategy For Clearstream, the target for liquidity management is the ability to respond to daily,
including intraday, changing customer net long/short cash balances. Customers maintain
cash balances with Clearstream and draw on credit facilities because of their securities
settlement activities.
Treasury’s investment strategy is driven by the cash amounts customers leave in their
settlement accounts with Clearstream Banking S.A. To limit liquidity risk that may arise
from Treasury investments, strict mismatch limits are established. Consequently, the
Treasury must invest funds with the objectives:
i. To have sufficient liquid resources such as highly liquid collateral or investments
readily available and convertible into cash to sustain liquidity risks under a wide
range of potential stress scenarios including intraday; and
ii. To have a maximum of liquidity available within one business day including
intraday via overnight secured/unsecured placements and overnight foreign
exchange swaps with creditworthy financial institutions, mostly executed after the
customer deadline towards the respective currency.
Due to the very short-term nature (mainly intraday) of Clearstream obligations arising from
its core settlement activities, there is no need for long term funding. Clearstream liquidity
requirements are intraday and overnight. However, to maintain a sufficient market
presence for potential contingency situations, Clearstream has a multi-currency EUR 1 bn
Euro Commercial Paper (ECP) programme in place under which it permanently issues,
mostly in USD and EUR currencies.
Mismatch limits are allocated to acquire highly liquid securities (collateral via reverse repo
trades or assets via direct investments) which can be utilised for liquidity generation in the
repo market or via ECB standing facilities in EUR currency and to ensure a permanent
liquidity buffer readily available and convertible into cash. These highly liquid assets
forming the liquidity buffer are placed in separate accounts under the direct management
of Treasury in its liquidity function with the sole intent of using them as a source of
contingent funds, including during stress periods, for overnight funding transactions.
10.3 Objectives For CBL the target for liquidity management is the ability to
64
• Manage CBL’s varying cash position because of customer and own activity with the
aim of having sufficient liquidity available in all currencies for a timely provision of
domestic and cross-border settlement and payment services as they fall due,
including liquidity management of cross-currency exposure where relevant;
• Keep intraday cash balances with nostro banks within the boundaries set by the
liquidity risk tolerance and established concentration limits; and
• Have in place measures to deal with unexpected disruptions to its cash flows.
This is ensured by a permanent measurement, monitoring and control of the expected and
actual cash flows.
Meet payment obligations
Customers maintain cash balances with CBL and may additionally draw on credit facilities
(unconfirmed funds facility (UCF) and intraday technical overdraft facilities (i-TOFs)) as a
result of their securities settlement activities. For EUR, USD, GBP, AUD and JPY, Treasury
analyses the historical net customer cash balance development to determine the minimum
balance that is available for investments with a tenor exceeding overnight (Treasury
mismatch limits). Customer requests to pay out customer long balances and payments
related to trades initiated by Treasury are addressed in the established liquidity stress
scenarios.
10.4 Measurement As defined in the Clearstream Bank Treasury Liquidity Management Policy, liquidity usage
and sources are shared between CBL and CBF, whilst prudent concentration limits ensure
that inter-company liquidity exposures are contained within approved limits.
To ensure that Clearstream has its liquidity risk (including intraday) under control, Treasury
permanently measures and monitors the expected and actual cash flows mainly stemming
from cash and securities settlement activities for each currency and agent.
To ensure that there is sufficient liquidity (including intraday) to honour its liquidity
management objective, Clearstream has ex ante liquidity risk mitigating measures9 in place.
Ex post, Clearstream verifies that all obligations have been met and all buffer and ratio
requirements comply as described in the policies.
Clearstream also performs the following types of stress tests, which are explained in detail
in 11.6 Stress tests:
• Daily liquidity stress tests;
• Classic liquidity stress tests (quarterly);
• Reverse liquidity stress tests.
Regulatory liquidity ratio
For Clearstream Banking S.A., regulatory ratios have been defined by national law.
Reporting duties are monthly. The minimum ratio for CBL is 100%.
9 Amongst others, permanent liquidity buffers, overdraft facilities with Clearstream’s cash correspondent banks, prioritisation of payment obligations, committed facilities, ECP programme, intraday procedures to anticipate potential intraday liquidity shortfalls, etc.

65
CBL needs to hold a liquidity buffer of high-quality liquid assets (HQLA) to cover the net
cash outflows in stressed conditions over thirty days. The HQLA at CBL consist of cash held
with central banks, own securities and securities received in reverse repo transactions. For
the last three months of 2019, CBL had an average LCR of 118.73%.
Total unweighted value (average) Q4
Total unweighted value (average) Q3
Total unweighted value (average) Q2
Total unweighted value (average) Q1
High quality liquid assets
Total HQLA
Cash outflows
Retail deposits and deposits from small business customers, of which: 0 0 0 0
Stable deposits 0 0 0 0
Less stable deposits 0 0 0 0
Unsecured wholesale funding, of which: 14,439,829 15,937,534 18,197,166 16,158,029
Operational deposits (all counterparties) and deposits in networks of cooperative banks 0 0 0 0
Non-operational deposits (all counterparties) 14,397,848 15,868,960 18,081,460 16,059,147
Unsecured debt 41,981 68,574 115,706 98,882
Secured wholesale funding 956,041
Additional requirements, of which: 120,847 121,372 121,275 124,648
Outflows related to derivative exposures and other collateral requirements 71,397 71,482 72,381 76,312
Outflows related to loss of funding on debt products 0 0 0 0
Credit and liquidity facilities 49,450 49,890 48,894 48,336
Other contractual funding obligations 132,790 123,164 122,507 87,917
Other contingent funding obligations 575,599 1,083,970 855,103 900,570
TOTAL CASH OUTFLOWS
Cash inflows
Secured lending (e.g. reverse repos) 62,123,349 54,310,733 46,272,591 44,636,096
Inflows from fully performing exposures 1,178,955 1,994,186 2,761,327 1,813,127
Other cash inflows 326,195 259,366 57,879 58,022
TOTAL CASH INFLOWS 63,628,499 56,564,285 49,091,797 46,507,245
Total HQLA
Total net cash outflows
Liquidity Coverage Ratio (%)
Table 37 A - Liquidity Coverage Ratio (LCR)

66
Total weighted value (average)Q4
Total weighted value (average)Q3
Total weighted value (average)Q2
Total weighted value (average)Q1
High quality liquid assets
Total HQLA 14,493,357 15,176,126 16,775,216 15,873,742
Cash outflows
Retail deposits and deposits from small business customers, of which: 0 0 0 0
Stable deposits 0 0 0 0
Less stable deposits 0 0 0 0
Unsecured wholesale funding, of which: 13,388,657 14,686,819 16,484,015 14,556,358
Operational deposits (all counterparties) and deposits in networks of cooperative banks 0 0 0 0
Non-operational deposits (all counterparties) 13,346,676 14,618,245 16,368,309 14,457,476
Unsecured debt 41,981 68,574 115,706 98,882
Secured wholesale funding 91,509 25,604 14,153 5,273
Additional requirements, of which: 76,342 76,471 77,270 81,146
Outflows related to derivative exposures and other collateral requirements 71,397 71,482 72,381 76,312
Outflows related to loss of funding on debt products 0 0 0 0
Credit and liquidity facilities 4,945 4,989 4,889 4,834
Other contractual funding obligations 107,894 93,995 96,009 60,495
Other contingent funding obligations 0 0 0 0
TOTAL CASH OUTFLOWS 13,664,402 14,882,889 16,671,447 14,703,273
Cash inflows
Secured lending (e.g. reverse repos) 182,686 208,978 183,720 85,923
Inflows from fully performing exposures 1,173,828 1,987,952 2,757,097 1,801,584
Other cash inflows 101,239 89,346 57,879 58,022
TOTAL CASH INFLOWS 1,457,753 2,286,276 2,998,696 1,945,529
Total adjusted value Total adjusted
value
Total HQLA 14,493,357 15,176,126 16,775,216 15,873,742
Total net cash outflows 12,206,649 12,596,613 13,672,751 12,757,743
Liquidity Coverage Ratio (%) 118.73% 120.48% 122.69% 124.42%
Table 38 B - Liquidity Coverage Ratio (LCR)
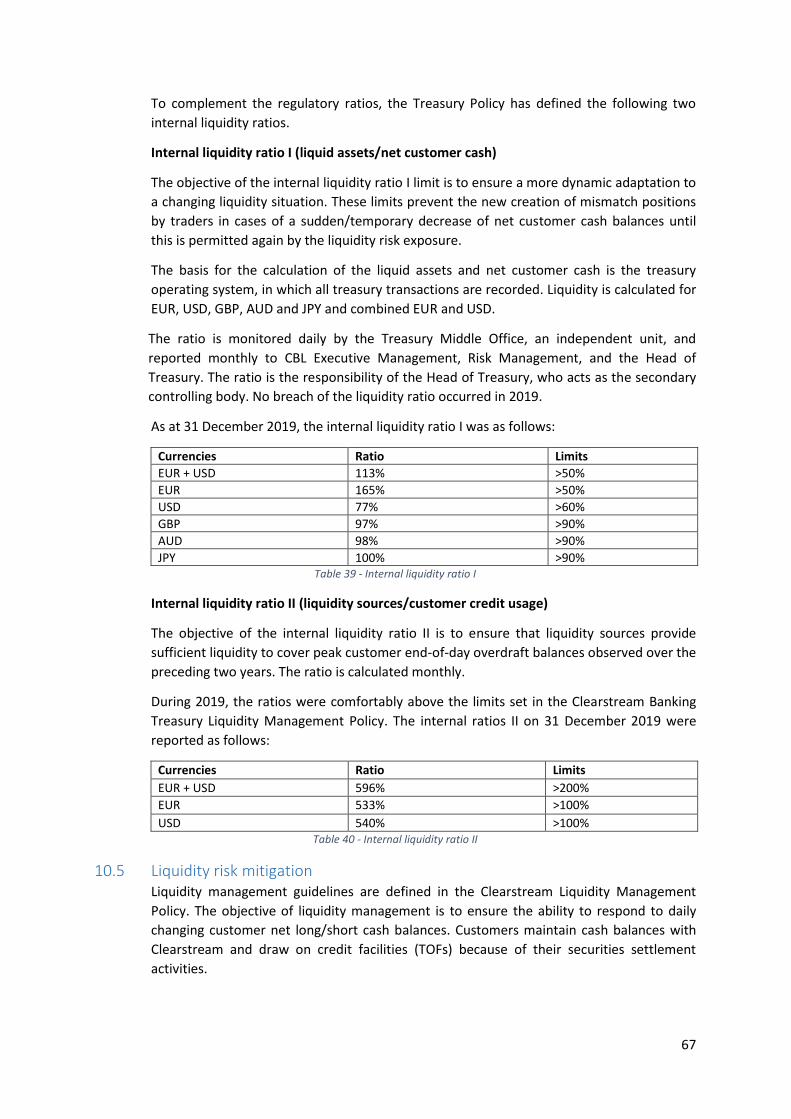
67
To complement the regulatory ratios, the Treasury Policy has defined the following two
internal liquidity ratios.
Internal liquidity ratio I (liquid assets/net customer cash)
The objective of the internal liquidity ratio I limit is to ensure a more dynamic adaptation to
a changing liquidity situation. These limits prevent the new creation of mismatch positions
by traders in cases of a sudden/temporary decrease of net customer cash balances until
this is permitted again by the liquidity risk exposure.
The basis for the calculation of the liquid assets and net customer cash is the treasury
operating system, in which all treasury transactions are recorded. Liquidity is calculated for
EUR, USD, GBP, AUD and JPY and combined EUR and USD.
The ratio is monitored daily by the Treasury Middle Office, an independent unit, and
reported monthly to CBL Executive Management, Risk Management, and the Head of
Treasury. The ratio is the responsibility of the Head of Treasury, who acts as the secondary
controlling body. No breach of the liquidity ratio occurred in 2019.
As at 31 December 2019, the internal liquidity ratio I was as follows:
Currencies Ratio Limits
EUR + USD 113% >50%
EUR 165% >50%
USD 77% >60%
GBP 97% >90%
AUD 98% >90%
JPY 100% >90% Table 39 - Internal liquidity ratio I
Internal liquidity ratio II (liquidity sources/customer credit usage)
The objective of the internal liquidity ratio II is to ensure that liquidity sources provide
sufficient liquidity to cover peak customer end-of-day overdraft balances observed over the
preceding two years. The ratio is calculated monthly.
During 2019, the ratios were comfortably above the limits set in the Clearstream Banking
Treasury Liquidity Management Policy. The internal ratios II on 31 December 2019 were
reported as follows:
Currencies Ratio Limits
EUR + USD 596% >200%
EUR 533% >100%
USD 540% >100% Table 40 - Internal liquidity ratio II
10.5 Liquidity risk mitigation Liquidity management guidelines are defined in the Clearstream Liquidity Management
Policy. The objective of liquidity management is to ensure the ability to respond to daily
changing customer net long/short cash balances. Customers maintain cash balances with
Clearstream and draw on credit facilities (TOFs) because of their securities settlement
activities.

68
To meet its objective, Clearstream Banking S.A. maintains several liquidity sources,
including
• Liquidity buffers in EUR, USD and GBP currencies. The estimated size of the
minimum required liquidity buffers in EUR, USD and GBP currencies is determined
by the stress test results. The EUR liquidity buffer is the sum of cash held at the
central bank, cash held with creditworthy financial institutions, and unencumbered
assets/collateral readily available and convertible into cash. The USD and GBP
liquidity buffers are composed of cash held with creditworthy financial institutions
and unencumbered assets/collateral readily available and convertible into cash.
Minimum required liquidity buffers, and additionally target buffers, have been determined.
Target buffers indicate the EUR equivalent liquidity amount which should constantly be
available in each of the relevant currencies.
During 2019, the liquidity buffer was comfortably above the limits and targets as set in the
Clearstream Banking Treasury Liquidity Management Policy.
As at 31 December 2019, the liquidity buffer was reported as follows:
Currency Actual buffer (in EUR '000,000)
Minimum required liquidity buffer (in EUR '000,000)
Target liquidity buffer (in EUR '000,000)
Liquidity recovery option indicator (amber)
Liquidity recovery option indicator (red)
EUR 6,537 1,700 4,000 4,000 1,700
USD 4,321 1,000 1,900 1,900 1,000
GBP 560 200 250 250 200 Table 41 - Liquidity buffer
To complement the permanent liquidity buffers, Clearstream has – amongst others – the
following arrangements and measures in place to mitigate liquidity risks:
• A network of cash correspondent banks and depositories to support the funding
requirements for CBL’s settlement operations in more than 40 currencies via
uncommitted, unsecured overdraft lines;
• A broad range of money market counterparties for both secured and unsecured
funding;
• A variety of committed liquidity facilities (can be drawn in multiple currencies);
• Multi-currency revolving credit facility (including a swing line for intraday credit
drawing right);
• A multi-currency Euro Commercial paper programme (can be drawn in EUR, USD
and GBP);
• By pledging eligible securities with their respective central banks, CBL and CBF are
granted credit lines and can participate in the regular tender operations conducted
by the BCL and in the ECB’s marginal lending facility in a contingency scenario;
• Procedures of prioritisation of payment obligations;
• Intraday procedures and tools to anticipate and forecast potential intraday liquidity
shortfalls;
• Escalation and contingency funding procedures.

69
To ensure that the overall risk exposure related to treasury investment activity remains
within acceptable concentration limits, Group Credit as per the Credit Policy allocates
credit limits for all approved investments for each counterparty and at the corresponding
counterparty Group level.
Also, to avoid excessive intraday cash concentration on its cash correspondent network
intraday, overnight cash concentration limits are set and constantly monitored. Intraday
overstepping of cash concentration limits results in alerts to Treasury, which is responsible
for day-to-day liquidity management, and requires immediate action to reduce the current
cash concentration.
Treasury ensures diversification of liquidity sources by arranging multiple types of
committed funding arrangements and ensuring a minimum number of liquidity providers
for each main currency. Treasury Back Office controls the concentration of liquidity
providers via daily reporting and reports breaches to the CBL Executive Board.
10.6 Stress tests Clearstream uses scenario analysis as part of its regular stress testing as per CSSF Circular
09/403, which requires that institutions conduct liquidity stress tests that enable them to
assess the potential impact of extreme but plausible stress scenarios on their liquidity
positions and their current contemplated risk mitigation.
Clearstream Risk Management handles the liquidity stress tests process. The stress test
framework includes clearly defined objectives, well-designed scenarios tailored to
Clearstream’s liquidity risk strategy, well-documented assumptions, informative
management reports, ongoing and effective reviews of the stress testing process, and
recommended actions based on stress test results. The general scope of these tests is to
determine whether Clearstream has sufficient liquidity to meet various types of future
liquidity demands under stressful conditions.
Clearstream Risk Management performs two daily liquidity stress tests, three quarterly
classical liquidity stress tests and three quarterly reverse stress tests considering
idiosyncratic, market disruption and combined scenarios.
Scenarios for the overnight liquidity
Clearstream has defined three classical scenarios to stress liquidity risk quarterly:
Scenario 1 – base scenario/quarterly
The base scenario considers the lowest net cash balances by currency in the most recent
five-year time horizon.
Scenario 1 result:
In this scenario, based on the lowest net cash balances in the past five years, Clearstream
can manage expected outflows in cash balances for all currencies.
Scenario 2 – market disruption scenario/quarterly
The market disruption scenario considers a disruption in the macroeconomic environment.
The assumption is that customer cash balances would drop by 10% (from their lowest

70
historical five-year level), money market funding lines would decline by 50%, and overdraft
lines at CCBs/depositories by 20%.
Scenario 2 result:
Despite the reduced availability of funding sources, Clearstream can fund short positions in
most currencies. Remaining short balances can be covered through FX swaps.
Scenario 3 – market disruptions and idiosyncratic scenario/quarterly
The market disruption/idiosyncratic scenario considers a disruption in the macroeconomic
environment and a downgrade of Clearstream’s credit rating. The assumption is that
customer cash balances would drop by 30% (from their lowest historical five-year level),
money market funding lines would no longer be accessible, and overdraft lines at
CCBs/depositories would decline by 60%.
Scenario 3 result:
In this scenario, USD currency short balances can be covered through uncommitted
CCBs/depositories overdraft lines. The excess funding capacity can be used to cover short
balances in other currencies through FX swaps. Exceptional overnight credit usage could
also be restricted to be in line with available liquidity and CCBs/depositories overdraft lines
since credit facilities in Clearstream are allocated on an unconditionally revocable basis and
primarily for intraday usage in support of customer settlement activities.
Scenario 4 – cover 2
The cover 2 scenario simulates the default of the two customers with the largest intraday
liquidity exposure, including their parent enterprises and subsidiaries, as well as a market
disruption and a downgrade of CBL’s external credit rating.
Scenario 4 result:
In this scenario, the results show that Clearstream could generate sufficient liquidity. In
most cases, Clearstream had a liquidity surplus or could generate sufficient liquidity using
FX swaps.
Scenario 5 – cover 1 + CSD-banking service provider
The cover 1 + CSD-banking provider scenario simulates the default of the customer with
the largest intraday liquidity exposure including its parent enterprises and subsidiaries, the
default of a major service provider of Clearstream, a market disruption and a downgrade of
CBL’s external rating.
Scenario 5 results:
In this scenario, test results show that Clearstream could generate sufficient liquidity. In
most cases, Clearstream had a liquidity surplus or could generate sufficient liquidity using
FX swaps.
Please note that liquidity stress tests are currently under review to comply with CSDR.

71
10.7 Medium-term liquidity sources Despite the very short-term nature of Clearstream’s liquidity risk because of its core
settlement activities, situations might arise where funding requirements exceed the usual
maximum of 48 hours.
The following instruments are available for funding:
• EUR 1 billion multi-currency Euro Commercial Paper Programme;
• BCL tender participation in EUR and USD;
• Repurchase agreements and committed repo funding lines (can be drawn in
multiple currencies);
• Foreign exchange swaps and committed foreign exchange swap facilities (can be
drawn in multiple currencies);
• Revolving credit facility (can be drawn in EUR and USD).
10.8 Permanently available liquidity Permanently available liquidity consists of the own funds of all Clearstream entities
managed by Clearstream Banking Treasury and the stable part of net customer cash in EUR
and USD currencies based on historical data, as follows:
• Based on historical data over the most recent two-year horizon (with a 99%
confidence level), the permanently available liquidity must be sufficient to cover all
term investments (fixed and variable coupon bonds, CBL reversed repos and
structured products) in EUR and USD.
• Based on historical data over the most recent five-year horizon (with a 99%
confidence level), the permanently available liquidity must be sufficient to cover all
long-term investments.
At year-end 2019, the own funds amounted to EUR 1.396 billion.
Figures for the stable part of the net customer cash in EUR and USD currency, based on
historical data, were as follows:
• Based on historical data over the most recent two-year horizon (with a 99%
confidence level), the stable part of the net customer cash (EUR and USD combined)
amounted to the EUR equivalent of 12.573 billion. Together with own funds, the
sum of permanently available liquidity is the EUR equivalent of 14.891 billion,
which is sufficient to cover the size of all term investments, which is the EUR
equivalent of 4.125 billion.
• Based on historical data over the most recent five-year horizon (with a 99%
confidence level), the stable part of the net customer cash (EUR and USD combined)
amounted to the EUR equivalent of 12.382 billion. Together with own funds, the
sum of permanently available liquidity is the EUR equivalent of 14.590 billion,
which is sufficient to cover the size of long-term investments, which is the EUR
equivalent of 1.229 billion.

72
10.9 Contingency funding plan Additional liquidity generation capabilities are available to face a contingency situation.
They are not included in the three stress scenarios, which only include liquidity instruments
used in the day-to-day liquidity management by Treasury. These additional contingency
funding capabilities and actions are listed below.
• Contingency liquidity generation capabilities:
➢ EUR 750 million revolving credit facility (including a EUR 400 million intraday
swing line);
➢ Sale of customer collateral (in the event of a customer’s default);
➢ Liquidation/buy-in of securities for Clearstream Treasury repo transactions;
➢ Sale and repo out of proprietary fixed coupon and/or FRN portfolio
➢ Intra-Group funding;
• Other actions:
➢ Cancellation of customer UCF/TOF lines;
➢ Flagging income and redemption proceeds “Upon Receipt of Funds” (URF);
➢ Timed payments/prioritised payments.
Clearstream Risk Management is responsible for the timely reporting of liquidity stress
tests results to CRO of Clearstream, Head of Treasury, Head of Group Credit, and the
respective boards and committees based on the outcome. If any breaches occur, Treasury,
Credit, Product, Risk and the responsible Risk Committee evaluate the result of the liquidity
stress tests and agree on subsequent mitigating actions, including adjustments to the
liquidity framework and updates of the contingency liquidity funding plan if needed.
10.10 Monitoring and reporting CBL’s liquidity risk exposure and breaches of limits are controlled and reported daily by
Treasury Middle Office. Treasury Middle Office reports any limit excesses occurring within
Treasury activity to CBL Executive Management.

73
11. Market risk Required information concerning market risk is laid out in paragraph 4.13 of the EBA
Guidelines on disclosure requirements under Part Eight of Regulation (EU) No. 575/2013,
specifying the requirements provided following Art. 445 and Art. 455 CRR.
11.1 Governance As per Clearstream Banking Treasury Investment Policy, Clearstream is not involved in
proprietary trading activities and does not maintain a trading book. Within Treasury,
market risks arise as currency risk in net positions in foreign currencies. It also arises as an
interest-rate risk in the banking book, particularly from money market activities (mostly
secured) and investments in securities as part of investment or short-term portfolios that
are purchased with the intention to “buy and hold”. The Clearstream Banking Treasury
Investment Policy defines the limits set for money market activities and securities purchase
transactions.
Clearstream’s general structure, organisation and process of risk management and its risk
strategy are described in 3. Risk management overview.
The Clearstream Banking Treasury Investment Policy sets the framework for hedging future
currency risk and interest income. It includes the approved hedging instruments and the
delegation of power for hedging interest income and foreign exchange risk. For Deutsche
Börse Group, the level of materiality of future currency risk is expressed as 10% of the
budget year’s consolidated EBITDA to be hedged for each foreign currency exposure. For
the protection of Clearstream’s budgeted interest income, the Treasury section may hedge
the budgeted interest income for up to 50% of the customer credit balances for the
upcoming budget period(s) through approved hedging instruments.
Regarding market risk, the risk strategy is translated into a limit system, which is monitored
regularly. The Treasury Investment Policy defines limits and responsibilities.
11.2 Measurement Besides the overall risk appetite calculated via VaR, interest rate risk is calculated on all
positions under Treasury management, applying a predefined parallel shift on the yield
curve. Interest rate risk on all positions under Treasury management is computed daily by
applying a 1% parallel shift for the money market portfolio and a 2% parallel shift for the
investment portfolio to the respective yield curve and assessing the effect on the net
present value (NPV) of this portfolio.
In cases where Clearstream’s budgeted interest income should be hedged, the
effectiveness of potential hedges is measured and the credit rating of the trade
counterparties is regularly controlled.
Foreign exchange risk is controlled using a limit system. Since Clearstream has payables and
receivables in foreign currencies, only the net exposure is relevant for the exposure
calculation. In cases where a certain level of foreign exchange exposure is exceeded in a
currency, the risk of this currency exposure should be hedged. For Clearstream, the level of
materiality is expressed as 10% of the budget year’s consolidated EBITDA to be hedged for
each currency exposure. The effectiveness of potential foreign exchange risk hedges is
measured and the credit rating of the trade counterparties is regularly controlled.

74
Since Clearstream Banking S.A. calculates its market risk exposure for regulatory purposes
according to the standardised approach, it is required to disclose its capital requirements
according to point 127 of the EBA Guidelines in conjunction with Art. 445 CRR. However, as
previously mentioned, CBL does not maintain a trading book. Hence, CBL’s only risk
exposure – which is addressed in this chapter – is the foreign exchange risk in the banking
book. Also, the FX risk net exposure subject to capital charge does not exceed the threshold
of 2% of own funds as per Art. 351 CRR. Thus, the required table would only be filled with
zeros and would not provide any additional value to the reader. Hence CBL decided not to
disclose it. Instead, CBL provides information on the open currency position as per Art. 351
and 352 CRR in the following table:
ALL POSITIONS NET POSITIONS Positions subject to capital
charge Total risk exposure amount
Own fund requiremen
ts LONG SHORT LONG SHORT LONG SHORT MATCHED
Reporting currency and currencies closely correlated
7,657,770 6,094,526 1,563,244 0 0 0 0 0 0
All other currencies (including CIUs)
10,907,339 10,931,318 675 24,654 0 24,654 0 1,972 1,972
Gold 0 0 0 0 0 0 0 0 0
Table 42 - Open currency positions
11.3 Market risk mitigation Market price risk can arise in connection with cash investments or borrowing because of
fluctuations in interest rates, foreign exchange rates and other prices, as well as through
corporate transactions. In the year under review, the expected foreign exchange exposure
resulting from CBL’s budgeted USD-based net interest income (NII) was hedged against a
change in foreign exchange rate.
If a foreign exchange hedge is undertaken, testing of the effectiveness of hedging
transactions is performed regularly in compliance with IAS 39.
11.4 Monitoring and reporting The Treasury Middle Office performs market risk control. Treasury Middle Office is
responsible for monitoring compliance with limits and issues monthly reports to the
relevant executive management and Group Risk Monitoring. Treasury Middle Office
monitors exposures against limits daily and immediately reports excesses to executive
management, Group Risk Monitoring and Treasury. This function is independent of the
Treasury Front Office, which controls liquidity and executes transactions (liquidity
management function).
11.5 Specific disclosures per market risk type
11.5.1 Foreign exchange risk Clearstream Banking S.A. transacts settlement and custody services business in more than
40 different currencies.
Customers maintain cash and securities accounts with CBL in those currencies in which
they transact their business. Amounts in currency transmitted to CBL by customers are
registered in the respective customers’ account(s) in that currency. The same is true for any
withdrawal of funds by customers (for example, for settlement purposes or custody
payments).

75
Debits and credits of all customers in the same currency are held by CBL at its cash
correspondent banks (CCBs). Clearstream Banking AG’s net customer positions are centrally
reflected in CBL’s overall position. Treasury analyses balances for each currency as a basis
for placings. Where there is a requirement to fund net currency credit facilities, such
takings are always made in the relevant currency. Therefore, concerning multi-currency
settlement, CBL bears no material currency risk.
A limited amount of local currency is held at CBL representative offices in each location to
cover expenses. Also, interest earned on currency placings above interest payable to
customers on currency balances will cause small (generally long) currency positions.
Additionally, Clearstream provides foreign exchange services to its customers. To remain
within the approved limits set in the Clearstream Banking Treasury Investment Policy,
foreign exchange risk resulting from the execution of customer foreign exchange requests
is covered daily in the foreign exchange market. Treasury Middle Office monitors residual
foreign exchange positions against approved limits on a daily basis and reports to senior
management in case of limit violations. In 2019, no limit violations were reported.
Foreign exchange risk measurement
Foreign exchange currency positions stemming from corporate activities and customer
foreign exchange transactions are covered via spot foreign exchange transactions. The
Clearstream Banking Treasury Investment Policy defines the maximum open foreign
exchange position allowed for all currencies. A report showing the foreign exchange
positions in all currencies is produced daily. The Treasury Middle Office unit (hierarchically
independent from Treasury) controls the reporting and reports any overstepping of the
limit to the Executive Board. No overstepping was reported in 2019.
Forward foreign exchange transactions may be undertaken in anticipation of expected
future exposures in foreign currencies to hedge the expected foreign exchange exposure
resulting from CBL’s budgeted USD based net interest income (NII). In 2019, an amount of
USD 120 million was hedged since a material part of the net interest was denominated in
USD.
11.5.2 Interest rate risk in the banking book Customer liquidity of Clearstream Banking S.A. is placed and refinanced primarily through
overnight secured reverse repos and placings with Banque Centrale du Luxembourg in EUR
currency and overnight foreign exchange swaps. In addition, CBL primarily purchases highly
liquid and low-risk-weighted investments for capital ratio purposes. The investment
portfolio of CBL aims at providing core capital investment. Consequently, these portfolios
are constructed to contain both market and credit risks and consist mainly of zero-risk-
weighted debt securities.
Derivative instruments are not offered to customers. The use of derivative instruments is
restricted to:
• Forward foreign exchange contracts that hedge or eliminate structural foreign
exchange exposures.
• FX swap contracts to avoid large unsecured exposures with commercial banks
and/or to convert available funds in one currency into another currency where
funds are required to support the securities settlement efficiency.

76
Clearstream monitors currency and interest rate exposures daily using reporting generated
by the general ledger accounting system and its customer cash ledgers or the treasury
ledger.
Clearstream’s assets and liabilities are managed to contain interest rate risk (IRR) within
limits established by the Clearstream Banking Treasury Investment Policy. Liabilities usually
determine the structure of its assets. The close matching of investments and customer
deposits ensures that Clearstream can control its IRR.
The Clearstream Banking Treasury Investment Policy defines the maturity mismatch limits,
the IRR sensitivity limits, and the maximum tenor for each currency or group of currencies.
Limits are based on the IRR and the concepts of duration and gap. Duration means the
remaining maturity of every deal on the asset and liability side. Gap means the IRR on the
asset side minus the IRR on the liability side. The IRR is calculated daily based on the net
present value (NPV) of a 1% interest rate change for trades/instruments with a remaining
life to maturity of less than one year and otherwise a 2% interest rate change.
31 December 2019 31 December 2018
Mismatch/portfolio limit
Interest Rate Risk (IRR)
Mismatch/portfolio limit
Interest Rate Risk (IRR)
Exposure Limit Exposure Limit Exposure Limit Exposure Limit
CBL investment portfolio (fixed and FRN)
1,228,613 2,500,000 26,977 72,000 1,526,807 2,500,000 26,639 92,000
CBL MM portfolio 3,898,606 7,300,000 11,936 24,000 3,036,605 7,300,000 4,319 26,000
Table 43 - Limits for CBL in line with Treasury Policy
Based on CSSF requirements10, Clearstream also calculates the IRRBB as a percentage of
own funds. The IRR is measured as a 2% parallel shift of the yield curve. The non-trading
book includes the investment portfolio and related fair value hedges, cash flow hedges and
the short- term portfolio.
10 http://www.cssf.lu/en/supervision/banks/regulation/circulars/info/article/1719/

77
Table 44 - Interest rate risk in the banking book – Clearstream Banking S.A.
Interest Rate Risk - Banking Book (IRRBB) as per circular CSSF 16/642 as of 31 Dec 2019
Clearstream Banking S.A., Luxembourg
Currency Scenario result
Scenario as
percentage of own
funds
Base EVE (in EUR equivalent) EUR 1,465,058,681 -
(a) Standard shock: +200bps shift up EUR -18,822,193 -1.35%
(b) Standard shock: -200bps shift down EUR 20,164,725 1.44%
(c) Scenario 1: Parallel shift up EUR -19,167,387 -1.37%
(d) Scenario 2: Parallel shift down EUR 20,164,725 1.44%
(e) Scenario 3: Steepened curve EUR 13,273,173 0.95%
(f) Scenario 4: Flattened curve EUR -15,382,492 -1.10%
(g) Scenario 5: Short rate up EUR -21,576,575 -1.55%
(h) Scenario 6: Short rate down EUR 12,546,526 0.90%
Eligible own funds
(source: Finance - December 2019)EUR 1,396,197,076
(a) IRRBB standard shock (+200bps) as percentage of own funds -1.35%
(b) IRRBB standard shock (-200bps) as percentage of own funds 1.44%
Early warning trigger 15%
Threshold set by CSSF 20%
Weighted Average Maturity in days
Assets 36
Liabilities 20

78
12. Remuneration The Remuneration Policy (“Policy”) is a central element for the implementation of the
remuneration systems within the organisation. It is composed in particular according to
Regulation (EU) No. 575/2013 (“CRR”), Directive 2013/36/EU (“CRD IV”), the EBA
Guidelines 2015/22 on sound remuneration policies, Law of 5 April 1993 on the financial
section (as amended) (“Luxembourg Law”), and related CSSF circulars. The Policy is
regularly reviewed to ensure compliance with the latest regulations; the last review took
place in February 2019.
As the CRR disclosure requirements are fulfilled in the Remuneration Policy and annual
Group Remuneration Report, this report only provides a summary of the key points and
features of the Policy. For more detailed information, interested persons can refer to the
Clearstream Remuneration Policy11 or the Clearstream Group Remuneration Report12.
12.1 Governance The Executive Board of Clearstream Holding AG as a superordinate company according to
the German Banking Act (KWG) is responsible for the implementation of a Clearstream
Group-wide policy. The Clearstream Group remuneration system including remuneration
schemes and the respective Terms & Conditions of instruments, which apply to the
respective categories of staff, is implemented according to a cascading process from
Clearstream Holding AG at Group level down to entity level of inter alia Clearstream
Banking S.A., especially taking into account the regulatory requirements of Luxembourg.
Within Clearstream Banking S.A., the supervisory board decides on the remuneration
system for the members of the Executive Board. The Executive Board decides on the
remuneration system of all employee groups except for members of the supervisory board
and members of the Executive Board.
The remuneration system has been elaborated in cooperation with the Clearstream
Group’s relevant control units (i.e. Risk Management, Compliance, Internal Audit, Human
Resources and the Group Compensation Officer, in the following “Compensation Officer”
and Deputy Group Compensation Officer, in the following “Deputy Compensation Officer”),
taking into account Luxembourg specificities. Within the Group, the competent functions of
the consolidating institution and subsidiaries, including CBL, are supposed to interact and
exchange information as appropriate.
Clearstream Banking S.A. has set up a Remuneration Committee on a solo entity basis. It is
set up by the Supervisory Board of Clearstream Banking S.A. This Remuneration Committee
(“CBLRC”) is responsible for advising the supervisory board on the Policy. The CBLRC deals
with remuneration-related matters within Clearstream Banking S.A. and directly oversees
the remuneration of the officers in charge of the internal control units in accordance with
the regulatory requirements. Further details regarding to the CBLRC, in particular its
composition and tasks/responsibilities, are stipulated in the Clearstream Banking S.A.
Supervisory Board Internal Rules & Regulations.
11https://www.clearstream.com/resource/blob/1318802/cd5840704d2d00b540db7c7f80817085/clearstream-group-remuneration-policy-ch-cbf-data.pdf 12 https://www.clearstream.com/clearstream-en/about-clearstream/regulation-1-/remuneration-information/from-2014-onwards/from-2014-onwards-1278076

79
12.2 Remuneration systems Members of the Executive Board, risk takers and other employees (including staff
employed in risk management, compliance and internal control, internal audit and
technology functions) shall receive fixed and variable remuneration. The fixed
remuneration shall be a substantial proportion of the total annual remuneration. The
variable remuneration is aligned with the rules of the Remuneration Policy and is not
guaranteed.
Fixed remuneration consists of basic fixed remuneration and other fixed remuneration as
classified by regulatory requirements (such as payments mandatory for employees in the
collective agreement).
Variable remuneration is remuneration such as discretionary performance bonus or
payments in instruments (as long-term sustainable instruments, stock bonus plan) and
should reflect:
• Sustainable and risk adjusted performance, as well as
• Performance in excess of that required to fulfil the employee’s job description as
part of the terms of employment.
The remuneration shall be designed such that incentives for incurring disproportionally
high-risk positions are avoided. There should not be a significant dependency on variable
remuneration.
12.2.1 Appropriateness of remuneration The remuneration shall be designed appropriately. This means that:
1) The remuneration shall not incentivise the assumption of disproportionally high
risks;
2) The remuneration shall be commensurate with the respective tasks and the
performance as well as the situation of the Group and the respective entity and
shall not exceed the usual remuneration without cause;
3) Guidelines for variable remuneration shall take due account of possible
mismatches of performance and risk periods. Payments of variable remuneration
shall be deferred as appropriate. Variable remuneration is not guaranteed, i.e. all
variable remuneration is based on a performance measurement and can be zero;
4) There shall be an appropriate ratio between the fixed and the variable
remuneration. The variable remuneration may amount up to a maximum of 100%
of the fixed remuneration. In case national regulatory requirements allow the
shareholders, owners or members of the institution to approve a ratio of 1:2
between the Fixed and Variable Remuneration components;
the Variable Remuneration may amount up to a maximum of 200% of the Fixed
Remuneration.
5) Guaranteed variable remuneration is exceptional and is only allowed in connection
with the hiring of new staff, is limited to a maximum period of one year and subject
to appropriate equity and liquid resources as well as sufficient capital in order to
ensure the Company’s Risk-Bearing Capacity;
6) As a rule, the Company shall not provide discretionary pension benefits. The terms
of the Group’s pension scheme include pension benefits that are not based on
performance and that are consistently granted to a category of staff;

80
7) In general, severance payments are variable remuneration. Payments in connection
with premature termination shall take due account of the performance over time
and shall not reward falling short of performance expectations or misconduct
following art. 38-6(h) Luxembourg Law;
8) Payments made as compensation for forfeited remuneration in previous service
and/or employment relationships shall be in line with the long-term interests of the
Group and its respective companies and take into account individual performance
and the deferral requirements stipulated in the respective remuneration scheme as
applicable from time to time in case the beneficiary is identified as a risk taker or is
a member of the Executive Board;
9) The remuneration of risk takers and other employees in control units shall be
designed with respect to their function;
10) In the case of overlapping regulatory requirements on remuneration on the
national implementation level, the stricter requirements shall be applied;
Avoidance of conflicts of interest
Conflicts of interest with relevance for remuneration can arise in situations in which the
interests of one party interfere with (or appear to interfere with) the interests of another
party, impairing its ability to act fairly and ethically. The Company is subject to a framework
aimed at preventing and dealing with conflicts of interest. All employees have to respect
the related “Policy on Conflicts of Interest” at all times.
In order to avoid or to mitigate potential or actual conflicts of interest, the Company shall
ensure the implementation of the following mitigating measures (non-exhaustive):
• A sufficient level of transparency (e.g. information on relevant parameters of the
remuneration systems in the respective service contracts, terms and conditions of
instruments, bonus letters),
• A sufficient level of objectivity, e.g.
o review of target achievements in performance panels,
o the use of qualitative and quantitative targets,
• Technical support of remuneration related processes, e.g.
o usage of control steps via merit tools, e.g. budget approval and reading
rights of bonus proposals of line managers above,
o implementation of check-boxes for regulatory requirements on target
setting in the appraisal system,
o calculation of bonus amounts and check of compliance with remuneration
rules (e.g. bonus cap or maximum amounts) via merit tool,
• Involvement of neutral third person/party, e.g.
o Compensation Officer involvement in the determination of the final bonus
amounts,
o Remuneration Advisory Board involvement regarding the design and
implementation of the remuneration systems,
o Remuneration Committee involvement (where relevant) with regard to the
assessment of the appropriateness of the remuneration systems,
derivation of the total amount of variable remuneration, monitoring the
remuneration of the officer in charge of control units, especially Risk
Management and Compliance as well as risk takers,

81
o Four-eyes principle during the operation of the bonus process.
12.2.2 Total amount of variable remuneration The variable remuneration must not limit the Group’s or CBL’s ability to sustainably
maintain or recover an appropriate capital base. If the Group’s or CBL’s ability to
sustainably maintain or recover an appropriate suitable capital base is limited, no variable
remuneration is to be granted.
The total amount of the variable remuneration shall be determined in a formal, transparent
and comprehensible process. Representatives of the relevant control units (for the
determination of the bonus pool, performance criteria and remuneration awards) shall be
involved within their scope of duties.
The total amount of the variable remuneration is based on a combination of the
assessment of the performance of the overall result of the Group as well as individual
targets including the area of responsibility. Details are stipulated in the respective
remuneration scheme and the documentation of the determination of the total amount of
variable remuneration.
12.2.3 Individual performance In case individual performance is determined, this shall be based on the achievement of a
mix of quantitative/financial and qualitative/non-financial agreed targets, which shall be
challenging and ambitious. Targets shall be consistent with the business and risk strategies,
corporate values, risk appetite, long-term interests, as well as the cost of capital and the
liquidity of the Group/Company.
The full amount of variable remuneration is subject to an ex ante risk adjustment in case of
negative performance contributions, breach of duty and unconscionable conduct; it can be
reduced to zero before the bonus award is made. The reduction shall not be compensated
by positive performance contributions.
The performance of members of the Executive Board, risk takers and other employees is
measured annually and documented and tracked in the respective appraisal systems. The
performance assessment is executed by the respective line manager or, for members of the
Executive Board, by the supervisory board.
The individual performance measurement is ensured through the respective appraisal
systems.
12.3 Rules on remuneration systems for members of the Executive Board, risk
takers and employees in charge of a control unit
12.3.1 Risk analysis Clearstream Banking S.A. shall conduct an annual risk analysis to identify categories of staff
whose professional activities have a material impact on the institution’s risk profile (“risk
takers”) and to whom specific requirements apply according to the respective regulatory
specifications, unless exemptions apply.
Staff members are deemed to be identified as risk takers particularly if one of the criteria
below is met. The qualitative and appropriate quantitative criteria on the identification of
risk takers are set out in Regulation (EU) No. 604/2014 and Commission Delegated
Regulation (EU) 2016/861 of 18 February 2016, e.g.:

82
• Member of the Executive Board or supervisory board,
• Member of the senior management,
• Staff responsible and accountable to the management body for control activities of
the independent risk management function, compliance function or internal audit
function,
• Staff heading or having managerial responsibility for a material business unit,
• Staff leading a (control) function responsible for legal affairs, finance including
taxation and budgeting, human resources, remuneration policy, information
technology or economic analysis,
• Staff identified via quantitative criteria, e.g. staff with remuneration exceeding
criteria set out by regulation and deemed to have a material impact on the
institution’s risk profile.
12.3.2 Criteria in determining variable remuneration The variable remuneration shall consider the overall performance of the Clearstream
Group and, respectively, the institution, the performance of the areas of responsibility and
individual performance contributions, with each measurement level generally equally
weighted. The allocation of the variable remuneration components within the Company
shall also consider all types of current and future risks. When assessing individual
performance, financial and non-financial criteria are considered. Further, the assessment of
the performance is set in a multi-year framework. The criteria for determining the variable
remuneration shall be consistent with the objective of long-term sustainable performance.
Details are stipulated in the remuneration scheme.
12.3.3 Deferral of variable remuneration The pay-out schedules shall be sensitive to the time horizon of risks. In particular in case
variable remuneration is paid, due account shall be taken of possible mismatches of
performance and risk periods, and it shall be ensured that payments are deferred as
appropriate. At least 40% or, respectively, 60% (depending on the category of risk taker or
in case of a variable remuneration of a high amount) of the variable remuneration
component shall be deferred over a period that is no less than three to five years.
Remuneration payable shall vest no faster than on a pro rata basis. Further, a substantial
portion – at least 50% – of any variable remuneration shall be in shares or equivalent
share-linked instruments. Instruments shall be applied to both the deferred and non-
deferred (upfront) portion of variable remuneration. Before vesting, there is only an
entitlement to an accurate determination of the respective part of the variable
remuneration. Details, in particular the pay-out schedule, are stipulated in the
remuneration scheme and the terms and conditions of instruments, in each case as
applicable from time to time. Exemption limits in line with regulatory requirements of the
Company and the Group may apply. As there could be cases where the activity of one staff
member, given the individual’s job function or individual risk assessment, may have a
higher material impact on the institution’s risk profile, even though the remuneration is not
material, the exemption limit shall not be applied automatically and generally. This
neutralisation on the level of the individual relates to the pay-out of parts of variable
remuneration in instruments, the deferral of parts of the variable remuneration and the ex-
post incorporation of risk (malus and clawback); it also takes into consideration the
individual’s job function.

83
12.3.4 Link to the Group’s long-term performance At least 50% of the deferred and non-deferred parts of the variable remuneration shall be
linked to the Group’s long-term performance. For this purpose, the corresponding parts of
the variable remuneration shall be granted in the form of Deutsche Börse AG share-based
remuneration (instruments). Exemption limits in accordance with regulatory requirements
of the Company and the Group may apply.

84
Appendix A – Abbreviations used in this document ABS Asset-Backed Security
AG Aktiengesellschaft (German: stock company)
A-IRB Advanced Internal Rating Based Approach
AMA Advanced Measurement Approach
ASL Automated Securities Lending Programme
AV Availability
BaFin Bundesanstalt für Finanzdienstleistungsaufsicht (Federal Financial
Supervisory Authority)
BCBS Basel Committee on Banking Supervision
BCL Banque centrale du Luxembourg
BCM Business Continuity Management
BIA Basis Indicator Approach
BRRD Banking Recovery and Resolution Directive
CAM Control Assurance & Monitoring
CBJ Clearstream banking Japan Ltd.
CBL Clearstream Banking S.A.
CBLRC Clearstream Banking S.A. Remuneration Committee
CCB Cash Correspondent Bank
CCF Credit Conversion Factor
CCP Central Counterparty
CCR Counterparty Credit Risk
CDO Collateralised Debt Obligation
CEM Current Exposure Method
CEO Chief Executive Officer
CET 1 Common Equity Tier 1
CGSS Clearstream Global Securities Services Ltd.
CH Clearstream Holding AG
CLN Credit-Linked Note
CLO Credit-linked Obligation
CLS Continuous Linked Settlement
CMBS Commercial Mortgage-Backed Security
COP Clearstream Operations Prague s.r.o.
CRD IV Capital Requirements Directive IV
CRD V Capital Requirements Directive V
CRD VI Capital Requirements Directive VI
CRM Clearstream Risk Management
CRO Chief Risk Officer
CRR Capital Requirements Regulation
CRR II Capital Requirements Regulation II
CRR III Capital Requirements Regulation III
CS Clearstream Services S.A.
CSA Credit Support Annex
CSD Central Securities Depository
CSDR Central Securities Depository Regulation
CSSF Commission de Surveillance du Secteur Financier
CVA Credit Valuation Adjustment
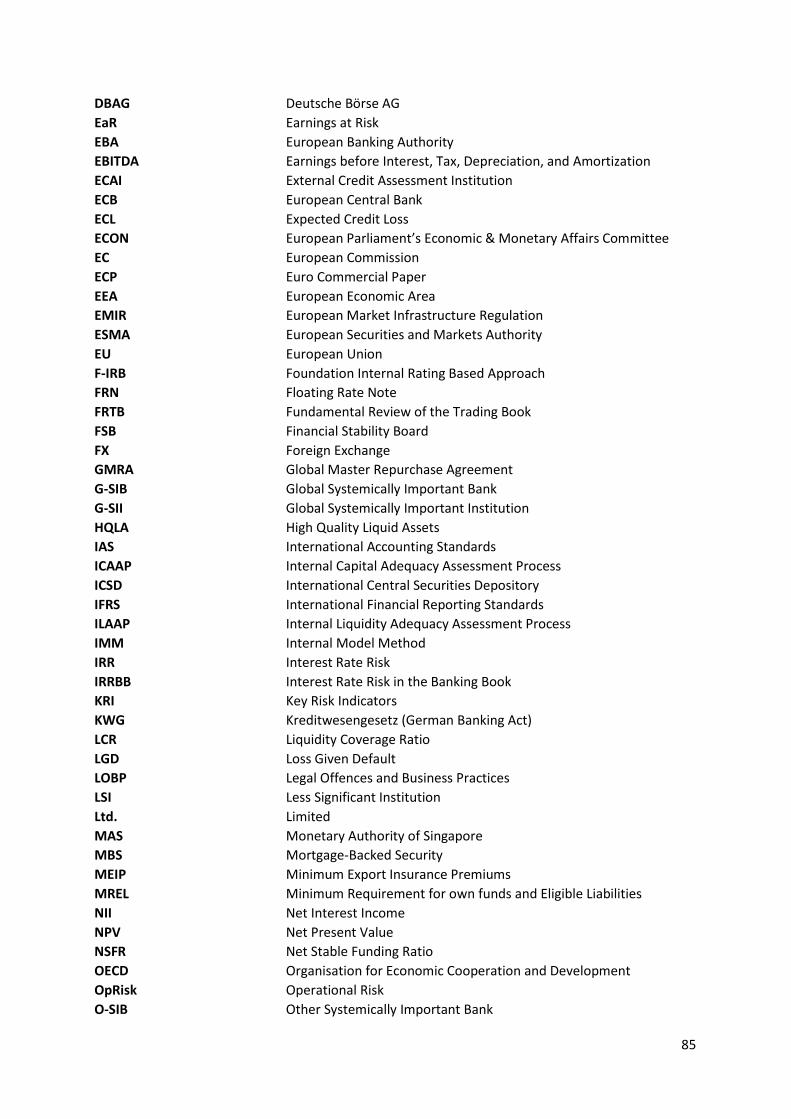
85
DBAG Deutsche Börse AG
EaR Earnings at Risk
EBA European Banking Authority
EBITDA Earnings before Interest, Tax, Depreciation, and Amortization
ECAI External Credit Assessment Institution
ECB European Central Bank
ECL Expected Credit Loss
ECON European Parliament’s Economic & Monetary Affairs Committee
EC European Commission
ECP Euro Commercial Paper
EEA European Economic Area
EMIR European Market Infrastructure Regulation
ESMA European Securities and Markets Authority
EU European Union
F-IRB Foundation Internal Rating Based Approach
FRN Floating Rate Note
FRTB Fundamental Review of the Trading Book
FSB Financial Stability Board
FX Foreign Exchange
GMRA Global Master Repurchase Agreement
G-SIB Global Systemically Important Bank
G-SII Global Systemically Important Institution
HQLA High Quality Liquid Assets
IAS International Accounting Standards
ICAAP Internal Capital Adequacy Assessment Process
ICSD International Central Securities Depository
IFRS International Financial Reporting Standards
ILAAP Internal Liquidity Adequacy Assessment Process
IMM Internal Model Method
IRR Interest Rate Risk
IRRBB Interest Rate Risk in the Banking Book
KRI Key Risk Indicators
KWG Kreditwesengesetz (German Banking Act)
LCR Liquidity Coverage Ratio
LGD Loss Given Default
LOBP Legal Offences and Business Practices
LSI Less Significant Institution
Ltd. Limited
MAS Monetary Authority of Singapore
MBS Mortgage-Backed Security
MEIP Minimum Export Insurance Premiums
MREL Minimum Requirement for own funds and Eligible Liabilities
NII Net Interest Income
NPV Net Present Value
NSFR Net Stable Funding Ratio
OECD Organisation for Economic Cooperation and Development
OpRisk Operational Risk
O-SIB Other Systemically Important Bank

86
O-SII Other Systemically Important Institution
OTC Over-the-Counter
P2G Pillar II Capital Guidance
PA Damage to Physical Assets
PD Probability of Default
PROFIL Fédération des Professionels du Secteur Financier
RBC Risk-Bearing Capacity
REC Required Economic Capital
RI Risk Indicator
RMBS Residential Mortgage-Backed Securities
RTS Regulatory Technical Standards
RWA Risk-Weighted Assets
S&P Standard & Poor’s
S.A. Société Anonyme
SA Standardised Approach
SD Service Deficiency
SFT Securities Financing Transactions
SI Significant Institution
SREP Supervisory Review and Evaluation Process
SRM-R Single Resolution Mechanism-Regulation
SRP Supervisory Review Process
SSM Single Supervisory Mechanism
SSS Securities Settlement System
STP Straight-Through Processing
TLAC Total Loss Absorbing Capacity
TOF Technical Overdraft Facility
UCF Unconfirmed Funds Facility
URF Upon Receipt of Funds
VaR Value at Risk

87
Contact Published by
www.clearstream.com Clearstream Banking S.A
Address
Clearstream Banking S.A.
42 Avenue J.F. Kennedy,
L-1855 Luxembourg
April 2020
Document number:7244