Pillar III Disclosure Report 31.12 - Credit Europe Bank · 2 Group Structure ... Pillar III...
33
1 Risk Management and Capital Adequacy Pillar III Report 31 December 2 0 14
Transcript of Pillar III Disclosure Report 31.12 - Credit Europe Bank · 2 Group Structure ... Pillar III...
1
Risk Management and Capital Adequacy Pillar III Report
31 December 20 14

2
3
Table of Contents
Introduction ........................................................................................................................ 5
Basel III implementation .................................................................................................. 5
1 Basel III Framework ........................................................................................................ 6
1.1. Pillar I ..................................................................................................... 6
1.2. Pillar II .................................................................................................... 6
1.3. Pillar III ................................................................................................... 6
2 Group Structure .............................................................................................................. 8
3. Capital and Risk Management ................................................................................... 9
3.1. Roles and Responsibilities ........................................................................ 9
3.2 Risk Appetite and Risk Governance ......................................................... 10
3.3. Capital Management............................................................................. 11
3.4. Risk Types ............................................................................................ 12
4. Regulatory Capital Requirements and Capital Adequacy Profile ..................... 13
4.1 Capital Structure .................................................................................... 13
4.2 Capital Adequacy .................................................................................. 15
5. Credit Risk ..................................................................................................................... 18
6. Credit Quality .............................................................................................................. 23
7. Credit Risk Mitigation ................................................................................................ 24
8. Counterparty Credit Risk ........................................................................................... 26
9. Operational Risk ......................................................................................................... 28
10. Market Risk ................................................................................................................. 28
11. Interest Rate Risk ....................................................................................................... 29
12. Liquidity Risk .............................................................................................................. 30
4
Index of Tables
Table 1 Prudential consolidation scope ................................................................. 9
Table 2 Capital Structure ................................................................................... 14
Table 3 Capital requirements and risk weighted assets ........................................ 16
Table 4 Minimum capital requirements (local regulation) .................................... 17
Table 5 Breakdown of total exposure per exposure class ...................................... 18
Table 6 Total exposure broken down by asset type .............................................. 19
Table 7 Geographical distribution of total exposure ............................................ 20
Table 8 Breakdown of credit risk by residual maturity .......................................... 21
Table 9 Breakdown of credit risk exposure by risk weight ..................................... 23
Table 10 Breakdown of total exposure by type of collateral.................................. 25
Table 11 Credit quality of unfunded credit protection .......................................... 26
Table 12 Mitigation of the counterparty credit risk .............................................. 27
5
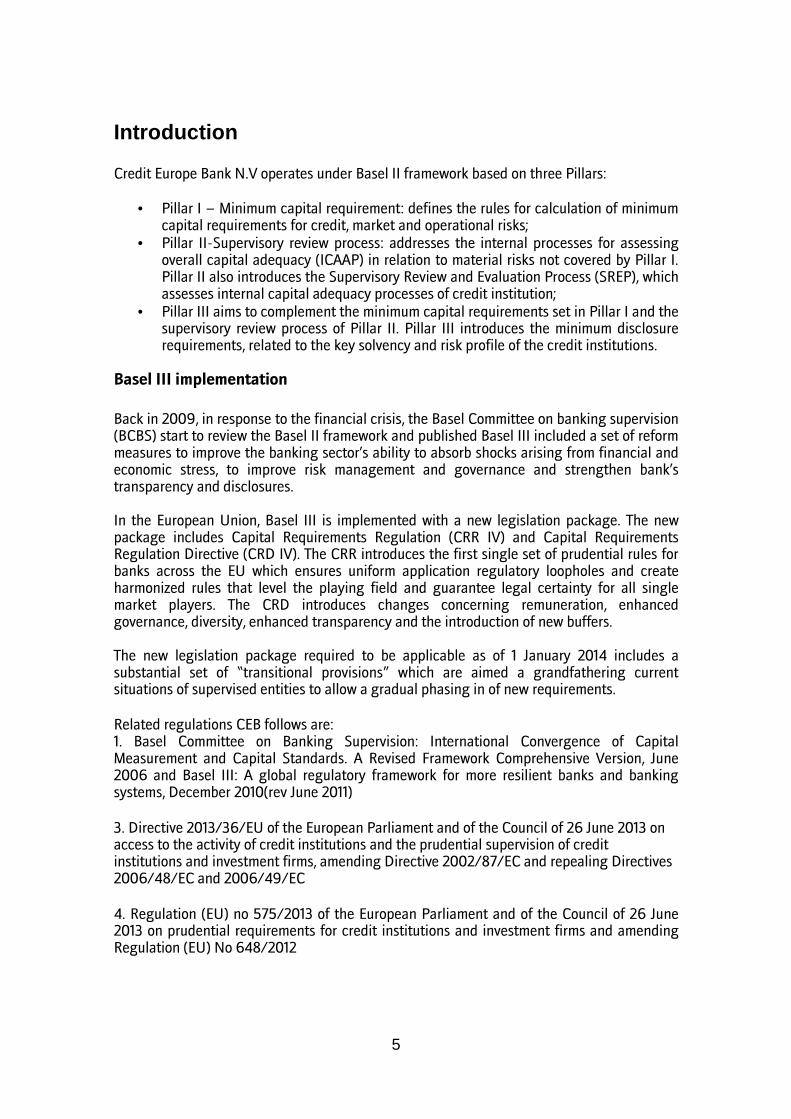
Introduction Credit Europe Bank N.V operates under Basel II framework based on three Pillars:
• Pillar I – Minimum capital requirement: defines the rules for calculation of minimum capital requirements for credit, market and operational risks;
• Pillar II-Supervisory review process: addresses the internal processes for assessing overall capital adequacy (ICAAP) in relation to material risks not covered by Pillar I. Pillar II also introduces the Supervisory Review and Evaluation Process (SREP), which assesses internal capital adequacy processes of credit institution;
• Pillar III aims to complement the minimum capital requirements set in Pillar I and the supervisory review process of Pillar II. Pillar III introduces the minimum disclosure requirements, related to the key solvency and risk profile of the credit institutions.
Basel III implementation
Back in 2009, in response to the financial crisis, the Basel Committee on banking supervision (BCBS) start to review the Basel II framework and published Basel III included a set of reform measures to improve the banking sector’s ability to absorb shocks arising from financial and economic stress, to improve risk management and governance and strengthen bank’s transparency and disclosures. In the European Union, Basel III is implemented with a new legislation package. The new package includes Capital Requirements Regulation (CRR IV) and Capital Requirements Regulation Directive (CRD IV). The CRR introduces the first single set of prudential rules for banks across the EU which ensures uniform application regulatory loopholes and create harmonized rules that level the playing field and guarantee legal certainty for all single market players. The CRD introduces changes concerning remuneration, enhanced governance, diversity, enhanced transparency and the introduction of new buffers. The new legislation package required to be applicable as of 1 January 2014 includes a substantial set of “transitional provisions” which are aimed a grandfathering current situations of supervised entities to allow a gradual phasing in of new requirements. Related regulations CEB follows are: 1. Basel Committee on Banking Supervision: International Convergence of Capital Measurement and Capital Standards. A Revised Framework Comprehensive Version, June 2006 and Basel III: A global regulatory framework for more resilient banks and banking systems, December 2010(rev June 2011)
3. Directive 2013/36/EU of the European Parliament and of the Council of 26 June 2013 on access to the activity of credit institutions and the prudential supervision of credit institutions and investment firms, amending Directive 2002/87/EC and repealing Directives 2006/48/EC and 2006/49/EC
4. Regulation (EU) no 575/2013 of the European Parliament and of the Council of 26 June 2013 on prudential requirements for credit institutions and investment firms and amending Regulation (EU) No 648/2012
6
1 Basel III Framework
1.1. Pillar I
CEB is regulated by DNB, which consequently acts as the home regulator for Basel III compliance. Banks are expected to meet the capital-requirements constraints imposed by Basel. These are a minimum capital ratio of 8%, which is a ratio of total own funds to total risk weighted assets (RWA).
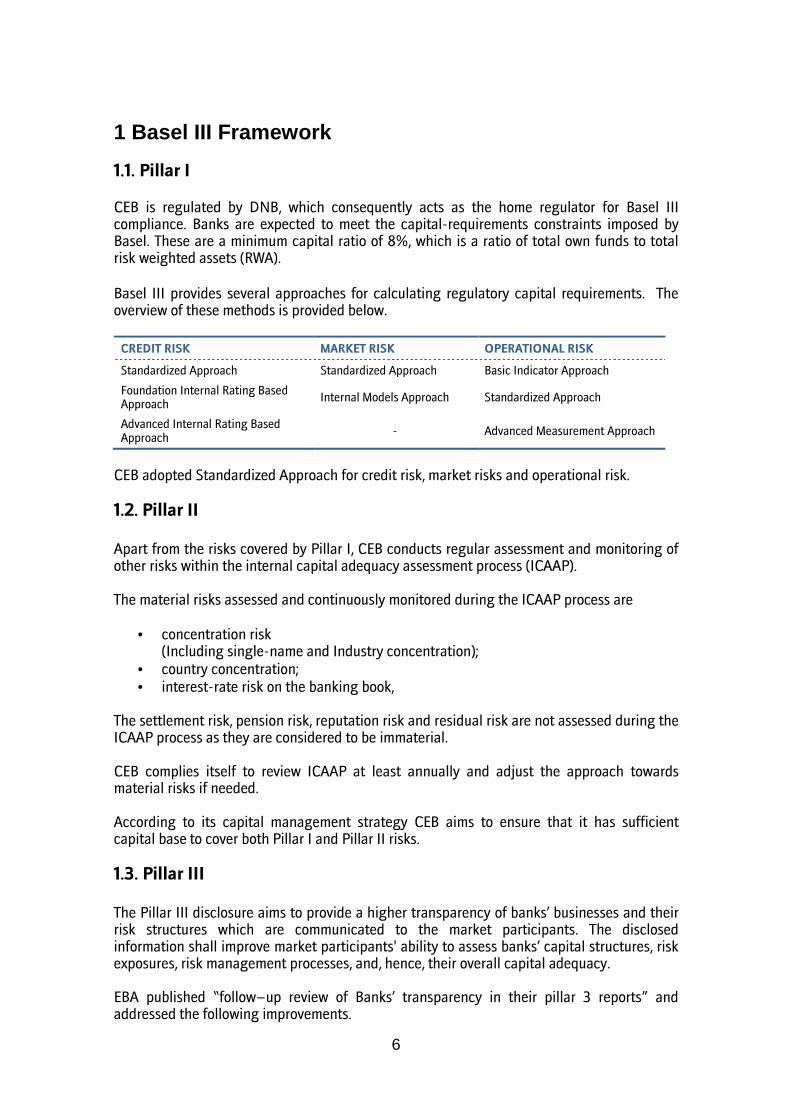
Basel III provides several approaches for calculating regulatory capital requirements. The overview of these methods is provided below.
CREDIT RISK MARKET RISK OPERATIONAL RISK
Standardized Approach Standardized Approach Basic Indicator Approach
Foundation Internal Rating Based Approach
Internal Models Approach Standardized Approach
Advanced Internal Rating Based Approach
- Advanced Measurement Approach
CEB adopted Standardized Approach for credit risk, market risks and operational risk.
1.2. Pillar II Apart from the risks covered by Pillar I, CEB conducts regular assessment and monitoring of other risks within the internal capital adequacy assessment process (ICAAP). The material risks assessed and continuously monitored during the ICAAP process are
• concentration risk (Including single-name and Industry concentration);
• country concentration; • interest-rate risk on the banking book,
The settlement risk, pension risk, reputation risk and residual risk are not assessed during the ICAAP process as they are considered to be immaterial. CEB complies itself to review ICAAP at least annually and adjust the approach towards material risks if needed. According to its capital management strategy CEB aims to ensure that it has sufficient capital base to cover both Pillar I and Pillar II risks.
1.3. Pillar III The Pillar III disclosure aims to provide a higher transparency of banks’ businesses and their risk structures which are communicated to the market participants. The disclosed information shall improve market participants' ability to assess banks’ capital structures, risk exposures, risk management processes, and, hence, their overall capital adequacy. EBA published “follow–up review of Banks’ transparency in their pillar 3 reports” and addressed the following improvements.
7
• Detailed information on the composition of own funds. • Quantitative back-testing information regarding credit risk. • Clearer information on credit risk mitigation techniques supplemented by adequate
quantitative information on their impact. • Valuation methodology used and detailed quantitative information on credit
derivative instruments. The Pillar III Disclosure Report of CEB covers following topics:
• Description of the group structure; • Description of capital and risk management strategies and approaches; • Regulatory capital requirements under Pillar I and capital adequacy profile; • Description of credit and dilution risks; • Impaired and past due assets; • Credit quality of CEB’s portfolio; • Counterparty credit risk; • Description of credit risk mitigation techniques; • Operational risk; • Market risk; • Interest rate risk; • Liquidity risk.
The Pillar III disclosures are prepared for CEB on consolidated basis. All amounts are in thousands of Euros. Pillar III Disclosure Report is prepared annually and is published on the CEB’s website www.crediteuropebank.com
8
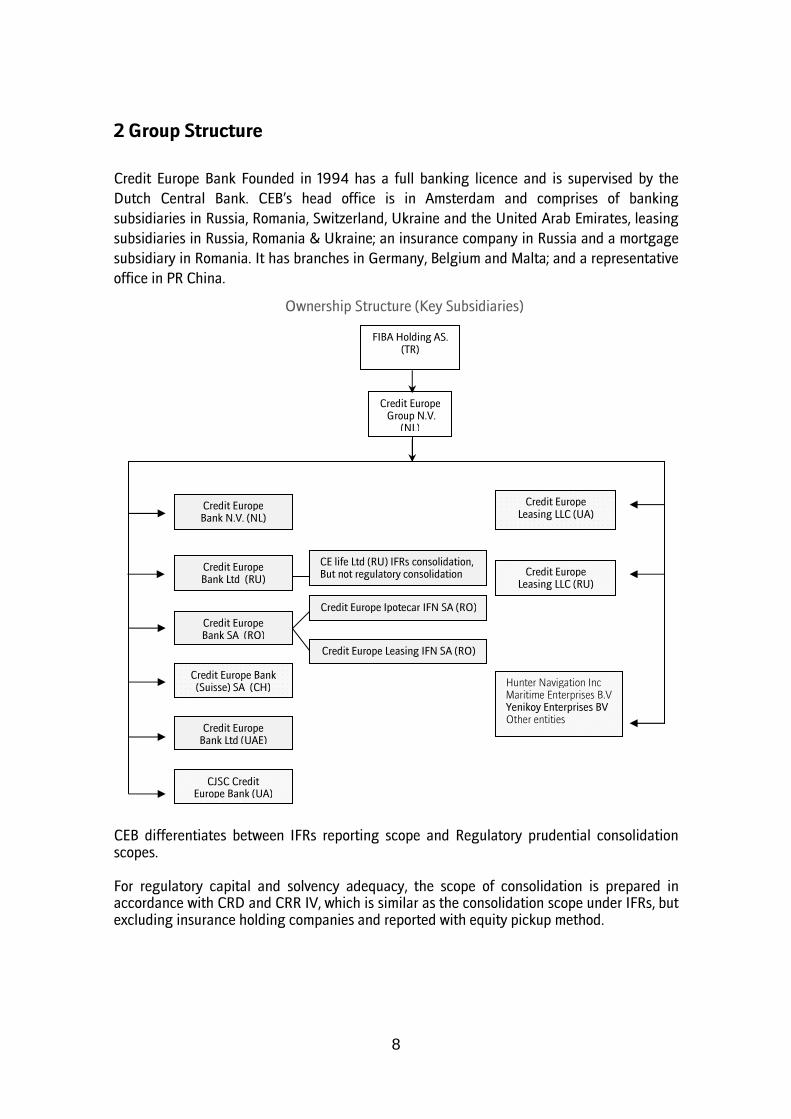
2 Group Structure
Credit Europe Bank Founded in 1994 has a full banking licence and is supervised by the
Dutch Central Bank. CEB’s head office is in Amsterdam and comprises of banking
subsidiaries in Russia, Romania, Switzerland, Ukraine and the United Arab Emirates, leasing
subsidiaries in Russia, Romania & Ukraine; an insurance company in Russia and a mortgage
subsidiary in Romania. It has branches in Germany, Belgium and Malta; and a representative
office in PR China.
Ownership Structure (Key Subsidiaries)
CEB differentiates between IFRs reporting scope and Regulatory prudential consolidation scopes. For regulatory capital and solvency adequacy, the scope of consolidation is prepared in accordance with CRD and CRR IV, which is similar as the consolidation scope under IFRs, but excluding insurance holding companies and reported with equity pickup method.
CE life Ltd (RU) IFRs consolidation, But not regulatory consolidation
FIBA Holding AS. (TR)
CJSC Credit Europe Bank (UA)
Credit Europe Bank Ltd (UAE)
Credit Europe Bank (Suisse) SA (CH)
Credit Europe Leasing IFN SA (RO)
Credit Europe Bank SA (RO)
Credit Europe Bank Ltd (RU) Credit Europe
Leasing LLC (RU)
Credit Europe Leasing LLC (UA)
Credit Europe Ipotecar IFN SA (RO)
Credit Europe Group N.V.
(NL)
Hunter Navigation Inc Maritime Enterprises B.V Yenikoy Enterprises BV Other entities
Credit Europe Bank N.V. (NL)
9
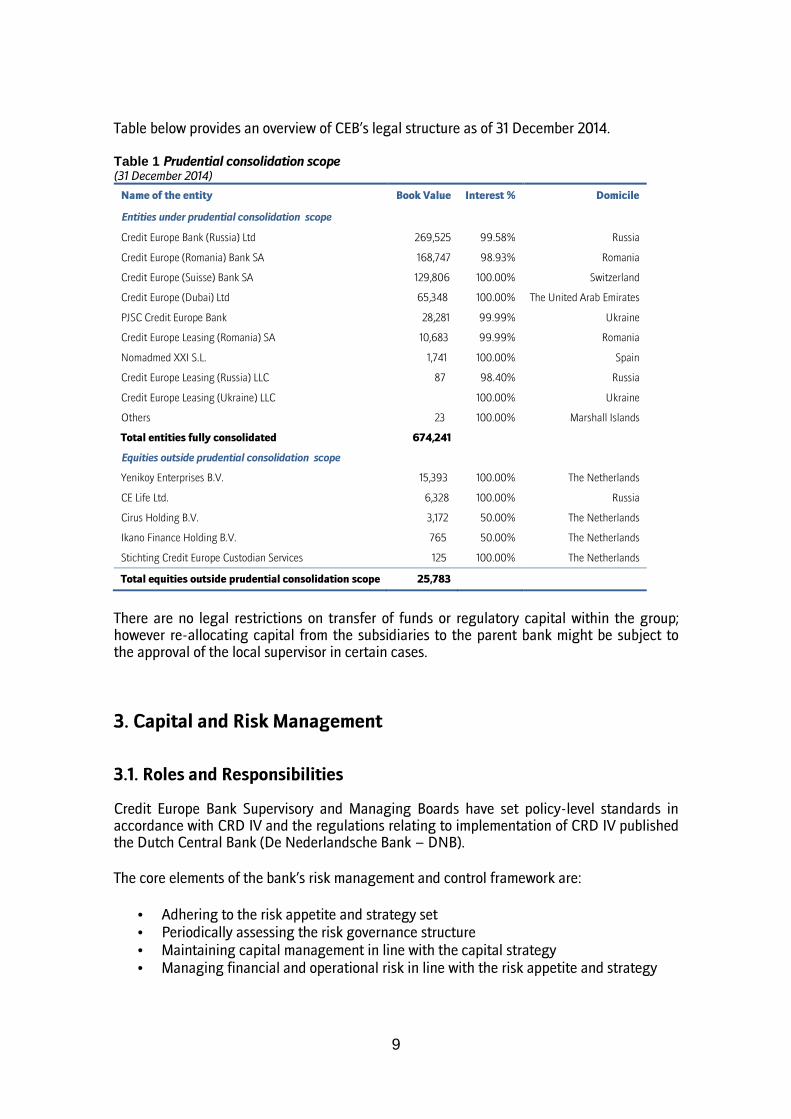
Table below provides an overview of CEB’s legal structure as of 31 December 2014. Table 1 Prudential consolidation scope (31 December 2014)
Name of the entity Book Value Interest % Domicile
Entities under prudential consolidation scope
Credit Europe Bank (Russia) Ltd 269,525 99.58% Russia
Credit Europe (Romania) Bank SA 168,747 98.93% Romania
Credit Europe (Suisse) Bank SA 129,806 100.00% Switzerland
Credit Europe (Dubai) Ltd 65,348 100.00% The United Arab Emirates
PJSC Credit Europe Bank 28,281 99.99% Ukraine
Credit Europe Leasing (Romania) SA 10,683 99.99% Romania
Nomadmed XXI S.L. 1,741 100.00% Spain
Credit Europe Leasing (Russia) LLC 87 98.40% Russia
Credit Europe Leasing (Ukraine) LLC
100.00% Ukraine
Others 23 100.00% Marshall Islands
Total entities fully consolidated 674,241
Equities outside prudential consolidation scope
Yenikoy Enterprises B.V. 15,393 100.00% The Netherlands
CE Life Ltd. 6,328 100.00% Russia
Cirus Holding B.V. 3,172 50.00% The Netherlands
Ikano Finance Holding B.V. 765 50.00% The Netherlands
Stichting Credit Europe Custodian Services 125 100.00% The Netherlands
Total equities outside prudential consolidation scope 25,783
There are no legal restrictions on transfer of funds or regulatory capital within the group; however re-allocating capital from the subsidiaries to the parent bank might be subject to the approval of the local supervisor in certain cases.
3. Capital and Risk Management
3.1. Roles and Responsibilities
Credit Europe Bank Supervisory and Managing Boards have set policy-level standards in accordance with CRD IV and the regulations relating to implementation of CRD IV published the Dutch Central Bank (De Nederlandsche Bank – DNB).
The core elements of the bank’s risk management and control framework are:
• Adhering to the risk appetite and strategy set • Periodically assessing the risk governance structure • Maintaining capital management in line with the capital strategy • Managing financial and operational risk in line with the risk appetite and strategy
10
3.2 Risk Appetite and Risk Governance
The CEB risk management philosophy requires direct reporting lines and a clear division of tasks and responsibilities. At the same time, it ensures that bank-wide criteria for acceptance, monitoring, control and management of risks are deeply rooted. We clearly separate risk ownership from business activities.
CEB exercises full control over its subsidiaries’ business performance and steers their risk appetite. In addition, we employ the following risk management governance structure:
• Effective Audit & Risk Committees at subsidiary as well as consolidated level; • Direct reporting of general managers of the banks' subsidiaries to the CEO of CEB; • Presence of a global CRO function on the Managing Board; • A uniform credit committee structure at both local and the consolidated level.
CEB has a global Operational Risk Management (ORM) Department whose goal is to consolidate the already-existing ORM activities and coordinate implementation of the framework at locations where there was no prior ORM activity. The framework uses the Risk Control Self-Assessment and Operational Loss database to identify risks and establish risk-mitigating action points. Related departments have been given awareness trainings to ensure that operational-risk management is embedded in day-to-day operations.
CEB has established a center of excellence for retail risk management responsible for scoring, risk based pricing, algorithm development, stress testing, monitoring and reporting. The center is composed of 22 highly skilled statisticians, bankers, econometrists, database programmers and risk managers. The team has worked in projects in several countries including Russia, Romania, Germany and Belgium. Now through their efforts, all banking entities are taking the right risk with the right interest margin.
We continue to invest in our risk management capabilities in each entity of the bank. This included creating a streamlined credit process, particularly with regard to risk modeling, and implementing integrated stress testing measures. These efforts also cover a wide range of activities, from strengthening risk management in Human Resources, qualitatively and quantitatively, to seeking external assessments of our risk management capabilities. The risk consolidation is conducted by the Group Risk Management Department (GRMD) which is responsible for measurement and monitoring of risks at consolidated level. The GRMD operates under the supervision of Chief Risk Officer (CRO). The CRO is responsible for financial and non-financial risk management, internal audit and compliance. The consolidated credit risk related reports are conducted on a monthly basis and contains detailed analysis of the portfolio structure, asset impairments and concentration risks. The consolidated market risk and liquidity gap reports are prepared on a monthly basis, except of VaR and liquidity positions which are reported daily to the Managing Board.
The Audit and Risk Committee (ARC) at the consolidated level plays a pivotal role in CEB’s risk governance framework. ARC meets 4 times a year and receives regular reports and updates on the Bank’s actual risk appetite with respect to the approved risk appetite statement. The Committee reviews and monitors the limits for individual types of risks and
11
takes decisions whether principal risks have been properly identified and are being appropriately managed. ARC also makes assessments on the existing risk management capacity / know-how of the Bank and raises action items / investment plans –where necessary- to reach the desired level.
In line with the ARC recommendations we continued to invest in the Bank’s risk management systems in 2014, including but not limited to the streamlining of the credit process, particularly with regard to capital planning, and implementing integrated stress testing tools.
3.3. Capital Management A capital level commensurate with the bank’s risk profile is the key to financial resilience. CEB operates with an optimum level and mix of capital resources. A centralized regulatory/internal capital management model plays a major role in this process. The CEB internal capital model incorporates detailed scenario analyses of key risk factors and their potential effects on profit and loss and the bank’s capital base under different assumptions. This framework is designed to ensure CEB has sufficient capital resources to meet the capital requirements of DNB, as well as those of local regulators in our operating countries. It further ensures that we have capital available to meet our own risk appetite and internal guidelines. We place great emphasis on the strength of our capital base as a way to maintain investor, creditor and market confidence, and to sustain future business development.
CEB allocates assets in accordance with the risk-return thresholds defined in our risk appetite statement. Business units are required to fully understand the inherent risk-reward profile of their business and to generate a specific level of return on regulatory/internal capital requirements. The CEB risk strategy has proved its value, not only by providing consistently strong financial results, but also by yielding consistently robust returns on equity.
CEB and its individually supervised subsidiaries complied with all externally imposed capital requirements throughout the reporting period. The bank’s capital-management objectives are to:
• Maintain sufficient capital resources to meet the DNB’s minimum regulatory capital requirements.
• Ensure that locally regulated subsidiaries can meet their minimum capital requirements.
• Achieve adequate capital levels to support the bank’s risk appetite and internal capital requirements.
• Maintain a strong capital base to reassure investors, creditors and markets, and to sustain future business development.
To support its capital-management objectives, the bank takes into account:
• Possible volatility in anticipated demand for capital caused by new business opportunities, including acquisitions, or by deterioration in the credit quality of the bank’s assets.
• Possible volatility of reported profits and other capital resources compared with forecast.
• Capital ratio sensitivity to foreign-exchange-rate movements.

12
3.4. Risk Types
3.4.1. Pillar I Risks
In pillar I, which forms the base for the regulatory capital requirement, three risk types are covered: credit risk, market risk and operational risk. Credit Risk Credit risk is defined as the current or prospective threat to CEB’s earnings and capital as a result of counterparty’s failure to comply with financial or other contractual obligations. Credit risk constitutes the most significant risk of CEB and arises mainly from its trade-finance, lending, treasury, mortgage and leasing businesses. Credit risk both stem from idiosyncratic risk factors and systematic factors like country risk and industry risk. Idiosyncratic risk factors are managed through counterparty risk assessment and monitoring while portfolio diversification is adopted as the main portfolio strategy to control country, industry and single name concentration risks. Market Risk Market risk is the risk that CEB’s earnings or capital, or its ability to meet business objectives, will be adversely affected by changes in the level or volatility of market rates or prices such as interest rates, credit spreads, commodity prices, equity prices and foreign exchange rates. Operational Risk CEB defines Operational Risk as the risk of loss resulting from inadequate or failed internal processes, people, and systems or from external events. It includes legal risk and outsourcing risk (within Execution, Delivery, & Process Management) but excludes strategic risk, business risk, liquidity risk, reputational risk.
3.4.2. Pillar II Risks Concentration risks This includes single-name, sector and country concentration risks. Calculation of capital requirements for the credit risk under Pillar I do not consider a buffer for credit risk concentrations, therefore an assessment of additional required capital due to concentration risk is conducted under Pillar II. GRMD prepares regular concentration reports to monitor its concentration risks on different levels. Concentration risk is managed with the limit structure and credit risk mitigation techniques.
13
Interest rate risk in the banking book One of the Bank’s major risks under Pillar II is the interest-rate risk on the banking book. The Bank defines interest-rate risk as the current or prospective risk to earnings and capital arising from adverse movements in interest rates. The trading book is also subject to interest-rate risk, but this type of risk is dealt with under the Market Risk Value-at-Risk section. Subsidiaries are not allowed to carry interest-rate positions and are expected to transfer their positions to the parent Bank, where centralized ALM and funding principles are in place. The Bank has a ‘limited’ risk tolerance towards interest-rate risk in its banking book. Liquidity risk Liquidity risk rises when an institution is unable to meet its due liabilities, since it is unable to borrow on an unsecured basis, or does not have sufficient good quality assets to borrow against or liquid assets to sell to raise immediate cash without severely damaging its net asset value. CEB manages its liquidity position on the consolidated level in order to be able to ride out a crisis without damaging the on-going viability of the business. This is complemented by its funding risk management which aims to achieve the optimal liability structure to finance its businesses cost-efficiently and reliably.
4. Regulatory Capital Requirements and Capital Adequacy Profile CEB ensures that it holds enough capital to cover its material risks. The nature and quality of the capital which can be included into total own funds for the purposes of capital requirement calculation is subject to regulatory restrictions set out by CRD and the Dutch Central Bank. This section describes main elements of CEB’s capital base and provides capital adequacy profile of CEB, CEG and its significant subsidiaries.
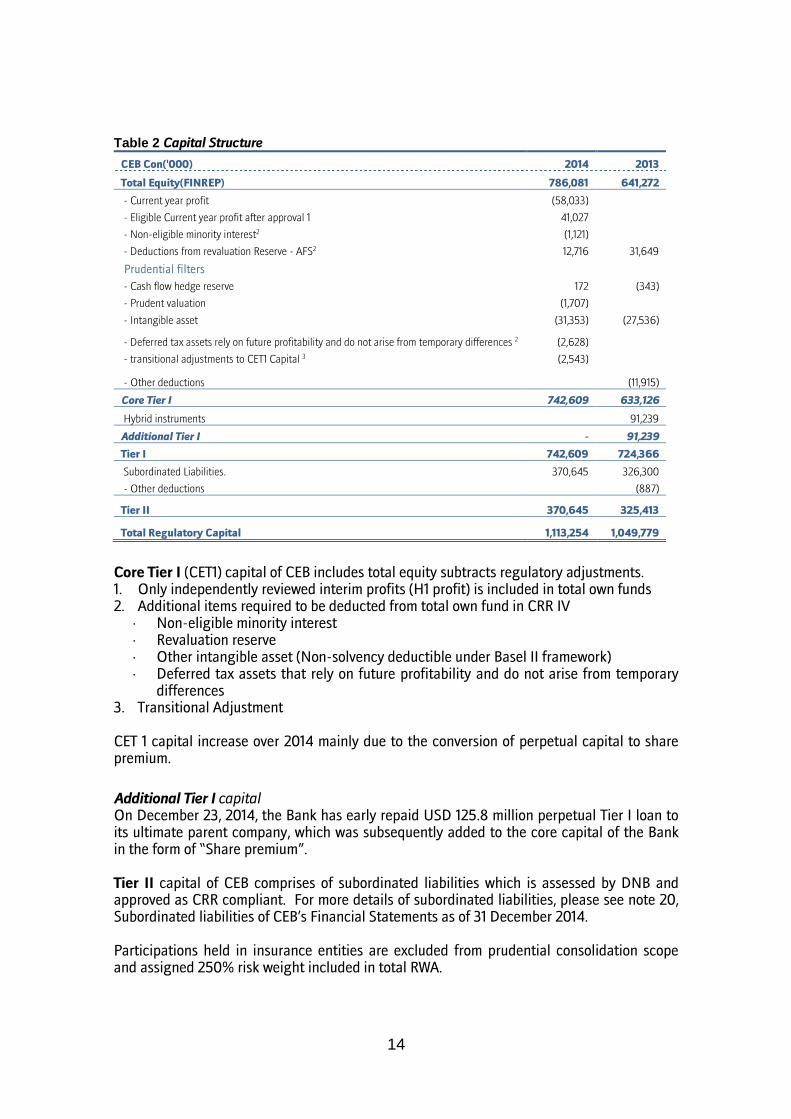
4.1 Capital Structure The total own funds eligible for regulatory purposes are calculated based on IFRS figures and are composed of three components: Tier I capital(includes Core Tier I and Hybrid Tier I capital), Tier II(also known as “supplementary capital”) and Tier III. Currently CEB’s capital base includes Core Tier I, Additional Tier I and Tier II capital. The main terms and conditions of these elements are summarized below.
14
Table 2 Capital Structure
CEB Con('000) 2014 2013
Total Equity(FINREP) 786,081 641,272
- Current year profit (58,033)
- Eligible Current year profit after approval 1 41,027 - Non-eligible minority interest2 (1,121) - Deductions from revaluation Reserve - AFS2 12,716 31,649
Prudential filters - Cash flow hedge reserve 172 (343)
- Prudent valuation (1,707) - Intangible asset (31,353) (27,536)
- Deferred tax assets rely on future profitability and do not arise from temporary differences 2 (2,628) - transitional adjustments to CET1 Capital 3 (2,543)
- Other deductions
(11,915)
Core Tier I 742,609 633,126
Hybrid instruments
91,239
Additional Tier I - 91,239
Tier I 742,609 724,366
Subordinated Liabilities. 370,645 326,300
- Other deductions
(887)
Tier II 370,645 325,413
Total Regulatory Capital 1,113,254 1,049,779
Core Tier I (CET1) capital of CEB includes total equity subtracts regulatory adjustments. 1. Only independently reviewed interim profits (H1 profit) is included in total own funds 2. Additional items required to be deducted from total own fund in CRR IV
· Non-eligible minority interest · Revaluation reserve · Other intangible asset (Non-solvency deductible under Basel II framework) · Deferred tax assets that rely on future profitability and do not arise from temporary
differences 3. Transitional Adjustment CET 1 capital increase over 2014 mainly due to the conversion of perpetual capital to share premium.
Additional Tier I capital On December 23, 2014, the Bank has early repaid USD 125.8 million perpetual Tier I loan to its ultimate parent company, which was subsequently added to the core capital of the Bank in the form of “Share premium”. Tier II capital of CEB comprises of subordinated liabilities which is assessed by DNB and approved as CRR compliant. For more details of subordinated liabilities, please see note 20, Subordinated liabilities of CEB’s Financial Statements as of 31 December 2014. Participations held in insurance entities are excluded from prudential consolidation scope and assigned 250% risk weight included in total RWA.
15
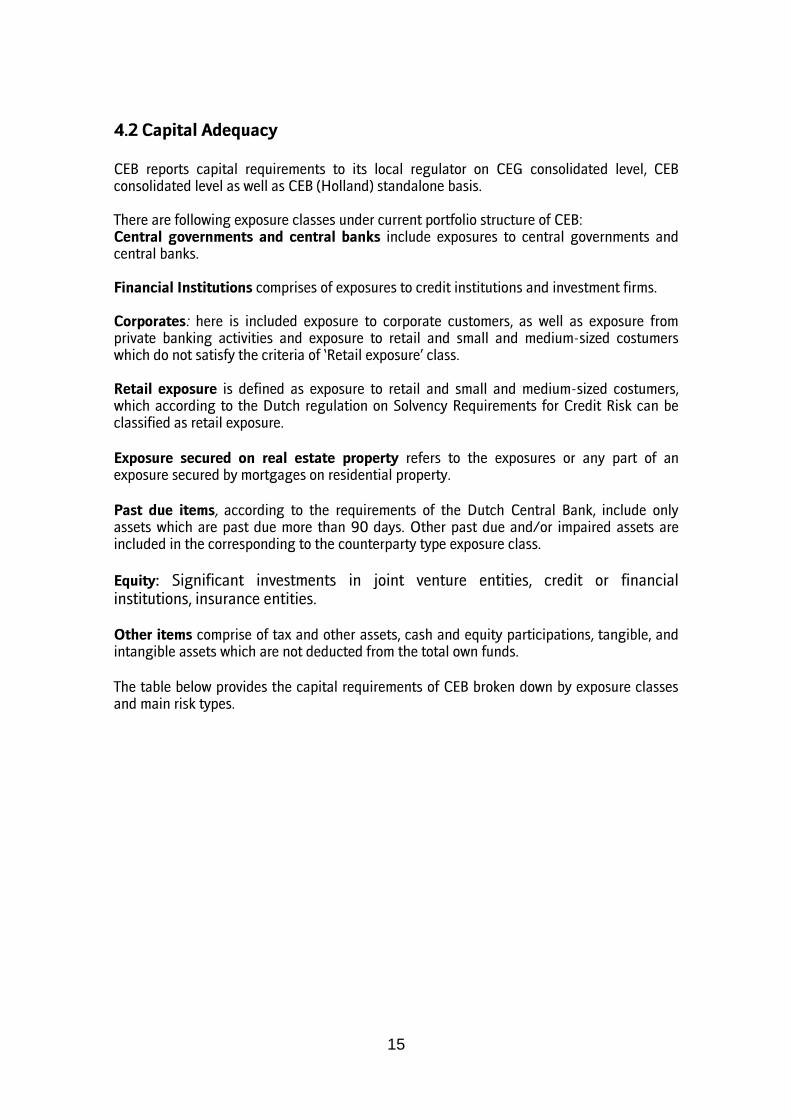
4.2 Capital Adequacy
CEB reports capital requirements to its local regulator on CEG consolidated level, CEB consolidated level as well as CEB (Holland) standalone basis. There are following exposure classes under current portfolio structure of CEB: Central governments and central banks include exposures to central governments and central banks. Financial Institutions comprises of exposures to credit institutions and investment firms. Corporates: here is included exposure to corporate customers, as well as exposure from private banking activities and exposure to retail and small and medium-sized costumers which do not satisfy the criteria of ‘Retail exposure’ class. Retail exposure is defined as exposure to retail and small and medium-sized costumers, which according to the Dutch regulation on Solvency Requirements for Credit Risk can be classified as retail exposure.
Exposure secured on real estate property refers to the exposures or any part of an exposure secured by mortgages on residential property.
Past due items, according to the requirements of the Dutch Central Bank, include only assets which are past due more than 90 days. Other past due and/or impaired assets are included in the corresponding to the counterparty type exposure class.
Equity: Significant investments in joint venture entities, credit or financial institutions, insurance entities. Other items comprise of tax and other assets, cash and equity participations, tangible, and intangible assets which are not deducted from the total own funds.
The table below provides the capital requirements of CEB broken down by exposure classes and main risk types.
16
Table 3 Capital requirements and risk weighted assets (31 December 2014)
Dec-14 Risk Weighted
Exposure Average RW
(%) Capital
Requirements
Credit Risk
Central governments and central banks 115,928 7.18% 9,274
Institutions 448,006 46.47% 35,840
Corporates 3,078,563 100.99% 246,285
Retail 1,218,749 75.00% 97,500
Secured by real state property 179,419 48.51% 14,354
Past due items 245,063 122.57% 19,605
Equity 41,366
3,309
Other items 335,370 85.55% 26,830
Total Credit risk 5,662,465 68.81% 452,997
Market Risk
Equity in the trading book 2,610
209
Option in the trading book 81
6
Trading securities (specific risk) 4,530 24.63% 362
General market risk 6,543
523
Foreign Exchange 63,336 5,067
Total Market Risk 77,101
6,168
Total Operational Risk 892,816 - 71,425
CVA Risk 50,226
Total of items 6,682,607 - 530,590
(31 December 2013)
Dec-13 Risk Weighted
Exposure Average RW
(%) Capital
Requirements
Credit Risk
Central governments and central banks 112,034 8.13% 8,963
Institutions 497,171 46.66% 39,774
Corporates 3,384,543 99.67% 270,763
Retail 2,126,419 75.00% 170,114
Secured by real state property 203,698 48.44% 16,296
Past due items 275,820 114.84% 22,066
Other items 272,393 62.21% 21,791
Total Credit risk 6,872,078 70.31% 549,766
Market Risk
Equity in the trading book 2,783
223
Option in the trading book 244
20
Trading securities (specific risk) 3,068 19.00% 245
General market risk 5,531
442
Foreign Exchange 32,205 2,576
Total Market Risk 43,831
3,507
Total Operational Risk 879,680 - 70,374
Total of items 7,795,589 - 623,647
17
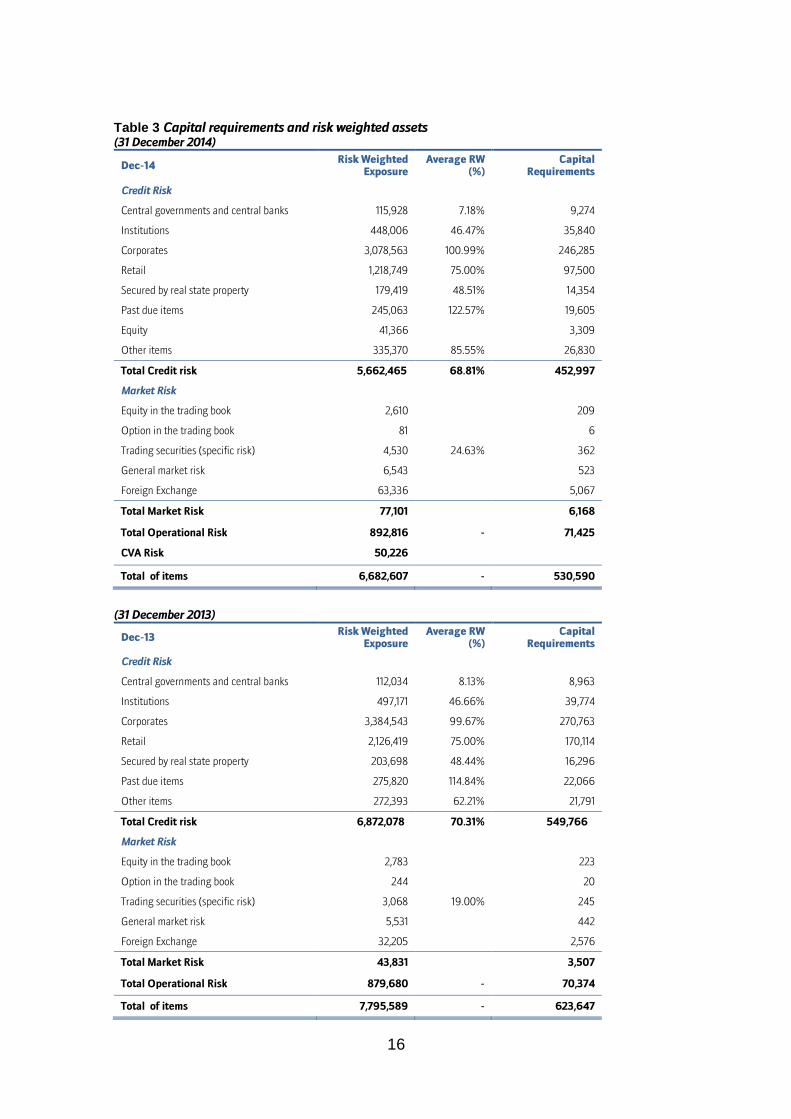
CEB maintains minimum Capital ratio at 13% and CET1 ratio at 11% as of Dec 2014. CET1 ratio is equal to T1 ratio as of Dec 2014 since all additional Tier 1 capital is converted to share premium.
Among other entities consolidated under CEB, only CEB Swiss S.A and CEB Romania S.A. operate under Basel framework. Solvency profile of CEB Russian, CEB Ukrainian and CEB Dubai is subject to the local regulation of the country of their domicile.
Overview of the local capital requirements for significant entities consolidated under CEB are disclosed below Table 4 Minimum capital requirements (local regulation) (31 December 2014)
Significant subsidiaries
CEB N.V consolidated (audited)
CEG N.V. (audited)
CEB Russia
Ltd.
CEB Ukraine CJSC
CEB Dubai
CEB Swiss S.A.
CEB Romania S.A.
CEB NV (Holland)
Total Own funds 299,944 33,202 61,565 103,947 128,089 1,118,166 1,113,254 1,100,540
Total RWA 2,155,700 74,908 222,296 399,437 580,559 4,163,355 6,682,607 6,691,745
Capital Ratio
- actual (local) 13.91% 44.32% 27.70% 26.02% 22.06% 26.86% 16.66% 16.45%
- required (local) 10% 10% 10% 11% 10% 13.0% 13.0% 13.0%
Capital surplus (deficit) 84,374 25,711 39,335 62,006 70,033 576,930 244,515 230,613
(31 December 2013)
Significant subsidiaries CEB N.V consolidat
ed (audited)
CEG N.V. (audited)
CEB Russia
Ltd.
CEB Ukraine CJSC
CEB Dubai
CEB Swiss S.A.
CEB Romania S.A.
CEB NV (Holland)
Total Own funds 611,097 48,660 49,985 114,843 115,829 1,054,091 1,049,779 1,029,885
Total RWA 3,083,917 126,508 104,003 406,905 768,654 6,890,889 7,795,589 7,764,104
Capital Ratio
- actual (local) 19.82% 38.46% 48.06% 28.22% 15.07% 15.30% 13.47% 13.26%
- required (local) 10% 10% 10% 11% 10% 13.0% 13.0% 13.0%
Capital surplus (deficit) 302,705 36,009 39,585 72,118 38,964 158,275 36,352 20,552

18
5. Credit Risk
This section provides an overview over CEB’s credit risk. Total credit risk covers risk associated with the probability of the customer’s default and arising mainly from CEB’s cash and non-cash loan portfolios, treasury business, including available-for-sale and derivative instruments which give rise to counterparty credit risk. Non-cash loan portfolio is comprised of issued letters of guarantees and letters of credits as well as of other irrevocable and revocable credit commitments. The total exposure for counterparty credit risk is calculated in accordance with the current exposure method and is a sum of potential future exposure and positive current replacement costs after application of the relevant netting options. Also trading book assets which are subject to specific risk are included in the below tables. These are equity in the trading book and trading securities. Table 5 Breakdown of total exposure per exposure class (31 December 2014)
Exposure Value Dec-14 Dec-13
Credit Risk
Central governments and central banks 1,614,374 1,378,491
Institutions 1,226,788 1,478,847
Corporates 4,222,871 4,036,128
Retail 2,085,279 3,444,805
Secured by real state property 369,895 420,523
Default assets 199,938 240,168
Equity 25,782 Deducted from capital
Other items 405,485 437,883
Total Credit risk 10,150,411 11,436,845
Equity in trading book 1,305 1,392
Trading securities 17,879 16,160
* Net of 209 million provisions (2014) and 256 million provisions (2013) * Counterparty credit risk is calculated in accordance to CRR IV
NPL and Leases 351,417
Provisions on NPLs and leases (151,480)
Net NPA 199,938
Total loans and leases 6,213,074
Total debt securities 1,052,545
Interest bearing balances 187,777
Total 7,453,396
Net NPA ratio 2.68%
19
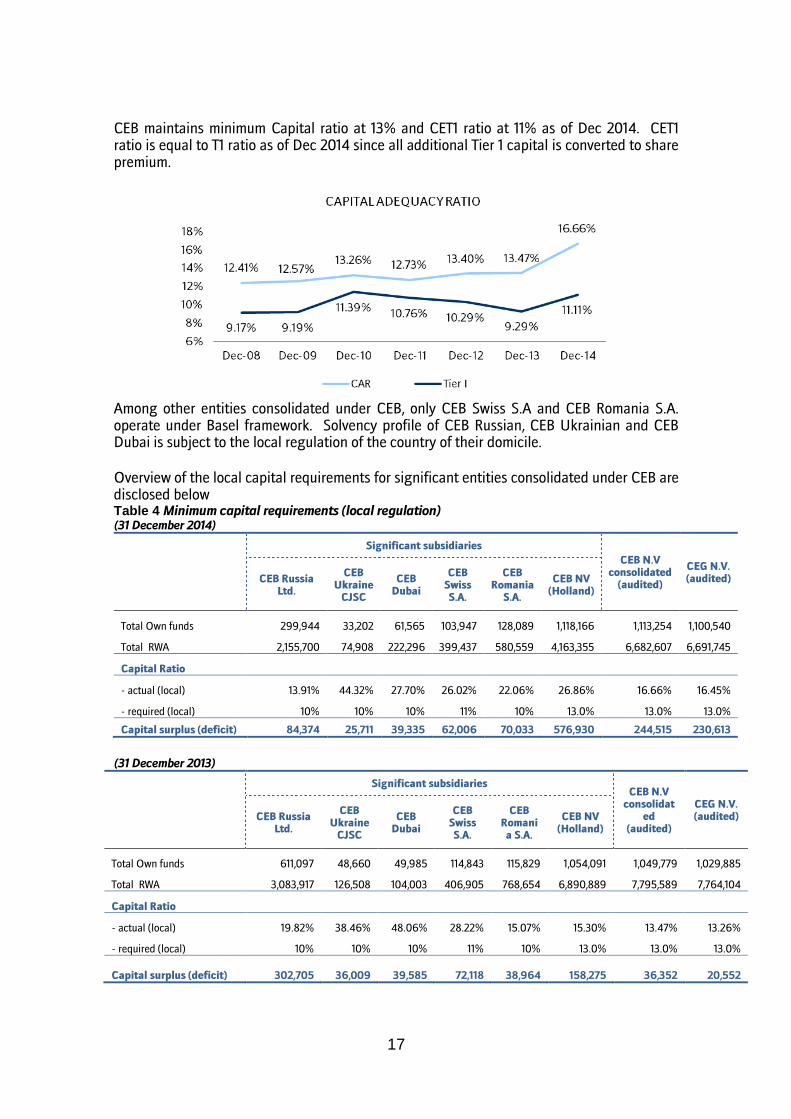
The following tables broke down total exposure by the type of financial assets. Tangible, tax and other assets as well as cash balances, captured under ‘Other items’ exposure class are not included in the below tables. Table 6 Total exposure broken down by asset type (31 December 2014)
Central governments and central
banks
Institutions Corporates Retail
Secured by real state
property
Past due items
Total
Demand deposits with central banks
323,587 - - - - - 323,587
Financial investments 650,560 543,045 45,963 - - - 1,239,568
Loans and receivables - banks
38,708 325,516 - - - - 364,224
Loans and receivables - customers
601,520 - 3,143,150 1,535,140 369,895 199,938 5,849,642
Contingent liabilities and other commitments
- 109,172 882,165 550,136 - - 1,541,473
Counterparty credit risk - 249,055 151,592 4 - - 400,651
Total credit risk 1,614,374 1,226,788 4,222,871 2,085,279 369,895 199,938 9,719,144
Equity in trading book - - 1,305 - - - 1,305
Trading securities 8,009 2,525 7,346 - - - 17,879
* Net of 209 million provisions and counterparty credit risk is calculated in accordance to CRD
(31 December 2013)
Central governments and central
banks
Institutions Corporates Retail
Secured by real state
property
Past due items
Total
Demand deposits with central banks
427,417 - - - - - 427,417
Financial investments 922,390 557,105
70,524 - - - 1,550,019
Loans and receivables - banks
28,684 643,558 20,550 - - 49 692,841
Loans and receivables - customers
- -
3,285,251
2,707,090
420,523
240,119
6,652,984
Contingent liabilities and other commitments
- 60,351
454,836
737,564 - - 1,252,751
Counterparty credit risk - 217,834
204,967
151 - -
422,951
Total credit risk 1,378,491 1,478,847 4,036,128 3,444,805 420,523 240,168 10,998,962
Equity in trading book - - 1,392 - - - 1,392
Trading securities 14,618 688 838 - - - 16,144
* Net of 256 million provisions and counterparty credit risk is calculated in accordance to CRD
20
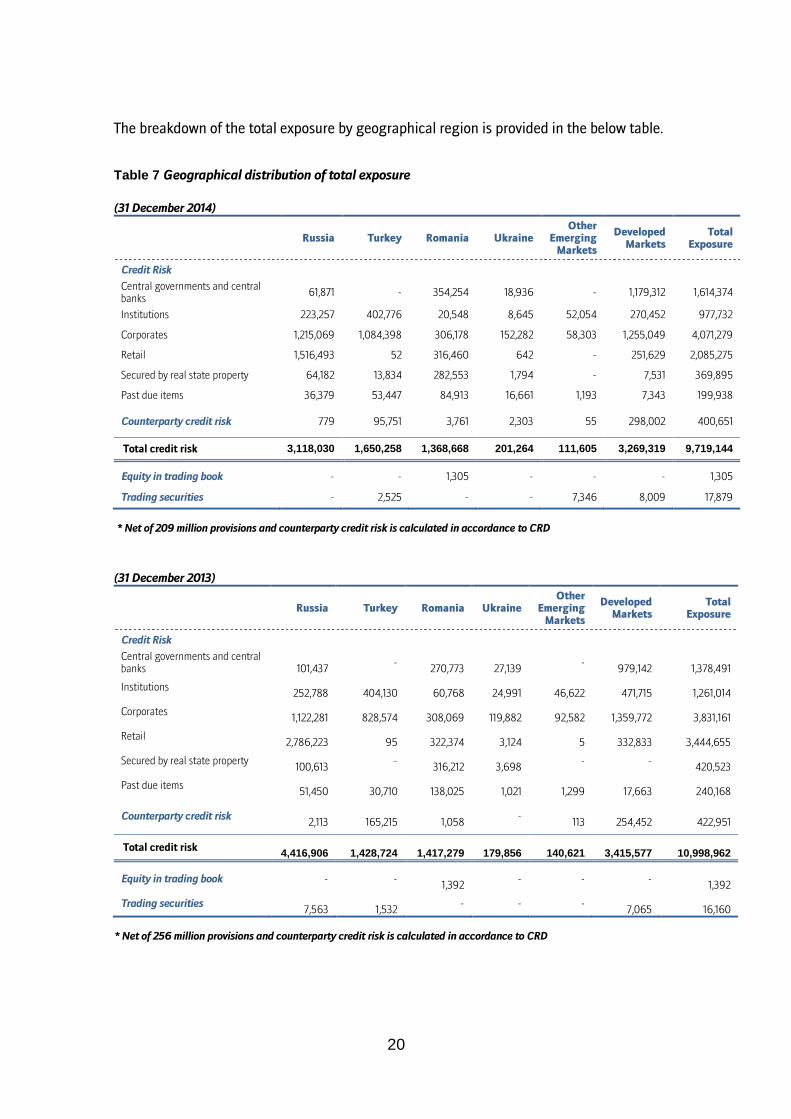
The breakdown of the total exposure by geographical region is provided in the below table. Table 7 Geographical distribution of total exposure (31 December 2014)
Russia Turkey Romania Ukraine Other
Emerging Markets
Developed Markets
Total Exposure
Credit Risk
Central governments and central banks
61,871 - 354,254 18,936 - 1,179,312 1,614,374
Institutions 223,257 402,776 20,548 8,645 52,054 270,452 977,732
Corporates 1,215,069 1,084,398 306,178 152,282 58,303 1,255,049 4,071,279
Retail 1,516,493 52 316,460 642 - 251,629 2,085,275
Secured by real state property 64,182 13,834 282,553 1,794 - 7,531 369,895
Past due items 36,379 53,447 84,913 16,661 1,193 7,343 199,938
Counterparty credit risk 779 95,751 3,761 2,303 55 298,002 400,651
Total credit risk 3,118,030 1,650,258 1,368,668 201,264 111,605 3,269,319 9,719,144
Equity in trading book - - 1,305 - - - 1,305
Trading securities - 2,525 - - 7,346 8,009 17,879
* Net of 209 million provisions and counterparty credit risk is calculated in accordance to CRD
(31 December 2013)
Russia Turkey Romania Ukraine Other
Emerging Markets
Developed Markets
Total Exposure
Credit Risk
Central governments and central banks
101,437
-
270,773
27,139 -
979,142
1,378,491
Institutions
252,788
404,130
60,768
24,991
46,622
471,715
1,261,014
Corporates
1,122,281
828,574
308,069
119,882
92,582
1,359,772
3,831,161
Retail
2,786,223
95
322,374
3,124
5
332,833
3,444,655
Secured by real state property
100,613 -
316,212
3,698
- -
420,523
Past due items
51,450
30,710
138,025
1,021
1,299
17,663
240,168
Counterparty credit risk
2,113
165,215
1,058
-
113
254,452
422,951
Total credit risk
4,416,906
1,428,724
1,417,279
179,856
140,621
3,415,577
10,998,962
Equity in trading book - -
1,392
- - -
1,392
Trading securities
7,563
1,532 - - -
7,065
16,160
* Net of 256 million provisions and counterparty credit risk is calculated in accordance to CRD
21
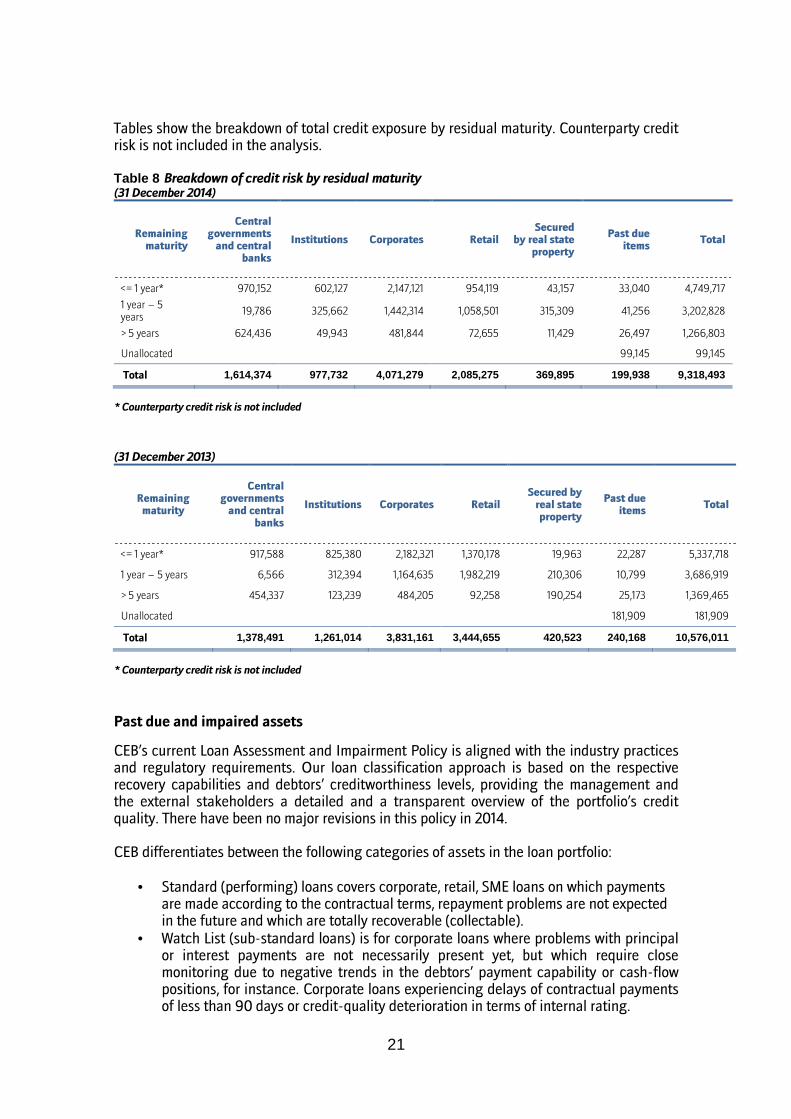
Tables show the breakdown of total credit exposure by residual maturity. Counterparty credit risk is not included in the analysis. Table 8 Breakdown of credit risk by residual maturity (31 December 2014)
Remaining maturity
Central governments and central
banks
Institutions Corporates Retail Secured
by real state property
Past due items
Total
<= 1 year* 970,152 602,127 2,147,121 954,119 43,157 33,040 4,749,717
1 year – 5 years
19,786 325,662 1,442,314 1,058,501 315,309 41,256 3,202,828
> 5 years 624,436 49,943 481,844 72,655 11,429 26,497 1,266,803
Unallocated
99,145 99,145
Total 1,614,374 977,732 4,071,279 2,085,275 369,895 199,938 9,318,493
* Counterparty credit risk is not included
(31 December 2013)
Remaining maturity
Central governments and central
banks
Institutions Corporates Retail Secured by
real state property
Past due items
Total
<= 1 year* 917,588 825,380 2,182,321 1,370,178 19,963 22,287 5,337,718
1 year – 5 years 6,566 312,394 1,164,635 1,982,219 210,306 10,799 3,686,919
> 5 years 454,337 123,239 484,205 92,258 190,254 25,173 1,369,465
Unallocated
181,909 181,909
Total 1,378,491 1,261,014 3,831,161 3,444,655 420,523 240,168 10,576,011
* Counterparty credit risk is not included
Past due and impaired assets
CEB’s current Loan Assessment and Impairment Policy is aligned with the industry practices and regulatory requirements. Our loan classification approach is based on the respective recovery capabilities and debtors’ creditworthiness levels, providing the management and the external stakeholders a detailed and a transparent overview of the portfolio’s credit quality. There have been no major revisions in this policy in 2014. CEB differentiates between the following categories of assets in the loan portfolio:
• Standard (performing) loans covers corporate, retail, SME loans on which payments are made according to the contractual terms, repayment problems are not expected in the future and which are totally recoverable (collectable).
• Watch List (sub-standard loans) is for corporate loans where problems with principal or interest payments are not necessarily present yet, but which require close monitoring due to negative trends in the debtors’ payment capability or cash-flow positions, for instance. Corporate loans experiencing delays of contractual payments of less than 90 days or credit-quality deterioration in terms of internal rating.
22
• Non-Performing Loans (NPL) includes loans and receivables with limited (doubtful) recovery prospects. These clients:
• have limited means for total recovery because their repayment capacity is inadequate to cover payments on respective terms; they are likely to lead to losses if these problems are not solved; or,
• are in a situation where full or partial recovery prospects are fully dependent on the outcome of the liquidation of the underlying assets or recourse to the guarantor; or,
• have suffered significant credit quality deterioration; or, • have delayed the capital and/or interest payments for more than 90 days as
of the day of their payment date • Delinquent Loans are retail loans (including SME loans and the residential-
mortgage portfolio) with a delay in contractual payment of no more than 90 days (also shown on Watch List).
Impairment allowances The Bank aims to maintain sufficient reserves to cover its incurred losses. According to its policy, the Bank differentiates between:
• Provisions for individually assessed assets • Provisions for collectively assessed assets
Individual Assessment All Watch List and NPL customers are analyzed individually, regardless of size. Standard (performing) loans are subject to individual assessment only if they are deemed ‘significant’. The ‘significance criterion’ is established at global level, and amounts to EUR 1 million. In terms of individual assessment, the trigger point for impairment is formal classification of an account as exhibiting serious financial problems and where any further deterioration is likely to lead to failure. Two key inputs to the cash-flow calculation are the valuation of all security and collateral and the timing of all asset realizations. Collective Assessment The Bank identifies loans to be evaluated for impairment on an individual basis and segments the remainder of the portfolio into groups of loans with similar credit characteristics. CEB classifies its corporate portfolio either on an obligor or a transactional rating scale, where corresponding probability of default “PD” or expected loss “EL” figures are readily available. The Bank calculates collective impairment allowances for retail portfolios using the dynamic statistical model, based on analysis of the portfolio’s default and recovery rates according to historical data. The same approach is implemented across the Bank’s entities, with adjustment for specific local conditions. The methodology remained unchanged in 2014. For more information about past due and impaired assets refer to note 38.f. of CEB’s Financial Statements as of 31 December 2014.

23
6. Credit Quality
In order to calculate the RWA CEB is using external ratings provided by the eligible credit assessment institutions (ECAIs), namely Moodys, S&P and Fitch. The ratings provided by ECAIs are aggregated into 6 groups, so called ‘credit quality steps’ and mapped to the risk weights. Tables below provide breakdown of cash equivalent exposure by risk weight. Table 9 Breakdown of credit risk exposure by risk weight (31 December 2014)
Risk weight Exposure value
Adjusted Value of Collaterals
Adjusted Value of Collaterals and other credit enhancements
Exposure, net of collaterals, adjusted for risk substitution
effect Outflow (-) Inflow (+)
0% 1,508,834
- - 1,508,834
20% 577,598
- 869 417,893
35% 235,533
- - 235,533
50% 559,527
- 18,261 577,243
75% 1,754,254 (848) (9,988) - 1,743,418
100% 4,012,288 (430,274) (9,143) - 3,572,872
150% 183,635
- - 183,635
250% 23,857
23,857
Total 8,855,526 (431,122) (19,131) 19,131 8,263,284
* Counterparty credit risk is not included
(31 December 2013)
Risk weight
Exposure value
Adjusted Value of Collaterals
Adjusted Value of Collaterals and other credit enhancements
Exposure, net of collaterals, adjusted for risk substitution
effect Outflow (-) Inflow (+)
0% 1,191,111
- - 1,191,111
20% 738,989
- 8,686 410,332
35% 284,517
- - 284,517
50% 467,171
- 32,515 492,035
75% 2,985,498 (887) (21,984) - 2,962,628
100% 4,164,925 (242,413) (38,434) - 3,884,077
150% 126,311
- - 126,311
Total 9,958,522 (243,300) (60,418) 41,201 9,351,011
* Counterparty credit risk is not included
24
7. Credit Risk Mitigation
It is CEB’s policy to ensure that the loan extension process is conducted under strong evidence of a customer’s ability to repay the loan. Nevertheless, collaterals are actively used for the purposes of credit-risk mitigation. The Transactions and Collateral Management Department is organized as a separate department for collateral management of all types of lending. Transactional lending especially relies heavily upon collaterals and documentation. Valuation reports, survey report updates and insurance policies are followed up systematically. Mainly related to trade finance, Collateral Management Agreements and Collateral Monitoring Agreements are also outsourced to expert collateral management agents who have management and reporting capabilities at the site of the collateral. As a principal, the value of the collateral should not have a material positive correlation with the credit quality of the provider for the risk mitigation effect to be considered. Due to the application of Standardized Approach, not all available collaterals can be considered for solvency testing. Currently CEB applies Financial Collateral Comprehensive Approach to assess the value of collateral for risk mitigation purposes. For funded credit protections, following collaterals are recognized as eligible:
• cash on deposit with, or cash-assimilated instruments held by, a lending credit institution;
• debt securities issued by central governments or central banks which securities have a credit assessment that is associated with credit quality step 4 or above;
• debt securities issued by institutions or other entities which securities have a credit assessment that is associated with credit quality step 3 or above;
• debt securities with a short-term credit assessment that is associated with credit quality step 3 or above;
• equities or convertible bonds that are included in a main index or listed on a recognized stock exchange;
• gold; To reflect the possible fluctuations in the collateral value CEB applies supervisory haircuts set by the Dutch Central Bank. CEB strictly follows that there is a proper documentation in place which legally enforces the pledge of the collateral to the exposure. Otherwise the collateral is not accepted for risk mitigation purposes. The main documents ensuring that CEB has the right to liquidate collateral in case the customer does not fulfill its credit obligations are Deed of Pledge and Framework Credit Agreements. The next tables show the carrying amount of collateralized exposure broken down by type of collateral obtained. The distinction is made between collaterals eligible for capital adequacy calculation and other collaterals.
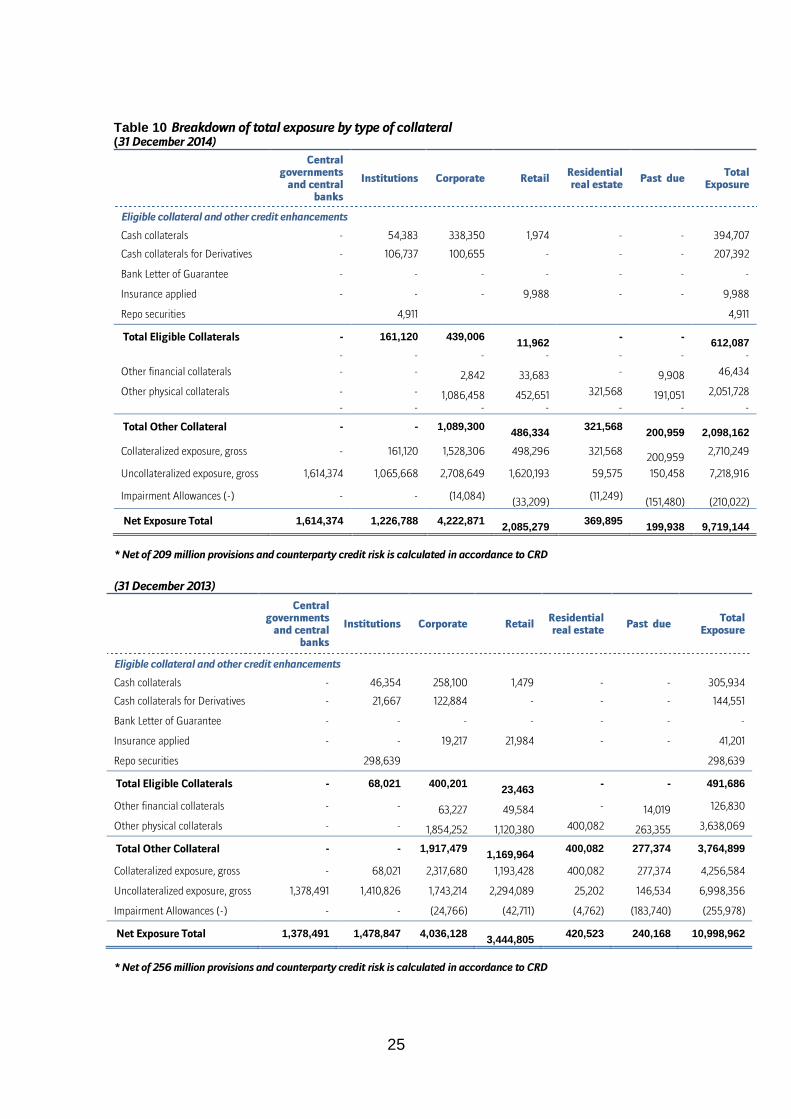
25
Table 10 Breakdown of total exposure by type of collateral (31 December 2014)
Central governments and central
banks
Institutions Corporate Retail Residential real estate
Past due Total
Exposure
Eligible collateral and other credit enhancements
Cash collaterals - 54,383 338,350 1,974 - - 394,707
Cash collaterals for Derivatives - 106,737 100,655 - - - 207,392
Bank Letter of Guarantee - - - - - - -
Insurance applied - - - 9,988 - - 9,988
Repo securities
4,911
4,911
Total Eligible Collaterals - 161,120 439,006 11,962 - -
612,087
- - - - - - -
Other financial collaterals - - 2,842 33,683 - 9,908 46,434
Other physical collaterals - - 1,086,458 452,651 321,568 191,051 2,051,728
- - - - - - -
Total Other Collateral - - 1,089,300 486,334 321,568
200,959
2,098,162
Collateralized exposure, gross - 161,120 1,528,306 498,296 321,568
200,959 2,710,249
Uncollateralized exposure, gross 1,614,374 1,065,668 2,708,649 1,620,193 59,575 150,458 7,218,916
Impairment Allowances (-) - - (14,084)
(33,209) (11,249)
(151,480)
(210,022)
Net Exposure Total 1,614,374 1,226,788 4,222,871 2,085,279 369,895
199,938
9,719,144 * Net of 209 million provisions and counterparty credit risk is calculated in accordance to CRD
(31 December 2013)
Central governments and central
banks
Institutions Corporate Retail Residential real estate
Past due Total
Exposure
Eligible collateral and other credit enhancements
Cash collaterals - 46,354 258,100 1,479 - - 305,934
Cash collaterals for Derivatives - 21,667 122,884 - - - 144,551
Bank Letter of Guarantee - - - - - - -
Insurance applied - - 19,217 21,984 - - 41,201
Repo securities
298,639
298,639
Total Eligible Collaterals - 68,021 400,201 23,463 - - 491,686
Other financial collaterals - - 63,227 49,584 - 14,019 126,830
Other physical collaterals - - 1,854,252 1,120,380 400,082 263,355 3,638,069
Total Other Collateral - - 1,917,479 1,169,964 400,082 277,374 3,764,899
Collateralized exposure, gross - 68,021 2,317,680 1,193,428 400,082 277,374 4,256,584
Uncollateralized exposure, gross 1,378,491 1,410,826 1,743,214 2,294,089 25,202 146,534 6,998,356
Impairment Allowances (-) - - (24,766) (42,711) (4,762) (183,740) (255,978)
Net Exposure Total 1,378,491 1,478,847 4,036,128 3,444,805 420,523 240,168 10,998,962
* Net of 256 million provisions and counterparty credit risk is calculated in accordance to CRD
26
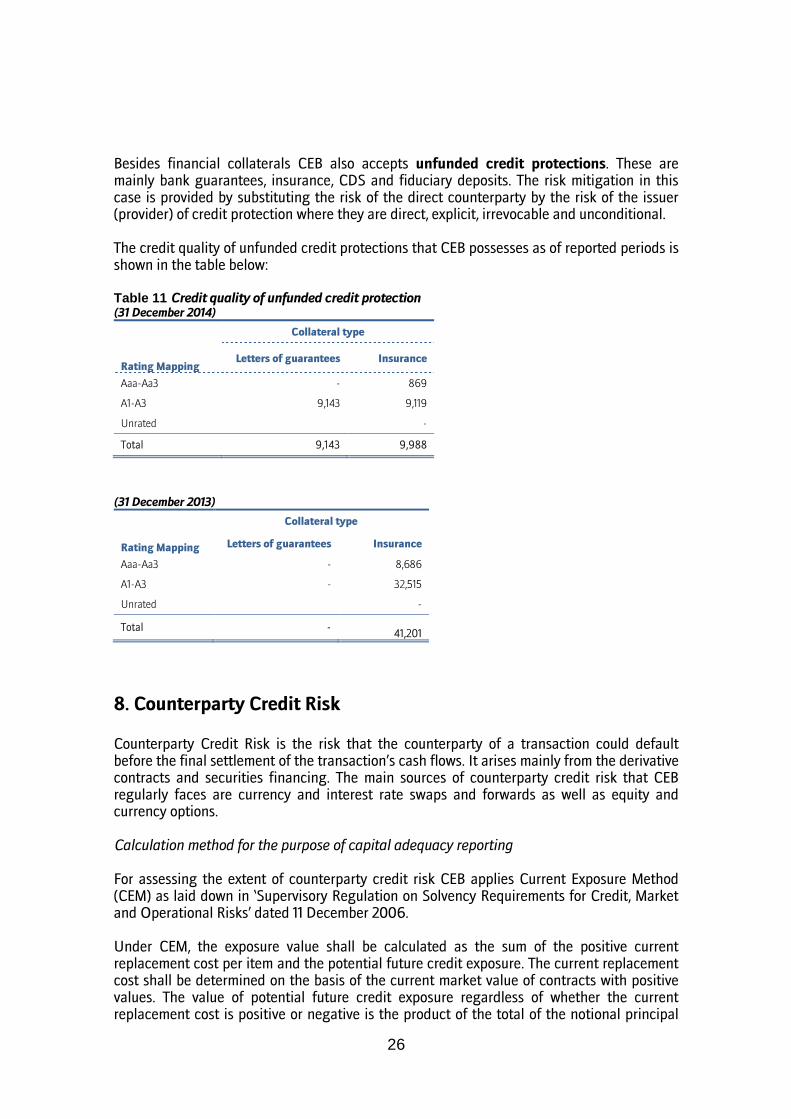
Besides financial collaterals CEB also accepts unfunded credit protections. These are mainly bank guarantees, insurance, CDS and fiduciary deposits. The risk mitigation in this case is provided by substituting the risk of the direct counterparty by the risk of the issuer (provider) of credit protection where they are direct, explicit, irrevocable and unconditional. The credit quality of unfunded credit protections that CEB possesses as of reported periods is shown in the table below: Table 11 Credit quality of unfunded credit protection (31 December 2014)
Rating Mapping
Collateral type
Letters of guarantees Insurance
Aaa-Aa3 - 869
A1-A3 9,143 9,119
Unrated
-
Total 9,143 9,988
(31 December 2013)
Rating Mapping
Collateral type
Letters of guarantees Insurance
Aaa-Aa3 - 8,686
A1-A3 - 32,515
Unrated
-
Total -
41,201
8. Counterparty Credit Risk Counterparty Credit Risk is the risk that the counterparty of a transaction could default before the final settlement of the transaction’s cash flows. It arises mainly from the derivative contracts and securities financing. The main sources of counterparty credit risk that CEB regularly faces are currency and interest rate swaps and forwards as well as equity and currency options. Calculation method for the purpose of capital adequacy reporting For assessing the extent of counterparty credit risk CEB applies Current Exposure Method (CEM) as laid down in ‘Supervisory Regulation on Solvency Requirements for Credit, Market and Operational Risks’ dated 11 December 2006. Under CEM, the exposure value shall be calculated as the sum of the positive current replacement cost per item and the potential future credit exposure. The current replacement cost shall be determined on the basis of the current market value of contracts with positive values. The value of potential future credit exposure regardless of whether the current replacement cost is positive or negative is the product of the total of the notional principal
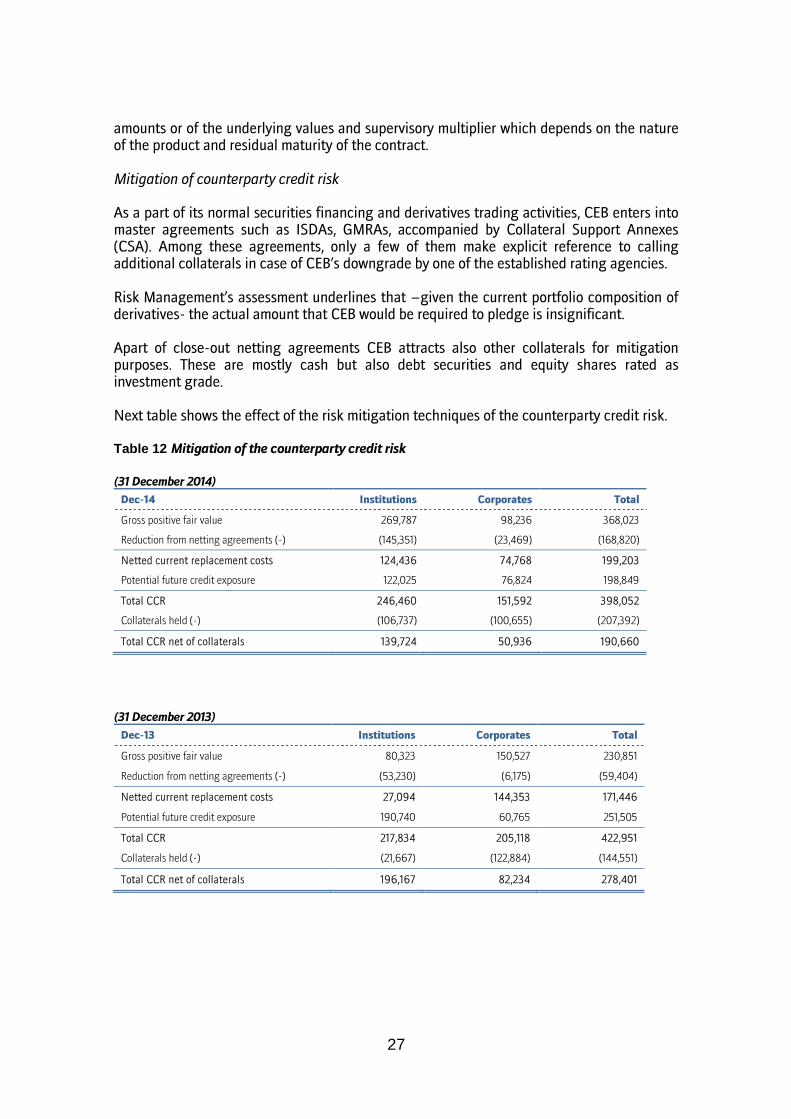
27
amounts or of the underlying values and supervisory multiplier which depends on the nature of the product and residual maturity of the contract. Mitigation of counterparty credit risk As a part of its normal securities financing and derivatives trading activities, CEB enters into master agreements such as ISDAs, GMRAs, accompanied by Collateral Support Annexes (CSA). Among these agreements, only a few of them make explicit reference to calling additional collaterals in case of CEB’s downgrade by one of the established rating agencies. Risk Management’s assessment underlines that –given the current portfolio composition of derivatives- the actual amount that CEB would be required to pledge is insignificant. Apart of close-out netting agreements CEB attracts also other collaterals for mitigation purposes. These are mostly cash but also debt securities and equity shares rated as investment grade. Next table shows the effect of the risk mitigation techniques of the counterparty credit risk. Table 12 Mitigation of the counterparty credit risk
(31 December 2014)
Dec-14 Institutions Corporates Total
Gross positive fair value 269,787 98,236 368,023
Reduction from netting agreements (-) (145,351) (23,469) (168,820)
Netted current replacement costs 124,436 74,768 199,203
Potential future credit exposure 122,025 76,824 198,849
Total CCR 246,460 151,592 398,052
Collaterals held (-) (106,737) (100,655) (207,392)
Total CCR net of collaterals 139,724 50,936 190,660
(31 December 2013)
Dec-13 Institutions Corporates Total
Gross positive fair value 80,323 150,527 230,851
Reduction from netting agreements (-) (53,230) (6,175) (59,404)
Netted current replacement costs 27,094 144,353 171,446
Potential future credit exposure 190,740 60,765 251,505
Total CCR 217,834 205,118 422,951
Collaterals held (-) (21,667) (122,884) (144,551)
Total CCR net of collaterals 196,167 82,234 278,401
28
9. Operational Risk
Operational risk is the risk of loss resulting from inadequate or failed internal processes, people and systems, or from external events, including legal and outsourcing risk but excluding business, strategy and reputational risk. Starting from 2012, CEB applies standardized approach for operational risk calculation. Under Standardized approach, the capital requirement for operational risk is calculated as the sum of the relevant indicators for different business line listed in table 1 in Article 3:4 in the regulation multiplied by relevant percentage. CEB classified its portfolio into below categories
Trading and sales 18%
Commercial banking 15%
Retail banking 12% The three-year average is calculated on the basis of the year-end audited figures. The gross income includes following items: Net interest Income: Interest receivable and similar income Interest payable and similar charges Net Non-interest income: Income from equities and other securities Net fees and commissions received and paid Net profit or net loss on financial transactions Other operating income The following items shall not be included Realized profits/losses on the sale of financial instruments in the non-trading book Income from extraordinary or irregular items Income from insurance policies
10. Market Risk
Market risk is defined as the current or prospective threat to CEB’s earnings and capital as a result of adverse movements in market prices (security and derivative prices, as well as interest rates and foreign exchange rates) or in parameters such as volatility and correlations. The trading portfolio includes financial instruments such as securities, derivatives and FI loans, which are exposed to short-term price/interest-rate fluctuations. Eligible positions should be in line with the guidelines and principles set out in the Market Risk Policy. No eligible positions and financial instruments approved by ALCO are monitored within the scope of the banking book. In line with its business plan, CEB has ‘minor’ risk appetite in market risk.
CEB aims at regularly measuring and monitoring its market risk associated with adverse market movements affecting the trading components of its treasury and FI portfolio. It measures its market risk using different approaches, both standard and internal models.
29
CEB’s risk tolerance in the form of limits is determined to manage market risk efficiently and to keep market risk within these limits. Risk limits, such as VaR limit, notional limits and sensitivity limits, are set by considering the primary risk factors. In case of a limit breach, ALCO is convened to determine strategy and take necessary actions to restore the outstanding exposure to within limits in a certain period of time. CEB measures the market risk of its trading book and the foreign-exchange risk of its banking book using an internal model, based on VaR methodology. VaR defines the maximum loss not exceeded by a given probability over a given period of time under normal market conditions. However, this approach fails to capture exceptional losses under extreme market conditions; that is why market risk measurement is complemented by periodic stress-testing analyses.
The internal VaR model is used only for risk monitoring purposes and not for regulatory capital purposes. Regulatory capital for market risk is calculated and reported quarterly according to the Standard Approach as specified in the market risk regulations of the Dutch Central Bank. Other market risks, such as liquidity and interest-rate risk, on the banking book are measured and monitored through sensitivity and gap analyses, detailed in subsequent sections.
Value-at-risk figures – Trading Book (2014) Total Diversification effect
Interest-rate risk
Foreign-exchange risk
Average 1,075 - 1,156 126 Maximum 2,655 - 2,692 400 Minimum 95 - 82 12 Period-end 160 - 155 12
(*) Starting from January 2013, the Bank measures the market risk of its trading book and the foreign-exchange risk of its banking book by using an internal historical simulation method while the Monte Carlo simulations method was in place, formerly. As of the year 2013, for the Bank diversification effect is not applicable anymore.
Value-at-risk figures – Trading Book (2013) Total Diversification effect
Interest-rate risk
Foreign-exchange risk
Average 1,317 - 109 1,026 Maximum 3,377 - 1,005 2,640 Minimum 130 - - 33 Period-end 1,200 - 226 974
11. Interest Rate Risk CEB defines interest rate risk as the current or prospective risk to earnings and capital arising from adverse movements in interest rates. Subsidiaries are not allowed to carry interest rate positions and expected to transfer their positions to the parent bank where
centralized ALM and funding principles are in place. CEB has a “limited” risk tolerance towards interest rate risk in its banking book.
For the Repricing Gap any mismatch exceeding 15% of the total own funds, at maturities longer than 6 months, is hedged, unless otherwise approved by ALCO. Treasury and ALCO does closely follow-up the interest-rate sensitivity of each currency on duration basis. For the
30
maturity Gap the consolidated Gap shouldn’t be negative for the first 6 months unless otherwise approved by ALCO.
12. Liquidity Risk
CEB runs internal tests to verify that its unencumbered, high-quality liquid assets are sufficient to cover urgent liquidity demand in a short time frame. Risk Management measures and monitors the size and composition of CEB’s core, high quality liquid assets for short and medium time horizons with respect to the stress-testing outcome.
CEB defines short term horizon up to 1 month. In this framework, the definition of available liquidity is very narrow in the sense that contractual inflows within this timeframe are almost totally disregarded. Up to 1 month, CEB has the capacity to meet all contractual and non-contractual liquidity demands under a severe scenario, by simply relying on its core liquid assets.
The medium time horizon refers to ‘up to 3 months, where CEB tests and makes sure that its survival period is longer than three months. In this methodology, all contractual cash flows are taken into account after applying severe run-off and roll-over rates for liabilities and assets, respectively.
Liquidity Buffer Composition (Time horizon: O/N, 1 week, 1 month and 3 months)
• Different time-to-liquidity assumptions for each asset class
• Elevated central bank haircut ratios
• Marked-to-market losses on securities portfolio
• No dependency on wholesale funding from financial institutions and central banks
(i.e. 100% run-off)
• Rapid withdrawal of CEB’s ‘non-core’ current account deposits and corporate time
deposits.
• Non-marketable assets are disregarded.
Liquidity Buffer – O/N
CEB measures its O/N counterbalancing capacity based on the following items;
• Cash
• Central bank reserves in excess of minimum reserve requirement
• Nostro balances in excess of margins held
• unencumbered marketable securities (ECB eligible)
• ECB-eligible securities which will be repurchased within 1 day (maturing repo)
• Net interbank position (O/N)
The definition of unencumbered assets is only confined to ECB-eligible securities, while the rest of the security portfolio is disregarded due to time-to-liquidity concerns. CEB assumes neither its interbank borrowings nor its placements at the O/N market will be rolled over. CEB assumes withdrawal of its ‘non-core’ current account balances and corporate time deposits.

31
Liquidity Buffer – 1 week Regarding the ‘up to 1 week’ time bucket, on top of the items mentioned under O/N liquidity buffer, we assume that CEB will be able generate liquidity through refinancing eligible securities with local central banks. In other words, CEB’s unencumbered assets now includes all (E)CB-eligible securities within 1-week time horizon. Other securities, which CEB can only refinance in the money market, are still not taken into account, assuming the that time-to-liquidity can be longer than one week for this class of securities.
Liquidity Buffer – 1 month
CEB measures its liquidity buffer up to 1 month similar to preceding maturities, but includes other securities (non-E(CB)-eligible) into its unencumbered asset assessment. We assume that CEB will be able to refinance these securities in the money market between 1-week and 1-month (time-to-liquidity). That said, based on the internal guidelines deep hypothetical haircuts applied on these assets.
Liquidity Buffer – 3 months
From a cash flow perspective CEB’s liquidity buffer up to 1 month is restricted to the inflows coming from interbank market and excludes all other types of incoming funds. That said, we anticipate reimbursements –albeit limited- from other type of receivables, such as maturing loans to customers. In principle, we expect lower roll-over rates (or higher inflows) in retail loan and trade finance segments, while relatively higher roll-over (or lower inflows) in corporate and SME loan segments.
STRESS-TESTS CEB aims to maintain a buffer above a predefined minimum required liquidity level to withstand a very severe liquidity stress scenario. This scenario plays a major role in defining the Bank’s risk appetite and it reflects the nature of CEB’s activities, concentrations and funding dynamics. CEB ensures that its liquidity buffer is always above the outcome this ‘combined’ stress scenario at all times. CEB updates the figures in its stress testing on a monthly basis and compares its available liquidity buffer with this ‘minimum’ on a daily basis. The Components of CEB’s Stress Testing Framework CEB’s scenarios combine the effects of institution-specific liquidity problems (run-on-the bank) and market-specific incidents (declining security values, higher haircuts, margin calls on derivatives, etc.) Institution-specific components The run-off of retail funding CEB’s funding plan relies on geographically-diversified and granular deposit base and for this very reason, a run-off of retail deposits forms a major part of CEB’s stress testing framework, both qualitatively and quantitatively. CEB puts special emphasis on credit-sensitive deposits with ‘on-demand’ characteristics, saving accounts in particular.
The run-off of unsecured wholesale funding CEB’s internal guidance assumes all unsecured wholesale funding from financial institutions and central banks will be fully paid back (i.e., 100% run-off) as described under section 0. That said, CEB treats deposits from ‘corporate clients’ similar to retail funding, considering their granular structure and their transactional/operational relationship with CEB (i.e., these clients are mostly depositors to and borrowers from the Bank). The run-off of corporate
32
deposits are recognized as ‘deduction’ or negative ‘correction’ item in CEB’s liquidity buffer definition. Other institution-specific components CEB’s stress testing framework considers other possible sources of institution specific liquidity drains as either insignificant or not applicable:
• CEB does not offer committed liquidity facilities to third parties or its subsidiaries.
Committed credit lines are predominantly in the form self-liquidating trade finance
transactions; therefore we do not foresee material liquidity outflows thereof.
• CEB does not have conduit activities and off-balance sheet activities, which may
absorb its liquidity.
• CEB does not enter into complex products/transactions.
• Considering CEB’s non-investment grade rating, we do not foresee any liquidity
outflow due to any future downgrade of the Bank. Likewise, we do not foresee
material margin calls, in case of CEB being downgraded.
• CEB’s stress scenario fully disregards any availability of ‘unsecured’ wholesale
funding.
Market-specific components Erosion of the value of liquid assets CEB adapted EU Wide Stress (2011) adverse scenario regarding the calculation of erosion of the value of liquid assets as a result of changes in macro-economic conditions. Parameters declared by ECB have been multiplied by three for all zones except EUR zone securities. Higher official haircuts applied by Central Banks CEB considers two extreme scenarios regarding the haircut applied by ECB to the eligible securities. For of all the ECB eligible securities in Treasury’s the current ECB valuation haircuts are increased with nominal of 5%. In a second alternative stress test scenario, the current valuation haircut is doubled. All the haircuts values (actual or increased) are applied to the EUR equivalent value of the MTM amounts of the outstanding amounts. Out of the two stress scenarios, the one with a higher impact (thus the one that would cause a deeper loss in the collateral value of the ECB eligible portfolio) is included in the calculation of the stress scenario impact. Additional margin calls and collateral requirements Additional margin call and collateral requirements are calculated with ‘Historical Lookback’ method. (EBA/RTS/2014/05). For all derivatives net positive inflow of collaterals is collected for each day in the preceding two years. Then, the largest difference in net collaterals within consecutive periods of 30 days during the two years preceding the date of the outflow calculation is considered as the additional margin call and collateral requirement amount.

33
The Utilization of Stress-Test Results CEB Risk Management compares the Bank’s available liquidity buffer (both on solo and consolidated levels) against the stress-test results on daily basis. CEB aims to maintain its available liquidity buffer above the stress-test result at all times. In other words, the surplus liquidity showing the difference between the two must be a positive figure. The results are distributed to ALCO members showing the level, composition and location of the available liquidity buffer. In case the available liquidity buffer falls below the minimum required level imposed by the stress scenario, the incident is also communicated with the Audit & Risk Committee.