Phytotoxic action of Endoconidiophora fagacearum Bretz
108
Retrospective eses and Dissertations Iowa State University Capstones, eses and Dissertations 1958 Phytotoxic action of Endoconidiophora fagacearum Bretz Michael George Boyer Iowa State College Follow this and additional works at: hps://lib.dr.iastate.edu/rtd Part of the Botany Commons is Dissertation is brought to you for free and open access by the Iowa State University Capstones, eses and Dissertations at Iowa State University Digital Repository. It has been accepted for inclusion in Retrospective eses and Dissertations by an authorized administrator of Iowa State University Digital Repository. For more information, please contact [email protected]. Recommended Citation Boyer, Michael George, "Phytotoxic action of Endoconidiophora fagacearum Bretz " (1958). Retrospective eses and Dissertations. 2246. hps://lib.dr.iastate.edu/rtd/2246
Transcript of Phytotoxic action of Endoconidiophora fagacearum Bretz

Retrospective Theses and Dissertations Iowa State University Capstones, Theses andDissertations
1958
Phytotoxic action of Endoconidiophorafagacearum BretzMichael George BoyerIowa State College
Follow this and additional works at: https://lib.dr.iastate.edu/rtd
Part of the Botany Commons
This Dissertation is brought to you for free and open access by the Iowa State University Capstones, Theses and Dissertations at Iowa State UniversityDigital Repository. It has been accepted for inclusion in Retrospective Theses and Dissertations by an authorized administrator of Iowa State UniversityDigital Repository. For more information, please contact [email protected].
Recommended CitationBoyer, Michael George, "Phytotoxic action of Endoconidiophora fagacearum Bretz " (1958). Retrospective Theses and Dissertations.2246.https://lib.dr.iastate.edu/rtd/2246

PHYTOTOXIC ACTION OF ENDOCONIDIOPHORA FAGACEARUM 3RETZ
by
Michael George Boyer
A Dissertation Submitted to the
Graduate Faculty in Partial Fulfillment of
The Requirements for the Degree of
DOCTOR OF PHILOSOPHY
Major Subject: Plant Pathology
Approved:
In Charge of Major W k
Head of Major Department
Dean of Graduate College
Iowa State College
1958
Signature was redacted for privacy.
Signature was redacted for privacy.
Signature was redacted for privacy.

il
TABLE OF CONTENTS
Page
INTRODUCTION 1
RE VIEW OF LITERATURE 3
Tyloses and Their Role in Wilt Diseases 3 Wilt Disease Toxins 6
GENERAL METHODS 9
Induction and Measurement of Tyloses in Red Oak . 9 Analyses of Sap and Sapwood 13 Leaf Symptoms and Chemical Analyses 21 Chromatographic Procedures 23 In Vitro Studies on Endoconidlophora
fagacearum Bretz 24
Culture medium 24 Inoculation of cultures and measurement
of growth 25 Measurement of growth promoting substances . 26
RESULTS AND DISCUSSION 29
Aspects of Red Oak Physiology in Relation to Tylosis Formation 29
Movement of sap in xylem of diseased and healthy red oak. .... . 29
Effect of reduced transpiration and drought conditions on tylosis formation in red oak 31
Distribution and spread of tyloses in wounded red oak 32
Prevention of tyloses at the wound site. . . 33 Seasonal response to wounding In red oak . . 34
Attempts at Characterization of the Mechanism of Tylosis Induction 35
Effect of girdling to the cambium on tylosis formation 36
Comparison of diseased and healthy sapwood constituents 36
Effect of sapwood extracts on tylosis formation 41

ill
Page
Chromatographic Analyses of Sap from Diseased and Healthy Red Oak 44
Normal constituents of healthy red oak sap . 45 Constituents of vessels of diseased red oak. 48
Leaf Symptoms on Diseased Red Oak 50
Comparative rates of sap flow in healthy and diseased red oak 50
Distribution and rate of spread of leaf symptoms. . . 52
Distribution of E. fagacearum in leaves in relation to leaf symptoms 55
Chromatographic and analytical comparisons of diseased and healthy red oak leaves . . 56
Flavonoid and phenolic constituents . . 57 Normal metabolic constituents 63 Starch accumulation in diseased leaves. 65 Chemical analyses of leaves 66
Metabolism and Metabolic Products of E. fagacearum 68
Effect of certain phenols on growth in vitro of E. fagacearum 68
Effect of culture filtrates on tylosis formation in red oak 68
Presence of growth promoting substances in culture filtrates 75
Toxicity of culture filtrates to red oak leaves 78
Fractionation of culture filtrates 79
The alcohol insoluble fraction 79 The ether soluble fraction 84 The cation fraction 89 Isolation of toxic substances by
steam distillation 90 Other metabolites in culture filtrates. 92
GENERAL DISCUSSION AND CONCLUSIONS 96
LITERATURE CITED 99
ACKNOWLEDGEMENTS 104

1
INTRODUCTION
Vascular diseases of plants are, at the present time, the
subject of intensive physiological and biochemical studies.
The interest shown in these diseases does not stem from
economic considerations alone, for fundamental to the ulti
mate goals of pathology is the urgent requirement for a more
basic knowledge of parasitism and its causes. In this re
spect wilt diseases are unusual. They offer to the path
ologist an opportunity to investigate a distinct pathologi
cal relationship unhampered by the complexities attendant
upon the more intricate parasitic interactions common to the
majority of plant diseases.
Endoconidiophora fagacearum Bretz, the causal organism
of oak wilt, in common with other wilt pathogens, is confined
until death of the host to the large non-living vessels of
the xylem. Symptom expression generally arises as a result
of such an association. In explanation of this, a. tenable
theory presupposes the existence of specific toxins released
in the xylem by parasite or host and transported passively
to a site of action in the living cell. On the basis of
present evidence, however, the possibility also exists that
symptoms arise as a result of secondary effects less directly
linked to the metabolic activity of the pathogen.
It was the basic intent of this study to clarify and

2
characterize the mechanism of symptom development in oak
wilt in relation to these two theories.

3
REVIEW OF LITERATURE
Tyloses and Their Role in Wilt Diseases
Basic studies on host parasite interactions in the oak
wilt disease have centered around the extensive formation
of tyloses in xylem vessels of diseased oak (Beckman et al.
1953b) . Although a pronounced symptom of the wilt disease,
tyloses are found in most species of the genus, Quercus
(Williams 1942), arising from other causes such as drought,
wounding, or senesence. Therefore, they are by no means
diagnostic for this disease. Tylosis formation has also
been observed as a widespread physiological phenomenon in
many families of plants (Chattaway 1949; Chrysler 1908;
Gerry 1914).
Arising as a consequence of vascular infection, tyloses
have been found in watermelon (Sleeth 1933), grape (Esau 1949),
tobacco (Powers 19 54) and other plants (Clinton and McCormick
1936; van der Meer 1926)• However, their occurrence in cer
tain vascular diseases is probably not pronounced enough to
account for wilting except in the case of oak wilt. In this
disease tylosis formation is so extensive and rapid it is
assumed to be the primary cause of wilting (Beckman et al.
1953b)•
While tyloses are known to be hypertrophic prolifera
tions through the pit adjoining parenchymatous ray cells with
4
vessel segments or tracheitis (Esau 1949; Kuster 1925), evi
dence as to their fundamental cause is fragmentary. Accord
ing to Haberlandt (1921), tyloses arise in response to secre
tion of wound hormones by living cells. Isolation of a wound
hormone-like substance from dried bean pods (Haberlandt 1921)
and its subsequent identification as traumatic acid (English
et al. 19-39) have lent support to this theory. This acid
has never been tested as a tylosis inducing agent. The
restricted number of plants in which it induces any healing
response, however, has cast serious doubt on the validity of
its interpretation as a wound hormone or growth regulator
(Bonner and English 1938; Davis 1949).
Exposure to oxygen as a result of wounding has also
been proposed as a cause of tylosis formation (Klein 1923).
The former hypothesis appears to be more widely accepted
although naturally occurring wound hormones, other than
traumatic acid, have neither been characterized nor definitely
established (Block 1952).
Evidence of the part played by pathogens in inciting
tylosis formation is indirect. Using radio-active rubidium,
the close correlation that exists in diseased red oaks be
tween infection, incipient wilting, decline in the rate of
water movement and formation of tyloses was demonstrated
(Beckman ejt al. 1953b). As a consequence of this work and
anatomical studies (Struckmyer et al. 1954), tyloses were

5
postulated, to be the major cause of vascular plugging in
diseased red oak. It was also suggested that they could
arise through action of specific substances produced by
E. fagacearum. More recent investigations have demonstrated
the existence of growth stimulants in culture filtrates of
this organism (Fergus and Wharton 195?).
Evidence that tyloses s rise through stimulation by
metabolic products of the host has also been presented (Powers
1954). Tobacco plants infected with Phytophthora parasitic!
Dast. form tyloses but the response was initiated not by the
parasite, but by products of host cells as a. result of in
fection or wounding.
While the ability of several compounds to stimulate
wound healing has been investigated (Brown and Cormack 1937;
Davis 1949; LaRue 1941), apparently there has been no investi
gation of their effect on tylosis formation, although the
latter is a wound response and a common growth phenomenon.
Tne theory that accumulation of SH-contalning compounds is
positively correlated with wound healing responses (Hammet
and Chapman 1938), has been partly confirmed (Davis 1949).
Cysteine hydrochloride and glutathione, both sulfhydryl com
pounds, were found to stimulate wound healing in several
species of plants. These appear to be of more universal
application in this regard than any of the more specific
growth regulators.
6
Wilt Disease Toxins
While toxins, or vivotoxins (Dimond and Waggoner 1953a)
have long been implicated in the wilt disease syndrome
(Hutchinson 1913), unequivocal evidence of their existence
in vivo had not been established until recently (Dimond and
Waggoner 1953b; Gaumann 1957). Since the last comprehensive
review of wilt induction (Dimond 1955), a wide variety of
metabolic products have been implicated, particularly with
reference to tomato wilt (Gaumann 1957) . Formation arid func
tion of some of these substances are well understood (Dimond ii
and Waggoner 1953b; Gaumann 1957) . Many other compounds,
fusarinic acid (Yabuta et al. 1934), lycomarasmin (Gaumann
1951), and lateritun I ( Gaumann et_ al. 1947; Cook eft al.
1947) are less perfectly known. Through these discoveries
the postulated mechanism of action of toxins in wilt diseases
has been modified to incorporate interactions of all these
compounds in the wilt syndrome (Gaumann 1957). The solution
to this problem has therefore become infinitely more complex.
In addition to certain chemically characterized com
pounds which induce various aspects of the wilt disease,
higher molecular weight substances such as fungus-synthesized
polysaccharides ( Hodgson et jsl. 1949) and gums (Bewley 1922;
Rosen 1926; Struckmyer ert al. 1954) have been implicated as
physical agents in occlusion of vessel segments. Enzymes
such as pectin methyl esterase induce vascular browning

7
( Gothoskar et al. 1953; Van s te ad and Walker 1954) and in
conjunction with polygalacturonase and depolymerase probably
break down cell wall constituents to yield pectic derivatives
active in plugging the xylem (Waggoner and Dimond 1955). In
addition to these enzymes, B-glycosidase has also been assign
ed a role in the wilt syndrome. Acting in conjunction with
polyphenol oxidase it could account for vascular browning
through hydrolysis and polymerization of phenolic constitu
ents of the cell wall (Davis and Dimond 1954) .
The role of mycelium and spores in physical obstruction
of water flow has been questioned. Generally more vessels
have been found free of mycelium than colonized in diseased
plants (Brandes 1919; Rudolph 1922). Therefore it has been
assumed they play only a minor role in wilt induction.
Toxins have also been implicated in vascular diseases
of woody plants. When small elm trees were inoculated with
fungus free culture filtrates of Ceratostomella ulmi Buisman,
typical symptoms of Dutch elm disease were induced (Zentmyer
1942) . Culture filtrates of this organism were fractionated
into two toxic components, an alcohol insoluble polysaccharide
and an unidentified ether soluble substance (Dimond et si.
1949) . Both fractions induced different aspects of the
disease. Using the same procedure similar substances from
culture filtrates of E. fagacearum were isolated (White
1955). Other studies on this organism in vitro (Hoffman 1954;

8
Young 1949) resulted in demonstration of toxic substances.
However, no evidence has been presented supporting existence
of these compounds in vivo.

9
GENERAL METHODS
All studies involving physiology of oak,1 tylosis in
duction, and host parasite relationships were carried out at
the Iowa State Conservation Commission Nursery, Ames, Iowa
or at Pilot Knob State Park, Forest City, Iowa.
Induction and Measurement of Tyloses in Red Oak
At the pre se.time there is no evidence that tylosis
formation arises in all- cases from a universal, fundamental
cause. Inducement through wounding, senescence, drought or
disease suggests a common cause only inasmuch as it involves
a disturbance of normal metabolic processes through cessation
of normal sap flow. However, any information which could be
obtained on aspects of tylosis formation, from whatever the
cause, would ultimately prove helpful. In addition it was
desirable to develop some method involving tylosis induction
whereby metabolic products of both host and pathogen could be
assayed for their ability to induce this specific response
in the host. Therefore several experiments were performed
to determine the response of red oak to wounding and to vari
ous chemical treatments.
^The trees used in these studies were predominantly northern pin oak (Quereus ellipsoïdales Hill)• However no distinction was made between this species and northern red oak (Quereus borealls Michx.) or between their hybrids. The group is designated red oak throughout this study.
10
A standardized method was used in order that wound re
sponse could be placed on a semi-quantitative basis. Mature,
healthy red oaks free from observable defects, were wounded
by drilling two holes, separated by a vertical distance of
10 cm, into the bole of the tree by means of a brace and
one-inch bit. Depending on the diameter, three to 10 pairs
were drilled in each tree at waist height.
To observe the effects of wounding, sample cores were
withdrawn with a Swedish increment borer from the midpoint
of a vertical line joining the two holes, 36 to 48 hours
after wounding. The cores were then stored in 90 per cent
ethanol until examined for tyloses.
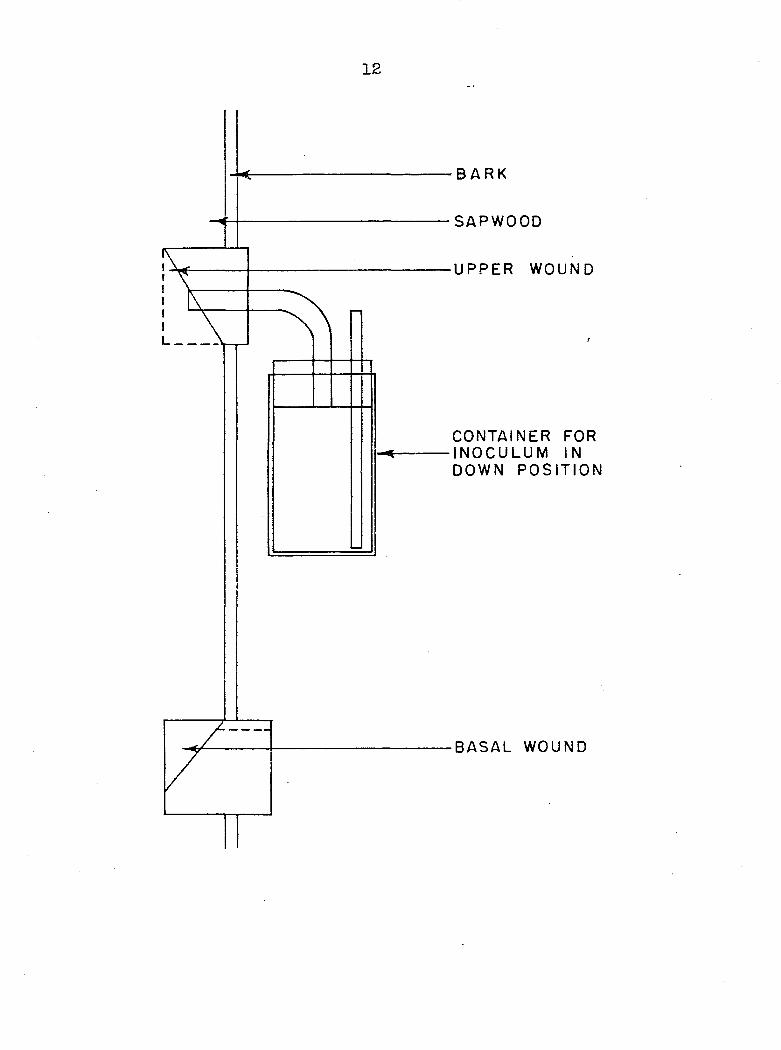
Various chemicals were tested for their effect on tyloses
by injecting them into the vessels (Figure 1). By this means
it was possible to fill the vessel lumina with a solution,
seal it in, and after a given time interval withdraw a core
with the increment borer for observation. Prior tests with
a one per cent aqueous solution of crystal violet showed
that water movement occurred initially through vessels of
the current year's ring. However, due to the method that
was used it was not possible to place the amount of solution
taken up on a per vessel basis. Where movement of the test
solutions through vessels did not take place immediately,
due to air pockets, a small atomizer bulb attached to the
air inlet on the container (Figure 1), was used to initiate
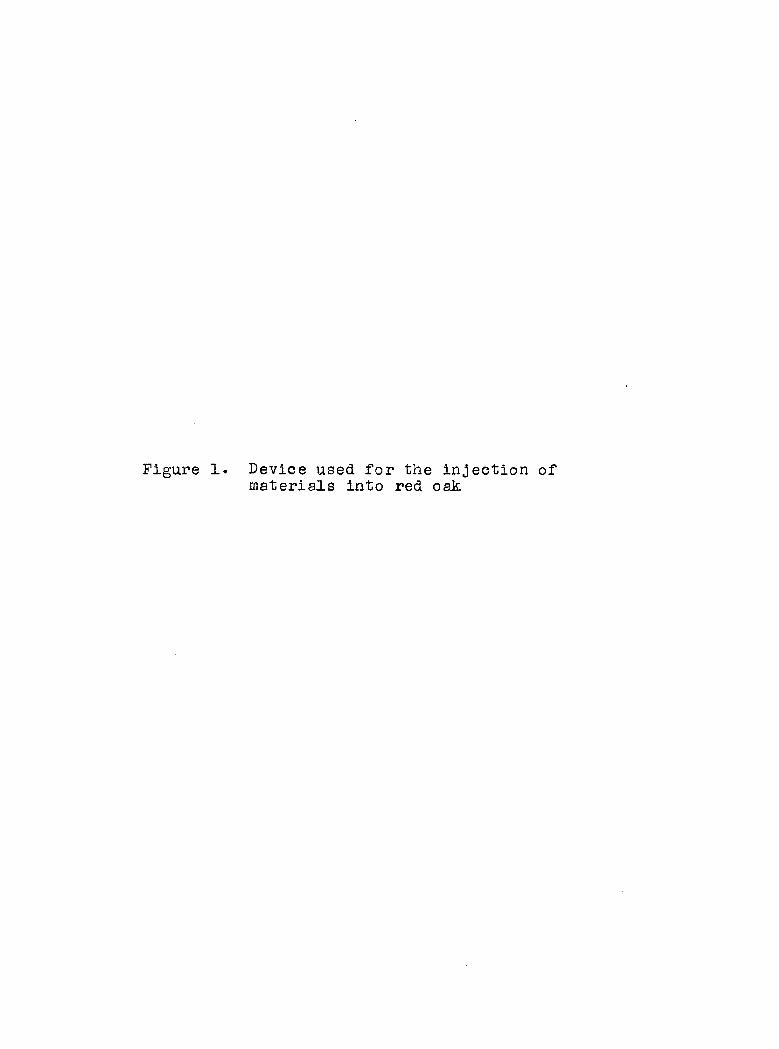
Figure 1. Device used for the injection of materials into red oak
12
B A R K
SAPWOOD
UPPER WOUND
l
CONTAINER FOR INOCULUM IN DOWN POSIT ION
BASAL WOUND
13
flow.
To measure the extent to which vessels were occluded by
tyloses, thin vertical sections from the current year's
growth ring were cut from the core and observed under a
calibrated binocular microscope. Vessel diameter was held
constant for any one tree and the degree to which it was
occluded by tyloses was expressed by a ratio R, such that
r = horizontal extent of tyloses diameter of the vessel
For any one sample, three vessel segments of equal diameter
were selected and 20 tyloses in each vessel were measured.
Tree to tree response varied considerably; therefore inter-
tree responses were not comparable.
Analyses of Sap and Sapwood
Diseased and healthy sap and sapwood were compared ss
an initial step toward interpretation of the mechanism of
wilting in diseased oak.
To study constituents of red oak sap initial attempts
were made to obtain sap in the spring of the year by tapping.
This method was not very successful although extended over a
period of several weeks prior to, during and after bud break.
A better procedure involved cutting young red oak twigs 20
cm long at the time the new growth ring was in the process
of formation. Ends of cut sections were rinsed thoroughly
in a stream of double distilled water. A hand atomizer was

14
connected by means of a rubber tube to one end of the twig
and the sap expressed under pressure. Generally one or two
drops were obtained from each twig. A 20 ml sample of the
exudate was collected and evaporated down to 5.0 ml. in vacuo
at 36°C• The concentrated sap was passed through a Dowex
50 x 8 cation exchange column in the hydrogen "cycle11. After
washing with 50 ml of distilled water, the cation fraction
was eluted with 50 ml of four per cent NH^OH, concentrated
to 5.0 ml and chromatographed. The combined neutral and
anion fractions were evaporated to 5.0 ml and passed through
a Dowex 1 x 10 anion exchange column in the chloride "cycle".
Elution was carried out with 50 ml of three per cent diethyla-
mine, after washing with 50 ml distilled water. The neutral
and anion fractions were concentrated to 5.0 ml and chromato-
graphed.
A different method was employed for diseased sap extrac
tion. Several 20 cm sections from two-year-old twigs of red
oak exhibiting advanced symptoms of the disease were washed
and attached to a vacuum pump by means of a rubber hose. The
free end was placed in a minimum of double distilled water
and under a vacuum of 15 lbs/square inch approximately 1.0
ml was drawn through. The extracted solution was concen
trated at 37°C in vacuo and chromatographed without further
treatment• This simplified procedure was employed because
nothing was known of the nature or stability of possible

15
toxic substances in diseased sap. During comparative studies
with healthy red oak sap the latter was obtained and treated
in an identical manner.
Sapwood samples from diseased and healthy trees were
obtained with a brace and one-inch bit. Bark, phloem and
heartwood were discarded when they became accidentally in
cluded in the sample. Diseased trees exhibited advanced
leaf symptoms and generally vascular browning, although the
latter phenomenon was not always observed. Samples were
placed in air tight containers and stored at -12°G until
extracted. Initial extraction procedures for isolation of
sapwood constituents were 50 per cent alcohol at room tempera
ture for 24 hours or cold distilled water at 5°C for 24 hours.
Because preliminary extraction with either water or water-
alcohol solutions resulted in isolation of a multitude of
substances, further fractionation was necessary to purifica
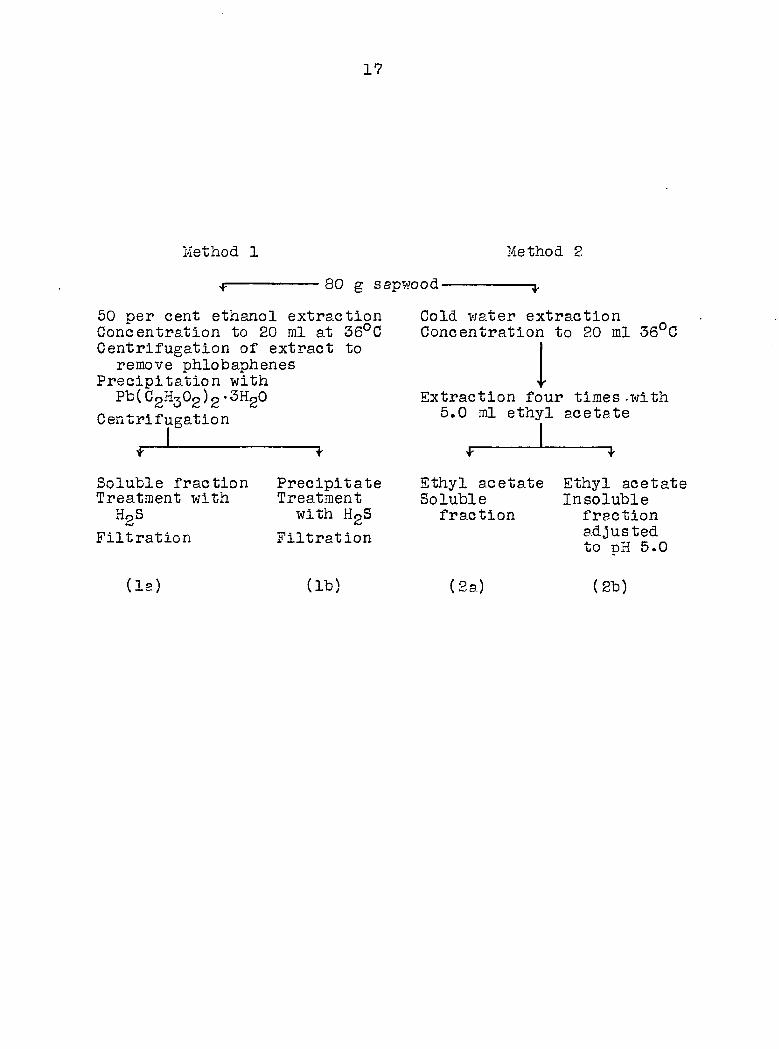
tion and identification by chromatographic means. A proce
dure for the isolation of specific substances following
extraction of sapwood (Figure 2) yielded four fractions
from diseased and healthy sapwood which could be compared
quantitatively and qualitatively by chromatography.
To study effects of various sapwood constituents on
tylosis formation a different procedure was utilized in
order to maintain the sapwood in a living condition as long
as possible. Sapwood samples were taken from healthy trees

Figure 2. Procedure for the fractionation of aqueous and alcoholic extracts of sapwood
17
Method 1 Method 2
80 g sapwood-
50 per cent ethanol extraction Concentration to 20 ml at 36°C Centrlfugation of extract to remove phlobaphenes
Precipitation with Pb(C2H302)2.3H20
Centrlfugation
Cold water extraction Concentration to 20 ml -36°C
I Extraction four times-with 5.0 ml ethyl acetate
Soluble fraction Treatment with
HgS
Filtration
Precipitate Treatment with H2S
Filtration
Ethyl acetate Soluble fraction
Ethyl acetate Insoluble fraction adjusted to pH 5.0
(la) (lb) (2a) (2b)

18
by the method outlined previously and immediately placed in
a container at 100 per cent relative humidity and 10°C for
two to four hours until the extraction procedure given below
was initiated. Sapwood samples taken in this manner are
designated herein as fresh sapwood.
Prior tests had indicated that the initial water soluble
constituents of healthy sapwood did not stimulate and appar
ently slightly inhibited the formation of tyloses. Also, it
was shown that if there was a substance responsible for
tylosis formation it was not formed immediately on wounding.
Consequently, it was desirable to isolate a consecutive
series of substances from the sapwood under conditions
approaching those found in the wounded tree. To do this a
continuous extractor was utilized (Figure 3). By this
method 20 g samples of fresh sapwood chips were weighed
rapidly and washed with distilled water. After draining,
the samples were placed in each of two glass columns, 3.5 cm
by 29 cm, and 10 ml of distilled water was added. By means
of compressed air, a continuous flow of water over the
samples was maintained at about 3.0 ml/minute. The bottom
of the extractor was immersed in an ice bath. The extrac
tives were withdrawn every two hours and replaced with equal
quantities of distilled water. By this means consecutive
samples could be withdrawn over an extended period of time.
Samples taken were held at 0°C until injected into red oak

Figure -3. Continuous extractor used to fractionate sapwood constituents
A- Column in which sapwood samples were placed
B• Compressed air inlet
C. Extractive reservoir
D • Ice bath
E. Drain for removing extractive

20
•A
•B

21
by the method indicated previously (Figure 1). The duplicate
sample was reserved for chromatographic analysis.
Leaf Symptoms and Chemical Analyses
For observation and analysis of diseased leaves, 23 young
20- to 25-year-old red oaks were selected which had been in
oculated artificially with E- fagacearum the previous year.
Branches from each tree were tagged and the leaves were
lettered alphabetically from the base. Observations of each
leaf were recorded over a period of 60 days. Leaf symptoms
were classified into four major groups :
Necrotic leaves - This symptom is identical in appearance
to that described as summer or bronze-leaf symptoms (Engelhard
1955). Leaves so affected exhibited marginal necrosis which
was delimited clearly from adjacent healthy tissue. Further
necrotic development in leaves of young red oak was extremely
slow. Characteristically, leaves exhibiting this symptom
showed no further change until late in the growing season
wnen within a period of a few days the leaves rapidly and
uniformly became browned.
Bronze leaves - This was a characteristic leaf symptom
on both young and mature diseased oaks. The leaves rapidly
became dry, brittle and often faded to a bronze-green color.
This appeared to be the result of an abrupt termination of
the xylem sap flow. This possibility was supported further

22
by the fact that it did not appear in conjunction with other
symptoms but typically was found affecting all leaves on a
given branch.
Dwarf leaves - This leaf symptom generally observed in
the spring has been described previously (Engelhard 1955;
Engelhard and Bragonier 1957). The leaves were small and
chlorotic but otherwise normal appearing. While a spring
leaf symptom in mature diseased oak, it was observed in young
oak as both a spring leaf symptom and later, after abscission
of diseased leaves, as a result of premature secondary out
growths of the axillary buds.
Chlorotic leaves - This symptom was characterized by
extreme mottling or yellowing of the leaf. In general all
leaves on diseased trees were paler than leaves from adja
cent healthy trees.
For analyses of leaf tissue, standard analytical and
chromatographic techniques were used. Total nitrogen was
determined by the micro-Kjeldahl method, starch by the method
of WidcLowson (1932), and phosphorous by a modification of the
Fiske-Subbarow method (Ward and Johnston 1953). Diseased
leaves for analytical and chromatographic analyses included
normal-appearing and chlorotic leaves. Necrotic, bronze, or
dwarf leaves were not used.

23
Chromatographic Procedures
In routine analysis by chromatography a general procedure
was adopted for study of various extractives. Chromatographic
separation of mixtures was carried out at room temperature
either by the ascending method on Whatman No. 1 or No. 3
paper, 8 1/2" by 8 1/2", or by the descending method on
similar paper, 5 1/211 by 14 1/2". After the appropriate
period of development, chromatograms were dried and exposed
to UV light, 320 mja, without treatment and after exposure to
NHg fumes, to observe color changes in fluorescent substances.
General chromogenie reagents and solvents are listed in
Table 1.
Scopoletin for chromatographic comparison was isolated
from oat seedlings, variety Victory (Goodwin and Kavanaugh
1949) . It was purified chromatographically in BAW followed
by elution and further chromatography with distilled water.
Its UV absoprtion spectrum maxima in the Beckman DU spectro
photometer were identical to those reported in the litera
ture ( Goodwin and Kavanaugh 1949).
To prepare 3,4,dimethoxy cinammic acid, 10 mg of a
methanolic solution of caffeic acid was made alkaline with
a saturated solution of NaOH in methanol. To this solution,
0-5 ml of methyl iodide was added and the reaction mixture
heated under reflux on a steam bath for 10 minutes. After
cooling, the solution was concentrated, filtered and banded

24
Table 1. Common re agents and solvents used in chromatro-graphic procedures
ferric chloride (FeClg) (Block et p. 228,
al. 1955)
ninhydrin (Consden 1848)
ammoniacal silver nitrate (ASN) (Block et p. 132,
al. ' 1955)
aniline hydrogen pthalate (AKP) (Block et p. 133,
al. ' 1955)
diazotized p-nitroaniline (DPNA) (Block et p. 228,
al. ' 1955)
phenol, 80 per cent (Aronoff 1956)
n-butanol, acetic acid, distilled water (BAW) 50:3:10 v/v
butyric acid, n-butanol, distilled water (BABW) 2:2:1 v/v ( Aronoff 1956)
on a descending chromatogram developed with SO per cent
phenol• The 3,4,dimethoxy cinnamic acid (Rf in 80 per cent
phenol 0.85) was detected under UV, eluted in 0.5 ml of water
and stored at 0°C for chromatographic comparisons.
In Vitro Studies on Endoconldiophora fagacearum Bretz
Culture medium
Although some strains of E. fagacearum appear to be
partially heterotrophic with respect to biotin, thiamine and
inositol (Beckman et al. 1853a), a chemically defined syn

25
thetic medium, without added vitamins, was utilized to sim
plify subsequent analyses. The composition of the basal
medium was based in part on studies of the nutritional re
quirements of E. fagacearum (Beckman et al- 1953a). The
medium consisted of the following: Sucrose 34.2 g; L-
arginine 3.48 g; KHgPO^ 1-0 g; KpHPO^ 1.3 g; MgSO^-YHgO
0.5 g; FeSO^'YHgO 10 mg; ZnS04•?Hg0 2.0 mg; CaClg-2Hg0 0.6
mg; CUSO4•5HgO 0.4 mg; MnClg'4HpO 0.4 mg; CoClg-6Hg0 0.4 mg;
NagMoO^^HgO 0.2 mg; H3BO3 0.2 mg; and double-distilled water
to make 1000 ml. The trace elements were prepared as stock
solutions made up to volume with double-distilled water and.
stored at 5°C. Aliquots of 50 ml were dispersed in 250 ml,
wide-mouth Erlenmeyer flasks and sterilized at 15 lbs pres
sure for 15 minutes. The organism was incubated at 22°C
in still culture. Changes in chemical composition of the
basal medium and varying methods of incubation are described
under the respective experiments.
Inoculation of cultures and measurement of growth
All flasks for studies on growth measurements and growth
promoting substances were inoculated with a 0.1 ml aliquot
of a twice washed spore suspension of E. faRacearum by means
of a calibrated sterile pipette. Spore suspensions were
made from two- to four-week-old slants of the organism grown
on potato-dextrose agar. In the case where growth promoting
26
substances in the culture medium were analyzed by means of
the Avena. coleoptile test, it was necessary to inoculate
flasks through a seven-day period with the same quantity of
inoculum. Therefore, the amount of inoculum was standardized
turbidimetrically in a Klett-Summerson colorimeter by measur
ing a 2.0 ml aliquot and estimating the necessary dilution
factor -
For estimation of growth in culture, media were filtered
through a Buchner funnel on previously weighed filter paper.
Mycelial mats were washed with 30 ml distilled water, dried
at 95°C and weighed.
Measurement of growth promoting substances
For study of growth promoting substances produced by E.
fagacearum in a chemically defined medium a previously de
scribed method (Kitsch and Kitsch 1956), with slight modifica
tions , was employed. A clean, high-germinating sample of
the oat variety, Nemaha, was used throughout the experiment.
Seeds were first soaked in cold tap water for two hours.
After soaking they were arranged uniformly in parallel rows,
embryo s up, between two sheets of soaked paper toweling.
The sheets were then wrapped around large Pyrex test tubes,
placed upright in a metal container and sealed with aluminum
foil. The container was held in darkness in an incubator at
22°C for four days, at which time the coleoptiles were

27
approximately 20 to 30 mm. long. Under minimum white light,
ooleoptiles 20 to 25 mm long were selected and cut into 40
mm lengths, 30 mm from the tip. Ten coleoptile sections
were placed in each sealed weighing bottle which contained
0.4 ml of a solution made by dissolving 1.0 mg MnSO^-HgO
in one liter of distilled water. These bottles were returned
to the incubator in a sealed container for three hours- All
coleoptile sections from a given sample were exposed five
minutes to light during this procedure to standardize the
method. After soaking, the MnSO^ solution was removed
rapidly from the samples with a syringe and replaced with
the test reagents. These reagents had been mixed previously
to reduce the time of exposure of the coleoptile sections
to light• Each sample consisted of two lots of ten coleop
tile sections in 0-1 ml buffer solution, 0.2 ml double dis
tilled water and 0.1 ml of culture filtrate- Duplicate
samples in the uninoculated medium were used as controls.
The buffer mixture contained KgHPO^ 1-794 g/liter + citric
acid monohydraté 1.019 g/liter, pH 5.0 in double-distilled
water (Nitsch and Nitsch 1956) . The samples were placed in
a sealed container and returned to the incubator for 24
hours. The individual coleoptile sections were measured
with the aid of a calibrated binocular microscope. This
method was standardized against known concentrations of indole
acetic acid. Coleoptile section length plotted against the

28
log concentration of indole acetic acid was linear over the
range from 1.0 to 100 jug/liter. Above this the increase in
length was non-linear.
The basal medium and standard conditions of growth were
used in all studies on coleoptile elongation. Prior to use,
inoculated medium was passed through a Seitz filter to remove
all mycelium and spores. The clear, culture filtrate was
used directly without further treatment.

29
RESULTS MD DISCUSSION
Aspects of Red Oak Physiology in Relation to Tylosis Formation
Evidence up to this time has substantiated the theory
that tyloses are a primary cause of reduced sap flow in xylem
of diseased red oak (Beckman _et al. 19 53b) • The evidence
however was not conclusive and further information was sought
to determine if tyloses were, in fsct, a result rather than
a cause of reduced water movement in the xylem.
Movement of sap in xylem of diseased and healthy red oak
It is well known in ring porous wood, that translocation
of sap is confined generally to the outermost or current
year's ring. To observe this in red oak, four- and five-year
old branches were cut and immersed immediately in a one per
cent aqueous solution of crystal violet. They then were
placed under, conditions conducive to high transpiration.
Within two to three hours the dye was detected in petioles of
the uppermost leaves. At this point the branches were re
moved from the solution, bark and phloem stripped off, and
tangential and transverse free-hand sections msde in order
to observe distribution of the dye. Movement of the solution
was restricted entirely to the outermost ring. All larger
vessels, but not the tracheids or fibers, seemed to function

30
in translocation. The discrete vessel groups of the late
wood were stained an intense blue throughout their length and
could be observed clearly when the bark was removed. Very
little anastomoses of the vessel groups were observed.
Diseased branches presented an interesting comparison.
Whereas movement of the dye in healthy branches was dis
tributed uniformly in discrete bundles throughout the circum
ference of the stem, in diseased branches movement was re
stricted to one or a few randomly distributed vessel groups.
These functional vessel groups were generally free of tyloses
wnile the remainder were occluded severely. Lateral trans
location, that is movement of the dye at a point of occlusion
to other non-occluded vessels or vessel groups, never was
observed.
Furthermore, when branches from diseased and healthy
trees were pruned to give an excess of leaf area on the
diseased branch, vertical movement of the dye through the
xylem was only one-fourth as rapid in the diseased branch
in spite of an estimated 90 per cent reduction in functional
vessels. From this it became apparent that leaves on diseased
trees probably maintain themselves under conditions simulating
a severe water shortage. The lower rates of water uptake of
ten diseased leaves as compared to ten healthy leaves,
measured over a 12-hour period, help explain the basis for,
but not necessarily the cause of the reduced rate of dye

•31
Table 2- Water uptake of diseased and healthy leaves over a 12-hour period
Leaf type Water uptake ml/sq.cm/hour
Normal (check) 1.3 x 10"^
Normal (diseased) 4.2 x 10"^
Ohiorotic 3.8 x 10" ~
movement in the xylem of diseased oak (Table 2).
Effect of reduced transpiration and drought conditions on tylosis formation in red oak
Defoliation of northern pin oak and the resultant reduc
tion of xylem sap movement does not in itself induce tyloses
(Beckman _et al. 1953b) • To substantiate this and further
determine if tylosis formation under these conditions was
merely a matter of time, several large branches up to 10
years old were maintained in a defoliated condition for
periods up to 60 days. In no case were tyloses observed in
excess of those found in leaf-bearing branches. On the other
hand, in several mature red oaks suffering from drought in
jury during the summer of 1956, extensive tylosis formation
was observed in the vessels of the bole and branches. Be
cause the external symptoms of drought injury bore a strong
resemblance to those of oak wilt, several attempts to isolate

32
the causai organism from these trees were made without suc
cess . This diagnosis was further supported by the fact that
these trees were not located in areas where oak wilt had been
observed previously. At the time of death tylosis formation
and other vascular symptoms were identical in all macroscopic
aspects to those found in infected trees.
Distribution and spread of tyloses in wounded red oak
Wounding initiated localized tylosis formation in red
oak. Tyloses were observed as small balloon-like projections
into vessel cavities 36 to 48 hours after wounding. Within
five to seven days they had made contact with the opposite
wall of the vessel segment.
Spread of tyloses about the wound site in relation to
xylem sap movement was determined• Vertical spread was ob
served up to 40 cm beyond the wound site• Horizontal spread
was restricted to approximately 2.0 cm on either side of the
wound.
Radial distribution of tyloses was also determined. By
careful control of wound depth only the first row of vessels
was severed. Sampling with the increment borer to a depth
encompassing five or six growth rings of the sapwood revealed
tyloses in decreasing numbers inward from the second ring.

33
Prevention of tyloses at the wound site
Since the evidence presented was suggestive of the exis
tence of specific hormones controlling tylosis formation,
several attempts were made to interfere with the response by
treatment of the wound site with various chemicals. Imme
diately after wounding, the area was washed thoroughly with
specific substances sprayed on by means of a plastic squeeze
bottle. Where materials other than water were used treatment
was followed by a water rinse to limit the toxic effects of
the chemicals. The experiment was run in duplicate (Table 3).
Table 3. Tylosis formation in red oak as affected by several chemicals
Treatment Relative abundance of tyloses R value
Water ++•+ 0.28
Acetone 4* 0 .18
(NH^)pSO^ (50# 0.00
Ethanol (95^) 0.25
Control 0.27
Acetone and 50 per cent (NH^)gSO^ limited tylosis size
and reduced their relative abundance. Since these two chemi
cals also caused browning and partial disintegration of the
wood tissue they were assumed to be toxic and were not

34
utilized further. The inability of water to affect tylosis
size could be interpreted to mean either that s wound hormone
did not exist or its release did not coincide directly with
the time of wounding.
Since the inducing principle could arise as a delayed
response to wounding, an experiment was set up whereby water
was washed continuously through the wound at a constant rate
of about 4.0 ml/minute for 24 hours. Controls, without
continuous washing, were set up in the same tree. The experi
ment was run in duplicate. Sampling after 48 hours revealed
extensive tylosis formation in controls but none in treated
wounds.
Seasonal response to wounding in red oak
While in general tylosis formation as a response to
wounding was initiated within a 48-hour period, a progressive
diminution in tylosis size was observed throughout the grow
ing season. Towards the end of September, 1957, tylosis
formation was delayed considerably, while in October of the
same year it could not be induced at all. There is perhaps
a relationship between the cessation of tylosis formation and
the onset of dormancy in the cambium.
35
Attempts at Characterization of the Mechanism of Tylosis Induction
The foregoing sections implied, not unequivocally, that
the rise of tyloses in wounded tissue was caused by an abrupt
termination of the normal flow of xylem sap through the ves
sels. Such an implication would provide a common basis for
the origin of tyloses through wounding, senescence, disease
or drought conditions.
Under this hypothesis, the xylem sap could have two
possible functions in relation to tylosis induction. Occlu
sion during the growing season could result in the loss of
nutrients essential for normal metabolism. Conceivably this
might lead, in the presence of a sufficient quantity of energy
yielding materials, to the formation of tyloses. As an
alternative, xylem sap could have a dilution or inactivation
effect upon a growth regulatory substance either normally
present in living cells of the xylem or synthesized under ab
normal conditions such as wounding. Much of the evidence
supported the latter reasoning. Radial, horizontal and ver
tical spread of tyloses at a wound site appeared restricted
to the area where normal flow of xylem sap had been obstruct
ed. Tyloses occurred not only from the cells of the xylem
rays which had been severed but also from those distant to
the wound site. Therefore, tylosis formation was a response
to a stimulus which could move radially along the chain of
36
living cells from one ray to the other through the cambial
zone.
Effect of girdling to the cambium on tylosis formation
Transmission of any wound response in a vertical direc
tion required that the stimulus be transmitted by non-living
fibers, tracheids and apotracheal parenchyma. The only
alternative was transmission through xylem rays to living
cells of the cambium and from there to other rays. To test
this reasoning a mature red oak was girdled to the depth of
the cambium at two points 40 cm apart. A wound was made
above, below and between the rings. After 48 hours samples
were taken and examined for tyloses. Tyloses were formed
abundantly above and below all wounds. From the wound made
between the rings, tyloses extended beyond the upper ring.
This suggested that if a specific growth-regulating substance
was involved it could be transmitted through non-living tis
sue . Since tyloses occurred between the two rings it would
seem that the stimulus was a product of wounded cells and
was not translocated from some other site through the phloem.
Comparison of diseased and healthy sapwood constituents
Studies have suggested that the removal of a water solu
ble substance from the wound site prevented the formation of

37
tyloses. Attempts were made to isolate a regulatory substance
which would control tylosis formation.
Water soluble constituents of infected and healthy sap-
wood were concentrated to 20 ml in vacuo at 36°G. Water in
soluble material was removed by centrif ugation and 200 >il were
banded on a chromatogram developed ascendingly in BAW. Rf
values and response to specific reagents of four compounds
selected on the basis of quantitative or qualitative differ
ences were studied (Table 4).
Table 4. General properties of compounds isolated from red oak sapwood
Com Rf Relative UV pound values abundanc e Reagents Un— letter BAW Diseased Normal ASN FeClg DPNA treated NH_3
A 0.45 ++•+ NRa NR m B B
B 0.71 ++ + Br B fY NR NR
C 0.77 ++ + BC- GGr B Bk Bk
D 0.91 ++ + NR NR P GrY bGrY
aB=blue Br=brown Gr=green Y=yellow b=bright Bk=black G=grey P=purple NR=no reaction f=faint
Compound A was assumed to be a substance which arose as
a direct result of host-parasite interaction since this mate
rial was not observed in healthy sapwood aqueous extracts.
Subsequent extraction with 50 per cent ethanol, however,
showed that compound A was also present in the extract of

38
normal sapwood. Therefore, all the substances observed in
diseased sapwood extracts were present also in sapwood from
healthy trees.
Thirty chromatographically identifiable compounds were
observed originally on chromatograms of the sapwood extract.
These substances interfered with chromatographic purification
by limiting the amount of extract applicable to a chromato
gram . Consequently, prior to chromatography, fractionation
of the extract was undertaken.
Treatment of the solution containing compound A according
to Method 1 (Figure 2) yielded a solution (la) Method 1.
Ascending chromatography in BAW gave an Rf value of 0.49 for
compound A- After drying, compound A was located under UV,
outlined, cut out and eluted in 1.0 ml of distilled water.
After concentration in vacuo it was rebanded on a chromato
gram and developed in 80 per cent phenol (Rf 0.79). Because
the purity of the compound was in doubt, it was eluted again,
banded on a chromatogram and subsequently developed in dis
tilled water (Rf 0.79). The Rf values in 80 per cent phenol,
BAW and distilled water, and its characteristic fluorescence
under UV were properties similar to those reported for aes
culin, 7-hydroxy, 6-glucoxy coumarin (Swain 1953). Purified
compound A and an authentic sample of aesculin were hydrolyzed
in 1.0 N HCL under reflux on a steam bath for three hours and
chromatographed in BAW. A new bluegreen fluorescent sub

39
stance corresponding to aesculitin, the aglycone of aesculin,
was observed (Rf 0.78). Treatment of the chromatogram with
ASN indicated the presence of a reducing substance corre
sponding to glucose (Rf 0.1). From these data, compound A
was assumed to be chromatographically identical to aesculin.
Compound B (Table 4) was obtained by extraction of the
sapwood by Method 2 (Figure 2). Concentration of the solu
tion (2b) Method 2, yielded abundant compound B. When com
pound B was developed chromatographically in conjunction with
tannic acid, Rf values in BABW (0.55), BAW (0.69) and 80 per
cent phenol (0.24), and reactions to both ASN and FeClg were
identical. Compound B was assumed to be a substance either
identical or closely related to tannic acid-
Compound C (Table 4) was isolated from sapwood of
diseased and healtny trees by Method 2 (Figure 2). Concen
tration of the ethyl acetate soluble fraction (2a) Method 2,
and chromatography in BABW yielded compound C in addition to
several fluorescent and FeClg-positive substances. Compound
C was eluted and developed chromatographically in conjunction
with the simple phenols (phenol, catechol, resorcinol, hydro-
quinone, pyrogallol and phloroglucinol)• In BAW (Rf 0.71),
distilled water (Rf 0.72), and 80 per cent phenol (Rf 0.45),
compound C reacted identically to an authentic sample of
pyrogallol.
Compound D (Table 4) was isolated by the same method as

40
compound C. After chromatography in BABW (Rf0-73), it v;as
located by its UV fluorescence and eluted from the chroma
togram- On re-chromstography in NH^OH: distilled water (pH
8-0) and in five per cent acetic acid, three fluorescent sub
stances were observed (Table 5).
Table 5. Fluorescent compounds isolated by chromatography from the ethyl acetate fraction of diseased sapwood extracts
Compound Rf values UV number 5.0% acetic acid NH^0H:Hg0(pH 8.0) Untreated NH3
1 0.50 0.68 Ba B
2 0.68 0.85 G-rY b&rY
3 0.81 0.90 p bP
aB= blue Gr=green P=purple Y~yellow b=bright
Compound 2 (Table 5) which represented chromatographical
ly purified compound D (Table 4) was eluted in s minimum of
distilled water.
Color changes under UV on treatment with ammonia fumes
are characteristic of f lavanoid compounds, certain CgCg-type
precursors (Geissman 1955) and their lactones (Swain 1953).
Compound 2 (Table 5) exhibited fluorescent characteristics
and Rf values similar to scopoletin (7-hydroxy, 6-methoxy
coumarin) with wnich compound 2 ( Table 6) was compared in

41
several solvents. The Rf values were not Identical.
Ferulic acid, its methoxylated derivative (3,4-dimethoxy-
cinnamic acid) and o-coumaric acid also were tested with nega
tive results. The UV fluorescence spectrum of compound 2,
using a Beckman DU spectrophotometer, was similar to the
câtechins (A max. 200 and 275, A min. 250 and 300). These
substances, however, appear black under short and long wave
UV (Gelssman 1955). Compound 2 (Table 5) also exhibited no
color change to yellow in visible light when exposed to
ammonia fumes, a characteristic of many flavanols. Therefore,
compound 2 (Table 5) was assumed to be a flavanoid perhaps
structurally reflated to the flavanones.
Effect of sapwood extracts on tylosis formation
Growth regulatory substances arising as a delayed re
sponse to wounding could cause tylosis formation. In an
attempt to Isolate some tylosis-inducing substance, fresh
sapwood samples were extracted under aerobic conditions
(Figure 3). Preliminary chromatographic analysis of the
extracts revealed a series of compounds up to 20 hours of
extraction. Those compounds giving a response to FeCl_
(phenolic substances) appeared instantaneously during the
cold water extraction. After five hours no FeClg-posltlve
reactions were observed. Nlnhydrin-positive substances,
having low Rf values, appeared during the two- to four-hour
42
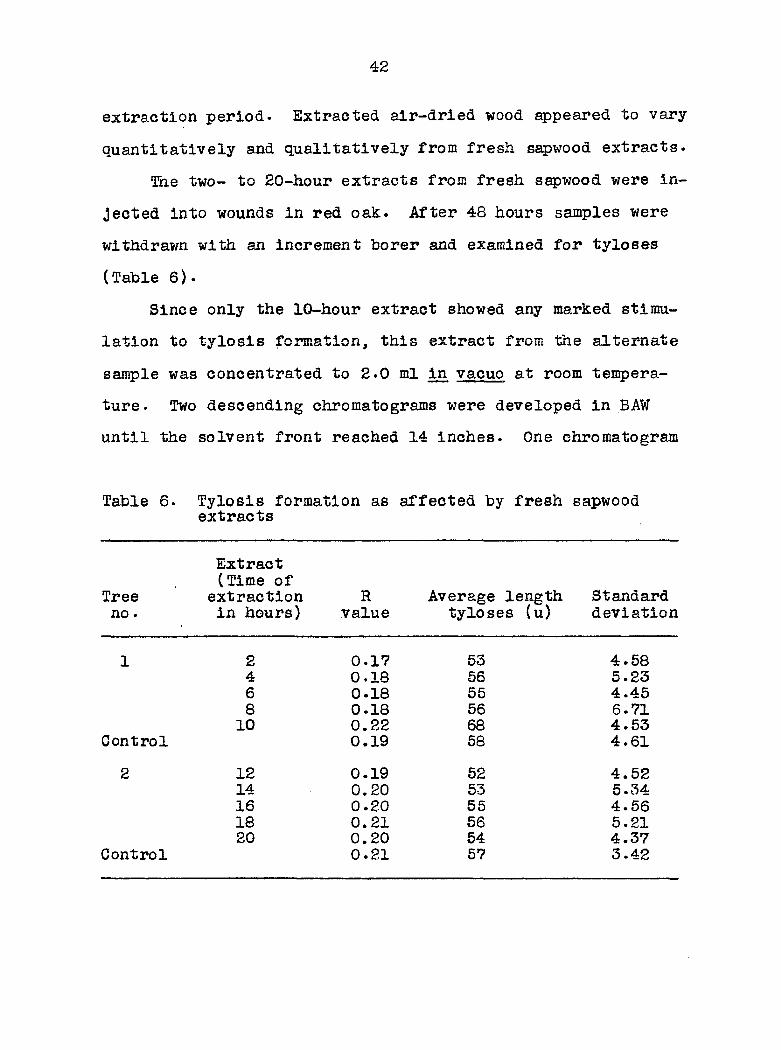
extraction period- Extracted air-dried wood appeared to vary-
quantitatively and qualitatively from fresh sapwood extracts.
The two- to 20-hour extracts from fresh sapwood were in
jected into wounds in red oak. After 48 hours samples were
withdrawn with an increment borer and examined for tyloses
( Table 6 ) •
Since only the 10-hour extract showed any marked stimu
lation to tylosis formation, this extract from the alternate
sample was concentrated to 2.0 ml in vacuo at room tempera
ture . Two descending chroma to grains were developed in BAW
until the solvent front reached 14 inches. One chromatogram
Table 6. Tylosis formation as affected by fresh sapwood extracts
Extract (Time of
Tree extraction R Average length Standard no. in hours) value tyloses (u) deviation
1 2 0.17 53 4.58 4 0.18 56 5.23 6 0.18 55 4.45 8 0.18 56 6.71 10 0.22 68 4.53
Control 0.19 58 4.61
2 12 0.19 52 4.52 14 0.20 53 5.34 16 0.20 55 4.56 18 0.21 56 5.21 20 0.20 54 4.37
Control 0.21 57 3.42

43
was reserved for rough characterization of compounds present;
the other was cut into strips corresponding to the Rf values,
0.1 to 1.0. Each strip was eluted with 3 ml of distilled
water and the eluate diluted to 5.0 ml. The eluates were
then injected into red oak. No stimulation of tyloses was
detected. Substances present in the 10-hour extract were
detected chromatographically (Table 7).
Table 7. Substances detected chromatographically after 10 hours of sapwood extraction
Reagents UV Rf asn FeCl3 Ninhydrin Untreated nh3
0.05 NRa NR NR bB bB 0.07 Br NR NR NR NR 0.15 Br NR NR NR NR 0.25 Br NR NR BG-r bBGr 0.60 NR NR NR Y bY 0.80 NR NR NR B B
aB=blue O-r-green NR=no reaction Br=brown Y=yellow b=bright
Substances in diseased wood extracts differing quanti
tatively from healthy wood extracts were Isolated to deter
mine their effects on tylosis formation.
Compounds A, B, C and D (Table 4) were isolated from
200 g of sapwood chips. The four compounds were eluted and
diluted to 5.0 ml with distilled water. In addition the
partially purified fractions from the extraction procedure

44
(Figure 2) were tested. After extraction the four fractions
(la, lb, 2a and 2b) were evaporated in vacuo to dryness,
taken up in 10 ml distilled water and filtered. Filtrates
were injected into wounds in red oak. The results sug
gested that none of the specific compounds or fractions was
involved directly in tylosis formation (Table 8).
Table 8. Tylosis formation as affected by specific compounds and partially purified fractions isolated from the sapwood of diseased red oak
Compounds and fractions R value
A 0.27 B 0.26 C 0.26 D 0.24
la 0.26 lb 0.27 2a 0.28 2b 0.27
Control 0.28
No further attempts were made to Isolate specific
tylosis-inducing substances.
Chromatographic Analyses of Sap from Diseased and Healthy Red Oak
The general procedure for the extraction and separation
of sap constituents has been described under methods.

45
Normal constituents of healthy red oak sap
The neutral fraction of healthy red oak sap was concen
trated to 1.0 ml and 25 >il spots were applied to descending
chromatograms developed in BABW. After development for 70
hours the chro mato grams were dried, sprayed with AHP and
heated for 10 minutes at 100°C. Three spots became evident.
These were identified chromatographically as sucrose, glu
cose and xylose by descending co-chromatography with authentic
samples and reactions with AHP, ASN and the molybdate reagent
(Burrows et al. 1952). A fourth substance was observed which
gave a positive reaction with the molybdate reagent (Burrows
et al. 1952). The Rf value of this substance after prolonged
development in BABW coincided with raffinose. An eluate of
this spot was hydrolyzed in 1.5 N HgSO^ for two hours at
100°C, concentrated and re-chromatographed. This revealed,
however, only two spots corresponding to glucose and fructose.
In view of the superiority of xylose as a carbon source for
growth of E. fagacearum in vitro (Beckman et al. 1953a), it is
possible that this sugar has some role in the degree of
specificity exhibited by this pathogen for its host.
The anion fraction, after concentration, was chroma-
tographed ascend!ngly in 80 per cent phenol. When a chroma
togram was sprayed with the molybdate reagent (Burrows et.
al. 1952) two yellow spots, characteristic of inorganic
phosphate, were observed at Rf values of 0.32 and 0.65.

46
To further characterize these spots a banded chromatogram
was prepared (Whatman No. 1 paper, previously washed thor
oughly in 0.1 M citric acid) and developed in 80 per cent
phenol. After complete drying the chromatogram was cut into
strips corresponding to Rf values from 0.1 to 1.0, eluted
with 1.0 ml of double-distilled water and added to test tubes
containing 9.0 ml of the basal medium less phosphorous. The
potassium was supplied 0.018 M KNO^• A control sample was
prepared from a chromatogram on which none of the anion frac
tion had been banded. An aliquot of a heavy spore suspension
of E. fagacearum, which had been washed three times in
double-distilled water, was added to each test tube• These
cultures were incubated on a wrist shaker at 28°C. After
48 hours, the fungus growth was estimated turbidimetrieally
in the Klett-Summerson colorimeter (Table 9). The results
indicated that the two spots were probably ionic species of
phosphate.
Aliquots of 25 pi of the cation fraction were applied
to each of several chromatograms and separated two dimen-
sionally by the ascending technique in 80 per cent phenol
and BABW• After drying, one chromatogram was sprayed with
ninhydrin and heated at 100°C for 10 minutes. Fourteen
ninhydrin-positive spots were found. Their positions were
marked on the remaining chromatograms, the spots were cut
out and eluted in a minimum of distilled water. Eluates were

47
Table 9. Growth of E. fagacearum on addition of chromatographic eluates of the anion fraction to the basal mediuma
Klett reading Rf of chromato grams Anion fraction Control
0.1 38 35 0.2 41 42 0.3 89 41 0.4 65 38 0.5 46 42
0.6 83 42 0.7 79 39 0.8 41 34 0.9 39 31 1.0 39 36 ..
^Phosphorus deleted
applied individually on descending chromatograms against
standards suggested by a previously prepared chromatomap.
In this manner glutamine, glutamic acid, asparagine, methi
onine, alanine and glycine were identified chromato graphic al
ly. Tentatively identified were tyrosine, aspart1c acid,
and threonine. The presence of glutamine, asparagine and
glutamic acid in relatively high concentrations was inter
esting since they also were observed to be among the pre
dominant nitrogeneous compounds in the xylem sap of apple
trees (Bollard 1953).
In order to determine if indole compounds, particularly
tryptophan, were present another chromatogram was sprayed

48
with 0.5 per cent alcoholic NaNOg and exposed to HC1 fumes
in a closed container (Block et al. 1955)• No reaction was
observed.
Evidence has been presented in the literature that
phosphoryl choline is an organic form of phosphorous found
in the xylem sap of barley seedlings (Maizel ej; al. 1956) .
When concentrated red oak sap, without further treatment,
was applied to a chromatogram and developed according to the
method used in these barley studies the presence of phos-
phoryl choline could not be demonstrated.
Constituents of vessels of diseased red oak
The "sap" obtained by siphoning double-distilled water
under low vacuum through stem sections of diseased red oak
was chromatographed by the ascending technique on Whatman No.
1 paper. Aliquots of 25 /il of these vessel constituents from
healthy and diseased trees taken under identical conditions
were applied side by side for comparison. The chromatograms
were developed in BAW (Table 10). Marked differences existed
between the vessel constituents of diseased and healthy red
oak. The presence of phenolic compounds, indicated by a
positive reaction with FeClg, in the vessels of diseased oak
parallels results with tomato wilt (Davis and Waggoner 1953).
Subsequent attempts to identify the compounds found in
the xylem vessels revealed that compound G (Table 10) was

Table 10. General properties of water soluble vessel constituents
Reagents Compound letter
Rf value BAW Normal Diseased
ASN 25°C 100°C FeClg AHP
UV Untreated NHg
E 0.1 to 0.2 + + NRa Br NR Br NR NR
F 0.17 + G GBl GB NR NR NR
G 0.50 + NR fBr NR NR B B
H 0.65 + Br Br B NR NR NR
aB=blue Br=brown NR=no reaction Bl=black G=grey f=f aint

50
identical to compound A (Table 4) identified as aesculin.
Compound H (Table 10) was identified as tannic acid, compound
B (Table 4).
Compound F (Table 10) was not observed in the sapwood
extracts (Table 4) although no concerted attempt was made to
analyze all the fractions.
A blue reaction with FeClg is indicative of the 3, 4, 5,
trihydroxy grouping in the B-ring of polyhydroxy flavanoids
(Geissman 1955; Roberts et al. 1951). Since compound F
(Table 10) was not similar in reaction to specific reagents
or in Rf values to the simpler phenols, it was classified as
a flavonoid compound.
Leaf Symptoms on Diseased Red Oak
Severely infected trees exhibited many symptoms indica
tive of nutrient deficiencies. Growth generally was retarded
and dwarf leaf symptoms together with necrotic and chlorotic
leaves were abundant. Distribution and rate of spread of leaf
symptoms were observed in an attempt to ascertain if the
symptoms could be attributed to toxins or to failure of essen
tial metabolites or nutrients to reach the leaf.
Comparative rates of sap flow in healthy and diseased red oak
Three-year-old branches from healthy and diseased trees,
free from defects and of nearly equal diameter, were selected

51
at the time when leaf development was progressing rapidly but
the current year's growth ring was not observable. Water
carrying capacities of the branches were measured using the
method employed by Beckman et al- (1953b), with the exception
that a one percent solution of crystal violet rather than
water was used. The quantity of dye passing through a 10 cm
section in 10 minutes was recorded (Table 11).
Table 11. Comparative water carrying capacities of diseased and healthy branches
Time in days from Water carrying capacity ml/minute first observation Diseased Healthy
0 0.000 0.280 6 0.040 0.289 15 0.110 0.270 20 0.110 0.315 27 0.120 0.350
In both diseased and healthy branches the water carrying
capacities increased with the appearance of new vessels.
The flow rate in diseased sections, however, was severely
restricted. An examination of cross-sections revealed the
following: 1) The previous year's growth ring which functions
initially in sap transport was largely occluded in diseased
sections. 2) Occlusion of new vessels was evident within a
few days after formation.
Function of the old growth ring in initial transport of

52
xylem sap probably bears an important relationship to symptom
development in trees which survived infection from the pre
vious year. From the time leaf development begins in the
spring, a partial to severe restriction in sap flow limits
the movement of essential inorganic and organic materials.
Distribution and rate of spread of leaf symptoms
Observations made on the distribution and spread of leaf
symptoms led to the hypothesis that symptoms arose as a
result of a deficiency of nutrients or other metabolic con
stituents (Table 12). The primary symptom on young infected
red oaks was premature abscission of leaves. In conjunction
with this axillary buds of abscissed leaves often developed
prematurely and gave rise to typical dwarf leaves. Abscissed
leaves frequently were devoid of specific symptoms prior to
abscission. It should be emphasized however that in relation
to leaves on adjacent healthy trees, leaves prior to abscis
sion were always a lighter green and devoid of lustre.
Marked chlorosis was observed. In some cases necrotic
development followed chlorosis but in general chlorosis was
independent of other symptoms•
Necrotic symptoms while by no means numerous relative to
other symptoms were important with respect to possible exis
tence of specific toxins. While necrotic symptoms might
have arisen as a result of the action of toxic substances,

53
Table 12. Distribution and rate of development of leaf symptoms on young diseased red oak
Days from June 20. 1956 0 2 4 8 12 15 22 29 32 36 58 62
Branch 1 (Tree l)a
Total leaves 16 16 Normal leaves 15 15
16 15
16 15
14 13
14 13
14 13
15 12
13 10
12 7
11 4
8 1
Symptom distribution
Necrosis C13
Chlorosis H NOP JK
Abscission. FG DI AEB H COL
Dwarf leaf F GI
Branch 2 (Tree 2) Total leaves 13 10 Normal leaves 10 7
10 7
10 6
11 5
10 4
10 4
9 1
9 1
9 0
9 0
8 0
Symptom distribution
Necrosis AFG M H
Chlorosis M L HK
Abscission BEJ D CF I K
Dwarf leaf B D C
Branch 3 (Tree 3) Total leaves 22 22 Normal leaves 18 18
21 17
21 17
21 17
21 17
20 17
18 15
18 12
15 8
10 5
9 4
Symptom distribution
Necrosis AGL DJ
Chlorosis R N JK 0
Abscission T R AS BFM CEEJL P
Dwarf leaf
aData selected as typical from observations on 23 trees.
bThe alphabetical designation fixes the position of the leaves relative to the base of the stem.
54
their random distribution, slow rate of development and
scarcity of numbers tended to refute this interpretation. In
addition, the rate of spread of initial necrotic areas on
individual leaves was extremely slow on those which remained
on the tree. Further progression, determined by outlining
the necrotic margin with India ink, took place only towards
the end of the growing season. At this time a rapid browning
of the whole leaf occurred. This was analagous to that ob
served on healthy trees later in the season.
In an attempt to clarify the cause of dwarf-leaf develop
ment on diseased red oak, several diseased branches with
terminal dwarf leaves, in addition to typical necrotic or
chlorotic leaves, were placed in solutions of 1.0 per cent
aqueous crystal violet for 24 hours, at which time the bark
was removed and the branches cut into sections. Restricted
dye movement occurred to all necrotic and chlorotic leaves
but not to the dwarf leaves. Furthermore, when 10 cm sections
of the apical portion of stems containing dwarf-leaves were
connected to a vacuum pump, dye could not be drawn through
any of the sections at a vacuum of 30 lbs/square inch. This
indicated that dwarf leaves subsisted only on the nutrients
and water available in the upper portion of the stem, or which
could be imbibed through non-occluded micro-capillaries of
the xylem.
The bronze-leaf symptom generally w as not observed in

55
close proximity with other symptoms, but overtook all the
leaves on a particular branch, or section of a tree. Complete
occlusion of the stem could not be demonstrated in all cases
but the symptom was typical of an abrupt termination of water
movement in the stem. A condition similar to the bronze-leaf
symptom could be induced by severing the conducting vessels
of a normal branch.
Distribution of E. fagacearum in leaves in relation to leaf symptoms
The presence of the organism in necrotic and chlorotic
leaves and its absence in normal appearing leaves would in
volve the organism directly in the symptom complex. This
conclusion had been reached previously when it was observed
that the organism could not be isolated from other than
symptomatic leaves on diseased trees (Young 1949). To test
this hypothesis further, leaves exhibiting each of the four
typical symptoms were collected from young diseased red oak.
Petioles were removed, sterilized in 30 per cent Chlorox for
one minute and plated on potato-dextrose agar. After incuba
tion for two weeks at 22°C the petioles were examined for
the presence of E. fagacearum (Table 13).
Percentage infection in normal-appearing leaves was
contrary to earlier observations (Young 1949). When examined
in association with other data (Table 12), the results were
difficult to reconcile with any theory associating necrotic

56
Table 13. Presence of E. fagacearum in petioles from normal-appearing and symptomatic leaves from diseased trees
Symptoms Number of petioles
examined Number
infected Percentage infected
Necrotic leaves 205 168 82
Chlorotic leaves 185 135 73
Bronze leaves 80 52 64
Normal-appearing leaves 192 144 75
development directly with E. fagacearum. Observed differences
in percentage of infection between necrotic and normal-
appearing leaves, while small, were probably real and indica
tive of the extent of vascular infection and therefore in
directly, of vascular occlusion.
Chromatographic and analytical comparisons of diseased and healthy red oak leaves
A general procedure was used in preparing leaf extracts
for chromatography. Portions containing 25 g of diseased or
healthy leaves, which had been rinsed previously in tap water,
were ground for two minutes in a Waring blendor with 180 ml
of 85 per cent ethanol. The leaf extract was filtered and
extracted three times with 20 ml portions of petroleum ether
(Skelly B). This fraction was discarded. The 85 per cent

ethanol soluble component was evaporated down at 35°C to
40 ml and filtered. This solution was designated as Fraction
A. Further treatment varied according to the nature of the
experiment.
Flavonoid and phenolic constituents. Fraction A was
evaporated down to 10 ml in vacuo• Quantities of 5 to 25 pi
of both healthy and diseased fractions were examined by two
dimensional chromatography in 80 per cent phenol and BABW
in order to establish quantitative or qualitative differences
between healthy and diseased leaves (Table 14).
Previous evidence has indicated that flavonoid compounds
with catechol groupings gave a green color with FeClg and
those with phloroglucinol groupings a blue color (Roberts
and Wood 1951). However, the green color given by the ortho-
dlhydroxy flavonoid s was not specifically diagnostic ( G-elss-
man 1955; Clarke and Nord 1955). While no attempt was made
at the time to identify specific compounds, all simple phenols
giving a blue color with FeClg had relatively high Rf values
In BABW and 80 per cent phenol. Consequently, it was assumed
that most of the compounds listed (Table 14) were the more
complex flavonoid compounds. From the preliminary data (Table
14), there appeared to be a qualitative excess of phloroglu-
cinol-derived flavonoids in the diseased leaves and a defi
ciency of catechol-derlved flavonolds.
Presence of an excess of phlo ro glu c ino1-d erived flavo-

58
Table 14. Phenolic and flavonoid and healthy red oaks
constituents of diseased
Compound Rf values
Relative concentrations Reagent
UV Un
number BABW 80^ phenol Diseased Healthy FeClg treated NHg
1 0.00 0.00 -r + Ba NR NR
2 0.12 0.12 + + B NR NR
3 0-12 0.21 + B NR NR
4 0.14 0.21 + B NR NR
5 0.18 0.31 + B B1 OY
6 0.25 0.43 + B NR NR
7 0.28 0.18 + + B NR NR
8 0.30 0.31 + B NR OY
9 0.31 0.18 + B NR NR
10 0.40 0.62 + ++ Gr NR OY
11 0.56 0.43 + Gr B1 OY
12 0.56 0.50 + ++ Gr B1 Gr
13 0.56 0.81 + + NR B bB
14 0.68 0.90 + NR NR bP
15 0.70 0.63 + fGr B bB
aB=blue Gr=green P=purple b=bright Bl=black OY=orange yellow NR=no reaction f=faint

59
noids in diseased red oak leaves suggested that some of these
compounds might have been translocated from infected vessels
of the xylem. Consequently 25 jal spots of diseased oak sap
and Fraction A of diseased leaves were applied at varying
concentrations to descending chromatograms. After develop
ment in BABW the chromatograms were dried, observed under UV
and afterwards sprayed with FeClg. Of the compounds found in
the vessels of diseased sapwood none was chromatographically
identical to any of the compounds found in diseased leaves
( Table 15).
From this information two conclusions were drawn. Either
substances observed in the vessels of diseased oak repre
sented contents of non-functional conducting elements or the
phenolic constituents of the xylem were being enzymatically
altered in leaves without prior observable accumulation.
To obtain information on this latter possibility, the
three compounds (F, G and H) from the xylem "sap" (Table 10)
were separated and purified by successive chromatography in
80 per cent phenol and BAW. The substances were eluted after
thorough drying of the chromatogram and made up to 5.0 ml.
Eight healthy red oak leaves were allowed to take up the solu
tions while control leaves were placed in distilled water.
After three days there was no macroscopic evidence of toxic
ity. Individual leaves were ground in 85 per cent ethanol,
with a mortar and pestle, filtered, concentrated and chroma-

60
Table 15. Comparison of phenolic substances in leaves and xylem of diseased red oak
Com- Rf Reagents yv pound number
Observed values ASN FeClg
Untreated NH3
pound number Leaves Xylem BABW 25UC 100UC FeClg
Untreated NH3
1 + 0.00 Bra BrBl B NR NR
2 + 0.12 G GBr GB NR NR
3 + 0.16 Br Br B NR NR
4 + 0.25 Br B1 B NR NR
5 + 0.31 BrBl B B NR NR
6 + 0.43 Br B Gr NR 0
7 + 0.46 Br Br B NR NR
8 + 0.48 NR NR fGr B B
9 + 0.61 Br Br B NR NR
aB=blue Br=brown Gr=green NR=no reaction Bl=black G=grey 0=orange f=f aint
tographed. The three compounds were re-isolated from the
leaves, unaltered. Other than the three substances mentioned
no other qualitative or quantitative differences were observed
between control leaves and those placed in the chromatographic
eluates. This information supports the conclusion that the
substances designated herein as xylem "sap" constituents of
diseased red oak were soluble compounds from nonfunctional
or occluded vessels and hence were not translocated to the
leaves.
61
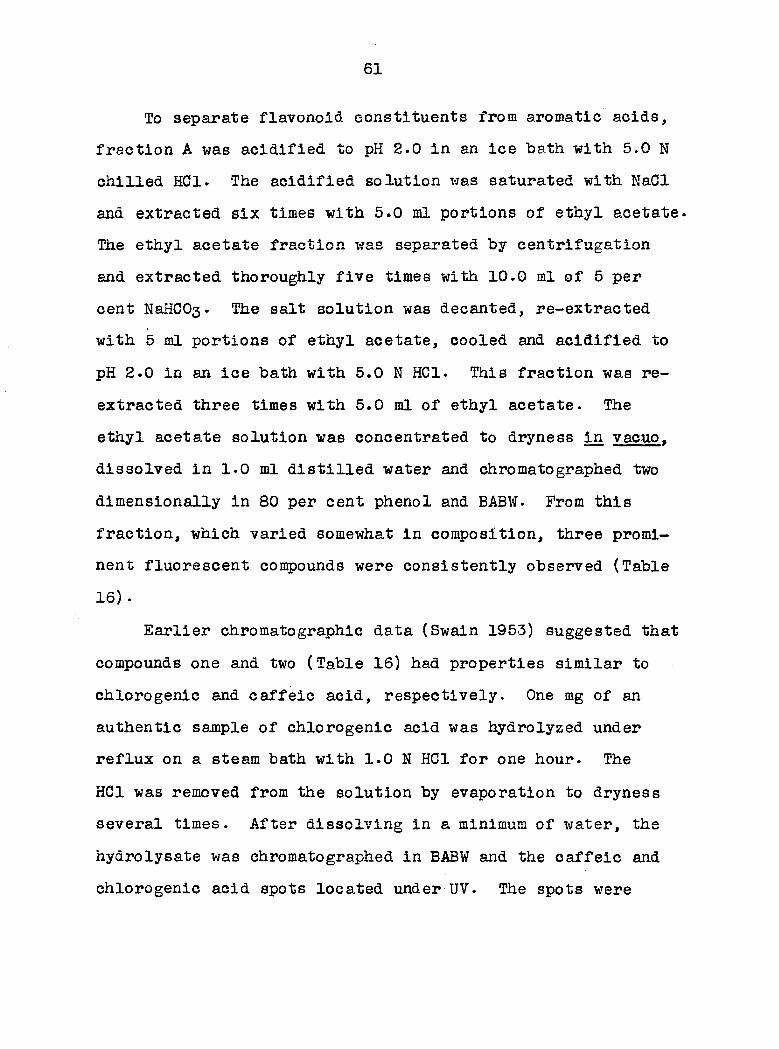
To separate flavonoid constituents from aromatic acids,
fraction A was acidified to pH 2.0 in an ice bath with 5.0 N
chilled HCl. The acidified solution was saturated with NaCl
and extracted six times with 5.0 ml portions of ethyl acetate.
The ethyl acetate fraction was separated by centrifugation
and extracted thoroughly five times with 10.0 ml of 5 per
cent NaHCOg. The salt solution was decanted, re-extracted
with 5 ml portions of ethyl acetate, cooled and acidified to
pH 2.0 in an ice bath with 5.0 N HCl. This fraction was re-
extracted three times with 5.0 ml of ethyl acetate. The
ethyl acetate solution was concentrated to dryness in vacuo.
dissolved in 1.0 ml distilled water and chromatographed two
dimensionally in 80 per cent phenol and BABW. From this
fraction, which varied somewhat In composition, three promi
nent fluorescent compounds were consistently observed (Table
16) •
Earlier chromatographic data (Swain 195-3) suggested that
compounds one and two (Table 16) had properties similar to
chlorogenlc and caffeic acid, respectively. One mg of an
authentic sample of chlorogenic acid was hydrolyzed under
reflux on a steam bath with 1.0 N HCl for one hour. The
HCl was removed from the solution by evaporation to dryness
several times. After dissolving in a minimum of water, the
hydrolysate was chromatographed in BABW and the caffeic and
chlorogenic acid spots located under UV. The spots were

62
Table 16. Phenolic acids from diseased and healthy leaves of red oak
Relative Com- Rf values concentrations UV pound 80$ Diseased Healthy Reagents Un-number BABW phenol leaves leaves ASN FeClg treated NHg
1 0.40 0. 50 + ++ Bra fGr fB BGr
2 0.56 0.50 + Br NR B bB
3 0.68 0.75 + Br Gr B B
afi=blue Gr=green b=bright Br=brown NR=no reaction f=faint
eluted In 0.5 ml distilled water and chromatographed sepa
rately in 80 per cent phenol and BABW, with the leaf extracts.
Rf values and reaction under UV of compounds one and two
(Table 16) were identical to chlorogenic and caffeic acids,
respectively.
Quinic acid, the third product of acid hydrolysis of
chlorogenic acid was not found in the leaf samples. It was
located in the hydrolysate of the authentic sample by spray
ing with the molybdate reagent (Burrows et al. 1952). It
formed a white spot on a blue background. The observation of
quinic acid in diseased leaves would have suggested that
enzymatic hydrolysis of chlorogenic acid had occurred and
that the acid was not localized in the cell vacuole. This
would have explained the smaller concentration of chlorogenic

63
acid observed in diseased leaves. Since no quinic acid was
detected in diseased or healthy leaves, however, the lower
quantity of chlorogenic acid observed in diseased leaves was
assumed to be a result of metabolic deficiencies.
Normal metabolic constituents. For both normal and
diseased leaves Fraction A was evaporated to 10 ml in vacuo
at 32°C and passed through ion exchange columns. The cation
fraction was treated as indicated In the section on methods.
The anion fraction was isolated on an IRA 400 column in the
hydroxyl form and eluted with 0.1 N HCl. After separation,
the cation, anion and neutral fractions were concentrated to
5.0 ml in vacuo at 32°C and chromatographed.
Twenty-five jul samples of the cation fraction from both
diseased and healthy leaves were chromatographed two dimen-
sionally in 80 per cent phenol and BABW. After drying,
chromatograms were sprayed with ninhydrln and heated at 100°C
for two minutes. The healthy leaf fraction contained 16
ninhydrin-positive spots. Using a previously prepared chroma
to map and known amino acids, positive chromatographic identi
fication was made of the following amino acids: glycine,
asparagine, glutamine, proline, alanine, lysine, arglnlne
and valine. Glutamic acid and serine were tentatively iden
tified. At similar concentrations no ninhydrin-positive sub
stances were isolated from the diseased leaf fraction.
Twenty-five jul samples from the anion fraction of

64
diseased and healthy leaves were developed chromatographically
in 80 per cent phenol and BABW. After drying, the chromato
grams were sprayed with one per cent dextrose and then with
ASN (Gore 1951). Eight non-fluorescent spots were recorded
from healthy leaf extracts. Two were identified as citric
acid and malic acid by co-chromatography with authentic samples.
Diseased leaf extracts contained no definitive spots at this
concentration.
Neutral fractions of diseased and healthy leaf extracts
were applied In 25 jal aliquot s to descending chromatograms.
The chromatograms were developed for 70 hours in BABW, dried,
sprayed with AHP and heated at 115°C for five minutes. Three
AHP-posltlve spots were recorded for extracts from healthy
leaves. By descending co-chromatography of these extracts
with sucrose, fructose and glucose in BABW and BAW, all three
sugars were Identified. None was observed In diseased leaf
extracts at this concentration.
These chromatographic analyses have Indicated defi
ciencies of essential metabolites in diseased leaves. Iden
tified compounds in healthy leaves were common glycolytic,
Kreb cycle, or amino acid constituents. Their complete
absence in diseased leaves at concentrations where they were
normally observed in healthy leaves was conceivably more
indicative of acute starvation than of toxic activity of the
pathogen or of host-parasite interaction.

65
Starch accumulation in diseased leaves. Necrotic,
chlorotic and normal appearing leaves from diseased red oak
were cleared in boiling 80 per cent ethanol and immersed in
an IgKI solution. These leaves had accumulated starch in
excess of that found in healthy leaves. Excised leaves from
both healthy and diseased trees were placed in a moist chamber
for 48 hours in darkness and then tested for starch. Healthy
leaves gave a negative reaction while diseased leaves re
tained a strong positive reaction. The assumption was made
from these observations that the mechanism for starch degrada
tion had been obstructed. Since chromatographic evidence
indicated a deficiency of glucose in diseased leaves, the
inhibition of starch breakdown could not be attributed to an
accumulation of this sugar.
The reversible enzymatic breakdown of starch to glucose-
one-phosphate by phosphorylase has been reported to proceed
towards the formation of glucose-one-phosphate as the pH in
creases (Hanes 1940). The possibility that a pH optimum Con
tois the breakdown of starch led to a study of the phosphor
ylase activity of oak leaves. Solutions made by grinding 25
g samples of diseased and healthy leaves in 100 ml of dis
tilled water were used to estimate the pH values. Healthy
leaves had a pH of 5.6, diseased leaves a pH of 4.5. Deter
mination of phosphorylase activity in healthy leaves followed
the method of Sumner et al. (1950). One to 5.0 ml of crude

66
leaf extracts containing cytoplasm and chloroplasts were pre
pared by grinding 2.5 g of leaves at 0°G in 10.0 ml of a mix
ture of washed white sand and chilled 0.1 M citrate buffer
pH 6.0. The crude extract was filtered through several layers
of cheese cloth and centrifuged to remove sand and cell debris.
To the filtered extract were added 0.1 ml of a glueose-one-
phosphate buffer substrate, 0.5 ml starch solution, 0.5 ml of
—3 10~ M HgClg to inhibit amylase activity and 0.5 ml toluene.
Analyses of healthy leaf extracts for inroganic phosphate by
a modified Fisk-Subbarow method (Ward and Johnston 1953) gave
a maximum yield after 10 hours of 12.0 >ig of inorganic phos
phorus. The diseased leaf extracts were inactive. Due, how
ever, to the low activity of the enzyme in the crude extracts
of healthy leaves this aspect was not investigated further.
Chemical analyses of leaves. Since starch accumulation
was a common symptom of nitrogen or phosphorus deficiency,
diseased and healthy leaves (see Methods) from adjacent trees
were analyzed at three periods through the summer of 1957.
Leaf samples were pooled, washed thoroughly in distilled water,
dried, ground in a Wiley mill and analyzed (see Methods).
Chromatographic and chemical analyses indicated chlorotic and
necrotic symptoms arose from a deficiency of essential min
eral and organic constituents (Table 17).

i ,
Table 17. Chemical analyses of diseased and healthy leaves of red oak
Dry Alcohol Reducing sugar weight insoluble in insoluble Percentage Percentage Percentage
Leaves in g residue in g residue in g nitrogen ash phosphorus
Healthy 5.0000 2.8389 0.748 2.15 3.76 0.0019
o> 0
Diseased 5.0000 2.7061 0,892 1.64 3.35 0.0010
aAll percentages are expressed on the basis of the dry weight and are averages of four determinations.

68
Metabolism and Metabolic Products of E. fagacearum
Effect of certain phenols on the growth in vitro of E. fagacearum
Presence of phenolic substances in aqueous extracts of
diseased wood (Table 4) and in vessels of diseased red oak
(Table 10) prompted an investigation on the effect of phenols
on growth ill vitro of E. fagacearum. Phenolic compounds were
added at three concentrations in an attempt to find both an
inhibitory and a stimulatory range. The medium used differed
slightly from the basal medium. It consisted of 2.64 g/liter
1-asparagine and 0.05 M sucrose, except in the case of the
medium containing tannic acid where 0.1 M sucrose was used.
Culture flasks were randomized and held at room temperature
for the duration of the experiment. Growth was recorded as
the average mycelial dry weight from two flasks.
— 5 All phenolic compounds at concentrations of 10" M with
the exception of phloroglucinol, exhibited stimulatory effects
on the in vitro growth of E. fagacearum (Figures 4, 5, 6, and
7) . This suggested a possible stimulatory role for phenolic
compounds in the wilt syndrome.
Effect of culture filtrates on tylosis formation in red oak
Specific substances synthesized by the organism may
have a role in tylosis induction (Beckman eit al. 1953a). To

Figure 4. Growth of E. fagacearum as affected by tannic acid
Figure 5. Growth of E. fagacearum as affected by phloroglucinol

DRY WT. MYCELIUM mg X I 0 2
Q — M CM DRY WT. MYCELIUM mg X I 0 2
- o ooo
ro oo
w

Figure 6. Growth of E. fagacearum as affected by quercitin
Figure 7. Growth of E. fagacearum as affected by resorcinol

DRY WT. MYCELIUM mg X I 0 2
O — l\) (Al
'OO
o oo.
o oor" o
oo
DRY WT. MYCELIUM mg X I0 2
O O
— OOP
o o o
-< fX) en —
o\o
IX) 00
ooo

73
test this hypothesis, culture filtrates and spore suspensions
of E. fagacearum were prepared and injected into red oak.
Neither the culture filtrates nor the spore suspensions had
any effect on the rate of formation of tyloses (Table 18).
Table 18. Tylosis formation as affected by culture filtrates and spore suspensions of E. fagarearum
Treatment R value
Culture filtrates one week old 0.23 two weeks old 0.22 three weeks old 0.24 two weeks old (concentrated 1/2) 0.21 three weeks old (concentrated 1/2) 0.22
Spore suspensions in distilled water 0.21 in basal medium 0.22
Controls in distilled water 0.23 in basal medium 0.22
In an attempt to isolate an enzyme fraction from the
culture filtrate 200 ml fractions of 15 day old culture fil
trates were evaporated rapidly at 30°C to 50 ml and imme
diately chilled in an ice bath. These concentrated fractions
were adjusted from pH 2.0 to 12.0 by addition of 1.0 N NaOH
or 1.0 N HC1. Sufficient chilled acetone was added to the
fractions to bring the final concentration to 50 per cent.
The solutions were stirred rapidly whereupon the polysac-

74
charlde component floated to the top and was removed. The
remaining colorless precipitates in the solutions were fil
tered and redissolved in 10.0 ml of citric acid "buffer pH
6.0. These precipitates had no stimulatory effect on tylosis
formation (Table 19). Other precipitates obtained in the
same manner were collected by filtration, tested for the
Table 19. Tylosis formation as affected by solutions of the 50 per cent acetone precipitates from culture filtrates of E. fagacearum
PH mg precipitate R value
Tree 1 2.0 21.53 0.28 3.0 24.78 0.31 4.0 24.01 0.27 5.0 24.89 0.27 6.0 35.31
Control 0.27
Tree 2 7.0 41.46 0.31 8.0 40.09 0.29 9-0 43.21 0.30 10.0 50.61 0.31 11.0 53.25 0.30
Control 0.31
presence of peptide bonds with the biuret reagent, dried and
weighed (Table 19). The results of the biuret test were
negative and therefore the precipitates did not contain a
protein moiety.

75
Presence of growth promoting substances in culture filtrates
Presence of growth promoting substances in culture fil
trates of E. fagacearum was investigated on the assumption
that such substances might have some role in tylosis forma
tion . Avena coleoptile tests on culture filtrates of dif
ferent ages were undertaken. Pronounced elongation of
coleoptile sections was observed for filtrates from 11- to
15-day-old cultures (Table 20). Beyond this time toxic sub
stances apparently were present which interfered with the
test.
Table 20. Growth of Avena coleoptile sections as affected by culture filtrates
Age of Weight of culture mycelium Length of Standard in days in mg pH coleoptiles deviation
(control) 5.35 0.24
10 25.21 6.2 5.08 0.30
11 32.57 6.3 5.70 0.32
12 42.41 6.1 5.83 0.29
13 56.71 6-0 6.37 0.29
14 68.01 6.1 5.85 0.19
15 75.73 5.6 5.74 0.21
16 84.30 5.6 4.85 0.26

76
Attempts were made to isolate the substance or substances
inducing the stimulation. A 200 ml sample of the 13-day-old
culture filtrate concentrated (to 20 ml) at 32°C in vacuo was
extracted with peroxide free diethyl ether overnight in a
continuous extractor. The ether layer was removed, evaporated
in vacuo and the ether soluble components taken up in 1.0 ml
of 50 per cent ethanol. From this solution 200 jul aliquots
were applied to. chromatograms developed in 80 per cent phenol.
After development the chromato grams were thoroughly dried and
sprayed with the indole reagent (Block et al. 1955). No in
dole positive spots were observed. To be certain the extrac
tion procedure was not at fault a 100 jig sample of indole
acetic acid was dissolved in 200 ml of culture filtrate and
the identical extraction procedure carried out. On the basis
of area measurement, an 82 per cent recovery of indole acetic
acid was estimated. With this information it appeared that
ether soluble indole compounds were not present in culture
filtrates.
Since some amino acids, in addition to specific growth
regulators, promote elongation of coleoptiles (Nitsch and
Nltsch 1956) an attempt was made to determine the amino acids
present in 13-day-old culture filtrates. The presence of 1-
arginine in relatively high concentration in the basal medium
prevented the direct chromatographic determination of other
amino acids. To circumvent this, a 50 ml sample of the 13-

77
day-old culture filtrate was concentrated in vacuo at 32° C
and passed through a Dowex 50 x 8 cation exchange column.
After elution the cation fraction was concentrated to dry
ness in vacuo at 32°G and taken up in 1.0 ml of distilled
water. This solution was banded on two descending chroma
to grams developed in 80 per cent phenol. After drying the
chromatograms were cut into strips corresponding to Rf values
from 0.1 to 1.0 and eluted in distilled water. Eluates
were diluted to 2.0 ml and each was divided in half• One
half of each eluate was applied to a chromatogram in varying
concentrations. After development in BABW chromatograms were
sprayed with ninhydrin and amino acids marked. From a pre
viously prepared chromatomap tentative identification of the
amino acids was made. Varying concentrations of the other
half of each eluate were then chromatographed against known
amino acids selected on the basis of prior tentative identi
fication. It was necessary to carry some eluates through
another chromatographic separation to resolve those amino
acids having Rf values close to arginine in both 80 per cent
phenol and BABW. By this method identical Rf values and re
actions with ninhydrin were recorded for the following amino
acids : lysine, tyrosine, methionine, threonine and glycine.
Since methionine specifically stimulated the growth of
coleoptile sections in the absence of IAA (Kitsch and Nitsch
1956), it was concluded that this substance, in all probabil

78
ity, accounted for the observed stimulation of coleoptiles
by culture filtrates of E. fagacearum.
The rather abrupt termination of the growth-promoting
characteristics of culture filtrates was difficult to under
stand. Sugar concentrations above 2.0 per cent adversely
affected coleoptile elongation. However, although the molar
concentration of sugar probably increased in the medium due
to hydrolysis of sucrose to glucose and fructose, the sugar
concentration in the test solutions never exceeded the 2.0
per cent optimum (Kitsch and Kitsch 1956). A study of the
mycelial weights (Table 20 and Figure 8) indicated that the
organism was in the phase of maximum growth. At this time
there presumably would be a rapid increase in extra-cellular
metabolic products, any one of which might interfere with
the growth-promoting effects of methionine.
Toxicity of culture filtrates to red oak leaves
Evidence points to nutritional deficiencies rather than
toxins, as the primary cause of leaf symptoms on diseased
red oak. A preliminary study of basic metabolic products
of the organism was attempted however in hope that some in
formation might be obtained leading to a more fundamental
understanding of the pathogenicity of E. fagacearum.
Culture filtrates of E. fagacearum grown under various
conditions, have been shown to contain materials toxic to

79
red oak leaves and tomato cuttings (White 1955; Hoffman 1954).
The toxic substances could be partially separated and purified
by precipitation and extraction procedures.
As a preliminary step, one- to four-week-old culture
filtrates, with no preliminary treatment, were tested for
toxicity to red oak leaves . A growth curve of the organism
(Figure 8) was prepared in conjunction with this phase of
the study. While wilting of red oak leaves resulted when
the leaves were placed In the filtrates of two- to four-week-
old cultures there was no evidence of toxic substances in
ducing leaf necrosis. When a polysaccharide-like material
was removed by precipitation with 95 per cent ethanol and
the ethanol removed in vacuo, the culture filtrates were
not toxic within the limits of the experiment.
Fractionation of culture filtrates
The alcohol insoluble fraction. E. fagacearum produced
in culture a gelatinous polysaccharide-like material. Four
20-day-old cultures of the organism grown in the basal medium
were filtered and the filtrate concentrated in vacuo to 30
ml. Enough 95 per cent ethanol was added to bring the alcohol
concentration to 50 per cent. This was stored for several
hours at 0°C after which the gelatinous, grey polysaccharide
material was collected on a filter paper and washed with
warm 95 per cent ethanol. It was redis solved in warm water

Figure 8. Growth of E. fagacearum in the basal medium

81
d r y w e i g h t
20 30 D A Y S

82
again precipitated with ethanol and filtered. This was re
peated until the gelatinous material appeared completely
homogenous after which it was re-dissolved in 3.0 ml hot water
and an equal volume of 3.0 N HgSO^ added. The solution was
heated for three hours under reflux on a steam bath, cooled,
saturated with BaCOg, and the excess BaCOg and BaSO^ removed
by filtration. The solution was then evaporated to dryness
and taken up in 1.0 ml of hot pyridine. This material was
applied to chromatograms and developed for 70 hours by the
descending method?, in BABW. After drying the chromato grams
were sprayed with AHP and heated for five minutes at 100°C•
One spot was observed which proved identical to glucose by
co-chromatography with an authentic sample. Therefore, under
conditions where sucrose was used as a carbon source a poly
saccharide-like material was isolated containing glucose as
the only reducing sugar. The possibility existed that the
polysaccharide was a glueosan.
To determine the nature of the polysaccharide when other
sugars were used as a carbon source, the basal medium was
modified to Incorporate 0.1 M fructose, 1(+) arabinose or
1-xylose in place of sucrose. At the end of 20 days the
cultures were treated in the same manner as indicated pre
viously, to isolate the polysaccharide. Under the condi
tions where arabinose and xylose were used as the carbon
source only one reducing substance corresponding to glucose

83
was isolated. The polysaccharide observed when fructose was
used as the carbon source appeared to contain a small quan
tity of fructose, in addition to glucose. In this case
either a heterogeneous polysaccharide or another polysac
charide distinct from the one containing glucose was present.
To determine if the polysaccharide produced by E. faga
cearum on a sucrose substrate would induce wilting in oak
leaves the polysaccharide was purified from 100 ml of cul
ture filtrate dissolved in 5 ml of distilled water and its
effect on the transpiration of oak leaves measured (Figure 8).
To do this the petiole of each leaf was inserted into a
small vial containing distilled water. The tops of the vials
were sealed so that loss of water occurred only from the leaf
surface. The vial was placed on a balance and weighed every
five minutes over a short period to obtain an estimation of
the normal transpiration rate. After equilibration for 40
minutes, all but 0.1 ml of the water was removed from the
vial with a hypodermic syringe and replaced with 1.0 ml of
the polysaccharide solution. The polysaccharide at this
concentration Induced an immediate response reflected in the
rapid decrease in transpiration. Within a 12 hour period
the leaves in the polysaccharide solution had wilted com
pletely. When a similar experiment was carried out using a
washed spore suspension (three times in double-distilled
water) of E. fagacearum containing approximately 2.5 x 10⁴

84
spores/ml in place of the polysaccharide the response was
similar (Figure 9). These results were typical of the action
of large molecules or spores on the transpiration rate of
leaves (G-auman 1951).
The ether soluble fraction. To 200 ml of the culture
filtrate concentrated in vacuo to 60 ml, 50 ml of peroxide
free diethyl ether was added. The mixture was shaken thor
oughly for five minutes and held in the dark at about 20°C
for one week. The yellow ether layer was then removed and
evaporated in vacuo to dryness. A yellow wax-like residue
remained. The ether soluble fraction was shaken with 10 ml
of distilled water and filtered. This aqueous solution,
which fluoresced bright blue under UV, exhibited no toxicity
to oak leaves. Most of the yellow wax-like material was in
soluble in distilled water. The residue was taken up in 2.0
ml of 95 per cent ethanol in which it was readily soluble.
The solution was banded on a chromatogram and developed in
SAW. After drying, the compound which had an Rf of 0.96
in this solvent could be seen as a very faint yellow band in
visible light and as a bright blue fluorescent band under UV.
It exhibited no color change in the presence of ammonia fumes.
The fluorescent band was eluted from the chromatogram with
95 per cent ethanol and its UV spectrum (Figure 10) deter
mined with the Beekman DU spectrophotometer. At this con
centration the substance did not appear to have any absorption

Figure 9. Decline in the transpiration rate of red oak leaves in a spore suspension of E. fagacearum and a solution of the polysaccharide

86
96
s p o r e s u s p e n s i o 80
c o n t r o l Q
£ 64 CL co z <t
g 48
i
E 32
p o l y s a c c h a r i d e
20
TIME IN MINUTES X 10

Figure 10. The UV absorption spectrum of a substance obtained from culture filtrates of E. f agacearum

88
1.20
1.00
0.80
-10.60
0.40
0.20
0.00 250 275 300 325 400 225 350 375
WAVE LENGTH IN MU

89
maxima in the visible range.
The cation fraction. Exactly 200 ml of the culture
filtrate were evaporated down to 50 ml in vacuo at 36°C»
The filtrate was mixed with 55 ml of 95 per cent ethanol and
the precipitate removed by filtration. The remaining solu
tion was evaporated down to 20 ml and passed through a Dowex
50 x 8 cation exchange resin. This procedure was identical
to that described previously. The cation fraction was con
centrated in vacuo to 1.0 ml, spotted on several chromato-
grams developed two dimensionally in 80 per cent phenol and
BABW. The ninhydrin positive areas were located and out
lined on duplicate chromatograms. After drying the chromato-
grams in a warm oven until all the odor of phenol had dis
appeared they were eluted. Various dilutions of these elu-
ates were examined for toxicity to soy bean seedlings,
variety Clark, in the unifoliate stage, since oak leaves
were no longer available. The eluates were toxic to soy
beans causing interveinal browning followed by rapid death
of the leaf tissue. Duplicate eluates were banded on de
scending chromatograms to resolve the toxic component. Since
the eluates from these chro mato grams proved to be uniformly
toxic it was assumed that some substance in the solvent
employed was responsible. A further study revealed that
phenol at dilutions down to one part in 1 x 10® parts of
distilled water induced an identical response. Subsequent
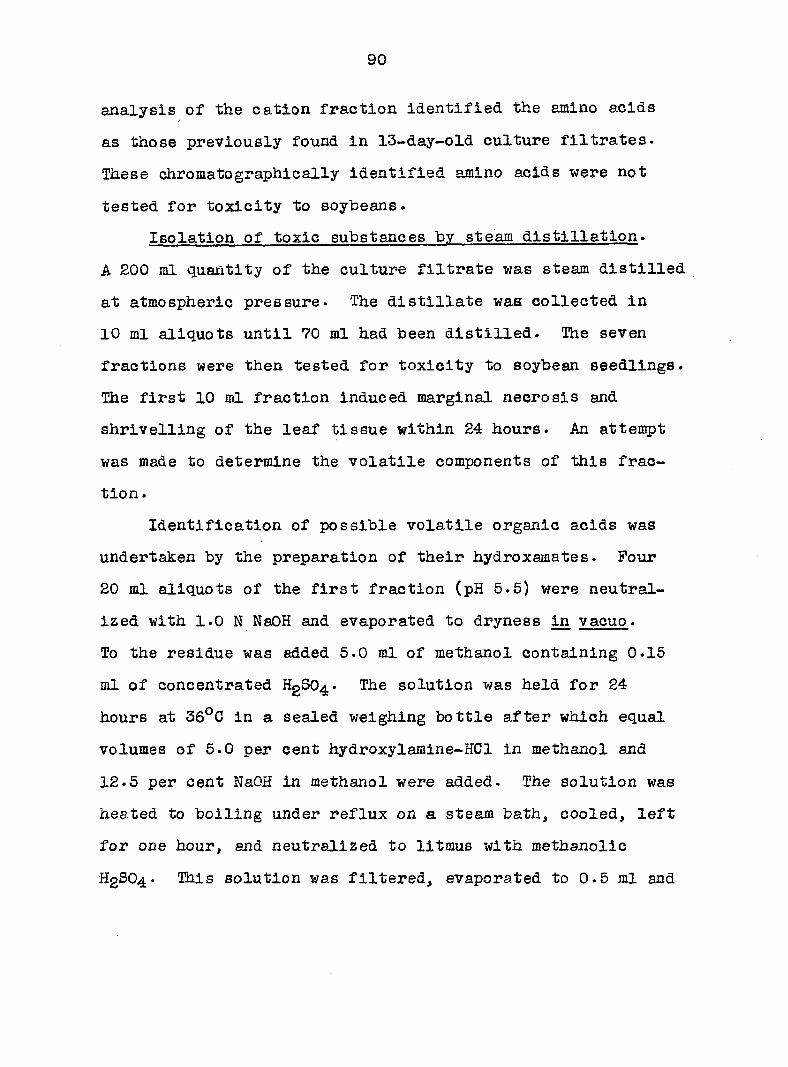
90
analysis of the cation fraction identified the amino acids
as those previously found in 13-day-old culture filtrates.
These chromatographically identified amino acids were not
tested for toxicity to soybeans.
Isolation of toxic substances by steam distillation.
A 200 ml quantity of the culture filtrate was steam distilled
at atmospheric pressure. The distillate was collected in
10 ml aliquots until 70 ml had been distilled. The seven
fractions were then tested for toxicity to soybean seedlings.
The first 10 ml fraction induced marginal necrosis and
shrivelling of the leaf tissue within 24 hours. An attempt
was made to determine the volatile components of this frac
tion .
Identification of possible volatile organic acids was
undertaken by the preparation of their hydroxamates. Four
20 ml aliquots of the first fraction (pH 5.5) were neutral
ized with 1.0 N NaOH and evaporated to dryness in vacuo.
To the residue was added 5.0 ml of methanol containing 0.15
ml of concentrated HgSO^.. The solution was held for 24
hours at 36°C in a sealed weighing bottle after which equal
volumes of 5.0 per cent hydroxylamine-HCl in methanol and
12.5 per cent NaOH in methanol were added. The solution was
heated to boiling under reflux on a steam bath, cooled, left
for one hour, end neutralized to litmus with methanol!c
H2SO4. This solution was filtered, evaporated to 0.5 ml and

91
a small portion tested for the presence of hydroxamates with
FeClg. A faint positive reaction was observed, which corre
sponded to the Rf values of the hydroxamate of acetic acid
prepared in an identical manner from sodium acetate.
To prepare the 2,5,dlnitrophenylhydrazones 20 ml of the
first fraction were mixed with twice their volume of a satu
rated solution of 2,4,dinitrophenylhydrazine in 20 N HCl.
The solution was placed in a boiling water bath for five
minutes whereupon a precipitate formed. After cooling, the
solution was filtered, the precipitate washed with distilled
water and dried. The filtrate was extracted with small por
tions of ethyl acetate. The ethyl acetate solution was con
centrated and chromatographed In ethyl alcohol:petroleum
ether (Skelly B), 80:20 v/v (Block, et al. 1955). Three yel
low spots were observed. Their Rf values were 0.96, 0.75,
and 0.62, respectively. The substance at Rf 0.96 proved
chromatographically identical to the 2,4,dinitrophenylhydra-
zone of acetaldehyde, the substance at Rf 0.62 was unreacted
2,4,dinitrophenylhydrazine. The identity of the substance
corresponding to Rf 0.75 was not known. The crystalline
hydrazone on chromatography in several solvents acted iden
tically to the 2,4,dintrophenylhydrazone of acetaldehyde.
The steam distillate of the culture filtrate which prior
to distillation had been made alkaline with 2N NaOH proved
to be equally as toxic as the steam distilled fraction from

92
untreated culture filtrates. From this information it was
assumed that the volatile acid fraction was probably not
responsible for the observed toxicity of the first fraction
to soybean seedlings. Acetaldehyde in concentrations ex
ceeding one part in 10^ parts of distilled water caused
complete collapse of the leaves and stems of the seedlings. g
At concentrations lower than this, down to one part in 10
parts of distilled water, marginal necrotic spots developed
and general yellowing of the leaf tissue appeared in two
to five days. However the symptoms Induced by acetaldehyde
were the same as those observed in control seedlings after
approximately 10 days In distilled water. These symptoms,
typical of potassium deficiency, that the presence of a
common metabolic intermediate under unbalanced nutritional
conditions hastened their appearance. Since these symptoms
were only superficially similar to those observed on leaves
of soybean seedlings placed in the steam distilled fraction,
the toxic substance in the steam distillate was assumed not
to be acetaldehyde.
Other metabolites from culture filtrates. Determination
of specific products of metabolism In mycelial extracts or
culture filtrates is useful in the elucidation of metabolic
pathways of organisms. Once established, possible toxic
substances can be deduced or hypothesized and precise methods
undertaken to isolate them. In anaerobic culture ethyl

93
alcohol is often the first product of metabolism accumulated
in excess. Since ethanol is a known toxin (G-siumann 1957) an
attempt was made to determine the quantity of ethanol pro
duced in still culture by this pathogen.
A standard curve was prepared from 0.0 to 5.0 per cent
ethanol at 15°C with a Genco specific gravity hydrometer
(0.900 to 1*100). From 15-day-old culture filtrates a 200
ml sample was distilled at atmospheric pressure until 30 ml
of distillate had been collected. The specific gravity of
this solution at 15°C exceeded 1.000 indicating the presence
of contaminating substances. Consequently 200 ml of the cul
ture filtrate were treated with 6.0 N NaOh for 40 minutes to
saponify any esters present, and when cool, with dilute ASN
to oxidize volatile aldehydes and ketones. Distillation of
30 ml of this solution yielded a distillate with specific
gravity of about 1-000. As a consequence it was assumed that
the metabolism of E. fagacearum did not result in the accumu
lation of ethanol. Subsequently, the distillate was re
distilled and the xanthogenate derivatives prepared (Block
et al. 1955). On chromatography in n-butanol saturated
with 5.0 per cent NaHCOg only a trace of ethyl xanthogenate
was observed (Rf 0.28) indicating that ethanol was probably
a transient in metabolism, not accumulated In any quantity.
An indication that metabolism might proceed via ethanol was
observed during initial studies of the mineral requirements

94
of the organism. Growth, after- 40 days in the basal medium
from which zinc had been deleted, averaged 92.6 mg. From
the corresponding controls the average was -363.0 mg. While
zinc undoubtedly has other important roles in metabolism it
is a co-factor requirement for alcohol dehydrogenase.
To establish the presence of keto acids in the culture
filtrate, a 25 ml sample of the filtrate was chilled in an
ice bath and mixed with 50 ml of a cold saturated solution
of 2,4,dinitrophenylhydrazine in 2.0 N HC1. The solution
was held at 36°C for 30 minutes and then extracted with sev
eral small portions of ethyl acetate. The ethyl acetate was
in turn extracted with 1.0 N ammonium carbonate. The alka
line solution was extracted twice with ethyl acetate, chilled,
acidified with cold 2.0 N HC1 and re-extracted with ethyl
acetate. The ethyl acetate fraction was evaporated to dry
ness and dissolved in a minimum of distilled water. The sol
vent n-butanol: ethanol: 0.5 N NH40H(Aronoff 1956), proved
best for the resolution of the keto acid-2,4,dinitrophenyl-
hydrazones. By chromatography with authentic samples pre
pared in an identical manner, pyruvic acid-2,4,dinitropheny1-
hydrazone (Rf 0.43) and °< keto-glutamic acid-2,4,dinitro-
phenylhydrazone (Rf 0.19) were Identified. An unidentified
substance (Rf 0.75) in relatively higher concentration was
also observed. It was not the 2,4,dinitrophenyihydrazone of
oxalacetate or unreacted 2,4,dinitrophenylhydrazine. While

95
no attempt was made to characterize fully this substance
the Rf value (0.62) in tert-amyl alcohol: ethanol: distilled
water, 50:10:40 v/v (Block et; al. 1955) suggested it might
be p-hydroxyphenylpyruvic acid.

96
GENERAL DISCUSSION AND CONCLUSIONS
The experimental work presented herein was undertaken
in the hope of clarifying some biochemical aspects of host-
parasite relationships in oak wilt. Both leaf symptoms and
tylosis formation, a pronounced vascular symptom of this
disease, were studied. While these investigations have not
resulted in an explanation of the fundamental causes of all
the complex symptom developments in oak wilt, some of the
more basic aspects have been resolved. It was concluded
that the role of E. fagacearum in the wilt syndrome cannot
be interpreted fully on the basis of the toxin theory.
Chromatographic and analytical evidence, in addition
to other observations, pointed to nutrient deficiencies as
the primary cause of necrotic and chlorotic leaf symptoms.
These diseased leaves in contrast to healthy leaves exhibited
deficiencies of total nitrogen, phosphorus, soluble carbo
hydrates and free amino acids. Starch accumulation, common
when nutrients or moisture are deficient, also occurred in
diseased leaves. During periods of maximum growth oak leaves
appeared to have a marked tolerance in regard to water re
quirements . By a drought hardening process, achieved per
haps through dehydration of the protoplasm, leaves were able
to survive a severe water shortage. Specific nutrient de
mands for growth and maintenance probably are not so regulated
and therefore, death or chlorosis of tissue eventually re-
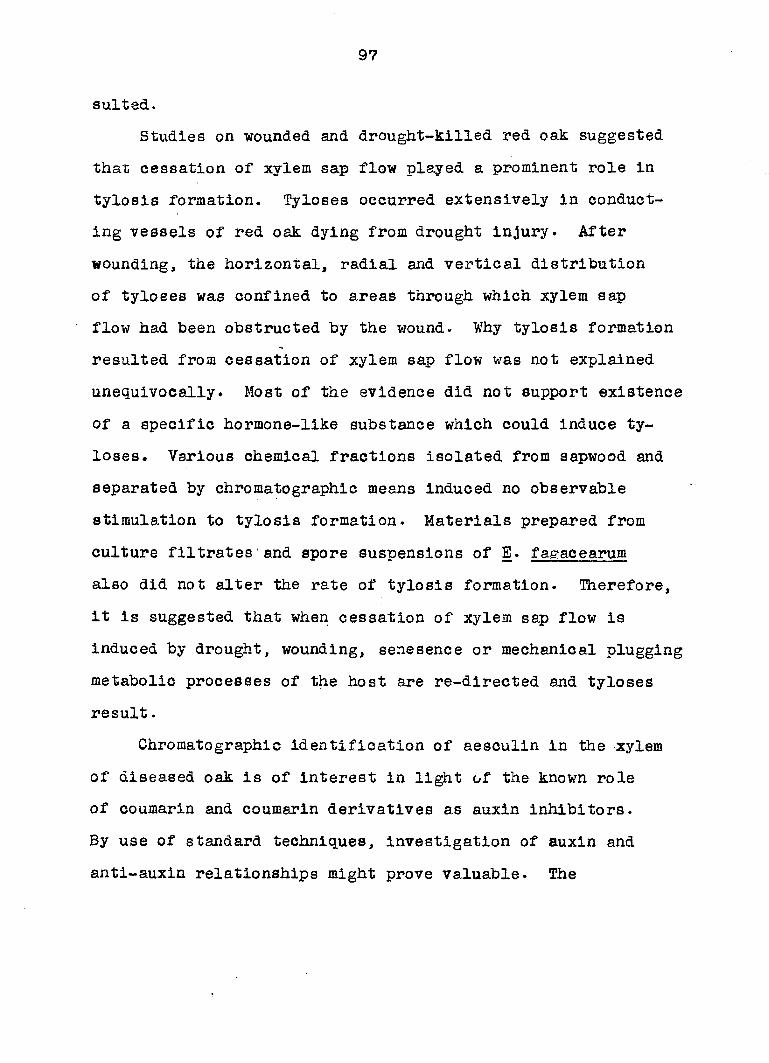
97
suited.
Studies on wounded and drought-killed red oak suggested
that cessation of xylem sap flow played a prominent role in
tylosis formation. Tyloses occurred extensively in conduct
ing vessels of red oak dying from drought injury. After
wounding, the horizontal, radial and vertical distribution
of tyloses was confined to areas through which xylem sap
flow had been obstructed by the wound. Why tylosis formation
resulted from cessation of xylem sap flow was not explained
unequivocally. Most of the evidence did not support existence
of a specific hormone-like substance which could induce ty
loses. Various chemical fractions isolated from sapwood and
separated by chromatographic means induced no observable
stimulation to tylosis formation. Materials prepared from
culture filtrates and spore suspensions of E. fagacearum
also did not alter the rate of tylosis formation. Therefore,
it is suggested that when cessation of xylem sap flow is
induced by drought, wounding, senesence or mechanical plugging
metabolic processes of the host are re-directed and tyloses
result.
Chromatographic identification of aesculln in the xylem
of diseased oak is of interest in light of the known role
of coumarin and coumarin derivatives as auxin inhibitors.
By use of standard techniques, investigation of auxin and
anti-auxin relationships might prove valuable. The

98
remaining identified or partially identified compounds
appeared to be common phenolic or flavonoid constituents of
the host. Their role, if any, in tylosis formation remains
to be determined.
The presence of toxic substances, polysaccharides and
growth stimulants in culture filtrates of E. fagacearum was
demonstrated. The polysaccharlde-like material contained
glucose and was shown to cause wilting of red oak leaves.
Of the fractions assayed for phytotoxic activity only the
steam distillate of culture filtrates was toxic. Studies on
growth stimulants produced in culture failed to reveal any
evidence of indole-type compounds. Chromatographic analyses
of amino acids and other constituents present in culture
filtrates suggested that the amino acids and in particular
methionine were responsible for the observed stimulation of
Avena coleoptile sections. Previously derived conclusions
on the causes of leaf symptoms do not implicate fungus-
synthesized toxins. However, polysaccharides synthesized
by the fungus in addition to various products of host-
parasite interaction could be involved as physical agents in
the plugging mechanism.

99
LITERATURE CITED
Aronoff, Sam. 1956. Techniques of radiobiochemistry. Ames, Iowa, Iowa State College Press.
Beckman, C. H., J. E. Kuntz and A. J. Riker. 1953a. The growth of the oak wilt fungus with various vitamins and carbon and nitrogen sources. Phytopath. 43:441-447.
, , and J. G. Berbee. 1953b. Host responses associated with oak wilt development. Phytopath . 43:448-454.
Bewley, W. F. 1922. "Sleepy disease" of the tomato. Ann. Appl. Biol. 9:116-134.
Block, R. 1952. Wound healing in higher plants 2. Bot. Rev. 18:655-682.
Block, R. J., B. L. Durrum and G- Zweig. 1955. A manual of paper chromatography and paper electrophoresis. New York, N. Y-, Academic Press, Inc.
Bollard, E. G. 1963. Movement of nitrogenous substances of apple tree sap. Nature (London) 171:671-672.
Bonner, J. and J. English, Jr. 1938. A chemical and physiological study of traumatin a plant wound hormone. Plant Physiol. 13:331-348.
Brandes, E. W. 1919. Banana wilt. Phytopath. 9:339-389.
Brown, A. B. and R. G- H. Cormack. 1937. Stimulation of cambium activity, locally in the region of application and at a distance in relation to a wound, by means of heteroauxin. Canad. Jour. Res. 15:433-441.
Burrows, S., F. S. M. Grylls and J. S. Harrison. 1952. Paper chromatography of phosphoric esters. Nature (London) 170:800-801.
Chattaway, Margaret M. 1949. The development of tyloses and secretion of gum in heartwood formation. Austral. Jour. Sci. Res. (B) 2:224-240.
Chrysler, M. A- 1908. Tyloses in tracheids of conifers. New Phytol. 7:198-204.

100
Clarke, D. D- and F. F. Nord. 1955. Simple benzene derivatives . In Paech, K. and H. V. Tracey, eds. Moderne Methoden der Pflanzenanalyse. Vol. 3, pp. 332-360. Berlin. Germany, Springer-
Clinton, G. P. and Florence A. McCormick. 1936. Dutch elm disease. Conn. (New Haven) Agr. Exp. Sta. Bui. 389: 701-752.
Consden, R. 1948. Partition chromatography on paper, its scope and application. Nature (London) 162:359-361.
Cook, A- H-, S. F. Cox, T. H. Farmer and M. S. Lacey. 1947. Production of antibiotics by Fusaria. Nature (London) 160:31-32.
Davis, E. A. 1949. Effects of several plant growth regulators on wound healing of sugar maple. Bot. Gaz. Ill: 69-77.
Davis, David and A. E. Dimond. 1954. The source and role of phenols in Fusarium wilt symptoms• Phytopath. 44: 485-486.
and P. E. Waggoner. 1953. Conjugated phenols in the Fusarium wilt syndrome. Nature (London) 172:959-961.
Dimond, A. E. 1955. Pathogenesis in the wilt diseases. Ann. Rev. Plant Physiol. 6:329-350.
and p. E. Waggoner. 1953a. On the nature and role of vivotoxins in plant disease. Phytopath. 43:229-235.
and 1953b. The cause of eplnastic symptoms in Fusarium wilt of tomatoes. Phytopath. 43;663-669.
, G. H. Plumb, E. M. Stoddard and J. G- Horsfall. 1949. An evaluation of chemotherapy and vector control by insecticides for controlling Dutch elm disease. Conn. (New Haven) Agr. Exp. Sta. Bui. 531:1-69-
Engelhard, A. W. 1955. Host parasite relationships of Endoconldlophora fagacearum Bretz, the cause of oak wilt. Unpublished Ph. D. Thesis. Ames, Iowa, Iowa State College Library.
and W. H. Bragonier. 1957. Dwarf leaf, a symptom of oak wilt. (Abstract) Phytopath. 47:10.

101
English, J. Jr., J. Bonner and A. J• Haagen Smit. 19-39. Structure and synthesis of a plant wound hormone. Science 90:329.
Esau, Katherine. 1949. Anatomic effects of the viruses of Pierce's disease and phony peach. Hilgardia 18:423-482.
Fergus, G. L. and D. G. Wharton. 1957. Production of pec-tinase and growth promoting substances by Oeratocystis fagacearum. Phytopath. 47:635-635.
Gaumann, E. 1951. Some problems of pathological wilting in plants. Adv. Enzym. 11:401-437.
1957. Fusaric acid as a wilt toxin. Phytopath. 47:342-357.
, St. Roth, L. Ettlinger, P. A. Plattner and U. Nager. 1947. Enniatin, ein neves, gegen Mykobakterien wirksames Antibioticum. Experientia 3;202.
Geissman, T- A. 1955. Anthocyanins, chalcones, aurones, flavones and related water soluble plant pigments. In Paech, K. and M. V. Tracey, eds. Moderne Methoden der Pflanzenanalyze. Vol. 3, pp. 450-498•
Gerry, Bloise. 1914. Tyloses : their occurrence and practical significance in some American woods. Jour. Agr. Res. (U.S.) 1:445-469.
Goodwin, R. H. and Kavanaugh. 1949. The isolation of scopo-letin, a blue fluorescing compound from oat roots. Bui. Torrey Bot. Club 76: 255-265.
Gore, D. N. 1951. The detection of acids on paper partition chromatograms. Chem. and Ind. 4:479.
Gothoskar, S. S., R. p. Scheffer, J. G• Walker and M. A-Stahmann. 1953. The role of pectic enzymes in Fusarium wilt of tomato. Phytopath. 43:535-536.
Haberlandt, G. 1921. Wundhormone als erreger von zell-teilungen. Beitr. Allg. Bot. 2:1-53 «
Hammet, F. S. and S. S. Chapman. 1938. Correlation between sulf hydrymitosis and cell growth in length of roots of Phaseolus vulgaris. Growth 2:297-302.
Hanes, C. S. 1940. The reversible formation of starch from glucose-l-phosphate catalyzed by potato phosphorylase. Proc. Roy. Soc. (London)(B) 129:174-208.

102
Hodgson, R., W. H. Peterson and A. J. Riker. 1949. The toxicity of polysaccharides and other large molecules to tomato cuttings. Phytopath. 30:47-62.
Hoffman, P. F. 1954. Physiology of Endo c onidlopho r a f agace arum Bretz, 1. Factors influencing growth and toxin production. Iowa State Coll. Jour. Sci. 29;27-38.
Hutchinson, G. H. 1913. Rangpur tobacco wilt. Memoirs India Agr. Dept., Bact. Series 1:67-84.
Klein, G. 1923. Zur Atiologie der Thyllen. Zeitschrift fur Botanik 15:418-439.
Kuster, E. 1925. Pathologische pflanzenanatomie. 2nd ed. Jena, Germany, Gustav Fisher.
LaRue, G. D. 1941. The effect of wounding and wound hormones on root formation. Proc. Nat. Acad. Sci. 27: 388-392.
Maizel, J. W., A. A. Benson and N. E. Tolbert- 1956. Identification of phosphoryl choline as an important constituent of plant saps. Plant Physiol. 31:407-408.
Nitsch, J. P. and Collette Nitsch. 1956. Studies on the growth of coleoptlle and first internode sections. A new sensitive, straight-growth test for auxins. Plant Physiol. 31:94-111.
Powers, H. R., Jr. 1954. The mechanism of wilting in tobacco plants affected by black shank. Phytopath. 44;513-521.
Roberts, E. A. H. and D. J. Wood. 1951. A study of polyphenols in tea leaf by paper chromatography. Biochem. J our. 49:414-422.
Rosen, H. R. 1926. Efforts to determine the means by which the cotton wilt fungus, Fusarium vasinfectum induces wilting. Jour. Agr. Res! 33:1143-1163.
Rudolph, E. E. 1922. Verticillium hadromycosis. Hilgardia 5:201-361.
Sleeth, B. 1933. Relationship of Fusarium nlveum to the formation of tyloses in melon plants. (Abstract) Phytopath. 23:33.

103
Struckmyer, Esther B., C- H. Beckman, J. E. Kuntz and A. J. Riker. 1954. Plugging of vessels by tyloses and. gums in wilting oaks. Phytopath. 44:148-153.
Sumner, J. B., T. C. Ghou and A. T. Bever. 1950. Phosphorylase of jack bean. Arch. Biochem. 25:1-5.
Swain, T. 1953. The identification of coumarins and related compounds by filter paper chromatography. Bio-chem. Jour. 53:200-208.
van der Meer, J. H. H. 1926. Vertieillium wilt of maple and elm seedlings in Holland. Phytopath. 16:611-614.
Waggoner, P. E. and A- E. Dimond. 1955. Production and role of extracellular pectic enzymes of Fusarium oxysporum f. lycoperslci. Phytopath. 45:79-87.
Ward, Gr. H. and F. B. Johnston. 1953. Chemical methods of plant analysis. Canada Dept. of Agr., Chemistry Div. Contrib. No. 238.
White, Irene G-. 1955. Toxin production by the oak wilt fungus Endoconidiophora fag acearum Bretz. Amer. Jour. Bot. 42:759-764.
Widdowson, E. M. 1932. Physiology of apples. 13. Starch and hemicellulose contents of developing apples. Ann. Bot. 46:597-631.
Williams, S. 1942. Secondary vascular tissues of the oaks indigenous to the U. S. 2. Types of tyloses and their distribution in Erythobalanus and Leucobalanus. Bui. Torrey Bot. Club 69:1-10.
Winstead, N. N. and J. C. Walker. 1954. Production of vascular browning by metabolites from several pathogens. Phytopath. 44:153-158.
Yabuta, T., K. Kambe and T. Hayashi. 1934. Biochemistry of the bakanae fungus. I. Fusarinie acid a new product of the bakanae fungus. Jour. Agr. Chem. Soc. Japan 10:1059-1068.
Young, Roy Alton. 1949. Studies on oak wilt caused by Chalara querclna. Phytopath. 39:425-441.
Zentmyer, G-. A. 1942. Toxin formation by Ceratostomella ulml. Science 95:512-513.
104
ACKNOWLEDGEMENTS
The author wishes to thank Professor H. S. McNabb, Jr.
for guidance and encouragement during the period of this
research.
Appreciation is expressed to the Iowa State Conserva
tion Commission for their continued support of the oak wilt
project and to Professor W• H. Bragonier for criticism of
the manuscript.