Photos placed in horizontal position with even amount of ...
17
Sandia National Laboratories is a multi-program laboratory managed and operated by Sandia Corporation, a wholly owned subsidiary of Lockheed Martin Corporation, for the U.S. Department of Energy’s National Nuclear Security Administration under contract DE-AC04-94AL85000. Photos placed in horizontal position with even amount of white space between photos and header Tritium Gas Analysis Capabilities and Results from Sandia National Laboratories Russell Jarek, Henry Peebles, Jessica Bierner 37 th Tritium Focus Group Meeting, October 26, 2016
Transcript of Photos placed in horizontal position with even amount of ...

Sandia National Laboratories is a multi-program laboratory managed and operated by Sandia Corporation, a wholly owned subsidiary of Lockheed Martin Corporation, for the U.S. Department of Energy’s National Nuclear Security Administration under contract DE-AC04-94AL85000.
Photos placed in horizontal position with even amount of white space
between photos and header
Tritium Gas Analysis Capabilities and Results from Sandia National LaboratoriesRussell Jarek, Henry Peebles, Jessica Bierner37th Tritium Focus Group Meeting, October 26, 2016

Capabilities Overview Quantitative measurement of permanent gases, particularly including
the hydrogen isotopes (HDT) Thin film desorption Gas cylinder samples Grab samples from sealed systems
Calorimetry Bulk tritium quantitative measurement Waste stream
JEOL M‐Station High‐res & high‐mass Various sample inlet options
2
Outline

Requirements for Quantitative Mass Spectral Analysis
Mass Spectrometer
Stable instrument ion source and detector
Gas Standard(s) for detector sensitivity calibration
Sufficient mass resolving power
Total molar quantity measurement
Stable in‐situ pressure measurement (Baratron CP gauge)
Calibrated source of molar quantity gas
Calibrated leaks and accumulation time
High‐precision pressure gauge in known volume
3

4
0 5 10 15 20 25 30-2.0
-1.5
-1.0
-0.5
0.0
0.5
1.0
1.5
2.0
-2
Rel
ativ
e D
rift f
rom
Prio
r D2 S
ensi
tivity
(%)
Pre-Analysis Calibration RunsMay 2016 - Oct. 2016
+2
Mass Spec Sensitivity Stability

HDT Standards and Measurement
• In a environment which provides a mechanism for dissociation, the hydrogen molecules exchange isotopes to establish thermodynamic equilibrium.
H2 + D2 ↔ 2HD H2 + T2 ↔ 2HT
D2 + T2 ↔ 2DT
• The mass spectrometer measures each of the six molecular isotope species. Given initial H2′ , D2′ , and T2 ′, the concentration of the six molecular isotopes can be calculated from the equations from known equilibrium constants (Jones 1949 & 1967):
)D()H()HD(
22
2
XXXKHD
)T()H(
)HT(
22
2
XXXKHT
)()()(
22
2
TXDXDTXK DT
@ 298 K: 3.26 2.57 3.82
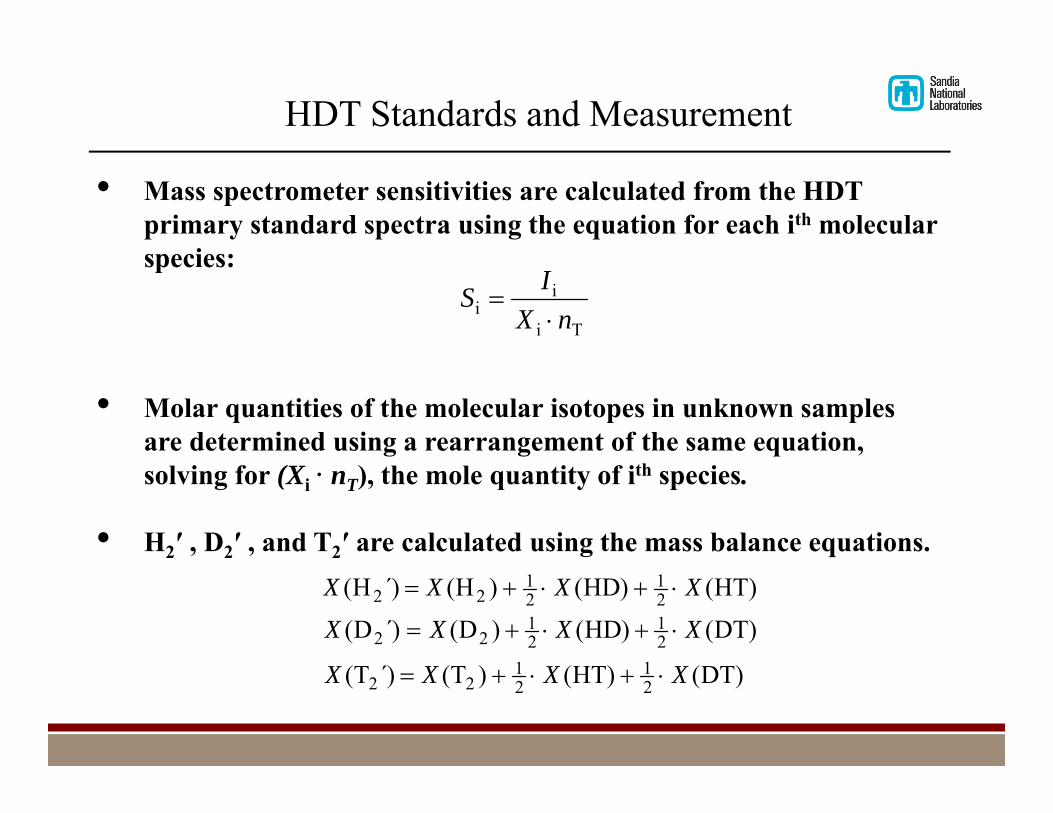
• Mass spectrometer sensitivities are calculated from the HDT primary standard spectra using the equation for each ith molecular species:
• Molar quantities of the molecular isotopes in unknown samples are determined using a rearrangement of the same equation, solving for (Xi · nT), the mole quantity of ith species.
• H2′ , D2′ , and T2′ are calculated using the mass balance equations.
Ti
ii nX
IS
HDT Standards and Measurement
)HT()HD()H()́H( 21
21
22 XXXX
)DT()HD()D()́D( 21
21
22 XXXX
)DT()HT()T()́T( 21
21
22 XXXX

HDT Standards and Measurement
3.005 3.010 3.015 3.020 3.025 3.030
0
2000
4000
6000
8000
TCV-04
HD
3He
20X
Inte
nsity
(mV
)
Atomic Mass Units
1X
T +

Determine nT by Pressure-Volume StandardParoScientific 6000-15A
8 to 775 Torr, 3.7 mLTRnVP
Precisely (0.1%) measures and internally captures a known molar quantity of gas.
Gas expansions measure internal effective volumes (n / P) of adjacent vessels.
Good absolute accuracy (1%, 2) of measured “N/P” functions transferred to Baratron response
eff,ff
oo VP
VP
PnTR
V /eff

Desorption Calibration Curve for Inlet System
...
C
AC
B
ABA
A
AT T
TVTTVV
RTPnRather than:
systemN/P PPnT Just:

System Check – N/P Control Chart
2/1/2005 5/1/2005 8/1/2005 11/1/2005 2/1/2006
-1.0
-0.5
0.0
0.5
1.0
1.5
2.0
2.5
3.0
LCL (-0.8%)
%
in N
/P R
elat
ive
to C
alib
ratio
n E
quat
ion
Date
PV-STD TC Readout Changed
Furnace TCChanged BJ Changed
Furnace TCReadoutAdjusted
BJ Shifted
BJ Changed
UCL (0.8%)

11
HDT Gas Standard Comparison
10/1/2014 2/1/2015 6/1/2015 10/1/2015-1.0
-0.5
0.0
0.5
1.0
H/D 77 / 79 T/D 77 / 79 H/D 77 / 80 T/D 77 / 80
Pe
rcen
t Diff
eren
ce
Measurement Date
TCV-77 (5-65-30) TCV-79 (35-35-30) TCV-80 (10-80-10)

Thermal Battery Internal Gas Sampling

13
Li(Si)/FeS2 Thermal Battery Aging Study• Battery-like units built with modern production
process, material of known pedigree (and stored)• Two acceleration factors selected
– Temperature (classic Arrhenius)» Temperature selections based on historical
accelerated aging levels (1980’s testing)– Water
» Only confirmed aging mechanism for thermal batteries is water reaction- forms basis for leak rate measurement
» Leak rate can’t be easily controlled, so water was added to the battery instead
• Times selected for convenience
Variable LevelsTemperature 75°C, 130°C, 180°CTime 3m, 6m, 12m, 24m (75°C only)Water content Dry to best efforts, insulation exposed to moist air
Battery‐like unit• All battery materials except
ignitor or heat paper• Fiberfrax insulation• Stack shimmed to 250 PSI• Welded stainless steel can

14
Thermal Battery Internal Gas from Aging Study

15
Thermal Battery Internal Gas from Aging Study

Calorimetry For Non-Intrusive Tritium Measurement
Sample Well12”x12”x30”
Tritium Capture System (TCS) absorbs tritiated waste onto molecular sieve bedsProblem: To maintain regulatory compliance for disposal, the amount of tritium in the sieve beds must be declared.
Calorimeter
Other Uses:- Helps to check reported tritium inventory- The 100% tritium bottles are usable as calibration standards for the calorimeter - First TCS waste sieve bed measurements made in FY16
0 1 2 3 4 5 6
0
5
10
15
20
25
30
Hea
t Pow
er (m
W)
Signal (mV)
Equation y = Intercept + B1*x^1 + B2*x^2Weight No WeightingResidual Sum of Squares
1.05389E-5
Adj. R-Square 1Value Standard Error
BIntercept -0.00227 0.00255B1 5.15779 0.00227B2 -4.54516E-4 3.5701E-4
Calorimeter Calibration Curve
Technology: Differential heat-flow from the radioactive decay produces a voltage that is proportional to the quantity of tritium in the container cell vs. reference cell.
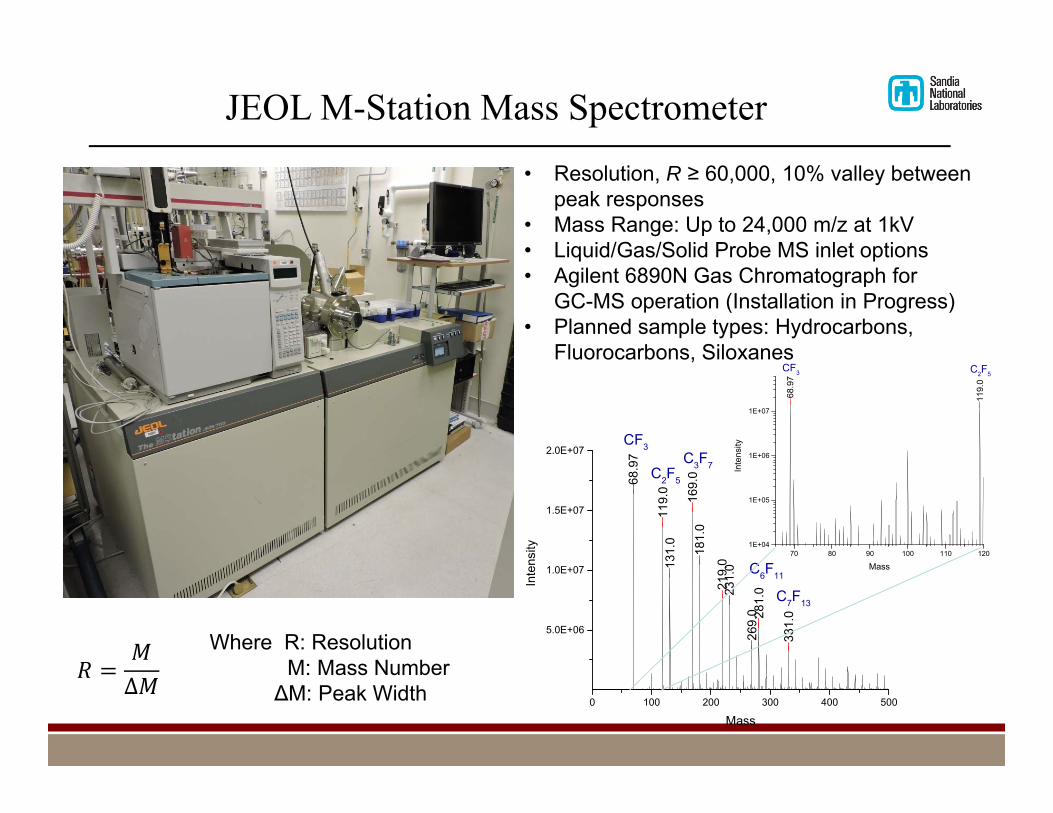
JEOL M-Station Mass Spectrometer
0 100 200 300 400 500
5.0E+06
1.0E+07
1.5E+07
2.0E+07
68.9
7
119.
013
1.0
169.
018
1.0
219.
023
1.0
269.
0 281.
0
331.
0
C2F5
C7F13
C6F11Inte
nsity
Mass
CF3C3F7
70 80 90 100 110 1201E+04
1E+05
1E+06
1E+07
68.9
7
119.
0
C2F5
Inte
nsity
Mass
CF3
• Resolution, R ≥ 60,000, 10% valley between peak responses
• Mass Range: Up to 24,000 m/z at 1kV• Liquid/Gas/Solid Probe MS inlet options• Agilent 6890N Gas Chromatograph for
GC-MS operation (Installation in Progress)• Planned sample types: Hydrocarbons,
Fluorocarbons, Siloxanes
∆
Where R: ResolutionM: Mass Number
∆M: Peak Width