Phenotypical and biochemical analysis of BACE1 and BACE2 ... · Dominguez et al., 2005 E-Secretase,...
33
Dominguez et al., 2005 Phenotypical and biochemical analysis of BACE1 and BACE2 deficient mice Diana Dominguez 1 *, Jos Tournoy 1 *, Dieter Hartmann 1 , Tobias Huth 5 , Kim Cryns 3 , Siska Deforce 1 , Lutgarde Serneels 1 , Ira Espuny Camacho 1 , Els Marjaux 1 , Katleen Craessaerts 1 , Anton J.M. Roebroek 1 , Michael Schwake 2 , Rudi D'Hooge 4 , Patricia Bach 6 , Ulrich Kalinke 6 , Dieder Moechars 3 , Christian Alzheimer 5 , Karina Reiss 2 , Paul Saftig 2 §, Bart De Strooper 1 § Running title: BACE1 and BACE2 deficient mice * These authors contributed equally to this work § to whom correspondence should be addressed 1 Center for Human Genetics, K.U. Leuven and Flanders Interuniversity Institute for Biotechnology VIB 4, Herestraat 49, 3000 Leuven, Belgium. 2 Department of Biochemistry, University Kiel, Eduard-Buchner-Haus, Otto-Hahn-Platz 9, D-24118 Kiel, Germany. 3 Johnson & Johnson Pharmaceutical Research and Development, Turnhoutseweg 30, B-2340 Beerse, Belgium. 4 Laboratory of Biological Psychology, K.U.Leuven, Tiensestraat 102, B-3000 Leuven, Belgium. 5 Department of Physiology, University Kiel, Olshausenstr. 40, D-24098 Kiel, Germany 6 Division of Immunology, Paul Ehrlich Institute, Paul-Ehrlich-Str. 51-59, D-63225 Langen, Germany 1 JBC Papers in Press. Published on June 29, 2005 as Manuscript M505249200 Copyright 2005 by The American Society for Biochemistry and Molecular Biology, Inc. by guest on November 27, 2018 http://www.jbc.org/ Downloaded from
Transcript of Phenotypical and biochemical analysis of BACE1 and BACE2 ... · Dominguez et al., 2005 E-Secretase,...
Dominguez et al., 2005
Phenotypical and biochemical analysis of BACE1 and BACE2 deficient mice
Diana Dominguez1*, Jos Tournoy1*, Dieter Hartmann1, Tobias Huth5, Kim Cryns3, Siska Deforce1, Lutgarde Serneels1, Ira Espuny Camacho1, Els Marjaux1, Katleen Craessaerts1,
Anton J.M. Roebroek1, Michael Schwake2, Rudi D'Hooge4, Patricia Bach6, Ulrich Kalinke6,Dieder Moechars3, Christian Alzheimer5, Karina Reiss2, Paul Saftig2§, Bart De Strooper1§
Running title: BACE1 and BACE2 deficient mice
* These authors contributed equally to this work § to whom correspondence should be addressed 1Center for Human Genetics, K.U. Leuven and Flanders Interuniversity Institute for BiotechnologyVIB 4, Herestraat 49, 3000 Leuven, Belgium.2Department of Biochemistry, University Kiel, Eduard-Buchner-Haus, Otto-Hahn-Platz 9, D-24118Kiel, Germany.3Johnson & Johnson Pharmaceutical Research and Development, Turnhoutseweg 30, B-2340 Beerse,Belgium.4Laboratory of Biological Psychology, K.U.Leuven, Tiensestraat 102, B-3000 Leuven, Belgium.5Department of Physiology, University Kiel, Olshausenstr. 40, D-24098 Kiel, Germany6Division of Immunology, Paul Ehrlich Institute, Paul-Ehrlich-Str. 51-59, D-63225 Langen, Germany
1
JBC Papers in Press. Published on June 29, 2005 as Manuscript M505249200
Copyright 2005 by The American Society for Biochemistry and Molecular Biology, Inc.
by guest on Novem
ber 27, 2018http://w
ww
.jbc.org/D
ownloaded from
Dominguez et al., 2005
-Secretase, or BACE1, is the rate limiting protease for the generation of the amyloid -peptide in Alzheimer’s disease. Mice in whichthe BACE1 gene is inactivated are reported tobe healthy. However, the presence of a homologous gene encoding BACE2 raises thepossibility of compensatory mechanisms. Therefore, we have generated BACE1, BACE2 and double knock out mice. We report here that BACE1 mice display a complex phenotype. A variable but significant number of BACE1 offspring dies in the first weeksafter birth. The surviving mice remain smallerthan their littermate controls and present a hyperactive behaviour. Electrophysiologically,subtle alterations in the steady state inactivation of voltage-gated sodium channels in BACE1 deficient neurons are observed. In contrast, BACE2 knock out mice display an overall healthy phenotype. Combined deficiency of BACE2 and BACE1 enhances,however, the BACE1-/- lethality phenotype.At the biochemical level we confirm that BACE1 deficiency results in an almostcomplete block of A generation in neurons, but not in glia. As glia are ten times moreabundant in brain than neurons, our data indicate that BACE2 could indeed contribute to A generation in the brain of AD and inparticular of Down’s syndrome patients.In conclusion, our data challenge the general idea of BACE1 as a safe drug target and call for some caution when claiming that no major side effects should be expected from blocking BACE1 activity.
Alzheimer’s disease (AD) is the most commoncause of dementia for which neither a gooddiagnostic test nor an effective treatment is available yet. The most widely acceptedhypothesis states that AD is initially triggered by the abnormal accumulation and possiblydeposition of a small peptide, amyloid (A in different brain regions, which in turn initiates a pathogenic cascade that ultimately leads to neuronal death, AD pathology and dementia. Ais cleaved out from a long, membrane-boundprecursor, the amyloid precursor protein (APP) by two consecutive cleavages. - and -secretaseare the enzymes that liberate, respectively, the N-
and the C-terminus of A , and are the subject of intense investigation because of their relevanceas candidate therapeutic targets to treat AD.BACE1 and BACE2 are two highly homologousmembrane-bound aspartyl proteases that canprocess APP at the -secretase site (1-8).Although both enzymes exhibit many of thecharacteristics expected for -secretase, it has been quite convincingly demonstrated that BACE1 is in fact the major -secretaseresponsible for A generation in brain (9-11).Contrary to BACE1, BACE2 is more highlyexpressed in peripheral tissues, but also to someextent in the brain (2,12,8,13) raising the question whether BACE2 could contribute to the generation of the brain A pool. Both BACE1 and BACE2 can cleave APP in vitro not only atthe Asp1 position (numbering considering the first amino acid of A as position 1) but also at internal sites within the A region. BACE1cleaves between amino acids 10 and 11 of Aresulting in an N-terminally truncated peptidethat is considered more amyloidogenic and moreneurotoxic than full-length A (14) and whichhas been observed in senile plaques (15,16). The internal BACE2 cleavage site is between aminoacids 19 and 20 (8,17,18) and the resulting Apeptide has thus far not been found in senile plaques. Moreover, BACE2-transfected cells produce reduced levels of A (2,8,13,18) andselective knock-down of endogenous BACE2 in HEK293 cells by RNAi elevates A secretion(19). These observations led to the suggestionthat BACE2 does not function as a -secretasebut rather as an -like secretase that precludesA formation (17-20). However, this in vitroobservations can not rule out a possiblecontribution of BACE2 to the A pool in brain,and it has even been suggested that BACE2-mediated APP cleavage might play a role in the development of AD in individuals carrying theFlemish familial AD mutation in APP (8) as wellas in the AD-like disease associated with Down’ssyndrome (12,21). From a therapeutic point of view, there areincreasing concerns with using -secretaseinhibitors to treat AD. -Secretase processes agrowing number of membrane proteins and blocking their cleavages is likely to have toxic side effects. Indeed, administration of a potent -
2
by guest on Novem
ber 27, 2018http://w
ww
.jbc.org/D
ownloaded from
Dominguez et al., 2005
secretase inhibitor to mice resulted in markeddefects on lymphocyte development and on theintestine villi and mucosa (22), as was alsoobserved in presenilin deficient mice (23). On thecontrary, BACE1 appears as a promising drugtarget, since genetic ablation of the BACE1 gene in mice does not seem to be associated with anygross abnormality (9-11). Moreover, BACE1 deficiency could prevent the learning and memory impairments and the cholinergic dysfunction observed in a transgenic mousemodel for AD (24). Whereas BACE1 function might still be required under particular conditions that may have escaped detection, these resultshighlight BACE1 as one of the best available drug targets for AD. At this point, however, it cannot be excluded that BACE1 has importantfunctions in vivo and that the apparent lack ofphenotype in BACE1 knock out mice is due to the activation of compensatory mechanisms or to genetic redundancy. Because of their high homology, BACE2 is the best candidate protease to compensate for the absence of BACE1function. Based on this homology, it is also likely that active site inhibitors for BACE1 will affect in addition BACE2 protease activity.In order to better understand the biologicalfunctions of BACE1 and BACE2, to analysepossible overlapping functions of these twoproteases and in an attempt to predict theconsequences of blocking BACE function invivo, we generated mice with inactivated BACE1and/or BACE2 genes. Unexpectedly and in contrast to what has been published for BACE1 knock out mice, we do observe a phenotypeassociated with BACE1 deficiency, namely ahigher mortality rate early in life. BACE2 knockout mice are fertile and viable, with no majorphenotypic alteration. Most importantly, micewith inactivated BACE1 and BACE2 genes arefertile and viable but present neonatal mortalitythat is even higher than that of the monogenicBACE1 line. These results suggest that BACE2 indeed partially compensates for the absence ofBACE1 in BACE1 knock out mice and thattherapeutic inhibition of BACE function mayresult in adverse side effects.
EXPERIMENTAL PROCEDURES
Antibodies- The C-terminal specificantibody for mouse BACE1 (B48) was raised inNew Zealand White rabbits using the synthetic
peptides CLRHQHDDFADDISLLK. Rabbit antibodies B7/8 against A and B63 raisedagainst the C-terminus of human APP, have already been described (25,26, respectively).Anti-flag monoclonal antibody is from Sigma.The human anti-A antibody N-terminal specific, 82E1, is from IBL, Japan.
Plasmid construction- cDNAs to beexpressed in non-neuronal cells were sub-cloned into a derivative of the eukaryotic expressionvector pSG5 (Stratagene) that contains a largerpolylinker (pSG5**, polylinker: EcoRI,SpeI,SacII, HindIII, NotI, XhoI, SmaI, SacI, BamHI, BglII). BACE1 cDNA was amplifiedfrom mouse brain RNA using the primers 5’GGATTCATGGCCCCAGCGCTGCACTGGCT 3’ and 5’ GAGCTCTCACTTGAGCAGGGAGATGTCATC 3’ (SacI site underlined) and directly cloned into pGEM-T (Promega). The SacI-SacII fragment was subsequently sub-cloned into the SacI-SacII sites of pSG5**.BACE2 cDNA was amplified from mousepancreas cDNA using the primer set5'ATGGGCGCGCTGCTTCGAGCAC 3' and 5’ TCATTTCCAGCGATGTCTGAC 3’ and cloned into the pGEM-T vector. The XmaIII fragment of pGEM-T-mBACE2 was subsequently subcloned into the SmaI site of pSG5**. For the cloning of BACE2 cDNA containing a deletion of exon 6(BACE2 E6), two subfragments of the cDNA where separately amplified using primers that contain the deletion: the 5’ fragment was amplified using T7 as forward and 5’AGAAAACTCTGGAATCTCTCTGCAGTCCAGGTTGAGGTTCTGG 3’ as reverse primer. For the 3’ fragment, the primer set 5’ CTGGACTGCAGAGAGATTCCAGAGTTTTCTGATGGCTTCTGGAC 3’ and 5’ GCTGCAATAAACAAGTTCTGCT 3’ was used. Purified 5’ and 3’ sub-fragments weremixed together and PCR amplified using the T7-and 5’ GCTGCAATAAACAAGTTCTGCT 3’primers. The PCR product was digested withEcoRI and BamHI and cloned in the same sites ofpSG5**. Cloning of BACE2 and BACE2 E6containing a C-terminal flag epitope was done by PCR amplification on pSG5**BACE2 and pSG5**BACE2 E6, respectively, using theprimers 5’ CGGAATTCCACCATGGGCGCGCTGCTTCGAGCA 3’ (EcoRI site underlined) and5’ CGGGATCCTCATTTATCGTCGTCATCCTT
3
by guest on Novem
ber 27, 2018http://w
ww
.jbc.org/D
ownloaded from

Dominguez et al., 2005
GTAGTCTTTCCAGCGATGTCTGACTAGT 3’ (BamHI site underlined; flag epitope in italics). PCR products were digested with EcoRI/BamHIand cloned into the same sites of the pSG5** vector. All constructs were verified bysequencing.For expression in neuronal and glial cells,cDNAs were cloned into Semliki Forest virus-1 (SFV-1). Cloning of SFV-APPwt, SFV-APPsw and SFV-APPfl have already been described(27,28).
Primary cultures and cell lines- Medium,serum and supplements for maintenance of cells were obtained from Invitrogen. COS cells andadult mice fibroblasts were maintained in Dulbecco’s modified Eagle’s medium/F12 (1:1) supplemented with 10% foetal calf serum.Primary neuronal cultures were generated fromtrypsinized brains obtained from 14-days-oldembryos and were maintained in Neurobasal medium (Invitrogen) supplemented with B27 and0.5 μM L-glutamine. 5 μM cytosine arabinoside were added 24 hours after plating to prevent non-neuronal (glial) cell proliferation. For glial cell cultures, the Neurobasal medium was replaced byMEM-HS medium (MEM medium (Invitrogen)supplemented with 10% horse serum, 0.225%NaHCO3, 2 mM L-glutamine and 0.6% glucose. Cultures were maintained at 37°C in a humidified5% CO2 atmosphere.
DNA transfer and metabolic labelling- COS cells were plated in 6 cm2 plates one daybefore transfection. Approximately 70-80%confluent cells were transfected with total 2 μg of DNA (1 μg of APP- and 1-μg of BACE-plasmids) and 6 μl of FuGene (Roche). Two daysafter transfection cells were metabolicallylabelled with 100 μM/ml [35S]methionine for 4hours, the conditioned medium was collected andcells were directly lysed in DIPA buffer (50 mMTris/HCl pH 7.8, 150 mM NaCl, 1% Triton X-100, 1% sodium deoxycholate and 0.1% SDS). Neurons were maintained in neurobasal mediumand ~48 hours after the addition of cytosinearabinoside they were infected with recombinantSemliki Forest Virus (SFV). Glial cells were maintained for ~1 week in MEM-HS medium,passaged at least once and infected with recombinant SFV ~48 hours after trypsinization (this treatment ensured the absence of neurons in the culture). For both neurons and glia cells, a 10-fold dilution of SFV encoding either wild-
type APP (APPwt), or APP containing theSwedish- (APPsw) or the Flemish (APPfl) familial Alzheimer’s disease mutations wasadded to the cultures and infection proceeded for one hour. Conditioned medium containing thevirus was then replaced by fresh medium and cells were further incubated for 2 hours. Cells were metabolically labelled with 100 μM/ml[35S]methionine for 4 hours, the conditioned medium was collected and the cells were directly lysed in DIPA buffer.Mouse fibroblasts were plated in 12-well platesone day before infection (~300000 cells/well). A1:4 dilution of adenovirus encoding APPsw was added to the medium and cells were further incubated for 48 hours. Metabolic labelling was subsequently done as described above.
Analysis of APP processing- APP full-length and C-terminal fragments (stubs) were immunoprecipitated from cell extracts using theB63 antibody. A was immunoprecipitated fromthe conditioned medium using the B7/8 antibody.Protein G–Sepharose beads (Pharmacia) wereadded to the mixtures and incubation proceededovernight at 4°C with rotation. Theimmunoprecipitates were washed five times withDIPA buffer and once with 0.3 x TBS and thensolubilized with Nu-PAGE LDS loading buffer. Samples were heated for 10 min at 70°C and electrophoresed on 4-12% precast gels (NOVEX). Radiolabeled bands were detected by PhosphorImager (Molecular Dynamics, Inc.).
Analysis of APP processing using the 82E1 antibody- Neurons and glia cells were infected with recombinant SFV virus for onehour as described above. Medium wassubsequently replaced by neurobasal medium(neurons) or MEM-HS medium (glia cells) and cells were further incubated for 6 hours. Cells were lysed in PBS buffer containing protease inhibitors (Trazylol, 1 μg/ml pepstatine, 5mMEDTA) and 1% Triton-X100. Samples of cell extracts were resolved by SDS-PAGE and probed with B63 antibody. A was immunoprecipitated from the conditioned medium using B7/8antibody and detected by Western blotting usingthe 82E1 antibody.
FRET analysis- COS cells were transfected with 2 μg of either empty vector or with vectors encoding BACE1-, BACE2-Flag- or BACE2 E6-Flag, using 6 μl of Fugene. Forty-
4
by guest on Novem
ber 27, 2018http://w
ww
.jbc.org/D
ownloaded from

Dominguez et al., 2005
eight hours after transfection, cells were scraped in buffer B (5 mM Tris pH 7.4, 250mM sucrose, 1mM EGTA, 1%Triton-X100) and proteinconcentration was determined using the Protein Assay Dye Reagent (500-0006, Biorad laboratories). ~400 μg of proteins were subsequently incubated with B48 antibody(BACE1-transfected cells) or anti-Flag antibody (BACE2-transfected cells) and proteine G-Sepharose beads (Pharmacia) overnight at 4°C. The immunoprecipitates were washed three timeswith TBS containing 0.1% Triton-X100 andtwice with TBS. BACE activity was subsequently measured in an in vitro assay(Panvera, P2985) by Fluorescence Resonance Energy Transfer (FRET), according to themanufacturer’s instructions. Briefly, an APP-based peptide substrate carrying the Swedish mutation was used that contains a fluorescencedonor and a quencher acceptor at each end. The intact substrate is weakly fluorescent and becomes highly fluorescent upon enzymaticcleavage. BACE immunoprecipitates were directly resuspended in 20 μl assay bufferprovided with the kit and after substrate addition, excitation and emission were measured usingVictor2 (multilabel counter 1420 Perkin Elmer).
Pup exchange- A total of 8 BACE1 homozygote- and 8 wild-type couples were usedfor the experiment. Coupling was synchronizedand pups were exchanged during the first day ofbirth. The number of pups was followed untilweaning.
Electrophysiological recordings- Acutelyisolated pyramidal cell somata were prepared from the sensorimotor cortex of anesthetized and then decapitated wild-type and BACE1 -/- mice(23 - 30 days of age), using an establishedmethod of combined enzymatic/mechanicdissociation (29). Briefly, freshly prepared neocortical slices were incubated for 30 min inwarmed (29 oC) artificial cerebrospinal fluid (ACSF), and then maintained at room temperature. ACSF was constantly gassed with 95% O2/5% CO2 and contained (in mM): NaCl 125, KCl 3, CaCl2 2, MgCl2 2, NaH2PO4 1.25,NaHCO3 25, D-glucose 10 (pH 7.4). Small piecesof slice tissue (approx. 2 x 2 mm) were incubatedfor 45 min at 29° C in HEPES-buffered saline (HBS) containing 19 U ml-1 papain. HBS was composed of (in mM): NaCl 150, KCl 3, CaCl2 2, MgCl2 2, HEPES 10, D-glucose 10 (pH 7.4). All
recordings were made at room temperature (19-20° C). Current signals from acutely isolated pyramidal cell somata recorded in whole-cellvoltage-clamp mode were sampled at 20 kHz and filtered at 5 kHz (-3 dB) using an Axopatch 200Bamplifier in conjunction with a Digidata 1322A interface and pClamp 9 software (all from AxonInstruments, Foster City, CA, USA). Accessresistance in the whole-cell configuration was 10 - 15 M before series resistance compensation(75 - 80 %). To improve voltage control, Na+
currents were investigated in a low Na+ bathing solution containing (in mM): NaCl 15, Choline-Cl 115, KCl 3, MgCl2 2, CaCl2 1.6, CdCl2 0.4,HEPES 10, D-glucose 10 (pH 7.4). Patch pipetswere filled with (in mM): CsF 105, TEA-Cl 20,KCl 3, MgCl2 1, HEPES 8, EGTA 9, Na2-ATP 2(pH 7.2, adjusted with Cs-OH). Data arepresented as mean ± SEM. Data were statisticallyanalyzed (student´s t test, significance set at P < 0.05) with the use of Origin Pro7 software. Substances were purchased from Sigma(Deisenhofen, Germany).
Behavioural analysis
Animals- A panel of 69 male mice (25 wild-type, 23 heterozygous, and 21 BACE1 knock outlittermate mice; aged 3-9 months) was used to assess anxiety-related behavior in the open field test (OFT) and elevated zero-maze, anddepression-related behavior in the tail suspension test (TST) and forced swim test (FST). Animals were individually housed and kept under 12:12 hlight/dark cycle (lights on at 6:00 a.m.) in a temperature- and humidity-controlled room withfood and water at libitum. All experiments were conducted during the light phase of the light/darkcycle with one week in-between experiments.Experiments were approved by the animal careand use committee of Johnson & Johnson Pharmaceutical Research and Development.
Open field test- Locomotor activity was monitored using a Tru-scan system (Coulbourninstruments, Allentown, USA). The animal wasplaced in the center of the activity-field arena,which is a transparent plexi cage (W x D x H; 260 x 260 x 400 mm) equipped with two photo-beam sensor rings to register horizontal andvertical activity. Testing lasted 30 minutes.
Elevated zero maze- Elevated zero-mazetesting was performed as described by Crawley (2000) (30). The zero-maze consists of an annular platform (diameter: 50 cm, width: 5 cm).
5
by guest on Novem
ber 27, 2018http://w
ww
.jbc.org/D
ownloaded from
Dominguez et al., 2005
The animals were allowed to freely explore the maze for 5 minutes and their behavior was recorded and analyzed using the Ethovision Pro video tracking system (Noldus, The Netherlands).
Tail suspension test- Mice weresuspended by their tail to a hook in a test chamber using adhesive tape. Total duration ofimmobility was measured over a period of 6 minutes using the Videotrack system (Viewpoint,France). Mice that curled up towards their tail or that fell off during testing were excluded foranalysis.
Forced swim test- The mouse was placedin a cylinder ( 10 cm), filled with water to a height of 10 cm and a temperature of 25 C1 C. The mouse was exposed to swim-stress for6 minutes. Total duration of immobility was measured using the Videotrack system(Viewpoint, France). One animal was excluded for analysis because it had an extremely high fat mass and tended to drown during testing.
Statistical analysis- Data were analyzedusing one-way ANOVA or Kruskal-Wallis ANOVA on ranks in case data were not normallydistributed, followed by post hoc Tukey test(one-way ANOVA) or Dunn’s method (Kruskal-Wallis ANOVA on ranks) if appropriate.
RESULTS
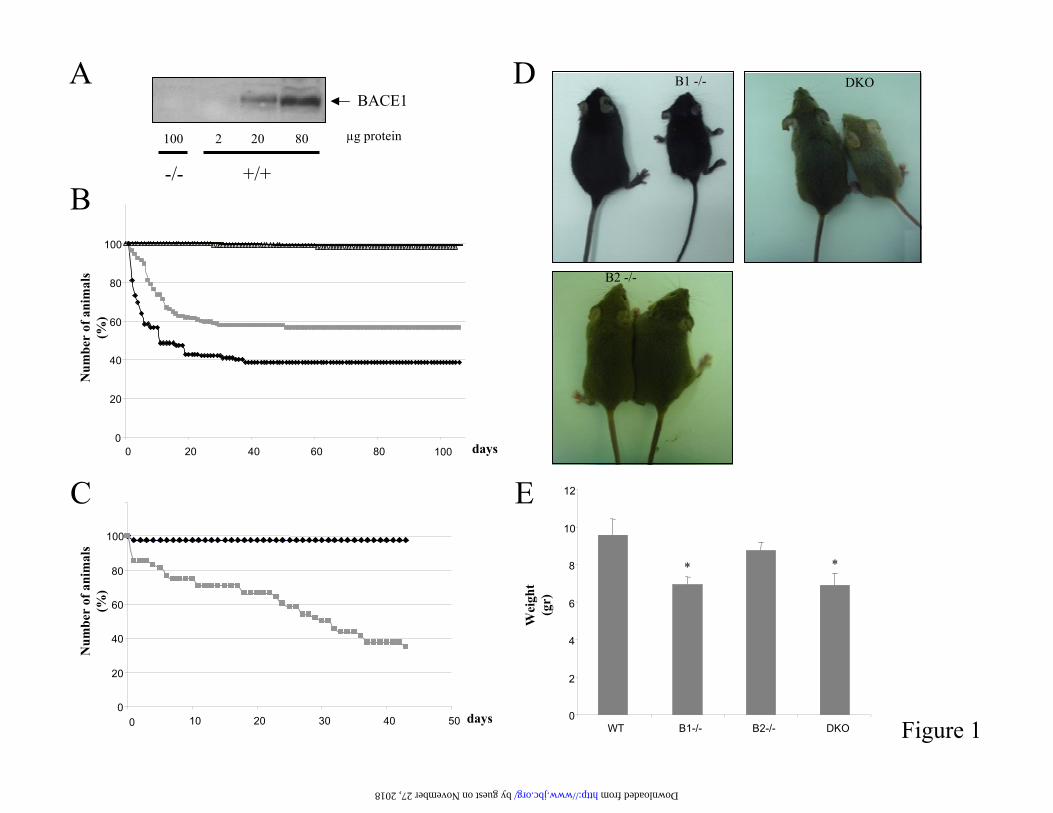
A lethal phenotype in BACE1 knock outmice- Several groups have reported the generation of BACE1 knock out mice (9-11). Wegenerated an independent line of BACE1 deficient mice (BACE1I line, supplementaryinformation). Briefly, a neomycin expressioncassette was inserted within the first coding exonof the BACE1 gene at codon position 49, which results in the introduction of a premature in frame translational stop codon. Absence of BACE1protein was confirmed by Western blotting onextracts from embryos’ brains using a BACE1 specific C-terminal antibody (figure 1A). BACE1deficient mice appeared at first glance viable and fertile. However, during expansion of the colony in two different conventional facilities in Leuven and in Kiel, we observed increased lethality among BACE1 deficient pups in the first weeks after birth. Mortality was almost exclusively restricted to the BACE1 -/- group (figure 1B).Out of 180 BACE1 knock out pups born toBACE1 knock out parents, 34 (19%) died within
the first 3-6 days of birth. From those remaining,44 (~24%) showed growth retardation (see for example figure 1D) and died by 3-4 weeks of age from a wasting syndrome. On the contrary,mortality in the wild-type and heterozygote group did not exceed 2% (figure 1B). The high neonatal death observed in BACE1 -/- pups was notcaused by a nursing defect of BACE1 deficientmothers. In a pup exchange experiment, there was no reduction in neonatal mortality of BACE1 knock out pups born to BACE1 knock outparents when they were nursed by a wild-typemother (figure 1C). Healthy BACE1 null mice,finally, are ~30% smaller by weight than controlmice. This was observed in BACE1 heterozygotecrosses (weight measured by 3 weeks of age, 8.3+/- 0.9 g for wild-type; 9.1 +/- 0.4 g for BACE1 +/- and 5.8 +/- 0.4 g for BACE1 -/-, not shown)and further confirmed in BACE1 and BACE2heterozygote crosses (figure 1E). The BACE1deficient mice surviving to adulthood are fertile and histological and anatomical examinationfailed to evidence any gross phenotypicabnormality (supplementary figure 4 and data notshown).To exclude the possibility that mortality in ourcolony is due to a defect independent fromBACE1 deficiency, a second BACE1 deficient line was independently generated (BACE1II line,supplementary information). A similar mortalityrate was observed with those mice (not shown),demonstrating that mortality is directly linked toBACE1 deficiency.BACE1 is known to cleave PSGL-1 and ST6Gal I, both proteins implicated in immune reactions(31-33), and therefore we performed a series of in vitro and in vivo assays to evaluate the ability of BACE1 deficient animals to mount anefficient immune response. We first tested whether BACE1-/- mice could mount an efficient immune response to vesicular stomatitis virus (VSV) infection. To this end, BACE1-/- mice,heterozygous and wild-type littermates were intravenously challenged with 2x10⁶ pfu VSV.On day 4 after infection, all mice analyzedmounted similar VSV neutralizing IgM responsesthat switched to the IgG isotype by day 8 andreached plateau levels at later time points(supplementary figure 5). Thus, adaptive immunity was functional in BACE1-/- mice, i.e.VSV neutralizing T help-independent IgM and the T help-dependent switch to the IgG subtypewere normally induced. Furthermore, a similar
6
by guest on Novem
ber 27, 2018http://w
ww
.jbc.org/D
ownloaded from

Dominguez et al., 2005
resistance to lethal VSV infection at higher infection doses (data not shown) suggested thatthe overall quality and quantity of VSV-specificimmunity was very similar for all genotypes. We further checked (a) the number and type ofleukocytes that migrated into the peritoneum in a model of acute peritonitis induced by thioglycolate (34,35), (b) the activation ofmacrophages in vitro as evaluated by TNF-secretion upon stimulation with pathogens(Mycobacterium avium and Mycobacteriumtuberculosis) or with LPS, and (c) the T-cellresponses, as measured by the capacity ofactivated T-cells isolated from spleen of pre-immunized mice, to destroy chromium labelledcells from a different genetic background. Allthese experiments were negative (results not shown), suggesting that the overall immunedefence of the BACE1 knock out animals is not dramatically compromised.
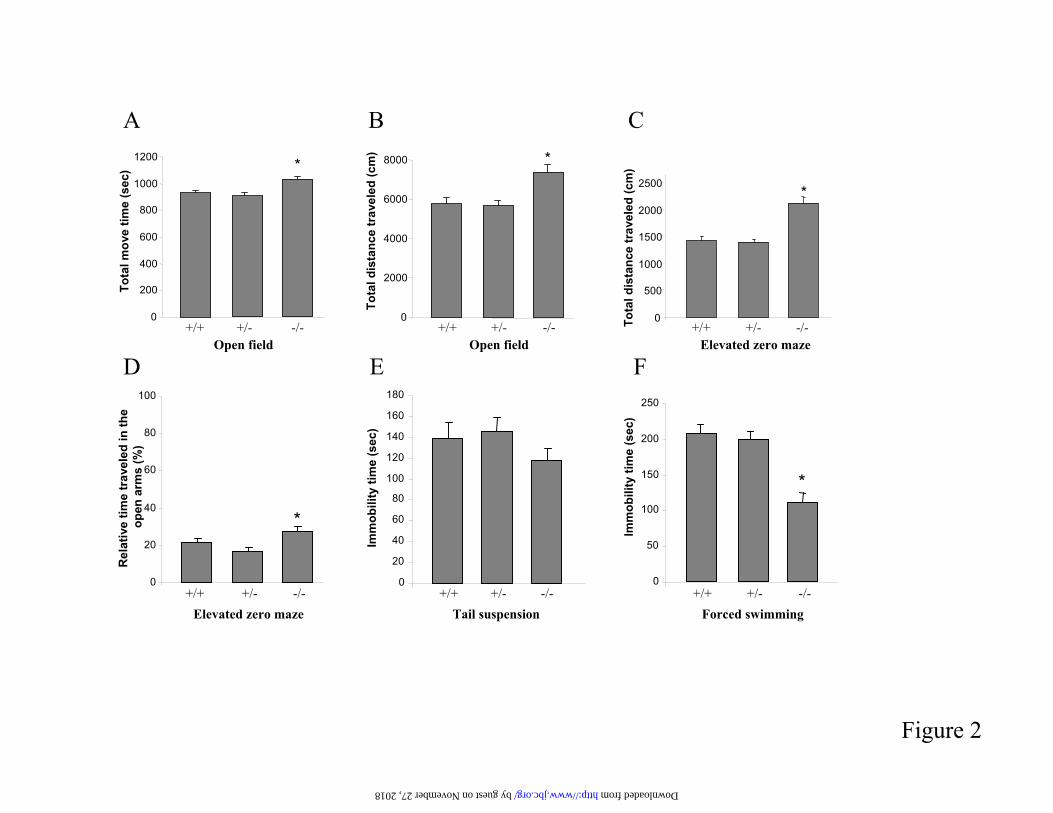
Behavioural analysis of BACE1 deficientmice- We tested BACE1 knock out mice (strainBACE1II) in a battery of behavioural tests (figure 2). In the open field test, BACE1 nullmice displayed hyperactivity and enhancedlocomotion compared to heterozygous and wild-type littermates, as illustrated by a significantincrease in total move time (figure 2A; F(2,66)=10.743, P<0.001) and total distance travelled (figure 2B; H=16.387, P<0.05). TheBACE1 genotype had, however, no effect on therelative time spent in the centre and the relative distance travelled in the centre (not shown). Thisindicates that BACE1 knock out mice do notshow an anxiolytic nor an anxiogenic phenotype,what was confirmed in the elevated zero mazetest. In this test BACE1 deficient mice showed a significant increase in the total distance travelled(figure 2C; F(2,65)<=21.926, P=<0.001), againpointing to a hyperactive phenotype. One mousewith a homozygous genotype actively jumped offof the maze and was excluded from the analysis.Further, there was a significant effect of genotypeon the relative time spent in the open arms (figure 2D; F(2,65)=4.003, P=0.023). Post hocanalysis revealed that BACE1 null miceexhibited an increase of the relative time spent in the open arms compared to heterozygouslittermates (P<0.05). This stresses that there is noindication of anxiety. No influence of genotypeon the relative distance travelled in the open armscould be detected (not shown). Finally, animals
were tested in the tail suspension and forced swim tests, which are both validated models forassessing depression-related behaviours. As shown in figure 2E, there was no significant effect of genotype on immobility in the tailsuspension test (F(2,59)=1.085, P=0.345). In the forced swim test (figure 2F), homozygousanimals showed a significant decrease in immobility time compared to heterozygous and wild-type animals (F(2,65)=16.625, P<0.001).This difference probably reflects a hyperactive rather than an anti-depressive phenotype.Similar data were obtained in independentbehavioural analyses of the BACE1I strain (not shown).
Na+ currents in cortical neurons of BACE1 knock out mice- BACE1 has beenrecently shown to cleave 2 and 4 subunits ofvoltage-gated Na+ channels in the mouse brain(36). These -subunits are auxiliary subunits which associate with the principal, pore-forming
-subunit and regulate the function andexpression of voltage-gated Na+ channels (37). We wondered hence whether the genetic ablation of BACE1 would influence the properties of thefast Na+ current. To address this issue, weperformed whole-cell recordings from pyramidalcell somata that were acutely isolated from slicesof mouse neocortex. We chose this preparationbecause BACE1 is highly expressed in neuronsof this brain region (36) and because dissociatedcells offer the advantage of allowing adequate spatio-temporal voltage control of fast Na+
currents. After pharmacological suppression of voltage-dependent Ca2+ and K+ currents with Cd2+ and Cs+/TEA+, respectively (see Experimental procedures), fast Na+ currents weregradually activated by step depolarizations to command potentials between -60 and 10 mV(figure 3A). To determine the current-voltage (I-V) relationship of the Na+ current, the peak current amplitude at each voltage step was normalized to the neuron´s capacitance and plotted as a function of the command potential(figure 3B). Cortical neurons from BACE1 knockout mice had a tendency to display lower Na+
current densities than those from wild-type mice,but this difference did not reach statisticalsignificance. The activation curve of the Na+
conductance (G) was constructed from the I-Vrelationship of figure 3B with the use of the equation
7
by guest on Novem
ber 27, 2018http://w
ww
.jbc.org/D
ownloaded from

Dominguez et al., 2005
G = I / (V - ENa)where I is the peak current amplitude atcommand potential V and ENa is the equilibriumpotential for Na+ under our experimentalconditions. As shown in figure 3C (open symbols), the activation curve of the Na+
conductance did not differ between neurons fromwild-type and BACE1 -/- mice. Steady-stateinactivation of Na+ currents was determined by holding the neuron for 1 s at prepulse potentialsbetween -100 and -20 mV before evoking a Na+
current response with a voltage step to 0 mV.Current amplitudes were expressed as a fraction of the maximum current amplitude and plotted as a function of the prepulse potential. In contrast toactivation, steady-state inactivation did vary significantly between neurons from wild-type mice and from BACE1-deficient mice (figure 3C, filled symbols). The rightward shift of the steady-state inactivation curve in neurons from BACE1-deficient mice (wild-type: Vh = -65 mV dashed curve, BACE1 KO: Vh = -58 mV, solid curve) indicates that a larger fraction of Na+ channels is available at a given potential compared to neurons from wild-type mice. Recovery from inactivation was studied by gradually increasingthe interval (1 ms to 2 s) between two 15-ms testpulses to 0 mV. The peak amplitude of the second Na+ current response, divided by the response at maximum interval, was then plotted as a function of the interpulse interval. As shownin figure 3D, recovery from inactivation was not significantly different between the two groups.
Generation and characterization of BACE2 knock out mice- To understand the invivo function of the -secretase homologueBACE2, a BACE2 knock out mouse line was generated. Two lox P sites were first introducedin the introns flanking exon 6 that contains one ofthe two enzyme’s active sites. Mice heterozygousfor the BACE2 conditional-targeted allele were subsequently crossed with mice expressing Crerecombinase from the ubiquitous PGK promoter,resulting in the deletion of BACE2 exon 6(BACE2 E6) (supplementary information). Todemonstrate that the BACE2 E6 protein does nothave -secretase activity, BACE1, BACE2 and BACE2 E6 expressed in COS cells wereimmunoprecipitated from cell extracts and protease activity was measured in an in vitroassay using a synthetic peptide representing theBACE1 cleavage site of APPsw. Only BACE1
and BACE2, but not BACE2 E6, were capable of cleaving the peptide (figure 4). Westernblotting confirmed that similar levels of BACE2 and BACE2 E6 were tested in the assay (figure 4). Thus the BACE2 E6 protein encoded inBACE2 knock out mice lacks protease activity.Mice homozygous for the deficient BACE2 allele were born at normal frequency, fertile and overallhealthy. No difference in size could be identified when compared to littermate controls (figure 1D and E). In a standard battery of blood and clinical chemistry parameters, no abnormality associatedto the genotype has been detected (not shown). Extensive pathological analysis of four BACE2+/+ and four BACE2 -/- mice with hematoxylinand eosin staining failed to show any abnormalityrelated to genotype (supplementary information).
Generation and characterization of BACE1-/-BACE2-/- knock out mice- To identifyputative major BACE functions that could be compensated for in the single monogenic BACE knock out lines, we generated mice deficient inboth BACE1 and BACE2 proteases.Interestingly, double knock out mice had a neonatal mortality of ~60%, therefore higher than that observed in the single BACE1 deficient line (figure 1B). Out of 122 double knock out miceborn to double knock out parents, 51 (~42%) died within the first 3-5 days postnatally. Additional24 pups (~20%) died within the first 3-4 weeks from a wasting syndrome. The surviving animalsare fertile and a detailed pathologicalexamination failed to reveal any abnormality(supplementary information and data not shown).Like BACE1 knock out mice, healthy doubleknock out animals remain smaller than theircontrol littermates (figure 1D and E).
Processing of APP in BACE deficient cells- We next analysed the processing of APP incells derived from knock out animals. We startedwith primary neurons because, while BACE1 isexpressed at relatively high levels in neurons, BACE2 expression in these cells is still a matterof debate (2,13,19). We analysed in parallel APPwt, APPsw and APPfl. APPsw and APPfl were chosen because both mutations are known to affect -secretase cleavage (8). We confirmed that BACE1 deficient neurons donot process APP at the known -secretase sites,Asp1 and Glu11, as shown by the absence of 1-and 11 stubs (figures 5A). However, we
8
by guest on Novem
ber 27, 2018http://w
ww
.jbc.org/D
ownloaded from
Dominguez et al., 2005
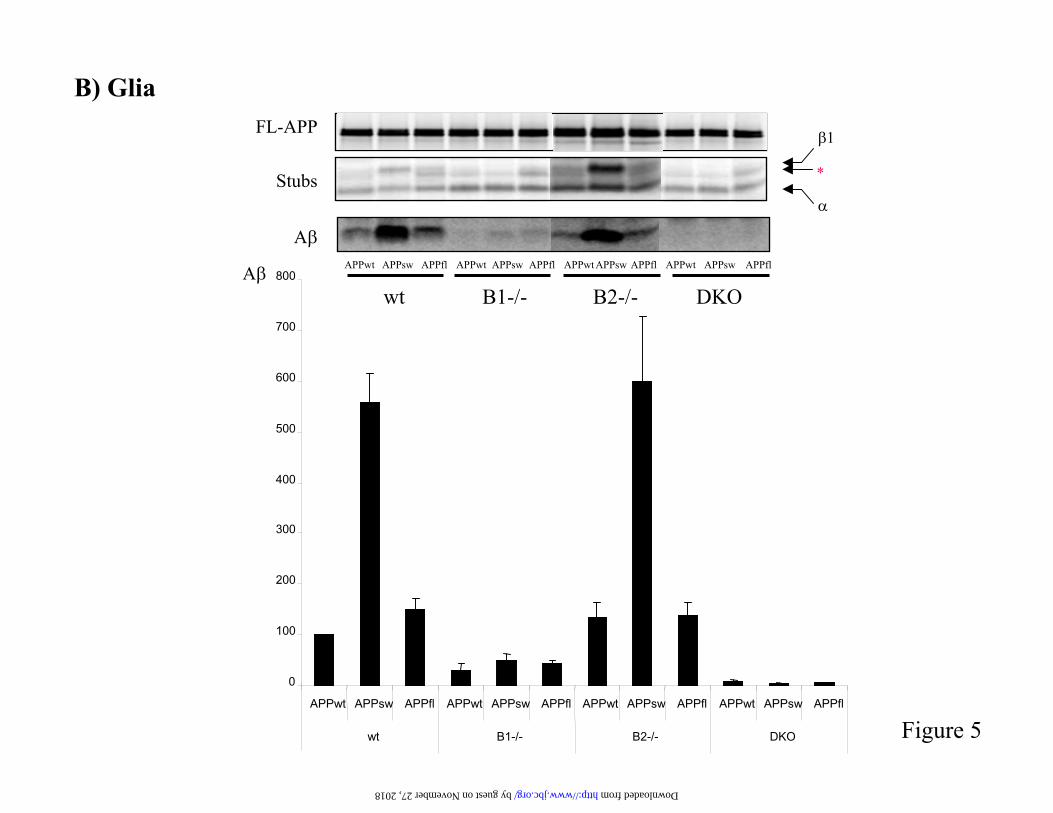
observed a novel APP C-terminal fragment that migrates slightly faster than the 1 stub (asterisk in figure 5A). BACE2 is not responsible for this cleavage, since the same fragment is still produced in double BACE1/BACE2 deficient neurons. The fact that BACE1 knock out neuronsdo not produce any measurable A and that there is no measurable effect on APP processing in primary neurons deficient in BACE2 confirmsthat BACE1 is the only -secretase in these cells.Glia cells are the most abundant cells in the brain and we next checked how APP processing is affected by the absence of BACE proteases.Interestingly, BACE1 deficient glia cells secretemeasurable levels of A , that are more prominentin APPsw and APPfl transduced cells (figure 5B). Moreover, whereas wild-type cells that overexpress APPsw produce about four timeshigher levels of A than APPfl-overexpressingcells, the situation changes in BACE1 deficient cells. In this case, similar amounts of A aregenerated from the APPsw and APPfl mutants,and the amounts generated from these mutantsare slightly higher than those produced by APPwtexpressing glia cells. This is consistent with BACE2 being the responsible protease, since it has been shown that the Flemish mutation in APP markedly increased A production by BACE2 (8). That BACE2 contributes to A generation incultured glia cells is also demonstrated by thefact that in BACE1 deficient glial cells significant A generation is observed which is only reduced to undetectable levels in the combined BACE1/BACE2 deficiency. Thesedata suggest that BACE2 is expressed in gliacells and might contribute to A production invivo in these cells. To demonstrate that the A measured in theseexperiments was generated by cleavage at theauthentic -secretase site, we made use of the82E1 antibody that specifically recognizes the neoepitope produced upon BACE cleavage ofAPP at the Asp1 position (38). Similar to the results described above, BACE1-deficient glia cells but not neurons continue to generate Adetected by 82E1 (figure 6), demonstrating that the observed cleavage was carried out by a -secretase.Finally, we analysed processing of APPsw in fibroblasts derived from BACE deficient mice(figure 5C). Analogous to neuronal cells, there is compensatory cleavage of APP in BACE1 knock
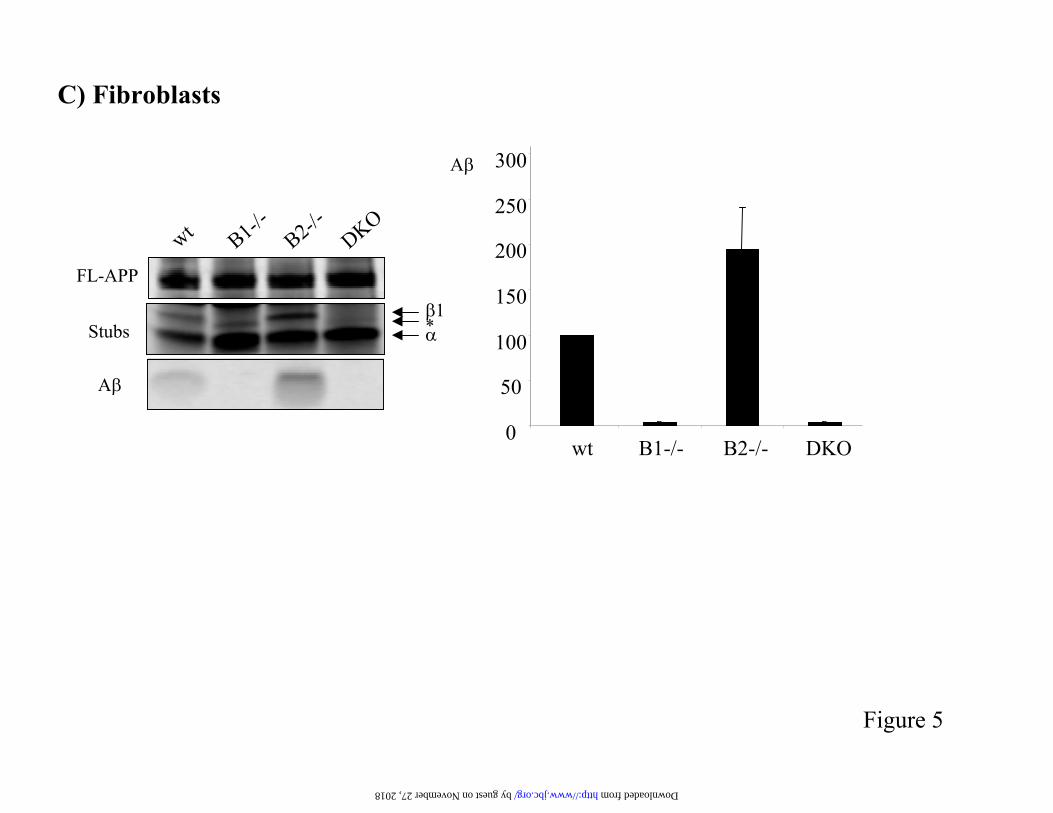
out fibroblasts that results in the generation of a CTF similar to that observed in neurons. Doubleknock out cells still produce this fragment,demonstrating that, like in neurons, BACE2 is not responsible for this compensatory cleavage. Interestingly, fibroblasts deficient in the BACE2 enzyme secrete higher levels of A compared towild-type cells. These results indicates thatfibroblast endogenous BACE2 has an anti-amyloidogenic function in vivo.
DISCUSSION
We generated mouse lines that are deficient in BACE1, BACE2 or both. Previous reports claimed that genetic ablation of BACE1 does notresult in overt phenotypical alterations (9-11,39).One group reported a more timid, more anxious and less exploratory behaviour in these mice(40). In contrast, we find a complex butsignificant phenotype in our two independentlygenerated BACE1 knock out strains, that are characterized by increased neonatal mortalityaffecting up to ~40% of newborn animals. The surviving mice are healthy and fertile, but displaya lower weight. They show also hyperactivity and enhanced locomotion in a battery of behaviouraltests. The phenotype of BACE2 deficient micehas not been reported before. We find until nowand under similar breeding conditions as our BACE1 strains, no indications of anyphysiological or anatomical abnormalities. This is somewhat surprising since BACE2 isubiquitously expressed in fetal and adult tissues (12) and further work is needed to determinemore precisely the physiological role of BACE2. The increased neonatal mortality observed inBACE1/BACE2 double knock out micecompared to BACE1 single deficiency indicates,however, that at least some overlap existsbetween BACE1 and BACE2 functions. It is unclear at the moment why one group ofBACE1- and double knock out mice die withinthe first weeks after birth while others survive into adulthood. Possible explanations for thisdiversity include effects of modifier genes, and varying levels of compensatory contributionsfrom other (related) genes. Mortality seems to be associated with an environmentally born factor, which only in combination with BACE1 deficiency triggers death. This probably explainswhy other groups did not observe mortality intheir BACE1-/- strains and is supported by the
9
by guest on Novem
ber 27, 2018http://w
ww
.jbc.org/D
ownloaded from
Dominguez et al., 2005
fact that the BACE1II line only presented neonatal mortality when the animals were housed in the same facility as the BACE1I line but not in the SPF facility where they originally came from(not shown). Since BACE1 is known to cleave PSGL-1 and ST6Gal I, both proteins implicatedin immune reactions (31-33), we speculated that the higher mortality rate observed in BACE1 knock out mice might reflect a deficient immuneresponse in a non-pathogen-free environment.The analyses we performed thus far (see resultsection) failed, however, to reveal any defect ofBACE1 knock out mice in their capacity tomount an efficient immune response. We excluded also the possibility that BACE1 knock out mothers were deficient in milk production ordid not care for their pups by performing pupexchange experiments (figure 1C). Since the lethality rate did not decrease when the knock outpups were nursed by wild-type mothers and since no lethality was observed when BACE1 deficientmothers nursed wild-type pups, we conclude that the lethality problem is linked with BACE1 deficiency in the pups. Since the adult micedisplay an abnormal hyperactive behaviour(figure 2), it remains an interesting speculation that behavioural alterations in the pups couldcontribute to lethality. There are however no behavioural tests available for newborn mice to evaluate this possibility in further detail.It was recently shown that BACE1 cleaves the -subunits of the voltage gated sodium channels (36). The -subunits belong to the immunoglobulin super family of cell adhesion molecules (CAMs) and besides their cell adhesion function, they play a role in channel gating and cell surface expression of the pore-forming -subunits (41). Given the prominentexpression of BACE1 in the striatum (36), it istempting to speculate that changes in Na+ channelfunction might contribute to the hyperactive phenotype of BACE1 null mice reported in thisstudy. We checked this by performing whole-cellrecordings from cortical neurons. We found thatthe lack of BACE1 was associated with asignificant shift of steady-state inactivation of theNa+ current towards more depolarized potentials. In contrast, the voltage dependence of activationwas not altered. The shift of steady-stateinactivation might be functionally important,because it increases the availability of Na+
channels in the critical voltage range aroundfiring threshold. In addition to modulating Na+
currents, BACE might also regulate synapticfunction. Kamenetz et al. (42) recently proposed a feedback loop in which the A peptide plays aprominent role. According to their model, an increase in neuronal activity induces BACE1, leading to an enhanced production of A , whichin turn depresses excitatory synaptictransmission. Thus blockade of BACE1 might be expected to influence neuronal excitability atboth the cellular and neuronal network levels, and such alterations might manifest as the subtle behavioural deficits observed in BACE1deficient mice. Again, further work is needed to firmly establish cause-consequence relationshipsin this regard.We finally analyzed in detail the role of BACE1and 2 in APP processing. We confirm thatBACE1 is the major -secretase in vivo and is basically the only -secretase that is active inneurons. Interestingly, cultured glia cells derived from BACE1 knock out mice still secreted in the conditioned medium measurable amounts of an A like peptide. This peptide is no longer detected in BACE1&2 double deficient glia cells, demonstrating that BACE2 is expressed in these cells and raising the intriguing possibility thatglia-expressed BACE2 contributes to the total brain A pool. This could be particularly relevantin Down’s syndrome, since the BACE2 gene(like the APP gene) is located on chromosome 21 (21). Also some mutations in APP (like the Flemish APP FAD mutation) increase theBACE2 dependent A peptide production (figure5B and (8)). That the observed protein band was authentic A peptide was confirmed using a highly specific mAb 82E1 (38) that reacts with the neo-epitope generated by BACE1 cleavage at position 1 of the A peptide (figure 6).Interestingly, the effects of BACE2 on APP processing appear to be cell type specific. For instance in fibroblast cells, BACE2 appears to prevent A generation since BACE2 deficient fibroblasts generate higher levels of A than theirwild-type littermates (figures 5). In conclusion, the current work addressed theimportant question of the physiological role of BACE1 and BACE2. It is obvious that the functions of these two proteases are quite subtle and that the molecular link between the observed phenotype and BACE1 deficiency remains to befirmly established. We will now use these micefor further detailed molecular analysis, hoping
10
by guest on Novem
ber 27, 2018http://w
ww
.jbc.org/D
ownloaded from

Dominguez et al., 2005
that identifying further substrates of BACE1 and BACE2 will help to elucidate the full functionalimportance of these proteases and provide further insight into the phenotype of the mice. While ourdata do not necessarily contradict the current assumption that BACE1 is a valid drug target to treat AD, they bring up a cautionary note to theprevailing optimism based on previous studiesthat stressed the normal phenotype of BACE1null mice. Obviously, in the absence of a
complete understanding of the functions ofBACE, it remains a problem to make predictions with regard to the outcome of BACE inhibition in humans. We conclude already, however, that a detailed observation of the impact of BACE inhibitors on behaviour is indicated. It remainsnevertheless surprising that ~40% of mice withcombined absence of BACE1 and BACE2 can indeed survive for more than 1,5 years under what seems quite healthy and fertile conditions.
REFERENCES
1. Hussain, I., Powell, D., Howlett, D. R., Tew, D. G., Meek, T. D., Chapman, C., Gloger, I. S., Murphy, K. E., Southan, C. D., Ryan, D. M., Smith, T. S., Simmons, D. L., Walsh, F. S.,Dingwall, C., and Christie, G. (1999) Mol Cell Neurosci 14, 419-427
2. Hussain, I., Powell, D. J., Howlett, D. R., Chapman, G. A., Gilmour, L., Murdock, P. R., Tew,D. G., Meek, T. D., Chapman, C., Schneider, K., Ratcliffe, S. J., Tattersall, D., Testa, T. T., Southan, C., Ryan, D. M., Simmons, D. L., Walsh, F. S., Dingwall, C., and Christie, G. (2000) Mol Cell Neurosci 16, 609-619
3. Sinha, S., Anderson, J. P., Barbour, R., Basi, G. S., Caccavello, R., Davis, D., Doan, M., Dovey, H. F., Frigon, N., Hong, J., Jacobson-Croak, K., Jewett, N., Keim, P., Knops, J., Lieberburg, I., Power, M., Tan, H., Tatsuno, G., Tung, J., Schenk, D., Seubert, P.,Suomensaari, S. M., Wang, S., Walker, D., and John, V. (1999) Nature 402, 537-540
4. Vassar, R., Bennett, B. D., Babu-Khan, S., Kahn, S., Mendiaz, E. A., Denis, P., Teplow, D. B., Ross, S., Amarante, P., Loeloff, R., Luo, Y., Fisher, S., Fuller, J., Edenson, S., Lile, J., Jarosinski, M. A., Biere, A. L., Curran, E., Burgess, T., Louis, J. C., Collins, F., Treanor, J., Rogers, G., and Citron, M. (1999) Science 286, 735-741
5. Yan, R., Bienkowski, M. J., Shuck, M. E., Miao, H., Tory, M. C., Pauley, A. M., Brashier, J. R., Stratman, N. C., Mathews, W. R., Buhl, A. E., Carter, D. B., Tomasselli, A. G., Parodi, L. A., Heinrikson, R. L., and Gurney, M. E. (1999) Nature 402, 533-537
6. Lin, X., Koelsch, G., Wu, S., Downs, D., Dashti, A., and Tang, J. (2000) Proc Natl Acad Sci US A 97, 1456-1460
7. Acquati, F., Accarino, M., Nucci, C., Fumagalli, P., Jovine, L., Ottolenghi, S., and Taramelli,R. (2000) FEBS Lett 468, 59-64
8. Farzan, M., Schnitzler, C. E., Vasilieva, N., Leung, D., and Choe, H. (2000) Proc Natl Acad Sci U S A 97, 9712-9717
9. Cai, H., Wang, Y., McCarthy, D., Wen, H., Borchelt, D. R., Price, D. L., and Wong, P. C. (2001) Nat Neurosci 4, 233-234
10. Roberds, S. L., Anderson, J., Basi, G., Bienkowski, M. J., Branstetter, D. G., Chen, K. S., Freedman, S. B., Frigon, N. L., Games, D., Hu, K., Johnson-Wood, K., Kappenman, K. E., Kawabe, T. T., Kola, I., Kuehn, R., Lee, M., Liu, W., Motter, R., Nichols, N. F., Power, M., Robertson, D. W., Schenk, D., Schoor, M., Shopp, G. M., Shuck, M. E., Sinha, S., Svensson,K. A., Tatsuno, G., Tintrup, H., Wijsman, J., Wright, S., and McConlogue, L. (2001) Hum Mol Genet 10, 1317-1324
11. Luo, Y., Bolon, B., Kahn, S., Bennett, B. D., Babu-Khan, S., Denis, P., Fan, W., Kha, H., Zhang, J., Gong, Y., Martin, L., Louis, J. C., Yan, Q., Richards, W. G., Citron, M., and Vassar,R. (2001) Nat Neurosci 4, 231-232
12. Solans, A., Estivill, X., and de La Luna, S. (2000) Cytogenet Cell Genet 89, 177-18413. Bennett, B. D., Babu-Khan, S., Loeloff, R., Louis, J. C., Curran, E., Citron, M., and Vassar, R.
(2000) J Biol Chem 275, 20647-2065114. Pike, C. J., Overman, M. J., and Cotman, C. W. (1995) J Biol Chem 270, 23895-23898
11
by guest on Novem
ber 27, 2018http://w
ww
.jbc.org/D
ownloaded from

Dominguez et al., 2005
15. Masters, C. L., Simms, G., Weinman, N. A., Multhaup, G., McDonald, B. L., and Beyreuther,K. (1985) Proc Natl Acad Sci U S A 82, 4245-4249
16. Naslund, J., Schierhorn, A., Hellman, U., Lannfelt, L., Roses, A. D., Tjernberg, L. O., Silberring, J., Gandy, S. E., Winblad, B., Greengard, P., and et al. (1994) Proc Natl Acad Sci US A 91, 8378-8382
17. Fluhrer, R., Capell, A., Westmeyer, G., Willem, M., Hartung, B., Condron, M. M., Teplow, D.B., Haass, C., and Walter, J. (2002) J Neurochem 81, 1011-1020
18. Yan, R., Munzner, J. B., Shuck, M. E., and Bienkowski, M. J. (2001) J Biol Chem 276, 34019-34027
19. Basi, G., Frigon, N., Barbour, R., Doan, T., Gordon, G., McConlogue, L., Sinha, S., and Zeller,M. (2003) J Biol Chem 278, 31512-31520
20. Wong, P. C., Price, D. L., and Cai, H. (2001) Science 293, 143421. Motonaga, K., Itoh, M., Becker, L. E., Goto, Y., and Takashima, S. (2002) Neurosci Lett 326,
64-6622. Wong, G. T., Manfra, D., Poulet, F. M., Zhang, Q., Josien, H., Bara, T., Engstrom, L., Pinzon-
Ortiz, M. C., Fine, J. S., Lee, H. J., Zhang, L., Higgins, G. A., and Parker, E. M. (2004) J Biol Chem
23. Tournoy, J., Bossuyt, X., Snellinx, A., Regent, M., Garmyn, M., Serneels, L., Saftig, P., Craessaerts, K., De Strooper, B., and Hartmann, D. (2004) Hum Mol Genet 13, 1321-1331
24. Ohno, M., Sametsky, E. A., Younkin, L. H., Oakley, H., Younkin, S. G., Citron, M., Vassar, R., and Disterhoft, J. F. (2004) Neuron 41, 27-33
25. De Strooper, B., Simons, M., Multhaup, G., Van Leuven, F., Beyreuther, K., and Dotti, C. G.(1995) EMBO J 14, 4932-4938
26. Esselens, C., Oorschot, V., Baert, V., Raemaekers, T., Spittaels, K., Serneels, L., Zheng, H., Saftig, P., De Strooper, B., Klumperman, J., and Annaert, W. (2004) J Cell Biol 166, 1041-1054
27. Simons, M., de Strooper, B., Multhaup, G., Tienari, P. J., Dotti, C. G., and Beyreuther, K. (1996) J Neurosci 16, 899-908
28. Tienari, P. J., De Strooper, B., Ikonen, E., Ida, N., Simons, M., Masters, C. L., Dotti, C. G., and Beyreuther, K. (1996) Cold Spring Harb Symp Quant Biol 61, 575-585
29. Alzheimer, C. (1994) J Physiol 479 ( Pt 2), 199-20530. Crawley, J. N. (2000) Emotional Behaviors: Animal models of psychiatric diseases. Behavioral
Phenotyping of transgenic and knockout mice, John Wiley & Sons, New York 31. Yang, J., Hirata, T., Croce, K., Merrill-Skoloff, G., Tchernychev, B., Williams, E.,
Flaumenhaft, R., Furie, B. C., and Furie, B. (1999) J Exp Med 190, 1769-178232. Xia, L., Sperandio, M., Yago, T., McDaniel, J. M., Cummings, R. D., Pearson-White, S., Ley,
K., and McEver, R. P. (2002) J Clin Invest 109, 939-95033. Hennet, T., Chui, D., Paulson, J. C., and Marth, J. D. (1998) Proc Natl Acad Sci U S A 95,
4504-450934. Tedder, T. F., Steeber, D. A., and Pizcueta, P. (1995) J Exp Med 181, 2259-226435. Watson, S. R., Fennie, C., and Lasky, L. A. (1991) Nature 349, 164-16736. Wong, H. K., Sakurai, T., Oyama, F., Kaneko, K., Wada, K., Miyazaki, H., Kurosawa, M., De
Strooper, B., Saftig, P., and Nukina, N. (2005) J Biol Chem37. Isom, L. L. (2002) Front Biosci 7, 12-2338. Qi-Takahara, Y., Morishima-Kawashima, M., Tanimura, Y., Dolios, G., Hirotani, N.,
Horikoshi, Y., Kametani, F., Maeda, M., Saido, T. C., Wang, R., and Ihara, Y. (2005) JNeurosci 25, 436-445
39. Luo, Y., Bolon, B., Damore, M. A., Fitzpatrick, D., Liu, H., Zhang, J., Yan, Q., Vassar, R., and Citron, M. (2003) Neurobiol Dis 14, 81-88
40. Harrison, S. M., Harper, A. J., Hawkins, J., Duddy, G., Grau, E., Pugh, P. L., Winter, P. H.,Shilliam, C. S., Hughes, Z. A., Dawson, L. A., Gonzalez, M. I., Upton, N., Pangalos, M. N., and Dingwall, C. (2003) Mol Cell Neurosci 24, 646-655
41. Isom, L. L. (2002) Novartis Found Symp 241, 124-138; discussion 138-143, 226-13212
by guest on Novem
ber 27, 2018http://w
ww
.jbc.org/D
ownloaded from

Dominguez et al., 2005
42. Kamenetz, F., Tomita, T., Hsieh, H., Seabrook, G., Borchelt, D., Iwatsubo, T., Sisodia, S., andMalinow, R. (2003) Neuron 37, 925-937
43. Wattler, S., Kelly, M., and Nehls, M. (1999) Biotechniques 26, 1150-1156, 1158, 116044. Saftig, P., Peters, C., von Figura, K., Craessaerts, K., Van Leuven, F., and De Strooper, B.
(1996) J Biol Chem 271, 27241-2724445. Kalinke, U., Bucher, E. M., Ernst, B., Oxenius, A., Roost, H. P., Geley, S., Kofler, R.,
Zinkernagel, R. M., and Hengartner, H. (1996) Immunity 5, 639-652
FOOTNOTESWe would like to thank Dr. Noriaki Kinoshita (IBL. Co) for kindly providing us with the 82E1 antibody, Dr. Wim Annaert (Leuven) and Dr. Collin Dingwall (GSK) for contributing BACE antibodies, Dr. Norbert Reiling for helping us to analyse macrophage function and Marlies Rusch for technical assistance. This research was supported by a Pioneer award from the Alzheimer’s Association to BDS;Alzheimer Forschungsinititative (AFI) to D.D and K.R; the Fund for Scientific Research, Flanders (FWO); the K.U.Leuven (GOA); the European Union (APOPIS: LSHM-CT-2003-503330); the Interuniversity Attraction Poles Program P5/19 of the Belgian Federal Science Policy Office (BDS andPS) and the Federal Office for Scientific affairs, Belgium (IUAP P5/19). EM is an aspirant of the FWO.
The abbreviations used are: A , amyloid ; APP, amyloid precursor protein; AD, Alzheimer’s disease;FRET, Fluorescence Resonance Energy Transfer; FAD, familial Alzheimer’s disease; APPwt, wild-type APP; APPsw, Swedish APP mutation; APPfl, Flemish APP mutation; PSGL-1, P-selectinglycoprotein ligand 1; ST6Gal I, syalyltransferase 6 Gal; VSV, vesicular stomatitis virus, PFU,plaques forming units; IgM, immunoglobulin of the M subclass; IgG, immunoglobulin of the G subclass.
13
by guest on Novem
ber 27, 2018http://w
ww
.jbc.org/D
ownloaded from
Dominguez et al., 2005
FIGURE LEGENDS
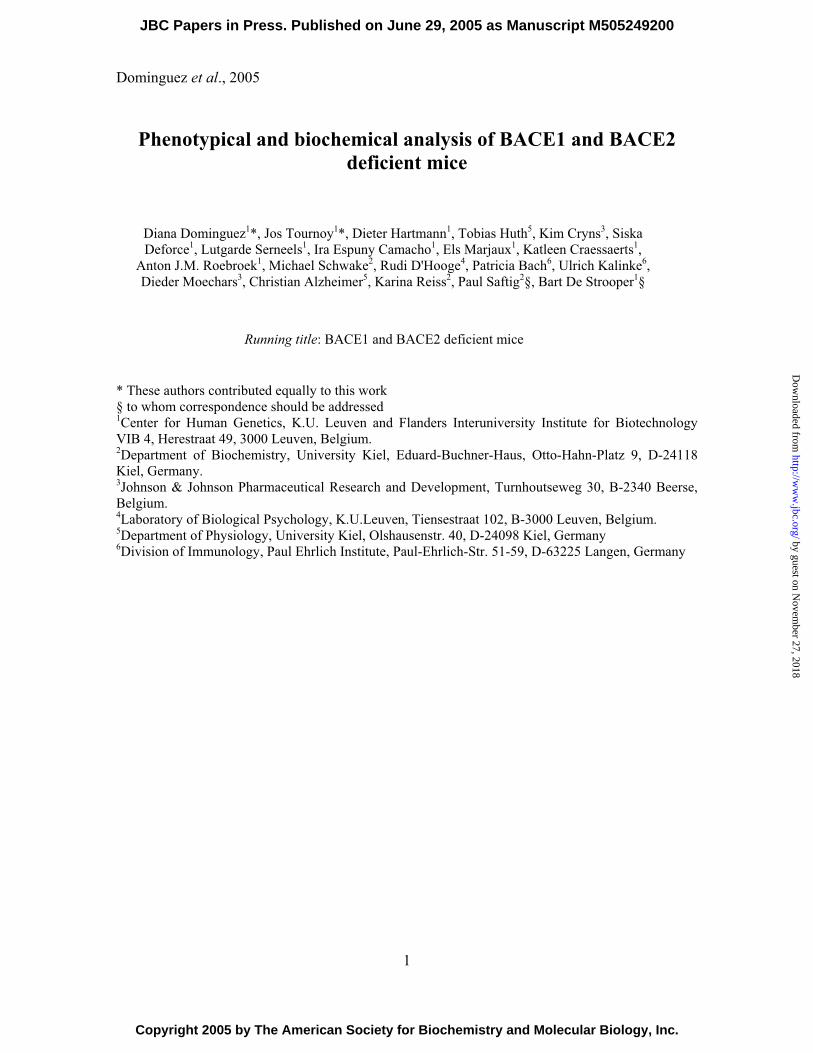
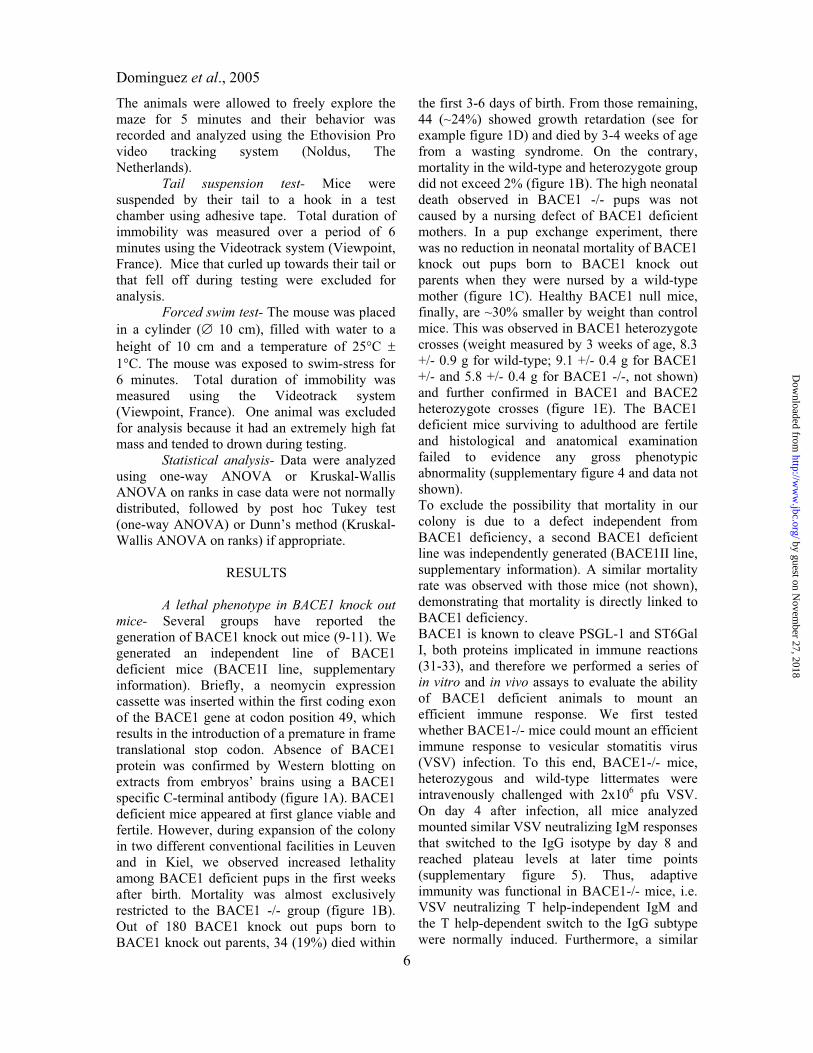
Figure 1. Mortality associated with BACE deficiency. A) Lack of BACE1 protein in brains of BACE1knock out mice. Membrane protein extracts were prepared from E14 embryos. Endogenous BACE1was detected by Western blotting using the C-terminal specific antibody B48. B) Lethality in the BACE1 the and double knock out colony. The number of mice at birth is set as 100%. There were 180 BACE1-/- mice (grey rectangles) derived from BACE1 knock out crosses, 122 BACE1/BACE2 double knock out mice (black rhomboids) derived from double knock out crosses, 232 wild-type (greytriangles) and 164 BACE1 +/- mice (black rectangles). Mortality is almost exclusively observed in BACE1 -/- and double knock out groups. C) Pup exchange experiment: 48 BACE1 null pups born toBACE1 null parents and 42 wild-type pups born to wild-type parents were exchanged within the first day after birth. Reduction in the number of mice is expressed as a percentage of the initial number (setas 100%.). Black rhomboids, wild-type pups nursed by BACE1 knock out mothers; grey rectangles,BACE1 null pups nursed by wild-type mothers. D) Top left panel, a 3 weeks old wild-type (left) and a BACE1 knock out littermate (right) affected by a wasting syndrome. Top right panel, a BACE1+/+/BACE2+/- (left) and a healthy double knock out littermate (right), by 4 weeks of age.Lower panel, 4 weeks old BACE2 knock out pup (left) and a BACE1+/+/BACE2+/- littermate (right). E) The weight (in grams) of BACE1+/+BACE2+/- (9.6 +/- 0.9; n=16), BACE1-/- (6.9 +/- 0.4; n=9),BACE2-/- (8.7 +/- 0.4; n=35) and double knock out (6.9 +/- 0.7; n=11) littermates was measured by theage of 3 weeks. *P<0.05 versus BACE1+/+BACE2+/-.
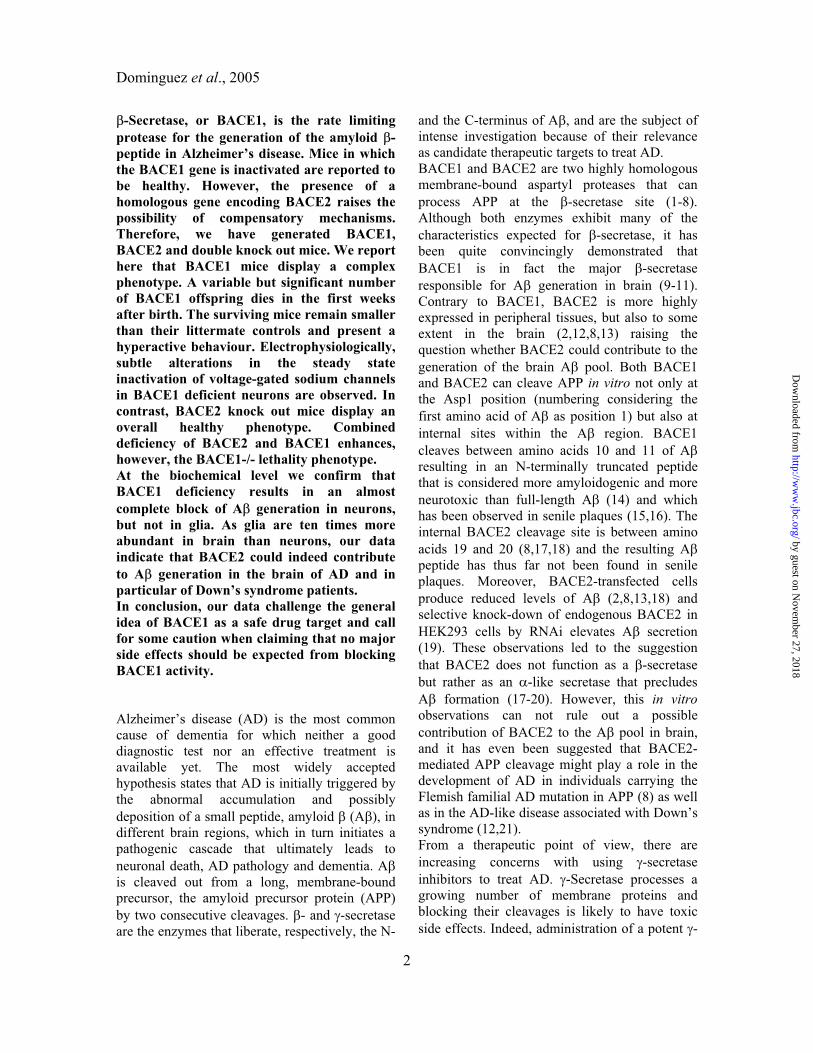
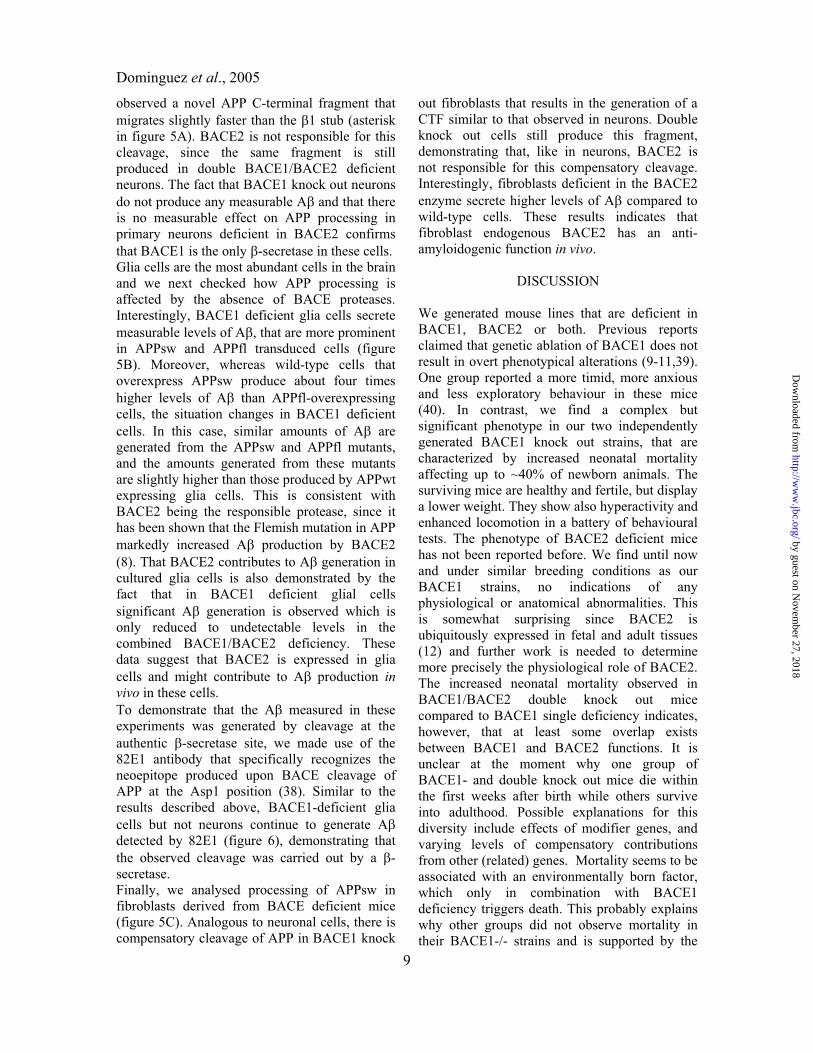
Figure 2. Behavioural analysis of BACE1 deficient mice. A-B) Hyperactivity and hyper locomotion in the open field test in BACE1 knock out mice. A) Total move time; B) Total distance travelled. C-D) Elevated zero maze test. C) Total distance travelled; D) Relative time spent in the open arms (timespent in the open arms/300 (=duration of experiment)). E) Targeted deletion of BACE1 had no effect on depression-related behaviour in the tail suspension test. F) BACE1 knock out mice show reducedimmobility in the forced swim test. This difference probably reflects a hyperactive rather than an antidepressant phenotype. Results are presented as mean + SEM. *P<0.05 versus wild-type mice.
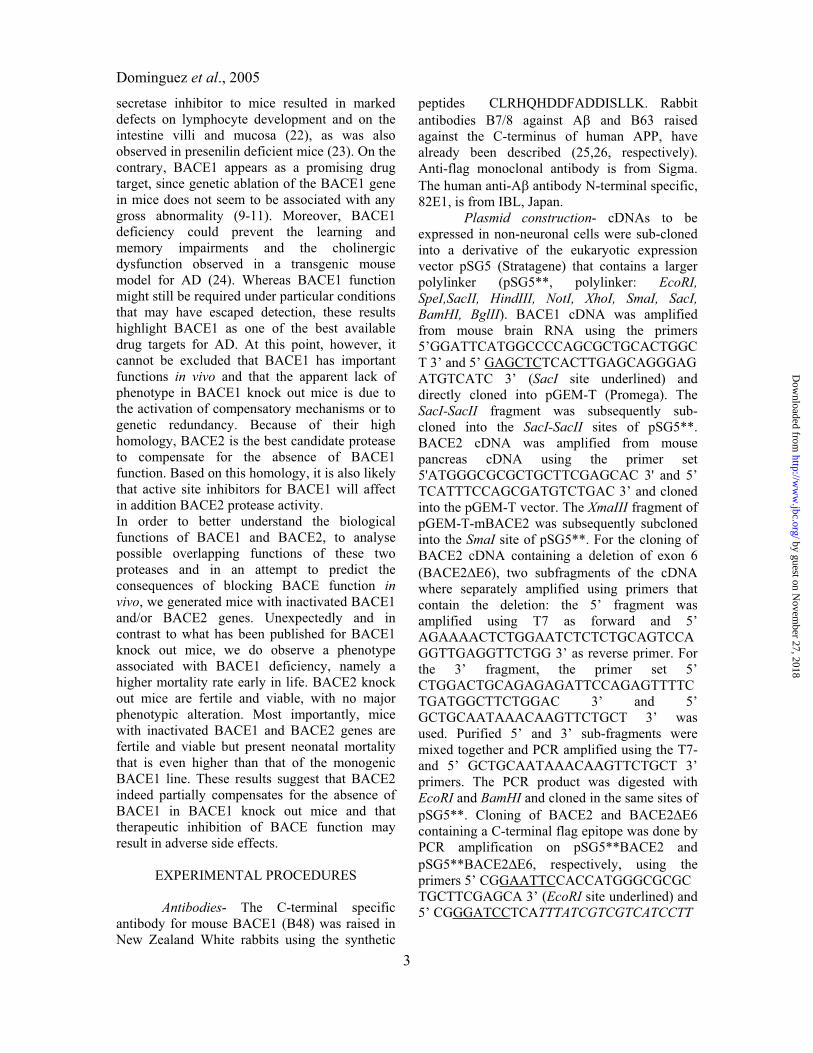
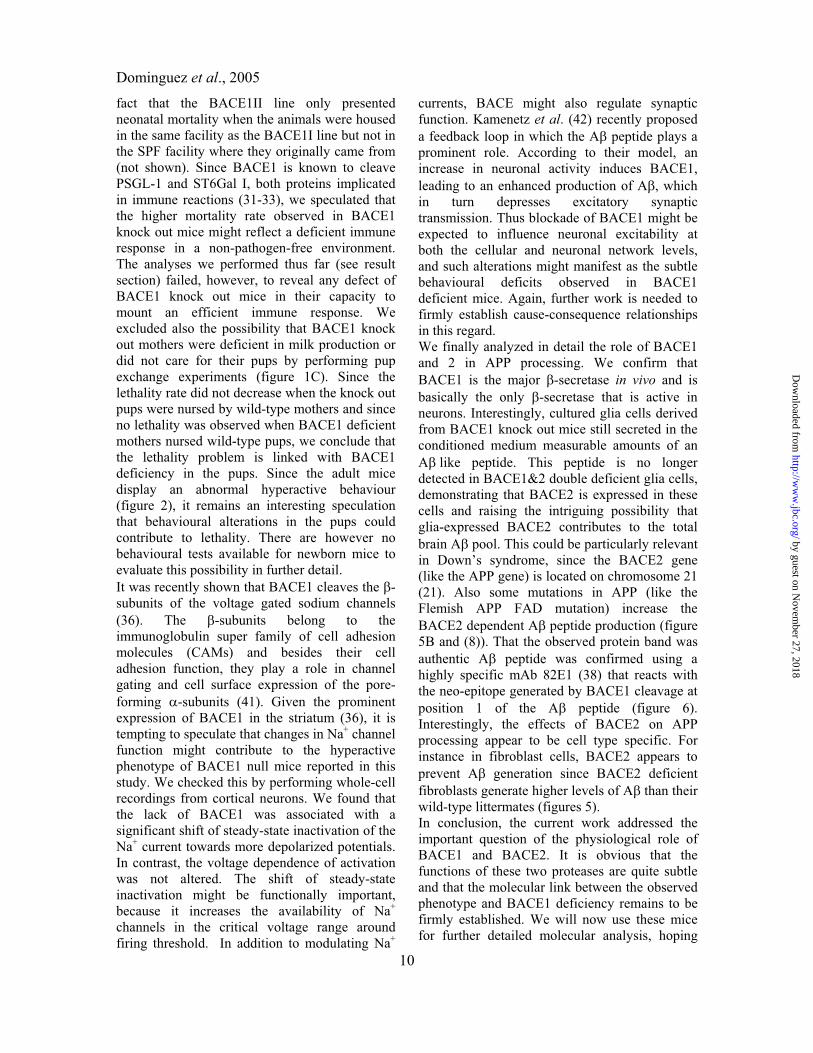
Figure 3. Whole-cell recordings of voltage-gated Na+ currents in acutely dissociated cortical pyramidalcells. A) Na+ current responses elicited by depolarizing voltage steps in a neuron from a BACE1 KOmouse. Inset depicts pulse protocol. B) Normalized I-V curves of peak Na+ currents in wild-type mice(circles, dashed line) and BACE1 KO mice (squares, solid line). C) Activation curve (open symbols)and steady-state inactivation curve (filled symbols) of Na+ currents in neurons from wild-type mice(circles, dashed line) and BACE1 KO mice (squares, solid line). Inset depicts pulse protocol used to examine steady-state inactivation. The activation and inactivation curves were fitted by the Boltzmannequations G/Gmax = 1/[1 + exp(Vh - V)/k] and h = 1/[1 + exp(V - Vh)/k], respectively, where Vh is the voltage of half-maximal Na+ conductance (Gmax/2) and half maximal availability, respectively, and k isa slope factor. D) Recovery from inactivation was measured with the use of a two-pulse protocol withvariable interval (inset) in neurons from wild-type mice (circles, dashed line) and BACE1 KO mice(squares, solid line). Data points indicate amplitude of second Na+ current response after normalization to amplitude of first response. Data in B-D summarize recordings from 8 neurons of 4 wild-type miceand from 10 neurons of 3 BACE1 KO mice. * P < 0.05
14
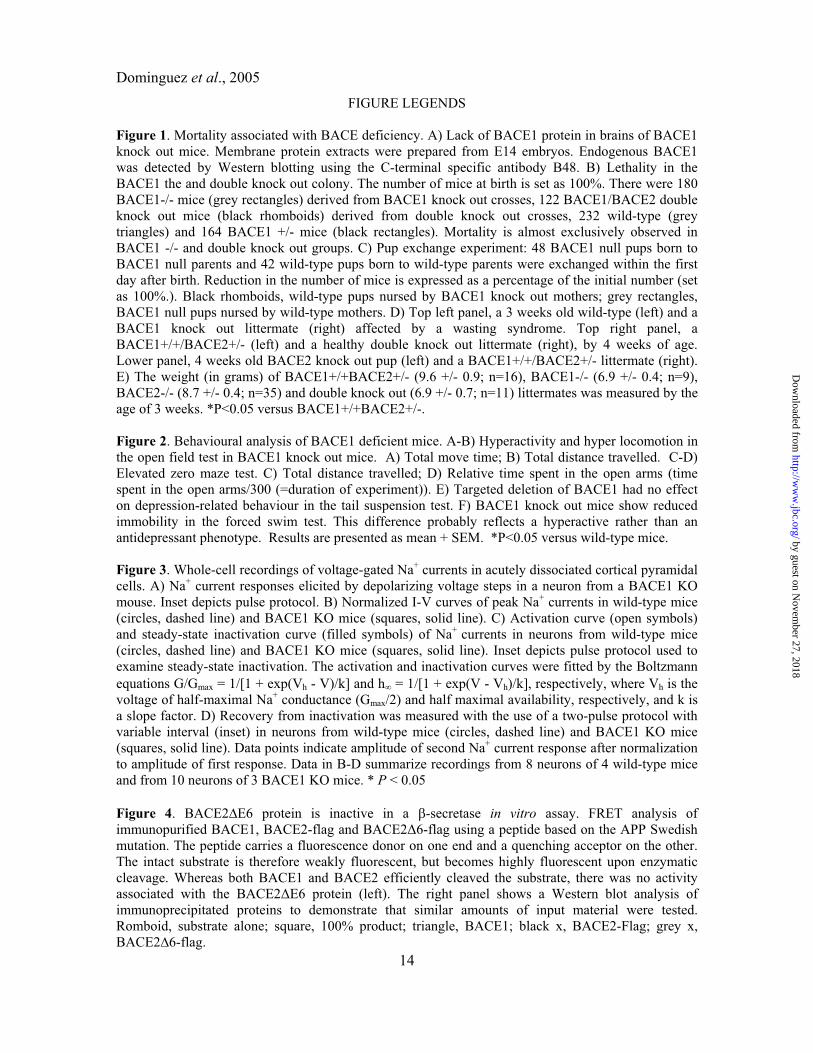
Figure 4. BACE2 E6 protein is inactive in a -secretase in vitro assay. FRET analysis ofimmunopurified BACE1, BACE2-flag and BACE2 6-flag using a peptide based on the APP Swedishmutation. The peptide carries a fluorescence donor on one end and a quenching acceptor on the other.The intact substrate is therefore weakly fluorescent, but becomes highly fluorescent upon enzymaticcleavage. Whereas both BACE1 and BACE2 efficiently cleaved the substrate, there was no activityassociated with the BACE2 E6 protein (left). The right panel shows a Western blot analysis ofimmunoprecipitated proteins to demonstrate that similar amounts of input material were tested.Romboid, substrate alone; square, 100% product; triangle, BACE1; black x, BACE2-Flag; grey x,BACE2 6-flag.
by guest on Novem
ber 27, 2018http://w
ww
.jbc.org/D
ownloaded from

Dominguez et al., 2005
Figure 5. Analysis of APP processing in cells derived from BACE deficient mice. A and B) Primarycortical neurons (A) and glia cells (B) were prepared from E14 embryos and infected with recombinantSFV encoding either APPwt or the FAD mutants APPsw or APPfl. Cells were metabolically labelled with 35S-methionine for 4 hours and APP full-length and C-terminal fragments wereimmunoprecipitated from a cell extract using antibody B63. A was immunoprecipitated from theconditioned medium with B7/8 antibody. Levels of secreted A were quantified by phosphor imageranalysis and expressed relative to the levels of full-length APP. The level of A secreted by wild-typecells upon expression of APPwt was fixed as 100%. Results are presented as mean + SEM. (C) Mouse fibroblasts were derived from peritoneum and diaphragm of adult mice and immortalized by stableexpression of SV40 large T antigen. Fibroblasts were transduced with recombinant adenovirus expressing APPsw. Processing of APP was analyzed as before. All experiments were performed at least3 times.
Figure 6. Analysis of APP processing using the A N-terminal specific antibody 82E1. Primarycortical neurons (A) and glia cells (B) were infected with recombinant SFV virus encoding APPwt andAPPsw, respectively. Samples of cell extract were probed with the APP C-terminal antibody B63 todetect full length APP and APP stubs (top and middle panels). A was immunoprecipitated from the conditioned medium with B7/8 antibody and detected with the 82E1 antibody (bottom panel).
15
by guest on Novem
ber 27, 2018http://w
ww
.jbc.org/D
ownloaded from
A D B1 -/-
B2 -/-
DKOBACE1
μg protein100 2 20 80
+/+-/-B
Num
ber
of a
nim
als
(%)
0
20
40
60
80
100
0 20 40 60 80 100 days
EC
0
20
40
60
80
100
0 10 20 30 40 50
Num
ber
of a
nim
als
(%)
days Figure 1
Wei
gh r)t
(g 6
0
2
4
8
10
12
**
WT B1-/- B2-/- DKO
by guest on November 27, 2018 http://www.jbc.org/ Downloaded from
A B C
0
2000
4000
6000
8000
Tota
l dis
tanc
e tr
avel
ed (c
m)
+/+ +/-
*
-/-
E
0
200
400
600
800
1000
1200
Tota
l mov
e tim
e (s
ec)
+/+
*
-/-0
500
1000
1500
2000
2500
Tota
l dis
tanc
e tr
avel
ed (c
m)
*
+/+
250
F100
Open field Open field Elevated zero maze+/- +/- -/-
D
0
20
40
60
80
100
120
140
Imm
obili
ty ti
me
(sec
)
+/+ +/- -/-+/+ +/- -/-
Imm
obili
ty ti
me
(sec
)
0
50
100
150
0
20
40
60
80
Rel
ativ
e tim
e tr
avel
edop
en a
rms
(%)
Elevated zero maze Tail suspension
*
in th
e
180
160
200
*
+/+ +/- -/-Forced swimming
Figure 2
by guest on November 27, 2018 http://www.jbc.org/ Downloaded from

Figure 4
50000
100000
150000
200000
250000
300000
0
15 m
in
25min
35min
45min
55min
Time
-BACE1
BACE2-Flag
BACE2E6-F
lag
Anti-FlagB48
BACE1BACE2
RFU
by guest on November 27, 2018 http://www.jbc.org/ Downloaded from

A) Neurons
FL-APP
Stubs
AAPPwt APPsw APPfl APPwt APPsw APPfl APPwt APPswAPPfl APPwt APPsw APPfl
Figure 5
APPwt APPwt APPwt wt0
50
100
150
200
250
300
350
APPsw APPfl APPsw APPfl APPsw APPfl APP APPsw APPfl
wt B1 B2 dko
wt B1-/- B2-/- DKOA
by guest on November 27, 2018 http://www.jbc.org/ Downloaded from
B) Glia FL-APP
Stubs
A
wt B1-/- DKO
APPwt APPsw APPfl APPwt APPsw APPfl APPwt APPsw APPfl APPwt APPsw APPfl
B2-/-
0
100
200
300
400
500
600
700
APPwt APPwt wt APPwt
800A
APPsw APPfl APPsw APPfl APP APPsw APPfl APPsw APPfl
Figure 5wt B1-/- B2-/- DKO
by guest on November 27, 2018 http://www.jbc.org/ Downloaded from
C) Fibroblasts
150
250
300A
DKOB2-/
-B1-/-
FL-APP
Stubs
A
wt200
100
50
0wt B1-/- B2-/- DKO
Figure 5
by guest on November 27, 2018 http://www.jbc.org/ Downloaded from

A) Neurons B) Glia
B1-/-B2-/-
DKOB1-/-
B2-/-DKO
wt wt
flAPPWestern
B63
Stubs
IP B7/8Western 82E1 A
Figure 6
by guest on November 27, 2018 http://www.jbc.org/ Downloaded from

Dominguez et al., 2005
SUPPLEMENTARY INFORMATION
EXPERIMENTAL PROCEDURES
Generation of BACE1 targeted ES cells- For the generation of the first BACE1 line (BACE1I), a 129/ola mouse cosmid library from RZPD (Resource Center of the German Human Genome Project) was screened with a partial cDNA of mouse BACE1. The isolated mouse BACE1 cosmid clones contained the 5´ part of the murine BACE1 gene. For construction of the targeting vector a 6 kb XbaI DNA restriction fragment of BACE1 covering exon 1 (supplementary figure 1) was subcloned into the plasmid vector pbluescript SKII+ (Stratagene). A SalI restriction site was introduced into the coding region by site directed mutagenesis. The neo expression cassette from pMC1neopA (Thomas and Capecchi, 1987; Stratagene) was inserted into this site located in exon 1 of a XbaI fragment (glutamate 19 of the BACE1 cDNA). The insertion of the neo cassette introduces a premature translational stop codon into the open reading frame of the BACE1 gene. The targeting vector was introduced into the ES cell line MPI-2 (gift of Peter Gruss, Göttingen) by electroporation. G418 resistant colonies were screened by Southern blot analysis of DNA digested with SacI and hybridized with the 5´ BglII probe (supplementary figure 1). For the generation of the second BACE1 knockout mouse line (BACE1II, developed in collaboration with Lexicon Genetics Inc.), genomic clones were isolated by screening of the 129SvEvBrd derived lambda pKOS genomic library (1). A genomic clone spanning 10 kb of the BACE-1 gene spanning exon 3 up to exon 9 was used to generate the targeting vector via yeast-mediated homologous recombination. In this vector a 252 bp genomic fragment, spanning exon 3, was replaced by a floxed version of exon 3 including a 1.7 kb PGK-neo selection cassette flanked by two Frt sites. The NotI-linearized vector was electroporated into 129 Sv/Evbrd(LEX1) embryonic stem (ES) cells and G418-fialuridine (FIAU)-resistant ES cell clones were isolated and analyzed for homologous recombination by Southern blot analysis.
Generation of BACE1 knock out mice- BACE1I: the mutated ES line EB5 was microinjected into blastocysts of C57BL/6J mice or aggregated with morolae from CD1 mice. Chimeric males were mated to C57BL/6J females or CD1 females in case of aggregation chimaeras. Mice were genotyped for the BACE1 gene mutation by Southern blot analysis of SacI-digested genomic DNA or by PCR analyses using a neomycin-specific PCR (2) and an exon-specific-PCR with primers 5´ ATGGCCCCAGCGCTGCACTGGCTCC 3´ and 5´ CTGCCTACGGTCATCTCCACATAGTAG 3´ flanking the exon used for interruption. Homozygous mutant mice were obtained by mating heterozygous mice. BACE1II: targeted ES cell clones were injected into C57BL/6(albino) blastocysts, and the resulting chimeras were mated to C57BL/6(albino) females to generate animals heterozygous for the mutation. In order to generate full BACE1 knockout animals, the above mentioned heterozygotes were crossed to the Protamine Cre mice and male descendants heterozygote for both the floxed BACE1 allele and the Protamine Cre transgene were crossed to C57Bl/6 females to obtain heterozygote BACE1 knock out animals. These were subsequently crossed to generate all three genotypes employed in the reported studies.
Generation of BACE2 targeted ES cells- A bacterial artificial chromosome (BAC) library done from mouse ES 129 SvJ ReleaseII (Genome systems) was screened with a BACE2 cDNA probe including exons 3 to 7 (PCR amplified from mouse BACE2 cDNA using the primers 5’ CTCCAAGGGCTTTGA 3’ and 5’ CCCATCATGGGCTGAATGT 3’). A ~10 kb fragment of the BACE2 gene spanning from the EcoRV site within intron 2 until the KpnI site in intron 6 (figure 4) has been subsequently subcloned in the pUC vector (HincII-KpnI sites). To create the targeting construct, a cassette consisting of a lox P site and the hygromycin resistant gene flanked by two frt sites was introduced at the ClaI site in intron 5. A second lox P site was subsequently introduced at the HincII site within intron 6. The fragment spanning from the Bsu36 I site (in intron 3) until the KpnI site (in
1
by guest on Novem
ber 27, 2018http://w
ww
.jbc.org/D
ownloaded from
Dominguez et al., 2005
intron 6) was excised from the plasmid and electroporated into 129 Ola ES cells. Homologous recombination in hygromycin-resistant clones was confirmed by Southern blot of EcoRV-digested genomic DNA using a 5’-external probe (I6, PCR amplified from genomic BACE2 DNA using primers 5' GGTACCTCACAGAAGGGTTTGTATTC 3' and 5' GACCTAACTGACATTACTTCCTTG 3') that detects an 8.4 kb fragment for the targeted locus. Homologous recombination at the 3’-end was confirmed in these clones by Southern blot of StuI-digested genomic DNA using the 3’-external probe E3 (PCR amplified from BACE2 cDNA using the primer pairs 5' GCTGGACTGGCTTTGTTGGTGA 3' and 5' GCAGCATAAGCAAGTCCAAGG 3').
Generation of BACE2 knock out mice- Two positive ES cell lines were obtained and independently injected into blastocysts C57BL/6J mice and transferred to foster mothers. Germline transmission of the conditional allele was achieved for both lines. Chimeric males were then mated to C57BL/6J females. Offsprings heterozygote for the BACE2-targeted allele were crossed with mice expressing Cre recombinase from the ubiquitous PGK promoter, resulting in a deletion of BACE2 exon 6 and therefore a full BACE2 knock out allele. Homozygous mutant mice were obtained by mating heterozygous mice.
Generation of BACE1 BACE2 double knock out mice- Double knock out mice were obtained by mating the monogenic BACE1 and BACE2 deficient mouse lines.
Quantitative RT-PCR- Quantitative RT-PCR analysis was used to show absence of the BACE1 transcript in BACE1II ainimals. Total RNA was isolated from different tissues using Trizol (Invitrogen; Carlsbad, CA) and first strand cDNA synthesis was performed on 0.5 µg total RNA using random hexamer primers and SuperscriptII RT (Invitrogen; Carlsbad, CA). Quantitative PCR was performed on a ABIPrism 7700 cycler (Applied Biosystems; Foster City, CA) using a Taqman PCR kit. Serial dilutions of cDNA were used to generate standard curves of threshold cycles versus the logarithms of concentration for ß-actin and BACE1. A linear regression line calculated from the standard curves allowed the determination of transcript levels in RNA samples from mice. The BACE1 primer-probe pair (primer 5’TGCCCCACACCCTTTCCT3’ primer 5’CCTTTCGGAGGTCTCGATATGT3’, probe 5’CATCGCTACTACCAGAGGCAGCTGTCCA3' [5']FAM [3']TAMRA) relative to actin (primer 5’ CATCTTGGCCTCACTGTCCAC3’, primer 5’ GGGCCGGACTCATCGTACT3’, probe 5’ TGCTTGCTGATCCACATCTGCTGGA3’ [5']FAM [3']TAMRA) was used to asses expression levels.
Genotyping- Genotyping was performed on DNA extracted from mouse tail biopsy samples. To discriminate between BACE1I wild-type and targeted alleles, the primer set 5’ ATGGCCCCAGCGCTGCACTGGCTCC3’ and 5’CTGCCTACGGTCATCTCCACATAGTA G3’ was used. For BACE1II, primers 5’ACCCTCAAAGTCTGACTGTG3’ and 5’TCATGTTCTGCTCTGGGAGC3’ were used, that amplify a 405 bp fragment from the wild type allele and 254 bp band from the Cre-excised allele. For genotyping BACE2 mice, the primers 5'GCTATAGAGACCAAAGCCCACAAATC3' and 5'GCCCGAATAACAAGAGCA TCAC 3' were used.
Northern blot analysis- A pre-made Northern blot containing ~2 µg of poly A+ RNA per lane from 8 different mouse tissues (Clontech) was used to detect the BACE2 mRNA. The probe consisted of BACE2 cDNA from exon 2 to exon 9 and was PCR amplified from BACE2 cDNA using the primers 5' TTGTGGACACTGGAAGCAG 3' and 5’ TCATTTCCAGCGATGTCTGAC 3’. The β-actin probe was done by PCR amplification using the primers 5’ TCAATAGTGATGACCTG 3’ and 5’ AGACGGAAATCGTG 3’.
2
Histology- Conventional histology was made on wild type, BACE1, BACE2 and BACE1/2 deficient mice, three 2.5-4 months old animals of each genotype. Light microscopy examination was done on sections of modified Bouin- or 4% paraformaldehyde (PFA) fixed tissue, embedded in
by guest on Novem
ber 27, 2018http://w
ww
.jbc.org/D
ownloaded from
Dominguez et al., 2005
paraffin, which were stained with hematoxylin and eosin. Immunohistology was performed as described (PNAS paper An H 1999) using antibodies against CD45, (BD Pharmingen) and F4/80 (ATCC). FITC-labeled tyramide was used for signal detection (Perkin Elmer).
Viruses- Vesicular stomatitis virus serotype Indiana (VSV-IND, Mudd-Summers isolate) was originally obtained from D. Kolakofsky, University of Geneva, Switzerland, and was grown on BHK cells in MEM with 5% FCS to virus stocks containing 109 pfu/ml.
VSV neutralization assay- Serial 2-fold dilutions of 1:40 pre-diluted serum samples were mixed with equal volumes of VSV containing 500 pfu/ml and the mixtures were incubated for 90 min at 37°C in an atmosphere containing 5% CO2. 100 µl of the mixture was transferred onto Vero cell monolayers in 96-well plates and incubated for 1 h at 37°C. Monolayers were overlaid with 100 µl of DMEM containing 1% methylcellulose, and incubated for 24 h at 37°C. Then the overlay was removed and the monolayer was fixed and stained with 0.5% crystal violet dissolved in 5% formaldehyde, 50% ethanol, 4.25% NaCl. The serum dilution reducing the number of plaques by 50% was taken as titer (3). To determine IgG titers, undiluted serum was treated with an equal volume of 0.1 M 2-mercaptoethanol in PBS for 1 h at room temperature before samples were processed as described above.
REFERENCES
1. Wattler, S., Kelly, M., and Nehls, M. (1999) Biotechniques 26, 1150-1156, 1158, 1160 2. Saftig, P., Peters, C., von Figura, K., Craessaerts, K., Van Leuven, F., and De Strooper,
B. (1996) J Biol Chem 271, 27241-27244 3. Kalinke, U., Bucher, E. M., Ernst, B., Oxenius, A., Roost, H. P., Geley, S., Kofler, R.,
Zinkernagel, R. M., and Hengartner, H. (1996) Immunity 5, 639-652
SUPPLEMENTARY FIGURES
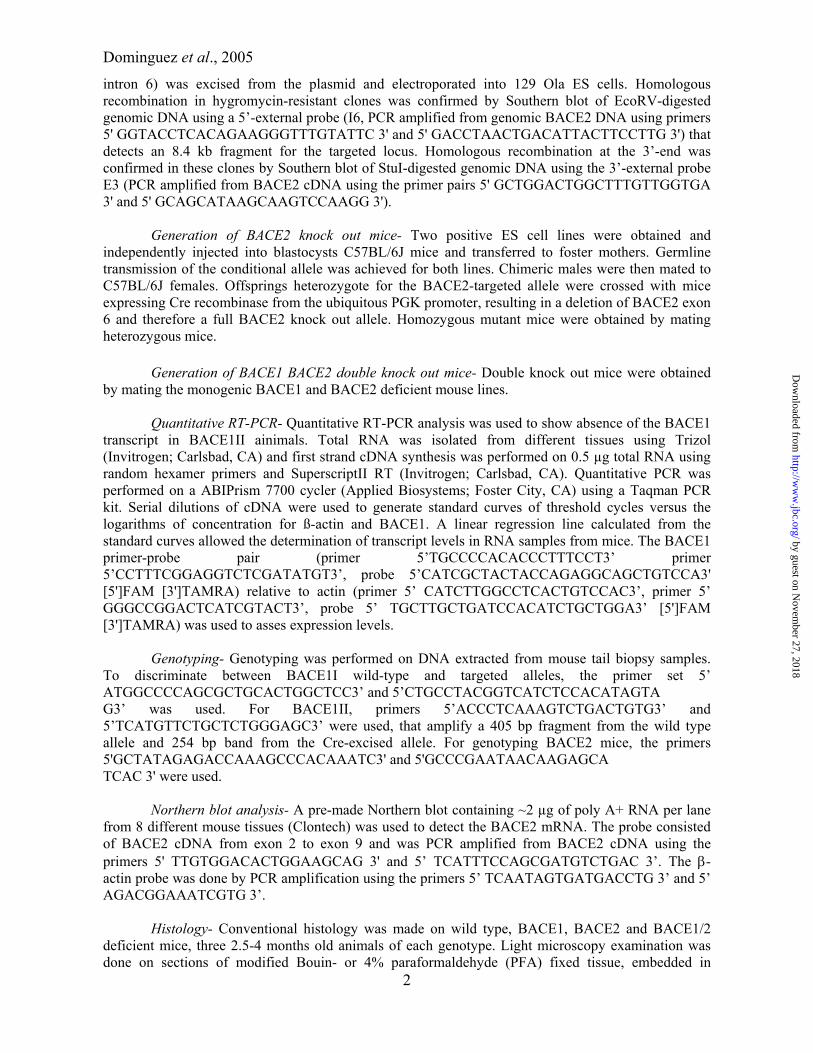
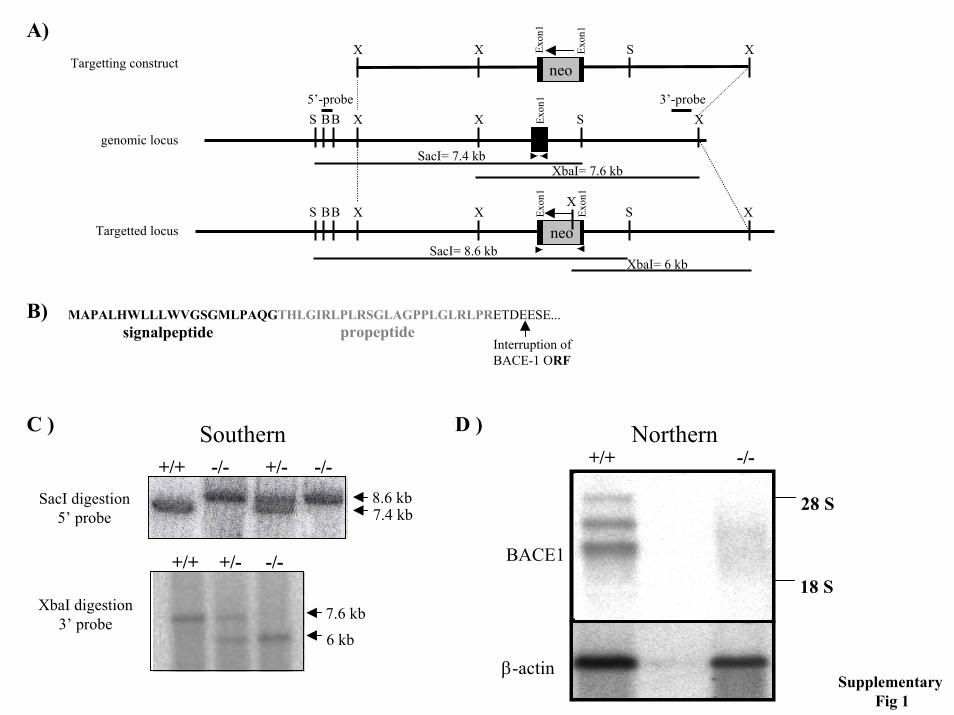
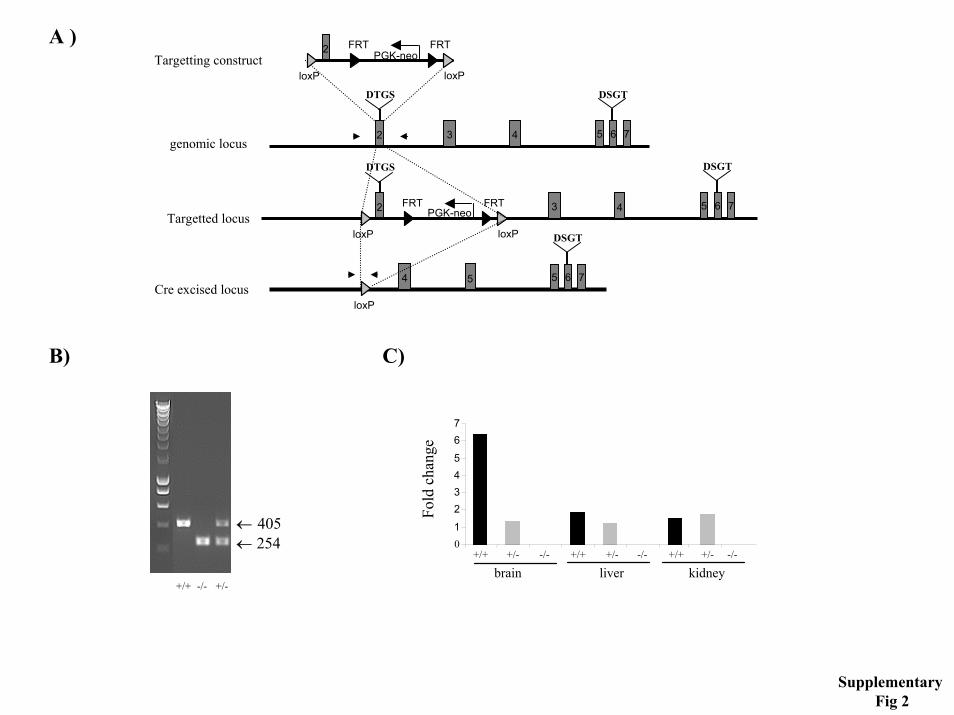
Supplementary figure 1. Generation of BACE1I knock out mice. A-D) BACE1I strain. E-G) BACE1II strain. A) Schematic representation of part of the BACE1 gene and targeting construct (BACE1I). The targeting construct was made by first subcloning the XbaI fragment of the BACE1 gene in pBluescript vector. S= SacI; B=BglII; X=XbaI. Subsequently, a neomycin-resistance cassette has been inserted within the first coding exon of BACE1, disrupting the open reading frame (site of interruption shown in B). Arrows in exon 1 indicate the primers used for genotyping. The position of the 5’- and 3’-probes as well as the size expected in Southern blotting analysis upon SacI and XbaI digestion, are indicated. Neomycin-resistant ES cells containing one copy of the appropriately disrupted locus were selected by Southern blot analysis of genomic DNA digested with SacI and probed with a 5’-external probe and further confirmed by digestion with XbaI and probing with a 3’-specific probe (not shown). Mice generated with the targeted ES cells also contained the targeted allele (C). Northern blot analysis of mRNA isolated from brain, confirmed the absence of BACE1 mRNA in the knock out mice (D). Supplementary figure 2. Generation of BACE1II knock out mice. A) Schematic representation of part of the BACE1 gene and targeting construct (BACE1II). Grey boxes represent exons; black and grey arrow heads represent Frt and LoxP sites respectively; black arrows represent primers used for PCR genotyping. B) PCR analysis of mouse genomic DNA. The wild type and targeted allele give a 405 and 254 bp PCR product, respectively. C) Expression of the BACE1 transcript in brain, liver and kidney was abolished in the homozygous knockout mouse as determined by quantitative RT-PCR. Supplementary figure 3. Generation of BACE2 knock out mice. A) Schematic representation of the BACE2 gene and the targeting construct. Scheme of the BACE2 gene consisting of nine coding
3
by guest on Novem
ber 27, 2018http://w
ww
.jbc.org/D
ownloaded from
Dominguez et al., 2005
exons. Indicated are the two aspartyl protease active sites (D T/S G T/S) within exon 2 and exon 6, respectively. The targeting construct and the sites of insertion of the 2 loxP sites and the hygromycin-resistance cassette are shown at the top of the figure. The wild-type and the targeted loci with the position of the 2 probes used in the Southern blot analysis are shown at the bottom. The fragments expected in the Southern blots for the EcoRV- and StuI digests are also indicated. B) Southern blot analysis of a positive ES clone. Two of the hygromycin-resistant ES clones gave the expected 8.4 kb fragment in Southern blot analyis using EcoRV digestion and the I6 5’-external probe. Homologous recombination at the 3’-end was confirmed by Southern blot of StuI-digested genomic DNA using the 3’-external probe E3. Shown are the results obtained for one of the two ES positive clones. C) Exon 6 is deleted in BACE2 knock out mice. RT-PCR analysis using mRNA extracted from the indicated tissues of BACE2 +/+, +/- and -/- mice and exon 5- and exon 7-specific primers. Grey arrow heads, loxP sites; black arrow heads, FRT sites; grey rectangle, hygromycin-resistant marker. Restriction enzymes: B36, Bsu36 I; EV, EcoRV, K, KpNI; S, StuI. Supplementary figure 4. Histological analysis of BACE deficient mice. Representative histological sections of non-neuronal and neural tissues from wild type, BACE1 -/-, BACE2 -/- and double knock out (DKO) mice. Tissue sections of ~3-4 month old animals were stained with hematoxylin and eosin. No genotype-specific difference could be observed. Supplementary figure 5. VSV infected BACE1 mice mount protective antibody responses. BACE1 deficient (BACE1-/-), heterozygous (BACE1+/-) and wild-type mice (BACE1+/+) were intravenously infected with 2x10⁶ pfu of VSV. On indicated days, blood was taken and the serum was analyzed for VSV neutralizing IgM (open circles) and IgG (filled squares) antibodies. Data shown are the mean of three mice per group ± SEM. One out of two similar experiments is shown.
4
by guest on Novem
ber 27, 2018http://w
ww
.jbc.org/D
ownloaded from
A)
S BB X X S XE
X X S XE E
ES BB X Xneo
S XExon
1
SacI= 7.4 kb
SacI= 8.6 kb
XbaI= 7.6 kb
X
XbaI= 6 kb
5’-probe 3’-probe
xon1
xon1
Targetting construct neo
xon1
genomic locus
xon1
Targetted locus
B) MAPALHWLLLWVGSGMLPAQGTHLGIRLPLRSGLAGPPLGLRLPRETDEESE...signalpeptide propeptide
Interruption ofBACE-1 ORF
C ) D )Southern Northern
Supplementary Fig 1
7.4 kb8.6 kb
+/+ -/- +/- -/- +/+ -/-
SacI digestion5’ probe
28 S
BACE1+/+ +/- -/-18 S
XbaI digestion3’ probe
7.6 kb
6 kb
β-actin
by guest on November 27, 2018 http://www.jbc.org/ Downloaded from
A )
loxPloxP
PGK-neoFRT FRT2
2 3 4
loxP
4 5
loxPloxP
PGK-neoFRT FRT2
DTGS
DTGS
Targetting construct
DSGT
5 76genomic locus
DSGT
3 4 5 76
5 76
DSGT
Targetted locus
Cre excised locus
C)B)
01
2345
67
Fold
cha
nge
← 405← 254
+/+ +/- -/- +/+ +/- -/- +/+ +/- -/-
liver kidneybrain+/+ -/- +/-
Supplementary Fig 2
by guest on November 27, 2018 http://www.jbc.org/ Downloaded from

HincII
B
I I
Hygromycin
E4 E5 E6
EV K EV
EcoRV= 8.4 kbStuI= 6 kb
EcoRV= 9.7 kbStuI= 9.2 kb
B36
S EV S EV
DTGS DSGT
DSGT
V
BACE2 gene
E3-prob
e
E3be
I6-probe
I6be
A) su36Kpn
ClaI
Targeting construct
10 kb
genomic locus
S E-pro
V S E-proS EV
Targeted locus
B) C)DTGS DSGT
1 2 3 4 5 6 7 8 9
1 2 3 4 5 7 8 9
StuIwt tg
EcoRVwt tgwt
wt targeted HeartLiver Lung Kidney
wt +/+ +/- -/- +/+ +/- -/- +/+ +/- -/- +/+ -/-targeted
224 bp
326 bp E5-E6-E7
E5-E7I6 probe(external 5’)
E3 probe(external 3’)
Supplementary Fig 3
by guest on November 27, 2018 http://www.jbc.org/ Downloaded from
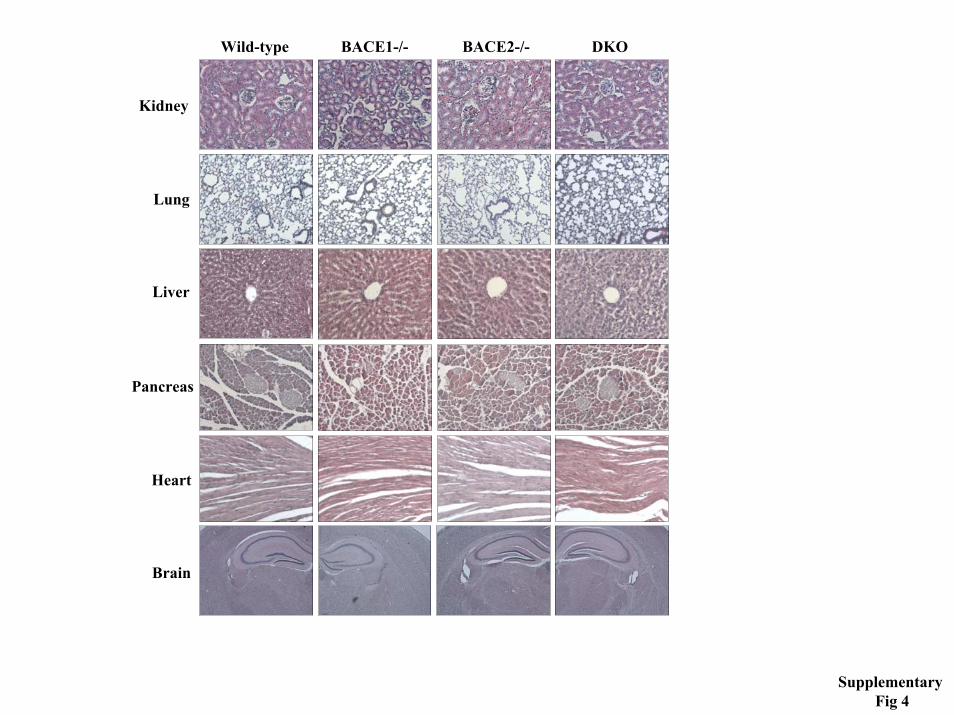
Wild-type BACE1-/- BACE2-/- DKO
Kidney
Lung
Liver
Pancreas
Heart
Brain
Supplementary Fig 4
by guest on November 27, 2018 http://www.jbc.org/ Downloaded from
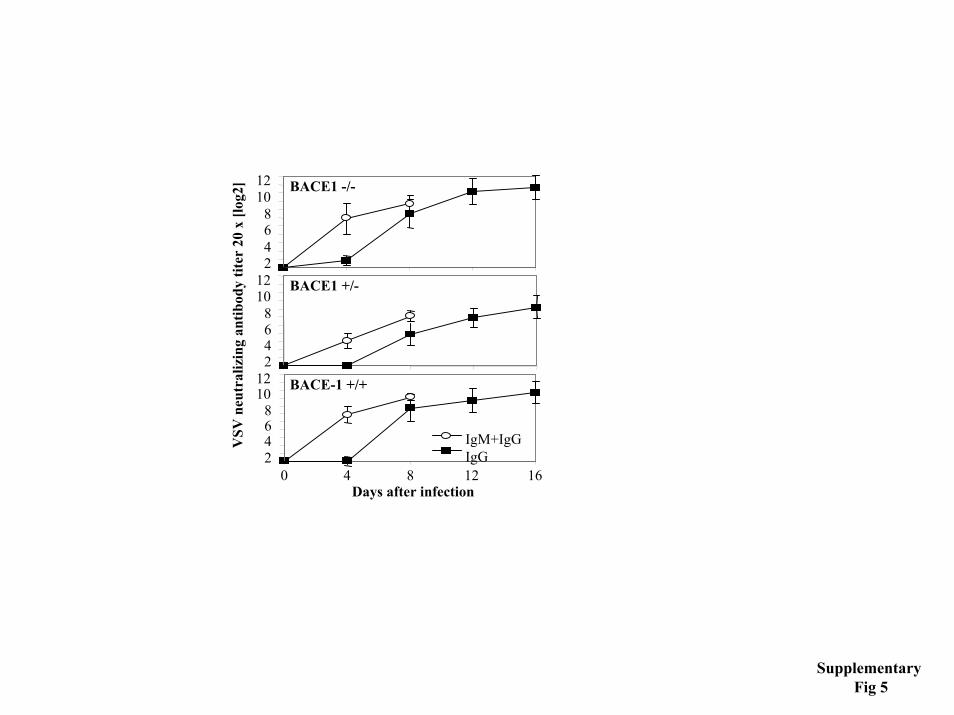
VSV
neu
tral
izin
g an
tibod
ytit
er20
x [l
og2]
Days after infection
24681012
24681012
24681012
0 4 8 12 16
BACE1 -/-
BACE1 +/-
BACE-1 +/+
IgM+IgGIgG
Supplementary Fig 5
by guest on November 27, 2018 http://www.jbc.org/ Downloaded from

Moechars, Christian Alzheimer, Karina Reiss, Paul Saftig and Bart De StrooperRoebroek, Michael Schwake, Rudi D'Hooge, Patricia Bach, Ulrich Kalinke, Dieder
Lutgarde Serneels, Ira Espuny Camacho, Els Marjaux, Katleen Craessaerts, Anton J. M. Diana Dominguez, Jos Tournoy, Dieter Hartmann, Tobias Huth, Kim Cryns, Siska Deforce,
Phenotypical and biochemical analysis of BACE1 and BACE2 deficient mice
published online June 29, 2005J. Biol. Chem.
10.1074/jbc.M505249200Access the most updated version of this article at doi:
Alerts:
When a correction for this article is posted•
When this article is cited•
to choose from all of JBC's e-mail alertsClick here
Supplemental material:
http://www.jbc.org/content/suppl/2005/07/08/M505249200.DC1
by guest on Novem
ber 27, 2018http://w
ww
.jbc.org/D
ownloaded from