Modeling Petroleum Supply Chain Multimodal Transportation ...

March 14, 2019
HazMat Analysis: Petroleum Supply
Chain Nevada Hazardous Commodity Flow Study
prepared for
Nevada Department of
Transportation
prepared by
Cambridge Systematics, Inc.


HazMat Analysis: Petroleum Supply Chain
Nevada Hazardous Commodity Flow Study
DRAFT
prepared for
Nevada Department of Transportation
prepared by
Cambridge Systematics, Inc. 555 12th Street, Suite 1600 Oakland, CA 94607
date
March 14, 2019


Petroleum Supply Chain Analysis DRAFT
Cambridge Systematics, Inc. i
Table of Contents
Glossary......................................................................................................................................................... 1-1
1.0 Introduction ........................................................................................................................................ 1-2
2.0 PADD 5 Transportation Fuel Supply and Demand ......................................................................... 2-3
3.0 Southern Nevada Supply, Demand, and Storage ........................................................................... 3-7
3.1 Southern California Southern Nevada (SCSN) Region Profile .................................................. 3-8
3.2 Pipelines and Storage Facilities in Southern Nevada .............................................................. 3-10
3.2.1 Calnev Pipeline and Las Vegas Terminal: Kinder Morgan ......................................... 3-10
3.2.2 UNEV Pipeline and Las Vegas Terminal: Holly Energy ............................................. 3-12
4.0 Northern Nevada Supply, Demand, and Storage .......................................................................... 4-14
4.1 Northern California Northern Nevada (NCNN) Region Profile................................................. 4-14
4.2 Pipelines and Storage Facilities in Northern Nevada .............................................................. 4-16
4.2.1 SFPP North Line and Sparks Terminal ...................................................................... 4-16
4.2.2 Golden Gate Petroleum Refinery ................................................................................ 4-18
5.0 Nevada Petroleum Distribution Profile .......................................................................................... 5-18


Petroleum Supply Chain Analysis DRAFT
Cambridge Systematics, Inc. iii
List of Tables
Table 2.1 Petroleum Demand and Production, by Region ................................................................... 2-6
Table 2.2 Petroleum Demand and Production for California and Nevada, by Fuel Type .................... 2-6
Table 3.1 Southern California Petroleum Refineries ............................................................................ 3-9
Table 3.2 Refined Petroleum Supply to Las Vegas, Kinder Morgan .................................................. 3-11
Table 4.1 Northern California and Northern Nevada Refineries ......................................................... 4-15
Table 4.2 Northern California Northern Nevada Petroleum Summary ............................................... 4-16
Table 5.1 Nevada Petroleum Pipeline and Storage Summary ........................................................... 5-18


Petroleum Supply Chain Analysis DRAFT
Cambridge Systematics, Inc. v
List of Figures
Figure 1.1 Petroleum Area Defense Districts (PADDs) ......................................................................... 1-3
Figure 2.1 PADD 5 Refineries and Petroleum Product Distribution ...................................................... 2-4
Figure 2.2 PADD 5 Regional Markets in California/Nevada, with SCSN Counties ............................... 2-5
Figure 2.3 California and Nevada Refined Petroleum Pipelines ........................................................... 2-7
Figure 3.1 Southern California and Southern Nevada Product Flows ................................................... 3-9
Figure 3.2 Kinder Morgan Terminal near Nellis Air Force Base .......................................................... 3-11
Figure 3.3 Holly Energy Terminal, Apex Industrial Park ...................................................................... 3-12
Figure 3.4 Holly Energy’s UNEV Pipeline Map .................................................................................... 3-13
Figure 4.1 Northern California and Nevada Refineries and Petroleum Flows ..................................... 4-14
Figure 4.2 Sparks Terminal .................................................................................................................. 4-17
Figure 5.1 Nevada Petroleum Distribution, Diesel ............................................................................... 5-20
Figure 5.2 Nevada Petroleum Distribution, Gasoline........................................................................... 5-21


Petroleum Supply Chain Analysis DRAFT
Cambridge Systematics, Inc. 1-1
Glossary
Atmospheric Crude Distillation Unit (ACDU) operating capacity: The operating capacity of a refinery as
determined by the maximum amount of crude oil that can flow into the distillation unit.
Barrel: A unit of volume equal to 42 U.S. gallons.
Barrels per calendar day (b/cd): The capacity of a refinery as defined by the number of barrels that a
distillation facility can process in a 24-hour period under usual operating conditions.
Barrels per stream day: The capacity of a refinery as defined by the maximum number of barrels that a
distillation facility can process within a 24-hour period when operating at full capacity without any downtown.
Barrels per stream day is typically about 6% higher than calendar day capacity.
Barrels per day (b/d): A measure of refinery output represented by the number of barrels produced in a
single day.
California Air Resources Board (CARB) gasoline: Gasoline that conforms to the gasoline and diesel
specifications as defined by the California Air Resources Board. CARB diesel requires lower aromatic
hydrocarbon content and a higher cetane number.
Distillate: Distillate is a general category of refined petroleum that includes diesel and fuel oils.
Ethanol: Ethanol is a clear, colorless alcohol made from a variety of biomass materials called feedstocks.
Gasoline is blended with 10% ethanol to make E10 fuel.
Petroleum Administration for Defense Districts (PADDs): Geographic aggregations of the 50 States and
the District of Columbia into five districts. The PADDs allow data users to analyze patterns of crude oil and
petroleum product movements throughout the nation.
Petroleum Administration for Defense District (PADD) 5: The West Coast PADD district includes the
western states of California, Arizona, Nevada, Oregon, Washington, Alaska, and Hawaii.
Rack: A loading facility for truck distribution to petroleum retail facilities.
Transmix: A mixture of gasoline, diesel, and/or jet fuel. Transmix forms when transported in pipelines.
Transmix processing plants use distillation to separate the mix into individual transportation fuels, specifically
gasoline, diesel, and jet fuel. After distillation, some additional treatments may be necessary in order to meet
fuel specifications.
Transportation fuel: A category of fuel that includes the different types of gasoline, diesel, and jet fuel
needed to provide fuel for automobiles, trucks, and airplanes.

Petroleum Supply Chain Analysis DRAFT
Cambridge Systematics, Inc. 1-2
1.0 Introduction
This Petroleum Supply Chain Analysis was conducted as part of the Nevada Hazardous Commodity Flow
Study. This research is important as flammable liquids, especially refined petroleum products, represent 85
percent of all hazmat shipments transported in the United States.1 Refined petroleum products include the
transportation fuels needed to provide fuel for automobiles, trucks, and airplanes throughout Nevada.
Though the volume of petroleum products on the roads is greater than any other hazardous material,
emergency responders are well experienced in handling petroleum-related incidents. Since refined
petroleum product movements comprise such a large portion of hazardous material shipments, this analysis
provides insight into majority of hazardous material movements in Nevada, while at the same allowing the
overall hazmat analysis to proceed with the other chemicals in the supply chain that may be less common
and more dangerous due to either the nature of the chemical or the lack of preparedness.
An important source for this research is the Energy Information Administration’s Petroleum Administration for
Defense District 5 (PADD 5) Transportation Fuels Markets Study conducted in 2015 (EIA Report). The EIA
Report examined the supply, demand, and distribution of transportation fuels in PADD 5, which includes the
western states of California, Arizona, Nevada, Oregon, Washington, Alaska, and Hawaii as shown in Figure
1.1. Using a 2013 base year, The EIA Report examined PADD 5 petroleum product regional markets, marine
vessel availability, and distribution infrastructure such as storage terminals, pipelines, rail facilities, marine
loading and unloading facilities.2 This study supplemented the petroleum distribution trends apparent in the
EIA Report with interviews of mid-stream petroleum operators. The combination of commodity flow
information and operator interviews provides a comprehensive look at the supply, demand, and distribution
of transportation fuels in Nevada.
1 BTS Freight Facts & Figures 2017 - Chapter 2: Freight Moved in Domestic and International Trade ,Table 2-6
2 Sources included Stillwater Associates, Califor/nia Energy Commission (CEC), the Army Corps of Engineers Waterborne Commerce Statistics Center, and publicly available data from various sources.
Petroleum Supply Chain Analysis DRAFT
Cambridge Systematics, Inc. 2-3
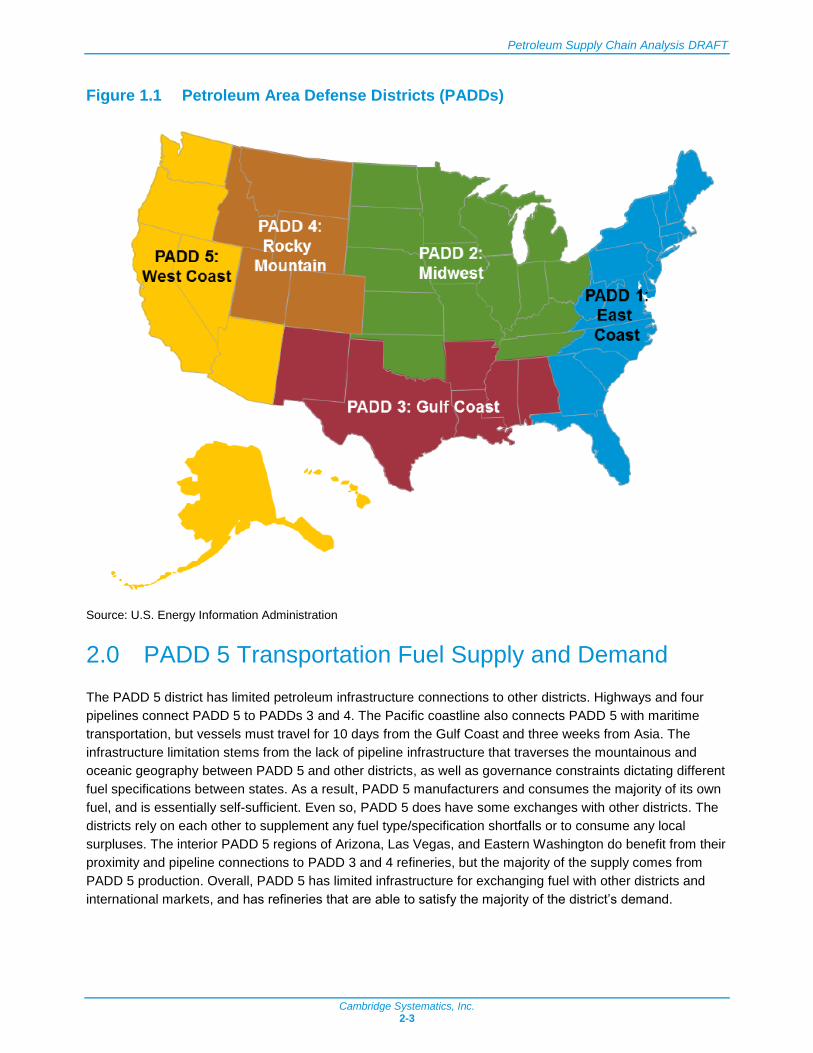
Figure 1.1 Petroleum Area Defense Districts (PADDs)
Source: U.S. Energy Information Administration
2.0 PADD 5 Transportation Fuel Supply and Demand
The PADD 5 district has limited petroleum infrastructure connections to other districts. Highways and four
pipelines connect PADD 5 to PADDs 3 and 4. The Pacific coastline also connects PADD 5 with maritime
transportation, but vessels must travel for 10 days from the Gulf Coast and three weeks from Asia. The
infrastructure limitation stems from the lack of pipeline infrastructure that traverses the mountainous and
oceanic geography between PADD 5 and other districts, as well as governance constraints dictating different
fuel specifications between states. As a result, PADD 5 manufacturers and consumes the majority of its own
fuel, and is essentially self-sufficient. Even so, PADD 5 does have some exchanges with other districts. The
districts rely on each other to supplement any fuel type/specification shortfalls or to consume any local
surpluses. The interior PADD 5 regions of Arizona, Las Vegas, and Eastern Washington do benefit from their
proximity and pipeline connections to PADD 3 and 4 refineries, but the majority of the supply comes from
PADD 5 production. Overall, PADD 5 has limited infrastructure for exchanging fuel with other districts and
international markets, and has refineries that are able to satisfy the majority of the district’s demand.

Petroleum Supply Chain Analysis DRAFT
Cambridge Systematics, Inc. 2-4
Figure 2.1 PADD 5 Refineries and Petroleum Product Distribution
Source: Energy Information Administration’s PADD 5 Transportation Fuels Markets Study, 2015
PADD 5 refineries may produce enough volume for the district, but petroleum products are not fungible and
the production of gasoline, jet fuel, and diesel does not match demand for various fuel specifications. In
2013, PADD 5 refineries supplied 91 percent of gasoline demand, 96 percent of jet fuel demand, and 113
percent of distillate demand. PADD 5 refineries produce more distillate than used by the district, but does not
produce enough gasoline or jet fuel for internal demand. Only a limited number of refineries outside of PADD
5 actually supply refined petroleum products that meet specifications for PADD 5 states. For example,
California Air Resources Board (CARB) gasoline is expensive and difficult to manufacture, and other areas of
PADD 5, such as Arizona, also require special gasoline formulas. Despite fuel specification requirements,
there are exchanges between PADD 5, other PADD districts, and the global market. The vast majority of
gasoline, jet fuel, and diesel are produced locally. Since more distillate is produced than needed, PADD 5
exports some distillate and brings in a small amount of gasoline and jet fuel in order to meet demand and
supply shortfalls. Based on this pattern, it would be expected that imports into Nevada from non-PADD 5
states would mostly be gasoline or jet fuel. This finding is consistent with the ratio of fuel that arrives in
Nevada from PADD 4 discussed in Section 3.2.2.
Nevada only has two operating refineries. One of the refineries, Foreland Refining Corporation Eagle Springs
Refinery in Ely, produces thick asphalt and fuel oils from locally sourced crude. The other refinery, Golden
Gate Petroleum in Storey County east of Reno, is a splitting facility which distills transmix into individual
transportation fuels. Transmix is a mixture of gasoline, diesel, and/or jet fuel that forms when petroleum is
transported in pipelines. Transmix processing plants (also referred to as splitters) use distillation to separate
Petroleum Supply Chain Analysis DRAFT
Cambridge Systematics, Inc. 2-5
the mix into individual transportation fuels, specifically gasoline, diesel, and jet fuel. After distillation, some
additional treatments may be necessary in order to meet fuel specifications. The majority of the
transportation fuels studied in this analysis supplying Nevada are refined in California and Utah, but Golden
Gate Petroleum does account for some additional production as a transmix processing plant. Golden Gate
Petroleum also blends their fuel with additional additives before distributing to their retail centers. Figure 2.1
shows all 24 refineries in PADD 5 and petroleum product flows between Nevada’s major cities (Reno and
Las Vegas) and California and Utah refineries. Golden Gate Petroleum is not listed in this EIA report, and
this may be because though the facility is considered by the EPA to be a refinery, it is not a typical refinery
as it does not process crude oil.
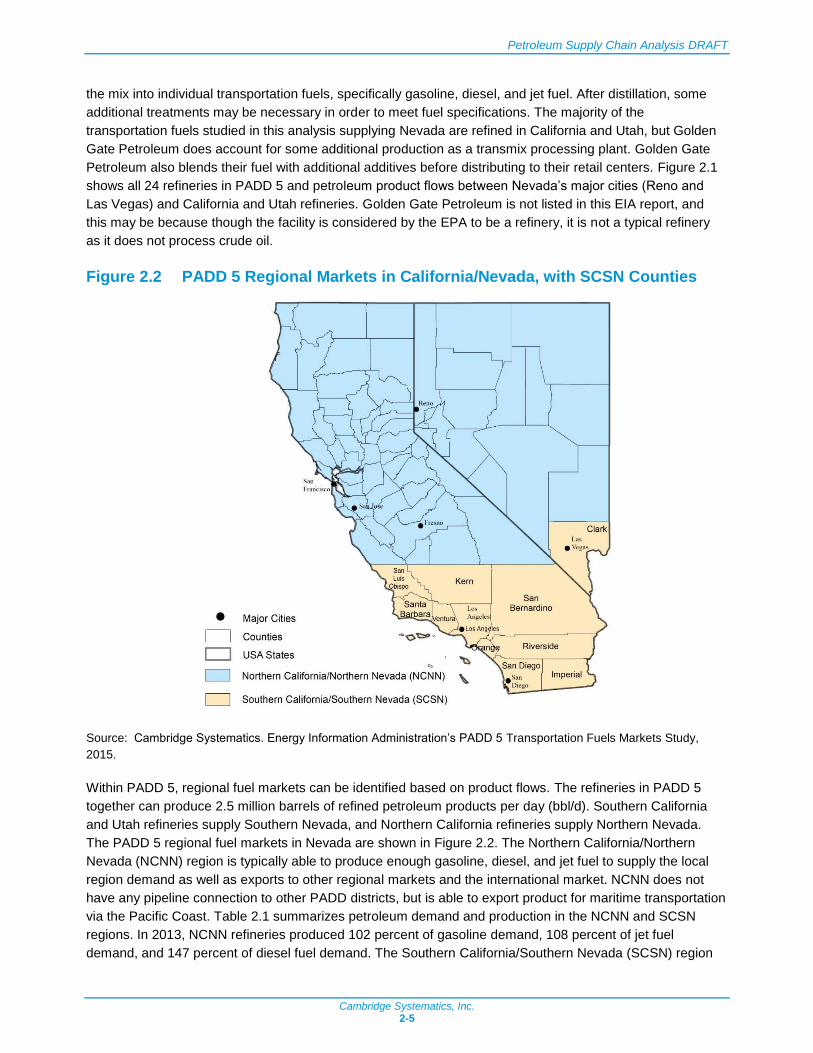
Figure 2.2 PADD 5 Regional Markets in California/Nevada, with SCSN Counties
Source: Cambridge Systematics. Energy Information Administration’s PADD 5 Transportation Fuels Markets Study,
2015.
Within PADD 5, regional fuel markets can be identified based on product flows. The refineries in PADD 5
together can produce 2.5 million barrels of refined petroleum products per day (bbl/d). Southern California
and Utah refineries supply Southern Nevada, and Northern California refineries supply Northern Nevada.
The PADD 5 regional fuel markets in Nevada are shown in Figure 2.2. The Northern California/Northern
Nevada (NCNN) region is typically able to produce enough gasoline, diesel, and jet fuel to supply the local
region demand as well as exports to other regional markets and the international market. NCNN does not
have any pipeline connection to other PADD districts, but is able to export product for maritime transportation
via the Pacific Coast. Table 2.1 summarizes petroleum demand and production in the NCNN and SCSN
regions. In 2013, NCNN refineries produced 102 percent of gasoline demand, 108 percent of jet fuel
demand, and 147 percent of diesel fuel demand. The Southern California/Southern Nevada (SCSN) region

Petroleum Supply Chain Analysis DRAFT
Cambridge Systematics, Inc. 2-6
produces and consumes the most transportation fuels between the regions. In 2013, SCSN produced 87
percent of gasoline demand, 117 percent of distillate demand, and 92 percent of jet fuel demand. The
gasoline and jet fuel production shortfall in SCSN is supplemented by the oversupply in NCNN and the
UNEV pipeline from PADD 3 (Salt Lake City, Utah) and Las Vegas.
Table 2.1 Petroleum Demand and Production, by Region
Region Fuel Type 2013 Refinery Production (b/d)
2013 Demand (b/d) 2013 Refinery Production / Demand (%)
SCSN Gasoline1 526,800 606,600 87%
SCSN Jet Fuel 178,100 194,100 92%
SCSN Distillate 182,500 155,500 117%
NCNN Gasoline 421,000 412,000 102%
NCNN Jet Fuel 96,000 88,200 108%
NCNN Distillate 185,000 125,600 147%
SCSN Subtotal 887,400 956,200 93%
NCNN Subtotal 702,000 625,800 112%
Note: Volumes for gasoline include 10 percent ethanol blending.
Source: Cambridge Systematics. Energy Information Administration’s PADD 5 Transportation Fuels Markets Study,
2015.
Table 2.2 combines the NCNN and SCNN demand and production. When totaled, NCNN and SCSN produce
93 percent of gasoline demand, 99 percent of jet fuel demand, and 129 percent of diesel fuel demand.
Combining all of the fuel types together, NCNN and SCSN actually produce quantities of fuel equivalent to
100 percent of the regions’ demand, but the regions do not actually consume 100 percent of their own fuel.
NCNN also produces enough product to satisfy internal demand as well as contribute to SCSN supply.
Table 2.2 Petroleum Demand and Production for California and Nevada, by Fuel
Type
Fuel Type 2013 Refinery Production (b/d)
2013 Demand (b/d) 2013 Refinery Production / Demand (%)
Gasoline1 Subtotal 947,800 1,018,600 93%
Jet Fuel Subtotal 274,100 282,300 97%
Distillate Subtotal 367,500 281,100 131%
Total 1,589,400 1,582,000 100%
Note: Volumes for gasoline include 10 percent ethanol blending.
Source: Cambridge Systematics. Energy Information Administration’s PADD 5 Transportation Fuels Markets Study,
2015.
Figure 2.3 shows the refined petroleum pipelines that flow into Northern and Southern Nevada. The following
sections will further evaluate the supply, demand, and distribution of fuels separately for Northern and
Southern Nevada.

Petroleum Supply Chain Analysis DRAFT
Cambridge Systematics, Inc. 3-7
Figure 2.3 California and Nevada Refined Petroleum Pipelines
Source: Cambridge Systematics. U.S. Energy Information Administration
3.0 Southern Nevada Supply, Demand, and Storage
SCSN is reliant on the refineries, pipelines, ports, and storage facilities for the effective functioning of the
petroleum supply chain. Refineries receive crude oil and produce specified petroleum products. Pipelines
transfer products between refiners and storage facilities. Ports import and export products by maritime
transport, and storage facilities hold product until it is sold and brought to market. In the SCSN region,
Watson Station, a pipeline hub in Carson, California, is also an important part of infrastructure for the
petroleum supply chain. Watson Station is a non-redundant pipeline hub, and refineries to the West, such as
Chevron, Shell Carson, Tesoro, Phillips, and ExxonMobil must move product through Watson Station to
reach bulk storage and distribution facilities to the east and south in Colton and San Diego. Without Watson
Petroleum Supply Chain Analysis DRAFT
Cambridge Systematics, Inc. 3-8
Station, product would not be able to move by pipeline from 88 percent of the SCSN refineries to the rest of
the region east of Los Angeles. Watson Station, therefore, is particularly important to the pipeline flow of
refined petroleum products from refinery to market. Refinery outages also affect the ability of SCSN to
provide enough fuel for the region. When a refinery is unable to produce, such as the outage at the Torrance
refinery in March 2015, maritime deliveries of supply from other regions, districts, and counties are critical for
meeting the shortfall. Each part of the supply chain: production, transportation, and storage of petroleum is
important for meeting the demand of SCSN. The following sections will examine the refineries, storage, and
distribution of petroleum in Southern Nevada.
3.1 Southern California Southern Nevada (SCSN) Region Profile
The Southern California and Southern Nevada (SCSN) region is the largest demand area in PADD 5. SCSN
includes the southernmost counties of California and the Las Vegas metropolitan area in Southern Nevada.
SCSN has large metropolitan areas and many military air bases and large commercial aviation hubs. In
2013, the SCSN region accounted for 39 percent of total PADD 5 demand, which is the largest share of
gasoline, diesel, and jet fuel demand of the six regional PADD 5 markets. The SCSN region consumes the
most petroleum products in PADD 5.
There are eight operating refineries in the California part of the SCSN region, which supply the region’s
majority of motor gasoline, diesel and jet fuel. All eight refineries are located in the Los Angeles metropolitan
area. Figure 3.1 shows the petroleum product bulk terminals, refineries, and pipelines in the SCSN region.
Table 3.1 lists the refineries with their location, markets served, and operating capacities. The refineries have
combined capacity of 1,019,100 b/cd, but only produced 940,080 b/d in 2013. Overall demand in the SCSN
regional market was 956,200 b/d in 2013. SCSN has the capacity to supply all of the demand in SCSN;
however, in 2013 only operated at 92 percent of capacity, and only produced 98 percent of demand. Since
some of the product does not conform to the specifications required for the area even if it is produced in the
area, some products are exported to other markets. SCSN provides product to Arizona and international
markets by maritime exports, and receives product from Utah, NCNN, and maritime imports. SCSN is mostly
self-sufficient, but does rely on other markets for selling and buying transportation fuels.

Petroleum Supply Chain Analysis DRAFT
Cambridge Systematics, Inc. 3-9
Figure 3.1 Southern California and Southern Nevada Product Flows
Source: Energy Information Administration’s PADD 5 Transportation Fuels Markets Study, 2015.
Table 3.1 Southern California Petroleum Refineries
Company Location
Atmospheric Crude Distillation Unit (ACDU) operating capacity b/cd Markets served
Valero Asphalt Wilmington, California 6,300
Lunday Thagard Southgate, California 8,500 Local
Valero Wilmington, California 85,000 Southern California (S. CA), Las Vegas, Phoenix
Tesoro Wilmington, California 104,500 S. CA, Las Vegas
Phillips 66 Wilmington, California 139,000 S. CA, Las Vegas
ExxonMobil Torrance, California 149,500 S. CA
Tesoro Carson, California 257,300 S. CA, Las Vegas
Chevron El Segundo, California
269,000 S. CA, Las Vegas, Phoenix
Total 1,019,100
Source: Energy Information Administration’s PADD 5 Transportation Fuels Markets Study, 2015.

Petroleum Supply Chain Analysis DRAFT
Cambridge Systematics, Inc. 3-10
3.2 Pipelines and Storage Facilities in Southern Nevada
Two pipelines bring petroleum products into Southern Nevada from California and Utah: Kinder Morgan’s
Calnev and Holly Energy’s UNEV. The following section will examine the pipeline and storage terminal
capacities in Southern Nevada.
3.2.1 Calnev Pipeline and Las Vegas Terminal: Kinder Morgan
The Calnev pipeline transports gasoline, jet fuel, and diesel fuel from Colton Terminal in Southern California
to Kinder Morgan’s Las Vegas Terminal (Las Vegas Terminal – KM) adjacent to Nellis Air Force Base in
Southern Nevada. Colton Terminal is a 108 acre fuel storage complex on the Rialto-Colton border. Las
Vegas Terminal – KM is operated by Kinder Morgan on 66 acres, where 41 refined petroleum tanks have a
combined storage capacity of 1.8 million barrels.3 Figure 3.2 is an aerial photo of Las Vegas Terminal – KM
and its tanks that store gasoline, diesel, and jet fuel before it is transported to market. Gasoline and ethanol
are blended before being transported by truck to Nevada retail gas stations. Diesel fuel is transported by
truck to retail gas stations and to fuel mine operations. Jet fuel is stored adjacent to the air force base. Las
Vegas Terminal – KM stores the vast majority of Southern Nevada’s petroleum supply before it is released to
the market.
The gasoline stored at Las Vegas Terminal – KM are blended with ethanol at the “rack” or loading facility
before distribution to retail facilities in Southern Nevada. Ethanol is transported to the terminal via Union
Pacific Railroad. Union Pacific transports approximately 2,000 railcars of ethanol per year to Las Vegas
Terminal – KM. Reports from Kinder Morgan indicate that construction growth in Las Vegas is having an
impact on rail capacity in the city. Asphalt cars have been displacing ethanol cars, resulting in 50-60 tank
cars lined up at the terminal with no place to store or turn around since there are no sidings. The result is
tank cars stored on the main line north of the terminal before unloading at the terminal can occur. Ethanol
delivery to Las Vegas Terminal – KM is important for blending the gasoline with ethanol to make finished
gasoline. Union Pacific is the primary deliverer of ethanol to Las Vegas Terminal – KM, a necessary part of
the process for making finished gasoline.
The monthly supply of petroleum to Las Vegas Terminal – KM is roughly double the storage capacity. Figure
2.3 shows the Kinder Morgan Calnev pipeline and other Kinder Morgan facilities in Southern Nevada,
Southern California, and Arizona. The Calnev pipeline is 566 miles long, operated by Kinder Morgan, and
consists of 14 inch and 8 inch parallel pipes. The supply consists of gasoline, diesel, and jet fuel. The refined
petroleum capacity from Colton to Las Vegas is currently 157,000 b/d.4 The actual refined petroleum
throughput from Colton to Las Vegas is currently 5,000 barrels per hour, which translates to 120,000 b/d or
3.6 million barrels per month.5 Of the 3.6 million monthly barrels, approximately 1.1 million represent jet fuel
supplied to the neighboring Nellis Air Force Base, 1 million barrels are gasoline, 0.5 million are diesel fuel,
and the remaining 1 million barrels are dedicated to other terminals. Table 3.2 summarizes the Calnev
pipeline batches transported from California refineries. The Calnev pipeline is responsible for delivering a
3 Kinder Morgan. United States Securities and Exchange Commission: Form 10-K for the fiscal year ended December 31, 2016. https://ir.kindermorgan.com/sites/kindermorgan.investorhq.businesswire.com/files/report/additional/KMI-2016-10K_Final_with_Exhibits.pdf)
4 Bannigan, Tom. “Products Pipelines.” Kinder Morgan Presentation. https://ir.kindermorgan.com/sites/kindermorgan.investorhq.businesswire.com/files/event/additional/2008_Analysts_Conf_05_Products_Pipelines.pdf
5 Interview with Kinder Morgan Terminal Manager August 7, 2018.

Petroleum Supply Chain Analysis DRAFT
Cambridge Systematics, Inc. 3-11
vast majority of Southern Nevada’s petroleum supply, and Las Vegas Terminal – KM is where it is stored
until it is distributed to the market.
Figure 3.2 Kinder Morgan Terminal near Nellis Air Force Base
Source: Imagery ©2018 Google
Table 3.2 Refined Petroleum Supply to Las Vegas, Kinder Morgan
Refined Product Approximate Barrels per Month
Gasoline 1,000,000
Diesel Fuel 500,000
Jet Fuel 1,100,000
Distribution to other Terminals6 1,000,000
Total 3,600,000
Note: Other terminals include Pacific Tank Lines, Haycock Petroleum Company (Sinclair) and Pro Petroleum
Source: Kinder Morgan
6 Other terminals include Pacific Tank Lines, Haycock Petroleum Company (Sinclair) and Pro Petroleum

Petroleum Supply Chain Analysis DRAFT
Cambridge Systematics, Inc. 3-12
3.2.2 UNEV Pipeline and Las Vegas Terminal: Holly Energy
The UNEV pipeline is another pipeline that transports petroleum products into Las Vegas. The UNEV
pipeline transports gasoline and diesel fuel from Woods Cross, Utah near Salt Lake City to Holly Energy’s
Las Vegas Terminal (Las Vegas Terminal – HE) at Apex Industrial Park in Southern Nevada, roughly 20
miles northeast of the Las Vegas Terminal – KM discussed in Section 3.2.1. Las Vegas Terminal – HE is
operated by Holly Energy on 53 acres, where 12 refined petroleum tanks have a combined storage capacity
of 330,000 barrels.7 Figure 3.3 is an aerial photo of Las Vegas Terminal – HE and its tanks which store
gasoline and diesel before it is transported to market. Gasoline and ethanol are blended before being
transported by truck to Nevada retail gas stations. Diesel fuel is transported by truck to retail gas stations and
to mines fuel operations. Pro Petroleum also operates from this facility, and 10 to 20 trucks per day transport
refined petroleum to the mines in Northern Nevada. Las Vegas Terminal – HE stores a minority of Southern
Nevada’s petroleum supply before it is released to the market.
Figure 3.3 Holly Energy Terminal, Apex Industrial Park
Source: Imagery ©2018 Google
The gasoline stored at Las Vegas Terminal – HE is blended with ethanol at the “rack” or loading facility
before distribution to retail facilities in Southern Nevada. Ethanol is transported to Apex Industrial Park by
7 378,000 barrel storage capacity is listed in 2017 Annual Report, but 2018 interview of UNEV listed 330,000 barrel storage capacity for petroleum products. http://www.annualreports.com/HostedData/AnnualReports/PDF/NYSE_HEP_2017.pdf

Petroleum Supply Chain Analysis DRAFT
Cambridge Systematics, Inc. 3-13
rail, and stored in tanks on site. Ethanol is then blended with gasoline to be transported to retail petroleum
facilities throughout Nevada.8 Railroad is the primary delivery method for ethanol to Las Vegas
Terminal – HE, a necessary part of the process for making finished gasoline.
The monthly supply of petroleum to Las Vegas Terminal – HE is roughly double the storage capacity. Figure
2.3 shows the Holly Energy UNEV pipeline in Southern Nevada and Utah. A schematic of the UNEV pipeline
is also shown in Figure 3.4 below. The UNEV pipeline is 427 miles long and operated by Holly Energy. The
monthly supply of petroleum to Las Vegas Terminal – HE is 70 percent gasoline and 30 percent diesel fuel.9
The refined petroleum capacity from Woods Cross to Las Vegas is currently 62,000 b/d with the availability
to expand up to 118,000 b/d with limited capital investment.10 The UNEV pipeline is responsible for delivering
a minority of Southern Nevada’s petroleum supply to storage at Las Vegas Terminal – HE for distribution to
the market.
Figure 3.4 Holly Energy’s UNEV Pipeline Map
Source: Holly Energy.
8 Interview with Holly Energy Apex Terminal Manager August 2, 2018.
9 Interview with Holly Energy Apex Terminal Manager July 2018.
10 http://www.annualreports.com/HostedData/AnnualReports/PDF/NYSE_HEP_2017.pdf

Petroleum Supply Chain Analysis DRAFT
Cambridge Systematics, Inc. 4-14
4.0 Northern Nevada Supply, Demand, and Storage
4.1 Northern California Northern Nevada (NCNN) Region Profile
The Northern California and Northern Nevada region (NCNN) is the most self-sufficient regional market in
PADD 5. NCNN includes and all of Nevada except for Clark county and the counties of California north of
San Luis Obispo, Kern, and San Bernardino counties. In 2013, the NCNN region accounted for 37 percent of
total PADD 5 demand, which is the second largest of the six regional PADD 5 markets. The NCNN region is
the least reliant on other regional markets and the second-largest regional market in PADD 5.
Figure 4.1 Northern California and Nevada Refineries and Petroleum Flows
Source: Energy Information Administration’s PADD 5 Transportation Fuels Markets Study, 2015.
There are 10 operating refineries in the NCNN region which supply most of the motor gasoline, diesel and jet
fuel for the region. Five refineries are located in the San Francisco Bay area which is the largest
concentration of refining capacity in the region, three refineries are located north of Los Angeles near
Bakersfield and Santa Maria, Golden Gate Petroleum (GGP) in Storey County east of Reno distills transmix
and blends fuel with additives for the retail market, and Eagle Foreland Refinery in Ely, Nevada produces
only asphalt and fuel oil which is mined locally. Figure 4.1 shows the petroleum product bulk terminals,
refineries, and pipelines in the NCNN region. Golden Gate Petroleum is located between Reno and Fallon
N.A.S. Table 4.1 lists the refineries with their location, markets served, and operating capacities. The
refineries have combined capacity of 887,371 b/cd. In 2013, the refineries produced 744,100 b/d in 2013
(excludes Golden Gate Petroleum). Overall demand in the NCNN regional market was 625,800 b/d in 2013.
NCNN has more capacity and production than the demand in NCNN, and in 2013 operated at only 84

Petroleum Supply Chain Analysis DRAFT
Cambridge Systematics, Inc. 4-15
percent of capacity but produced 119 percent of demand. NCNN provides product to other parts of PADD 5,
such as SCNN, and international markets by maritime exports. NCNN is self-sufficient, and provides fuel to
other markets.
NCNN is reliant on the refineries, pipelines, ports, and storage facilities for the effective functioning of the
petroleum supply chain. Refineries receive crude oil and produce specified petroleum products. Pipelines
transfer products between refiners and storage facilities. Ports import and export products by maritime
transport, and storage facilities hold product until it is sold and brought to market. In the NCNN region,
product is shipped by pipeline from NCNN refineries in San Francisco Bay, Santa Maria, and Bakersfield to
storage and distribution terminals near San Francisco, Fresno, Chico, and Reno. The Concord pipeline
junction is an important gateway pipeline transmissions in NCNN as it is the gathering and entry point for the
main trunk of the Kinder Morgan pipeline system. NCNN region is not connected by pipeline to any other
region or PADD, and supply from NCNN region to other markets is moved by marine vessel through ports in
the San Francisco Bay. Supply chain disruptions can be caused by power outages, earthquakes, and heavy
fog in the Bay. Each part of the supply chain: production, transportation, and storage of petroleum is
important for meeting the demand of NCNN. The following section will examine the storage and distribution
of petroleum in Northern Nevada.
Table 4.1 Northern California and Northern Nevada Refineries
Company Location ACDU1 operating capacity b/cd
Markets Served
Chevron Richmond, California 245,271
Tesoro Martinez, California 166,000
Shell Martinez, California 156,400 Northern California (N. CA), Reno, Oregon
Valero Benicia, California 145,000 N. CA, Reno
Phillips 662 Rodeo, California 120,200 N.CA, Los Angeles, Reno, Nevada, exports
Kern Oil & Refining Bakersfield, California 26,000 N.CA, Reno, Nevada, exports
San Joaquin Refining Bakersfield, California 15,000 S. CA, Las Vegas
Santa Maria Refinery Santa Maria, California
9,500 Central California
Foreland Refining Ely, Nevada 2,000 Central California
Golden Gate Petroleum
Clark, Nevada 2,0003 N. CA, Reno
Total 887,371
Note: 1 Atmospheric Crude Distillation Unit
2 A portion of this facility is actually located in San Luis Obispo County but is operated as part of the Rodeo
refinery.
3 This operating capacity came from interview with company, and is an approximation.
Source: Energy Information Administration’s PADD 5 Transportation Fuels Markets Study, 2015. Interview with Golden
Gate Petroleum December 2018.

Petroleum Supply Chain Analysis DRAFT
Cambridge Systematics, Inc. 4-16
Table 4.2 Northern California Northern Nevada Petroleum Summary
Fuel Type 2013 Demand (b/d) Refinery Capacity
(b/cd) 2013 Refinery
Production (b/d) Refinery Production
/ Demand (%)
Gasoline1 412,000 - 463,100 112%
Jet Fuel 88,200 - 96,000 108%
Distillate 125,600 - 185,000 147%
Total 625,800 885,371 744,100 119%
Note: Volumes for gasoline include 10 percent ethanol blending.
Source: Energy Information Administration’s PADD 5 Transportation Fuels Markets Study, 2015.
4.2 Pipelines and Storage Facilities in Northern Nevada
Reno is critical to the distribution of product to Northern Nevada. At the Northeast border of Nevada and near
the California border, Reno is removed from the refinery production in Northern California but is at the end of
one pipeline that brings petroleum products from the San Francisco Bay Area into Northern Nevada. The
following section will examine the pipeline and storage terminal capacities in Northern Nevada.
4.2.1 SFPP North Line and Sparks Terminal
Kinder Morgan’s Santa Fe Pacific Pipeline (SFPP) North Line transports gasoline, jet fuel, and diesel fuel
from Concord Station in Northern California to the Sparks Terminal in Northern Nevada. Concord station is a
25 acre fuel storage complex located just outside of San Francisco where there are 23 refined petroleum
tanks with a total capacity of 1.2 million barrels. A 20-inch pipeline extends from Concord to Sacramento,
then connects to Rocklin Station. From Rocklin, product is transported to the Sparks Terminal in Sparks, NV,
a distance of 138 miles, where it is stored in 44 tanks. The pipeline between Rocklin and Reno varies
between six, eight and ten inches in diameter, depending on geography. Figure 2.3 shows the Kinder
Morgan SFPP North Line and other Kinder Morgan facilities in Northern Nevada and Northern California. The
Sparks Terminal is operated by Kinder Morgan on 44 acres, where 45 refined petroleum tanks have a
combined storage capacity of 748,377 barrels. Figure 4.2 is an aerial photo of the Sparks Terminal and its
tank that store gasoline, diesel, and jet fuel before being transported to market. Gasoline and ethanol are
blended before being transported by truck to Nevada retail gas stations. Diesel fuel is transported by truck to
retail gas stations and to fuel mine operations. The Sparks Terminal stores the vast majority of Northern
Nevada’s petroleum supply before it is released to market.

Petroleum Supply Chain Analysis DRAFT
Cambridge Systematics, Inc. 4-17
Figure 4.2 Sparks Terminal
Source: Imagery ©2018 Google
The gasoline stored at the Sparks Terminal are blended with ethanol at the “rack” or loading facility before
distribution to retail facilities in Northern Nevada. The Sparks Terminal is sandwiched between I-80 and the
Union Pacific Railroad, and ethanol is transported to the terminal via Union Pacific Railroad. There are six
truck loading racks, and ethanol is sequentially blended with gasoline for transport to retail gasoline stations
throughout Northern Nevada. In several terminals, red dye is injected into diesel tanks dedicated to
agricultural or military operations which are not taxed.
Many truck trips from the Sparks Terminal extend into Northern California to serve petroleum retail stations11
since the closest alternative petroleum distribution facility is in Rocklin, California which is more than 100
miles away from the border, whereas the Sparks Terminal is less than 20 road miles from the border. Triple
trailers are allowed in Nevada and commonly used for deliveries within the state. They consist of one 53 foot
cargo tank trailer and two 28 foot “pups” for a total capacity of 20,000 gallons. However, triple trailers are not
allowed in California and therefore not used for deliveries into California.
The monthly supply of petroleum to the Sparks Terminal is roughly double the storage capacity. The actual
refined petroleum throughput from Rocklin to Reno is currently 48,000 b/d.12 The supply consists of roughly
40 percent gasoline, 40 percent diesel, and 20 percent jet fuel. Of the 1.44 million monthly barrels,
approximately 0.576 million barrels are gasoline, 0.576 million are diesel fuel, and the remaining 0.288
million barrels are jet fuel. Also, 6,000 b/d (250 barrels per hour) represent diesel supplied by a six-inch
pipeline to the neighboring Fallon Naval Air Station located 70 miles east. The SFPP North Line is
11 Interview with Kinder Morgan Terminal Manager August 20, 2018.
12 Interview with Gary Kulaszewski (1,800-2,000 barrels/hour)

Petroleum Supply Chain Analysis DRAFT
Cambridge Systematics, Inc. 5-18
responsible for delivering a vast majority of Northern Nevada’s petroleum supply, and the Sparks Terminal is
where it is stored until it is distributed to the market.
4.2.2 Golden Gate Petroleum Refinery
Roughly 20 miles east of the Sparks Terminal is the Golden Gate Petroleum (GGP) splitter facility. GGP
receives about 2,000 barrels of transmix per day, 50 percent arriving by rail and 50 percent by truck. The
transmix is sourced by truck from pipeline terminals in California and Reno, and by rail from pipeline
terminals in Phoenix and Denver. Another 2,000 barrels of diesel and gasoline leave the facility per day by
truck. Golden Gate Petroleum has about 75,000 barrels of storage capacity for transmix, feedstock, gasoline,
and diesel. GGP also uses some of the transmix as feedstock for their operations. For gasoline blending,
GGP also brings in renewable diesel from California. GGP does not supply enough gasoline to supply all of
their retail facilities and also buys finished gasoline. Other fuel additives are also used for fuel blending.
Product leaving GGP is mostly going to GGP retail facilities, but a surplus of diesel is also sold on the open
market.
5.0 Nevada Petroleum Distribution Profile
Petroleum products arriving in Nevada are likely to arrive by one of the three pipelines that supply the area
from Northern California, Southern California, or Utah. These pipelines, Calnev, UNEV, and SFPP supply the
vast majority of Nevada’s petroleum usage. Each pipeline feeds a storage terminal, and together, these
pipelines provide over 230,000 barrels per day of petroleum to Nevada, with 2,878,377 barrels of storage.
The pipeline capacity and storage terminal capacity facilities in Nevada are summarized in Table 5.1. The
facilities in Nevada are able to store roughly a 13 day supply of fuel.
Table 5.1 Nevada Petroleum Pipeline and Storage Summary
Pipeline Company Origin Nevada Storage Terminal
Northern or Southern Nevada
Pipeline Throughput
(b/d)
Storage Terminal Capacity (barrels)
Storage Turnover at
100% Throughput
(days)
Calnev Kinder Morgan Colton, CA Las Vegas Southern 120,000 1,800,000 15
UNEV Holly Energy Woods Cross, UT
Las Vegas Southern 62,000 330,000 5
SFPP Kinder Morgan Concord, CA Reno Northern 48,000 748,377 16
Southern Nevada Subtotal 182,000 2,130,000 12
Northern Nevada Subtotal 48,000 748,377 16
Total 230,000 2,878,377 13
Source: Cambridge Systematics. Interviews with Kinder Morgan and Holly Energy.
The distribution process brings petroleum product from storage facilities to retail petroleum facilities. The
Nevada Statewide Hazmat Database was used to identify refined petroleum facilities by type and thereby
estimate refined petroleum distribution across the state. Assuming a 250 mile radius around Las Vegas for
petroleum distribution, the Study Team used a shortest path algorithm to determine likely routing, assuming
truck drivers will primarily stay on interstate and U.S. highways as much as possible. Figure 5.1 below
Petroleum Supply Chain Analysis DRAFT
Cambridge Systematics, Inc. 5-19
illustrates the likely distribution area for diesel by truck in Nevada. Figure 5.2 below illustrates the likely
distribution area for gasoline by truck in Northern Nevada.
The petroleum distribution maps demonstrate that the volume of diesel on the roadways is greatest in
northern Nevada, while southern Nevada is dominated by gasoline. These results are consistent the large
urban population around Las Vegas and the increased prevalence of industrial facilities and mining
operations in northern Nevada.

Petroleum Supply Chain Analysis DRAFT
Cambridge Systematics, Inc. 5-20
Figure 5.1 Nevada Petroleum Distribution, Diesel
Source: Cambridge Systematics. Statewide Hazmat Database.

Petroleum Supply Chain Analysis DRAFT
Cambridge Systematics, Inc. 5-21
Figure 5.2 Nevada Petroleum Distribution, Gasoline
Source: Cambridge Systematics. Statewide Hazmat Database.