Petroleum Supply Chain Management
45
A.T. Kearney 82/7478 Petroleum Supply Chain Management Dr. Dale S. Rogers Center for Logistics Management University of Nevada Petroleo Missao Tecnica Houston, Texas June 9, 2008
-
Upload
brianna-kirby -
Category
Documents
-
view
40 -
download
2
description
Petroleum Supply Chain Management. Dr. Dale S. Rogers Center for Logistics Management University of Nevada Petroleo Missao Tecnica Houston, Texas June 9, 2008. 2008 University of Nevada-COPPEAD courses. University of Nevada Center for Logistics Management Research Websites. - PowerPoint PPT Presentation
Transcript of Petroleum Supply Chain Management

A.T. Kearney 82/7478 1
Petroleum Supply Chain ManagementPetroleum Supply Chain Management
Dr. Dale S. RogersCenter for Logistics Management
University of Nevada
Petroleo Missao TecnicaHouston, Texas
June 9, 2008
Dr. Dale S. RogersCenter for Logistics Management
University of Nevada
Petroleo Missao TecnicaHouston, Texas
June 9, 2008

2
2008 University of Nevada-COPPEAD courses2008 University of Nevada-COPPEAD courses
Course Date Location
Petroleum Logistics Executive Course
9 a 13 de Junho de 2008
Houston, TX
Logistics and Supply Chain Management Executive Course
18 a 22 de Agusto de 2008
Reno, NV & Silicon Valley, CA
Advanced Supply Chain Management
29 Septembre a 3 de Outubro de 2008
Northern & Southern California

3
University of Nevada Center for Logistics Management Research Websites
University of Nevada Center for Logistics Management Research Websites http://www.rlec.org
http://value.coba.unr.edu
http://www.sustainable-supplychain.com
http://www.rlec.org
http://value.coba.unr.edu
http://www.sustainable-supplychain.com

4
Structure Drives BehaviorStructure Drives Behavior
Structure determines behavior
Behavior does not determine structure
Structure determines behavior
Behavior does not determine structure

5
“End of the Beginning”“End of the Beginning”
“We are much closer to the end of the beginning than the beginning of the end.”
Source: Thomas Friedman, (2006) The World is Flat
“We are much closer to the end of the beginning than the beginning of the end.”
Source: Thomas Friedman, (2006) The World is Flat
6
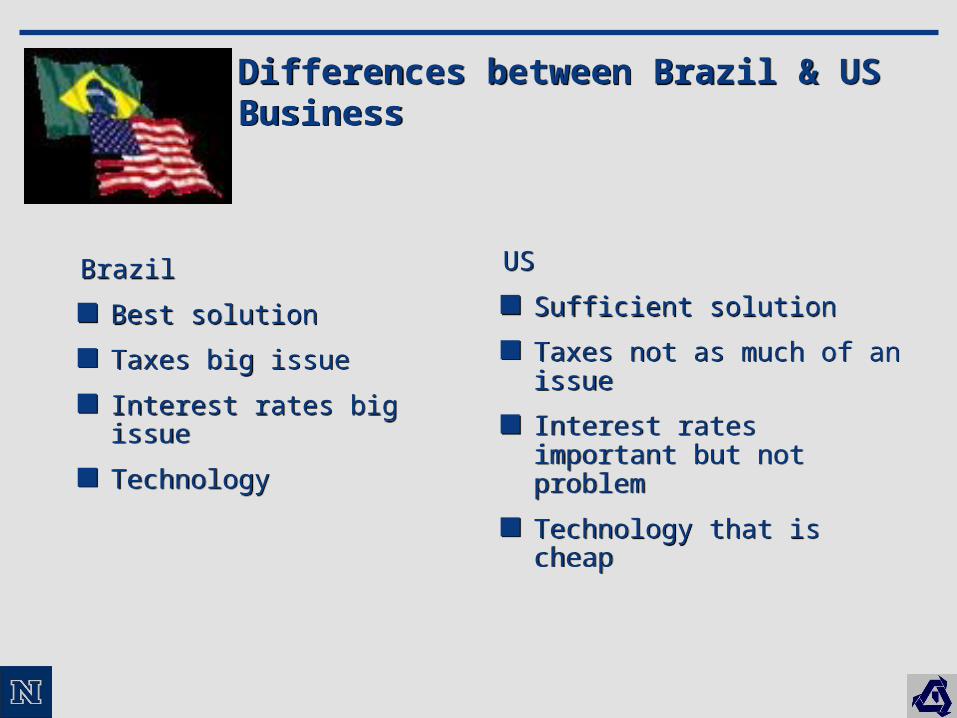
Differences between Brazil & US BusinessDifferences between Brazil & US Business
Brazil
Best solution
Taxes big issue
Interest rates big issue
Technology
Brazil
Best solution
Taxes big issue
Interest rates big issue
Technology
US
Sufficient solution
Taxes not as much of an issue
Interest rates important but not problem
Technology that is cheap
US
Sufficient solution
Taxes not as much of an issue
Interest rates important but not problem
Technology that is cheap

7
NASCAR vs. F1NASCAR vs. F1
8
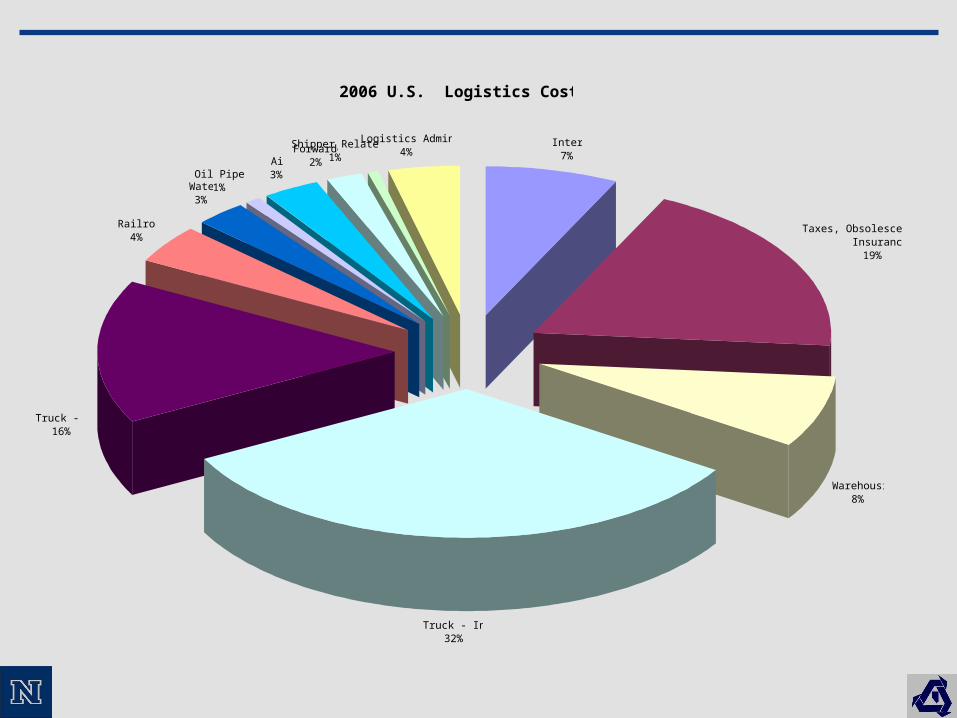
2006 U.S. Logistics Costs
Interest7%
Taxes, Obsolescence, Depreciation, Insurance
19%
Warehousing8%
Truck - Intercity32%
Truck - Local16%
Railroads4%
Water3%
Oil Pipelines1%
Air3%
Forwarders2%
Shipper Related Costs1%
Logistics Administration4%
9
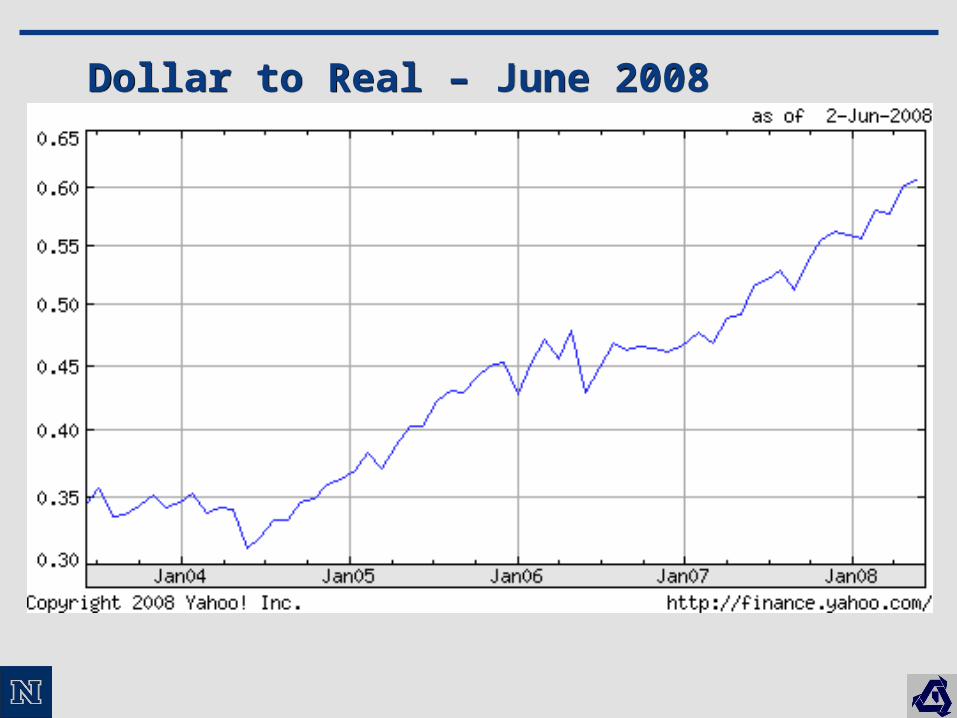
Dollar to Real – June 2008Dollar to Real – June 2008
10
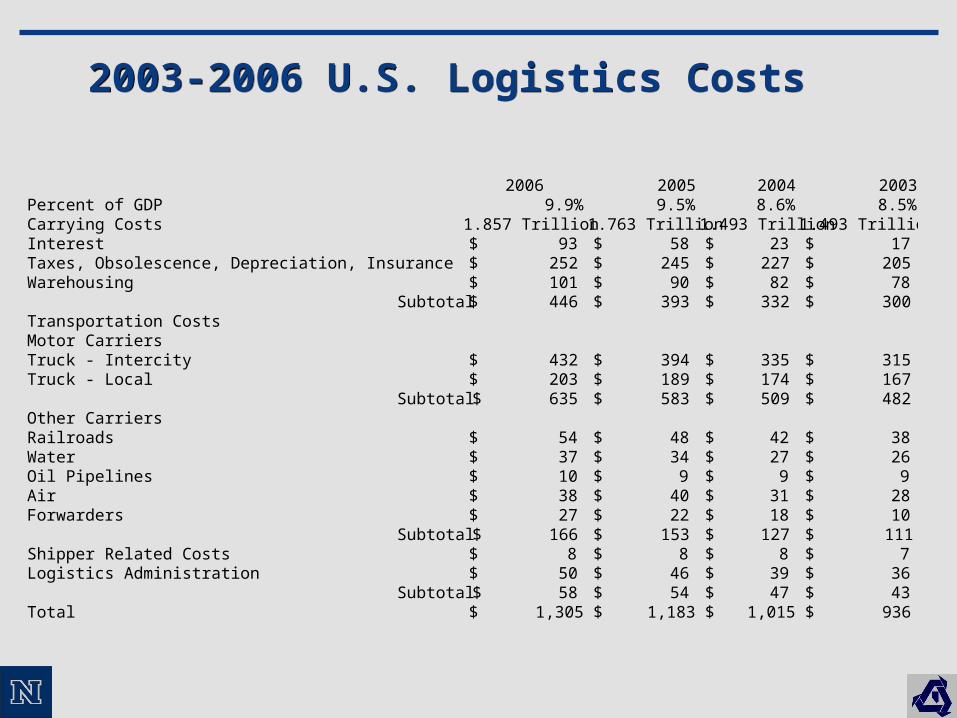
2003-2006 U.S. Logistics Costs2003-2006 U.S. Logistics Costs
2006 2005 2004 2003Percent of GDP 9.9% 9.5% 8.6% 8.5%Carrying Costs 1.857 Trillion 1.763 Trillion 1.493 Trillion 1.493 TrillionInterest 93$ 58$ 23$ 17$ Taxes, Obsolescence, Depreciation, Insurance 252$ 245$ 227$ 205$ Warehousing 101$ 90$ 82$ 78$
Subtotal 446$ 393$ 332$ 300$ Transportation CostsMotor CarriersTruck - Intercity 432$ 394$ 335$ 315$ Truck - Local 203$ 189$ 174$ 167$
Subtotal 635$ 583$ 509$ 482$ Other CarriersRailroads 54$ 48$ 42$ 38$ Water 37$ 34$ 27$ 26$ Oil Pipelines 10$ 9$ 9$ 9$ Air 38$ 40$ 31$ 28$ Forwarders 27$ 22$ 18$ 10$
Subtotal 166$ 153$ 127$ 111$ Shipper Related Costs 8$ 8$ 8$ 7$ Logistics Administration 50$ 46$ 39$ 36$
Subtotal 58$ 54$ 47$ 43$ Total 1,305$ 1,183$ 1,015$ 936$

11Source: http://www.eia.doe.gov/pub/oil_gas/natural_gas/analysis_publications/deliverability/pdf/chapter3.pdf

12Source: http://www.aopl.org/pubs/2004/Final%20Rabinow%20print%2040804.pdf

13http://www.aopl.org/pubs/misc/aopl_brochure.pdf

14
Where does it come from? Where does it go?Where does it come from? Where does it go?

15
U.S. Oil Basic StatisticsU.S. Oil Basic Statistics

16
17

18

19

20

21

22
23

24

25

26
U.S. Crude Oil ImportsU.S. Crude Oil Imports

27
Oil ReservesOil Reserves
28
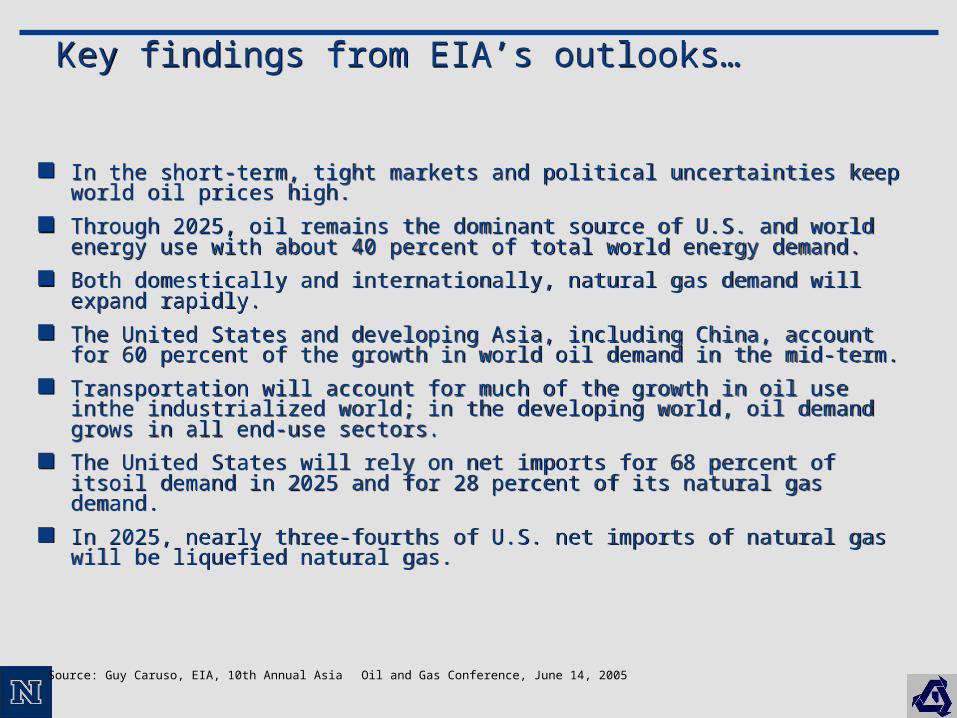
Key findings from EIA’s outlooks…Key findings from EIA’s outlooks…
In the short-term, tight markets and political uncertainties keep world oil prices high.
Through 2025, oil remains the dominant source of U.S. and world energy use with about 40 percent of total world energy demand.
Both domestically and internationally, natural gas demand will expand rapidly. The United States and developing Asia, including China, account for 60 percent
of the growth in world oil demand in the mid-term. Transportation will account for much of the growth in oil use inthe industrialized
world; in the developing world, oil demand grows in all end-use sectors. The United States will rely on net imports for 68 percent of itsoil demand in
2025 and for 28 percent of its natural gas demand. In 2025, nearly three-fourths of U.S. net imports of natural gas will be liquefied
natural gas.
Source: Guy Caruso, EIA, 10th Annual Asia Oil and Gas Conference, June 14, 2005
29
Source: Guy Caruso, EIA, 10th Annual Asia Oil and Gas Conference, June 14, 2005

30
Key findings from EIA’s outlooks…Key findings from EIA’s outlooks…
In the short-term, tight markets and political uncertainties keep world oil prices high.
Through 2025, oil remains the dominant source of U.S. and world energy use with about 40 percent of total world energy demand.
Both domestically and internationally, natural gas demand will expand rapidly.
The United States and developing Asia, including China, account for 60 percent of the growth in world oil demand in the mid-term.
Transportation will account for much of the growth in oil use in the industrialized world; in the developing world, oil demand grows in all end-use sectors.
The United States will rely on net imports for 68 percent of it soil demand in 2025 and for 28 percent of its natural gas demand.
In 2025, nearly three-fourths of U.S. net imports of natural gas will be liquefied natural gas.
Source: Guy Caruso, EIA, 10th Annual Asia Oil and Gas Conference, June 14, 2005

31
Source: Guy Caruso, EIA, 10th Annual Asia Oil and Gas Conference, June 14, 2005

32
Criteria for Measuring Viability of Fuel TypesCriteria for Measuring Viability of Fuel Types
Source: Rogers, Kelly, Rogers and Carter, (2007), Alternative Fuels: Are They Achievable, ILJRA

33
Fuel Type ViabilityFuel Type Viability
Source: Rogers, Kelly, Rogers and Carter, (2007), Alternative Fuels: Are They Achievable, ILJRA
34
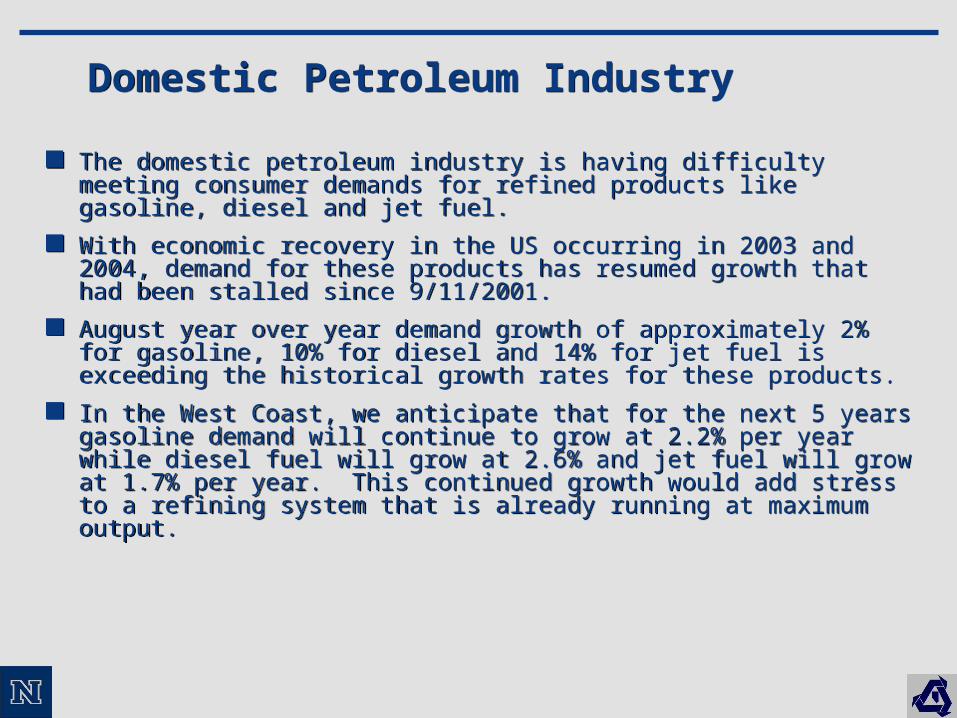
Domestic Petroleum IndustryDomestic Petroleum Industry
The domestic petroleum industry is having difficulty meeting consumer demands for refined products like gasoline, diesel and jet fuel.
With economic recovery in the US occurring in 2003 and 2004, demand for these products has resumed growth that had been stalled since 9/11/2001.
August year over year demand growth of approximately 2% for gasoline, 10% for diesel and 14% for jet fuel is exceeding the historical growth rates for these products.
In the West Coast, we anticipate that for the next 5 years gasoline demand will continue to grow at 2.2% per year while diesel fuel will grow at 2.6% and jet fuel will grow at 1.7% per year. This continued growth would add stress to a refining system that is already running at maximum output.

35
Domestic vs. Foreign RefiningDomestic vs. Foreign Refining
While cleaner burning fuels are supported by the refining industry, the upgrades required to produce them are consuming resources that a refining company may have used to expand capacity.
There will not be significant enough refinery expansions to alleviate growth in demand due to the fact that refiners will continue to focus resources on upgrading their plants to produce cleaner burning fuels.
Refiners in the US West Coast market will have to rely more on foreign imports of refined products like gasoline, diesel and jet fuel in order to meet future demand for these products.
Based upon supply and demand growth projections we assume that by 2008 the West Coast petroleum industry will have to more than triple its current levels of refined product imports from approximately 160,000 barrels per day (“bpd”) to approximately 480,000 bpd in 2008 in order to meet consumer demands in PADD V.
Imports primarily come on tanker ships through the three major West Coast storage and distribution hubs of Los Angeles, San Francisco and Portland.

36
Availability of Domestic (California) CrudeAvailability of Domestic (California) Crude
The availability of domestic crude oil in the state of California (primarily produced in the San Joaquin Valley) has been declining for several years and will continue to decline in future years at a rate of around 3% - 4% per year.
California crude oil has been a major feedstock to California refineries for many years. With domestic crude oil supplies continuing to decline, refiners in California will have to import more foreign crude oil through the same waterborne ports.
It is estimated that by 2008 refineries in California will need to import almost 1.2 MM bpd of crude oil versus the current level of .85 - .95 MM bpd.
37
Logistics Infrastructure Logistics Infrastructure
The logistics infrastructure supporting petroleum imports is already near capacity and permitting and funding these types of facilities (wharf’s, terminals, pipelines, etc.) can take several years at minimum.
Also, future import growth does not necessarily match up to where spare capacity exists in the system.
The future need to import more refined products and crude oil into the US West Coast is causing the petroleum industry and politicians to scramble to find supply-chain solutions that will alleviate the upcoming bottlenecks of the current infrastructure.
38
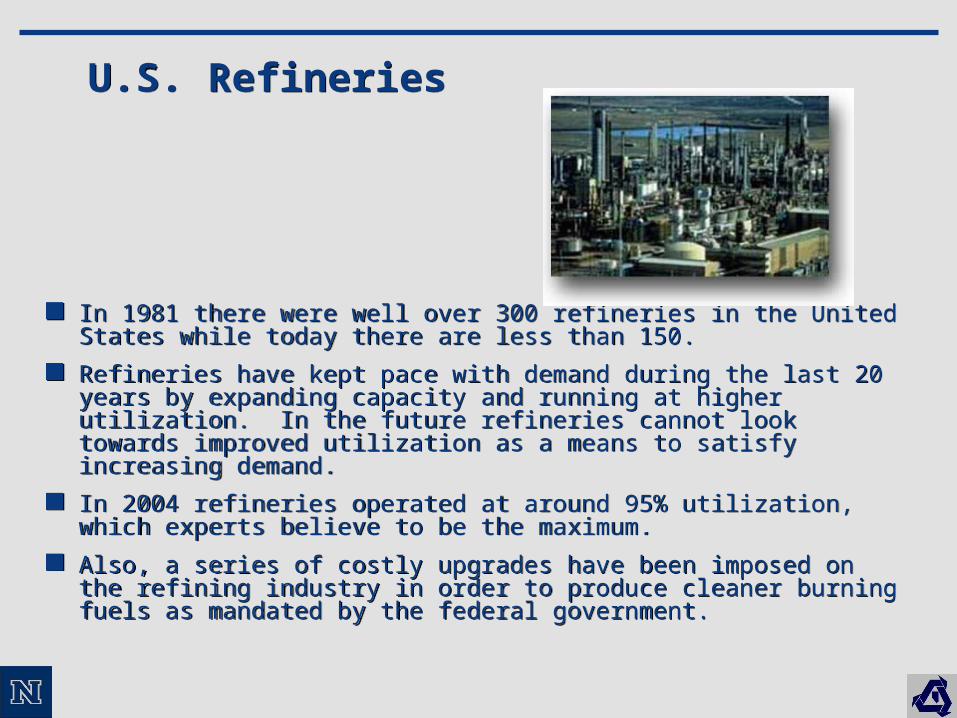
U.S. RefineriesU.S. Refineries
In 1981 there were well over 300 refineries in the United States while today there are less than 150.
Refineries have kept pace with demand during the last 20 years by expanding capacity and running at higher utilization. In the future refineries cannot look towards improved utilization as a means to satisfy increasing demand.
In 2004 refineries operated at around 95% utilization, which experts believe to be the maximum.
Also, a series of costly upgrades have been imposed on the refining industry in order to produce cleaner burning fuels as mandated by the federal government.
39
Asia’s Thirst for OilAsia’s Thirst for Oil
World-wide use is forecast to rise more than 50% to 121 million barrels a day by 2025, from 80 million barrels a day now.
Experts warn that without alternative fuel sources, the need for oil could pit massive consumers such as the U.S. and the rest of the Americas against China, India and the rest of Asia.

40
Chinese Oil DemandChinese Oil Demand
Chinese crude imports jumped 33 percent to 40 million metric tons in the first four months of 2004 compared with 2003.
2004 estimate - total of 100 million tons for the year. China is now the second-largest importer of oil after the U.S. Cosco has five very large crude carriers of 220,000-300,000
deadweight tons, and two more under construction at Japan's Kawasaki Heavy Industry Co. Ltd.

41
Current Trends – National Station CountCurrent Trends – National Station Count
Inefficiency has been a key contributor to station count decline over the last decade
Inefficiency has been a key contributor to station count decline over the last decade
2002 National Petroleum News, FBR Estimates
130
150
170
190
210
1994 1995 1996 1997 1998 1999 2000 2001 2002 2003E
U.S. Gasoline Stations (000)
42
Sustainable Supply Chain Management DefinedSustainable Supply Chain Management Defined
Sustainable supply chain management (SSCM) is the strategic, transparent integration and achievement of an organization’s social, environmental, and economic goals in the systemic coordination of key interorganizational business processes for improving the long-term economic performance of the individual company and its supply chains.
Source: Carter and Rogers, 2007

43
Hubbert’s PeakHubbert’s Peak

44
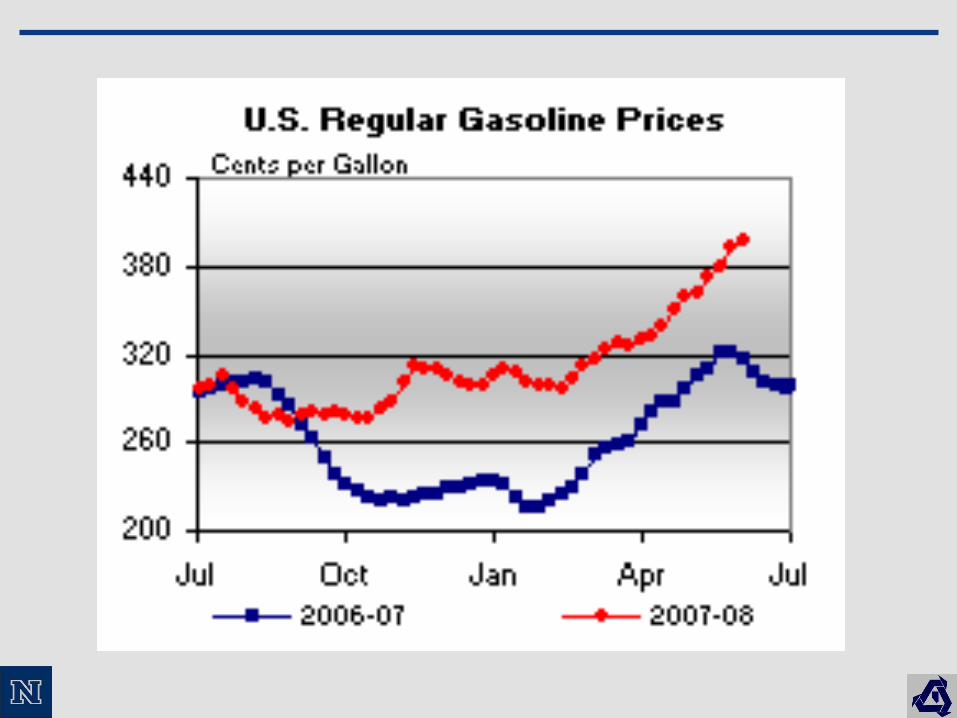
$100 a Barrel Oil?$100 a Barrel Oil?
45
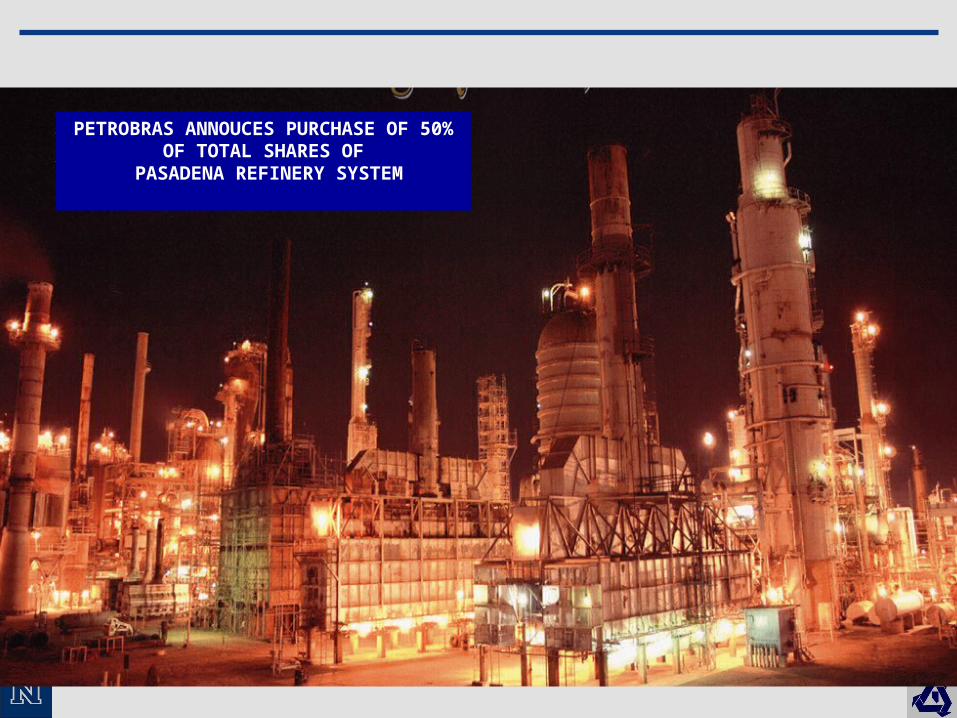
PETROBRAS ANNOUCES PURCHASE OF 50% OF TOTAL SHARES OF
PASADENA REFINERY SYSTEM