
Economic Report on Petroleum Storage Tanks in Washington (pdf)

Petroleum Supply and Use in Washington State
An Overview of Recent Developments in the Petroleum Market October 2013 Brian Bonlender, Director

Acknowledgements Washington State Department of Commerce
Tony Usibelli, Director, State Energy Office Greg Nothstein, Energy Program Specialist, Project Manager Roel Hammerschlag, Senior Energy Program Specialist This document is an update of a 2006 petroleum white paper authored by the State Energy Office. Greg Nothstein Washington State Department of Commerce State Energy Office 1011 Plum St. SE P.O. Box 42525 Olympia, WA 98504-2525 www.commerce.wa.gov
For people with disabilities, this report is available on request in other formats. To submit a request, please call 360-725-4000 (TTY 360-586-0772).
Petroleum Supply and Use in Washington State

Table of Contents
Executive Summary ........................................................................................................................ 1
Introduction ..................................................................................................................................... 3
Historical and Forecast Primary Energy and Petroleum Consumption ..................................... 4
Petroleum Resources, Domestic Production and Imports........................................................ 14
Transport and Refining of Crude Oil and Distribution of Refined Products ............................ 25
Crude Oil and Refined Petroleum Product Prices and Expenditures ...................................... 32
Causes of Price Volatility in the Petroleum Market ................................................................... 39
Greenhouse Gas Emissions Associated with Petroleum Consumption.................................. 46
Alternative Fuels and Technology to Replace Petroleum Products ........................................ 50
Recent Policy Directions .............................................................................................................. 53
Appendix A: Common energy units ............................................................................................ 55
Appendix B: Brief overview of ‘Peak Oil’ .................................................................................... 56
Appendix C: U.S. Liquid Fuel Prodcution Forecast. .................................................................. 59
Appendix D: Challenges Forecasting Petroleum Resources, Supply, Demand and Prices ... 60
Appendix E: Crude Oil Price Differentials. ................................................................................. 64
Appendix F: Electric vehicle competitiveness battery cost vs. gasoline price ....................... 65
Petroleum Supply and Use in Washington State

Executive Summary Global Petroleum Demand and Production
Global demand for petroleum products has grown at 1.3 percent per year over the last decade. Over the next two decades demand for coal, natural gas, nuclear, and renewable energy is expected to grow rapidly, and petroleum’s share of the global energy pie is expected to decline from 33 percent today to about 28 percent by 2030. Global petroleum demand growth is being driven by developing nations such as China, India, Brazil, and Indonesia. Developed nations such as the U.S., Germany, and Japan have stable or decreasing demand, caused primarily by a combination of slow growing populations, static demand for more vehicles, and increasing fuel economy standards. Currently, developed and developing nations consume approximately 45 million barrels per day, but in coming decades developing nations will dominate petroleum consumption.
Canada, Brazil, the U.S., Saudi Arabia, and a few other nations are increasing production of petroleum and other liquid fuels (synthetic liquids and biofuels) to meet demand. Norway, the United Kingdom, and Mexico have declining production, while China, Venezuela, Mexico, Iraq, and Iran have the potential to increase production but face technological or political hurdles to do so. The Organization of Petroleum Exporting Countries (OPEC) is a petroleum cartel which controls about 40 percent of global production. It has some control over petroleum prices. OPEC also controls most of the world’s petroleum reserves. These reserves have lower production costs than the oil sands, heavy oil, offshore, and tight oil being developed in non-OPEC nations. Static demand in the developed world and increasing production from unconventional resources outside of OPEC will shift trade balances, with North America becoming more energy self-sufficient and less concerned about political developments in OPEC countries. In contrast, China and India are increasing their petroleum imports and will become more concerned or involved in political developments in petroleum exporting countries. U.S. Petroleum Demand and Production
U.S. demand for petroleum and its refined products reached a peak in 2005, but declined 13 percent by 2012. Several factors contributed to the decline, including the 2007-09 recession, persistent high fuel prices, and increasing vehicle fuel economy standards. U.S. demand is forecast to decline for a few more years but begin slowly increasing in the next decade. U.S. production of petroleum and other liquid fuels has rebounded strongly after reaching a low in 2005. The increase is being driven by expansion of tight oil, natural gas liquids, and biofuels production. Total liquids production has increased from 8.1 million barrels per day in 2005 to 10.7 million barrels per day in 2012. The share of imported petroleum has declined from 61 percent in 2005 to 41 percent in 2012. Production is forecast to continue increasing until about 2020, after which production will slowly decline. Canadian petroleum production is also growing rapidly and Canada is by far the largest source of U.S. imported oil, supplying 1.1 million barrels per day in 2012. Canadian production growth has come primarily from oil sands development, more costly
Petroleum Supply and Use in Washington State 1

and energy intensive than conventional reserves. In 2012 Canadian oil sands production stood at 1.8 million barrels per day and is forecast to reach 4.7 million barrels per day by 2030. Much of the imported Canadian oil is just passing through the U.S., being refined into gasoline and diesel at Gulf coast refineries and then exported to central and South America markets. There is limited pipeline capacity for transporting oil from the newly developed midcontinent oil sands and tight oil fields, so the midcontinent is experiencing a glut of supply and lower oil prices. In response, the capacity to transport oil by rail tanker is growing rapidly. Rail tanker deliveries of midcontinent crude oil to Washington state refineries have recently started. The U.S. is still a net importer of petroleum, but in 2011 the U.S. transitioned from net importer to net exporter of refined petroleum products. The expansion of U.S. petroleum extraction and refining industries, besides reducing imports and boosting exports of refined products, has contributed significantly to job growth over the last several years. A PricewaterhouseCoopers study reported the U.S. petroleum and natural gas industry added 600,000 jobs during 2010 and 2011. Petroleum and refined product prices
While the prospects for higher petroleum production in North America appear good over the next dozen years, most of the conventional reserves lie in OPEC nations. The oil sand reserves in Canada are large, but long development times and high extraction costs mean that only sustained high world crude oil prices can spur production. Even with increasing North American production, petroleum is an internationally traded commodity and the North American price will continue to be set by international markets. Consequently, petroleum prices will likely remain above 100 dollars per barrel so Washington consumers should not expect to see significant reductions in gasoline and diesel prices. Unpredictable events, like a global financial crisis or political turmoil in a major OPEC exporting nation, could cause petroleum prices to swing above or below the standard price forecast. In addition, refinery or pipeline accidents can contribute to regional fuel price spikes of relatively short duration. Increasing light duty vehicle fuel efficiency will act to reduce the impact of higher petroleum and prices and price spikes on consumers. Beyond Petroleum
Petroleum has been the largest source of fossil fuel energy in the U.S. since 1950, and the primary transportation fuel for nearly a century. Increasing concerns over greenhouse gas emissions, state and national trade balances, and energy security have combined with price pressure to push the nation and states toward alternatives to petroleum. Electric generation and home heating, for example, have become far less dependent on petroleum over the past forty years as price has increased. In the transportation sector it has been much more difficult to find replacements for petroleum. But now biofuels, such as cellulosic ethanol and biodiesel, are slowly entering the transportation fuel market. New types of vehicles such as hybrids, plug-in hybrids, pure electric vehicles, and advanced diesels use less or no petroleum; and as of 2013 their collective market share was 5 percent, and is likely to increase.
Petroleum Supply and Use in Washington State 2
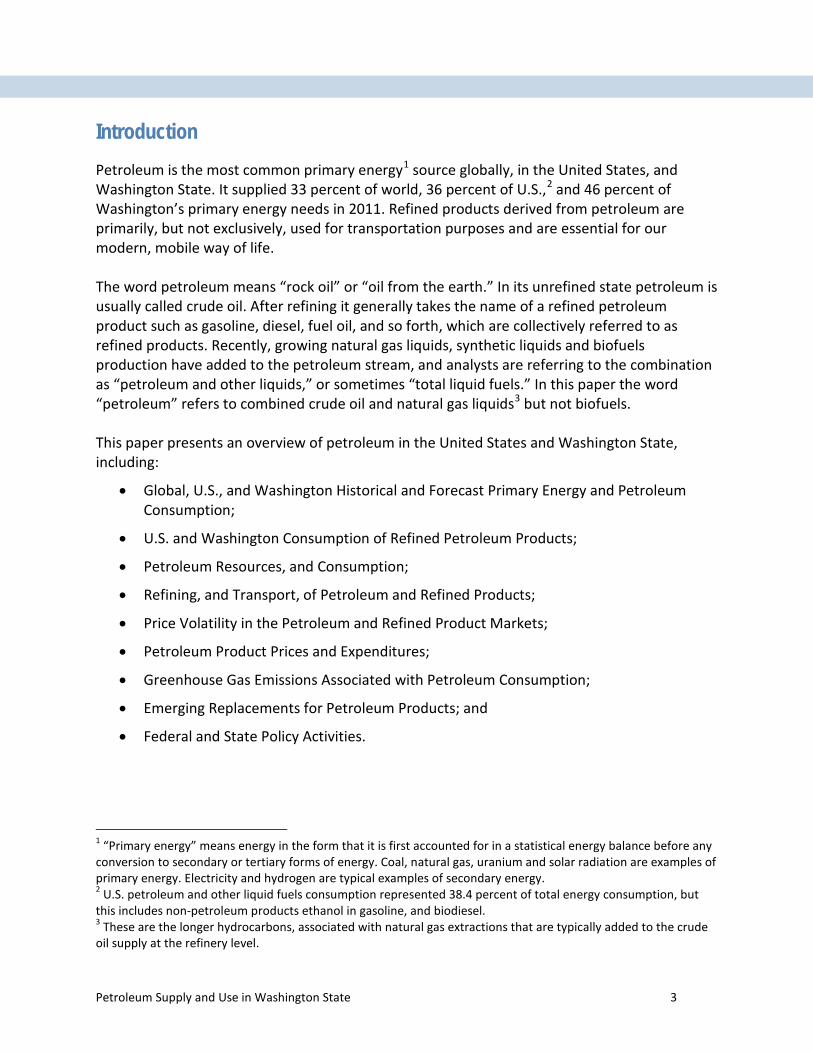
Introduction Petroleum is the most common primary energy1 source globally, in the United States, and Washington State. It supplied 33 percent of world, 36 percent of U.S.,2 and 46 percent of Washington’s primary energy needs in 2011. Refined products derived from petroleum are primarily, but not exclusively, used for transportation purposes and are essential for our modern, mobile way of life. The word petroleum means “rock oil” or “oil from the earth.” In its unrefined state petroleum is usually called crude oil. After refining it generally takes the name of a refined petroleum product such as gasoline, diesel, fuel oil, and so forth, which are collectively referred to as refined products. Recently, growing natural gas liquids, synthetic liquids and biofuels production have added to the petroleum stream, and analysts are referring to the combination as “petroleum and other liquids,” or sometimes “total liquid fuels.” In this paper the word “petroleum” refers to combined crude oil and natural gas liquids3 but not biofuels. This paper presents an overview of petroleum in the United States and Washington State, including:
• Global, U.S., and Washington Historical and Forecast Primary Energy and Petroleum Consumption;
• U.S. and Washington Consumption of Refined Petroleum Products;
• Petroleum Resources, and Consumption;
• Refining, and Transport, of Petroleum and Refined Products;
• Price Volatility in the Petroleum and Refined Product Markets;
• Petroleum Product Prices and Expenditures;
• Greenhouse Gas Emissions Associated with Petroleum Consumption;
• Emerging Replacements for Petroleum Products; and
• Federal and State Policy Activities.
1 “Primary energy” means energy in the form that it is first accounted for in a statistical energy balance before any conversion to secondary or tertiary forms of energy. Coal, natural gas, uranium and solar radiation are examples of primary energy. Electricity and hydrogen are typical examples of secondary energy. 2 U.S. petroleum and other liquid fuels consumption represented 38.4 percent of total energy consumption, but this includes non-petroleum products ethanol in gasoline, and biodiesel. 3 These are the longer hydrocarbons, associated with natural gas extractions that are typically added to the crude oil supply at the refinery level.
Petroleum Supply and Use in Washington State 3

Historical and Forecast Primary Energy and Petroleum Consumption To understand the current and future importance of petroleum as a primary energy source, it is useful to examine its consumption at the global, national, and state levels. All figures for global historical and forecast primary energy consumption are from British Petroleum’s (BP) Energy Outlook 2030, unless noted otherwise. National historical and forecast data come from the U.S. Department of Energy, Energy Information Administration’s (EIA) 2013 Annual Energy Outlook (AEO2013), and the EIA State Energy Data System. Washington State does not produce an energy forecast, but historical energy consumption is available from the EIA.
Petroleum in the Global Energy Picture
Globally, three fuels, petroleum, coal, and natural gas, currently4 provide 88 percent of primary energy, with nuclear and renewable energy providing the remaining 12 percent.5 As shown in Figure 1, these three fuels are projected to continue providing the majority of primary energy over the next 20 years, with an estimated share of 86 percent in 2030.6 Worldwide consumption of petroleum reached a record 87.3 million barrels per day in 2011.7 The four largest consuming countries were:
• United States (18.8 million barrels per day)
• China (9.8 million barrels per day)
• Japan (4.5 million barrels per day)
• India (3.3 million barrels per day) Petroleum provided 33 percent of primary energy in 2011, but this is forecast to decrease to 28 percent by 2030. The coal share is forecast to decrease from 30 percent to 28 percent by 2030, while the natural gas share increases from 24 percent to 25 percent. Nuclear power is forecast to remain at about a 6 percent share over the next 20 years, while renewable energy (including hydropower) is expected to increase its share from 6 percent to 12 percent. So while petroleum’s share decreases by 2030 it will be essentially tied with coal as the number one source of global primary energy. The units in Figure 1 are British thermal units (Btu), which is the customary unit used in the U.S. See Appendix A for a brief presentation on units.
4 2011 data. 5 British Petroleum Energy Outlook 2030. 6 Other world energy reviews forecast a lower share for fossil fuels. Exxon-Mobil’s 2013 Outlook for Energy: A view to 2040 forecasts the fossil fuel share at 81 percent. The EIA 2011 International Energy Outlook forecasts the fossil fuel share at 79 percent. 7 This is equivalent to 31.9 billion barrels per year, or 1.34 trillion gallons per year.
Petroleum Supply and Use in Washington State 4

Figure 1: Global Primary Energy Consumption by Fuel: Historical and Forecast, 1990-2030.
Source: British Petroleum Outlook 2012. Units: British Thermal Units (Btu)
Petroleum consumption in developed countries has declined over the last decade, but has been offset by a steady increase in consumption in developing countries. Figure 2 illustrates the recent consumption trends for developed countries in the Organization for Economic Cooperation and Development (OECD) and non-OECD developing countries. In early 2013 global consumption was evenly split between developed and developing countries. In the future global petroleum demand will be largely determined by the demand growth in developing countries. During the previous decade, when demand and prices for petroleum were rising rapidly there was a lively discussion regarding the prospect of peak oil production. The complex and contentious topic of peak oil is beyond the scope of this paper, but a brief overview is presented in Appendix B.
Petroleum Supply and Use in Washington State 5

Figure 2: Total liquid fuels consumption, OECD and non-OECD.
This Week in Petroleum, June 12, 2013
Petroleum in the United States Energy Picture
The U.S. energy profile and forecast in Figure 3 is somewhat different than the global energy profile and forecast. The three largest primary energy sources are the same: petroleum, coal and natural gas, but in the U.S. natural gas consumption, on an energy basis, exceeds that of coal. In 2011, total U.S. petroleum consumption was 18.8 million barrels per day, representing 36 percent of all the energy we consumed. Both the U.S. and global energy projections see increasing natural gas consumption. In contrast to the global primary energy forecast, the U.S. petroleum consumption, which peaked around 2007, is predicted to be flat to slightly declining while coal consumption is predicted to decline over the next several years and then slowly increase through 2030. Nuclear and renewable (including hydroelectric) energy consumption increases both globally and in the U.S., but the rate of increase is more rapid at the global level. The primary message from the U.S. forecast is that total energy consumption is flat and petroleum will remain the largest source of primary energy. However, its share will decrease over the next 20 years from 38 percent of the total in 2011, to 35 percent in 2030. The primary driver of the decrease in U.S.
Petroleum Supply and Use in Washington State 6

petroleum consumption is the recently updated8 Corporate Average Fuel Economy (CAFE) standards for light and medium duty vehicles. Policies mandating increasing biofuel production will also displace some petroleum consumption over the next 20 years.
Figure 3: United States Primary Energy Consumption by Fuel: Historical and Forecast, 1990-2030, 5-year increments.
Source: Energy Information Administration Annual Energy Outlook 2013
8 The Corporate Average Fuel Economy (CAFE) standards are regulations, first enacted by the U.S. Congress in 1975, intended to improve the average fuel economy of cars and light trucks (trucks, vans and sport utility vehicles) sold in the U.S. After reaching 27.5 miles per gallon (mpg) for cars in 1986, the CAFE standards remained relatively unchanged for twenty years. In 2007, the standards were set to increase to 35 mpg for cars by 2020. In 2011, CAFE standards were amended, with a target of 54.5 mpg by the 2025 model year. Coverage of medium duty trucks was added in 2012, and heavy-duty commercial trucks in 2014. The mpg values required by the 2011 CAFE standards are calculated using the original 1975 EPA testing methodology, which results in mpg values more than 20 percent higher than the current methodology used to produce the published fuel economy mpg numbers for new vehicles.
Petroleum Supply and Use in Washington State 7

Consumption of refined petroleum products in the U.S.
Petroleum, or more broadly crude oil and other liquids, is not used directly but is converted into a number of high value refined products. Motor gasoline, distillate fuels (diesel and heating oil), jet fuel, liquefied petroleum gases (LPG), and residual fuel oil account for the vast majority of refined petroleum products.
Figure 4: United States Consumption of Refined Petroleum Products 1981-2011.
Source: EIA, Product supplied
U.S. consumption statistics for 2011:
• In 2007, gasoline consumption reached a record high of 9.3 million barrels a day (or 391 million gallons per day), before declining to about 8.7 million barrels per day in 2011, representing 46 percent of total petroleum consumption.
• Nearly 10 percent of the gasoline volume consumed in 2011 was actually ethanol (mixed with gasoline).9
9 In 2007, a Renewable Fuel Standard target of 36 billion gallons (2.35 million barrels per day) by 2022 was established. Ethanol is one of the renewable fuels.
Petroleum Supply and Use in Washington State 8

• Distillate fuel oil includes both diesel fuel and heating oil. Total distillate fuel oil consumption in 2011 was over 3.8 million barrels per day, representing 20 percent of total petroleum consumption. Biodiesel represented nearly 1 percent of distillate consumption.
• Diesel fuel is used in the diesel engines of heavy construction equipment, trucks, buses, tractors, boats, trains, and some automobiles. It accounts for about one-fifth of total transportation fuel consumption and about 18 percent of total petroleum consumption in 2011.
• Heating or fuel oil is used to heat homes and buildings, for industrial heating, and for producing electricity.
• Liquefied petroleum gases (LPG) are mixtures of propane, ethane, butane, and other gases produced at natural gas processing plants and oil refineries. LPG is used to heat buildings, power non-road vehicles, and for cooking. Consumption in 2011 was 2.2 million barrels per day.
• Jet fuel, like gasoline, is nearly all used for transportation. Jet fuel consumption in 2011 was 1.4 million barrels per day.
• Still gas is a product of refining and is used as a source of heat at the refinery or as a petrochemical feedstock. Approximately 0.68 million barrels per day were used in 2011.
• Residual fuel is used as an industrial and ship fuel, and 0.48 million barrels per day were used in 2011.
U.S. consumption of refined petroleum products rose steadily from the early 1990’s until 2005-07 when peak consumption was reached. A combination of high fuel prices, a severe recession, and more recently increasing fuel economy standards resulted in declining gasoline and distillate fuel consumption during 2008-12. Jet fuel consumption flattened out after the 911 terrorist attacks in 2001 and because of operational changes made by airlines. LPG is most frequently used as a residential or commercial heating fuel and its use has continued to rise as the U.S. population grows. Because of increasingly stringent emission standards, residual fuel use has diminished in importance over the past 30 years. Consumption of still gas has remained relatively stable over the past twenty years.
Petroleum in the Washington State Energy Picture
The profile of primary energy consumption for Washington State differs from the global and national patterns (Figure 3). Petroleum is still the largest primary energy source, but the second largest category is hydroelectric and renewable energy.10 Washington has a uniquely11 large
10 Renewable energy includes biomass much of which comes from the forest products industry. 11 The three other Pacific Northwest states also have large hydropower electric generation shares.
Petroleum Supply and Use in Washington State 9
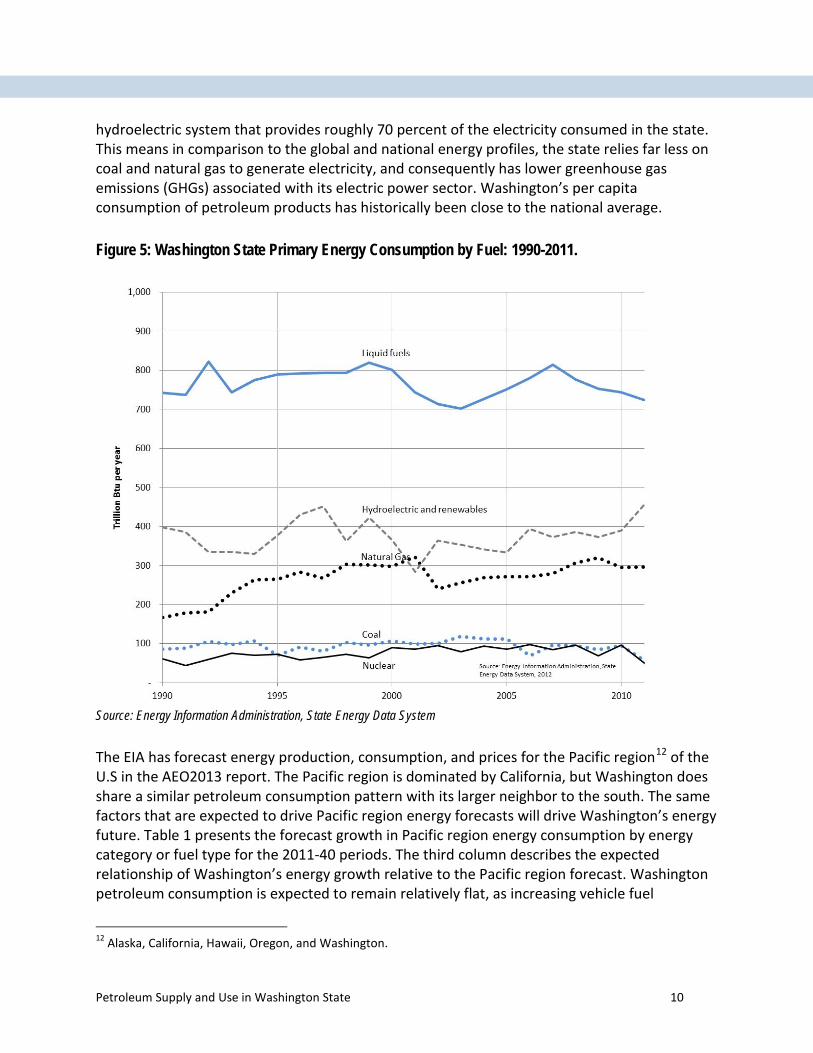
hydroelectric system that provides roughly 70 percent of the electricity consumed in the state. This means in comparison to the global and national energy profiles, the state relies far less on coal and natural gas to generate electricity, and consequently has lower greenhouse gas emissions (GHGs) associated with its electric power sector. Washington’s per capita consumption of petroleum products has historically been close to the national average.
Figure 5: Washington State Primary Energy Consumption by Fuel: 1990-2011.
Source: Energy Information Administration, State Energy Data System
The EIA has forecast energy production, consumption, and prices for the Pacific region12 of the U.S in the AEO2013 report. The Pacific region is dominated by California, but Washington does share a similar petroleum consumption pattern with its larger neighbor to the south. The same factors that are expected to drive Pacific region energy forecasts will drive Washington’s energy future. Table 1 presents the forecast growth in Pacific region energy consumption by energy category or fuel type for the 2011-40 periods. The third column describes the expected relationship of Washington’s energy growth relative to the Pacific region forecast. Washington petroleum consumption is expected to remain relatively flat, as increasing vehicle fuel
12 Alaska, California, Hawaii, Oregon, and Washington.
Petroleum Supply and Use in Washington State 10

efficiency is offset by a growing population. As a share of total energy consumption, petroleum is expected to decrease.
Table 1: Annual changes in energy consumption based on EIA AEO2013 Pacific region forecast. Energy category or fuel
Pacific region forecast annual change: 2011-2040 (percent)
Annual growth expectations for Washington state
Major influences on long-term trends
Natural gas 0.50 Similar Most growth for natural gas will be in electric generation
Coal -0.10 Less Phase-out of Centralia operation by 2025.
Nuclear 0.50 Less Reactor shutdowns in CA lowered the initial 2011 starting value. Retirement of two CA reactors will alter the next nuclear forecast
Hydro and renewables
1.20 Less Large existing hydro base in WA reduces our apparent renewable growth rate.
Petroleum fuels 0.00 Similar National CAFE standards & biofuels
gasoline -0.60 Similar CAFE and biofuels
diesel 1.00 Slightly more Reflects increasing movement of freight through WA ports.
It should be noted that the AEO2013 forecast is based on existing law and policy, some of which contains expiration or end dates.13 Legislative changes could influence the petroleum consumption for the nation, the Pacific region, and Washington State. Consumption of refined petroleum products in the Washington State
In Washington state gasoline, diesel, and jet fuel represent the vast majority (83 percent in 2011) of refined petroleum product consumed, and are used primarily for transportation purposes. Other refined petroleum products include liquefied-petroleum-gas and residual fuel. The amount of refined petroleum products used in the state, excluding residual fuel,14 grew steadily from the
13 For example, the renewable energy production tax credit expires at the end of 2013 and the CAFE standards for light duty vehicles increase until 2025 and then hold steady. Both of these programs could be extended or increased, but in the AEO reference case EIA assumes no renewal of the PTC or increases in the CAFE standard after 2025. EIA includes a scenario that extends existing policies. 14 Residual fuel is primarily used to fuel ocean-going vessels. These vessels purchase fuel in Washington, but are owned by other nations and spend only a short amount of time in state waters, so it is debatable as to whether this fuel should be count as Washington state consumption. In addition, the accounting for residual fuel sales seems to be erratic.
Petroleum Supply and Use in Washington State 11

early 1980’s until 1999, then declined for several years following the 2000-02 recession.15 Consumption began to grow again in 2004 and reached a new high in 2007, much like the nation as a whole, and then began to decline. Since 2007 the amount of petroleum product consumed in the state has declined nearly 12 percent, despite an 5 percent increase in population. Consequently, the decline in per capita consumption of refined petroleum products has dropped even more over the past five years. Factors that have contributed to this decline are:
• An economy operating at reduced output and employment,
• Higher fuel prices, and
• Increased fuel economy standards for light duty vehicles. Figure 6 illustrates the trend in Washington state consumption of refined petroleum products during 1970-2011.
Figure 6: Washington State Consumption of Refined Petroleum Products 1970-2011.
Source: EIA State Energy Data System.
15 The 911 terrorist attacks contributed to a sharp drop in jet fuel consumption nationally and in Washington state. Since the early 2000’s, when jet fuel price began to increase, airlines have replaced older less efficient planes with modern aircraft such as the 777 and 787.
Petroleum Supply and Use in Washington State 12

Per capita petroleum consumption: Washington and United States
Another way to look at energy consumption over time is to express the consumption on a per capita basis (average consumption per person). Expressing consumption on a per capita basis removes the effect of population growth and allows us to look at how efficiently we are using energy. While Figure 6 shows overall state consumption of petroleum is increasing from 1970 to 2005, Figure 7 shows that on a per capita basis petroleum consumption has declined. The figure also shows U.S. per capita consumption, which declined, but less dramatically in recent years.16
Figure 7: Per capita petroleum consumption: Washington and United States
Factors contributing to the decline in per capita petroleum consumption include:
• Adoption of vehicle fuel economy standards in 1976 and updates in 2007 and 2011,
• A move away from oil heating in homes,
• Continued improvements in passenger aircraft efficiency,
• High petroleum prices during 1979-85, 2006-08 and 2011 onward, and
• Deep recessions during 1981-83 and 2007-09.
16 There may be reporting problems for Washington State, as residual fuel consumption is quite variable on an annual basis. The U.S. reported residual consumption is much less variable and the per capita trend is smoother and probably more representative, especially between 1980 and 2000.
Petroleum Supply and Use in Washington State 13

Petroleum Resources, Domestic Production and Imports
Global Petroleum Resources and Production
Crude oil resources are commonly placed in two categories: proven, and unproven. The unproven category contains two sub-categories: probable and possible resources. Another term is technically recoverable reserves, which is the total of proven and unproven resources. There have been many instances when these terms are used incorrectly. In general, the numbers increase when moving from proven to probable to potential reserves. Proven reserves are the most frequently referenced term. It denotes the quantity of a known resource that is well supported by geological and engineering data and has a 90 percent certainty of being extracted under existing economic and technological conditions. Probable reserves are resource projections derived from the data used to support the proven reserves. Probable resources included proven reserves and additional reserves, such as those thought to be available by means of infill drilling or field extensions and are attributed with a 50 percent confidence of being recovered. Possible reserves are attributed to known accumulations that have a less likely chance of being recovered than probable reserves. This term is often used for reserves, which at a particular moment in time are believed to have at least a 10 percent certainty of being produced. In general, most early estimates of the reserves of an oil field are conservative and tend to grow with time. This is called “reserve growth.” Another term occasionally used in the literature is “oil in place,” which refers to the total amount of crude oil in an accumulation; only a portion of the oil in place is technically or economically recoverable.17 While prospects for crude oil and liquids production in North America appear good over the next dozen years, most of the global crude oil and other liquid resources lie elsewhere. Table 2 reveals the proven crude oil reserves for several regions and the Organization of Petroleum Exporting Countries (OPEC). The oil sand reserves in Canada are large, but project and infrastructure development times are long and extraction costs high, so production growth will require sustained high world crude oil prices. Crude oil production costs tend to be much lower in OPEC countries, particularly in the Middle east. The EIA and other energy forecasting agencies expect OPEC, and especially Saudi Arabia, to act as the swing producer over the next twenty years, throttling back or increasing production to keep the price of crude oil high, but lower than competing forms of energy.18 So even though North American liquids production will increase significantly over the next decade, the price of crude oil, and consequentially refined products like gasoline and diesel, will continue to be set by international markets. Consequently crude oil prices will likely remain above 100 dollars per barrel and Washington
17 Typically, 35 to 45 percent of oil in place can be recovered by primary and secondary techniques. Tertiary or Enhanced Oil Recovery can allow another 5 to 15 percent to be extracted, but is not always applied because of cost. E. Tzimas, (2005). Enhanced Oil Recovery using Carbon Dioxide in the European Energy System 18 Alternatives such as natural gas, GTL, CTL, biofuels, electricity, and others.
Petroleum Supply and Use in Washington State 14

consumers should not expect to see significant reductions in gasoline and diesel prices anytime soon.
Table 2: Proven Oil Reserves Country or region Proven oil reserves (billion
barrels) Share of global reserves
OECD Americas (Canada and U.S.)19 207 14% Rest of Americas (both OPEC and non-OPEC) 237 16% Africa 124 8.4% OECD Europe 11 0.7% Non-OECD Europe/Eurasia (former Soviet Union)
100 6.8%
OPEC 1050 71% World 1471 100%
Source: EIA International Energy Outlook 2011 (Figure 39)
Global liquids production (crude oil, natural gas liquids, biofuels and other liquids) averaged 89.1 million barrels per day in 2012. Production from Non-OPEC and OPEC nations averaged 52.7 and 36.4 million barrels per day respectively. The EIA forecasts that in 2030 global liquids production will increase to 104.4 million barrels per day, of which 61.9 and 42.5 million barrels per day will be supplied by Non-OPEC and OPEC producers respectively. As a cartel OPEC plays a key role in balancing global supply and demand, and can influence oil price, but by 2030 its share of global liquids production is unchanged suggesting that the cartels ability to control oil markets will largely remain the same.20 The primary reason that OPEC is not expected to appreciably increase its global production share is that several sources of new liquids production are predicted to significantly expand during the period from 2012 through 2030. Tight oil and oil sands are expected to add 6.2 million barrels per day of new capacity. Brazil will add 4.4 million barrels per day of new capacity, and natural gas liquid production will contribute 2.8 million barrels per day of new capacity by 2030. The combined 2030 addition from biofuels and other liquid production techniques are expected to be 2.4 million barrels per day of new capacity. These additions more than make up for declines in conventional crude oil production.
North American Resources and Production
This section focuses primarily on crude oil, which is largest component of the petroleum or liquid supply stream. North America has a sizable number of crude oil producing basins, including but not limited to basins in Alaska, Texas, Louisiana, California, Alberta, North Dakota
19 The EIA reports U.S. reserves for crude and NGLs in 2010 as 22.3 billion barrels. 20 The International Energy Association forecasts a significantly higher market share for OPEC by 2030.
Petroleum Supply and Use in Washington State 15

and the Gulf of Mexico. Figure 8 shows the major fossil fuel basins in the United States. Crude oil has been commercially extracted in North America since the mid-19th century. Even though the initial resource base was sizable, the U.S. experienced declining crude oil production after 1970, and North America as a whole after 1985. Imports, particularly to the United States, increased steadily after the mid 1980’s.
Figure 8: United States fossil fuel energy basins.
In the last ten to twenty years the steady development of three emergent North American crude oil resources have combined to reverse the long-term stagnation in overall North American production. The first and most prominent emergent resource are the oil sands in Alberta, centered in the three large sub-basins of Cold Lake, Peace River, and Athabasca (Fort McMurray). Total Canadian proved reserves, primarily oil sands, are currently estimated at approximately 170 billion barrels.21 The oil sands produce a very heavy oil, commonly referred to as bitumen, an almost tar-like substance that cannot be recovered by conventional oil extraction technology. Approximately 20 to 25 percent of the oil sands resource are in shallow formations (less than 200 feet deep) and can be extracted by strip mining, while the remaining resource must be extracted in situ by a technique known as Steam Assist Gravity Drainage (SAGD).22 SAGD consumes large amounts of natural gas to generate steam which is used to warm the bitumen
21 Of which approximately 5 billion barrels are conventional reserves. 22 Currently Canadian oil sands production is evenly split between surface mining and the SAGD method.
Petroleum Supply and Use in Washington State 16
so it can flow and be pumped to the surface. Once extracted the bitumen must be cleaned and may then be extensively upgraded, which requires additional energy input. The upgraded product is referred to as syncrude. Alternatively, bitumen can be blended with 25 to 30 percent light conventional crude oil or natural gas liquids, creating a product referred to as dilbit, before being sent to refineries. Oil sands production in Alberta reached 1.8 million barrels per day in 2012. In the 2011 International Energy Outlook the EIA projects that total Canadian liquids production would increase from 3.8 million barrels per day in 2011 to 6.6 million barrels per day in 2035.23 Most of the increase is expected to be from expanded oil sands production. The second emerging petroleum resource is offshore Gulf of Mexico production, which in 2011 was responsible for 1.3 million barrels per day or 23 percent of U.S. crude oil production and 1.9 million barrels per day of Mexican production. The federal offshore resource is currently listed as 5 billion barrels of proven reserves. It was first tapped decades ago, but was limited to depths of less than 1000 feet. More recent technological development has enabled production to occur at water depths of more than 3000 feet, thereby allowing the development of new offshore resources. AEO2013 forecasts approximately a 20 percent increase in U.S. offshore production by 2019, before production begins to decline. Mexico also has the potential for increased offshore oil production. The third emerging resource is “tight oil”, which is sometimes referred to as shale oil. Tight oil is usually of higher quality, being both “light” and “sweet”,24 but is trapped primarily in low permeability shale, sandstone, or carbonate rock, which prevents the oil from flowing easily. Advances in staged hydraulic fracturing, 3D imaging, and horizontal drilling have allowed exploration and extraction companies to locate and extract tight oil. Technically recoverable U.S. reserves of tight oil are estimated at 48-56 billion barrels. In 2013, for the first time, EIA released a proved reserve number for U.S. tight oil resources: 3.6 billion barrels as of 2011. The most well-known tight oil resource is the Williston Basin (encompassing the Bakken formation) that covers parts of North Dakota, Montana, and Saskatchewan. Texas is also seeing a significant increase in tight oil production in the Eagle Ford formation For 2012, the EIA reported annual U.S. crude oil production increased by 0.8 million barrels per day25 relative to 2011, most of the increase attributable to increasing tight oil production.26 In AEO2013 the EIA forecasts that by 2020 tight oil production will increase total U.S. petroleum production by 20 percent, after which a slow decline will begin. Tight oil production from the
23 Production forecasts are highly dependent on whether strong climate change measures are enacted in the U.S. and Canada. 24 Light refers to specific gravity and means the crude is of lower viscosity and flows more easily. Sweet refers to crude oil that is low in sulfur content; sour refers to crude that is high in sulfur. Removing sulfur creates an expense for refiners, usually offset by lower prices for sour (high sulfur) crude oil. 25 February 2013 Energy Information Administration STEO report: U.S. production averaged 6.5 million barrels per day in 2012, and is projected to average 7.4 and 8.2 million barrels per day in 2013 and 2014 respectively. 26 Increasing oil and natural gas production was credited with creating 150,000 new jobs in 2011: America’s Fossil Fuel Jobs Boom, Economix, March 12, 2012, New York Times.
Petroleum Supply and Use in Washington State 17

Bakken and Eagle Ford formation has developed rapidly over the past four years as illustrated in Figure 9. The development has outpaced pipeline infrastructure resulting in a shift to transport of oil by rail.
Figure 9: Lower 48 state crude oil production 2010 through early 2013
The EIA recently released the 2011 estimates of proved reserves for crude oil and natural gas in the U.S. For 2011, proved crude oil reserves were estimated to be 29 billion barrels, a 15 percent increase relative to 2010, and the highest level since 1985. Crude oil reserves have been increasing for several years and appear to be mirroring the trend for natural gas reserves which have been increasing for about a decade. In addition to growing North American petroleum resources, several petroleum substitutes are also growing in promise. The most successful petroleum substitute is from biofuel production. The two primary biofuels today are ethanol and biodiesel which can be blended easily with gasoline and diesel respectively. About 10 percent of current retail gasoline is actually ethanol while biodiesel makes up about 1 percent of diesel fuel. Biofuel production and consumption is primarily driven by the Renewable Fuel Standard (RFS) requirements of the Energy Independence and Security Act (EISA) of 2007. The annual volumes of renewable fuel required were significantly increased by EISA – to 36 billion gallons per year by 2022, of which 21 billion gallons are to be advanced biofuel.27 There have been numerous technical and economic challenges in the development of advanced biofuels and the EIA expects the RFS 36 billion gallon target will not be met in 2022.
27 Advanced biofuels excludes cornstarch derived ethanol.
Petroleum Supply and Use in Washington State 18

Two emerging petroleum substitutes are the gas-to-liquids (GTL) and coal-to-liquids (CTL) conversion processes.28 GTL technology converts natural gas to longer chain hydrocarbons that are typically used as a substitute for diesel. The conversion process is very capital-intensive and somewhat energy-intensive. It is currently economic only in a few places in the world where natural gas exists in large readily available reserves and is very inexpensive. Qatar and Shell recently developed the Pearl GTL project, but budget overruns have hurt profitability. A U.S. GTL project is planned for Saint Charles, Louisiana.29 The CTL process is even more capital and energy intensive than GTL, but the feedstock (coal) is typically inexpensive. The Shenhua CTL project is a small facility that has been operating for several years in northern China. Energy security and not cost may be the primary reason that China is pursuing CTL. The EIA foresees modest development of GTL and CTL in certain countries, but only limited development in the U.S. over the next twenty years. The EIA forecasts that total U.S. liquids production will increase until about 2020 when it reaches 12.8 million barrels per day and then begin to slowly decline. See Appendix C for U.S. liquids production forecast. Canadian crude oil production, because of the vast size of the oil sands resource, is forecast to continue increasing for at least twenty years, possibly reaching 6.5 million barrels per day in 2035. Mexico has begun the complicated political process of opening its state oil monopoly to foreign investment which may eventually increase its production capacity. Overall, North American production is expected to increase rapidly for the next 5 years, and then more slowly through 2025. Figure 10 illustrates the trend in total U.S. liquids production (crude oil, natural gas liquids, and biofuels) from 2007-12, and forecasts production for 2013-14 (EIA March Short Term Energy Outlook (STEO)). The figure also shows total U.S. liquids consumption for the same period and the share of liquid fuels that are imported. Liquids production rises steadily from 2007 through 2014.30 Consumption, after peaking in 2007, declines during the recession of 2008-09, recovers a bit during 2010 and is then predicted to slowly decline during 2013-14 as the nation’s vehicle fleet continues to become more efficient. The share of liquid fuels covered by imports declines rapidly, starting at about 60 percent in early 2007 and forecast to decline to about 30 percent by the end of 2014.
28 SASOL is a South African company that in part specializes in making liquid fuels from coal or natural gas using the Fischer-Tropsch process. Many of the GTL or CTL projects around the world involve SASOL. 29 The Louisiana GTL project would produce more profitable diesel fuel. 30 The low point of U.S. crude oil production occurred in 2005.
Petroleum Supply and Use in Washington State 19
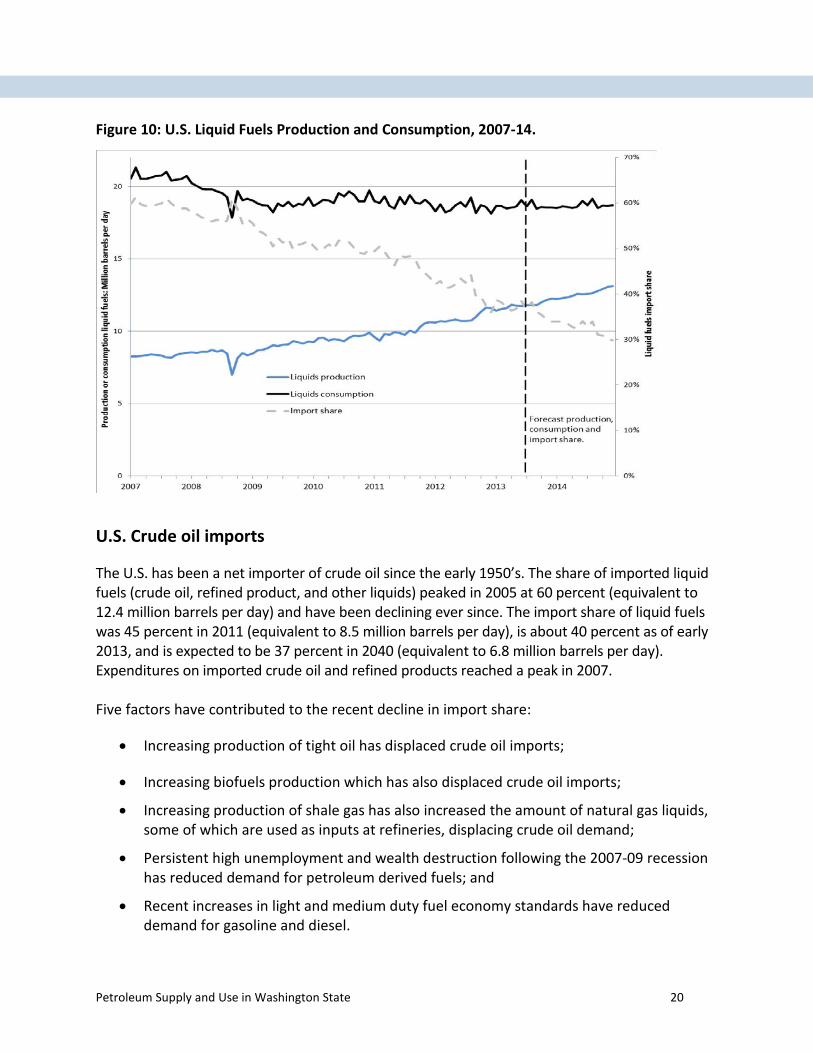
Figure 10: U.S. Liquid Fuels Production and Consumption, 2007-14.
U.S. Crude oil imports
The U.S. has been a net importer of crude oil since the early 1950’s. The share of imported liquid fuels (crude oil, refined product, and other liquids) peaked in 2005 at 60 percent (equivalent to 12.4 million barrels per day) and have been declining ever since. The import share of liquid fuels was 45 percent in 2011 (equivalent to 8.5 million barrels per day), is about 40 percent as of early 2013, and is expected to be 37 percent in 2040 (equivalent to 6.8 million barrels per day). Expenditures on imported crude oil and refined products reached a peak in 2007. Five factors have contributed to the recent decline in import share:
• Increasing production of tight oil has displaced crude oil imports;
• Increasing biofuels production which has also displaced crude oil imports;
• Increasing production of shale gas has also increased the amount of natural gas liquids, some of which are used as inputs at refineries, displacing crude oil demand;
• Persistent high unemployment and wealth destruction following the 2007-09 recession has reduced demand for petroleum derived fuels; and
• Recent increases in light and medium duty fuel economy standards have reduced demand for gasoline and diesel.
Petroleum Supply and Use in Washington State 20
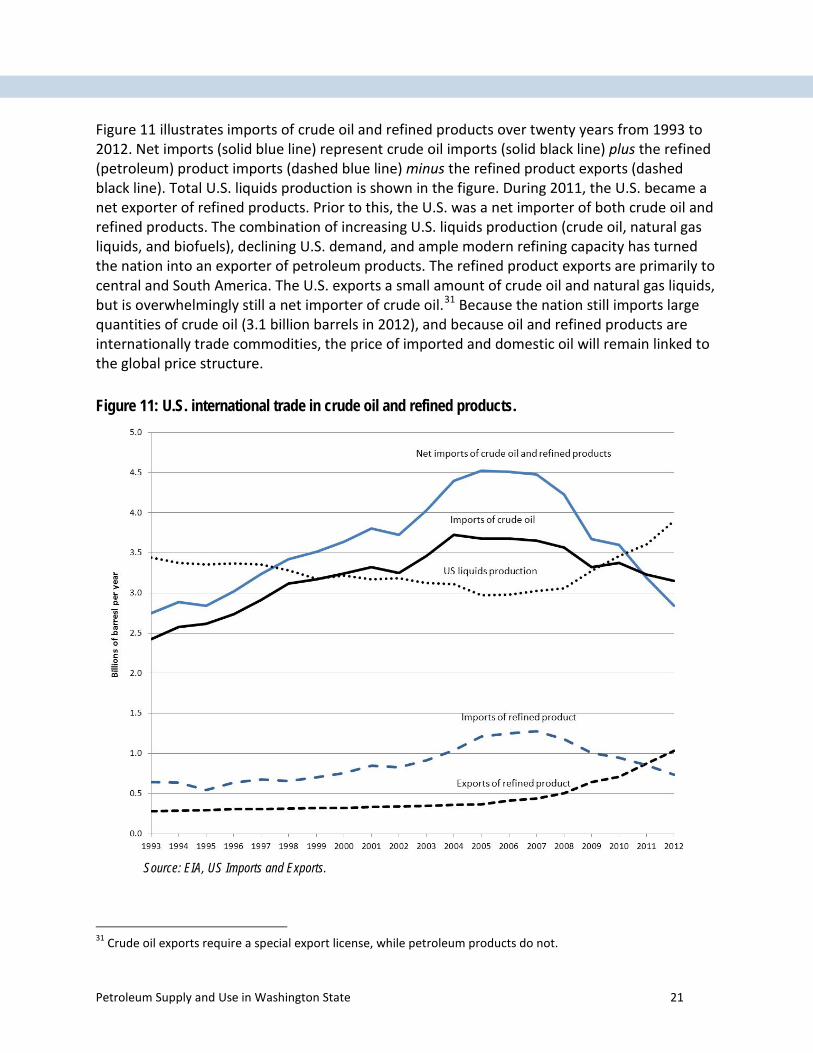
Figure 11 illustrates imports of crude oil and refined products over twenty years from 1993 to 2012. Net imports (solid blue line) represent crude oil imports (solid black line) plus the refined (petroleum) product imports (dashed blue line) minus the refined product exports (dashed black line). Total U.S. liquids production is shown in the figure. During 2011, the U.S. became a net exporter of refined products. Prior to this, the U.S. was a net importer of both crude oil and refined products. The combination of increasing U.S. liquids production (crude oil, natural gas liquids, and biofuels), declining U.S. demand, and ample modern refining capacity has turned the nation into an exporter of petroleum products. The refined product exports are primarily to central and South America. The U.S. exports a small amount of crude oil and natural gas liquids, but is overwhelmingly still a net importer of crude oil.31 Because the nation still imports large quantities of crude oil (3.1 billion barrels in 2012), and because oil and refined products are internationally trade commodities, the price of imported and domestic oil will remain linked to the global price structure.
Figure 11: U.S. international trade in crude oil and refined products.
Source: EIA, US Imports and Exports.
31 Crude oil exports require a special export license, while petroleum products do not.
Petroleum Supply and Use in Washington State 21

As noted, the past five years have seen an increase in U.S. liquids production and declining crude oil and refined products imports. Over roughly this period there has also been a dramatic shift in the sources of U.S. imported crude oil, as shown below. Canadian crude oil production and exports to the U.S. have surged, while Mexican exports to the U.S. after plateauing during 2004-06 have declined sharply as Mexico’s overall crude production has fallen. Imports from Venezuela peaked in 1997 and have declined as production and political relations with the U.S. have deteriorated. U.S. imports from West Africa nations began to rise about ten years ago, but have declined over the last several years. Imports from Saudi Arabia, while somewhat volatile, appear to have declined slightly over the past decade.
Figure 12: Select U.S. crude oil imports by country: 1993-2012.
Source: EIA Annual Energy Review
Figure 13 represents a one year snapshot (2011) of domestic liquids production and crude oil imports. The domestic share has increased significantly from 2005 when it reached a low of 40 percent of total liquids production. The Canadian share of imports has risen rapidly over the past decade. Since much of the imports from Canada is a heavier synthetic or blended crude oil derived from the oil sands, some U.S. refineries have had to make significant investments to alter their refinery processes.
Petroleum Supply and Use in Washington State 22

Figure 13: U.S. Petroleum Supply 2011.
Source: EIA Annual Energy Review.
Washington State Petroleum Resources and Imports
Washington State has no oil producing basins, but did have a small production site during the early part of the twentieth century.32 As illustrated in Figure 14, most crude oil delivered to Washington refineries originate from North American basins.33 The majority still comes from Alaska, but the production basins there have been declining for more than twenty years and refiners have had to look for new sources of supply. Crude oil from the Canadian oil sands has made up for most of the decline in supply from Alaska, but imports from Russia, Africa, and OPEC countries have also been tapped. More recently, crude oil from North Dakota has begun to arrive at Washington refineries via railcar.
32 Oil City located on the Pacific coast produced approximately 12,000 barrels of crude oil during 1957-1960. 33 The majority of Washington’s domestic crude oil and liquids supply is from Alaska. Smaller amounts are arriving from North Dakota and perhaps Montana via railcar.
Petroleum Supply and Use in Washington State 23

Figure 14: Washington crude oil supply 2012
Source: EIA, Company level imports 2012.
Petroleum Supply and Use in Washington State 24

Transport and Refining of Crude Oil and Distribution of Refined Products
Transport of petroleum or crude oil in the U.S.
The primary means of transporting crude oil to refineries is by pipeline or by tanker (ship). Figure 16 gives a sense of the extent of the crude oil and refined product pipeline network in North America. The U.S. has approximately 50,000 miles of crude oil pipeline and 88,000 miles of refined product pipeline. From 2005 to 2010, 96 percent of refinery crude oil receipts came by pipeline and tanker, with roughly an even split between the two modes of transportation. With relatively low costs and high capacity, pipelines have long been the delivery method of choice for inland refineries. Coastal refineries, on the other hand, have typically been served by tankers carrying waterborne imports or offshore production. In 2011, this pattern began to change, and in 2012, pipelines and tankers delivered only 93 percent of crude oil processed by U.S. refiners. The percent of crude oil delivered to U.S. refineries by tanker has declined steadily since 2005, while the percent delivered by pipeline has increased. The remaining 7 percent is made up primarily of domestic crude supplies carried via barge, rail and truck, and though a relatively small share it has been increasing rapidly since 2010. Truck transport of crude oil is more common near the tight oil production fields in North Dakota and Texas, but because of the high cost of this form of transport delivery distances are limited to a couple hundred miles. Rail transport is also associated with these two producing regions, but because rail transport of oil is lower cost than truck transport it can be delivered to refineries more than a thousand miles from the producing area. Shipping oil by rail costs $10 to $15 per barrel; about twice as much as the $5-7 per barrel it costs to move oil a similar distance by pipeline.34 Despite the higher cost, there are several factors currently in favor for using rail transport of crude oil from the continental interior including:
• foremost is that pipeline development to move midcontinental oil is lagging from the growing North American production,
• price discounts for continental interior oil are often large,35 ranging from $20 to $50 per barrel, which makes rail a viable alternative to pipelines,
• rail facilities (both at the refinery and in the producing region) can be developed very quickly, and offer more delivery flexibility than pipelines,
• oil sands crude oil does not have to be mixed with as much lighter and expensive hydrocarbon diluent when moved by rail which reduces cost.
34 http://www.eia.gov/todayinenergy/detail.cfm?id=7270. This is thought to be referring to transport from North Dakota to the Gulf coast. 35 http://oilandgas-investments.com/2013/oil-prices/shipping-crude-rail/
Petroleum Supply and Use in Washington State 25

Figure 15: North American crude oil and refined product pipelines.
Figure 16: U.S. crude oil refinery receipts by pipeline and tanker.
Petroleum Supply and Use in Washington State 26

Figure 17: U.S. crude oil refinery receipts by rail, truck and barge.
Petroleum/Crude Oil Refining in the U.S.
In 2013 the EIA reported the U.S. had 143 operable refineries with a total capacity of 17.8 million barrels per day.36 Figure 18 shows the refinery count and capacity trend from 2000 to 2013. The long-term trend in the U.S. has been towards fewer, larger and more complex refineries. In 1982 the U.S. had 301 operable refineries with capacity of 17.9 million barrels per day. During the intervening 30 years independent, smaller, and older regional refineries have closed as facility emission, refining, and fuel requirements became more challenging, leaving a smaller number of larger refineries that have continued to add refining capacity. A downside of fewer but larger refineries is when one or two are shut down for planned maintenance or due to accident, regional fuel shortages can occur and prices can spike.
36 Atmospheric crude oil distillation capacity, which is the “front end” of a refinery.
Petroleum Supply and Use in Washington State 27

Figure 18: Number and capacity of U.S. refineries, 2000 through 2013.
Transport of petroleum or crude oil in Washington
Crude oil arrives at Washington refineries by tanker, barge, railcar, as well as from Canada via the TransMountain pipeline which is owned by Kinder Morgan. In 2011, 71 percent of crude oil arrived by ship, 26 percent by pipeline and 4 percent by rail. As noted before, tight oil production, because of its remote location and rapid expansion, has limited transportation opportunities to reach west coast refineries. This caused several refineries in the Pacific Northwest to contract for rail tanker transportation and to invest in additional rail handling facilities at their sites. Two Washington refineries, U.S. Oil in Tacoma, and Tesoro in Anacortes have developed facilities for quickly offloading crude oil delivered by train from mid-continent producing regions. Each oil train transports up to 50,000 barrels of oil. The two refineries located near Ferndale, BP Cherry Point and Phillips 66, are developing plans to build facilities to accommodate oil delivered by train. The Shell refinery near Anacortes is in the process of developing plans for delivery of oil by train. An oil shipment receiving terminal at Hoquiam on the Washington coast is in the early development stage. It would be capable of receiving one train carrying midcontinent oil every two days. The largest announced project, in the early development stage, is a receiving terminal proposed by Tesoro and Savage at the Port of Vancouver, which could handle 300,000 barrels per day of oil delivered by train.37 The Hoquiam and Vancouver projects are different as they would take the midcontinent oil from the Bakken region or Canadian oil sands projects, and send the oil by tanker to other west coast refineries, Alaska and Hawaii. While transporting oil by rail has the
37 http://www.komonews.com/news/local/Vancouver-port-deciding-on-oil-train-terminal-216591201.html
Petroleum Supply and Use in Washington State 28

advantage of lower initial cost and flexibility, the long-term cost is higher than transport by pipeline and potentially riskier as oil spills are more common with rail transport.38 However, crude oil transported by rail is not assessed the five cent per barrel state fee39 that is placed on crude oil delivered by tanker or barge.
Petroleum/Crude Oil Refining in Washington State
Refineries are large, complicated production facilities that rely on chemical and physical processes to separate and convert crude oil and other liquids into refined petroleum products. The U.S. has 144 operating refineries with a combined refining capacity of 18.6 million barrels per day. In 2012, Washington state refineries had a combined refining capacity of 657,000 barrels per day, which represents about 3.5 percent of the nation’s total capacity.40 The five Washington refineries are:
• BP West Coast Products LLC: Built 1971 at Ferndale, 234,000 Barrels per day.
• Shell Oil Products US: Built 1957 at Anacortes, 149,000 Barrels per day.
• Phillips 66 Co. : Built mid 1950’s at Ferndale @ 107,500 Barrels per day.
• Tesoro West Coast: Built 1955 at Anacortes @ 125,000 Barrels per day.
• U.S. Oil & Refining Co.: Built 1957 at Tacoma @ 42,000 Barrels per day. These refineries produce more refined product than is needed by Washington State. In 2011 approximately 35 percent of the combined refinery output was sent to domestic consumers, mainly in Oregon and California. Approximately 14 percent was shipped to foreign consumers, mostly to British Columbia.41 The Chevron and Yellowstone pipelines deliver about 12 percent of the state’s refined product, serving mainly eastern Washington. A barrel of crude oil contains 42 gallons and nationally, on average, is converted into 20.3 gallons of gasoline, 13.3. gallons of diesel, 4.3 gallons of jet fuel, 1.8 gallons of liquefied petroleum gas (LPG), and 1.3 gallons of residual fuel. The remaining 4 gallons are made up of petrochemical feedstock, asphalt, and petroleum coke. The quantities of the fuels vary by refinery and the crude oil that is processed by the refinery. Because refining alters the molecular make-up and density of the crude oil feedstock, after refining there is usually about 6
38 http://www.bloomberg.com/news/2013-04-08/killing-keystone-seen-as-risking-more-oil-spills-by-rail.html 39 The fee is comprised of four cents per barrel oil spill administration fee to fund oil spill preparedness programs, and a one-cent per barrel oil spill response tax, which as of April 1 2013 has been temporarily suspended. 40 Refining capacity is measured in barrels per stream day or barrels per calendar. The numbers are barrels per stream day, which is the larger number. 41 Oregon does not have any oil refineries and is supplied primarily by refineries located in Washington and California. British Columbia has two small refineries but also has to import refined product.
Petroleum Supply and Use in Washington State 29

percent to 7 percent more volume of refined product output than crude oil input. This increase in volume is referred to as refinery gain. Figure 19 illustrates the trend in U.S. refinery output over the past twenty years. Several important trends in output, and by implication consumption, of refined petroleum products are apparent. Distillates, which are primarily represented by diesel fuel, make up about 25 percent more of the relative product share than they did 20 years ago. The gasoline share, though still the dominant refined product has declined slightly over the past five years. The shares for other major categories of refined petroleum products, such as LPG and jet fuel, have remained constant, while the percentage of heavy products represented by petroleum coke, residual fuel, and asphalt has declined slightly.42 EIA forecasts indicate the gasoline and residual fuel shares of refinery output will continue to slowly decrease, while the diesel share will continue to increase, reflecting the higher demand and market value for this fuel.
Figure 19: Trend in U.S. Refinery Yields 1993-2011.
Source: EIA, Refinery yield.
42 Low value heavy products are converted via thermal and catalytic processes to distillate, gasoline, and jet fuel.
Petroleum Supply and Use in Washington State 30
Distribution of refined products
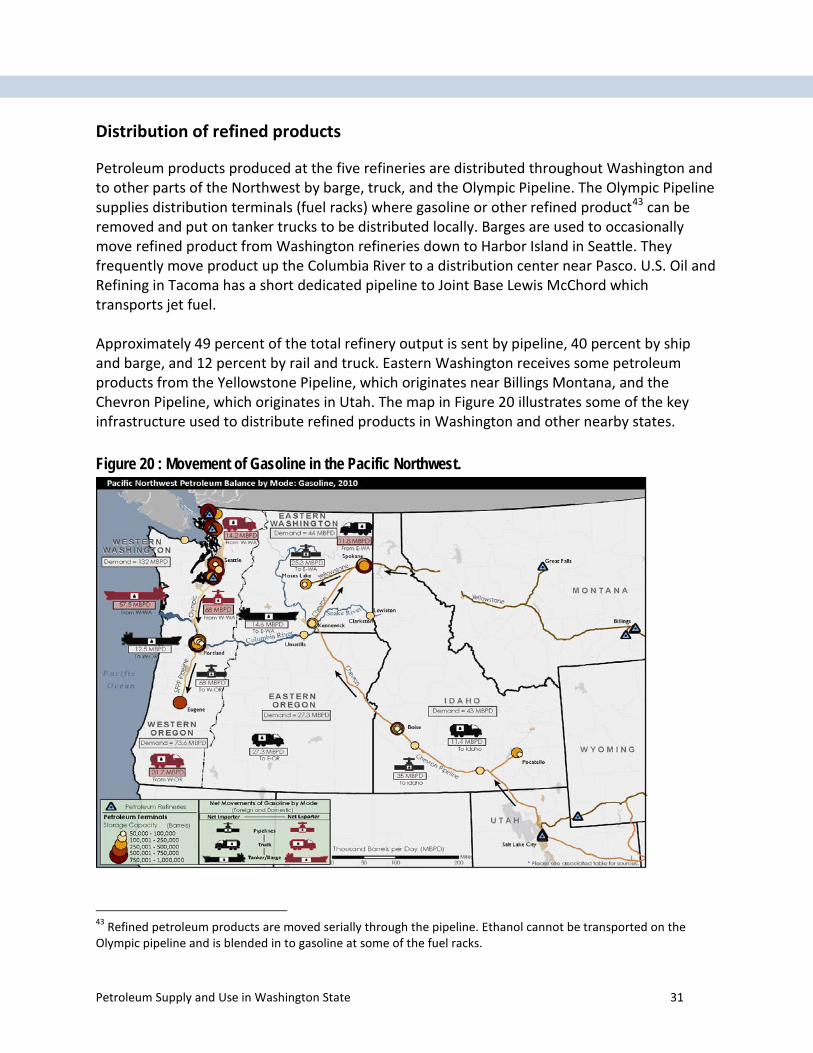
Petroleum products produced at the five refineries are distributed throughout Washington and to other parts of the Northwest by barge, truck, and the Olympic Pipeline. The Olympic Pipeline supplies distribution terminals (fuel racks) where gasoline or other refined product43 can be removed and put on tanker trucks to be distributed locally. Barges are used to occasionally move refined product from Washington refineries down to Harbor Island in Seattle. They frequently move product up the Columbia River to a distribution center near Pasco. U.S. Oil and Refining in Tacoma has a short dedicated pipeline to Joint Base Lewis McChord which transports jet fuel. Approximately 49 percent of the total refinery output is sent by pipeline, 40 percent by ship and barge, and 12 percent by rail and truck. Eastern Washington receives some petroleum products from the Yellowstone Pipeline, which originates near Billings Montana, and the Chevron Pipeline, which originates in Utah. The map in Figure 20 illustrates some of the key infrastructure used to distribute refined products in Washington and other nearby states.
Figure 20 : Movement of Gasoline in the Pacific Northwest.
43 Refined petroleum products are moved serially through the pipeline. Ethanol cannot be transported on the Olympic pipeline and is blended in to gasoline at some of the fuel racks.
Petroleum Supply and Use in Washington State 31

Crude Oil and Refined Petroleum Product Prices and Expenditures
Crude Oil and Petroleum Product Pricing
Crude oil price forecast
The EIA prepares an annual petroleum price forecast. Forecasting future oil prices is inherently uncertain as numerous factors can impact price in the short or long-term. See Appendix D for a brief discussion of forecasting challenges. To address the difficulty of forecasting decades into the future, the EIA develops a reference case and high and low crude oil price cases. The high price case incorporates a smaller and more expensive (to extract) resource base, while low price case assumes a larger and less expensive resource base. Figure 21 presents EIA’s 2013 Brent crude oil price forecast. Brent crude oil price is presented as the main benchmark for world oil prices. The West Texas Intermediate (WTI) crude oil price has recently been discounted relative to other world benchmark crude prices due to transportation constraints in the U.S. midcontinent. The EIA forecast shows prices declining slightly over the next two or three years, followed by a steady increase of a 1.5 percent per year in real dollars over the forecast time frame. The steady oil price increase is driven by increasing demand for crude oil, primarily from the developing countries, and more expensive new crude oil resources necessary to meet the new demand growth.
Figure 21: EIA Brent crude oil price forecast.
Source: EIA, Annual Energy Outlook 2013 – Note: the “High oil price” trace lies above the similarly formatted “Reference” trace.
Petroleum Supply and Use in Washington State 32

Regional crude oil pricing
Historically prices for similar grades of crude oil (similar viscosity and sulfur content) were observed to vary only slightly across North America. The difference in price was typically due to variable transportation costs. Over the past five years regional differences in prices have developed as a consequence of the rapid development of tight oil and oil sand resources in the mid-continent. A result of the rapid development is there is insufficient pipeline capacity to move the crude oil.44 This has caused prices for crude oil from the midcontinent to be significantly depressed relative to internationally priced coastal crude oil.45 Oil refineries located in or near the midcontinent pay significantly lower prices for crude oil.46 As a result, we see lower gasoline and diesel fuel prices in this region. Rail transport companies and refiners outside the midcontinent are investing in rail cars and loading-offloading facilities in order to gain access to this lower priced crude. See Appendix E for discussion and chart illustrating regional crude oil price differentials. Structure of the Petroleum Market
Unlike the electricity industry, which is highly regulated, the petroleum industry47 has a more modest amount of regulation. Most petroleum industry regulation is focused on preventing environmental contamination, safety hazards, or standardizing product quality. There are state and federal laws to discourage monopolistic behavior and price gouging in the petroleum industry, but they are infrequently triggered. Crude oil and refined products are more broadly traded commodities than electricity, and fundamental supply and demand factors are allowed to establish wholesale and retail prices. In the electric industry, utilities are regulated by utility commissions or boards that require some form of long-term least cost resource planning. There are well established wholesale electricity markets that are only lightly regulated, but investor owned utilities still own large portions of their generation assets for which return on investment is regulated and they often establish stable long-term contracts with independent power providers. The petroleum industry is less regulated and because of OPEC operates under a tight balance between supply and demand. Price and supply of petroleum and its refined products is set by the various unregulated markets into which they are sold. Consequently retail petroleum products prices are generally more volatile than retail electricity prices.
44 Infrastructure to move the natural gas associated with the tight oil is also insufficient and consequently as much as one third is being flared. 45 Crude oil that can be easily loaded and transported on large tankers is a fungible internationally traded good. Coastal refineries therefore typically pay the international price for specific grades of crude oil. 46 West Texas Intermediate (spot market) closed at $92.62 per barrel on March 12 2011, while Brent, similar quality “coastal oil”, produced in the North Sea closed at $109.65. 47 For this paper, petroleum industry includes crude oil and liquids production, refining, and retail distribution of refined products.
Petroleum Supply and Use in Washington State 33

Refined product prices in the U.S. and Washington State
The retail price of petroleum fuels is the product of the four components shown in Figure 22.
Figure 22: Component contributions to the price of gasoline: U.S. average
Source: EIA
Two components, crude oil price and refining margin48, have the greatest influence on the price and price volatility of refined products. Distribution and marketing (which includes profits) does vary a small amount throughout the year, but it makes a relatively small contribution to price. Taxes change only in response to occasional legislation or legislated schedules, and are therefore the least volatile component of overall fuel price. Figure 23 presents the time trend of weekly average retail gasoline and diesel prices for Washington State from 2003 through 2013. The U.S. average weekly gasoline price and the crude oil contribution to gasoline price (based on weekly WTI price) are also shown for comparative purposes. Several notable features are apparent in the price time trend:
• An oscillating 5 year upward trend price trend for gasoline and diesel from 2003 to July of 2008, when Washington state gasoline and diesel price peaked at $4.35 and $4.96 per gallon respectively. The price increase from January 2008 to July 2008 was particularly rapid, with gasoline and diesel increasing approximately $1.25 and $1.50 per gallon respectively.
• A very rapid 50 percent drop over about six months (July 2008 to Jan. 2009) in gasoline and diesel prices; primarily the result falling crude oil prices the consequence of the rapid economic decline in the U.S. and other developed nations.
48 Refining margin is the total cost and profits from changing crude oil into a refined petroleum product.
Petroleum Supply and Use in Washington State 34

• A steady rise in prices from Jan. 2009 to Jan. 2011 as the U.S. and other nations’ economies began to grow and crude oil prices rose, stabilizing in the $90 – 100 per barrel range.
• Washington gasoline and diesel prices are higher than the national average, in part reflecting higher state fuel taxes,49 but also the isolation of the pacific coast refined product markets from the rest of the U.S. In 2012, U.S. regular gasoline averaged $ 3.62 per gallon, while Washington regular gasoline averaged $3.82 per gallon.
• Diesel fuel prices tend to be higher than gasoline prices. Diesel has higher energy content on a volumetric basis than gasoline.
• A seasonal oscillation in gasoline price is apparent with an early summer peak, as demand increases and as the switch is made to low vapor pressure summer blend,
• Gasoline and diesel prices are more volatile than crude oil prices, illustrating the additional price volatility contributed by the wholesale refined product market.
Figure 23: Washington and US retail gasoline and diesel prices: June 2003 – May 2013
Source: AAA Fuel Gauge Report and EIA.
49 EIA table of state and federal fuel taxes: http://www.eia.gov/petroleum/marketing/monthly/pdf/mgt.pdf
Petroleum Supply and Use in Washington State 35

Expenditures on Refined Petroleum Products
U.S. expenditures on refined petroleum products
When presenting expenditure information covering several decades it is more informative to express values in constant (inflation adjusted) dollars. The expenditure figures in this document are made in constant 2005 dollars. Since the population and economy grow as well, expenditures are often expressed as constant dollars per capita or as a percent of gross domestic product (GDP) U.S. expenditures on refined petroleum products rose rapidly from the late 1990’s up to 2008 when expenditures reached 792 billion dollars. Consumption dropped in 2008 and prices also dropped rapidly during the second half of the year as the financial crisis deepened. Expenditures were down by one third in 2009, but rose in 2010 and 2011, although expressed in constant 2005 dollars, 2008 is still the peak expenditure year. It is likely, but not certain, that overall expenditures for 2012 will be slightly higher than 2011. Expressed as a percent of GDP, expenditures on petroleum products peaked during 1980-81 at 8.4 percent of GDP, while the most recent peak was 6.0 percent of GDP. On a per capita basis, expenditures reached 2466 dollars in 2011, exceeding the previous peak of 2184 dollars observed in 1981.
Figure 24: United States Expenditures on Refined Petroleum Products 1970-2011 (2005 dollars).
Source: EIA State Energy Data Systems
Petroleum Supply and Use in Washington State 36

Washington state expenditures on refined petroleum products
Expenditures on refined petroleum products in Washington State followed the same trend as seen for the entire nation. Expenditures on refined petroleum products rose rapidly from the late 1990’s up to 2008, when expenditures reached a record 16.1 billion in constant 2005 dollars. In Washington State the deep recession of 2007-09 caused a sharp drop in expenditures, but by 2011 they were at a near record billion 15.7 billion in constant 2005 dollars. It is likely that overall expenditures for 2012 were slightly higher than 2011.50 Another way to view petroleum expenditures is as a percent of state gross domestic product (GSP), or how much of total state income is directed towards the purchase of petroleum fuels in year. Petroleum expenditures as a percentage of GSP were very low during the late 1990’s and early 2000’s, then began to increase rapidly around 2004, peaking at 5.6 percent of GSP in 2008. The peak in expenditures as a percent of GSP actually occurred more than thirty years ago in 1981 at 8.1 percent of GSP. At that time, fuel prices were high and homes, businesses, cars, trucks, planes, were not yet very efficient so consumption was also high.
50 The EIA has made an early estimate that 2012 national expenditures on gasoline were higher in 2012 in both nominal and inflation adjusted dollars. Average expenditures for 2012 were $2,912 per household, or nearly 4 percent of pretax income. http://www.eia.gov/todayinenergy/detail.cfm?id=9831
Petroleum Supply and Use in Washington State 37
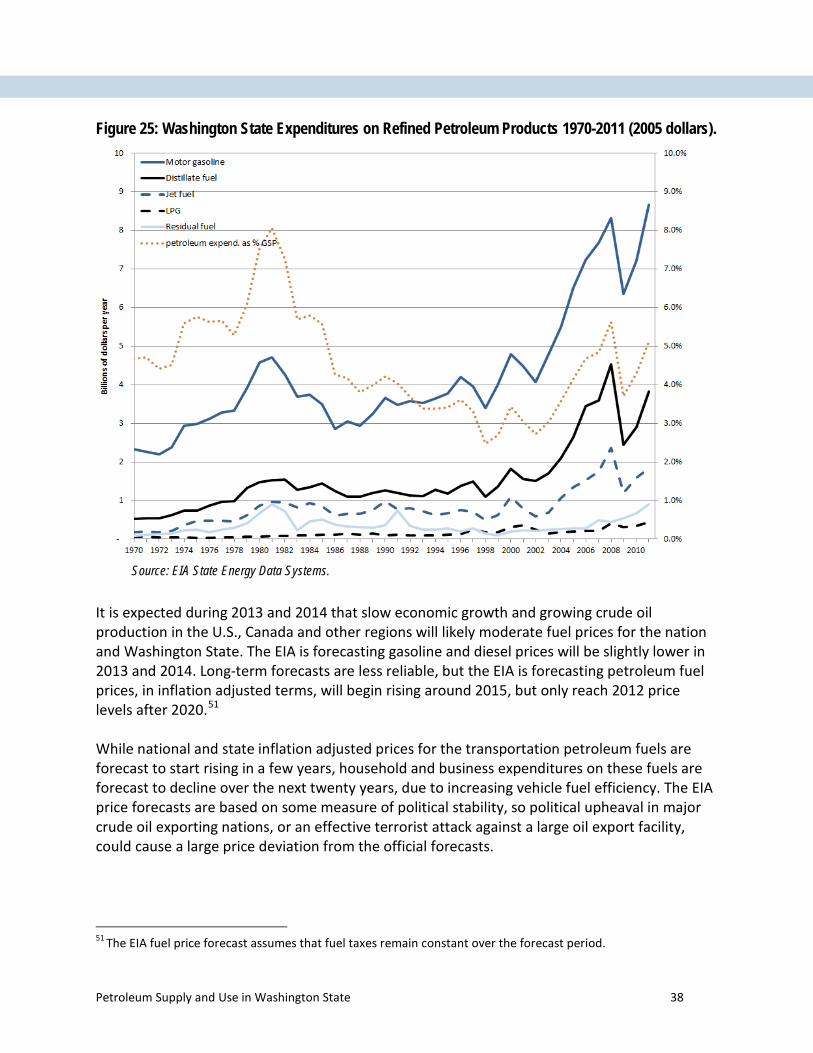
Figure 25: Washington State Expenditures on Refined Petroleum Products 1970-2011 (2005 dollars).
Source: EIA State Energy Data Systems.
It is expected during 2013 and 2014 that slow economic growth and growing crude oil production in the U.S., Canada and other regions will likely moderate fuel prices for the nation and Washington State. The EIA is forecasting gasoline and diesel prices will be slightly lower in 2013 and 2014. Long-term forecasts are less reliable, but the EIA is forecasting petroleum fuel prices, in inflation adjusted terms, will begin rising around 2015, but only reach 2012 price levels after 2020.51 While national and state inflation adjusted prices for the transportation petroleum fuels are forecast to start rising in a few years, household and business expenditures on these fuels are forecast to decline over the next twenty years, due to increasing vehicle fuel efficiency. The EIA price forecasts are based on some measure of political stability, so political upheaval in major crude oil exporting nations, or an effective terrorist attack against a large oil export facility, could cause a large price deviation from the official forecasts.
51 The EIA fuel price forecast assumes that fuel taxes remain constant over the forecast period.
Petroleum Supply and Use in Washington State 38

Causes of Price Volatility in the Petroleum Market
Crude oil pricing and price volatility in the crude oil and refined product markets
Crude oil prices are one of the most visible commodity prices in the world. There is no single price for crude oil since the quality of crudes can vary and because location can influence price as well. There are several benchmark crude oils, such as West Texas Intermediate (WTI) and Brent. Brent is a high quality crude oil extracted from United Kingdom North Sea fields. Since Brent and similar crudes can be readily loaded onto tankers and shipped inexpensively around the world, price arbitrage52 occurs for Brent and the other easily accessible and transported crudes. These crudes tend to track each other closely – shifting up or down in price at approximately the same time and rate, in response to the same market factors. In contrast, WTI or Bakken crude oil cannot easily be delivered to shippers by pipeline so their prices are somewhat independent from (and lower than) Brent or other benchmark crudes. The shortage of pipeline capacity serving sources of WTI, Bakken and Canadian oil sands crudes are a result of the recent, rapid increases in production from these sources. The transportation constraints in the North American Midcontinent, though temporary, have resulted in regional price differences and created some price volatility. Factors establish crude oil pricing
Most crude oil is purchased by refiners by contract from long term market partners. To make up a shortfall or to reduce an oversupply, oil companies can also buy or sell oil on a daily spot market. Futures markets allow oil companies to lock in prices months ahead, and offer a hedge against unexpected major fluctuations in price. A number of factors interact to establish daily spot and futures prices for crude oil.53 The EIA has a helpful, interactive, data driven graphic showing the key factors and how they interact to establish spot prices (Figure 26). Supply, demand, and inventory are the key market factors that set global oil prices. Demand for crude oil is directly linked to the demand for refined petroleum products. Critical to oil price setting is the inventory system (“Balance”) and price discovery through buying and selling of physical units and contracts (“Financial Markets”). A brief review of each is below.
52 Arbitrage is practice of taking advantage of a price difference between two or more market. Arbitrage has the effect of causing prices in different markets to converge. 53 Spot and futures crude oil prices can be tracked in real time and are posted in many financial publications and on many webpages. Options to buy or sell oil future one to six months ahead are the most actively traded and is where price discovery for the spot market takes place.
Petroleum Supply and Use in Washington State 39

Figure 26: Seven factors that influence crude oil markets
Source: http://www.eia.gov/finance/markets/
Global Crude Oil Supply
OPEC Supply
The EIA interactive graphic divides global crude oil supply into OPEC and non-OPEC categories. OPEC is an oil cartel that coordinates the production levels of its members. Its goal is to secure a steady long-term income for members and to ensure a secure supply of oil for its customers. The OPEC supply component is characterized by national oil companies (NOCs) of the member nations. OPEC produces about 40 percent of the world’s crude oil and, more importantly, 60 percent of the internationally traded oil. OPEC intentionally maintains a small amount of excess production capacity, currently at about 5 percent of global production, to respond to production crises and help moderate price spikes. During 2004-08, when crude oil prices were both volatile and increasing, global spare production capacity was generally under 2.5 percent, insufficient to prevent the price spikes that arise from production shortfalls or market speculation.
Non-OPEC Supply
The non-OPEC supply component represents the rest of the world’s crude oil production and is undertaken by a mix of NOCs and independent oil companies (IOCs). Examples of IOCs are British Petroleum, Shell, Chevron-Texaco, and Exxon-Mobil. The IOCs and non-OPEC NOCs do not coordinate their activities nor maintain any spare production capacity. They seek primarily
Petroleum Supply and Use in Washington State 40

to increase shareholder value and make investment decisions based on economic factors. The IOCs tend to capitalize on fluctuating, marginal demand for oil; have higher crude oil discovery and extraction costs; and often work as partners with non-OPEC NOCs. It is the IOCs that are developing resources in the Canadian oil sands, the Bakken formation, and the deep water of the Gulf of Mexico.54
Balance (Inventory)
The balance block represents various crude oil and refined product inventories. Inventories are crucial to managing the transport and processing of crude oil and marketing refined products. The EIA frequently reports national crude, gasoline, and diesel inventories. Other OECD countries’ energy offices, and private entities, provide inventory reports as well. These reports reflect how well balanced the crude and refined product markets are at a given time. If inventories are unexpectedly low, prices generally raise - if unexpectedly high, then prices generally fall.
Demand for Crude Oil
OECD Demand
Demand is the other side of the equation. Developed nations are categorized in the graphic as member nations of the OECD. This organization represents 26 nations including the U.S., the E.U. nations, Japan, and a number of other developed nations. These nations have slowly growing or declining populations, and their economies are generally slow growing. OECD countries tend to have higher per capita levels of vehicle ownership, freight movement, and air travel compared to developing nations. While the per capita level of crude oil use55 is high in the OECD, the overall level of consumption is slowly declining. Declining crude oil consumption in the OECD is primarily driven by ageing populations, consumer reactions to high crude oil prices, increasing vehicle fuel economy, and climate policy actions.
Non-OECD Demand
Developing nations are represented by the non-OECD category and are responsible for about half the world’s petroleum consumption. Population and economic output are rising rapidly in the developing world. Levels of vehicle ownership, freight movement, and air travel are rising rapidly; consequently demand for refined products, and ultimately for crude oil, is rising rapidly. With demand flat or slowly declining in the OECD nations, all forecast global demand
54 The Chinese national oil companies have become very active in oil project developments and acquisitions around the world. They have ready access capital, are willing to take risk, and accept relatively modest returns on investment in order to secure supply. 55 Crude oil is not directly consumed by individuals or most businesses; rather it is the refined products derived from crude oil that are consumed by individuals or most businesses.
Petroleum Supply and Use in Washington State 41

growth for crude oil will come from the developing nations. Change in non-OECD consumption is watched closely by forecasters and the financial markets.
Financial Markets
Spot prices for different grades of crude oils are established in the financial markets where participants not only buy and sell physical units of oil, but also trade contracts for future deliveries and other energy derivatives. The futures and derivatives markets involve a diversity of participants:
• Oil producers who may hedge against the risk of a sudden decrease in oil prices;
• Refiners and airlines who may hedge against a sudden increase in price;
• Banks, investors, and hedge funds investing in oil futures, and energy derivatives to diversify their portfolios; and
• The buying and selling of crude oil futures contracts is the price discovery process that incorporates all the information and expectations of market participants and helps establish the daily spot market price for oil.
Market participants closely follow news about supply, inventory, future projects, and demand on a daily basis. A reduction in OPEC production targets or an accident at a major shipping terminal impact perceptions of near-term supply and alter the spot price of oil. Recent reports on the rapidly growing production in the Bakken and Eagle Ford formations in the U.S. have put modest downward pressure on global oil prices.
On the demand side, market participants closely follow economic and other news to gauge whether future crude oil demand will rise or fall, or deviate from forecasts. Recent reports on poor economic performance in the E.U. signal a modest reduction in crude oil demand in Europe and puts slight downward pressure on prices. During 2002-08, as a consequence of rapid economic development, consumption in non-OECD nations, and particularly in China, rose more rapidly than expected, which put upward pressure on crude oil prices for an extended period of time.
Crude oil price volatility
Price volatility in the crude oil market can be either short-term, meaning days to weeks, or long-term, meaning months to years in duration. Short-term price volatility is often caused by unexpected declines (or increases) in crude oil supply or inventories. Examples of factors causing short-term price volatility are severe hurricanes that disrupt production and transport in the Gulf of Mexico, conflict in key producing nations such as Libya in 2011, or oil field worker strikes in the North Sea production fields.
An example of a factor that caused longer-term price volatility is the recession of 2007-09 which resulted in a more than 70 percent drop in WTI price between July 2008 and January
Petroleum Supply and Use in Washington State 42

2009. Setting the stage for rapid price decline in 2008 was the larger-than-forecast increase in crude oil demand between 2003 and 2007 which resulted in steady price escalation during that period. Figure 27 illustrates the long-term price trends of petroleum, natural gas, coal and electricity. To compare the different fuels, prices are expressed as constant 2005 dollars per million British Thermal Unit (annual price). Petroleum is the most volatile of the four fuels.
Figure 27: Comparison of long-term price trends for four fuels in Washington State.
Refined product price and price volatility
The price and price volatility seen in refined petroleum products is heavily influenced by the crude oil price and price volatility. However, the refined products market, though directly linked to the crude oil market, experiences separate and unique price pressures. The refined product market is more regional in character and impacted by changes in regional production or supply. Our west coast refined product market is an example of an isolated market which can, for short periods of time, experience price volatility independent of other national or global refined product markets. During 2012, a series of unexpected refinery events impacted regional supply of refined product. These unexpected events caused a sharp increase in wholesale prices which quickly manifest itself as higher retail prices for gasoline and diesel. The sequence of events is shown in the following time series chart showing average daily price for gasoline in Washington, California, and the U.S. A fire in mid-February at the BP refinery located at Cherry Point took the facility offline for several months. There is little petroleum
Petroleum Supply and Use in Washington State 43

product transportation infrastructure between the west coast and the rest of the U.S.; and supply from the Asian refining centers could not reach the west coast for several weeks. As a result, supply was constrained and prices rose on the west coast without rising substantially elsewhere. When the BP refinery failed its planned restart in May, regional refined product prices rose again at the wholesale and retail levels. A fire at a California refinery in early August and a power outage that forced another refinery to shut down two months later caused west coast refined product prices to increase rapidly during the August and October when they were more slowly increasing or declining in the rest of the country.56
Figure 28: Retail, regular gasoline prices over nine months in Washington (red), California (green), and the U.S. average (blue).
Data and graphics: gasbuddy.com. Source: GasBuddy
Price volatility at the retail level is less common and usually occurs at the sub-regional level. This kind of volatility can be caused by bad weather preventing local fuel deliveries, or power outages that render pumps at fueling stations inoperable. The shutdown of a distribution pipeline can also result in volatile and elevated retail prices at the sub-regional level.
56 California gasoline price was nearly 81 cents per gallon more than the national average on October 8 2012.
Petroleum Supply and Use in Washington State 44

Regional price differentials
Retail prices for gasoline and diesel can vary significantly within a relatively small region such as Western Washington, even though retailers have access to fuels from the same refineries. A 2007-08 study by the Washington State Attorney General’s Office and the Department of Commerce examined the factors that influence gasoline and diesel pricing, particular factors contributing to regional price differentials. The study found that regional price differentials were partially explained by differences in wholesale prices, and to a larger degree by retail supply cost and retail competition. Regions or cities with higher wholesale prices tended to have higher transportation costs built in. Retail supply costs were higher in some locations like Seattle and Bellevue due to higher land, rental, and wage costs. The lack of retail competition in several areas was observed to partially account for higher regional or local fuel prices. The presence of many fuel hyper-marketers (Costco, Safeway, etc.) in a region resulted in lower retail prices. The city of Bellingham was observed to have high fuel prices, which may have been due to its proximity to the Vancouver British Columbia metropolitan area where fuel prices were approximately 20 percent higher.
Petroleum Supply and Use in Washington State 45

Greenhouse Gas Emissions Associated with Petroleum Consumption Over the past 20 years about three-quarters of human-caused emissions of greenhouse gas (GHGs) have come from burning of fossil fuels for energy purposes.57 Approximately two-thirds of GHG emissions are CO2 emissions associated with energy production and use; reflected by the categories: buildings, transport, industry, energy fuel flaring, fugitive methane, and energy production and conversion.
Figure 29: Annual global greenhouse gas emissions. 1970-2010 in billion metric tons of CO2 equiv.
Source: International Panel on Climate Change
In the 2013 International Energy Outlook, the EIA forecasts that global energy related CO2 emissions will increase from 32 million metric tons (MMT) in 2010 to 41.5 MMT in 2030. The petroleum shares of global energy related CO2 emissions are 36 percent and 32 percent in 2010 and 2030 respectively.
57 The rest is from agriculture, industrial processes, waste management, and burning of forest to clear land for grazing or agriculture.
Petroleum Supply and Use in Washington State 46

United States petroleum related CO2 emissions
The United States produced about 18 percent of the world’s energy-related CO2 in 2010.58 The national emission trend since 2007 has been flat to slightly declining, while global energy-related CO2 emissions have been increasing rapidly as developing nations industrialize. In 2012, U.S. energy-related CO2 emissions were 5,272 million metric tons, 730 million tons less than the peak year of 2007, and about the same emission level as seen in 1996. The factors associated with the decline in CO2 emissions are some of the same factors that caused the decline in fossil fuel consumption:
• lingering effects of the severe recession of 2007-2009,
• consumer reaction to higher petroleum prices,
• and low natural gas prices and renewable energy development displacing some coal fired electric generation.
Figure 30 illustrates the monthly U.S. CO2 emissions from petroleum, coal, and natural gas for 2007-12. The EIA forecast for 2013 and 2014 is included. Petroleum emissions decline from the peak levels of 2007, then remain the same for 2012-14. Coal CO2 emissions also declined during 2007-2012, but are forecast to recover slightly in 2013-14. Natural gas CO2 emissions gradually rise during 2007-12, and are forecast to stabilize during 2013-14, as higher natural gas prices shift some electricity generation back to coal. Petroleum remains the largest source of energy related CO2 emissions. Coal and natural gas emissions show consistent seasonal variation. Natural gas CO2 emissions have a strong winter peak (heating and electricity generation), and a smaller summer peak (electric generation to serve air conditioning load). Coal CO2 emissions exhibit similar sized winter and summer peaks, because coal generation is more concentrated in parts of the country with lower electric heat demands and higher air conditioning demands. Petroleum CO2 emissions don’t exhibit a distinct winter or summer emissions peak, though gasoline use does tend to peak in the summer and heating oil use in the winter.
58 The last year of comparable data.
Petroleum Supply and Use in Washington State 47

Figure 30: U.S. Monthly CO2 Emissions by Fuel, 2007-12 and 2013-14 forecasts.
Source: EIA, Monthly Energy Review.
Of the 5,272 million tons of energy-related CO2 emissions in 2012, 2,244 million tons, or 42.6 percent, were associated with petroleum consumption. Most of U.S. petroleum consumption takes place in the transportation sector.59 In AEO 2013, the EIA forecasts that energy-related CO2 emissions will not return to their 2005 levels until 2040. The forecast calls for petroleum energy-related CO2 emissions to slowly decline until about 2035 when they will represent 39 percent of national energy CO2 emissions. Washington State petroleum related CO2 emissions
The Washington Department of Ecology inventoried Washington State greenhouse gas emissions in 2008, tallying 101 million metric tons, a 2.4 percent decrease from 2007, and an 8.8 percent increase from 1990. The state’s inventory will be updated shortly and it is expected that reported greenhouse gas emissions will be lower for 2010. The EIA reported Washington State energy related CO2 emissions of 79.6 and 76.1 million metric tons in 2008 and 2010 respectively. Peak emissions of 83.6 million metric tons were observed in 1999, while 1990 emissions were 70.5 million metric tons. The related CO2
59 Cars, light trucks, heavy-duty trucks, airplanes, railroad locomotives, and ships.
Petroleum Supply and Use in Washington State 48

emissions, like overall national emissions, are sensitive to the severity of the winter, which drives heating demand, but are influenced by the relative abundance of hydroelectricity, which varies with the snowpack. Because of the large share of hydropower in the electric sector, the Washington state emissions profile differs from the national profile. Consumption of refined petroleum products accounted for 51.5 million metric tons or 68 percent of Washington’s energy related CO2 emissions as illustrated in Figure 31; compare this with a 42 percent share nationally. In 2010 the transportation sector represented 55 percent of the state’s energy related CO2 emissions versus a 33 percent national share. The Washington State Energy Strategy reported,60 because transportation fuel use is responsible for such a large share of the state’s energy related CO2 emissions efforts to reduce emissions will have to focus on the transportation sector. Figure 31: Washington State energy related carbon dioxide emissions 1960-2010.
Washington State has not produced an official greenhouse gas or CO2 emission forecast recently. There is a forecast in the AEO2013 for the Pacific region, which can be considered a close proxy for the state. The forecast presents a decline in petroleum energy-related CO2 emissions through 2030.
60 2012 Washington State Energy Strategy: http://www.commerce.wa.gov/Documents/EO2012WAEnergyStrategy.pdf
Petroleum Supply and Use in Washington State 49

Alternative Fuels and Technology to Replace Petroleum Products Petroleum has been the largest source of fossil fuel energy in the U.S. since 1950 and the primary transportation fuel for nearly a century. Because of petroleum’s versatility, ease of storage, energy density, and affordability demand for it steadily increased through the 20th century. During the 1970’s and 80’s, and the first decade of the 21st century, the price of petroleum and its refined products increased significantly. A number of other challenging aspects of continued reliance on petroleum such as high greenhouse gas emissions, impact on state and national balance of trade, and energy security implications have combined with the increased price pressure to push the nation towards seeking alternatives to petroleum. Several uses of petroleum products have been reduced or phased out over the past forty years as price has increased. For instance, petroleum is now rarely used to generate electricity61 and it has been replaced to a significant degree in the industrial sector, and has been largely replaced by natural gas as a home heating fuel. However, in the transportation sector it has been much more difficult to find replacements for petroleum as it has several advantages over competing fuels and technologies. Petroleum’s chief advantages are:
• Provides vehicles with ample range.
• An established fueling infrastructure.
• Ability to rapidly and conveniently refuel.
• Reluctance of auto manufactures to abandon the mature and relatively low priced internal combustion engine (ICE).
• High energy density and convenience of refined liquid petroleum products. (Figure 32)
• General public satisfaction with ICE powered vehicles.
61 In the electric sector, oil is primarily used as an emergency backup fuel at natural gas fired electric generation plants.
Petroleum Supply and Use in Washington State 50

Figure 32: Energy density of several transportation fuels62.
Source: EIA Today in Energy, Feb. 14, 2013.
This figure illustrates one of the key challenges of alternative transportation fuels. Relative to gasoline and diesel, alternative fuels such as hydrogen, electricity, and compressed natural gas have either lower energy content per unit volume, lower energy content per unit weight, or both. Ethanol, biodiesel, liquefied natural gas, and compressed propane offer reasonably competitive energy densities. Battery energy densities are very low relative to gasoline, but the much higher efficiency of electric motors relative to gasoline powered engines and the benefits of regenerative braking compensate for this to a degree. Despite challenges, over the past thirty years several possible replacements for petroleum transportation fuels and the internal combustion engine have emerged, including (but not limited to) the advantages and disadvantages listed in Table 3.
62 The chart indicates that a replacement fuel is desirable if it has energy content per unit volume that is close to or equal to gasoline. None of the replacement fuels meets this criteria, especially the cost of the storage systems is taken into account.
Petroleum Supply and Use in Washington State 51

Table 3 : Advantages and disadvantages of alternative transportation fuels and technologies.
Alternative transportation fuels and technologies
Advantages Disadvantages
1. Battery electric vehicles (BEV) High efficiency, low fuel cost, potentially low GHG emissions
Limited range, long charge time, high initial cost, heavier vehicle
2. Plug-in hybrid electric vehicles (PHEV)
Two fuels, adequate range, potentially low GHG emissions
High initial cost, more complex than BEV, heavier vehicle
3. Biofuels Drop-in fuel, potential GHG reductions, displacement of imports
Limited scale, price and technology challenges
4. Compressed natural gas (CNG) Low fuel cost, lower but adequate range
Limited fueling infrastructure, more expensive vehicle
5. Liquefied petroleum gas (LPG, or “propane”)
Slightly lower fuel cost, lower but adequate range
Limited GHG reduction and fueling infrastructure, LPG in part derived from petroleum
6. Gas-to-liquids or coal-to-liquids Direct substitute for existing fuels, abundant feedstock
Capital intensive, not currently price competitive, high GHG emissions
7. Hydrogen fuel cells Lower but adequate range, higher efficiency
Very limited fueling infrastructure, more expensive vehicle, GHG reductions not guaranteed
Many of the substitute fuels or alternative transportation technologies will face challenges as they either require expensive new infrastructure or lack the energy density to directly substitute for gasoline or diesel. High cost of vehicle ownership associated with the smaller production runs of emergent fuel and vehicles also presents a hurdle for most of the options. The two most likely, long-term substitutes for petroleum based transportation fuels are biofuels, which can be blended with conventional liquid fuels and used in today’s advanced internal combustion engines, and electricity, which can used to propel a BEV or PHEV. Considerable federal and state support is already in place for these two options. Appendix F illustrates the combinations of battery price and fuel cost necessary for BEVs to compete with or replace conventional vehicles.
Petroleum Supply and Use in Washington State 52

Recent Policy Directions
Federal policies
Federal efforts to reduce consumption of petroleum based transportation fuels. The key efforts include, but are not limited to the following:
• Corporate Average Fuel Economy (CAFE) standards for light duty vehicles. Updated in 2007 and 2012 the CAFE standards by EPA and the National Highway Transportation Safety Administration (NHTSA) will lead to roughly a doubling in light duty vehicle fuel economy between 2005 and 2025.
• Medium and Heavy Duty Vehicle Fuel Economy (MHDFE) and GHG standards. Developed out of the Energy Independence and Security Act (EISA) of 2007, and adopted in 2011, the MHDFE standards set targets of a 15 percent improvement in heavy duty pickup truck fuel economy and a 7 percent to 20 percent improvement for class 3 to class 8 commercial trucks.
• Renewable Fuel Standard (RFS). The RFS was updated by EISA in 2007. Aggressive renewable fuel goals were set with a target of 36 billion gallons by 2022, 21 billion gallons of which were to be advanced biofuels, such as cellulosic ethanol. Technical obstacles have prevented the RFS advanced biofuels goals from being achieved.
• Federal incentives to promote early adoption of electric vehicles. Tax credits ranging from $2500-$7500 per vehicle, depending on battery size, are available to purchasers of electric vehicles such as the Nissan Leaf and Chevrolet Volt. The tax credits are phased out after each manufacturer achieves cumulative electric vehicles sales of 200,000.
State policies
State efforts to reduce consumption of petroleum based transportation fuels. The key efforts include, but are not limited to the following:
• Purchasers of BEVs are allowed a sales tax exemption of up to $2500.
• Washington is participating in the West Coast Green Highway initiative by installing chargers along I-5 and I-90 for electric vehicles.
• Washington State Ferries is required to use a minimum of 5 percent biodiesel in its ferry fleet.
• Effective June 1, 2013, all state agencies and local governments are required to satisfy 40 percent of their fuel usage for publicly owned vessels, vehicles, and construction equipment with electricity or biofuel.
• The Energy Freedom Program was established in 2006 under E3SHB 2939 to, “promote public research and development in bioenergy, and to stimulate the construction of facilities in Washington to generate energy from farm sources or convert organic matter into fuels. In 2006, the Legislature provided a Capital Budget appropriation of $23
Petroleum Supply and Use in Washington State 53

million, including $17 million to WSDA for a low-interest loan program, and $6 million to the Washington State Department of Department of Commerce for a designated grant.
• Washington State continues to support the Commute Trip Reduction program, the Growth Management Act, and better transportation systems management. These strategies reflect efforts to reduce vehicle miles traveled, which is another approach to reduce consumption of petroleum products.
• Washington State recently passed legislation allowing car sharing and mileage based insurance.
• Washington State has evaluated the effectiveness of a Low Carbon Fuel Standard, carbon tax, VMT fee, vehicle feebates, and congestion fees.
Petroleum Supply and Use in Washington State 54

Appendix A: Common energy units Petroleum consumption and production is often present in volumetric units of barrels. For historical reasons the oil barrel contains 42 U.S. gallons and is abbreviated as “bbl”. Europeans and most of the rest of the world use SI units of cubic meters (m3), but more often the mass based unit of measure of metric tons. Petroleum consumption and production can also be presented in energy units. In the U.S. the unit used is the British Thermal Unit (Btu), the amount of energy required to heat one pound of water by one degree Fahrenheit at a constant pressure of 1 atmosphere. A barrel of crude oil has an energy content of 6 to 7 million Btu (MMBtu), depending on the type of crude, while a gallon of gasoline and diesel contains 0.120 and 0.135 MMBtu respectively. Most of the rest of the world uses SI units of joules, with 1055 joules equaling one Btu. To get a sense of scale, in 2011 total global energy consumption was 536 quadrillion Btu (QBtu), while the U.S. consumption was 97.4 QBtu, and Washington consumed 1.65 QBtu.
Petroleum Supply and Use in Washington State 55

Appendix B: Brief overview of ‘Peak Oil’ Peak oil theory
Peak oil is the point in time when the maximum rate of petroleum extraction is reached, after which the rate of production is expected to enter terminal decline. Global production of oil fell from a high point in 2005 at 74 million barrels per day, but has since rebounded setting new records in both 2011 and 2012. There is active debate as to when global peak oil will occur, how to measure peak oil, and whether peak oil production will be supply or demand driven. The first sophisticated model of peak oil production was developed by M. King Hubbert, who, based on estimated resource size, discovery rates, and extraction rates, predicted that peak U.S. oil production would occur between 1965 and 1970. Many petroleum experts were surprised when the actual U.S. peak was reached in 1970. Hubbert also attempted to forecast global peak oil production and came up with a dates of 1990 to 1995. Global peak oil proved much more difficult for Hubbert to determine since many parts of the globe were not as geologically well explored as the U.S. and thus the ultimate size of the petroleum resource could not be easily approximated.
The case for near-term peak oil production
There is an ongoing debate in the energy industry as to whether there are adequate crude oil supplies to sustain increasing global consumption levels over the next 20 to 30 years. Peak oil advocates note global petroleum discoveries have been trailing global petroleum consumption for most of the last 30 years, and that many of the most productive fields in the Middle East are more than 50 years old and production is being sustained by more advanced and expensive extraction techniques. The basic mathematical underpinning of the peak oil theory is fairly simple and primarily dependent on estimates of the recoverable resource, consumption rates, and field decline rates. Peak oil advocates generally have not attached merit to the resource potential of less conventional petroleum sources such as heavy oil, oil sands, deep-water, oil shale, or alternative sources of liquid fuels such as (natural) gas-to-liquids, or coal-to-liquid techniques. They also assume oil price and technological advances will not substantially alter the amount of recoverable oil. Some of the advocates believe because of the huge development costs, these unconventional resources will only be pursued in a large scale manner after conventional oil production peaks and petroleum prices are sustained at very high levels. Many of the advocates are former petroleum engineers or geologists and are therefore familiar with the petroleum industry and technology. Association for the Study of Peak Oil website: www.peakoil.net/
Petroleum Supply and Use in Washington State 56

The case against near-term peak oil production
Others in this debate believe that significant quantities of conventional oil are yet to be discovered and that the reason discoveries have lagged consumption since around 1980 is because low prices have limited the incentive for oil exploration. Recent history has illustrated that higher petroleum prices and technological advances are contributing to an expanding resource base both through new discoveries and additions to existing fields. These optimists think new technologies, such as 3-D seismic, horizontal well drilling, and enhanced oil recovery technologies, such as hydraulic fracturing and carbon dioxide injection, will greatly add to the amount of crude oil that can be found and recovered. They also believe unconventional oil resources will add significantly to global production over the next 20 to 30 years. Ultimately optimists believe the peak oil theory is flawed, since it restricts the ultimate recoverable amount of petroleum. Historical experience has shown the opposite - that the resource base continues to expand. This anti peak oil group includes representatives from large and very skilled organizations such the Energy Information Administration, and the International Energy Agency, as well as representatives of several national and public oil producing entities. EIA petroleum analysis website: http://tonto.eia.doe.gov/dnav/pet/pet_pub_top.asp The recent consensus is there are adequate crude oil and other liquid fuel supplies for at least 10, and perhaps for 20 years. This does not mean oil prices will be low or even ‘affordable’ or stable as strategic behavior by OPEC, or political turmoil in the Mideast or Russia, could rapidly remove supply from the market even though the capacity to produce oil still exists. Poor resource management, as seen in Venezuela, could also reduce global production capacity.63 Rapid demand growth, as seen in China and much of the developing world, will continue to put upward pressure on petroleum prices.
Political Peak Oil
Forecasts by the EIA and IEA often assume an orderly development of petroleum and natural gas resources. This may be an idealized view, as many political and cultural barriers may prevent orderly resource development. Political Peak Oil, while far from a certainty, might be considered a special sub-case of peak oil.
63 Lower global production and higher prices due to cartel decisions, social instability or suboptimal resource development plans and could be referred to as “Political Peak Oil”.
Petroleum Supply and Use in Washington State 57

The following are examples of political factors that limit petroleum production.
• Cartels such as OPEC can limit production rates and increase global petroleum prices.
• Mexico has a constitutional amendment that prevents the state oil company PEMEX from entering into development contracts with other oil companies, which has limited its ability to develop deep-water petroleum resources.
• Venezuela and Russia have massive hydrocarbon resources, but government mismanagement and the lack of rule of law has prevented these countries from fully developing their resources.
• Iran’s nuclear program has resulted in sanctions by the U.S. and Europe and has diminished both exports and resource development.
• An extreme, but unlikely scenario would be a fundamentalist, anti-western takeover of Saudi Arabian oil production, resulting in reduced exports and much higher global petroleum prices.
Peak Demand, an alternative to Peak Oil.
The peak oil theory was developed many decades ago by petroleum geologists and consequently is primarily focused on geological constraints on petroleum production. An alternative is Peak Demand, where the geological and economic limits of petroleum production are not reached, but because of the anticipated leveling off of global population and income growth by 2050, and the rapid development of less expensive energy substitutes, global demand for petroleum may peak and then decline. Plausible energy substitutes for petroleum could be electricity, energy efficiency, biofuels, or natural gas. New York Times article: http://dotearth.blogs.nytimes.com/2013/07/10/more-signs-of-peak-us-in-new-study-of-peak-oil-demand/ Environmental Science & Technology article: http://pubs.acs.org/doi/abs/10.1021/es401419t
Petroleum Supply and Use in Washington State 58

Appendix C: U.S. Liquid Fuel Prodcution Forecast The chart shows the U.S. liquids fuel production forecast 2013 through 2040. The data is from AEO2013 and includes all liquid fuel production. It includes crude oil production, which is composed of lower 48 state conventional, off-shore, Alaska, tight oil, and enhanced oil recovery. It also includes liquids from natural gas production, such as natural gas liquids and lease plant condensate. Unconventional resources such as liquids fuels from biomass (ethanol, biodiesel, etc.), and other liquids (natural gas to liquids and coal to liquids) are also included. Finally total liquids include refinery gains, the volumetric increase that occurs during the refining process.
Petroleum Supply and Use in Washington State 59

Appendix D: Challenges Forecasting Petroleum Resources, Supply, Demand and Prices Organizations such as the EIA, the International Energy Administration, the National Research Council, and companies such as British Petroleum and Exxon-Mobil make short to long-term energy forecasts. These forecasts are based on large integrated economic and technology driven models that attempt to predict energy supply, demand, and prices anywhere from a couple to thirty years in the future. The forecast models require assumptions regarding trends in future population, economic growth, technological development, and hydrocarbon resource size. Experts are consulted to establish the forecast parameters in each of these fields of focus. Despite years of experience, refinement, and input from experts, their energy forecasts have been found to frequently be inaccurate over the long-term. The EIA has conducted a respective analysis of their Annual Energy Outlook (AEO) covering twenty years of reports from 1993 through 2012, where they compare forecast reference case values for energy prices, expenditures, and consumption with actual values: http://www.eia.gov/forecasts/aeo/retrospective/pdf/retrospective.pdf. To get a sense of the deviations between AEO forecast and actual outcomes, we present two tables. The first compares forecast and actual refiner acquisition costs for crude oil, the second compares forecast and actual petroleum consumption.
If we look at the top half of the first table, and compare the column of forecast crude prices for a particular year with the actual value at the bottom of the table, we see that the forecasts are relatively accurate through 2003. The exception is 1998, which was the year of the Asian economic crisis that happened to coincide with a late 1997 OPEC decision to increase oil production. After 2003, the average difference between forecast and actual price becomes larger. This partly because the forecast prices in the later years of 2005 -2011 represent the end of long-term forecasts for the earlier AEO reports. The relatively recent AEO2007 report forecast an average refiner acquisition crude oil cost of $54.84 (nominal dollars) in 2011 versus an actual cost of $102.7.
Petroleum Supply and Use in Washington State 60

The second table, covering total petroleum consumption, illustrates that forecasting petroleum consumption is easier than forecasting crude oil prices. Looking at the bottom line of the lower half of the table, one can see that the percent difference between the forecasts and actual consumption for a given year hovered around 2 percent until 2008, when it jumped to 9.8 percent. In 2008, this was largely due to the recession that began at the end of 2007. By 2011, the effects of higher fuel prices and federal legislation requiring vehicles that are more efficient was contributing to the forecasting error.
Petroleum Supply and Use in Washington State 61
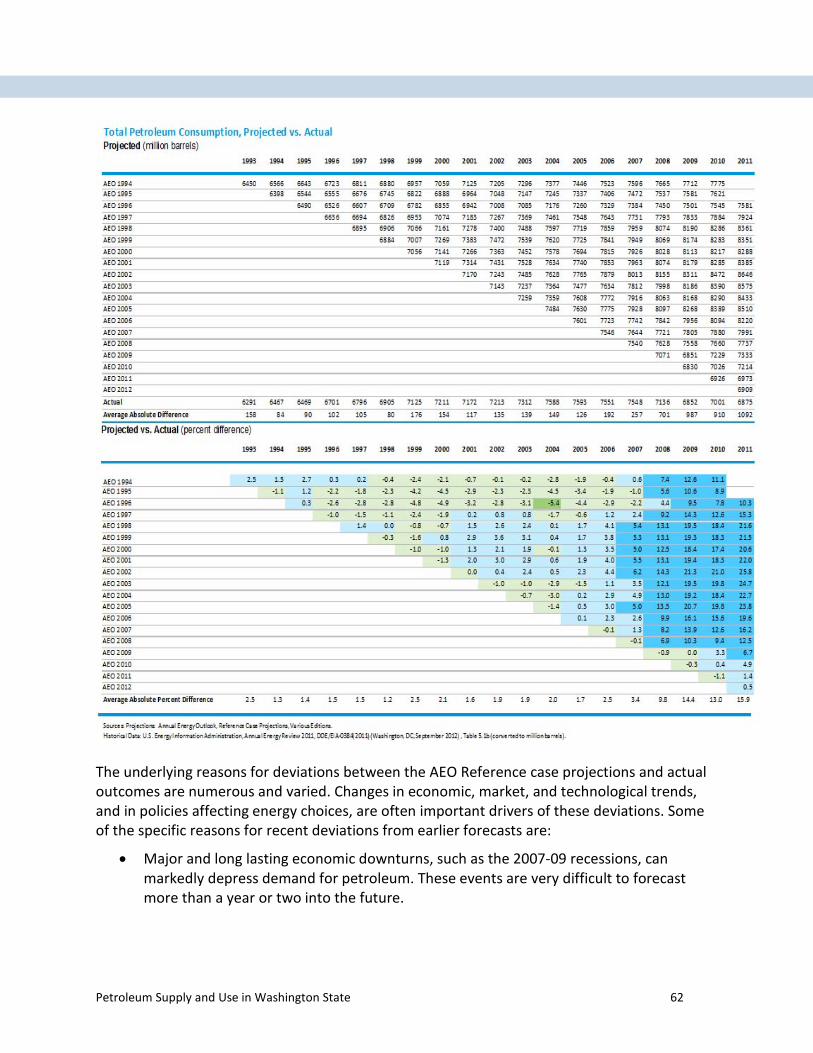
The underlying reasons for deviations between the AEO Reference case projections and actual outcomes are numerous and varied. Changes in economic, market, and technological trends, and in policies affecting energy choices, are often important drivers of these deviations. Some of the specific reasons for recent deviations from earlier forecasts are:
• Major and long lasting economic downturns, such as the 2007-09 recessions, can markedly depress demand for petroleum. These events are very difficult to forecast more than a year or two into the future.
Petroleum Supply and Use in Washington State 62

• The rapid economic growth in the developing world and consequent increase in demand for petroleum. The EIA and other forecasters were slow to grasp the extent of the increase in demand for petroleum in the developing world.
• Long response time for oil companies, who only brought more production capacity on-line several years after price of petroleum began to rise in the early 2000’s. New projects that the oil companies undertake have very high costs, so these companies must be certain that future prices will support the projects. Once the decision is made the lead times on the projects can be 5 to 10 years.
• Failure to fully anticipate the extent of the new resource available due to technological changes. Forecasters are still making adjustments to their resource estimates and supply forecasts to incorporate the new tight oil and natural gas resources, in the U.S. and around the world, that are now available because of advanced 3D seismology, horizontal drilling, and advanced hydraulic fracturing techniques.
• Higher fuel prices have made it politically feasible to adopt higher vehicle fuel economy standards which is reducing U.S. demand from levels forecast only five years ago.
• Concerns about climate change may provoke taxes or consumption caps on fossil fuels.
Petroleum Supply and Use in Washington State 63

Appendix E: Crude Oil Price Differentials. Over the past three years increasing U.S. and Canadian crude oil production combined with transportation constraints in the mid-continent have resulted in significant crude oil acquisition cost (price) differentials between refineries on the coasts and those located in the interior of the U.S. The figure shows the refiner acquisition cost of crude oil from 2009 through mid-2013. It illustrates two phenomena; the steady increase in crude oil price from 2009 through 2011, and the increasing price differential for crude oil between west coast refineries and Midwest and Rocky Mountain refineries (east coast refiner acquisition costs are similar to west coast costs). The west coast refineries, which receive a majority of their crude oil by tanker, are paying the global price for crude oil, while the interior refineries, due to a relative over-supply of crude oil in the mid-continent, are able to purchase at a relative discount.
Refiner Acquisition Cost of Crude Oil: 2009-13
Source: Energy Information Administration, http://www.eia.gov/dnav/pet/pet_pri_rac2_dcu_nus_m.htm
Petroleum Supply and Use in Washington State 64

Appendix F: Electric vehicle competitiveness battery cost vs. gasoline price
Petroleum Supply and Use in Washington State 65


