Pertemuan VIII Analisis Proses Kualitatif · Yudha Saintika, S.T., M.T.I (YUS) Sub Capaian...
25
Pertemuan VIII Analisis Proses Kualitatif Bisnis Proses Fundamental [IS611083] Dosen Pengampu: 1. Dwi Mustika K, S.Kom., M.Kom (DMK) 2. Yudha Saintika, S.T., M.T.I (YUS)
Transcript of Pertemuan VIII Analisis Proses Kualitatif · Yudha Saintika, S.T., M.T.I (YUS) Sub Capaian...

Pertemuan VIII
Analisis Proses Kualitatif
Bisnis Proses Fundamental [IS611083]
Dosen Pengampu: 1. Dwi Mustika K, S.Kom., M.Kom (DMK)
2. Yudha Saintika, S.T., M.T.I (YUS)

Sub Capaian Pembelajaran MK
“Mahasiswa mampu menjelaskan analisis proses kualitatif dan kuantitatif”

Sub Capaian Pembelajaran MK
We are here !!

•Process Analysis Technique
•Qualitative Analysis Technique
•VA Analysis
Agenda
Quick Repeat

Process Analysis Techniques
Qualitative analysis
• Value-Added Analysis
• Root-Cause Analysis
• Pareto Analysis
• Issue Register
Quantitative Analysis
• Quantitative Flow Analysis
• Queuing Theory
• Process Simulation

Purposes of Qualitative Analysis
Identify and eliminate waste
• Valued-added analysis
Identify, understand and prioritize issues
• Issue register
• Root-cause analysis (e.g. cause-effect diagrams)
• Pareto analysis

Purposes of Qualitative Analysis
“All we are doing is looking at the time line, from the moment the customer gives us an order to the point
when we collect the cash.
And we are reducing the time line by reducing the non-value-adding wastes ”
Taiichi Ohno
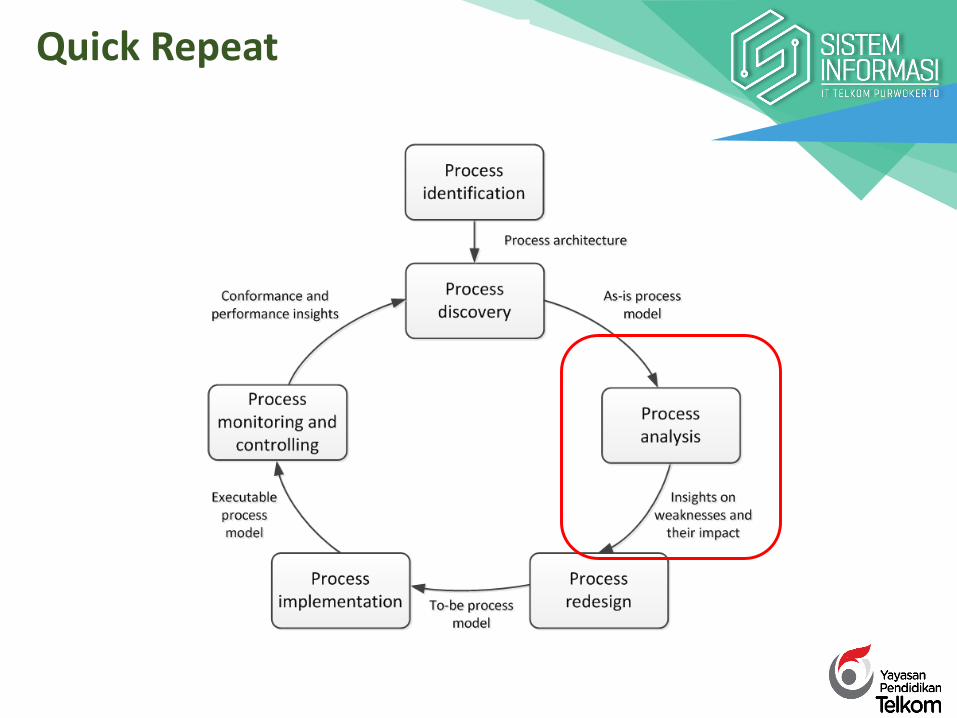
7+1 Sources of Waste
1. Unnecessary Transportation (send, receive)
2. Inventory (large work-in-process)
3. Motion (drop-off, pick-up, go to)
4. Waiting (waiting time between tasks)
5. Over-Processing (performing what is not yet needed or might not be needed)
6. Over-Production (unnecessary cases)
7. Defects (rework to fix defects)
8. Resource underutilization (idle resources)
Source: Seven Wastes defined by Taiichi Ohno
8th waste coined by Ben Chavis, Jr.

1. Decorticate the process into steps
2. Classify each step into: Value-adding (VA): Produces value or satisfaction to
the customer.• Is the customer willing to pay for this step?
Business value-adding (BVA): Necessary or useful for the business to run smoothly, or required due to the regulatory environment, e.g. checks, controls• Would the business potentially suffer in the
long-term if this step was removed? Non-value-adding (NVA) – everything else including
handovers, delays and rework
Value-Added Analysis

Example (Equipment Rental Process)

Example – Equipment Rental Process

•Purpose: to categorise identified issues as part of as-is process modelling
•Usually a table with the following columns (possibly others):• issue number•name•Description/explanation• Impact: Qualitative vs. Quantitative•Possible solution
Issue Register

Issue Register (Equipment Rental)
Name Explanation Assumptions Qualitative
Impact
Quantitative
Impact
Equipment
kept longer
than
needed
Site engineers keep the
equipment longer than
needed by means of
deadline extensions
BuildIT rents 3000 pieces of equipment p.a.
In 10% of cases, site engineers keep the
equipment two days longer than needed.
On average, rented equipment costs 100
per day
0.1 × 3000
× 2 × 100 =
60,000 p.a.
Rejected
equipment
Site engineers reject
delivered equipment due
to non-conformance to
their specifications
BuildIT rents 3000 pieces of equipment p.a.
Each time an equipment is rejected due to
an internal mistake, BuildIT is billed the cost
of one day of rental, that is 100.
5% of them are rejected due to an internal
mistake
Disruption to
schedules.
Employee
stress and
frustration
3000 × 0.05
× 100 =
15,000 p.a.
Late
payment
fees
BuildIT pays late
payment fees because
invoices are not paid by
the due date
BuildIT rents 3000 pieces of equipment p.a.
Each equipment is rented on average for 4
days at a rate of 100 per day.
Each rental leads to one invoice.
About 10% of invoices are paid late.
Penalty for late payment is 2%.
0.1 × 3000
× 4 × 100 ×0.02 = 2400
p.a.

• Cause-effect diagrams
• Why-why diagrams
• Pareto charts
Techniques for issue analysis

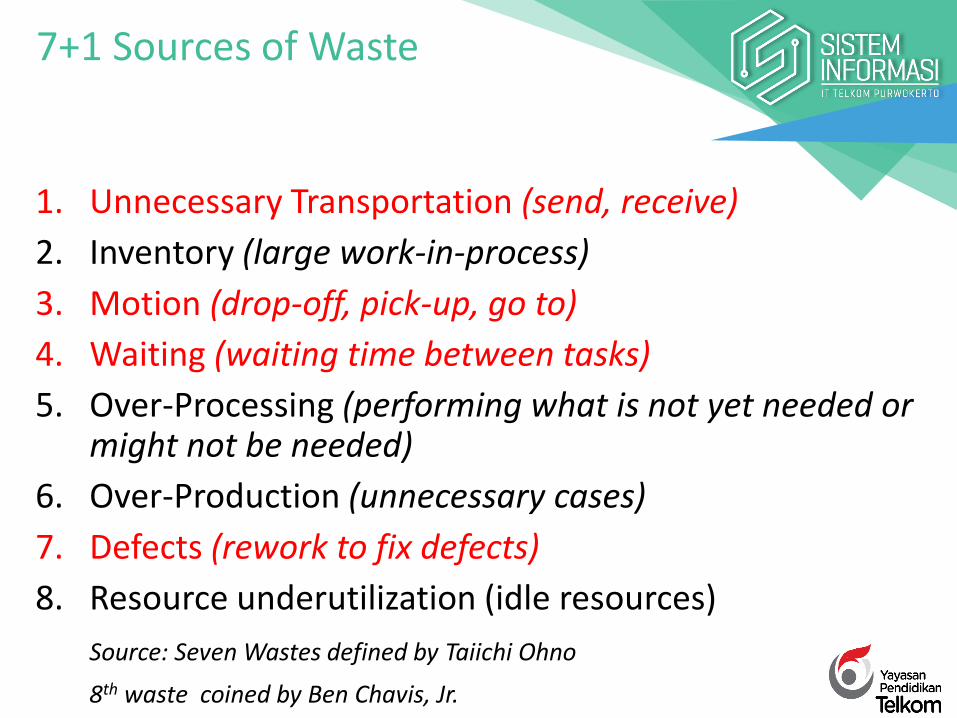
Cause-Effect (Fishbone) Diagrams
Cause-effect diagram (rejected equipment)

Why-Why Diagram

Site engineers keep equipment longer, why?
• Site engineer fears that equipment will not be available later when needed, why?• time between request and delivery too long, why?
• excessive time spent in finding a suitable equipment and approving the request, why?
• time spent by clerk contacting possibly multiple suppliers sequentially;
• time spent waiting for works engineer to check the requests;
Why-why diagram (equipment rental)

• Useful to prioritize a collection of issues or factors behind an issue
• Bar chart where the height of the bar denotes the impact of each issue
• Bars sorted by impact
• Superposed curve where the y-axis represents the cumulative percentage impact
Pareto chart

Bacalah ringkasan proses admisi di sebuah universitas pada slide di halamanslide selanjutnya. Buatlah perincian step-step yang dilakukan pada prosesadmisi tersebut kemudian klasifikasikan step-step itu ke dalam VA, BVA,dan NVA!!!
Latihan ini akan dibahas pada pertemuan selanjutnya.
LATIHAN

Consider the following process for the admission of graduate students at a university. In order to apply foradmission, students first fill in an online form. Online applications are recorded in an information system to which allstaff members involved in the admissions process have access to. After a student has submitted the online form, aPDF document is generated and the student is requested to download it, sign it, and send it by post together withthe required documents, which include: 1. Certified copies of previous degree and academic transcripts. 2. Resultsof English language test. 3. Curriculum vitae.
When these documents are received by the admissions office, an officer checks the completeness of thedocuments. If any document is missing, an e-mail is sent to the student. The student has to send the missingdocuments by post. Assuming the application is complete, the admissions office sends the certified copies of thedegrees to an academic recognition agency, which checks the degrees and gives an assessment of their validity andequivalence in terms local education standards. This agency requires that all documents be sent to it by post, and alldocuments must be certified copies of the originals. The agency sends back its assessment to the university by postas well. Assuming the degree verification is successful, the English language test results are then checked online byan officer at the admissions office. If the validity of the English language test results cannot be verified, theapplication is rejected (such notifications of rejection are sent by e-mail). Once all documents of a given studenthave been validated, the admission office forwards these documents by internal mail to the correspondingacademic committee responsible for deciding whether to offer admission or not. The committee makes its decisionbased on the academic transcripts and the CV. The committee meets once every 2 to 3 weeks and examines allapplications that are ready for academic assessment at the time of the meeting.
At the end of the committee meeting, the chair of the committee notifies the admissions office of the selectionoutcomes. This notification includes a list of admitted and rejected candidates. A few days later, the admission officenotifies the outcome to each candidate via e-mail. Additionally, successful candidates are sent a confirmation letterby post.
Admission Process

• Rata-Rata Nilai Kelas = 60
• Nilai tertinggi = 88
• Nilai ≥ 70 berjumlah 12 orang
• 60 ≤ Nilai < 70 berjumlah 4 orang
• Nilai < 60 berjumlah 16 orang
• Nilai tertinggi bagian A = 24 poin
• Kesalahan umum di bagian B untuk analisis proses bisnis yaituketidaklengkapan jenis bugs/kesalahan dan tidak adanya pool dan lane padapenggambaran diagram proses bisnis.
• Selain itu beberapa orang masih menggunakan proses untuk pemisahangateway.
Review UTS