
PERFORMANCE MANAGEMENT INFORMATION SYSTEMS: RELATING ... · PERFORMANCE MANAGEMENT INFORMATION...
32
1 30/03/2015 PERFORMANCE MANAGEMENT INFORMATION SYSTEMS: RELATING FUNCTIONALITY TO RESOURCE-BASED COMPETITIVE ADVANTAGE AUTHORS: Matthew Peters ([email protected]) Bernhard Wieder ([email protected]) UTS Business School, University of Technology Sydney Draft – Do Not Quote ABSTRACT Performance management information systems (PMIS) have been a ‘hot topic’ for Chief Information Officers (CIOs) and Chief Financial Officers (CFOs) for close to a decade. PMIS range from low-functionality spreadsheet-based solutions through to high-functionality business intelligence solutions. As yet, this area has not yet received sufficient academic enquiry. Our research questions concern: what are PMIS functionalities, and whether and how do they contribute to competitive advantage? We conceptualize functionality as reflected by system usability and data multi-dimensionality. We examine functionalities of the two types of PMIS: performance planning systems (for budgeting and forecasting) and performance reporting systems (for reporting results information to management). We apply resource-based theory. We hypothesize mediation chains, in which the two PMIS functionality constructs link to competitive advantage, mediated by performance management capabilities and mediated by a resource-base of organizational culture. We use partial least squares path modelling using survey data collected from senior managers of 264 Australian firms. We find support for the hypotheses. We also unexpectedly find that the two types of PMIS functionality operate in sequential, rather than parallel, mediation. The findings have implications for CIOs, CFOs and other managers responsible for development of PMIS. Keywords: business intelligence, competitive advantage, flexibility values, system functionality, organizational culture, performance management, resource-based theory, stability values.
Transcript of PERFORMANCE MANAGEMENT INFORMATION SYSTEMS: RELATING ... · PERFORMANCE MANAGEMENT INFORMATION...
1 30/03/2015
PERFORMANCE MANAGEMENT INFORMATION SYSTEMS: RELATING
FUNCTIONALITY TO RESOURCE-BASED COMPETITIVE ADVANTAGE
AUTHORS:
Matthew Peters ([email protected])
Bernhard Wieder ([email protected])
UTS Business School, University of Technology Sydney
Draft – Do Not Quote
ABSTRACT
Performance management information systems (PMIS) have been a ‘hot topic’ for Chief
Information Officers (CIOs) and Chief Financial Officers (CFOs) for close to a decade. PMIS
range from low-functionality spreadsheet-based solutions through to high-functionality business
intelligence solutions. As yet, this area has not yet received sufficient academic enquiry. Our
research questions concern: what are PMIS functionalities, and whether and how do they
contribute to competitive advantage? We conceptualize functionality as reflected by system
usability and data multi-dimensionality. We examine functionalities of the two types of PMIS:
performance planning systems (for budgeting and forecasting) and performance reporting
systems (for reporting results information to management). We apply resource-based theory.
We hypothesize mediation chains, in which the two PMIS functionality constructs link to
competitive advantage, mediated by performance management capabilities and mediated by a
resource-base of organizational culture. We use partial least squares path modelling using
survey data collected from senior managers of 264 Australian firms. We find support for the
hypotheses. We also unexpectedly find that the two types of PMIS functionality operate in
sequential, rather than parallel, mediation. The findings have implications for CIOs, CFOs and
other managers responsible for development of PMIS.
Keywords: business intelligence, competitive advantage, flexibility values, system
functionality, organizational culture, performance management, resource-based theory, stability
values.
2 30/03/2015
PERFORMANCE MANAGEMENT INFORMATION SYSTEMS: RELATING
FUNCTIONALITY TO RESOURCE-BASED COMPETITIVE ADVANTAGE
INTRODUCTION
There are many vendors and consultants for contemporary performance management
information systems (PMIS). The ‘high-functionality’ variants of PMIS that they offer are based
upon sophisticated business intelligence infrastructure, combining integrated data architecture
and specialist applications (Chaudhuri et al. 2011; Chen et al. 2012; Clark et al. 2007; Elbashir
et al. 2011). These high-functionality PMIS are often promoted as ‘competitively advantageous’
compared to the traditional alternative of a ‘low-functionality’ spreadsheet-based PMIS. In
academia, where competitive advantage from information technology (IT) is an important long-
standing question (e.g. Melville et al. 2004; Mithas et al. 2012), seasoned observers might well
wonder if high-functionality PMIS are just another ‘passing IT fashion’ (Baskerville et al. 2009;
Wang 2010). In the absence of related academic research, we examine the research questions
concern: what are PMIS functionalities, and whether and how do they contribute to competitive
advantage?
We draw from seminal academic literature (Ariav 1992) and diverse practitioner literature to
conceptualize PMIS functionalities. Functionality is related to the ease, extent and speed of
structured data processing and it is reflected by system usability and data multi-dimensionality
(Ariav 1992). There are two types of PMIS: performance planning systems (PPS) and
performance reporting systems (PRS). Practically all firms have a PPS and a PRS, with varying
levels of functionality (Libby et al. 2010; Sivabalan et al. 2009). Thus, we develop
conceptualizations for PPS functionality and for PRS functionality.
To develop our research model, we apply resource-based theory (Barney 1991; Penrose 1959;
Wernerfelt 1984). Without resource-based deployment, PPS and PRS functionalities might
provide a competitive advantage to early adopters; however, because every firm can procure
them, any competitive advantage would erode as rivals also adopt them. For a persistent
competitive advantage, a resource-base would provide an isolating mechanism, allowing only
those firms that sufficiently possess that resource-base to fully deploy PPS and PRS
functionalities. One example of such a resource-base is organizational culture (Barney 1986;
Barney 1991). We study flexibility and stability values of organizational culture (Fey et al.
2003) and performance management capabilities, which are multilevel processes for emergent
and intended strategy-making (Simons 1990; Simons 1994; Simons et al. 2000). In our research
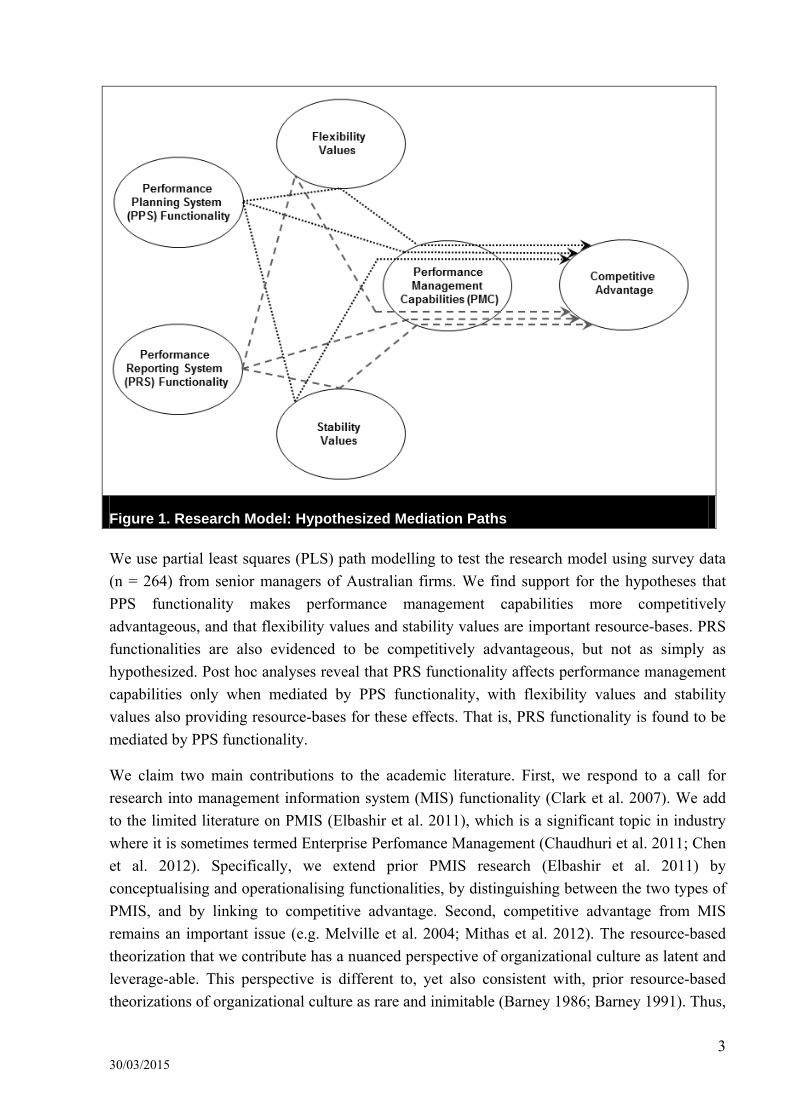
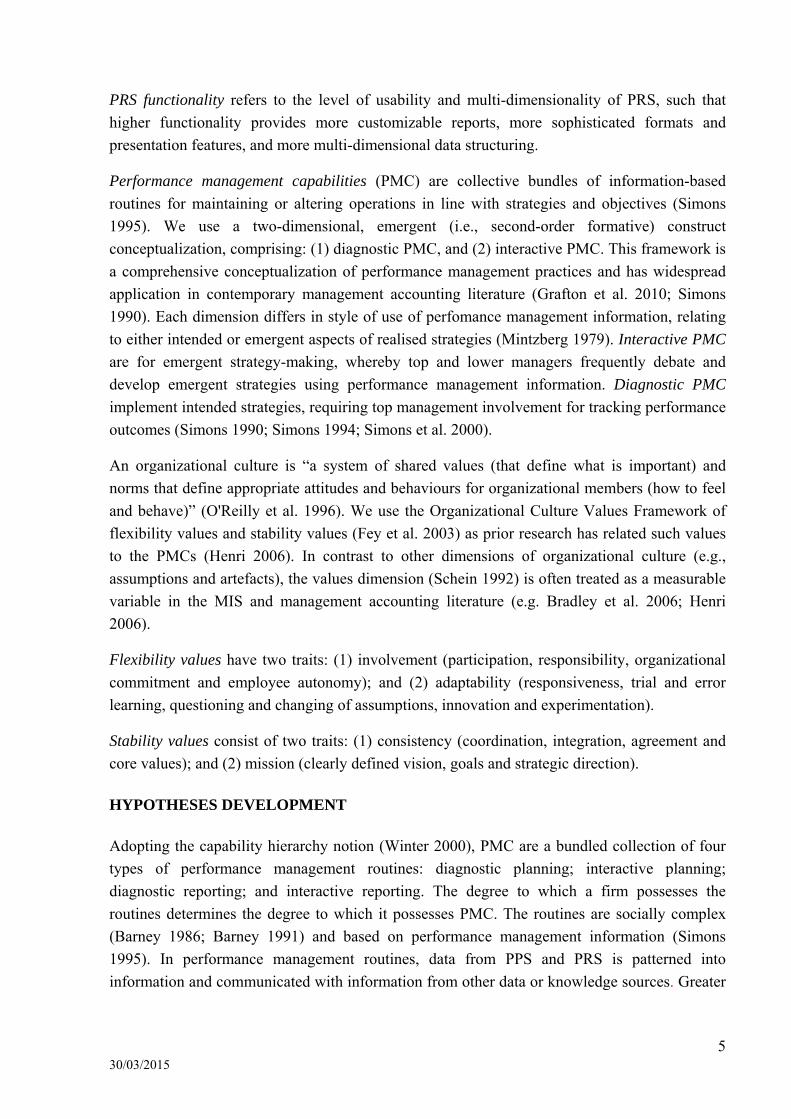
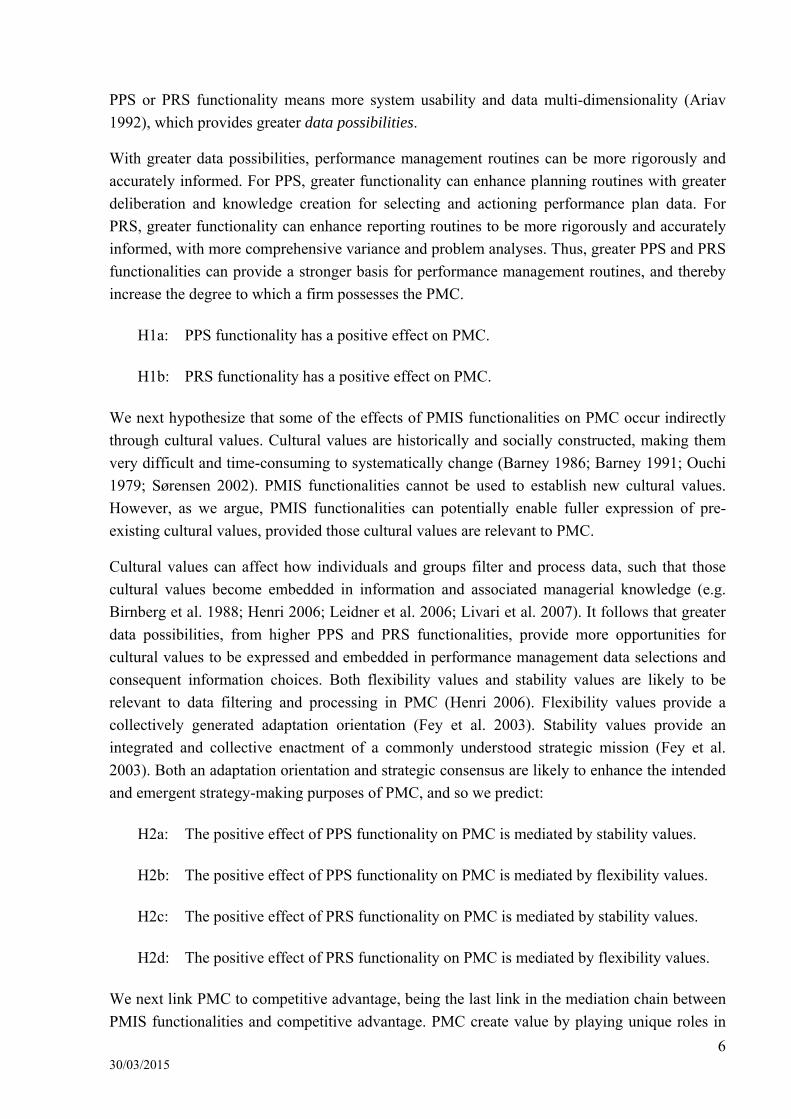
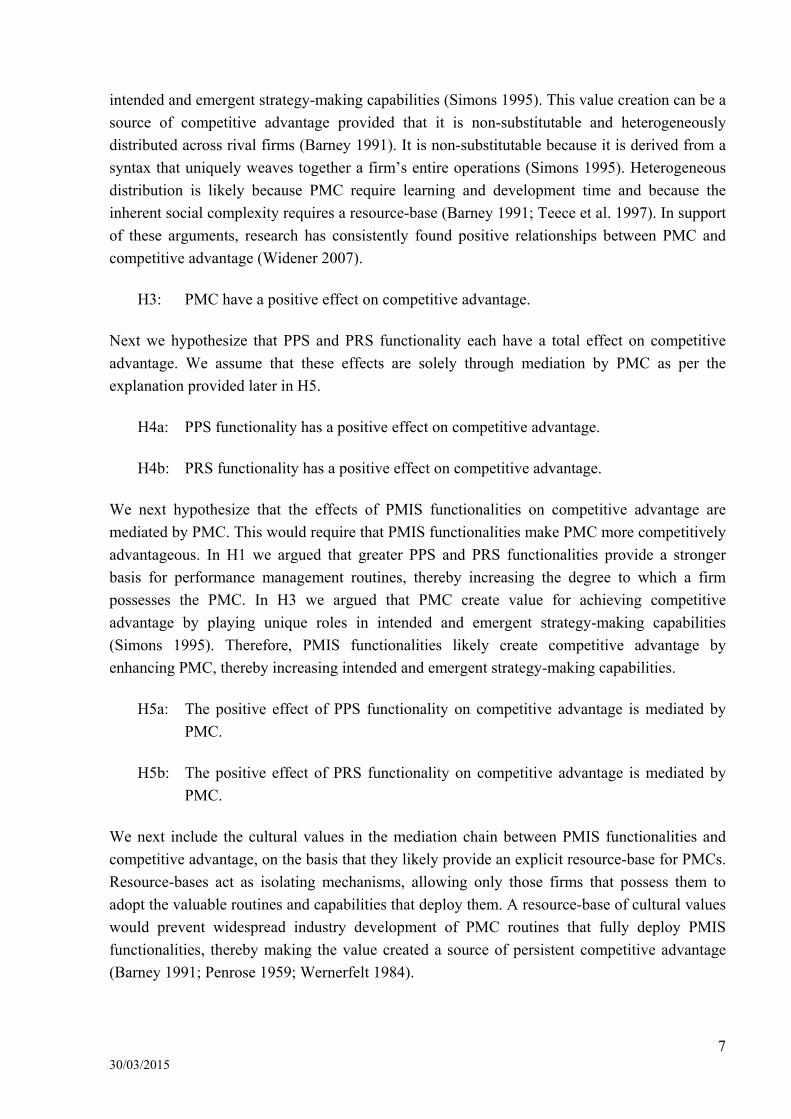
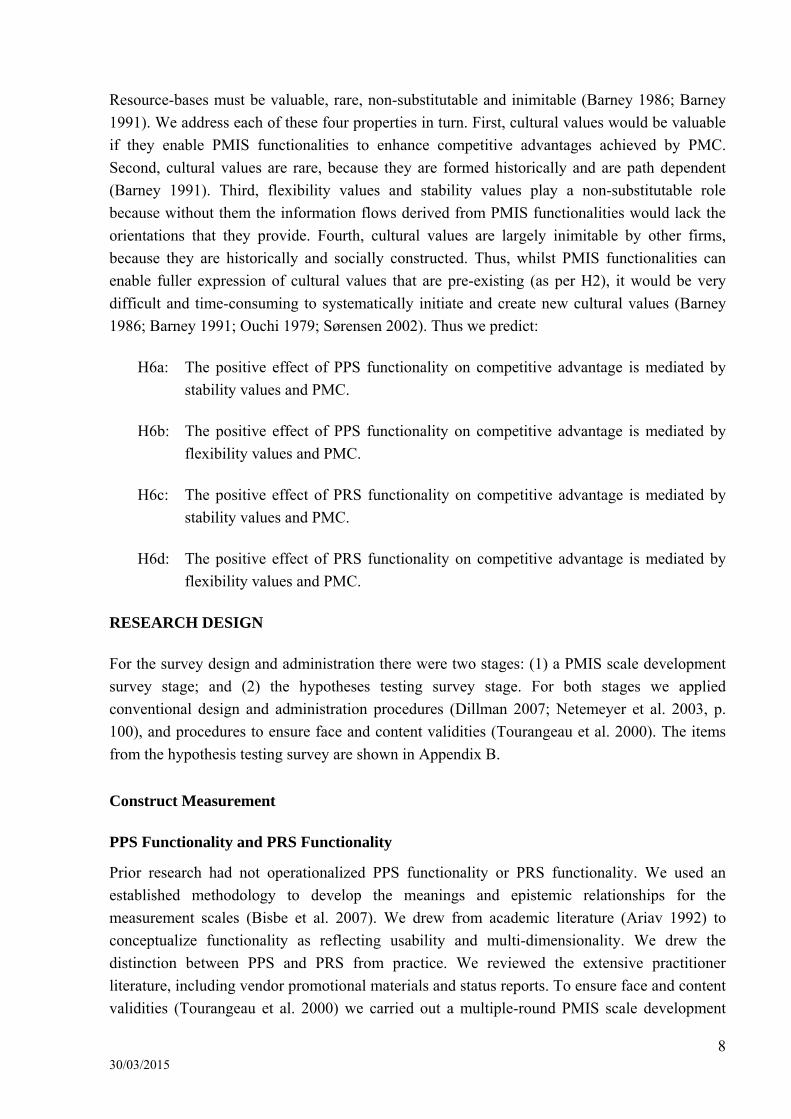
model, as shown in Figure 1, we hypothesize that PPS and PRS functionalities enable fuller
expression of pre-existing cultural values in performance management capabilities, leveraging
those cultural values as a source of persistent competitive advantage.
3 30/03/2015
Figure 1. Research Model: Hypothesized Mediation Paths
We use partial least squares (PLS) path modelling to test the research model using survey data
(n = 264) from senior managers of Australian firms. We find support for the hypotheses that
PPS functionality makes performance management capabilities more competitively
advantageous, and that flexibility values and stability values are important resource-bases. PRS
functionalities are also evidenced to be competitively advantageous, but not as simply as
hypothesized. Post hoc analyses reveal that PRS functionality affects performance management
capabilities only when mediated by PPS functionality, with flexibility values and stability
values also providing resource-bases for these effects. That is, PRS functionality is found to be
mediated by PPS functionality.
We claim two main contributions to the academic literature. First, we respond to a call for
research into management information system (MIS) functionality (Clark et al. 2007). We add
to the limited literature on PMIS (Elbashir et al. 2011), which is a significant topic in industry
where it is sometimes termed Enterprise Perfomance Management (Chaudhuri et al. 2011; Chen
et al. 2012). Specifically, we extend prior PMIS research (Elbashir et al. 2011) by
conceptualising and operationalising functionalities, by distinguishing between the two types of
PMIS, and by linking to competitive advantage. Second, competitive advantage from MIS
remains an important issue (e.g. Melville et al. 2004; Mithas et al. 2012). The resource-based
theorization that we contribute has a nuanced perspective of organizational culture as latent and
leverage-able. This perspective is different to, yet also consistent with, prior resource-based
theorizations of organizational culture as rare and inimitable (Barney 1986; Barney 1991). Thus,
4 30/03/2015
we contribute to the application and development of resource-based theory in the MIS literature
(Oh et al. 2007; Wade et al. 2004) and also to the extensive literature concerning organizational
culture and MIS (e.g. Bradley et al. 2006; Leidner et al. 2006).
The remainder of this paper is structured in the following order: overview of constructs;
hypotheses development; research design; PLS analysis and results; findings summary and
discussion; contributions, future research and limitations; conclusion and managerial
implications.
OVERVIEW OF CONSTRUCTS
PMIS are a type of ‘business intelligence’ system (Chaudhuri et al. 2011), a term that broadly
refers to management support systems for gathering, storing and accessing data for decision
making (Clark et al. 2007; Fedorowicz et al. 1992). PMIS functionality depends on the
sophistication of IT infrastructure, which may range from a highly manual series of
spreadsheets through to integrated data architecture with specialist applications (Chaudhuri et
al. 2011; Clark et al. 2007).
PPS and PRS are the two essential sub-systems of a PMIS, providing a comprehensive
cybernetic feedback framework for use in performance management capabilities. Performance
management data includes profit-planning, financial and non-financial data (Malmi et al. 2008).
A PPS is used to produce budgets (e.g., annually) and forecasts (e.g., monthly) and contains
historical data from the PRS as a basis for extrapolative modelling into future time periods. A
PRS is for management reporting and analysis of performance measure outcomes (e.g.,
monthly, quarterly and year-end), to compare results with budgets or forecasts. A PRS is for the
feedback stage of cybernetic control, and contains variance baseline data from PPS and
historical data from transactional systems.
Functionality of a PPS or PRS, in general, relates to the ease, extent and speed of structured data
processing. Specifically, this functionality reflects: (1) system usability, and (2) data multi-
dimensionality (Ariav 1992). First, usability requires unified access and user manipulation of
and between current, historic and future data cubes, where cubes comprise objects, attributes
and time (Ariav 1992). Second, multi-dimensionality refers to the extent of objects, attributes
and temporality (Ariav 1992). Objects include responsibility centre arrays (e.g., profit centre,
revenue centre, cost centre), responsibility centre aggregation patterns (e.g., manager, regional,
national), and plan versions (e.g., actual results, budget, forecast, latest forecast). Attributes
refer to calculative elements (e.g., amounts, stock keeping units, employees). Temporal
dimensionality refers to time periods (e.g., day, month, quarter, or year).
PPS functionality refers to the level of usability and multi-dimensionality of PPS, such that
higher functionality enables faster creation and revision of more multi-dimensional budgets and
forecasts.
5 30/03/2015
PRS functionality refers to the level of usability and multi-dimensionality of PRS, such that
higher functionality provides more customizable reports, more sophisticated formats and
presentation features, and more multi-dimensional data structuring.
Performance management capabilities (PMC) are collective bundles of information-based
routines for maintaining or altering operations in line with strategies and objectives (Simons
1995). We use a two-dimensional, emergent (i.e., second-order formative) construct
conceptualization, comprising: (1) diagnostic PMC, and (2) interactive PMC. This framework is
a comprehensive conceptualization of performance management practices and has widespread
application in contemporary management accounting literature (Grafton et al. 2010; Simons
1990). Each dimension differs in style of use of perfomance management information, relating
to either intended or emergent aspects of realised strategies (Mintzberg 1979). Interactive PMC
are for emergent strategy-making, whereby top and lower managers frequently debate and
develop emergent strategies using performance management information. Diagnostic PMC
implement intended strategies, requiring top management involvement for tracking performance
outcomes (Simons 1990; Simons 1994; Simons et al. 2000).
An organizational culture is “a system of shared values (that define what is important) and
norms that define appropriate attitudes and behaviours for organizational members (how to feel
and behave)” (O'Reilly et al. 1996). We use the Organizational Culture Values Framework of
flexibility values and stability values (Fey et al. 2003) as prior research has related such values
to the PMCs (Henri 2006). In contrast to other dimensions of organizational culture (e.g.,
assumptions and artefacts), the values dimension (Schein 1992) is often treated as a measurable
variable in the MIS and management accounting literature (e.g. Bradley et al. 2006; Henri
2006).
Flexibility values have two traits: (1) involvement (participation, responsibility, organizational
commitment and employee autonomy); and (2) adaptability (responsiveness, trial and error
learning, questioning and changing of assumptions, innovation and experimentation).
Stability values consist of two traits: (1) consistency (coordination, integration, agreement and
core values); and (2) mission (clearly defined vision, goals and strategic direction).
HYPOTHESES DEVELOPMENT
Adopting the capability hierarchy notion (Winter 2000), PMC are a bundled collection of four
types of performance management routines: diagnostic planning; interactive planning;
diagnostic reporting; and interactive reporting. The degree to which a firm possesses the
routines determines the degree to which it possesses PMC. The routines are socially complex
(Barney 1986; Barney 1991) and based on performance management information (Simons
1995). In performance management routines, data from PPS and PRS is patterned into
information and communicated with information from other data or knowledge sources. Greater
6 30/03/2015
PPS or PRS functionality means more system usability and data multi-dimensionality (Ariav
1992), which provides greater data possibilities.
With greater data possibilities, performance management routines can be more rigorously and
accurately informed. For PPS, greater functionality can enhance planning routines with greater
deliberation and knowledge creation for selecting and actioning performance plan data. For
PRS, greater functionality can enhance reporting routines to be more rigorously and accurately
informed, with more comprehensive variance and problem analyses. Thus, greater PPS and PRS
functionalities can provide a stronger basis for performance management routines, and thereby
increase the degree to which a firm possesses the PMC.
H1a: PPS functionality has a positive effect on PMC.
H1b: PRS functionality has a positive effect on PMC.
We next hypothesize that some of the effects of PMIS functionalities on PMC occur indirectly
through cultural values. Cultural values are historically and socially constructed, making them
very difficult and time-consuming to systematically change (Barney 1986; Barney 1991; Ouchi
1979; Sørensen 2002). PMIS functionalities cannot be used to establish new cultural values.
However, as we argue, PMIS functionalities can potentially enable fuller expression of pre-
existing cultural values, provided those cultural values are relevant to PMC.
Cultural values can affect how individuals and groups filter and process data, such that those
cultural values become embedded in information and associated managerial knowledge (e.g.
Birnberg et al. 1988; Henri 2006; Leidner et al. 2006; Livari et al. 2007). It follows that greater
data possibilities, from higher PPS and PRS functionalities, provide more opportunities for
cultural values to be expressed and embedded in performance management data selections and
consequent information choices. Both flexibility values and stability values are likely to be
relevant to data filtering and processing in PMC (Henri 2006). Flexibility values provide a
collectively generated adaptation orientation (Fey et al. 2003). Stability values provide an
integrated and collective enactment of a commonly understood strategic mission (Fey et al.
2003). Both an adaptation orientation and strategic consensus are likely to enhance the intended
and emergent strategy-making purposes of PMC, and so we predict:
H2a: The positive effect of PPS functionality on PMC is mediated by stability values.
H2b: The positive effect of PPS functionality on PMC is mediated by flexibility values.
H2c: The positive effect of PRS functionality on PMC is mediated by stability values.
H2d: The positive effect of PRS functionality on PMC is mediated by flexibility values.
We next link PMC to competitive advantage, being the last link in the mediation chain between
PMIS functionalities and competitive advantage. PMC create value by playing unique roles in
7 30/03/2015
intended and emergent strategy-making capabilities (Simons 1995). This value creation can be a
source of competitive advantage provided that it is non-substitutable and heterogeneously
distributed across rival firms (Barney 1991). It is non-substitutable because it is derived from a
syntax that uniquely weaves together a firm’s entire operations (Simons 1995). Heterogeneous
distribution is likely because PMC require learning and development time and because the
inherent social complexity requires a resource-base (Barney 1991; Teece et al. 1997). In support
of these arguments, research has consistently found positive relationships between PMC and
competitive advantage (Widener 2007).
H3: PMC have a positive effect on competitive advantage.
Next we hypothesize that PPS and PRS functionality each have a total effect on competitive
advantage. We assume that these effects are solely through mediation by PMC as per the
explanation provided later in H5.
H4a: PPS functionality has a positive effect on competitive advantage.
H4b: PRS functionality has a positive effect on competitive advantage.
We next hypothesize that the effects of PMIS functionalities on competitive advantage are
mediated by PMC. This would require that PMIS functionalities make PMC more competitively
advantageous. In H1 we argued that greater PPS and PRS functionalities provide a stronger
basis for performance management routines, thereby increasing the degree to which a firm
possesses the PMC. In H3 we argued that PMC create value for achieving competitive
advantage by playing unique roles in intended and emergent strategy-making capabilities
(Simons 1995). Therefore, PMIS functionalities likely create competitive advantage by
enhancing PMC, thereby increasing intended and emergent strategy-making capabilities.
H5a: The positive effect of PPS functionality on competitive advantage is mediated by
PMC.
H5b: The positive effect of PRS functionality on competitive advantage is mediated by
PMC.
We next include the cultural values in the mediation chain between PMIS functionalities and
competitive advantage, on the basis that they likely provide an explicit resource-base for PMCs.
Resource-bases act as isolating mechanisms, allowing only those firms that possess them to
adopt the valuable routines and capabilities that deploy them. A resource-base of cultural values
would prevent widespread industry development of PMC routines that fully deploy PMIS
functionalities, thereby making the value created a source of persistent competitive advantage
(Barney 1991; Penrose 1959; Wernerfelt 1984).
8 30/03/2015
Resource-bases must be valuable, rare, non-substitutable and inimitable (Barney 1986; Barney
1991). We address each of these four properties in turn. First, cultural values would be valuable
if they enable PMIS functionalities to enhance competitive advantages achieved by PMC.
Second, cultural values are rare, because they are formed historically and are path dependent
(Barney 1991). Third, flexibility values and stability values play a non-substitutable role
because without them the information flows derived from PMIS functionalities would lack the
orientations that they provide. Fourth, cultural values are largely inimitable by other firms,
because they are historically and socially constructed. Thus, whilst PMIS functionalities can
enable fuller expression of cultural values that are pre-existing (as per H2), it would be very
difficult and time-consuming to systematically initiate and create new cultural values (Barney
1986; Barney 1991; Ouchi 1979; Sørensen 2002). Thus we predict:
H6a: The positive effect of PPS functionality on competitive advantage is mediated by
stability values and PMC.
H6b: The positive effect of PPS functionality on competitive advantage is mediated by
flexibility values and PMC.
H6c: The positive effect of PRS functionality on competitive advantage is mediated by
stability values and PMC.
H6d: The positive effect of PRS functionality on competitive advantage is mediated by
flexibility values and PMC.
RESEARCH DESIGN
For the survey design and administration there were two stages: (1) a PMIS scale development
survey stage; and (2) the hypotheses testing survey stage. For both stages we applied
conventional design and administration procedures (Dillman 2007; Netemeyer et al. 2003, p.
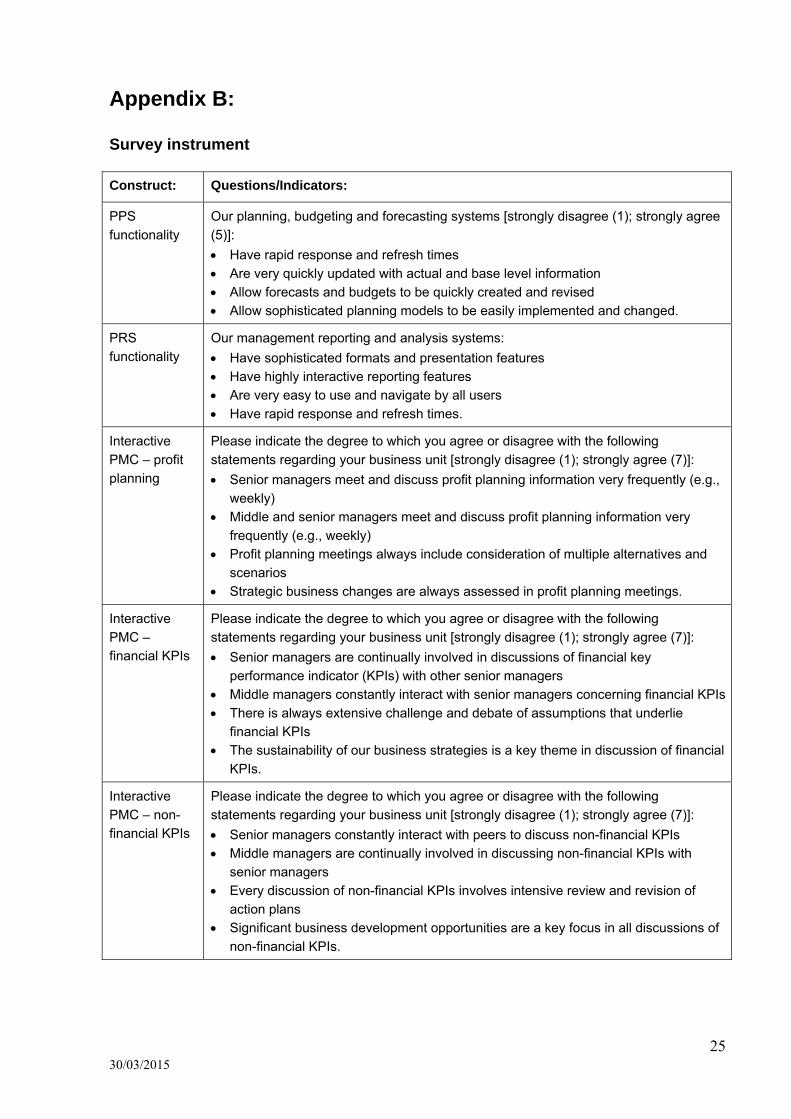
100), and procedures to ensure face and content validities (Tourangeau et al. 2000). The items
from the hypothesis testing survey are shown in Appendix B.
Construct Measurement
PPS Functionality and PRS Functionality
Prior research had not operationalized PPS functionality or PRS functionality. We used an
established methodology to develop the meanings and epistemic relationships for the
measurement scales (Bisbe et al. 2007). We drew from academic literature (Ariav 1992) to
conceptualize functionality as reflecting usability and multi-dimensionality. We drew the
distinction between PPS and PRS from practice. We reviewed the extensive practitioner
literature, including vendor promotional materials and status reports. To ensure face and content
validities (Tourangeau et al. 2000) we carried out a multiple-round PMIS scale development
9 30/03/2015
survey, in parallel to pre-testing consultations with five expert-practitioners. From these
processes, notably, the terms ‘usability’ and ‘multi-dimensionality’ were ambiguous to
practitioners, and so we very carefully and iteratively developed and tested related terms. The
PMIS scale development survey had a wide range of PPS and PRS related measurement items,
and 142 usable responses (12.0% response rate) were received. Guided by analyses of the
response data, we developed a four-item set of reflective scales for PPS functionality, and also
for PRS functionality.
Given the newness of the scales, we also performed convergent validity testing using data
collected with the hypotheses testing survey. We included scales for two other constructs: (1)
PPS infrastructure, and (2) PRS infrastructure, which we also had developed in the PMIS scale
development process. As discussed, low PPS/PRS functionality is derived from a dynamic
series of spreadsheet arrays, while high functionality is related to integrated data infrastructures
and specialist applications. For the two infrastructure constructs, the four-item scales were: our
PPS/PRS‘ (1) are purely spreadsheet based through to (5) have a fully integrated IT systems
architecture; (1) consist solely of isolated individualized spreadsheets through to (5) are
integrated by a common, shared online platform and database; (1) use highly manual processes
to extract data from transactional systems through to (5) have fully automated integration with
all relevant transactional systems; (1) are based on data from disparate spreadsheets through to
(5) source all data from a single data warehouse .’ Using latent variable scores from PLS (n =
264) , the Spearman correlations are: .63 (p < .001) for PPS functionality with PPS
infrastructure and; .61 (p < .001) for PRS functionality with PRS infrastructure. Thus, these
‘strong’ correlations provide evidence of satisfactory convergent validities for the PPS and PRS
functionality constructs. In the hypotheses testing survey, the scores for PPS functionality and
PRS functionality were coded from 1 to 5, with 5 representing high functionality.
Performance Management Capabilities
PMC is a two-dimensional emergent construct. The two dimensions are interactive PMC and
diagnostic PMC. For each dimension we had 12 scale items: four for profit-planning
information; four for financial key performance indicators and; four for non-financial key
performance indicators (Malmi et al. 2008). The scales were adapted from prior literature
(Abernethy et al. 1999; Bisbe et al. 2004; Naranjo-Gil et al. 2007; Widener 2007). We averaged
each four-item set of scores, so that each dimension had three reflective indicators. The
diagnostic PMC scores were coded from 1 to 5, with 5 representing a high degree of diagnostic
PMC. The interactive PMC scores were coded from 1 to 7, with 7 representing a high degree of
interactive PMC. In PLS the two emergent dimensions were modelled hierarchically as the
construct PMC (Wetzels et al. 2009).
Flexibility Values and Stability Values
From the Denison Organizational Culture Survey (Denison et al. 1995; Fey et al. 2003) we took
six items for flexibility values and six items for stability values. After removing items that failed
10 30/03/2015
our PLS reliability tests, there remained four items for flexibility values (two for adaptability
traits and two for involvement traits) and four items for stability values (two for mission traits
and two for consistency traits). Scores were coded from 1 to 7, with 7 representing strong
values.
Competitive Advantage
Competitive advantage is defined as superior financial performance relative to competitors. This
approach controls for differences in performance that are due to effects from industry,
environment, and strategy (Garg et al. 2003). Respondents were asked to rate their business
unit’s performance last year relative to competitors across three dimensions: sales growth;
market share and profitability. Such subjective performance measures are common in the MIS
literature (Bhatt et al. 2005; Oh et al. 2007; Ravichandran et al. 2005). Subjective and objective
measures of financial performance have been found to correlate highly and to provide similar
results in PLS modelling (Rai et al. 2006). With our data, in the PLS analyses the three
measures all load very strongly (.90, .91 and .81) giving confidence about reliability and
validity. Scores were coded from 1 to 9, with 9 representing high performance.
Sample Selection and Data Collection
For hypotheses testing, data was collected over a three month period using a cross-sectional
survey. To design and administer the survey we followed the Total Design Method (Dillman
2007), including pre-testing and pilot-testing with five academics and nine practitioners
(Dillman 2007). The survey was targeted to senior managers of 1,607 business units of
Australian companies, with a list purchased from a commercial provider. Industries that were
unlikely to provide valid results for our research model were excluded (e.g. public sector
organizations). It was conducted in four rounds, each with an email invitation and hyperlink to
an online survey, followed three days later by a postal invitation and attached hardcopy survey
(Dillman 2007). We received 507 responses, a 31.6% response rate, of which 430 were
complete. Our research model does not apply to small firms, and assumes a certain maturity of
operations. Thus we excluded responses from business units with less than AUD20m annual
revenue or less than 100 employees, and business units less than 3 years old. We also excluded
responses where the respondent had less than 12 months experience in the role. We were left
with 264 useable responses, being 130 online and 134 paper responses. The respondents were
predominantly CFOs or other senior finance managers (76.9%), with the remainder being CEOs
and general managers. The majority of responses (77.4%) were from the services sector, with
the remaining 32.6% from manufacturing firms.
11 30/03/2015
Analysis of Data Characteristics and Data Quality
Tests for Data Normality
To determine whether to use parametric or non-parametric procedures, all indicators were tested
for normality (Bollen et al. 1990; Ringle et al. 2012). The Shapiro-Wilk test and the
Kolmogorov-Smirnov test, as reported in Table 3 in Appendix 1, strongly suggest that our
dataset is not normally distributed. The indicators and corresponding latent variables
representing organizational culture and PMC have a strong negative skew, whereas the PMIS
measures have excess negative kurtosis. In both cases, the absolute value of the test statistic
skewness (kurtosis) to standard error of skewness (kurtosis) is > 2, i.e. skew and kurtosis are
significant at p < .05. Consequently, as discussed in following, we used non-parametric
procedures.
Method Bias
We applied numerous procedural remedies to mitigate potential method bias. The potential
effects of media preferences (e.g. email filters or email avoidance) were reduced by contacting
all target respondents both via email and post, and independent sample tests confirm
homogeneous distribution of indicator scores across online and paper surveys.
Ability factors, motivational factors and task factors can contribute to common method bias
(Podsakoff et al. 2012). We considered these factors by changing or eliminating ambiguous
items during the testing with practitioners, by targeting only very senior executives who have
been in their role for at least one year and by ensuring the voluntary survey was anonymous. To
further increase participants’ motivation to respond accurately, they were invited to register for
a preliminary findings report by separate mail or email. The survey invitation letter (email)
avoided any hints on our research question and hypotheses, and partially counterbalancing the
question order aimed at minimizing the risk of respondents guessing such relationships. In
addition, the number of Likert scale points varied between five, seven and nine (Netemeyer et
al. 2003) and different anchor labels were used for related constructs (Podsakoff et al. 2012)
(see Appendix B).
The statistical remedies used to assess for common method bias were Harman’s single-factor
test and the unmeasured latent method factor technique (Podsakoff et al. 2003; Podsakoff et al.
2012). Exploratory factor analysis of the 47 measurement items in the sample (n = 264) resulted
in 11 factors with eigenvalues > 1, with the strongest factor explaining 31.28% of the total
variance, suggesting that common method variance due to single source bias was not present
(Podsakoff et al. 1986). For the unmeasured latent method factor technique, we used a
covariance-based structural equation modelling package (AMOS). In alignment with our
hypothesized research model, we prepared a structural model with the constructs: PMIS;
organizational culture; PMC; and competitive advantage. This model provided significant
estimates for the structural relationships in line with our hypotheses. We then added a general
latent method factor, measured by all indicators of the constructs; when we ran this model the
12 30/03/2015
structural relationships remained significant, providing further evidence that common method
bias was not present (Podsakoff et al. 2003; Podsakoff et al. 2012).
Non-Response Bias Testing
Non-response bias was assessed by comparing responses of early and late respondents
(Armstrong et al. 1977). We used the midpoint of the data collected to classify responses as
early or late. Independent sample tests (Mann-Whitney U) showed no significant differences
between the distributions of all data between early and late respondents, suggesting that non-
response bias is not a considerable problem in this study.
PLS ANALYSIS AND RESULTS
We used the PLS path modelling procedure, because it best suits the non-normal dataset and
small sample size in our study. PLS uses very general, soft distributional assumptions and non-
parametric prediction-orientated model evaluation measures (Chin 1998b; Wold 1982). PLS is
particularly suitable for indirect effect analysis in multi-mediator models (Liang et al. 2007;
Taylor et al. 2008). ‘SmartPLS’ version 2.00 M3 (Ringle et al. 2005) and ‘R’ (package ‘plspm’)
were used for PLS analyses and bootstrapping, and the results are reported following recently
published guidelines (Chin 2010; Ringle et al. 2012).
Measurement Models – Tests of Reliability and Validity
All first-order constructs were measured reflectively, and so were tested for: (1) convergent
validity, and (2) discriminant validity (Chin 1998b; Hulland 1999). Regarding convergent
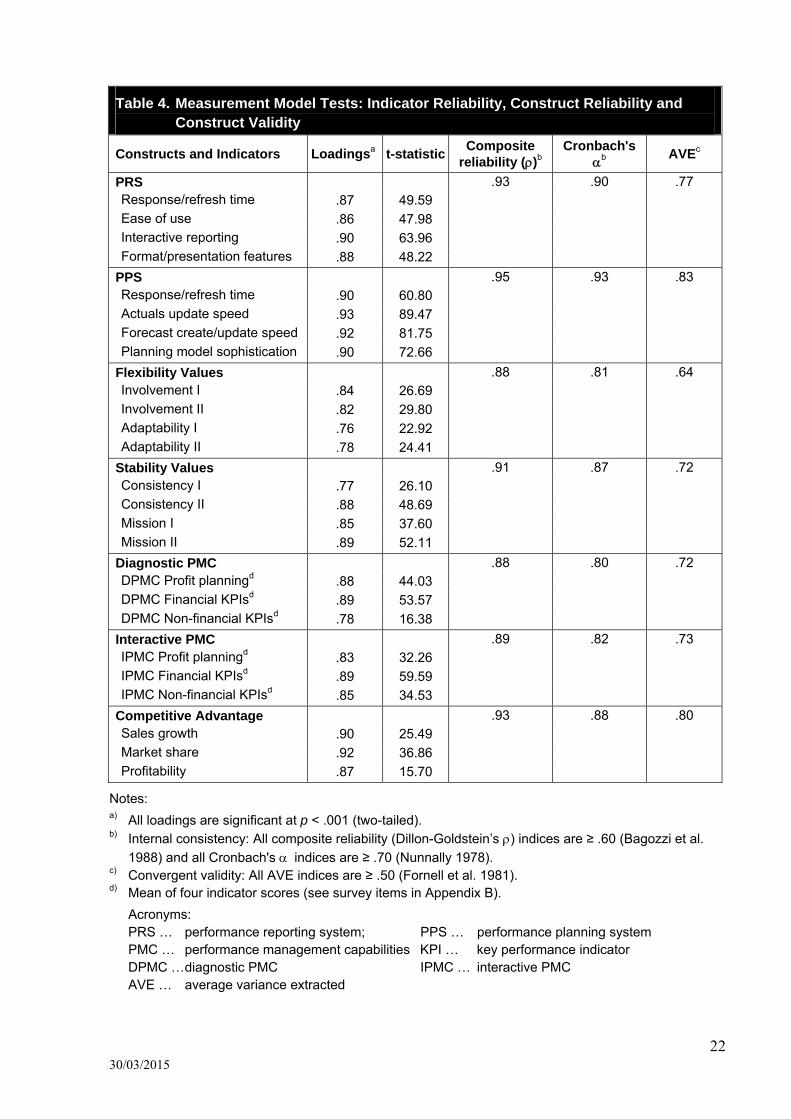
validity, indicator reliability was assessed by examining the significance of the construct
loadings. Table 4 in Appendix A reports the measurement indicator loadings and t-statistics. All
indicator loadings are significant at p < .001. Regarding construct reliability and validity, Table
4 indicates high internal consistency in terms of composite reliability (Dillon-Goldstein’s ≥
.60 and Cronbach's ≥ .70) (Bagozzi et al. 1988; Chin 1998b; Nunnally 1978). Convergent
validity is confirmed as all average variances extracted (AVE) clearly exceed .50 (Fornell et al.
1981). Thus, convergent validity is successfully evidenced.
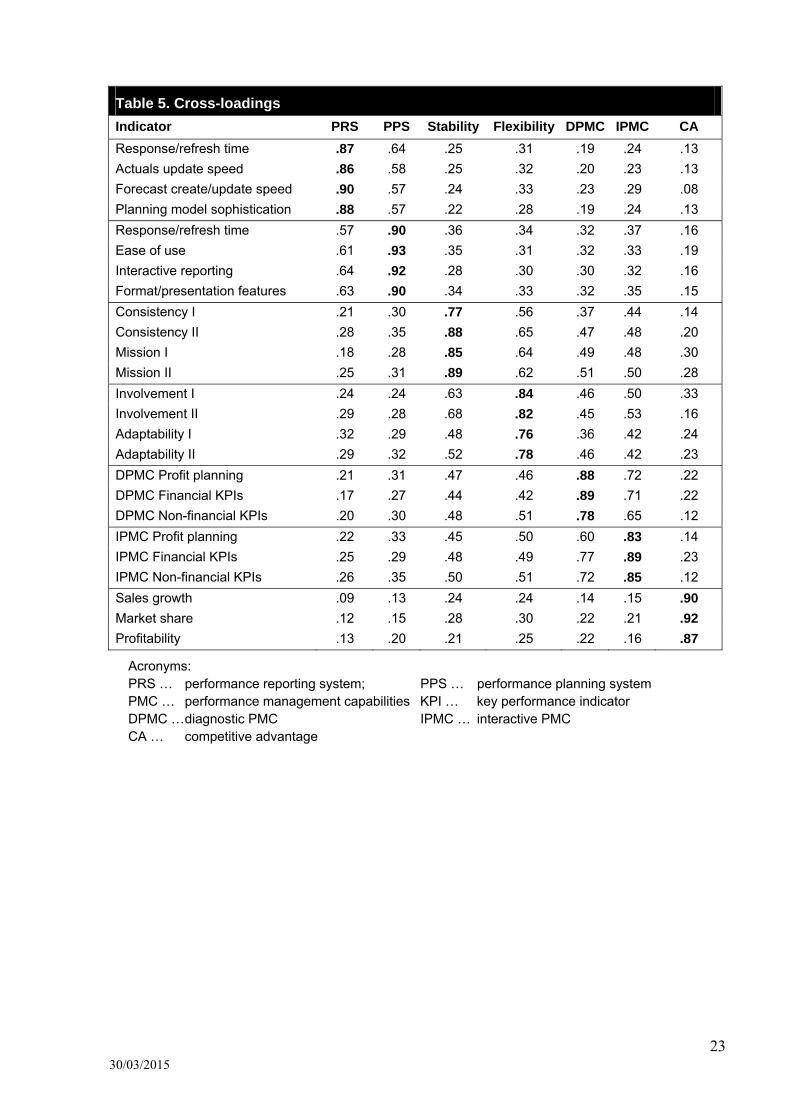
Discriminant validity of the construct indicators was examined by analysing the loading of each
indicator on its first-order construct, relative to its loading on other constructs. Table 5 in
Appendix A confirms that all construct-specific loadings are > .70 (Chin 1998b; Hulland 1999)
and that each indicator loads highest on the relevant construct (Fornell et al. 1981).
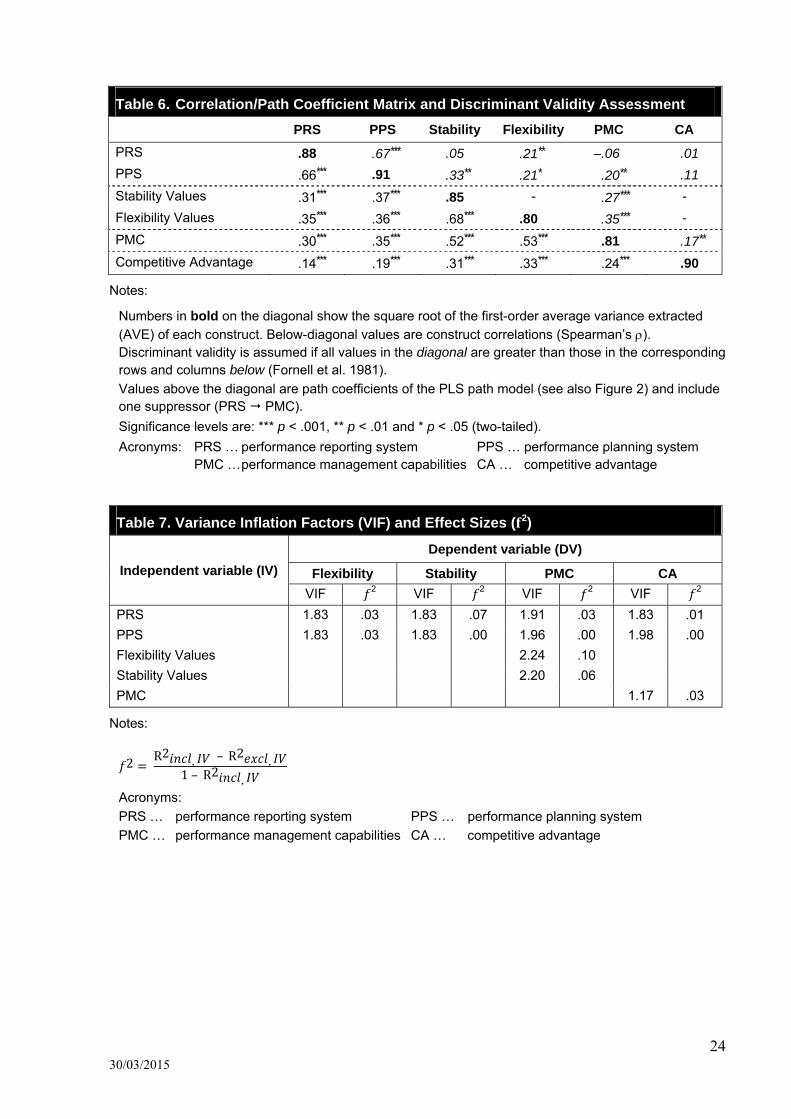
Discriminant validity of the constructs is evidenced by the fact that all square roots of the AVE
in the diagonal exceed the correlations with the other constructs (Barclay et al. 1995; Chin
1998a; Fornell et al. 1981). Thus, discriminant validity is successfully evidenced.
13 30/03/2015
Outline of Hypothesis Testing Procedures
As per Figure 2, the PLS path model includes all hypothesized effects. Importantly, an un-
hypothesized effect is included, shown with a broken-line, whereby PRS is antecedent to PPS.
This effect is needed to correctly specify the path model, and would not have arisen had we
hypothesized PPS to mediate PRS. It comes to light due to an unexpected negative suppression
effect of PRS on PPS, as evidenced by the negative beta of the path from PRS to PMC (Cohen
et al. 2003; MacKinnon et al. 2000). Unexpected negative path coefficients can provide an
opportunity for further investigation of the underlying reasons (Hayes 2009; Maassen et al.
2001; MacKinnon et al. 2002; Taylor et al. 2008). In this case, the negative suppression is
because PPS mediates the effects of PRS. This negative suppression is consistent with the
strong correlation between PRS and PPS, as reported in Table 6. Without inclusion of this path,
the ‘true’ effects of PRS cannot be revealed (Conger 1974; Pandey et al. 2010; Rucker et al.
2011). We explain this effect in relation to the hypotheses in the findings section.
In mediation analysis, a total effect represents an unmediated relationship, and is decomposed
into: (1) the direct effect, and (2) the indirect effects. Table 1 reports the effect magnitudes and
Table 2 reports the effect sizes, all based upon the path model presented in Figure 2.
The magnitude of a direct effect is simply the path coefficient. The magnitude of an indirect
effect is the multiplication of the coefficients of the paths in the mediational chain (Baron et al.
1986; Taylor et al. 2008). The significance of these effects is determined by the percentile
bootstrap method (Preacher et al. 2008; Shrout et al. 2002; Taylor et al. 2008). Bootstrap
methods generally outperform other methods of significance testing in mediation models
(MacKinnon et al. 2004) and – particularly with small samples – the bootstrap percentile
method captures the asymmetry in the sampling distribution missed by the product-of-
coefficients test using the standard error (Cheung et al. 2008; Shrout et al. 2002). The
advantages of bootstrap percentile methods have also been confirmed for three-path mediation
models (Taylor et al. 2008).
To determine effect sizes, we decompose the R-squares of the endogenous variables into direct
and indirect effects using a difference-in-R-squares approach (de Heus 2012; Fairchild et al.
2009; Preacher et al. 2011). The R-square of a total effect was determined from the full path
model; partial path models were used to determine the incremental R-square contribution of
each exogenous variable.
14 30/03/2015
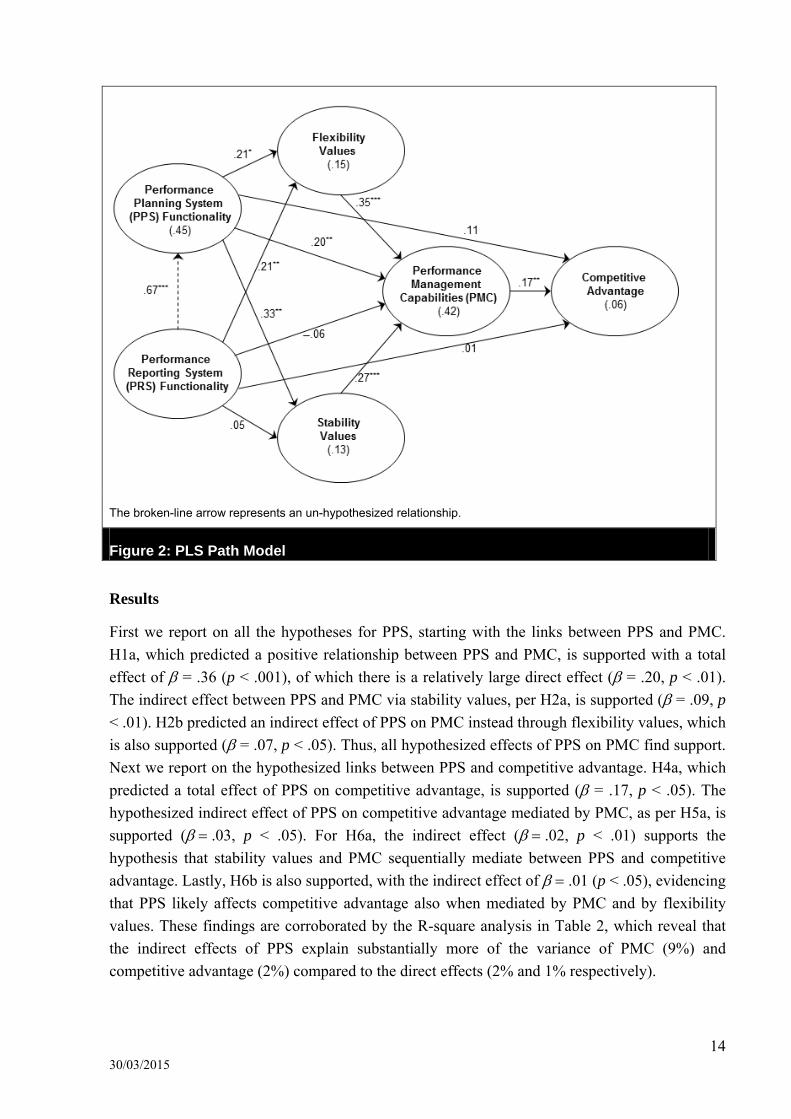
The broken-line arrow represents an un-hypothesized relationship.
Figure 2: PLS Path Model
Results
First we report on all the hypotheses for PPS, starting with the links between PPS and PMC.
H1a, which predicted a positive relationship between PPS and PMC, is supported with a total
effect of = .36 (p < .001), of which there is a relatively large direct effect ( = .20, p < .01).
The indirect effect between PPS and PMC via stability values, per H2a, is supported ( = .09, p
< .01). H2b predicted an indirect effect of PPS on PMC instead through flexibility values, which
is also supported ( = .07, p < .05). Thus, all hypothesized effects of PPS on PMC find support.
Next we report on the hypothesized links between PPS and competitive advantage. H4a, which
predicted a total effect of PPS on competitive advantage, is supported ( = .17, p < .05). The
hypothesized indirect effect of PPS on competitive advantage mediated by PMC, as per H5a, is
supported (.03, p < .05). For H6a, the indirect effect (.02, p < .01) supports the
hypothesis that stability values and PMC sequentially mediate between PPS and competitive
advantage. Lastly, H6b is also supported, with the indirect effect of .01 (p < .05), evidencing
that PPS likely affects competitive advantage also when mediated by PMC and by flexibility
values. These findings are corroborated by the R-square analysis in Table 2, which reveal that
the indirect effects of PPS explain substantially more of the variance of PMC (9%) and
competitive advantage (2%) compared to the direct effects (2% and 1% respectively).
15 30/03/2015
Next we report on all the findings for PRS. We have included the un-hypothesized path from
PRS to PPS, as discussed in the previous section. We commence with the links between PRS
and PMC. H1b is supported, by the total effect of PRS on PMC of = .27 (p < .001). Of this
total effect the reported direct effect is suppressed ( = –.06, p > .10) and thereby unreliable for
interpretation, whilst the indirect effects are made ‘true’ by inclusion of the path from PRS to
PPS (Pandey et al. 2010; Rucker et al. 2011). H2c is not supported, that is, there is not a
significant indirect effect of PRS on PMC through stability values. On the other hand, H2d is
supported, with the indirect effect of PRS on PMC through flexibility values of = .08 (p <
.01). The findings for H2d are important, as they reveal that a substantial part of the total effects
of PRS are not mediated by PPS; that is the effects of PRS are only partially, not fully,
mediated by PPS. Next we report on the hypothesized links between PRS and competitive
advantage. H4b, which predicted a total effect of PRS on competitive advantage, is supported (
= .14, p < .05). The hypothesized indirect effect of PRS on competitive advantage mediated by
PMC, as per H5b, is not supported, as is expected given the suppression effect dynamic.
Consistent with the lack of support found for H2c, H6c is not supported, that is there is not a
significant indirect effect of PRS on competitive advantage mediated by PMC and by stability
values. Consistent with the support found for H2d, H6d is supported by the indirect effect of
PRS on competitive advantage mediated by PMC and by flexibility values of .01 (p < .01).
Beyond the hypothesized effects there are several significant mediation chains from PRS
through PPS, by way of the inclusion of the un-hypothesized path from PRS to PPS. First, PPS
mediates PRS on PMC ( = .14, p > .01), including with stability values ( = .06, p > .01) and
including with flexibility values ( = .05, p > .05). Second, PPS mediates PRS on competitive
advantage with PMC ( = .02, p > .05), and with PMC and stability values ( = .01, p > .01),
and with PMC and flexibility values ( = .01, p > .05). All these findings regarding PRS are
also corroborated by the R-square analysis in Table 2, which shows that only the indirect effect
of PPS explains the variance of PMC (4%) and competitive advantage (1%).
16 30/03/2015
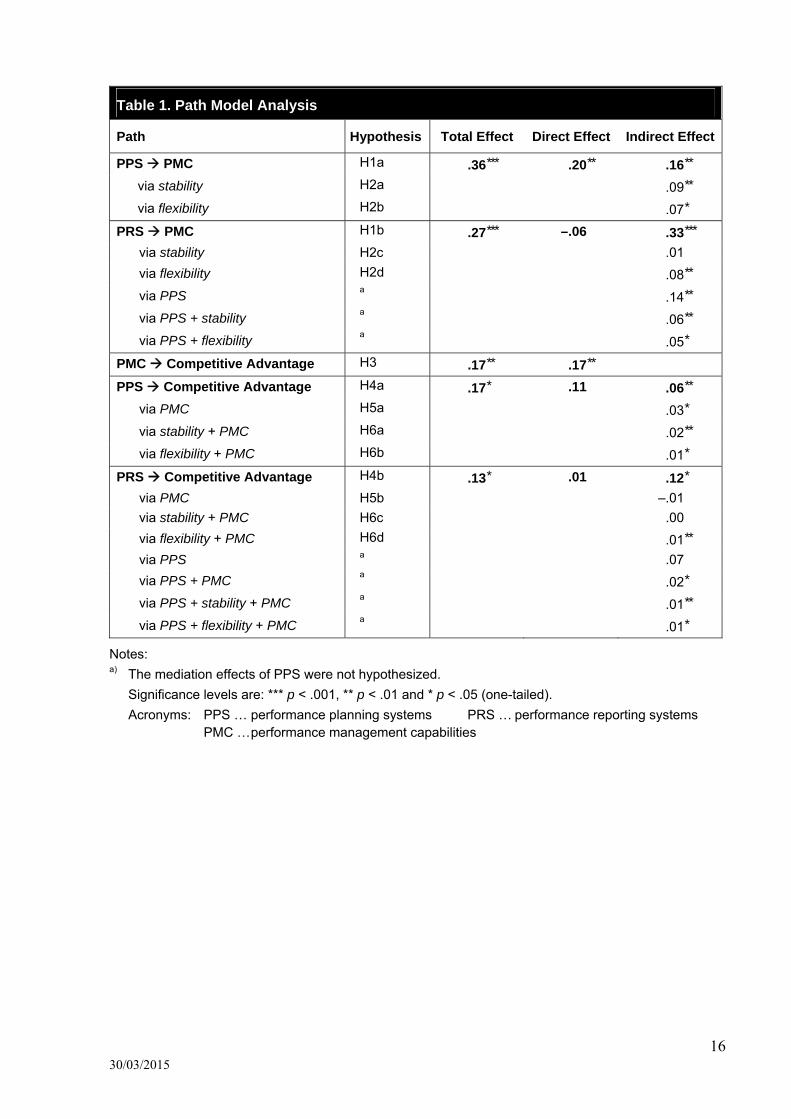
Table 1. Path Model Analysis
Path Hypothesis Total Effect Direct Effect Indirect Effect
PPS PMC H1a .36*** .20** .16**
via stability H2a .09**
via flexibility H2b .07*
PRS PMC H1b .27*** –.06 .33***
via stability H2c .01
via flexibility H2d .08**
via PPS a .14**
via PPS + stability a .06**
via PPS + flexibility a .05*
PMC Competitive Advantage H3 .17** .17**
PPS Competitive Advantage H4a .17* .11 .06**
via PMC H5a .03*
via stability + PMC H6a .02**
via flexibility + PMC H6b .01*
PRS Competitive Advantage H4b .13* .01 .12*
via PMC H5b –.01
via stability + PMC H6c .00
via flexibility + PMC H6d .01**
via PPS a .07
via PPS + PMC a .02*
via PPS + stability + PMC a .01**
via PPS + flexibility + PMC a .01*
Notes: a) The mediation effects of PPS were not hypothesized.
Significance levels are: *** p < .001, ** p < .01 and * p < .05 (one-tailed).
Acronyms: PPS … performance planning systems PRS … performance reporting systems PMC … performance management capabilities
17 30/03/2015
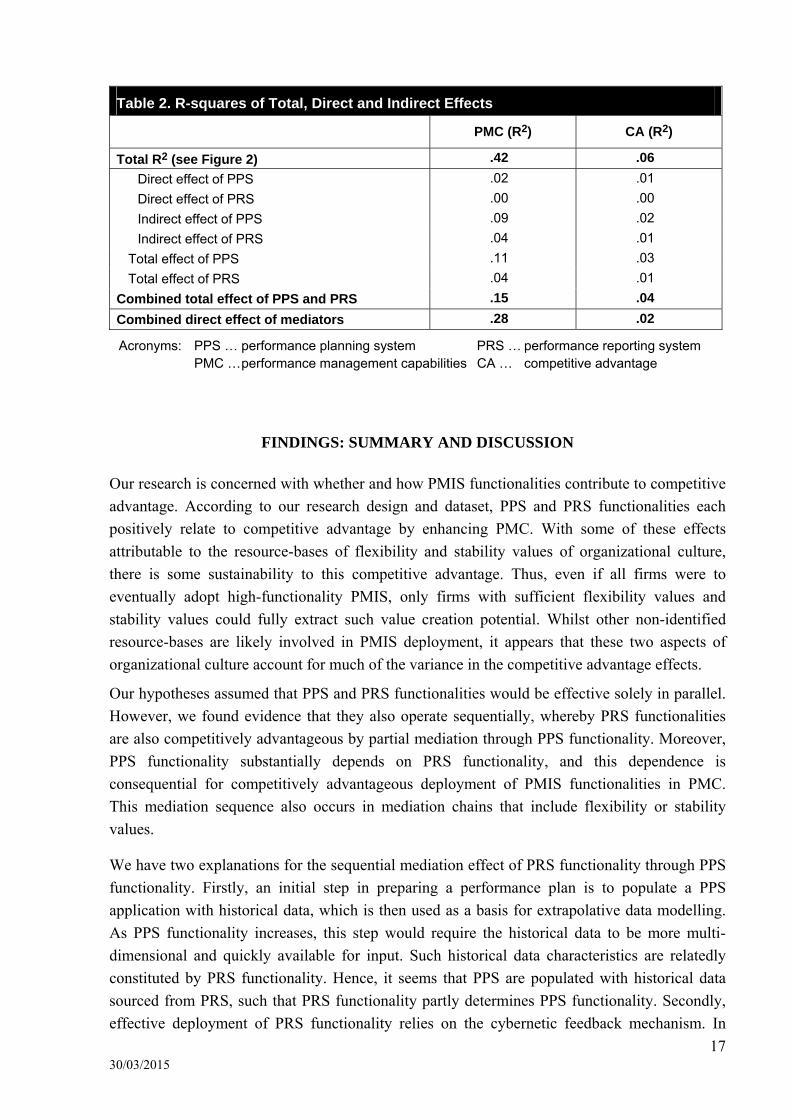
Table 2. R-squares of Total, Direct and Indirect Effects
PMC (R2) CA (R2)
Total R2 (see Figure 2) .42 .06
Direct effect of PPS .02 .01
Direct effect of PRS .00 .00
Indirect effect of PPS .09 .02
Indirect effect of PRS .04 .01
Total effect of PPS .11 .03
Total effect of PRS .04 .01
Combined total effect of PPS and PRS .15 .04
Combined direct effect of mediators .28 .02
Acronyms: PPS … performance planning system PRS … performance reporting system PMC … performance management capabilities CA … competitive advantage
FINDINGS: SUMMARY AND DISCUSSION
Our research is concerned with whether and how PMIS functionalities contribute to competitive
advantage. According to our research design and dataset, PPS and PRS functionalities each
positively relate to competitive advantage by enhancing PMC. With some of these effects
attributable to the resource-bases of flexibility and stability values of organizational culture,
there is some sustainability to this competitive advantage. Thus, even if all firms were to
eventually adopt high-functionality PMIS, only firms with sufficient flexibility values and
stability values could fully extract such value creation potential. Whilst other non-identified
resource-bases are likely involved in PMIS deployment, it appears that these two aspects of
organizational culture account for much of the variance in the competitive advantage effects.
Our hypotheses assumed that PPS and PRS functionalities would be effective solely in parallel.
However, we found evidence that they also operate sequentially, whereby PRS functionalities
are also competitively advantageous by partial mediation through PPS functionality. Moreover,
PPS functionality substantially depends on PRS functionality, and this dependence is
consequential for competitively advantageous deployment of PMIS functionalities in PMC.
This mediation sequence also occurs in mediation chains that include flexibility or stability
values.
We have two explanations for the sequential mediation effect of PRS functionality through PPS
functionality. Firstly, an initial step in preparing a performance plan is to populate a PPS
application with historical data, which is then used as a basis for extrapolative data modelling.
As PPS functionality increases, this step would require the historical data to be more multi-
dimensional and quickly available for input. Such historical data characteristics are relatedly
constituted by PRS functionality. Hence, it seems that PPS are populated with historical data
sourced from PRS, such that PRS functionality partly determines PPS functionality. Secondly,
effective deployment of PRS functionality relies on the cybernetic feedback mechanism. In
18 30/03/2015
providing feedback information, PRS provide historical data as well as feedback in the form of
variances to performance plan data sourced from PPS. The capacity to calculate and report such
feedback variances via PRS functionality is thus limited by the degree of multi-dimensionality
in the baseline performance plan dataset from PPS. That is, the extent to which PRS
functionality is of cybernetic usefulness in PMC is limited by the degree of multi-
dimensionality in the accompanying PPS. Therefore, PPS functionality limits and enables – that
is, it mediates – the deployment of PRS functionality in PMC.
CONTRIBUTIONS, FUTURE RESEARCH AND LIMITATIONS
This study responds to a call for researchers to examine contemporary MIS functionalities
(Clark et al. 2007). We rigorously developed the PPS and PRS functionality constructs from
seminal academic concepts (Ariav 1992) and practitioner literature. As reflective constructs,
they capture the data infrastructures and applications that underlie PMIS functionalities. Unlike
prior survey-based treatment of PMIS as a binary variable (Elbashir et al. 2011), our study
reveals a mediation relationship between the two sub-systems that comprise a PMIS. Future
research could usefully employ the two functionality constructs for other research questions.
Our focus was on mediation effects; future research could examine moderating variables, such
as operational complexities and other business model specifics.
Our research model contributes a synthesis of important prevailing theories in the MIS,
management accounting and strategic management literatures. We bring together resource-
based and interactive/diagnostic controls theories. Given the importance of resource-based
theory in the MIS literature (Oh et al. 2007; Wade et al. 2004) and that organizational culture
was a seminal example of a resource-base for MIS (Barney 1986; Barney 1991), it is surprising
that no other study has systematically linked organizational culture to MIS and competitive
advantage. Our mediation model adds a nuanced perspective, in which greater data possibilities
provide more opportunities for pre-existing cultural values to be leveraged within managerial
information production routines. This perspective is consistent with the tenet that a resource-
base be very difficult to change (Barney 1986; Barney 1991), whilst also consistent with the
modelling of it as an exogenous variable. Future research could examine other ways that
organizational culture provides a resource-base for realizing sustainable competitive advantage
from MIS.
Lastly, given that management accounting practices (such as performance management) are
underpinned by MIS, we contribute to the paucity of cross-disciplinary research between the
MIS and management accounting literatures (e.g. Chapman et al. 2009; Elbashir et al. 2011;
Mithas et al. 2011). Our study contributes to the treatment of performance management in the
MIS literature (Mithas et al. 2011) and also contributes to the treatment of PMIS in the
management accounting literature (Elbashir et al. 2011). Future research could fruitfully
investigate linkages between PMIS and other established management accounting constructs,
such as participative budgeting or strategic management accounting.
19 30/03/2015
This study has several noteworthy limitations. First, as was discussed in detail, whilst
significant procedural remedies were taken, some common method bias and method bias could
be present. We however note that the statistical remedies suggest otherwise, and that the strong
reliability and validity of the measurement models further reduce any concerns. Second, the
survey captured multiple Australian industries, which whilst not controlling for industry effects,
does however help to generalize the findings. A third limitation is the somewhat constricted
conceptualization of organizational culture.
CONCLUSION AND MANAGERIAL IMPLICATIONS
Whilst an important and enduring practitioner topic, PMIS functionality has not yet received
sufficient academic enquiry (Chaudhuri et al. 2011; Chen et al. 2012; Clark et al. 2007; Elbashir
et al. 2011). We contribute an academically-grounded conceptualisation of PMIS functionality,
as a continuous variable reflected by system usability and data multi-dimensionality (Ariav
1992). Applying this conceptualization to the two types of PMIS in practice, we find that PPS
functionality and PRS functionality operate in parallel, and also sequentially, to contribute to
competitive advantage. Our findings suggest that the greater data possibilities provided by
higher PPS and PRS functionalities can enhance performance management information,
strengthening intended and emergent strategy-making in performance management capabilities,
thereby conferring competitive advantages. Our findings also suggest that flexibility values and
stability values provide a resource-based component to this competitive advantage, by
extracting from the data possibilities more opportunities for informing intended and emergent
strategy-making in performance management capabilities.
This study has clear implications for CIOs, CFOs and other managers responsible for
development and deployment of PMIS. Practically all firms have a PPS and a PRS, each with
some level of functionality. Based on our findings, to enhance performance management
capabilities, some aspects of PPS and PRS functionalities are beneficial together, whilst other
aspects are independently effective. The implication is that firms should invest in both the
business intelligence solutions needed for high functionality PRS and for high functionality
PPS.
20 30/03/2015
Appendix A
Analysis
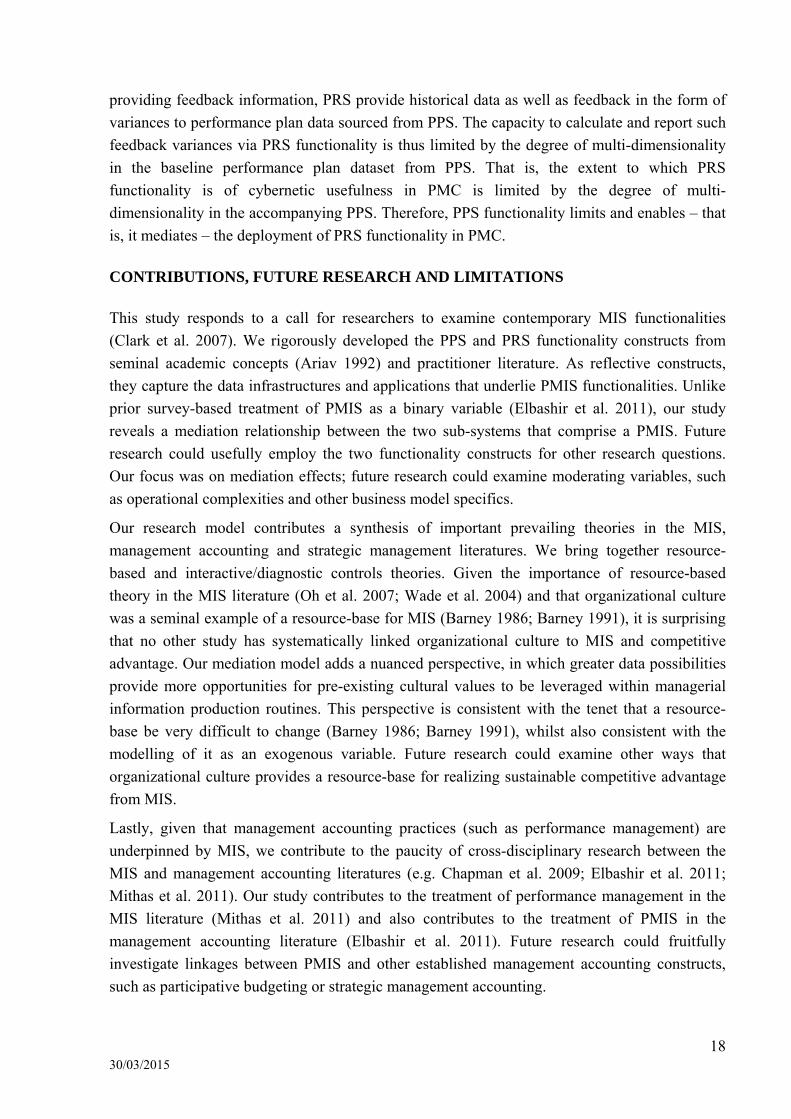
Table 3. Descriptive Statistics
Constructs and Indicators (Likert scale in brackets)
Mean Standard deviation
Skew/SEskewa Kurtosis/SEkurt
b
PRSc 2.96 .92 –.68 –1.12
Response/refresh time (1–5) 3.02 1.06 –1.33 –2.12
Ease of use (1–5) 2.77 1.04 .76 –1.61
Interactive reporting (1–5) 2.99 1.02 –.13 –1.74
Format/presentation features (1–5) 3.05 1.06 –.84 –2.07
PPS 2.92 1.00 –.05 –2.09
Response/refresh time (1–5) 2.98 1.10 –.55 –2.58
Actuals update speed (1–5) 3.05 1.12 –.81 –2.83
Forecast speed (1–5) 2.99 1.09 –.68 –2.77
Planning model sophistication (1–5) 2.67 1.07 1.20 –1.99
Flexibility Values 4.80 1.06 –4.59 1.13
Involvement I (1–7) 5.14 1.24 –5.21 1.75
Involvement II (1–7) 5.03 1.32 –5.58 2.07
Adaptability I (1–7) 4.69 1.32 –2.14 –1.57
Adaptability II (1–7) 4.25 1.42 –2.14 –1.76
Stability Values 5.02 1.14 –4.87 .94
Consistency I (1–7) 4.55 1.33 –4.01 –.48
Consistency II (1–7) 4.83 1.32 –4.47 –.19
Mission I (1–7) 5.50 1.32 –7.01 3.91
Mission II (1–7) 5.17 1.41 –5.27 .30
Diagnostic PMC 3.84 .71 –7.71 8.12
DPMC Profit planningd (1–5) 3.94 .79 –7.84 7.11
DPMC Financial KPIsd (1–5) 3.96 .85 –7.61 5.33
DPMC Non-financial KPIsd (1–5) 3.58 .87 –4.83 2.21
Interactive PMC 4.64 1.13 –4.81 2.04
IPMC Profit planningd (1–7) 4.51 1.37 –3.43 –.74
IPMC Financial KPIsd (1–7) 4.91 1.29 –5.66 1.07
IPMC Non-financial KPIsd (1–7) 4.47 1.28 –3.24 –.02
Competitive Advantage 5.87 1.48 .28 –.22
Sales growth (1–9) 5.88 1.56 .19 –.85
Market share (1–9) 5.88 1.50 .80 .58
Profitability (1–9) 5.84 1.95 –1.89 –1.47
Notes: a) Sample skewness divided by standard error of skewness (SES), with test scores > 2 or < –2
suggesting significant positive or negative skew (Cramer 1997). b) Sample kurtosis divided by standard error of kurtosis (SEK), with test scores > 2 or < –2 suggesting
significant positive or negative kurtosis (Cramer 1997). c) The scores for the constructs are based on the unstandardized latent variable scores. b) Mean of four indicator scores (see survey items in Appendix B).
n = 264

21 30/03/2015
Acronyms: PRS … performance reporting system; PPS … performance planning system PMC … performance management capabilities KPI … key performance indicator DPMC … diagnostic PMC IPMC … interactive PMC SEskew … skewness standard error (SES) SEkurt … kurtosis standard error (SEK)
22 30/03/2015
Table 4. Measurement Model Tests: Indicator Reliability, Construct Reliability and Construct Validity
Constructs and Indicators Loadingsa t-statisticComposite
reliability ()b Cronbach's
b AVEc
PRS .93 .90 .77 Response/refresh time .87 49.59 Ease of use .86 47.98 Interactive reporting .90 63.96 Format/presentation features .88 48.22
PPS .95 .93 .83 Response/refresh time .90 60.80 Actuals update speed .93 89.47 Forecast create/update speed .92 81.75 Planning model sophistication .90 72.66
Flexibility Values .88 .81 .64 Involvement I .84 26.69 Involvement II .82 29.80 Adaptability I .76 22.92 Adaptability II .78 24.41
Stability Values .91 .87 .72 Consistency I .77 26.10 Consistency II .88 48.69 Mission I .85 37.60 Mission II .89 52.11
Diagnostic PMC .88 .80 .72 DPMC Profit planningd .88 44.03 DPMC Financial KPIsd .89 53.57 DPMC Non-financial KPIsd .78 16.38
Interactive PMC .89 .82 .73 IPMC Profit planningd .83 32.26 IPMC Financial KPIsd .89 59.59 IPMC Non-financial KPIsd .85 34.53
Competitive Advantage .93 .88 .80 Sales growth .90 25.49 Market share .92 36.86 Profitability .87 15.70
Notes: a) All loadings are significant at p < .001 (two-tailed). b) Internal consistency: All composite reliability (Dillon-Goldstein’s ) indices are ≥ .60 (Bagozzi et al.
1988) and all Cronbach's indices are ≥ .70 (Nunnally 1978). c) Convergent validity: All AVE indices are ≥ .50 (Fornell et al. 1981). d) Mean of four indicator scores (see survey items in Appendix B).
Acronyms: PRS … performance reporting system; PPS … performance planning system PMC … performance management capabilities KPI … key performance indicator DPMC … diagnostic PMC IPMC … interactive PMC AVE … average variance extracted
23 30/03/2015
Table 5. Cross-loadings
Indicator PRS PPS Stability Flexibility DPMC IPMC CA
Response/refresh time .87 .64 .25 .31 .19 .24 .13
Actuals update speed .86 .58 .25 .32 .20 .23 .13
Forecast create/update speed .90 .57 .24 .33 .23 .29 .08
Planning model sophistication .88 .57 .22 .28 .19 .24 .13
Response/refresh time .57 .90 .36 .34 .32 .37 .16
Ease of use .61 .93 .35 .31 .32 .33 .19
Interactive reporting .64 .92 .28 .30 .30 .32 .16
Format/presentation features .63 .90 .34 .33 .32 .35 .15
Consistency I .21 .30 .77 .56 .37 .44 .14
Consistency II .28 .35 .88 .65 .47 .48 .20
Mission I .18 .28 .85 .64 .49 .48 .30
Mission II .25 .31 .89 .62 .51 .50 .28
Involvement I .24 .24 .63 .84 .46 .50 .33
Involvement II .29 .28 .68 .82 .45 .53 .16
Adaptability I .32 .29 .48 .76 .36 .42 .24
Adaptability II .29 .32 .52 .78 .46 .42 .23
DPMC Profit planning .21 .31 .47 .46 .88 .72 .22
DPMC Financial KPIs .17 .27 .44 .42 .89 .71 .22
DPMC Non-financial KPIs .20 .30 .48 .51 .78 .65 .12
IPMC Profit planning .22 .33 .45 .50 .60 .83 .14
IPMC Financial KPIs .25 .29 .48 .49 .77 .89 .23
IPMC Non-financial KPIs .26 .35 .50 .51 .72 .85 .12
Sales growth .09 .13 .24 .24 .14 .15 .90
Market share .12 .15 .28 .30 .22 .21 .92
Profitability .13 .20 .21 .25 .22 .16 .87
Acronyms: PRS … performance reporting system; PPS … performance planning system PMC … performance management capabilities KPI … key performance indicator DPMC … diagnostic PMC IPMC … interactive PMC CA … competitive advantage
24 30/03/2015
Table 6. Correlation/Path Coefficient Matrix and Discriminant Validity Assessment
PRS PPS Stability Flexibility PMC CA
PRS .88 .67*** .05 .21** –.06 .01
PPS .66*** .91 .33** .21* .20** .11
Stability Values .31*** .37*** .85 - .27*** -
Flexibility Values .35*** .36*** .68*** .80 .35*** -
PMC .30*** .35*** .52*** .53*** .81 .17**
Competitive Advantage .14*** .19*** .31*** .33*** .24*** .90
Notes:
Numbers in bold on the diagonal show the square root of the first-order average variance extracted (AVE) of each construct. Below-diagonal values are construct correlations (Spearman’s ). Discriminant validity is assumed if all values in the diagonal are greater than those in the corresponding rows and columns below (Fornell et al. 1981).
Values above the diagonal are path coefficients of the PLS path model (see also Figure 2) and include one suppressor (PRS PMC).
Significance levels are: *** p < .001, ** p < .01 and * p < .05 (two-tailed).
Acronyms: PRS … performance reporting system PPS … performance planning system PMC … performance management capabilities CA … competitive advantage
Table 7. Variance Inflation Factors (VIF) and Effect Sizes ( 2)
Independent variable (IV)
Dependent variable (DV)
Flexibility Stability PMC CA
VIF 2 VIF 2 VIF 2 VIF 2
PRS 1.83 .03 1.83 .07 1.91 .03 1.83 .01
PPS 1.83 .03 1.83 .00 1.96 .00 1.98 .00
Flexibility Values 2.24 .10
Stability Values 2.20 .06
PMC 1.17 .03
Notes:
2 R2 . – R2 .
1– R2 .
Acronyms:
PRS … performance reporting system PPS … performance planning system
PMC … performance management capabilities CA … competitive advantage
25 30/03/2015
Appendix B:
Survey instrument
Construct: Questions/Indicators:
PPS
functionality
Our planning, budgeting and forecasting systems [strongly disagree (1); strongly agree
(5)]:
Have rapid response and refresh times
Are very quickly updated with actual and base level information
Allow forecasts and budgets to be quickly created and revised
Allow sophisticated planning models to be easily implemented and changed.
PRS
functionality
Our management reporting and analysis systems:
Have sophisticated formats and presentation features
Have highly interactive reporting features
Are very easy to use and navigate by all users
Have rapid response and refresh times.
Interactive
PMC – profit
planning
Please indicate the degree to which you agree or disagree with the following
statements regarding your business unit [strongly disagree (1); strongly agree (7)]:
Senior managers meet and discuss profit planning information very frequently (e.g.,
weekly)
Middle and senior managers meet and discuss profit planning information very
frequently (e.g., weekly)
Profit planning meetings always include consideration of multiple alternatives and
scenarios
Strategic business changes are always assessed in profit planning meetings.
Interactive
PMC –
financial KPIs
Please indicate the degree to which you agree or disagree with the following
statements regarding your business unit [strongly disagree (1); strongly agree (7)]:
Senior managers are continually involved in discussions of financial key
performance indicator (KPIs) with other senior managers
Middle managers constantly interact with senior managers concerning financial KPIs
There is always extensive challenge and debate of assumptions that underlie
financial KPIs
The sustainability of our business strategies is a key theme in discussion of financial
KPIs.
Interactive
PMC – non-
financial KPIs
Please indicate the degree to which you agree or disagree with the following
statements regarding your business unit [strongly disagree (1); strongly agree (7)]:
Senior managers constantly interact with peers to discuss non-financial KPIs
Middle managers are continually involved in discussing non-financial KPIs with
senior managers
Every discussion of non-financial KPIs involves intensive review and revision of
action plans
Significant business development opportunities are a key focus in all discussions of
non-financial KPIs.
26 30/03/2015
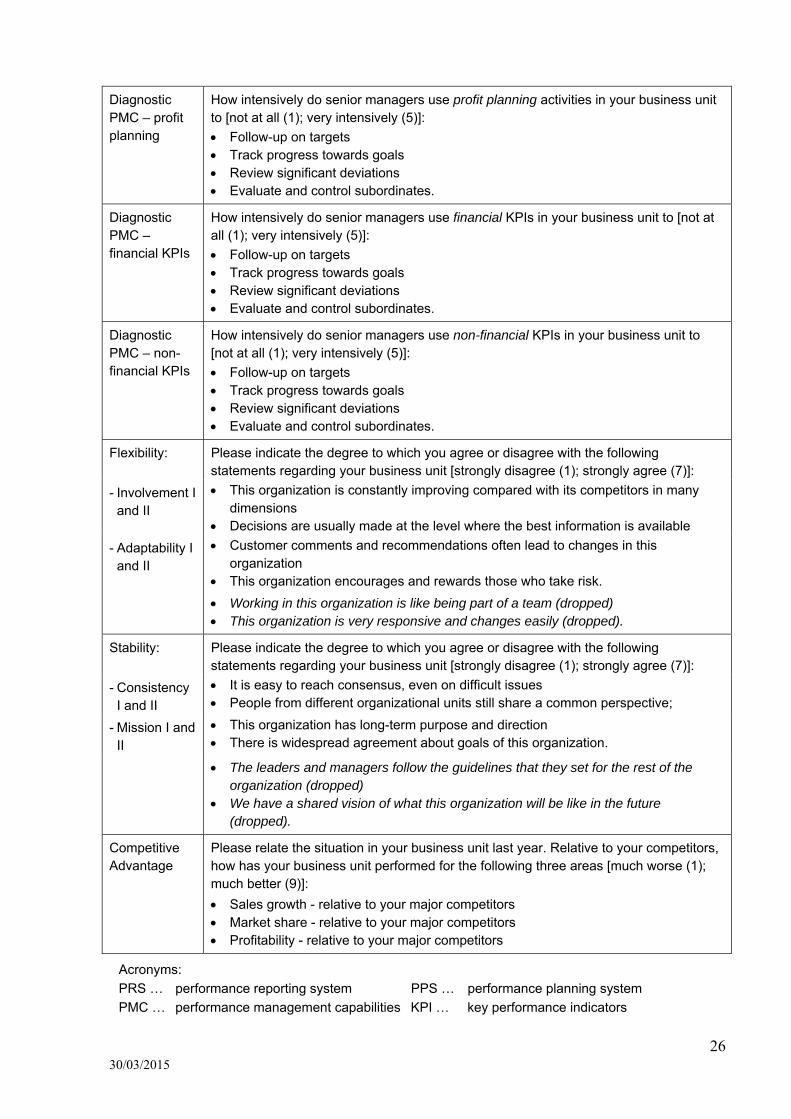
Diagnostic PMC – profit planning
How intensively do senior managers use profit planning activities in your business unit to [not at all (1); very intensively (5)]:
Follow-up on targets Track progress towards goals Review significant deviations Evaluate and control subordinates.
Diagnostic PMC – financial KPIs
How intensively do senior managers use financial KPIs in your business unit to [not at all (1); very intensively (5)]:
Follow-up on targets Track progress towards goals Review significant deviations Evaluate and control subordinates.
Diagnostic PMC – non-financial KPIs
How intensively do senior managers use non-financial KPIs in your business unit to [not at all (1); very intensively (5)]:
Follow-up on targets Track progress towards goals Review significant deviations Evaluate and control subordinates.
Flexibility: Please indicate the degree to which you agree or disagree with the following statements regarding your business unit [strongly disagree (1); strongly agree (7)]:
- Involvement I and II
This organization is constantly improving compared with its competitors in many dimensions
Decisions are usually made at the level where the best information is available
- Adaptability I and II
Customer comments and recommendations often lead to changes in this organization
This organization encourages and rewards those who take risk.
Working in this organization is like being part of a team (dropped) This organization is very responsive and changes easily (dropped).
Stability: Please indicate the degree to which you agree or disagree with the following statements regarding your business unit [strongly disagree (1); strongly agree (7)]:
- Consistency I and II
It is easy to reach consensus, even on difficult issues People from different organizational units still share a common perspective;
- Mission I and II
This organization has long-term purpose and direction There is widespread agreement about goals of this organization.
The leaders and managers follow the guidelines that they set for the rest of the organization (dropped)
We have a shared vision of what this organization will be like in the future (dropped).
Competitive Advantage
Please relate the situation in your business unit last year. Relative to your competitors, how has your business unit performed for the following three areas [much worse (1); much better (9)]:
Sales growth - relative to your major competitors Market share - relative to your major competitors Profitability - relative to your major competitors
Acronyms:
PRS … performance reporting system PPS … performance planning system
PMC … performance management capabilities KPI … key performance indicators
27 30/03/2015
References
Abernethy, M. A., and Bronwell, P. 1999. “The Role of Budgets in Organizations Facing Strategic Change: An Exploratory Study,” Accounting, Organizations & Society (24:3), pp. 189-204.
Ariav, G. 1992. “Information Systems for Managerial Planning and Control: A Conceptual Examination of Their Temporal Structure,” Journal of Management Information Systems (9:2), pp. 77-98.
Armstrong, J. S., and Overton, T. 1977. “Estimating Nonresponse Bias in Mail Surveys,” Journal of Marketing Research (14:3), pp. 396-402.
Bagozzi, R., and Yi, Y. 1988. “On the Evaluation of Structural Equation Models,” Journal of the Academy of Marketing Science (16:1), pp. 74-94.
Barclay, D., Thompson, R., and Higgins, C. 1995. “The Partial Least Squares (PLS) Approach to Causal Modeling: Personal Computer Adoption and Use an Illustration,” Technology Studies (2:2), pp. 285-309.
Barney, J. B. 1986. “Organizational Culture: Can It Be a Source of Sustained Competitive Advantage?,” Academy of Management Review (11:3), pp. 656-665.
Barney, J. B. 1991. “Firm Resources and Sustained Competitive Advantage,” Journal of Management (17:1), pp. 99-120.
Baron, R. M., and Kenny, D. A. 1986. “The Moderator-Mediator Variable Distinction in Social Psychological Research: Conceptual, Strategic, and Statistical Considerations,” Journal of Personality and Social Psychology (51:6), pp. 1173-1182.
Baskerville, R. L., and Myers, M. D. 2009. “Fashion Wave in Information Systems Research and Practice,” MIS Quarterly (33:4), pp. 647-662.
Bhatt, G. D., and Grover, V. 2005. “Types of Information Technology Capabilities and Their Role in Competitive Advantage: An Empirical Study,” Journal of Management Information Systems (22:2), pp. 253-277.
Birnberg, J. G., and Snodgrass, C. 1988. “Culture and Control: A Field Study,” Accounting, Organizations and Society (13:5), pp. 447-464.
Bisbe, J., Batista-Foguet, J. M., and Chenhall, R. 2007. “Defining Management Accounting Constructs: A Methodological Note on the Risks of Conceptual Misspecification,” Accounting, Organizations and Society (32:7), pp. 789-820.
Bisbe, J., and Otley, D. 2004. “The Effects of the Interactive Use of Management Control Systems on Product Innovation,” Accounting, Organizations and Society (29:8), pp. 709-737.
Bollen, K. A., and Stine, R. 1990. “Direct and Indirect Effects: Classical and Bootstrap Estimates of Variability,” Sociological Methodology (20:1), pp. 115-140.
Bradley, R. V., Pridmore, J., and Byrd, T. A. 2006. “Information Systems Success in the Context of Different Corporate Cultural Types: An Empirical Investigation,” Journal of Management Information Systems (23:2), pp. 267-294.
Chapman, C., and Kihn, L. A. 2009. “Information System Integration, Enabling Control and Performance,” Accounting, Organizations and Society (34:2), pp. 151-169.
Chaudhuri, S., Dayal, U., and Narasayya, V. 2011. “An Overview of Business Intelligence Technology,” Communications of the ACM (54:8), pp. 88-98.
Chen, H., Chiang, R. H. L., and Storey, V. C. 2012. “Business Intelligence and Analytics: From Big Data to Big Impact,” MIS Quarterly (36:4), pp. 1165-1188.
Cheung, G. W., and Lau, R. S. 2008. “Testing Mediation and Suppression Effects of Latent Variables,” Organizational Research Methods (11:2), pp. 296-325.
Chin, W. W. 1998a. “Issues and Opinion on Structural Equation Modeling,” MIS Quarterly (22:1), pp. 7-16.
28 30/03/2015
Chin, W. W. 1998b. “The Partial Least Squares Approach to Structural Equation Modeling,” in Modern Methods for Business Research, G.A. Marcoulides (ed.), Mahwah, NJ: Lawrence Erlbaum Associates, pp. 195-336.
Chin, W. W. 2010. “How to Write up and Report PLS Analysis,” in Handbook of Partial Least Squares - Concepts, Methods and Applications in Marketing and Related Fields, V.E. Vinzi, W.W. Chin, J. Henseler and H. Wang (eds.), Berlin; Heidelberg: Springer, pp. 655-690.
Clark, T. D., Jones, M. C., and Armstrong, C. P. 2007. “The Dynamic Structure of Management Support Systems: Theory Development, Research Focus and Direction,” MIS Quarterly (31:3), pp. 579-615.
Cohen, J., Cohen, P., West, S. G., and Aiken, L. S. 2003. Applied Multiple Regression/Correlation Analysis for the Behavioural Sciences (3rd ed.), Mahwah: Erlbaum.
Conger, A. J. 1974. “A Revised Definition for Suppressor Variables: A Guide to Their Identification and Interpretation,” Educational and Psychological Measurement (34:1), pp. 35-46.
Cramer, D. 1997. Basic Statistics for Social Research - Step-by-Step Calculations & Computer Techniques Using Minitab, London: Psychology Press.
de Heus, P. 2012. “R Squared Effect-Size Measures and Overlap between Direct and Indirect Effect in Mediation Analysis,” Behavior Research Methods (44:1), pp. 213-221.
Denison, D. R., and Mishra, A. K. 1995. “Toward a Theory of Organizational Culture and Effectiveness,” Organization Science (6:2), pp. 204-223.
Dillman, D. A. 2007. Mail and Internet Surveys: The Tailored Design Method (2nd ed.), New York: Wiley.
Elbashir, M. Z., Collier, P. A., and Sutton, S. G. 2011. “The Role of Organizational Absorptive Capacity in Strategic Use of Business Intelligence to Support Integrated Management Control Systems,” The Accounting Review (86:1), pp. 155-184.
Fairchild, A. J., MacKinnon, D. P., Taborga, M. P., and Taylor, A. B. 2009. “R2 Effect-Size Measures for Mediation Analysis,” Behavior Research Methods (41:2), pp. 486-498.
Fedorowicz, J., and Konsynski, B. 1992. “Organization Support Systems: Bridging Business and Decision Processes,” Journal of Management Information Systems (8:4), pp. 5-25.
Fey, C. F., and Denison, D. R. 2003. “Organizational Culture and Effectiveness: Can American Theory Be Applied in Russia?,” Organization Science (14:6), pp. 686-706.
Fornell, C., and Larcker, D. F. 1981. “Evaluating Structural Equation Models with Unobservable Variables and Measurement Error,” Journal of Marketing Research (18:1), pp. 39-50.
Garg, V. K., Walters, B. A., and Priem, R. L. 2003. “Chief Executive Scanning Emphases, Environmental Dynamism and Manufacturing Performance,” Strategic Management Journal (24:8), pp. 725-744.
Grafton, J., Lillis, A. M., and Widener, S. K. 2010. “The Role of Performance Measurement and Evaluation in Building Organizational Capabilities and Performance,” Accounting, Organization and Society (35:7), pp. 689-706.
Hayes, A. F. 2009. “Beyond Baron and Kenny: Statistical Mediation Analysis in the New Millennium,” Communication Monographs (76:4), pp. 408-420.
Henri, J. F. 2006. “Organizational Culture and Performance Measurement Systems,” Accounting, Organization and Society (31:1), pp. 77-103.
Hulland, J. 1999. “The Use of Partial Least Square (PLS) in Strategic Management Research: A Review of Four Recent Studies,” Strategic Management Journal (20:2), pp. 195-204.
Leidner, D. E., and Kayworth, T. 2006. “A Review of Culture in Information Systems Research: Toward a Theory of Information Technology Culture Conflict,” MIS Quarterly (30:2), pp. 357-399.
29 30/03/2015
Liang, H., Saraf, N., Hu, Q., and Xue, Y. 2007. “Assimilation of Enterprise Systems: The Effect of Institutional Pressures and the Mediating Role of Top Management,” MIS Quarterly (31:1), pp. 59-87.
Libby, T., and Lindsay, R. M. 2010. “Beyond Budgeting or Budgeting Reconsidered? A Survey of North American Budgeting Practice,” Management Accounting Research (21:1), pp. 56-75.
Livari, J., and Huisman, M. 2007. “The Relationship between Organizational Culture and the Deployment of System Development Methodologies,” MIS Quarterly (31:1), pp. 35-58.
Maassen, G. H., and Bakker, A. B. 2001. “Suppressor Variables in Path Models - Definitions and Interpretations,” Sociological Methods and Research (30:2), pp. 241-270.
MacKinnon, D. P., Krull, J. L., and Lockwood, C. M. 2000. “Equivalence of the Mediation, Confounding and Suppression Effect,” Prevention Science (1:4), pp. 173-181.
MacKinnon, D. P., Lockwood, C. M., Hoffman, J. M., West, S. G., and Sheets, V. 2002. “A Comparison of Methods to Test Mediation and Other Intervening Variable Effects,” Psychological Methods (7:1), pp. 83-104.
MacKinnon, D. P., Lockwood, C. M., and Williams, J. 2004. “Confidence Limits for the Indirect Effect: Distribution of the Product and Resampling Methods,” Multivariate Behavioral Research (39:1), pp. 99-128.
Malmi, T., and Brown, D. A. 2008. “Management Control Systems as a Package - Opportunities, Challenges and Research Directions,” Management Accounting Research (19:4), pp. 287-300.
Melville, N., Kraemer, K., and Gurbaxani, V. 2004. “Review: Information Technology and Organizational Performance: An Integrative Model of IT Business Value,” MIS Quarterly (28:2), pp. 283-322.
Mintzberg, H. 1979. “An Emerging Strategy of 'Direct' Research,” Administrative Science Quarterly (24:4), pp. 582-589.
Mithas, S., Ramasubbu, N., and Sambamurthy, V. 2011. “How Information Management Capability Influences Firm Performance,” MIS Quarterly (35:1), pp. 237-256.
Mithas, S., Tafti, A., Bardhan, I. R., and Goh, J. M. 2012. “Information Technology and Firm Profitability: Mechanisms and Empirical Evidence,” MIS Quarterly (36:1), pp. 205-224.
Naranjo-Gil, D., and Hartmann, F. 2007. “Management Accounting Systems, Top Management Team Heterogeneity and Strategic Change,” Accounting, Organizations and Society (32:7), pp. 735-756.
Netemeyer, R. G., Bearden, W. O., and Sharma, S. 2003. Scaling Procedures: Issues and Applications, Thousand Oaks: Sage.
Nunnally, J. C. 1978. Psychometric Theory (2nd ed.), New York: McGraw-Hill.
O'Reilly, C. A., and Chatman, J. A. 1996. “Culture as Social Control: Corporations, Cults and Commitment,” Research in Organizational Behavior (18:1), pp. 157-200.
Oh, W., and Pinsonneault, A. 2007. “On the Assessment of the Strategic Value of Information Technologies: Conceptual and Analytical Approaches,” MIS Quarterly (31:2), pp. 239-265.
Ouchi, W. G. 1979. “A Conceptual Framework for the Design of Organizational Control Mechanisms,” Management Science (25:9), pp. 833-848.
Pandey, S., and Elliott, W. 2010. “Suppressor Variables in Social Work Research: Ways to Identify in Multiple Regression Models,” Journal of the Society for Social Work and Research (1:1), pp. 28-40.
Penrose, E. T. 1959. The Theory of the Growth of the Firm, New York: Wiley.
30 30/03/2015
Podsakoff, P. M., MacKenzie, S. B., Lee, J. Y., and Podsakoff, N. P. 2003. “Common Method Biases in Behavioral Research: A Critical Review of the Literature and Recommended Remedies,” Journal of Applied Psychology (88:5), pp. 879-903.
Podsakoff, P. M., MacKenzie, S. B., and Podsakoff, N. P. 2012. “Sources of Method Bias in Social Science Research and Recommendations on How to Control It,” Annual Review of Psychology (63), pp. 539-569.
Podsakoff, P. M., and Organ, D. W. 1986. “Self-Reports in Organizational Research: Problems and Prospects,” Journal of Management (12:4), pp. 531-544.
Preacher, K. J., and Hayes, A. F. 2008. “Asymptotic and Resampling Strategies for Assessing and Comparing Indirect Effects in Multiple Mediator Models,” Behavior Research Methods (40:3), pp. 879-891.
Preacher, K. J., and Kelley, K. 2011. “Effect Size Measures for Mediation Models: Quantitative Strategies for Communicating Indirect Effects,” Psychological Methods (16:2), pp. 93-115.
Rai, A., Patnayakuni, R., and Seth, N. 2006. “Firm Performance Impacts of Digitally Enabled Supply Chain Integration Capabilities,” MIS Quarterly (30:2), pp. 225-246.
Ravichandran, T., and Lertwongsatien, C. 2005. “Impact of Information Systems Resources and Capabilities on Firm Performance: A Resource-Based Perspective,” Journal of Management Information Systems (21:4), pp. 237-276.
Ringle, C. M., Sarstedt, M., and Straub, D. W. 2012. “Editor's Comments: A Critical Look at the Use of PLS-SEM in MIS Quarterly,” MIS Quarterly (36:1), pp. iii-xiv.
Ringle, C. M., Wende, S., and Will, S. 2005. Smart PLS 2.0 (M3) Beta, Hamburg.
Rucker, D. D., Preacher, K. J., Tormala, Z. L., and Petty, R. E. 2011. “Mediation Analysis in Social Psychology: Current Practices and New Recommendations,” Social and Personality Psychology Compass (6:5), pp. 359-371.
Schein, E. H. 1992. Organizational Culture and Leadership, San Francisco: Jossey-Bass.
Shrout, P. E., and Bolger, N. 2002. “Mediation in Experimental an Nonexperimental Studies: New Procedures and Recommendations,” Psychological Methods (7:4), pp. 422-445.
Simons, R. 1990. “The Role of Management Control Systems in Creating Competitive Advantage: New Perspectives,” Accounting, Organizations and Society (15:1), pp. 127-143.
Simons, R. 1994. “How New Top Managers Use Control Systems as Levers of Strategic Renewal,” Strategic Management Journal (15:3), pp. 169-189.
Simons, R. 1995. Levers of Control: How Managers Use Innovative Control Systems to Drive Strategic Renewal, Boston: Harvard University Press.
Simons, R., Davila, A., and Kaplan, R. S. 2000. Performance Measurement and Control System for Implementing Strategy, Upper Saddle River, NJ: Prentice Hall.
Sivabalan, P., Booth, P. J., Malmi, T., and Brown, D. A. 2009. “An Exploratory Study of Operational Reasons to Budget,” Accounting & Finance (49:4), pp. 849-871.
Sørensen, J. B. 2002. “The Strength of Corporate Culture and the Reliability of Firm Performance,” Administrative Science Quarterly (47:1), pp. 70-91.
Taylor, A. B., MacKinnon, D. P., and Tein, J. Y. 2008. “Tests of the Three-Path Mediated Effect,” Organizational Research Methods (11:2), pp. 241-269.
Teece, D. J., Pisano, G., and Shuen, A. 1997. “Dynamic Capabilities and Strategic Management,” Strategic Management Journal (18:7), pp. 509-533.
Tourangeau, R., Rips, L. J., and Rasinski, K. 2000. The Psychology of Survey Response, Cambridge: Cambridge University Press.
31 30/03/2015
Wade, M., and Hulland, J. 2004. “The Resource-Based View and Information Systems Research: Review, Extension and Suggestions for Future Research,” MIS Quarterly (28:1), pp. 107-142.
Wang, P. 2010. “Chasing the Hottest IT: Effects of Information Technology Fashion on Organizations,” MIS Quarterly (34:1), pp. 63-85.
Wernerfelt, B. 1984. “A Resource-Based View of the Firm,” Strategic Management Journal (5:2), pp. 171-180.
Wetzels, M., Odekerken-Schröder, G., and van Oppen, C. 2009. “Using PLS Path Modeling for Assessing Hierarchial Construct Models: Guidelines and Empirical Illustration,” MIS Quarterly (33:1), pp. 177-195.
Widener, S. K. 2007. “An Empirical Analysis of the Levers of Control Framework,” Accounting, Organization and Society (32:7), pp. 757-788.
Winter, S. G. 2000. “The Satisficing Principle in Capability Learning,” Strategic Management Journal (21:10-11), pp. 981-996.
Wold, H. 1982. “Soft Modeling: The Basic Design and Some Extensions,” in Systems under Indirect Observations: Causality, Structure, Prediction, K.G. Joreskog and H. Wold (eds.), Amsterdam: North-Holland, pp. 1-54.
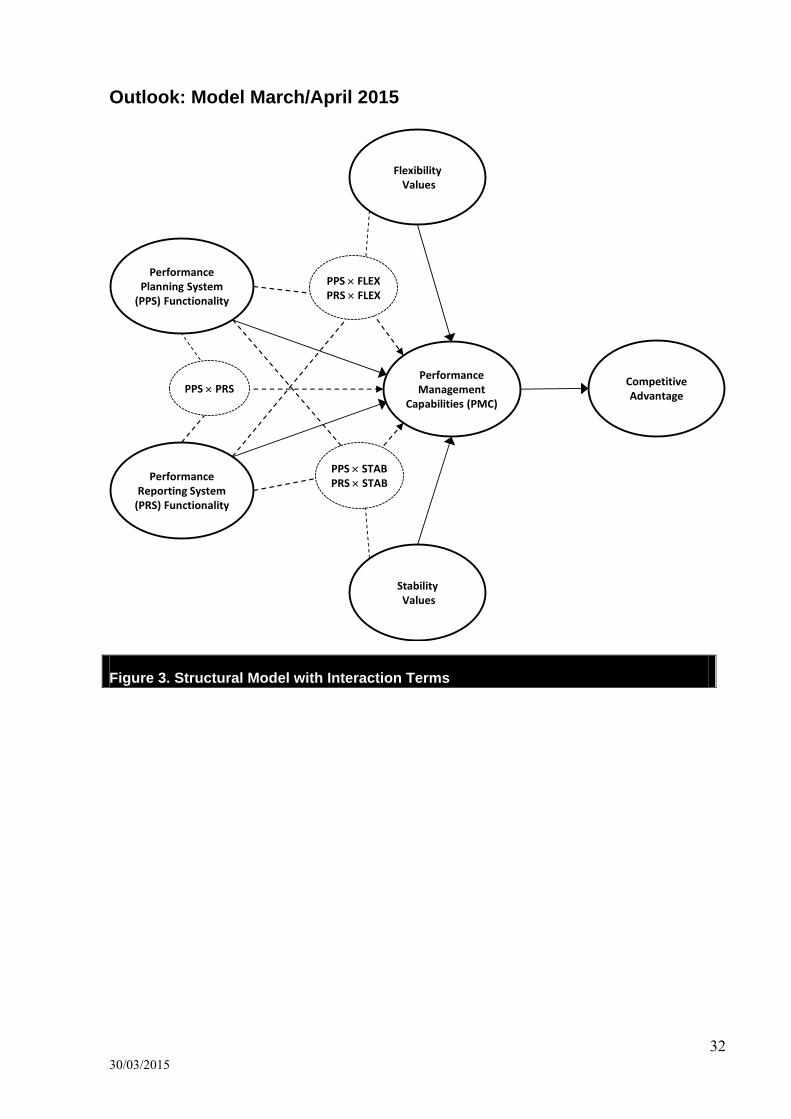
32 30/03/2015
Outlook: Model March/April 2015
Figure 3. Structural Model with Interaction Terms
Performance Planning System (PPS) Functionality
Performance Reporting System (PRS) Functionality
FlexibilityValues
Performance Management
Capabilities (PMC)
StabilityValues
Competitive Advantage
PPS FLEXPRS FLEX
PPS STABPRS STAB
PPS PRS