Chapter III 3. Performance audit relating to Statutory ...
35
57 Maharashtra State Road Transport Corporation 3.1 Performance Audit on the functioning of Maharashtra State Road Transport Corporation Executive Summary The Maharashtra State Road Transport Corporation (Corporation) provides public transport in the State through its 247 depots. The Corporation had fleet strength of 16,357 buses (including 24 hired buses) as on 31 March 2009 and carried an average of 60.62 lakh passengers per day during the period from 2004-05 to 2008-09. It had a monopoly in stage carriage in mofussil areas. The performance audit of the Corporation for the period from 2004-05 to 2008-09 was conducted to assess efficiency and economy of its operations, ability to meet its financial commitments, possibility of realigning the business model to tap non-conventional sources of revenue, existence and adequacy of fare policy and effectiveness of the top management in monitoring the affairs of the Corporation. Finance and Performance The Corporation started earning profit from 2006-07 during the review period and earned profit of Rs 118.09 crore in 2008-09 without considering prior period adjustments. Its accumulated losses and borrowings stood at Rs 457.13 crore and Rs 58.78 crore respectively as at 31 March 2009. The Corporation was not able to achieve the All India Average (AIA) for cost per KM (Rs 19.94) during 2006-07 to 2008-09. Audit noticed that more effective monitoring of key parameters coupled with certain policy measures could see further improvement in performance and increase in revenue. Declining Share The per capita kilometres operated by the Corporation decreased from 17.44 in 2004-05 to 16.32 in 2008-09. The vehicle density per one lakh population decreased from 15.63 in 2004-05 to 14.70 in 2008-09. However, no scientific survey was conducted to assess the demand for public transport. Further, no Integrated Transport Policy had been formulated for the State. Vehicle profile and utilisation The Corporation’s buses consisted of own fleet of 16,333 buses and 24 hired AC buses as on 31 March 2009. Of its own fleet, 689 (4.22 per cent) buses were overage, i.e., more than ten years old. The percentage of overage buses declined from 10 per cent in 2004-05 to 4.22 per cent in 2008-09 due to acquisition of 8,076 new buses during 2004-09 at a cost of Rs 907.54 crore. The acquisition was funded through capital contribution (Rs 734.41 crore) and internal resources (Rs 173.13 crore). The Corporation’s fleet utilisation at 94.28 per cent in 2008-09 was above AIA of 92 per cent. Its vehicle productivity at 316 KM per day per bus during 2008-09 was above the AIA of 313 KM. Similarly, its load factor at 71.20 per cent remained above the AIA of 63 per cent. However, the Corporation had not fixed targets for vehicle productivity. The percentage of cancellation of Scheduled KMs remained higher than the All India best performers. The Corporation had assessed trip-wise profitability without reckoning the amount of concessions in fare reimbursed by the State Government. The Corporation’s Chapter III 3. Performance audit relating to Statutory Corporation
Transcript of Chapter III 3. Performance audit relating to Statutory ...

57
Maharashtra State Road Transport Corporation 3.1 Performance Audit on the functioning of Maharashtra State Road Transport Corporation Executive Summary
The Maharashtra State Road Transport Corporation (Corporation) provides public transport in the State through its 247 depots. The Corporation had fleet strength of 16,357 buses (including 24 hired buses) as on 31 March 2009 and carried an average of 60.62 lakh passengers per day during the period from 2004-05 to 2008-09. It had a monopoly in stage carriage in mofussil areas. The performance audit of the Corporation for the period from 2004-05 to 2008-09 was conducted to assess efficiency and economy of its operations, ability to meet its financial commitments, possibility of realigning the business model to tap non-conventional sources of revenue, existence and adequacy of fare policy and effectiveness of the top management in monitoring the affairs of the Corporation.
Finance and Performance
The Corporation started earning profit from 2006-07 during the review period and earned profit of Rs 118.09 crore in 2008-09 without considering prior period adjustments. Its accumulated losses and borrowings stood at Rs 457.13 crore and Rs 58.78 crore respectively as at 31 March 2009. The Corporation was not able to achieve the All India Average (AIA) for cost per KM (Rs 19.94) during 2006-07 to 2008-09. Audit noticed that more effective monitoring of key parameters coupled with certain policy measures could see further improvement in performance and increase in revenue.
Declining Share
The per capita kilometres operated by the Corporation decreased from 17.44 in 2004-05 to 16.32 in 2008-09. The vehicle density per one lakh population decreased from 15.63 in 2004-05 to 14.70 in 2008-09. However, no scientific survey was conducted to assess the demand for public transport. Further, no Integrated Transport Policy had been formulated for the State.
Vehicle profile and utilisation
The Corporation’s buses consisted of own fleet of 16,333 buses and 24 hired AC buses as on 31 March 2009. Of its own fleet, 689 (4.22 per cent) buses were overage, i.e., more than ten years old. The percentage of overage buses declined from 10 per cent in 2004-05 to 4.22 per cent in 2008-09 due to acquisition of 8,076 new buses during 2004-09 at a cost of Rs 907.54 crore. The acquisition was funded through capital contribution (Rs 734.41 crore) and internal resources (Rs 173.13 crore). The Corporation’s fleet utilisation at 94.28 per cent in 2008-09 was above AIA of 92 per cent. Its vehicle productivity at 316 KM per day per bus during 2008-09 was above the AIA of 313 KM. Similarly, its load factor at 71.20 per cent remained above the AIA of 63 per cent. However, the Corporation had not fixed targets for vehicle productivity. The percentage of cancellation of Scheduled KMs remained higher than the All India best performers. The Corporation had assessed trip-wise profitability without reckoning the amount of concessions in fare reimbursed by the State Government. The Corporation’s
Chapter III
3. Performance audit relating to Statutory Corporation

Audit Report (Commercial) for the year ended 31 March 2009
58
performance on preventive maintenance was unsatisfactory as the maintenance schedules in respect of docking and reconditioning of buses were not adhered to.
Economy in operations
The operational performance of the Corporation in the areas of manpower deployment and fuel efficiency was below AIA. Manpower and fuel constituted 69.67 per cent of total cost. Interest, depreciation and taxes accounted for 21.10 per cent and are not controllable in short time. Thus, the controllable expenditure has to come from manpower and fuel. The expenditure on repairs and maintenance was Rs 413.23 crore (Rs 2.53 lakh per bus) in 2008-09, of which nearly 50 per cent was on manpower. The fuel consumption as compared to AIA was in excess to the extent of Rs 39.19 crore during 2004-05 to 2008-09.
The Corporation started hiring AC buses from 2006-07 onwards where the Corporation provides conductors, makes payment of fuel charges at agreed rates and makes payment as per KM operated. The Corporation earned a net profit of Rs 4.11 crore from hired buses during 2006-09. Audit observed that there was further scope to go for more hired buses considering its lower cost.
Revenue maximisation
The State Government directed that the amount of concessions in fare reimbursable by it may be adjusted against the passenger tax (PT) payable to the Government. However, the PT was not sufficient to adjust the full amount of concession and the unrealised claims due from the Government stood at Rs 359.44 crore as of March 2009. Besides, the State Government has not paid its share of Rs 352 crore in wage settlement of employees agreed in August 2004. Further, the Corporation has about 136.53 lakh square metres of land. As it utilises ground floor/land for its operations, the space
above can be developed on public private partnership (PPP) basis to earn steady income which can be used to cross-subsidise its operations. However, the Corporation had not framed any policy in this regard.
Need for a regulator
The fare revision was governed by an automatic formula approved by the State Government for certain elements of cost. However, the increase in input cost was not correctly fed in the formula resulting in higher fare revision. The Corporation had also not formulated norms for providing services on uneconomical routes. Thus, it would be desirable to have an independent regulatory body (like State Electricity Regulatory Commission) to fix the fares, specify operations on uneconomical routes and address grievances of commuters.
Inadequate monitoring
The fixation of targets for various operational parameters and an effective Management Information System for obtaining feed back on achievement thereof are essential for monitoring by the top management. However, Audit observed that norms/benchmarks for bus staff ratio and vehicle productivity had not been fixed.
Conclusion and Recommendations
Though the Corporation has been earning profit from 2006-07 onwards, it can control cost of operations by reducing manpower and fuel costs through effective monitoring. The Corporation can increase profit by resorting to hiring of buses and tapping non-conventional sources of revenue. This review contains eight recommendations to improve the Corporation’s performance. Hiring of buses, creating a regulator to regulate fares and services and tapping non-conventional sources of revenue by undertaking PPP projects are some of these recommendations.

Chapter III- Performance Audit relating to Statutory corporation
59
Introduction
3.1 In Maharashtra public road transport is provided by the Maharashtra State Road Transport Corporation (Corporation) which is mandated to provide an efficient, adequate, economical and properly coordinated road transport. The Corporation has a monopoly in stage carriage in mofussil (Rural) areas. It also operates city services in eight urban/semi urban locations . In 13 other urban locations the city services are operated by the Municipal Corporations. Private stage carriage is not allowed in the State, however, the Home Department (Transport) of the State Government issues permits to private operators for point to point services.
3.2 The Corporation was incorporated on 1 July 1961 by Government of Maharashtra (GoM) under Section 3 of the Road Transport Corporations Act, 1950 as a Statutory Corporation of the State Government. The Corporation is under the administrative control of the Home Department (Transport) of the GoM. The Management of the Corporation is vested with a Board of Directors (BoD) comprising of the Chairman, Vice Chairman & Managing Director (VC&MD) and six Directors appointed by the GoM. The day-to-day operations are carried out by the VC&MD who is the Chief Executive of the Corporation, with the assistance of General Managers, Deputy General Managers, Regional Managers, Divisional Controllers and Depot Managers. The Corporation has six Regional Offices, 30 Divisional Offices, 247 Depots, nine tyre retreading plants, 30 Divisional Workshops and three Central Workshops (CWs). The bus body building is carried out departmentally in its CWs.
3.3 The Corporation had a fleet strength of 16,357 buses (including 24 hired buses) as on 31 March 2009. The Corporation carried on an average 60.62 lakh passengers per day during 2004-05 to 2008-09. The turnover of the Corporation was Rs 4,196.19 crore in 2008-09 which was equal to 0.60 per cent of the State Gross Domestic Product (Rs 6,97,683 crore♠). The Corporation employed 96,454 employees as at 31 March 2009.
3.4 A review on fleet utilisation of the Corporation was included in the Report of the Comptroller and Auditor General of India for the year 2006-07 (Commercial), GoM. The report has not been discussed by the Committee on Public Undertakings so far (December 2009). Scope of Audit and Audit Methodology
3.5 The present review conducted between February and April 2009 covers the performance of the Corporation during the period from 2004-05 to 2008-09. The review mainly deals with operational efficiency, financial management, fare policy, fulfillment of social obligations and monitoring by
Arnala, Chandrapur, Miraj, Nalla Sopara, Nashik, Ratnagiri, Satara and Vasai. Akola, Amravati, Aurangabad, Kolhapur, Kalyan-Dombivali, Mira-Bhayandar, Mumbai
(BEST), Nanded, Navi Mumbai, Pimpri-Chinchwad, Pune, Solapur and Thane. ♠ Estimated.

Audit Report (Commercial) for the year ended 31 March 2009
60
top Management of the Corporation. The audit examination involved scrutiny of records at the Head Office, one (Dapodi, Pune) out of three CWs, five≠ Divisional Offices along with five Divisional Workshops out of 30 Divisions and 20 Depots¥ out of 247 Depots.
The parameters of fleet strength, fleet utilisation, trip analysis number of schedules operated, scheduled kilometres, earning per Kilometre (EPKM), vehicle productivity, tyre consumption rate, cost per Kilometre (CPKM), ratio of operated KMs to sanctioned KMs and consumption of High Speed Diesel (HSD) were considered for selection of units. The Audit sample covered 2,528 buses out of the fleet of 16,357 buses as on 31 March, 2009 and expenditure of Rs 604.89 crore out of total expenditure of Rs 4,078.10 crore during 2008-09.
3.6 The methodology adopted for attaining the audit objectives with reference to audit criteria consisted of explaining audit objectives to top management, scrutiny of records at Head Office and selected units, interaction with the Auditee personnel, analysis of data with reference to audit criteria, raising of audit queries, discussion of audit findings with the Management and issue of draft review to the Management for comments.
Audit objectives
3.7 The objectives of the performance audit were to assess:
3.7.1 Operational Performance
• the extent to which the Corporation was able to keep pace with the growing demand for public transport;
• whether the Corporation succeeded in recovering the cost of operations;
• the extent to which the Corporation was running its operations efficiently;
• whether adequate maintenance was undertaken to keep the vehicles roadworthy; and
• the extent to which economy was ensured in cost of operations.
3.7.2 Financial Management
• whether the Corporation was able to meet its commitments and recover its dues efficiently; and
≠ Akola, Mumbai, Nagpur, Satara and Sindhudurg. ¥Akola-I and II, Devgad, Kankavali, Karanja, Katol, Koregaon, Kudal, Kurla, Mahabaleshwar, Medha, Mumbai Central, Nagpur-I and II, Panvel, Parel, Ramtek, Satara, Vengurla and Washim.
'A' trips are profit making trips, 'B' trips are not recovering total cost component and 'C' trips are not recovering even variable cost.

Chapter III- Performance Audit relating to Statutory corporation
61
• the possibility of realigning the business model of the Corporation to tap non-conventional sources of revenue and adopting innovative methods of accessing such funds.
3.7.3 Fare Policy and Fulfillment of Social Obligations
• the existence and adequacy of fare policy; and
• whether the Corporation operated adequately on uneconomical routes.
3.7.4 Monitoring by Top Management
• whether the monitoring by Corporation’s top management was effective.
Audit criteria
3.8 The audit criteria adopted for assessing the achievement of the audit objectives were:
• all India averages for performance parameters;
• performance standards and operational norms fixed by the Association of State Road Transport Undertakings (ASRTU);
• physical and financial targets/norms fixed by the Management;
• manufacturers’ specifications, norms for life of a bus, preventive maintenance schedule, fuel efficiency norms, etc.;
• instructions of the Government of India (GoI), GoM and other relevant rules and regulations; and
• procedures laid down by the Corporation.

Audit Report (Commercial) for the year ended 31 March 2009
62
Financial position and Working results
3.9 The financial position of the Corporation for the five years up to 2008-09 is given below:
(Rupees in crore)
Particulars 2004-05 2005-06 2006-07 2007-08 2008-09 (Provisional)
A. Liabilities
Paid up capital (including capital contribution) 785.24 923.81 1,072.57 1,231.77 1,403.37
Reserve and surplus (including Capital grants but excluding depreciation reserve)
145.49 150.48 177.67 177.25 193.19
Borrowings (Loan funds) 266.26 246.21 254.73 137.94 58.78
Current liabilities and provisions 630.29 628.74 519.82 559.39 731.48
Total 1,827.28 1,949.24 2,024.79 2,106.35 2,386.82
B. Assets
Gross block 1,797.12 1,838.46 1,882.11 2,016.49 2,180.78
Less: Depreciation 1,609.24 1,665.82 1,357.48 1,475.98 1,610.06
Net Fixed Assets 187.88 172.64 524.63 540.51 570.72
Capital works-in-progress (including cost of chassis) 30.58 28.51 23.12 24.64 32.96
Investments 0.07 0.08 0.08 53.50 189.30
Current Assets, Loans and Advances 525.67 625.03 738.81 908.78 1,136.71
Accumulated losses 1,083.08 1,122.98 738.15 578.92 457.13
Total 1,827.28 1,949.24 2,024.79 2,106.35 2,386.82
(Source: Annual Accounts for the year 2004-05 to 2008-09)

Chapter III- Performance Audit relating to Statutory corporation
63
3.10 The details of working results like operating revenue and expenditure, total revenue and expenditure, net surplus/loss and earnings and cost per KM of operation are given below:
(Rupees in crore) Sl.No. Description 2004-05 2005-06 2006-07 2007-08 2008-09
(Provisional) 1. Total revenue 3,263.45 3,295.97 3,593.89 3,869.55 4,196.19
2. Operating revenueφ 2,909.72 3,200.45 3,470.79 3,740.90 4,091.96
3. Total expenditure 3,396.63 3,336.82 3,585.88 3,702.22 4,078.10
4. Operating expenditureψ 3,341.90 3,277.13 3,516.83 3,627.11 4,004.28
5. Operating profit/ loss (-) (-)432.18 (-)76.68 (-)46.04 113.79 87.68
6. Profit/loss (-) for the year before prior period adjustment
(-)133.18 (-)40.85 8.01 167.33 118.09
7.
Fixed costs (i) Personnel costs (ii) Depreciation (iii) Interest (iv) Other fixed costs
1,373.84
174.34 53.79
142.52
1,147.12
165.68 58.70
140.96
1,183.82
208.75 68.32
155.37
1,290.63
213.79 74.03
179.12
1,483.37
215.77 71.43
197.53 Total fixed costs 1,744.49 1,512.46 1,616.26 1,757.57 1,968.10
8.
Variable costs (i) Fuel & Lubricants (ii) Tyres & Tubes (iii) Other Items/spares (iv) Taxes (MV Tax,
Passenger Tax, etc.)
1,085.39
78.29 59.15
429.31
1,228.82
74.29 56.50
464.75
1,298.35
99.19 72.42
499.66
1,240.98
103.36 65.55
534.76
1,357.71
101.54 77.49
573.26
Total variable costs 1,652.14 1,824.36 1,969.62 1,944.65 2,110.00
9. Effective KMs operated (in crore) 179.76 172.13 173.52 178.85 181.31
10. Earnings per KM (Rupees) (1/9) 18.15 19.15 20.71 21.64 23.14
11. Fixed cost per KM (Rupees) (7/9) 9.70 8.79 9.31 9.83 10.85
12. Variable Cost per KM (Rupees) (8/9) 9.19 10.60 11.35 10.87 11.64
13. Cost per KM (Rupees) (11+12) 18.89 19.39 20.66 20.70 22.49
14. Net earnings per KM (Rupees) (10-13) (-) 0.74 (-)0.24 0.05 0.94 0.65
15. Traffic Revenue§ 2,894.70 3,185.59 3,456.78 3,727.09 4,076.21
16. Traffic Revenue per KM (Rupees) (15/9) 16.10 18.51 19.92 20.84 22.48
17. Contribution per KM (Rupees) (16-12) 6.91 7.91 8.57 9.97 10.84
18. Operating Profit/loss (-) per KM (Rupees) (5/9) (-)2.40 (-)0.45 (-)0.27 0.64 0.48
(Source: Annual Accounts and Monthly Operational Reports)
φOperating revenue includes traffic earnings, passes and season tickets, fare realised from private operators under KM Scheme, luggage and parcel charges etc. ψOperating expenditure includes expenses relating to traffic, depreciation on fleet, repair and maintenance, electricity, welfare and remuneration, licences and taxes and general administration expenses. §Traffic revenue represents sale of tickets, advance booking, reservation charges, re-imbursement against concessional passes and contract service earnings.

Audit Report (Commercial) for the year ended 31 March 2009
64
Elements of Cost
3.11 Personnel costs and material costs constitute the major elements of costs. The percentage break-up of costs for 2008-09 is given below in the pie-chart.
Components of various elements of cost
14%
2%5%
5%
38%
36%
Personnel Cost Material Cost TaxesInterest Depreciation Miscellaneous
(Source: Working results of the Corporation)
Elements of revenue
3.12 Traffic revenue@ constitutes the major element of revenue. The percentage break-up of revenue for 2008-09 is given below in the pie-chart.
Components of various elements of revenue
(Source : Working results of the Corporation)
3%
97%
Traffic Revenue Non Traffic Revenue
@ Traffic revenue (Rs 4,076.21 crore) includes subsidy received from the State Government (Rs 591.51 crore) for re-imbursement against concessional passes/tickets.

Chapter III- Performance Audit relating to Statutory corporation
65
Audit findings
3.13 Audit explained the audit objectives to the Corporation during an ‘entry conference’ held on 28 January 2009. Subsequently, audit findings were reported to the Corporation and the Government in August 2009 and discussed in an 'exit conference' held on 21 October 2009, which was attended by the representative of the Home Department (Transport), Government of Maharashtra, VC&MD and General Manager (Finance) of the Corporation. The Corporation replied to the audit findings in October 2009. The views expressed by them have been considered while finalising this review. The audit findings are discussed below. Operational performance
3.14 The operational performance of the Corporation for the five years ending 2008-09 is given in the Annexure 11. The operational performance of the Corporation was evaluated on various operational parameters as described below. It was also seen whether the Corporation was able to maintain pace with the growing demand of public transport. Audit findings in this regard are discussed in the subsequent paragraphs. These audit findings show that the losses were controllable and there is scope for improvement in performance. Share of Corporation in public transport
3.15 In order to have a balanced modal mix of public and private transport an Integrated Transport Policy (ITP) defining the role of Corporation is necessary. Such a policy would seek to focus on the role of bus transport system as the main mass transport system provider vis-a-vis an increase in adequate, accessible and affordable mass transport options. A Concept Paper for Passenger Transport Policy was submitted (February 2008) by the Corporation to GoM. The policy is yet to be formulated (November 2009). The policy needs to be in place to develop an integrated and holistic perspective, delineating the specific role of the Corporation and other forms of mass transport.
3.16 The data on total passenger traffic in the State indicating total passengers travelled by all modes of transport and share of the Corporation in total traffic was not available with the State Government. The line-graph depicting the percentage of average passengers carried per day by the Corporation to the population of the State and percentage share of the Corporation in stage carriage in terms of number of buses during the five years ending 2008-09 is given below:
GoM was yet to formulate an Integrated Transport policy defining the role of the Corporation.

Audit Report (Commercial) for the year ended 31 March 2009
66
52.38 50.58 51.25 52.76
5.52 5.47 5.55 5.92
55.52
5.72
0
10
20
30
40
50
2004
-05
2005
-06
2006
-07
2007
-08
2008
-09
Percentage share of Corporation in stage carriagePercentage of average passengers carried per day to population
(Source: Census and information furnished by the Corporation)
3.17 The table below depicts the growth of public transport in the State.
Sl. No.
Particular 2004-05 2005-06 2006-07 2007-08 2008-09
1. Corporation’s buses at the end of the year
16,115 15,456 15,111 15,864 16,333
2. Total buses for public transport
29,023 29,506 29,877 30,957 30,957∗
3. Percentage share of Corporation in stage carriage (1/2)
55.52 52.38 50.58 51.25 52.76
4. Estimated population (crore)
10.31 10.50 10.78 10.98 11.11
5. Vehicle density per one lakh population
28.15 28.10 27.72 28.19 27.86
6. Vehicle density of Corporation buses per one lakh population
15.63 14.72 14.02 14.45 14.70
(Source: Information furnished by the Transport Commissioner and the Corporation)
It was seen from the above that the percentage share of the Corporation to total stage carriage buses operated in the State decreased from 55.52 in 2004-05 to 52.76 in 2008-09.
3.18 The Corporation however has not been able to keep pace with the growing demand for Public Transport. The percentage of passengers carried by the Corporation per day to the population marginally increased from 5.72 per cent in 2004-05 to 5.92 per cent in 2008-09. The share of the Corporation in stage carriage declined between 2004-05 and 2007-08. The Corporation has not conducted scientific study/survey to assess the demand for public transport. Thus, the adequacy of services provided by the Corporation could not be ensured. The effective per capita KM operated per year is given below:
∗ Figures for 2008-09 are yet to be compiled by the Transport Commissioner. However, the
figures of 2007-08 for total buses have been adopted in 2008-09 for the purpose of comparison only.

Chapter III- Performance Audit relating to Statutory corporation
67
Particulars 2004-05 2005-06 2006-07 2007-08 2008-09
Effective KM operated (crore) 179.76 172.13 173.52 178.85 181.31
Estimated population (crore) 10.31 10.50 10.78 10.98 11.11
Per capita KM per year (1/2) 17.44 16.39 16.10 16.29 16.32(Source: Monthly Operational Reports and Information furnished by the Corporation)
3.19 The above table shows that the per capita KMs per year had declined from 17.44 in 2004-05 to 16.32 in 2008-09 though the population (estimated) had increased from 10.31 crore to 11.11 crore.
The Corporation stated (October 2009) that conducting of scientific survey regarding private and public passenger transport in the State was under the purview of the State Government. As the Corporation has monopoly in operating stage carriages it is necessary that periodical survey is conducted to get feedback from the public for necessary remedial action.
3.20 Public transport has definite benefits over personalised transport in terms of costs, congestion on roads and environmental impact. The public transport services have to be adequate to derive those benefits. In the instant case, the Corporation had operational inefficiencies in some areas of operation as described later. Recovery of cost of operations
3.21 The Corporation was not able to recover its cost of operations during 2004-07 but earned profit thereafter. The trend of revenue during 2004-05 to 2008-09 is shown in the graph⊗ below:
18.8
9
19.1
5
0.05 0.94
0.65
0.64
0.48
19.3
9
20.6
6
20.7
0
22.4
9
18.1
5 20.7
1
21.6
4
23.1
4
-0.7
4
-0.2
4
-2.4
0
-0.2
7
-0.4
5
-30369
1215182124
2004-05 2005-06 2006-07 2007-08 2008-09
Cost per KM Revenue per KM Net Revenue per KM Operating loss per KM
(Source: Annual Accounts for the years 2004-05 to 2008-09) ⊗ Cost per KM represents total expenditure divided by effective KM operated. Revenue per KM is arrived at by dividing total revenue with effective KM operated. Net Revenue per KM is revenue per KM reduced by cost per KM. Operating loss per KM represents operating expenditure per KM reduced by operating income per KM.
Per capita KMs operated per year declined from 17.44 in 2004-05 to 16.32 in 2008-09.

Audit Report (Commercial) for the year ended 31 March 2009
68
3.22 Above graph indicates the improving trend in the performance of the Corporation. The Corporation had earned operational profit during 2007-08 and 2008-09. The net earning of the Corporation was Rs 0.05 per KM in 2006-07 which improved to Rs 0.94 per KM in 2007-08 and decreased to
Rs 0.65 per KM in 2008-09. However, the Corporation was not able to achieve the All India Average (AIA) for cost per KM (Rs 19.94) since 2006-07. This has been impacting the ability of the Corporation to provide public
transport adequately as it is not able to replace its fleet on time or increase the fleet strength to meet growing demand.
The Corporation stated (October 2009) that the operating cost of the Corporation was not comparable with All India Average (AIA) because of different structure of wages/salary, Value Added Tax (VAT) on High Speed Diesel (HSD) and passenger tax etc. The Corporation had not however requested the State Government to review the structure of VAT on HSD and passenger tax. Also the Corporation needs to improve operational efficiency and strive to achieve the AIA so as to make the public transport more affordable. Efficiency and Economy in operations Fleet strength and utilisation
Fleet Strength and its Age Profile
3.23 The Corporation has its own fleet of buses. It also hires buses. Audit findings in respect of hired buses are given in Paragraphs 3.49 and 3.50. The table below explains the position of Corporation's own fleet.
3.24 The Association of State Road Transport Undertakings (ASRTU) had prescribed (September 1997) the desirable age of a bus as eight years or five lakh KMs, whichever was earlier. The Corporation however, fixed the life of a bus as 10 years. The table below shows the age profile of the buses held by the Corporation for the period of five years ending 2008-09. Sl. No. Particulars 2004-05 2005-06 2006-07 2007-08 2008-09
1. Total No. of buses at the beginning of the year 16,128 16,115 15,456 15,111 15,864
2. Additions during the year 1,610 1,125 1,554 2,018 1,769
3. Buses scrapped during the year 1,623 1,784 1,899 1,265 1,300
4. Buses held at the end of the year (1+2-3) 16,115 15,456 15,111 15,864 16,333
5. Of (4), No. of buses more than 10 years old 1,611 1,518 820 1,132 689
6. Percentage of overage buses to total buses 10.00 9.82 5.43 7.14 4.22
(Source: Information furnished by the Corporation)
Orissa, Uttar Pradesh and Karnataka registered best net earnings per KM at Rs. 0.49, Rs. 0.47 and Rs. 0.34 respectively during 2006-07. (Source : STUs profile and performance 2006-07 by CIRT, Pune)

Chapter III- Performance Audit relating to Statutory corporation
69
3.25 The above table shows that the Corporation was not able to achieve the norms of right age buses. During 2004-09, the Corporation added 8,076 new buses at a cost of Rs 907.54 crore. The expenditure was funded through internal resources (Rs 173.13 crore) and capital contribution (Rs 734.41 crore) received from the State Government. The requirement of funds to replace 689 buses more than 10 years old as on 31 March 2009 was Rs 77.44 crore at the rate of Rs 11.24 lakh per bus based on the average cost of buses purchased during 2004-09. Audit noticed that the Corporation had not prepared long term plan for replacement of overaged buses in a phased manner.
3.26 The overage fleet requires high maintenance and results in extra cost and less availability of vehicles compared to right age fleet, other things being equal. This only increases operational inefficiency and causes losses, which affects the ability of the Corporation to replace its fleet on a timely basis.
The Corporation stated (October 2009) that it had revised (August 2009) the policy for vehicle age as eight years and that the revised policy would be implemented in stages considering the fund position.
Fleet Utilisation
3.27 Fleet Utilisation (FU) represents the ratio of buses on road to those held by the Corporation. The Corporation had set target of FU at 95.21, 95.50, 95.00, 95.00 and 95.60 per cent during the period from 2004-05 to 2008-09 respectively. Against
this, the FU of the Corporation varied from 95.46 per cent in 2004-05 to 93.16 per cent in 2005-06 as indicated in the graph given below:
94.28
94.79
94.19
95.46
93.16
95.21
95.50
95
95.60
95
91
92
93
94
95
96
2004
-05
2005
-06
2006
-07
2007
-08
2008
-09
Fleet utilisation (percentage of average vehicles on road to total vehicles held)
All India Average of 92
Internal target set by the Corporation for each year
Andhra Pradesh, Tamil Nadu (Kumbakonam) and Tamil Nadu (Coimbatore) registered best fleet utilisation at 99.4, 98.4 and Rs. 98.3 per cent respectively during 2006-07. (Source : STUs profile and performance 2006-07 by CIRT, Pune)

Audit Report (Commercial) for the year ended 31 March 2009
70
Though, the FU of the Corporation was above the AIA of 92 per cent, it was below the internal targets fixed by the Corporation as well as the best performers.
The Corporation stated (October 2009) that the targets were always fixed on the higher side to encourage the field offices to achieve maximum utilisation and efforts were being made to keep the FU more than 92 per cent. Considering the audit observation, targets for 2009-10 were set on realistic basis so that the divisions could achieve the same and efforts were being made to provide training to staff to improve FU.
3.28 Even though the Corporation had achieved an overall FU above the AIA, it was noticed that in Akola, Mumbai and Sindhudurg Divisions FU was below AIA and varied from 89.00 to 91.94 per cent during 2004-05 to 2008-09. It was also noticed in Audit that in the said three Divisions the vehicles were detained in the Divisional Workshops (DWS) for seven to 114 days before being taken for repairs. Due to delay in repairs, these vehicles were not available for utilisation. The reasons for detention of vehicles in DWS were attributed by management to shortage of manpower, heavy accidents and non availability of spare parts.
The Corporation stated (October 2009) that the FU in Akola and Sindhudurg had improved (July 2009) and was above AIA. Further, the Corporation had decided to recruit maintenance staff and make spare parts available to ensure timely repairs. However, the fact remains that there were delays in repairs due to reasons within the management control.
Vehicle productivity
3.29 Vehicle productivity refers to the average KMs run by each bus per day during the year. The vehicle productivity of the Corporation vis-a-vis the overage fleet for the five years ending 2008-09 is shown in the table below:
Sl. No. Particulars 2004-05 2005-06 2006-07 2007-08 2008-09
1. Vehicle productivity (KMs run per day per bus held)
309 299 310 317 316
2. Overage fleet (percentage)-more than 10 years old
10.00 9.82 5.43 7.14 4.22
(Source: Information furnished by the Corporation)
It could be seen from the above that the vehicle productivity varied between 299 and 317 KMs per day per bus during the review period.

Chapter III- Performance Audit relating to Statutory corporation
71
3.30 Compared to the AIA of 313 KMs, the vehicle productivity of the Corporation was lower during 2004-05 to 2006-07 but improved since 2007-08 and exceeded the AIA. The Corporation had however not fixed internal targets for vehicle productivity. The lower productivity was mainly on account of:
• Excess time taken for repairs (Paragraphs 3.28).
• Want of crew (Paragraphs 3.38 and 3.39).
• Cancellation of scheduled KMs (Paragraph 3.38).
The Corporation stated (October 2009) that the norms for vehicle productivity cannot be fixed because of different types of operations at different places depending upon traffic potential. The reply is not convincing as depot-wise norms can be fixed considering the different types of operations. Capacity utilisation
Load Factor
3.31 Capacity utilisation of a transport undertaking is measured in terms of Load Factor (LF) which represents the percentage of passengers carried to seating capacity. The schedules to be operated are to be decided after proper study of routes and periodical reviews are necessary to improve the LF. The LF worked out by the Corporation was 56.20, 56.59, 57.28, 59.03 and 60.76 during 2004-05 to 2008-09 respectively. It was, however, noticed that the LF was being erroneously worked out by the Corporation on the basis of actual passenger earnings without considering concessions in passenger fares reimbursed by the State Government divided by expected passenger earnings on total seating capacity. The LF after considering the amount of concessions reimbursed by the Government however, worked out to 62.66, 64.13, 65.47, 68.23 and 71.20 per cent during the said period as against AIA of 63 per cent. A graph depicting the LF after considering concessions vis-a-vis number of buses per one lakh population is given below:
14.72 14.02 14.45
64.1362.66 65.4768.23 71.20
14.7015.63
0
20
40
60
2004
-05
2005
-06
2006
-07
2007
-08
2008
-09
Load Factor No. of buses per one lakh population
Tamil Nadu (Villupuram), Tamil Nadu (Salem) and Tamil Nadu (Kumbakonam), registered best vehicle productivity at 474, 469 and 462.8 KMs per day respectively during 2006-07. (Source : STUs profile and performance 2006-07 by CIRT, Pune)
No target was fixed for vehicle productivity.
Number of buses per lakh population decreased from 15.63 in 2004-05 to 14.70 in 2008-09.
Audit Report (Commercial) for the year ended 31 March 2009
72
The above graph indicates that though the LF showed an increasing trend over the period under review, the number of buses per one lakh population had decreased from 15.63 (2004-05) to 14.70 (2008-09).
The Corporation stated (October 2009) that LF would be worked out by reckoning the concessions reimbursed by the GoM.
A reference is invited to Paragraph 4.17 of the Report of the Comptroller and Auditor General of India (Commercial) for the year ended 31 March 2005, Government of Maharashtra, where deficiencies in inspection of the passenger routes operated by the private operators who had been permitted point to point service was highlighted. In the oral evidence before the Committee on Public Undertakings (COPU) (September-October 2008), the Corporation accepted the fact that the revenue was affected due to clandestine operations. COPU recommended (October 2008) that the Government in co-ordination with all other concerned and the Corporation should take effective steps to curtail the clandestine operations. No Action Taken Note was however submitted by the Corporation/Government so far (December 2009).
The Corporation stated (October 2009) that the State Government had formed checking squads consisting of Regional Transport Office, police and staff of the Corporation for controlling clandestine operations. Further, it was stated that the authority to formulate rules to impose high penalty for clandestine operations was with the State Government. Audit observed that the clandestine operations were still in existence (December 2009). The Corporation conducted the last survey of clandestine operations in February 2005 according to which it was estimated that the Corporation was suffering revenue loss of Rs 2.94 crore per day due to such operations.
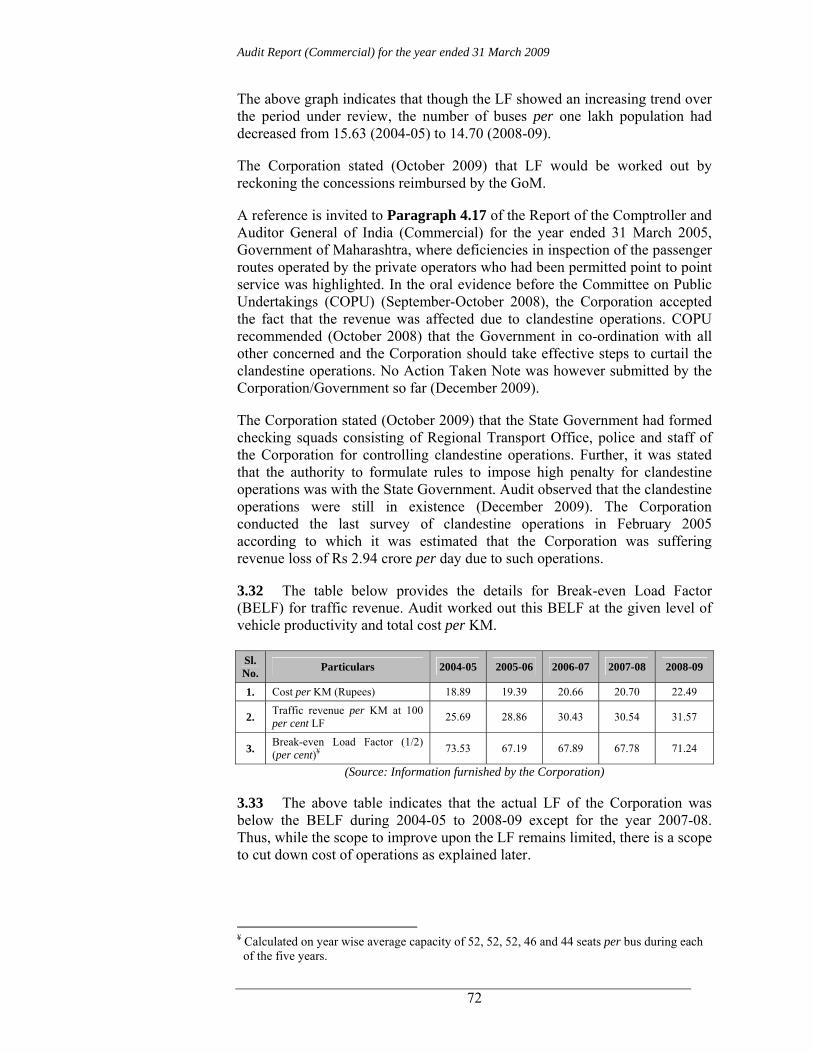
3.32 The table below provides the details for Break-even Load Factor (BELF) for traffic revenue. Audit worked out this BELF at the given level of vehicle productivity and total cost per KM.
Sl. No. Particulars 2004-05 2005-06 2006-07 2007-08 2008-09
1. Cost per KM (Rupees) 18.89 19.39 20.66 20.70 22.49
2. Traffic revenue per KM at 100 per cent LF 25.69 28.86 30.43 30.54 31.57
3. Break-even Load Factor (1/2) (per cent)¥ 73.53 67.19 67.89 67.78 71.24
(Source: Information furnished by the Corporation)
3.33 The above table indicates that the actual LF of the Corporation was below the BELF during 2004-05 to 2008-09 except for the year 2007-08. Thus, while the scope to improve upon the LF remains limited, there is a scope to cut down cost of operations as explained later.
¥ Calculated on year wise average capacity of 52, 52, 52, 46 and 44 seats per bus during each of the five years.

Chapter III- Performance Audit relating to Statutory corporation
73
Route Planning
3.34 Appropriate route planning to tap demand leads to higher load factor. The Corporation conducts post operational trip analysis by categorising trips into 'A', 'B' and 'C' groups. A trips are profit making, B trips are not recovering the total cost and C trips are not recovering even variable cost. However, the Corporation does not have an Management Information System framework to assess the route-wise profitability.
3.35 Some trips are profitable while others are not. The position of profit and loss making trips is given in the table below:
Particulars Total No. of routes
Total No. of trips
No. of trips making profit
(A trips)
No. of trips not meeting total cost
(B and C trips)
No. of trips not meeting variable
cost (C trips)
2004-05 17,584
88,612 (100)
16,027 (18)
72,585 (82)
23,979 (27)
2005-06 16,697
84,781 (100)
16,467 (19)
68,314 (81)
21,988 (26)
2006-07 16,482
84,162 (100)
17,455 (21)
66,707 (79)
19,011 (23)
2007-08 16,227
84,000 (100)
20,084 (24)
63,916 (76)
16,432 (20)
2008-09 16,521
85,071 (100)
18,102 (21)
66,969 (79)
17,536 (21)
(Figures in bracket indicate percentage to total trips) (Source: Compiled from Monthly Operational Reports of the Corporation
It could be seen from above that the total number of routes operated by the Corporation which were 17,584 in 2004-05 were reduced to 16,521 in 2008-09. Similarly, the total trips operated were also reduced from 88,612 trips in 2004-05 to 85,071 trips in 2008-09. In this regard audit observed that the profitability of A, B and C trips was assessed by the Corporation without reckoning the amount of concessions in passenger fare reimbursed by the State Government. Inclusion of concessions reimbursed by the State Government may alter the profitability of trips to some extent.
3.36 Though some of the routes now appearing unprofitable may become profitable once the Corporation considers reimbursement of concessional claims and improves its efficiency, there would still be some uneconomical routes. Given the scenario of mixed routes and obligation to serve uneconomical routes, the Corporation should decide an optimum quantum of services on different routes so as to optimise its revenue while serving the cause. However, no systematic route planning exercise with structured parameters and timeframes for route survey was carried out by the Corporation.
While accepting the Audit suggestion Corporation stated (October 2009) that analysis of trips would be done after taking into account the amount of concessions given by GoM.
Profitability of trips operated was assessed by the Corporation without considering the amount of concessions reimbursed by GoM.

Audit Report (Commercial) for the year ended 31 March 2009
74
Cancellation of Scheduled Kilometres
3.37 A review of the operations indicated that the scheduled KMs were not fully operated mainly due to shortage/absenteeism of crews, non-availability of adequate number of buses owing to delay in repairs of vehicles, delay of buses from Depots/line, accidents and break down of vehicles due to mechanical faults.
3.38 The details of scheduled KMs, effective KMs and cancelled KMs calculated as difference between scheduled KMs and effective KMs are furnished in the table below:
(In crore KMs) Sl. No. Particulars 2004-05 2005-06 2006-07 2007-08 2008-09
1. Scheduled KMs (planned) 174.89 167.72 169.95 173.75 176.33
2. Effective scheduled KMs (out of planned) 171.23 164.22 165.14 169.37 172.21
3. Kilometres cancelled 3.66 3.50 4.81 4.38 4.12 4. Percentage of cancellation 2.09 2.09 2.83 2.52 2.34
Cause-wise analysis 5. Want of buses 0.31 0.32 0.74 0.69 0.71 6. Want of crew 1.82 1.07 1.25 1.35 1.86 7. Others (3 - 5 - 6) 1.53 2.11 2.82 2.34 1.55
8. Contribution per KM (in Rupees) 6.91 7.91 8.57 9.97 10.84
9. Avoidable cancellation (want of buses and crew) (5 + 6) 2.13 1.39 1.99 2.04 2.57
10. Loss of contribution (8 x 9) (Rupees in crore) 14.72 10.99 17.05 20.34 27.86
3.39 It can be seen from the above table that the percentage of cancellation of scheduled KMs varied from 2.09 to 2.83 during 2004-05 to 2008-09 and remained on the higher side as compared to the best performers. The main
reason for cancellation was the shortage and absenteeism of crews besides shortage of vehicles. Due to cancellation of scheduled KMs for want of buses and crews, the Corporation was deprived of contribution of Rs 90.96 crore during 2004-05 to 2008-09. The cancellation
also affected the reliability in the service. The non availability of buses was due to delay in repairs, breakdown of vehicles due to mechanical faults indicating poor preventive maintenance.
The Corporation stated (October 2009) that sometimes non-obligatory, low paying scheduled KMs are cancelled for extra operations to meet demand of the passengers on profitable routes and to operate buses on casual contracts.
This does not tally with the effective KMs mentioned in Sl. No.9 of table under
Paragraph 3.10 as it includes KMs operated for casual contracts and extra operations besides scheduled KMs.
Tamil Nadu (Salem), State Express Transport Corporation (Tamil Nadu) and Tamil Nadu (Villupuram) registered least cancellation of scheduled KMs at 0.45, 0.67 and 0.78 per cent respectively during 2006-07. (Source: STUs profile and performance 2006-07 by CIRT, Pune)
Cancellation of scheduled KMs was higher than Tamil Nadu (best performer).

Chapter III- Performance Audit relating to Statutory corporation
75
However, Audit observed that the cancellation was mainly due to non availability of crew. Maintenance of vehicles
Preventive Maintenance
3.40 Preventive maintenance is essential to keep the buses in good running condition and to reduce breakdowns/other mechanical failures. The Corporation had Tata and Leyland make buses, for which the following schedule of change of oil had been prescribed by the Original Equipment Manufacturers (OEM).
Sl. No. Particulars Schedule 1. Engine oil change
1 (a) Tata make Every 18,000 KMs 1 (b) Leyland make Every 16,000 KMs
2 Brake inspection 2(a) Tata make
Leyland make Daily Inspection
(Source: MSRTC instructions and chassis manufacturing Operating Manual)
Top up of oil is required to maintain the level of oil recommended by manufacturers which gets reduced due to leakage and poor efficiency of the engine. It is therefore necessary to have an engine make-wise data on oil consumption separately for top up and engine oil change for comparison with the standard prescribed by OEMs. The reporting of make-wise consumption of oil for top up and change of engine oil was reported through Monthly Operational Reports (MORs) from April 2008 only.
A scrutiny of MORs of 2008-09 in Audit revealed that there was excess consumption of 2.93 lakh litres of engine oil as compared to norms for change of engine oil. This indicated lack of effective management control on consumption of engine oil.
The Corporation stated (October 2009) that oil was also required for top up to maintain the oil level between the period of two oil changes and variation of (+/-) 500 KMs in standard KPL is permissible as recommended by OEMs. The reply is not acceptable as the consumption differed for the same make from Region to Region during the two years under comparison.
Reconditioning of buses
3.41 Reconditioning (RC) of buses involves replacement of all damaged parts of bus, change of seats and painting work etc. As per the time schedule, first RC is to be done within three years from the date of registration of the vehicle, second RC within two years from the date of first RC and third RC within two years from the date of second RC. The Corporation does not maintain records of buses due for various RC during the year. However, the internal targets for RC of buses to be done annually are set by the Corporation.
Ineffective monitoring of engine oil consumption resulted in excess consumption of 2.93 lakh litres as compared to norms during 2008-09.

Audit Report (Commercial) for the year ended 31 March 2009
76
The consolidated position of buses targeted for RC and RC actually done during 2004-05 to 2008-09 was as under:
Sl. No. Particulars 2004-05 2005-06 2006-07 2007-08 2008-09
1. No. of buses targeted 4,624 4,211 4,501 4,319 4,302
2. No. of buses reconditioned 4,281 4,091 4,507 4,318 4,114
3. Shortfall in reconditioning 343 120 06 (excess) 01 188 (Source: Information furnished by the Corporation)
Audit observed that in the absence of details of number of buses due for first RC, second RC and third RC and buses actually reconditioned under each category the correctness of the target fixed for RC in each year was not verifiable in audit.
Docking of buses
3.42 Docking involves inspection and repair of engine, clutch and transmission, steering and suspension, wheel and brake etc. As per the norms fixed by the Corporation, six docking of buses is required to be done in a year after every two months from the date of registration/certification of vehicle by the Regional Transport Office (RTO). As per the procedure third and sixth docking is required to be done in Divisional Workshops and the remaining four dockings at Depot Workshop.
The consolidated details of docking of buses done at Depot level during 2004-09 was as under:
Sl. No.
Particulars 2004-05 2005-06 2006-07 2007-08 2008-09
1. No. of scheduled dockings due 64,282 61,931 57,844 58,357 59,738
2. No. of docking done in time 55,247 52,833 50,179 51,228 52,776
3. Percentage of dockings done in time
85.94 85.31 86.75 87.78 88.35
(Source: Information furnished by the Corporation)
It could be seen from the above that docking in time had increased from 85.94 per cent (2004-05) to 88.35 per cent (2008-09).
The Corporation stated (October 2009) that the FU during the review period was above the norm of 92 per cent which was an indication that vehicles were not available for scheduled maintenance.
The docking of buses, as per the prescribed schedule is preventive maintenance and in the interest of productivity and passenger safety.

Chapter III- Performance Audit relating to Statutory corporation
77
Repairs and Maintenance
3.43 A summarised position of fleet holding, over-aged buses, repairs and maintenance (R&M) expenditure for the last five years up to 2008-09 is given below:
Sl. No. Particulars 2004-05 2005-06 2006-07 2007-08 2008-09
1. Total buses at the end of the year (No.) 16,115 15,456 15,111 15,864 16,333
2. Over-age buses (more than 10 years old) 1,611 1,518 820 1,132 689
3. Percentage of over age buses (2/1 x 100) 10.00 9.82 5.43 7.14 4.22
4. R&M Expenses (Rupees in crore) 345.24 339.85 379.65 397.29 413.23
5. R&M Expenses per bus (4/1) (in lakh Rupees) 2.14 2.20 2.51 2.50 2.53
6. Percentage of manpower cost in R&M expenses 50.59 51.81 48.64 49.20 49.85
(Source: Information furnished by the Corporation)
The above table indicates that though there was a decline in number of overaged buses from 1,611 (2004-05) to 689 (2008-09), there was increase in R&M expenses per bus from Rs 2.14 lakh to Rs 2.53 lakh during the period 2004-05 to 2008-09.
The Corporation stated (October 2009) that the increase was mainly due to increasing prices of raw material and other elements of cost. The reply is not convincing as the Corporation has not maintained separate records for R&M expenses on over aged buses to ascertain the reasonability of expenditure on repairs of such buses. Manpower cost
3.44 The cost structure of the organisation shows that manpower and fuel constitute 69.67 per cent of total cost. Interest, depreciation and taxes-the costs which are not controllable in the short-term - account for 21.10 per cent. Thus, the major cost saving can come only from manpower and fuel.
3.45 Manpower is an important element of cost which constituted 36.37 per cent of the total expenditure of the Corporation in 2008-09. Therefore, it is imperative that this cost is kept under control and the manpower is utilised optimally to achieve high productivity. The table below provides the details of
manpower, its cost and productivity.
Position excluding hired buses.
Gujarat, Tamil Nadu (Villupuram) and Tamil Nadu (Salem) registered best performance at Rs. 6.10, Rs. 6.13 and Rs. 6.21 cost per effective KM respectively during 2006-07. (Source: STUs profile and performance 2006-07 by CIRT, Pune)

Audit Report (Commercial) for the year ended 31 March 2009
78
Sl. No. Particulars 2004-05 2005-06 2006-07 2007-08 2008-09
1. Total manpower at the end of the year 1,01,724 1,02,818 1,00,247 1,00,774 96,454
2. Manpower cost (Rupees in crore) 1,373.84 1,147.12 1,183.82 1,290.63 1,483.37
3. Effective KMs (in crore) 179.76 172.13 173.52 178.85 181.31
4. Cost per effective KM (Rupees) (2÷3) 7.64 6.66 6.82 7.22 8.18
5. Productivity per person (KMs) 57 57 58 60 61
6. Total No. of buses at the end of the year
16,115 15,456 15,111 15,864 16,333
7. Manpower per bus (1/6) 6.31 6.65 6.63 6.35 5.91 (Source: Compiled from Monthly Operational Reports of the Corporation)
It may be seen from the above that the deployment of manpower per bus was higher as compared with AIA of 6.5 person per bus up to 2006-07 but reduced thereafter. The decrease in bus staff ratio was mainly due to reduction in administrative staff from 0.85 person per bus in 2004-05 to 0.75 person in 2008-09. The manpower cost per KM increased in 2008-09 due to revision of
pay. Similarly, productivity of staff increased due to reduction in staff and increase in effective KMs.
The Corporation has however, not prescribed norms for deployment of staff per bus. In the absence of norms, the deployment of staff differed from Division to Division. The deployment of manpower per bus in the five divisions test checked in Audit was as under:
(Number of persons per bus) Year Akola Mumbai Nagpur Satara Sindhudurg
2004-05 7.07 7.96 5.82 6.41 7.10
2005-06 7.39 7.65 5.75 6.33 7.07
2006-07 7.43 7.11 6.51 6.71 6.73
2007-08 8.04 7.06 6.71 6.43 6.35
2008-09 7.87 6.94 6.45 6.13 6.43 (Source: Information furnished by Divisions)
From the above, it may be seen that there was a need to take appropriate steps to formulate norms for deployment and regulate the staff deployment accordingly to achieve optimum utilisation of manpower.
The Corporation stated (October 2009) that it deployed staff in some departments such as Central Workshops, Tyre Retreading Plants and Civil Engineering Departments which are not in existence in some other STUs. Hence the comparison of deployment of staff per bus with AIA was not correct. However, the fact remains that the Corporation had not fixed any norm for bus staff ratio for effective utilisation of manpower.
3.46 The normal duty hours prescribed for operating crew is 12 hours, which includes steering duty of eight hours. In 16 out of 20 depots it was
North West Karnataka State Road Transport, Karnataka State Road Transport and Himachal Pradesh registered best performance at 4.89, 4.99 and 4.94 manpower per bus. (Source : STUs profile and performance 2006-07 by CIRT, Pune)

Chapter III- Performance Audit relating to Statutory corporation
79
noticed that the average normal duty (steering plus spread over) hours provided ranged from 6.60 to 9.32 hours during 2004-05 to 2008-09 resulting in under utilisation of operating crews. In remaining four depots it was noticed that depot-wise steering and spread over duty was not reported through MORs. Further, the overall average steering duty hours in the Corporation ranged from 6.55 (2007-08) to 7.14 hours (2008-09) during the review period. However, the Corporation paid overtime of Rs 102.69 crore to crew for double duty during the review period. Thus, there is a need to review the duty hours and provide maximum duty permissible under the rules so that overtime payment can be minimised. The assignment of normal duty hours need to be reviewed as it has a bearing on the overtime payment and manpower productivity.
Fuel cost
3.47 Fuel is a major cost element which constituted 33.29 per cent of total expenditure in 2008-09. Control of fuel costs by a road transport undertaking has a direct bearing on its productivity. The table below gives the targets fixed by the Corporation for fuel consumption, actual consumption, KMs obtained per litre (KMPL), AIA and estimated extra expenditure.
Sl. No. Particulars 2004-05 2005-06 2006-07 2007-08 2008-09 1. Gross KMs (in crore) 181.39 173.69 175.12 180.49 183.06
2. Kilometres obtained per litre (KMPL) 4.85 4.89 4.93 4.93 4.93
3. Actual Consumption (in crore litres) (1 / 2) 37.40 35.52 35.52 36.61 37.13
4. Target of KMPL fixed by Corporation 4.90 4.90 5.09 5.03 5.03
5. All India Average in the category 4.94 4.94 4.94 4.94 4.94
6. Consumption as per All India Average (in crore litres) (1/5) 36.72 35.16 35.45 36.54 37.06
7. Excess Consumption (in crore litres) (3-6) 0.68 0.36 0.07 0.07 0.07
8. Average cost per litre (in Rupees) 28.66 34.22 36.10 33.34 36.04
9. Extra expenditure (Rupees in crore) (7 x 8) 19.49 12.32 2.53 2.33 2.52
(Source: Information furnished by the Corporation)
3.48 It can be seen from the above table that the mileage obtained per litre had remained almost static over the period under review. There was excess consumption of 1.25 crore litres of fuel as compared to AIA during 2004-09 resulting in extra expenditure of Rs 39.19 crore. The consumption
was even more than the targets fixed by the Corporation considering the local situation.
North East Karnataka State Road Transport, Uttar Pradesh and Andhra Pradesh registered mileage of 5.45, 5.33 and 5.26 KMPL. (Source : STUs profile and performance 2006-07 by CIRT, Pune)
Excess consumption of fuel as compared to AIA resulted in extra expenditure of Rs 39.19 crore.

Audit Report (Commercial) for the year ended 31 March 2009
80
The Corporation stated (October 2009) that targets were fixed on higher side with the intention to achieve optimum consumption. There was an improving trend and efforts were being made to get optimum performance. The comparison with AIA and working of the loss there against was unrealistic as the fleet age, road condition and topographical condition differed from State to State. However, Audit observed that the number of overaged buses had come down from 1,611 (2004-05) to 689 (2008-09) and the other conditions in the best performing States were similar to that in Maharashtra. Cost effectiveness of hired buses
3.49 The Corporation started (December 2006) hiring of private buses on KM payment basis (KM scheme). Agreements with the private bus owners were initially entered into for a period of three years. The owners of these buses were required to provide new air-conditioned buses with drivers and to incur all expenditure for their running. The Corporation was to provide conductors, pay fuel charges at agreed rates and make payment as per the actual KMs operated by the hired buses. During 2006-09, the Corporation earned a net profit of Rs 4.11 crore from the operation of hired AC buses (Volvo, Mahabus and Kinglong) as shown below:
(Amount in Rupees) Sl.No. Particulars 2006-07 2007-08 2008-09
Own fleet§ (Volvo only)
1. Cost per effective KM 40.16 39.67 36.69
2. Traffic Revenue per effective KM 45.58 46.02 51.22
3. Net Revenue per effective KM 5.42 6.35 14.53
Hired buses (Volvo, Mahabus and Kinglong)
4. No. of Hired buses at the end of the year 29 29 24
5. Cost per effective KM (Rupees) 37.21 36.72 33.74
6. Traffic Revenue per effective KM (Rupees) 33.30 35.61 42.79
7. Net Revenue/Loss (-) per effective KM (Rupees) (-) 3.91 (-) 1.11 9.05
8. Total effective KMs operated (in lakh) 6.69 37.99 52.97
9. Profit from hired buses (Rupees in crore) (7/8) (-)0.26 (-)0.42 (+)4.79
10. Break-even load factor considering traffic revenue 66.10 67.15 54.05
(Source: Information furnished by the Corporation)
3.50 It could be seen from the above table that though the cost per effective KM of hired buses was less than the same for owned buses, the net revenue per KM from hired buses remained low as compared to own fleet because the traffic revenue per KM of hired buses was much less than that for owned buses. The Corporation could have improved the net revenue per KM from operation of hired buses by optimising the number of trips on routes, based on traffic potential. Thus, due to operation of hired buses, the Corporation § Under own fleet only Volvo buses have been considered to have a better comparison of profit between owned and hired buses.
This includes hire charges, fuel cost, conductors pay and other overheads. Calculated at capacity of 45 seats per bus.

Chapter III- Performance Audit relating to Statutory corporation
81
suffered loss of Rs 68 lakh during the first two years. The Corporation has however not prepared a scientific cost benefit analysis of utilising its own fleet vis-a-vis hiring of buses in areas with different traffic potential to adopt the best option.
The Corporation stated (November 2009) that CPKM of hired buses was Rs 32 and owned Volvo buses was Rs 36 and BELF was 52 and 58 respectively. It was further stated that the Corporation increased hired buses from 24 to 47 AC buses from April 2009 onwards out of 64 AC buses operated. Audit observed that there is a further scope to go for more hired buses considering its lower cost and BELF after due consideration to the traffic potential in different areas.
It was further observed in Audit that though the manufacturer of Volvo had a monopoly, it offered rebate of Rs 0.50 lakh per bus. However, the Corporation purchased (August 2005) 15 Volvo buses without deducting the rebate resulting in excess payment of Rs 7.50 lakh. The Corporation stated (October 2009) that an amount of Rs 2 lakh had been recovered and the remaining amount of Rs 5.50 lakh will be recovered. Financial management
3.51 Raising of funds for capital expenditure i.e., for replacement/addition of buses happens to be the major challenge in financial management of the Corporation's affairs. This issue has been covered in Paragraphs 3.24 to 3.26. The section below deals with the Corporation's efficiency in raising claims and their recovery. This section also analyses whether an opportunity exists to realign the business model to generate more resources without compromising on service delivery. Claims and dues
3.52 The Corporation gives its buses on hire for which parties are required to pay in advance the charges at prescribed rate per KM basis at the time of booking. However, hire charges of Rs 2.06 crore for buses provided (1998-99) to the State Government for Agro Advantage Programme and Rs 2.67 crore for buses provided (2004-05 to 2008-09) to various Government Departments were still outstanding (November 2009).
The Corporation stated (October 2009) that the matter has been taken up with the concerned departments.
3.53 Further, the Corporation provides free/concessional passes to various categories of public like students, senior citizens, handicapped, journalists etc. The State Government reimburses the Corporation the concession in fare given to students and other categories. The number of passes issued to students and others, the total amount recoverable for all categories and the amount received during 2004-05 to 2008-09 is shown in the table below:

Audit Report (Commercial) for the year ended 31 March 2009
82
Sl. No. Particulars 2004-05 2005-06 2006-07 2007-08 2008-09
1. No. of student passes issued (in lakh) 47.05 47.77 47.84 53.86 64.85
2. No. of other passes issued (in lakh) --• --• --• --• --•
3. Amount recoverable for student passes (Rupees in crore) 185.71 198.41 220.59 254.59 296.22
4. Amount recoverable for other passes (Rupees in crore) 112.87 174.58 210.74 245.20 295.29
5. Total amount recoverable from State Government for the year (Rupees in crore) (3+4)
298.58 372.99 431.33 499.79 591.51
6. Amount actually received∗/adjusted# (Rupees in crore)
264.59 347.71 374.64 406.59 442.40
7. Unrealised claims (cumulative) (Rupees in crore) 35.16ϒ 60.44 117.13 210.33 359.44
(Source: Information furnished by the Corporation)
3.54 The above table indicates that the amount of concessions receivable from the State Government increased from Rs 35.16 crore in 2004-05 to Rs 359.44 crore in 2008-09. The State Government directed (June 2000) the Corporation to adjust the amount of concessions from the Passenger Tax (PT) payable. The PT payable was however not sufficient to adjust the concessions and the arrears were increasing year after year. In view of the above, the Corporation may take up the matter with the State Government to re-imburse the unrealized claims.
3.55 An analysis in Audit of the debtors outstanding as a percentage of turnover and the percentage of outstanding debtors for more than five years to the total debtors for the five years ending March 2009 are depicted in the graph below:
21.4525.65 26.83
12.98
1.30
18.6216.27
15.34 22.52
12.06
0369
12151821242730
2004
-05
2005
-06
2006
-07
2007
-08
2008
-09
Percentage of Debtors outstanding for more than five years tothe total debtors as on 31 March of each yearPercentage of Debtors to turnover as on 31 March of each year
3.56 From the above, it can be seen that the outstanding dues are continuously increasing as compared to the turnover since 2004-05. Further, • Data on passes other than students and Senior Citizens, etc. has not been maintained by the Corporation. ∗Data on category wise recovery is not maintained by the Corporation. # Adjustments are made against passenger tax and interest and capital contribution. ϒ This includes unrealised claims of previous years besides 2004-05.
Unrealised claims due from GoM in respect of concessions in fare extended by the Corporation increased from Rs 35.16 crore in 2004-05 to Rs 359.44 crore in 2008-09.

Chapter III- Performance Audit relating to Statutory corporation
83
the age-wise analysis of debtors indicated that the outstanding dues for more than five years as compared to the total outstanding debtors for each year has been increasing over the period under review. This was due to non-realisation of wage settlement dues (Rs 352 crore) recoverable from the GoM for the pay increase granted to employees for the period 2000-2004 and 2004-2008. As per the agreement with the Government (August 2004) the above amount was to be adjusted against passenger tax collected by the Corporation. However, Audit observed that the passenger tax collected was not sufficient even to adjust the concessions provided to various categories of passengers as mentioned in Paragraph 3.54 leaving aside the above amount unrealised. Besides, outstanding dues as on 31 March 2009 include Rs 11.08 crore recoverable from commercial establishments in the Corporation’s premises as licence fees. Audit observed that the Corporation had not formulated any strategic plan in conjunction with the State Government for recovery of outstanding dues.
The Corporation stated (October 2009) that it had requested the State Government to allow adjustment of dues against capital contribution. Audit however, observed that the Corporation had not prepared any long term plan for adjustment of dues. Realignment of business model
3.57 The Corporation is mandated to provide an efficient, adequate and economical road transport to public. Therefore, the Corporation cannot take an absolutely commercial view in running its operations. It has to cater to uneconomical routes to fulfil its mandate. It also has to keep the fares affordable. In such a situation, it is imperative for the Corporation to tap non-traffic revenue sources to cross-subsidise its operations. However, the share of non-traffic revenues (other than interest on investments) was nominal at 4.32 per cent of total revenue during 2004-09. The non traffic revenue of Rs 786.76 crore during 2004-09 mainly came from advertisements, restaurant/ shop rentals and sale of scrap.
3.58 Over a period of time, the Corporation had acquired sites at prime locations in cities, district and tehsil headquarters in the State. The Corporation generally uses the ground floor/land for its operations, leaving ample scope to construct and utilise spaces above. Audit observed that the Corporation had land at 763 locations (mostly owned/leased by Government) in the State. Location-wise details of land held by the Corporation as of 31 March 2009 were as under:
Particulars Cities
(Municipal areas)
District Headquarters
Tehsil Headquarters
Other places Total
Number of sites 168 34 312 249 763
Occupied land (Square metres in lakh) 37.67 10.33 61.37 27.16 136.53
(Source: Information furnished by the Corporation)
The Corporation could not realise Rs 352 crore due from the GoM against wage settlement dues.

Audit Report (Commercial) for the year ended 31 March 2009
84
The Corporation stated (July 2009) that land mapping is available at Divisional level and there was a system for periodical inspection to ensure that no encroachment takes place on the land. However, it was observed that the system of periodical inspection was not effective. Out of five Divisions test checked in Audit the encroachment of land of 13,953.57 square metres was noticed in four Divisions as detailed below:
Name of Division Land encroachment in square metres Akola 3,988.47 Mumbai 8,344.70 Nagpur 1,540.30 Satara 80.10
Total 13,953.57 (Source: Information furnished by the Corporation)
The Corporation may evolve a suitable policy for dealing with the issue of land under encroachment.
3.59 It was possible for the Corporation to undertake projects on public private partnership basis for construction of shopping complexes, malls, hotels, office spaces, etc. above (from first or second floor onwards) the existing sites so as to bring in a steady stream of revenue without any investment by it. Such projects can be executed without curtailing the existing area of operations of the Corporation and can yield substantial revenue.
The Corporation has not formulated any consistent policy regarding commercial exploitation of available land. The GoM accepted (September 2008) the request of the Corporation and increased the Floor Space Index (FSI)# on such land from one to one and half. However, consequential increase in availability of built-up area due to increase in FSI was not commercially exploited by the Corporation (November 2009).
The Corporation stated (October 2009) that the projects were being re-planned considering increase in FSI from 0.5 to 1.00 for commercial use out of maximum FSI of 1.5. The reply is not convincing as the increase in FSI, which was accepted by the GoM in September 2008 is yet to be effectively utilised by the Corporation (November 2009). Fare policy and fulfillment of social obligations Existence and fairness of fare policy
3.60 Section 67(1) of the Motor Vehicles Act empowers the State Government to fix the minimum and maximum rate for stage and contract carriages. The
# Floor space index is fixed by the local authority. It is the ratio of the combined gross floor area of all floors (excluding areas specifically exempted) to the total area of the plot.
The Corporation had not formulated any consistent policy for commercial exploitation of land.

Chapter III- Performance Audit relating to Statutory corporation
85
State Government appointed (December 1992) a Committee to recommend a standard formula for automatic revision of passenger fare.
The Committee recommended (October 1995) an automatic fare revision formula based on which the fare be revised annually. This was accepted by the State Government (April 1999) which provided for revision of fare based on revision of DA rates and increase in cost of fuel, tyres and chassis. The automatic fair revision formula was for ordinary services and 80 per cent schedules of the Corporation were of ordinary services.
The input price increase was to be neutralised to the extent of 87.5 per cent while revising the fare and the balance 12.5 per cent was to be absorbed by the Corporation. The position of the passenger fare during 2004-05 to 2008-09 was as under:
Fare table for ordinary buses (In Rupees) Stages 2004-05 2005-06 2006-07 2007-08 2008-09
First 6 KMs 4 4 4 4 4 Upto 12 KMs 7 7 8 8 8 Upto 24 KMs 14 15 15 15 16 Upto 96 KMs 54 58 60 60 62 Upto 102 KMs 58 62 64 64 66
(Source: Information compiled from the Fare Table)
The Corporation had revised the fare four times in November 2004, October 2005, August 2006 and July 2008 during the review period. Audit scrutiny of three fare revisions from October 2005 onwards revealed the following:
• The Corporation considered the High Speed Diesel (HSD) rate of five Divisions only instead of cost of fuel at Mumbai which was lower than the average for five Divisions. Therefore the fare revision on account of HSD was on higher side.
• The cost of chassis considered by the Corporation was of TATA make only while the chassis of Leyland make was also procured. The tyres were purchased from six manufacturers. The weighted average cost of both chassis make and tyres was less than what was considered in fare revision resulting in higher revision of fare.
• In the approved formula for automatic fare revision, only change in percentage of Dearness Allowance (DA) rates was considered as a contributor for fare revision instead of total manpower cost. Audit observed that subsequent to pay revision after implementation of Pay Commission recommendations, the percentage of DA got reduced though the overall
Comprising of Secretary, Home Department (Transport), Joint Commissioner of State
Transport, Deputy General Manager (Transport) MSRTC, Additional General Manager of Brihan Mumbai Electric Supply and Transport Undertaking (BEST), representative of Consumer Forum etc.

Audit Report (Commercial) for the year ended 31 March 2009
86
manpower cost had increased. However, the Corporation considered the old contribution of DA to total operating cost after the pay revision. This has resulted in revision of fare on higher side.
• According to the approved automatic fare revision formula, fare is to be charged to the passenger inclusive of Passenger Tax (PT). Further, instead of considering existing fare exclusive of PT, the fare including PT was considered for working out PT element in the revised fare which also resulted in higher fare revision.
The above deficiencies resulted in higher revision of fare for ordinary services in all the three fare revisions. This has resulted in excess collection from public. However, the financial impact of excess revision could not be worked out in Audit as the previous fare revisions would have an effect on the quantum of increase. Further, the effective kilometers operated under each category of services and their respective load factors would also have a bearing on the excess collection of fare due to higher revision of fare.
3.61 The fare policy of the Corporation had no scientific basis as it did not take into account the normative cost. Thus, there was a risk of commuters paying for inefficiency of the Corporation. The table below shows how the Corporation could have curtailed cost and increased revenue with better operational efficiency. Sl. No. Particulars 2004-05 2005-06 2006-07 2007-08 2008-09
1. Cost per KM (Rupees) 18.89 19.39 20.66 20.70 22.49
2. Traffic Revenue per KM (Rupees) 16.10 18.51 19.92 20.84 22.48
3. Loss of revenue# due to less vehicle productivity per KM (Rupees)
0.08 0.33 0.07 @ @
4. Excess cost due to excess consumption of fuel per KM (Rupees)
0.11 0.07 0.01 0.01 0.01
5. Ideal revenue (2 + 3) (Rupees) 16.18 18.84 19.99 20.84 22.48
6. Ideal cost per KM (1 - 4) (Rupees)
18.78 19.32 20.65 20.69 22.48
7. Net revenue per KM (2 - 1) (Rupees)
(-) 2.79 (-) 0.88 (-) 0.74 0.14 (-)0.01
8. Net ideal revenue (5-6) (Rupees) (-)2.60 (-)0.48 (-)0.66 0.15 --
9. Effective KMs (in crore) 179.76 172.13 173.52 178.85 181.31
10. Avoidable loss (in (Rupees) crore) [(7-8) X 9] 34.15 68.85 13.88 1.79 1.81
(Source: Financial results of the Corporation)
3.62 The above table does not take into account other inefficiencies such as defective route planning etc. Nonetheless, it shows that the net revenue could
# Loss of revenue has been worked out on the basis of traffic revenue contribution per KM. @ Not applicable as the Vehicle productivity was above AIA.
Deficiencies in computation of the element of fare revisions as per automatic formula resulted in higher revision of fare.

Chapter III- Performance Audit relating to Statutory corporation
87
be higher, if the operations are properly planned and efficiently managed, than what they actually are.
3.63 The above facts lead to conclude that it is necessary to regulate the fares on the basis of a normative cost and it would be desirable to have an independent regulatory body (like State Electricity Regulatory Commission) to fix the fares, specify operations on uneconomical routes and address the grievances of commuters. Adequacy of services on uneconomical routes
3.64 The Corporation has been serving all rural routes in the State. The Corporation had 21 per cent profit making routes as of March 2009 as shown in table under Paragraph 3.35. However, the position may change if the Corporation improved its efficiency. Nonetheless, there may still be some routes which would be uneconomical. Though, the Corporation was required to cater to these routes, the Corporation had not formulated norms for providing services on uneconomical routes. In the absence of norms, the adequacy of services on uneconomical routes could not be ascertained in Audit. The desirability to have an independent regulatory body to specify the quantum of services on uneconomical routes taking into account the specific needs of commuters is further underlined.
As per Essential Services (ES) Act, 2005 the Corporation operates certain services at the behest of the GoM as ES, which are called obligatory trips. Based on the recommendations of Upasani Committee# (January 2003) for defining obligatory trips, the Corporation defined (October 2003) all trips which were not recovering even variable cost as obligatory trips. However, the GoM rejected (April 2007) the definition given by the Corporation on the plea that all trips not recovering variable costs are not covered as trips operated for ES. However, the Corporation raised claims for Rs 962.45 crore during 2004-09 with the GoM for reimbursement of losses on account of ES based on its own definition which had not been paid by the Government. Audit observed that some of the ‘C’ trips may become ‘B’ trips by improving operational efficiency and after inclusion of the reimbursement of concessions.
The Corporation stated (October 2009) that it is obligatory on the part of the Corporation to provide minimum services to the passengers being its monopoly in the sector. The performance was reviewed at all levels to reduce the loss from non obligatory trips. It was further stated that profitability of each trip would be assessed in future after taking concessions into account as suggested by audit. However, the Corporation may define obligatory trips so that the same is mutually accepted by both the GoM and the Corporation and losses on their operations are reimbursed.
# Committee headed by Shri Upasani (former Chief Secretary to the GoM) assisted by two
expert members appointed by the GoM for financial and administrative restructuring of the Corporation.

Audit Report (Commercial) for the year ended 31 March 2009
88
Monitoring by top management MIS data and monitoring of service parameters
3.65 For a Road Transport Corporation to succeed in operating economically, efficiently and effectively, there have to be written norms of operations, service standards and targets. Further, there has to be Management Information System (MIS) to report on achievement of targets and norms. The achievements need to be reviewed to address deficiencies and also to set targets for subsequent years. The targets should generally be such so that its achievement would make an organisation self-reliant. The annual targets for Regions are fixed by VC&MD and in turn Regions fixed targets for Divisions.
In the light of the above, Audit reviewed the system and it was observed that Monthly Operational Reports (MORs) are generated to report the performance of the Corporation, which were inadequate in view of the following:
• The MOR indicates the performance of key parameters. However, in the absence of norms regarding vehicle productivity and bus staff ratio the comparison with the actual achievement could not be worked out through available data from MOR.
• MOR did not furnish the figures for cumulative consumption of engine oil. Further, the consumption of single month reported through MOR is not comparable with the standards as the engines due for oil change may differ from month to month.
• The Corporation had not generated MIS on number of buses due for reconditioning and actually reconditioned under each category to ensure that all buses are reconditioned in time.
• The performance of Divisional Workshop on docking of buses was not reported though MOR to ensure docking of buses in time.
• There was no system of evaluation of utilisation of manpower by the Corporation with standard mandays.
• Monitoring of pending court cases for recovery of licence fees and others was not effective and pendency registered increasing trend.
• The MORs are reviewed by VC&MD and deficiencies noticed are brought to the notice of the Regional Managers for remedial action. However, there was no system for periodical submission of operational reports to Board of Directors (BoD) for their consideration.
The Corporation stated (October 2009) that compilation of MIS is submitted to top management for decision and corrective action. The annual Administrative Report is submitted to BoD and the GoM as per provisions of the RTC, Act. The reply is not convincing as periodicity of the Administrative

Chapter III- Performance Audit relating to Statutory corporation
89
Report is annual and would not be an aid to the BoD for addressing the deficiencies noticed during the course of the year for remedial action.
Acknowledgement
3.66 Audit acknowledges the co-operation and assistance extended by different levels of the management at various stages of conducting of the performance audit. Conclusion
Operational performance
• The State Government had not formulated an Integrated Transport Policy defining the role of the Corporation in public transport.
• The Corporation had not fixed internal targets for vehicle productivity to enhance efficiency on that account.
• The profitability of trips was being assessed without reckoning the concessions received from the State Government. Based on the information furnished by the Corporation, there was no significant increase in percentage of profit making trips over the review period.
• Percentage of cancellation of scheduled KMs increased from 2.09 to 2.34 during the review period mainly due to shortage and absenteeism of crew and shortage of buses.
• The Corporation had not conducted cost benefit analysis of utilising its own fleet vis-a-vis hired buses in areas with different traffic potential to adopt the best option.
Financial management
• The Corporation could not realise Rs 352 crore recoverable from the State Government on account of wage settlement dues. The Corporation had not formulated any strategic plan in conjunction with the State Government for recovery of outstanding dues.
• The Corporation did not have any consistent policy for large scale tapping of non conventional sources of revenue through commercial exploitation of available land by taking up BOT projects.
Fare policy and fulfillment of social obligations
• Though the Corporation had a fare policy, due to incorrect inputs in automatic fare revision formula, the Corporation had charged excess fare from the public.

Audit Report (Commercial) for the year ended 31 March 2009
90
• In the absence of any norms, the adequacy of services on uneconomical routes could not be ascertained in Audit.
Monitoring by top management
• The Corporation had not prescribed any norms for bus staff ratio and vehicle productivity to ensure maximum utilisation of manpower and fleet. Further, the periodicity of MIS submitted to the top management was inadequate.
On the whole, there is immense scope to improve the performance of the Corporation. Effective monitoring of key parameters, coupled with certain policy measures can see further improvement in performance.
Recommendations
Operational performance
• The Corporation may minimise cancellation of scheduled KMs and improve the reliability of services besides ensuring economy in operation particularly in the area of manpower utilisation and consumption of fuel.
• The Corporation may improve its load factor by controlling the clandestine operations. The State Government may review the existing rules for penalty for clandestine operations.
Financial performance
• The Corporation may formulate a strategic plan in conjunction with the State Government for recovery of outstanding dues.
• The Corporation may evolve policy to deal with land encroachment and large scale commercial exploitation of available land.
Fare policy and fulfillment of social obligations
• The Government may consider creating a regulator to ensure that correct cost inputs are used to regulate fares based on agreed formula, the formula is updated at regular intervals and regulate services on uneconomical routes.
• The Corporation and Government may evolve mutually acceptable definition of obligatory trips so that the losses on that account are reimbursed to the Corporation.
Monitoring by top management
• The Corporation may prescribe norms for bus staff ratio and vehicle productivity to ensure maximum utilisation of manpower and fleet.

Chapter III- Performance Audit relating to Statutory corporation
91
• The Corporation may evolve an MIS with greater reliability and with enhanced periodicity for submission to BoD.
The matter was reported to the Government (August 2009); their reply was awaited (December 2009).