
Performance and Emission analysis of Multi-Cylinder Common ...
46
Journal of Engg. Research Online First Article 1 Performance and Emission analysis of Multi-Cylinder Common Rail Direct Injection Diesel Engine Powered with Blends of Tyre Pyrolysis Oil-Ethanol- Diesel DOI : 10.36909/jer.8583 S. V. Khandal * , T.M. Yunus khan ** , Irfan Anjum Badruddin *** , Sarfaraz Kamangar *** , C. Ahamed Saleel *** , Maughal Ahmed Ali Baig **** , Salman Ahmed N J ***** * Department of Mechanical Engineering, Sanjay Ghodawat University, Kolhapur, Maharashtra, India. ** Research Center for Advanced Materials Science (RCAMS), King Khalid University, P.O. Box 9004, Abha, 61413, Asir, Kingdom of Saudi Arabia *** Department of Mechanical Engineering, College of Engineering, King Khalid University, Abha 61421, Kingdom of Saudi Arabia. **** Department of Mechanical Engineering, CMR Technical Campus, Hyderabad, India ***** Department of Mechanical and Industrial Engineering, Sultan Qaboos University, Muscat, Oman. **** Corresponding Author Email: [email protected] ABSTRACT This paper mainly focuses on optimal replacement of diesel by Tyre Pyrolysis oil-Ethanol blends to run a common rail direct injection (CRDI) multi cylinder engine and to compare the results with neat diesel fuel operation results at 1500 rpm. The engine was operated at different loads and speeds. From the experimental study, decrease in brake thermal efficiency (BTE) and oxides of nitrogen (NOx) emission with increase in carbon monoxide (CO), hydrocarbon (HC), and smoke
Transcript of Performance and Emission analysis of Multi-Cylinder Common ...
Journal of Engg. Research Online First Article
1
Performance and Emission analysis of Multi-Cylinder Common Rail Direct
Injection Diesel Engine Powered with Blends of Tyre Pyrolysis Oil-Ethanol-
Diesel
DOI : 10.36909/jer.8583
S. V. Khandal*, T.M. Yunus khan**, Irfan Anjum Badruddin***, Sarfaraz Kamangar***, C.
Ahamed Saleel***, Maughal Ahmed Ali Baig****, Salman Ahmed N J*****
*Department of Mechanical Engineering, Sanjay Ghodawat University, Kolhapur, Maharashtra,
India.
**Research Center for Advanced Materials Science (RCAMS), King Khalid University, P.O. Box
9004, Abha, 61413, Asir, Kingdom of Saudi Arabia
***Department of Mechanical Engineering, College of Engineering, King Khalid University, Abha
61421, Kingdom of Saudi Arabia.
****Department of Mechanical Engineering, CMR Technical Campus, Hyderabad, India
*****Department of Mechanical and Industrial Engineering, Sultan Qaboos University, Muscat,
Oman.
****Corresponding Author Email: [email protected]
ABSTRACT
This paper mainly focuses on optimal replacement of diesel by Tyre Pyrolysis oil-Ethanol blends
to run a common rail direct injection (CRDI) multi cylinder engine and to compare the results with
neat diesel fuel operation results at 1500 rpm. The engine was operated at different loads and
speeds. From the experimental study, decrease in brake thermal efficiency (BTE) and oxides of
nitrogen (NOx) emission with increase in carbon monoxide (CO), hydrocarbon (HC), and smoke
Journal of Engg. Research Online First Article
2
emission was observed for blends as compared to diesel fuel. Further, it was also observed that
increase in speed from 1200 rpm to 1800 rpm yielded higher BTE with decrease in CO, HC and
smoke emission. But slightly increase in NOx, peak pressure (PP) and heat release rate (HRR) was
reported at higher speed as compared to lower speeds. Beyond engine speed of 1800 rpm, knocking
was observed.
Key words: Tyre Pyrolysis Oil (TPO), Common Rail Direct Injection (CRDI) Engine, Ethanol,
Engine Performance.
INTRODUCTION
Fast depletion of diesel besides stringent emissions norms being implemented by authorities of
various countries around the globe have pushed researchers to look into feasible solutions to
aforesaid problems of diesel engines (Dawodu et al., 2014; Afzal et al. 2018 & Khan et al., 2014).
These two problems have boosted the research in the field of alternate fuels to replace diesel
(Alenezi & Al-Anzi, 2013 & Avulapati et al., 2016). In recent years, lot of research activity being
carried out to recover energy from waste materials such as rubber and plastics that have high
energy density (Wang et al., 2010). The waste from tyres and tubes of automotive vehicles pose
big environmental problem as it is not biodegradable (Jang et al., 1998). Pyrolysis has been
regarded as potential way towards sustainable economy for management of this type of waste
(Martinez et al., 2020). Pyrolysis of tyres could minimize the dependency on fossil fuels besides
addressing the concern related to climate change (Antoniou et al., 2013; Martínez et al., 2020).
Pyrolysis is thermochemical process which converts waste to useful energy under oxygen free
environment (Elbaba et al., 2012) and this process was demonstrated by many researchers
(Murugan et al., 2008 & Sharma et al., 2013). The end product of tyre pyrolysis process yields
three valuables- Tyre pyrolysis oil (TPO), pyro-gas and carbon black (Arya et al., 2020). TPO
Journal of Engg. Research Online First Article
3
alone cannot be used directly in diesel engine without its proper upgrading (Aydın et al., 2012,
Ahoor et al., 2014 & Martínez 2014 et al.,). The cetane number of TPO is below 30 which is an
important fuel property for ignition of fuel (Hossain et al., 2013 & Van de Beld et al., 2013). TPO
can be blended with diesel which improves the cetane number and then can be used in existing
diesel engine (Murugan et al., 2008 & Frigo et al., 2014). Hariharan et al., 2013 studied the effect
of diethyl ether on the performance of diesel engine run withg TPO and reported that 5% reduction
in formation of oxides of nitrogen (NOx) as compared to diesel engine run with neat diesel.
Different approaches have been reported on utilization of TPO in diesel engine like blending TPO
with diesel (Frigo et al., 2014, Martínez et al., 2014; Aydın et al., 2015 & Seljak et al., 2015) or
biodiesel (Sharma et al., 2015 (a); Sharma et al., 2015(b)), increasing the intake temperature of air
(McNeil et al., 2012), increasing compression ratio (Van de Beld et al., 2013),varying injection
timing and pressure (Sudershan et al., 2018a), artificial neural network (ANN) modeling (Khandal
et al., 2020).
An experimental study on CRDI engine run with diesel blend fuel (5% ethanol–20% biodiesel–
75% diesel) revealed that ethanol as an additive for the biodiesel–diesel blend does not need any
modification of CI engine. A blend fuel 20% bio-ethanol, 10% rape seed methyl ester, and 70%
diesel used in Euro 5 CI engine revealed that reduction of smoke and NOx at all tested conditions
and an increase of CO and HC, especially at partial loads. Blend of 10% ethanol, 10% microalgae
oil and 80% diesel was found to be homogenous and stable without using a surfactant with
improved properties of the resulted blend.
An experimental work reported that the best operating parameters for maximum BTE besides
lowered emissions were injection timing of 10obTDC and injection pressure of 900 bar with fuel
combinations of 70% plastic pyrolysis oil (PPO) with 28% diesel and 2% ethanol (Sudarshan et
Journal of Engg. Research Online First Article
4
al., 2018 b). Phase separation problem encountered when percentage of ethanol was more than
15% in the blend (Gadwal et al., 2019). The presence of hydroxyl group in ethanol reduces
particulate emissions of diesel engines. Blends of diesel-ethanol-fuelled multi cylinder diesel
engine showed higher brake specific fuel consumption (BSFC) and improved brake thermal
efficiency (BTE) for higher ethanol content in the blend. This work also revealed that carbon
monoxide (CO) and smoke emission reduced remarkably at higher loads (Armaset al., 2006 &
Tomicet al., 2013). The usage of ethanol with diesel in farm equipment engine resulted in lower
smoke and particulate emissions (Kwanchareonet al., 2007). A study with blend of ethanol and
diesel on diesel engine showed lower BTE, CO, hydrocarbon (HC) and smoke emissions with
higher NOx emission (Sayin, 2010). Influence of blends of ethanol and biodiesel showed higher
BTE with lower NOx and particulate matter (PM) emission in comparison with diesel fuel. BSFC,
CO and HC emissions increased with increase in the proportion of ethanol in the blends
(Banapurmath et al., 2010).
Motivation for the present study and objectives
The detailed literature review revealed that TPO has been blended with diesel or biodiesel. There
are some studies which used TPO-ethanol blend with diesel and biodiesel as pilot injection fuels
(Lee et al., 2013 & Lee et al., 2015). As scarce literature is available with blends of TPO-ethanol-
diesel, an attempt is made to use blends of TPO, diesel and ethanol as a substitute to neat diesel
fuel to power diesel engine. The blends were prepared with different proportions of ethanol to
study their effect on multi-cylinder engine performance, combustion and tail pipe emissions. The
experiments were conducted on multi cylinder CRDI diesel engine for varied ethanol-diesel
proportions at different speeds and engine performance was compared with diesel fuel operation
to make critical inferences.
Journal of Engg. Research Online First Article
5
MATERIALS AND METHODS
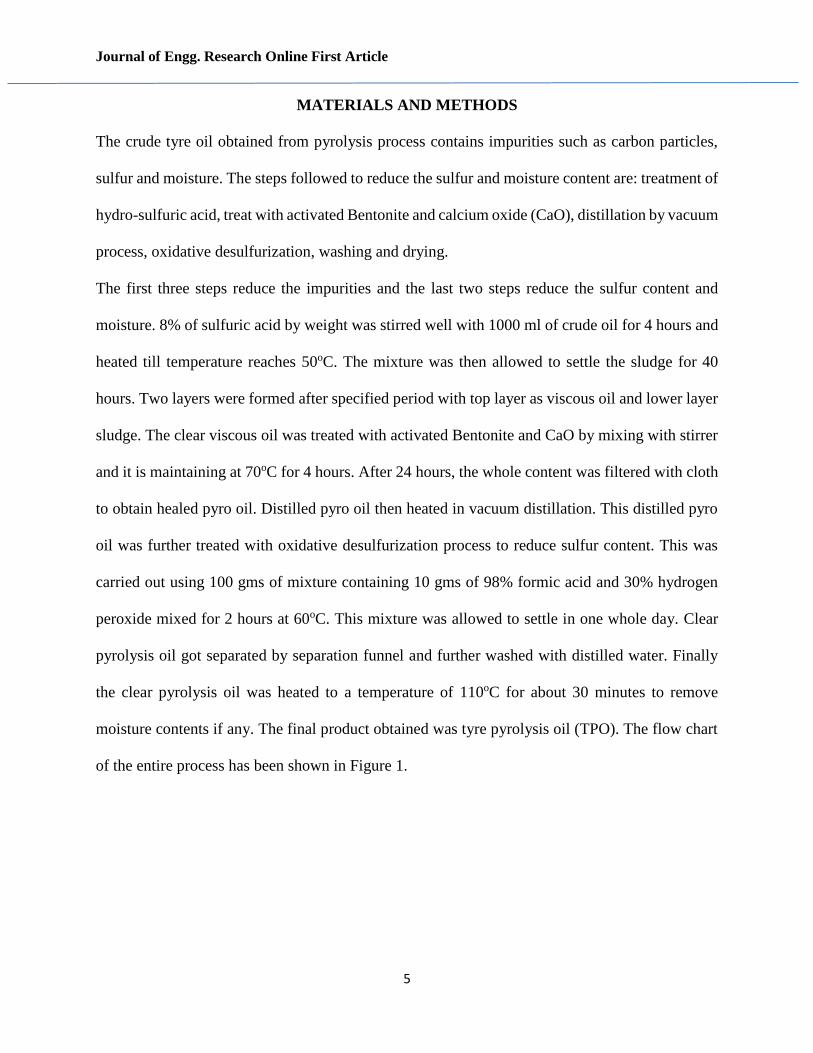
The crude tyre oil obtained from pyrolysis process contains impurities such as carbon particles,
sulfur and moisture. The steps followed to reduce the sulfur and moisture content are: treatment of
hydro-sulfuric acid, treat with activated Bentonite and calcium oxide (CaO), distillation by vacuum
process, oxidative desulfurization, washing and drying.
The first three steps reduce the impurities and the last two steps reduce the sulfur content and
moisture. 8% of sulfuric acid by weight was stirred well with 1000 ml of crude oil for 4 hours and
heated till temperature reaches 50oC. The mixture was then allowed to settle the sludge for 40
hours. Two layers were formed after specified period with top layer as viscous oil and lower layer
sludge. The clear viscous oil was treated with activated Bentonite and CaO by mixing with stirrer
and it is maintaining at 70oC for 4 hours. After 24 hours, the whole content was filtered with cloth
to obtain healed pyro oil. Distilled pyro oil then heated in vacuum distillation. This distilled pyro
oil was further treated with oxidative desulfurization process to reduce sulfur content. This was
carried out using 100 gms of mixture containing 10 gms of 98% formic acid and 30% hydrogen
peroxide mixed for 2 hours at 60oC. This mixture was allowed to settle in one whole day. Clear
pyrolysis oil got separated by separation funnel and further washed with distilled water. Finally
the clear pyrolysis oil was heated to a temperature of 110oC for about 30 minutes to remove
moisture contents if any. The final product obtained was tyre pyrolysis oil (TPO). The flow chart
of the entire process has been shown in Figure 1.
Journal of Engg. Research Online First Article
6
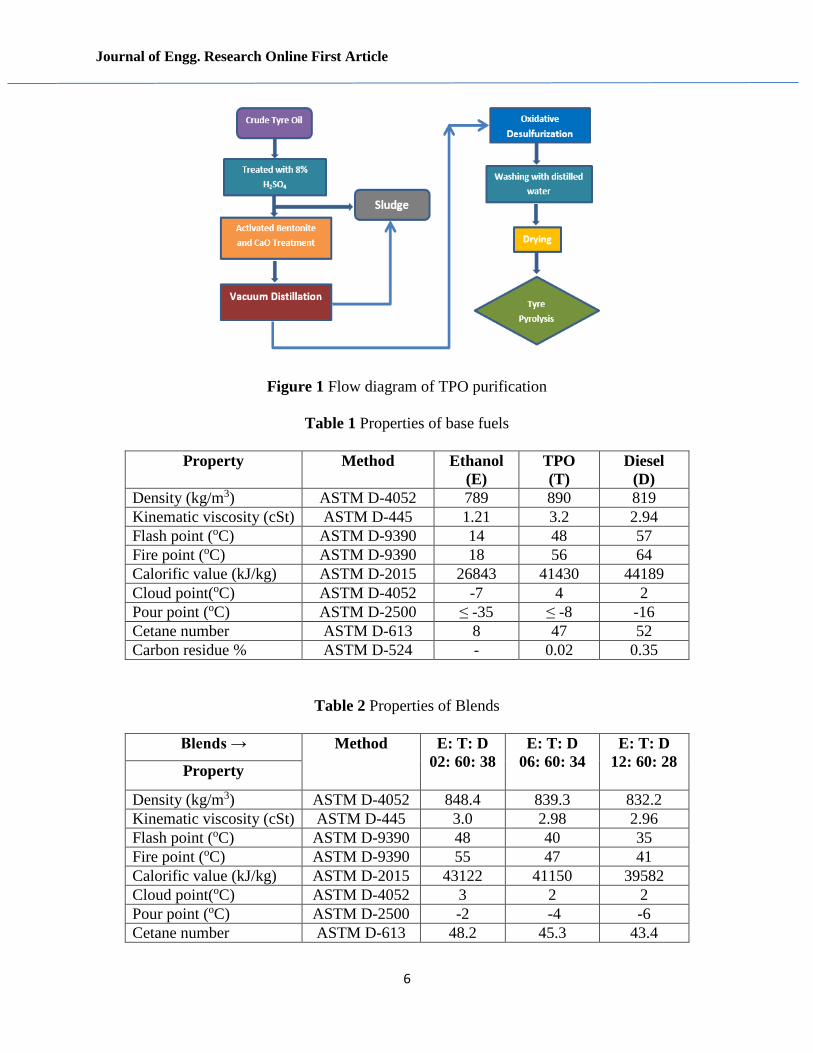
Figure 1 Flow diagram of TPO purification
Table 1 Properties of base fuels
Property Method Ethanol
(E)
TPO
(T)
Diesel
(D)
Density (kg/m3) ASTM D-4052 789 890 819
Kinematic viscosity (cSt) ASTM D-445 1.21 3.2 2.94
Flash point (oC) ASTM D-9390 14 48 57
Fire point (oC) ASTM D-9390 18 56 64
Calorific value (kJ/kg) ASTM D-2015 26843 41430 44189
Cloud point(oC) ASTM D-4052 -7 4 2
Pour point (oC) ASTM D-2500 ≤ -35 ≤ -8 -16
Cetane number ASTM D-613 8 47 52
Carbon residue % ASTM D-524 - 0.02 0.35
Table 2 Properties of Blends
Blends → Method E: T: D
02: 60: 38
E: T: D
06: 60: 34
E: T: D
12: 60: 28 Property
Density (kg/m3) ASTM D-4052 848.4 839.3 832.2
Kinematic viscosity (cSt) ASTM D-445 3.0 2.98 2.96
Flash point (oC) ASTM D-9390 48 40 35
Fire point (oC) ASTM D-9390 55 47 41
Calorific value (kJ/kg) ASTM D-2015 43122 41150 39582
Cloud point(oC) ASTM D-4052 3 2 2
Pour point (oC) ASTM D-2500 -2 -4 -6
Cetane number ASTM D-613 48.2 45.3 43.4
Journal of Engg. Research Online First Article
7
Carbon residue % ASTM D-524 0.32 0.30 0.23
EXPERIMENTAL METHODOLOGY
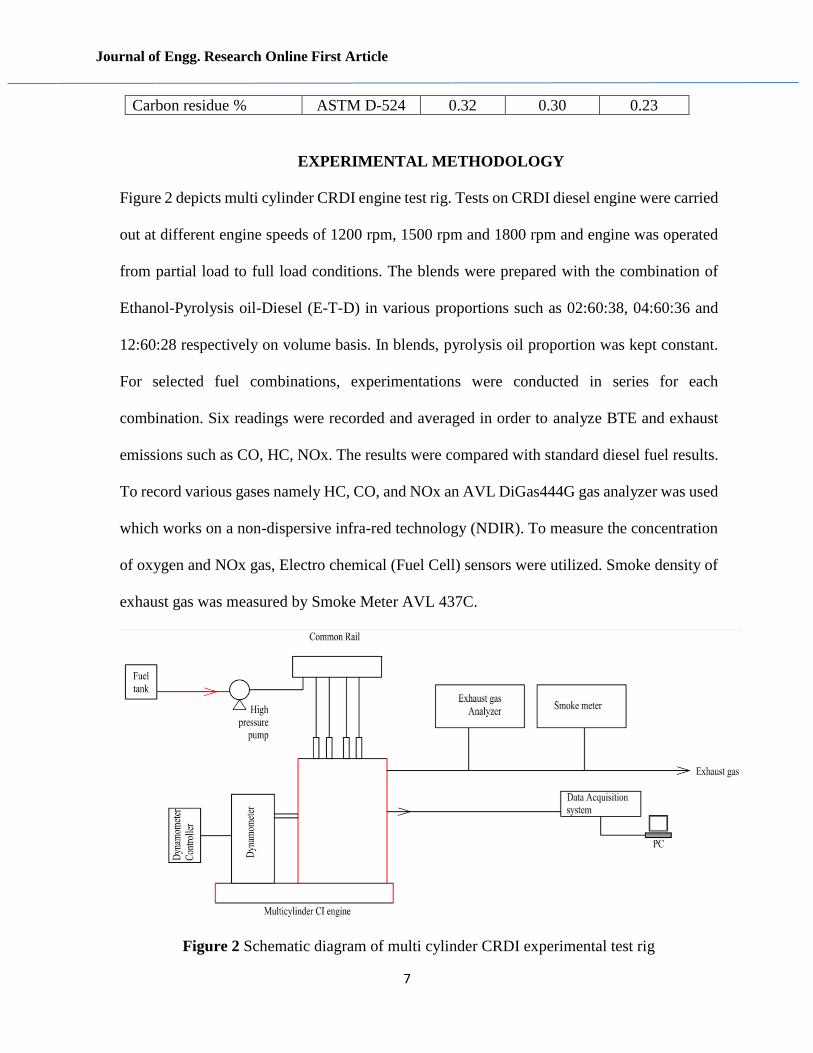
Figure 2 depicts multi cylinder CRDI engine test rig. Tests on CRDI diesel engine were carried
out at different engine speeds of 1200 rpm, 1500 rpm and 1800 rpm and engine was operated
from partial load to full load conditions. The blends were prepared with the combination of
Ethanol-Pyrolysis oil-Diesel (E-T-D) in various proportions such as 02:60:38, 04:60:36 and
12:60:28 respectively on volume basis. In blends, pyrolysis oil proportion was kept constant.
For selected fuel combinations, experimentations were conducted in series for each
combination. Six readings were recorded and averaged in order to analyze BTE and exhaust
emissions such as CO, HC, NOx. The results were compared with standard diesel fuel results.
To record various gases namely HC, CO, and NOx an AVL DiGas444G gas analyzer was used
which works on a non-dispersive infra-red technology (NDIR). To measure the concentration
of oxygen and NOx gas, Electro chemical (Fuel Cell) sensors were utilized. Smoke density of
exhaust gas was measured by Smoke Meter AVL 437C.
Figure 2 Schematic diagram of multi cylinder CRDI experimental test rig
Journal of Engg. Research Online First Article
8
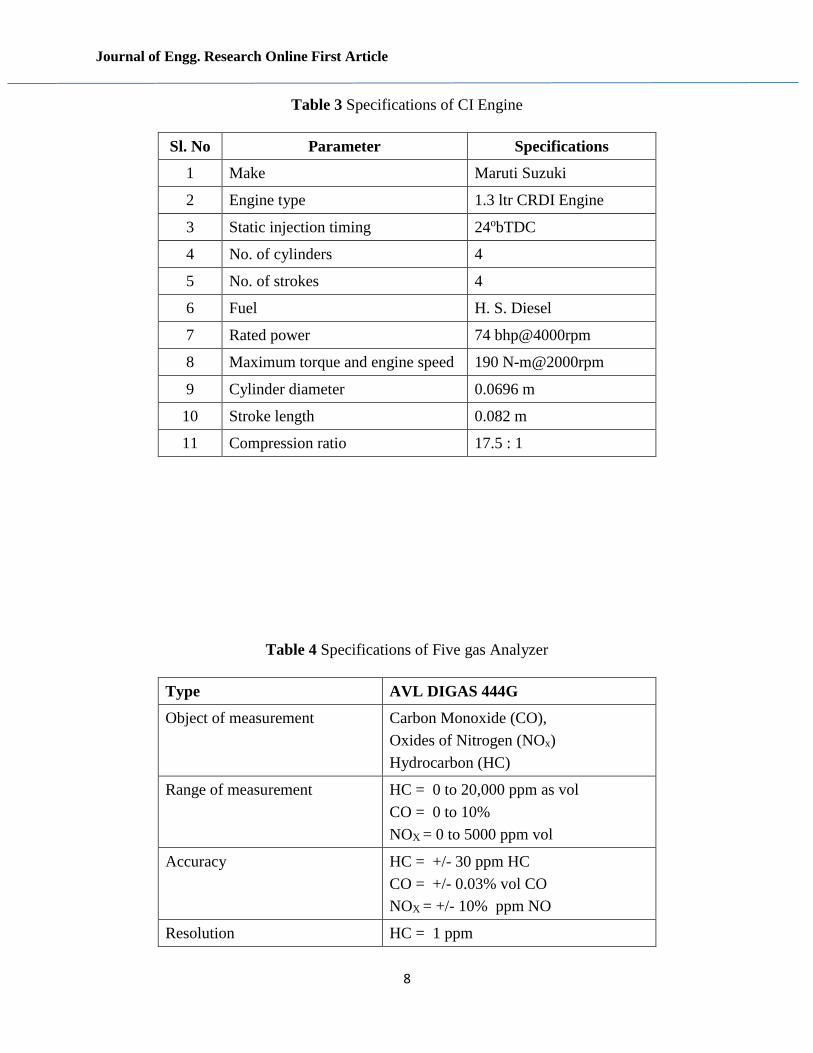
Table 3 Specifications of CI Engine
Sl. No Parameter Specifications
1 Make Maruti Suzuki
2 Engine type 1.3 ltr CRDI Engine
3 Static injection timing 24obTDC
4 No. of cylinders 4
5 No. of strokes 4
6 Fuel H. S. Diesel
7 Rated power 74 bhp@4000rpm
8 Maximum torque and engine speed 190 N-m@2000rpm
9 Cylinder diameter 0.0696 m
10 Stroke length 0.082 m
11 Compression ratio 17.5 : 1
Table 4 Specifications of Five gas Analyzer
Type AVL DIGAS 444G
Object of measurement Carbon Monoxide (CO),
Oxides of Nitrogen (NOx)
Hydrocarbon (HC)
Range of measurement HC = 0 to 20,000 ppm as vol
CO = 0 to 10%
NOX = 0 to 5000 ppm vol
Accuracy HC = +/- 30 ppm HC
CO = +/- 0.03% vol CO
NOX = +/- 10% ppm NO
Resolution HC = 1 ppm
Journal of Engg. Research Online First Article
9
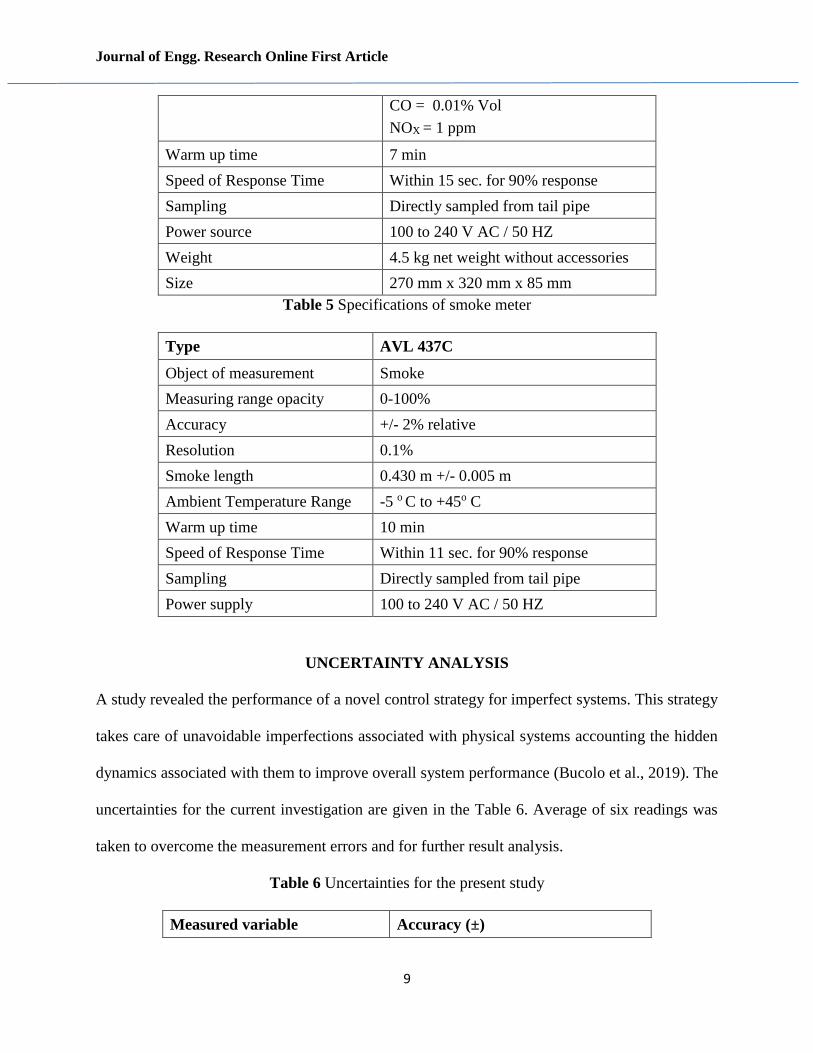
CO = 0.01% Vol
NOX = 1 ppm
Warm up time 7 min
Speed of Response Time Within 15 sec. for 90% response
Sampling Directly sampled from tail pipe
Power source 100 to 240 V AC / 50 HZ
Weight 4.5 kg net weight without accessories
Size 270 mm x 320 mm x 85 mm
Table 5 Specifications of smoke meter
Type AVL 437C
Object of measurement Smoke
Measuring range opacity 0-100%
Accuracy +/- 2% relative
Resolution 0.1%
Smoke length 0.430 m +/- 0.005 m
Ambient Temperature Range -5 o C to +45o C
Warm up time 10 min
Speed of Response Time Within 11 sec. for 90% response
Sampling Directly sampled from tail pipe
Power supply 100 to 240 V AC / 50 HZ
UNCERTAINTY ANALYSIS
A study revealed the performance of a novel control strategy for imperfect systems. This strategy
takes care of unavoidable imperfections associated with physical systems accounting the hidden
dynamics associated with them to improve overall system performance (Bucolo et al., 2019). The
uncertainties for the current investigation are given in the Table 6. Average of six readings was
taken to overcome the measurement errors and for further result analysis.
Table 6 Uncertainties for the present study
Measured variable Accuracy (±)
Journal of Engg. Research Online First Article
10
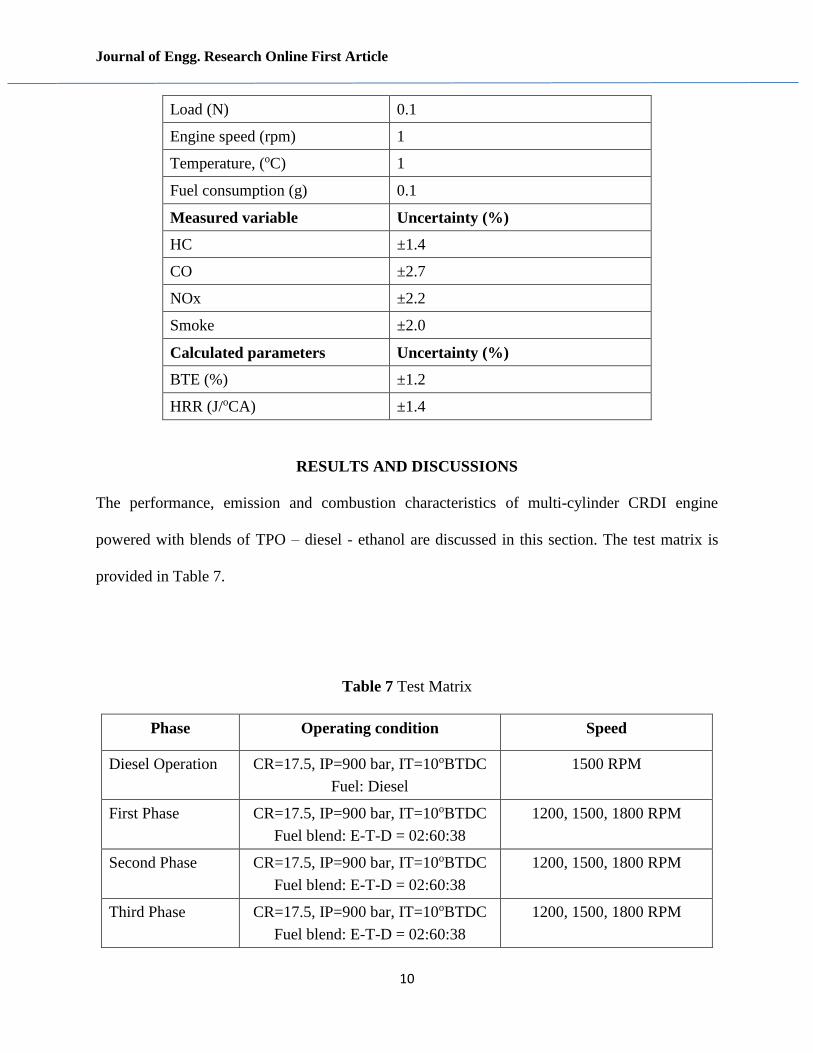
Load (N) 0.1
Engine speed (rpm) 1
Temperature, (oC) 1
Fuel consumption (g) 0.1
Measured variable Uncertainty (%)
HC ±1.4
CO ±2.7
NOx ±2.2
Smoke ±2.0
Calculated parameters Uncertainty (%)
BTE (%) ±1.2
HRR (J/oCA) ±1.4
RESULTS AND DISCUSSIONS
The performance, emission and combustion characteristics of multi-cylinder CRDI engine
powered with blends of TPO – diesel - ethanol are discussed in this section. The test matrix is
provided in Table 7.
Table 7 Test Matrix
Phase Operating condition Speed
Diesel Operation CR=17.5, IP=900 bar, IT=10oBTDC
Fuel: Diesel
1500 RPM
First Phase CR=17.5, IP=900 bar, IT=10oBTDC
Fuel blend: E-T-D = 02:60:38
1200, 1500, 1800 RPM
Second Phase CR=17.5, IP=900 bar, IT=10oBTDC
Fuel blend: E-T-D = 02:60:38
1200, 1500, 1800 RPM
Third Phase CR=17.5, IP=900 bar, IT=10oBTDC
Fuel blend: E-T-D = 02:60:38
1200, 1500, 1800 RPM
Journal of Engg. Research Online First Article
11
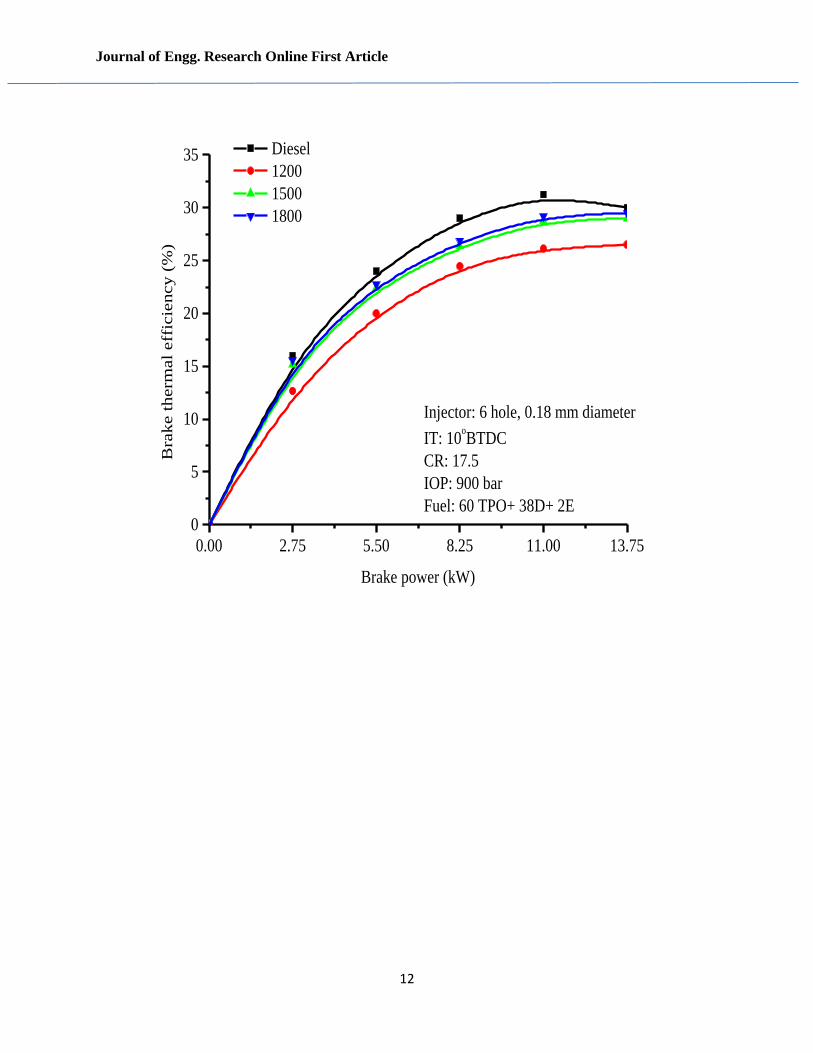
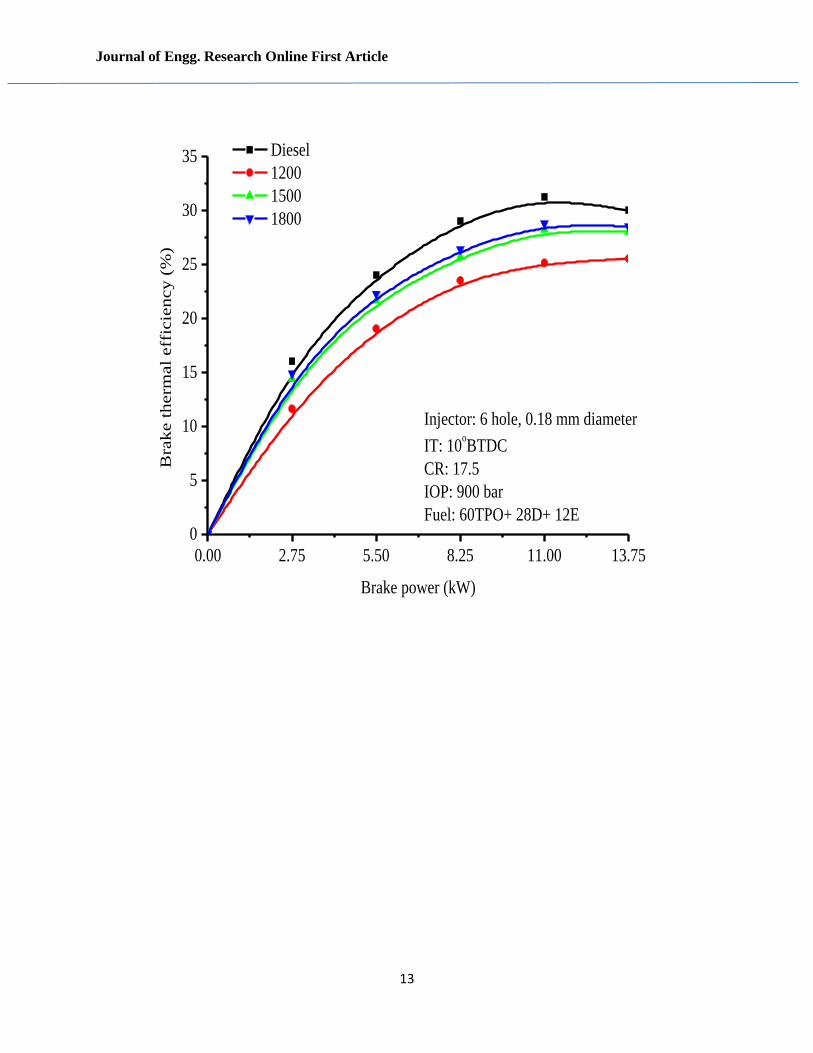
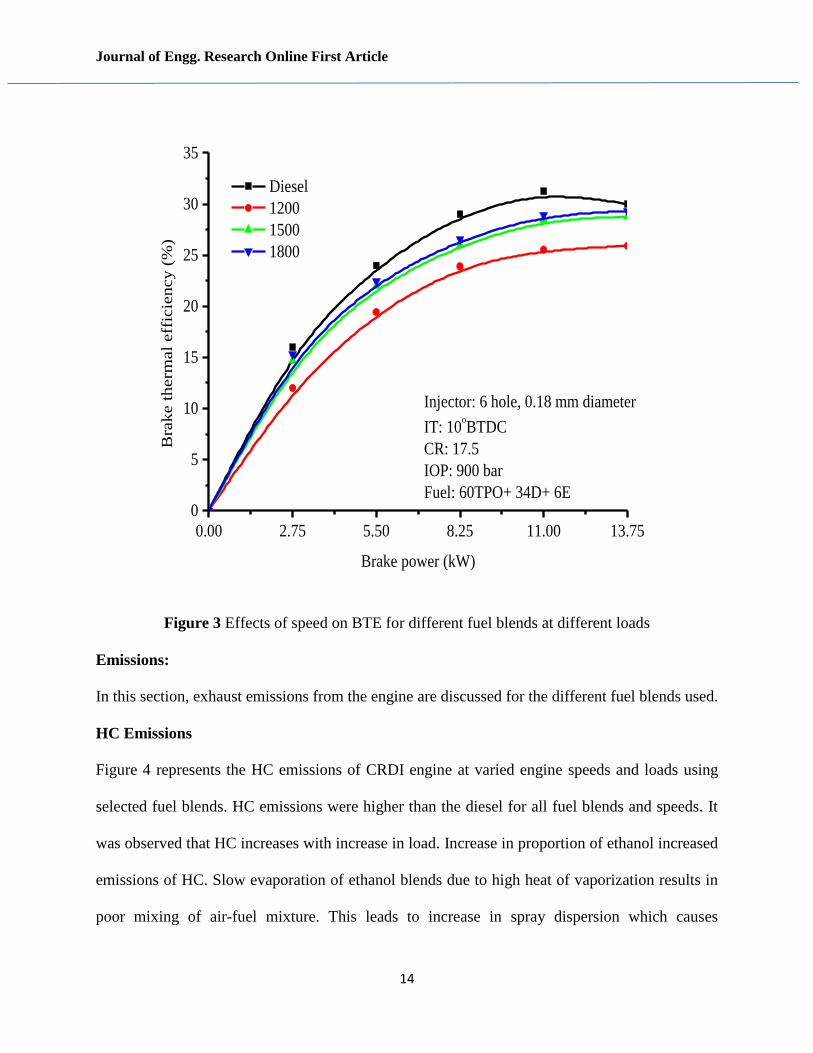
Influence of engine speed and fuel blends on brake thermal efficiency:
Figure 3 shows the effect of engine speeds and selected blends on BTE of CRDI engine at different
loads. For all fuel blends, BTE was lower as compared to diesel. This may be due to the blends
having lower energy contents and higher viscosity (Montajir et al., 2000; Sudarshan, 2018b; Sayin,
2010& Manjunath et al., 2019). When concentration of ethanol was increased, marginal decrease
in BTE was observed. Lower cetane number of ethanol could be another factor for low BTE
(Gadwal, 2019). With increase in load and speed, BTE was increased for all combinations of fuel
blends. For the selected combination E02:T60: D38 showed better BTE as compared to other
combinations. Among all speeds, 1800 rpm showed better results for all combinations of fuel
blends (An et al., 2012). Knocking was observed when engine speed increased beyond 1800 rpm.
Similar results were observed in literature (Sjoberg et al., 2005).
Journal of Engg. Research Online First Article
12
0.00 2.75 5.50 8.25 11.00 13.75
0
5
10
15
20
25
30
35
Injector: 6 hole, 0.18 mm diameter
IT: 10oBTDC
CR: 17.5
IOP: 900 bar
Fuel: 60 TPO+ 38D+ 2E
Bra
ke t
herm
al
eff
icie
ncy
(%
)
Brake power (kW)
Diesel
1200
1500
1800
Journal of Engg. Research Online First Article
13
0.00 2.75 5.50 8.25 11.00 13.75
0
5
10
15
20
25
30
35
Injector: 6 hole, 0.18 mm diameter
IT: 10oBTDC
CR: 17.5
IOP: 900 bar
Fuel: 60TPO+ 28D+ 12E
Bra
ke t
herm
al
eff
icie
ncy (
%)
Brake power (kW)
Diesel
1200
1500
1800
Journal of Engg. Research Online First Article
14
0.00 2.75 5.50 8.25 11.00 13.75
0
5
10
15
20
25
30
35
Injector: 6 hole, 0.18 mm diameter
IT: 10oBTDC
CR: 17.5
IOP: 900 bar
Fuel: 60TPO+ 34D+ 6E
Bra
ke t
herm
al
eff
icie
ncy (
%)
Brake power (kW)
Diesel
1200
1500
1800
Figure 3 Effects of speed on BTE for different fuel blends at different loads
Emissions:
In this section, exhaust emissions from the engine are discussed for the different fuel blends used.
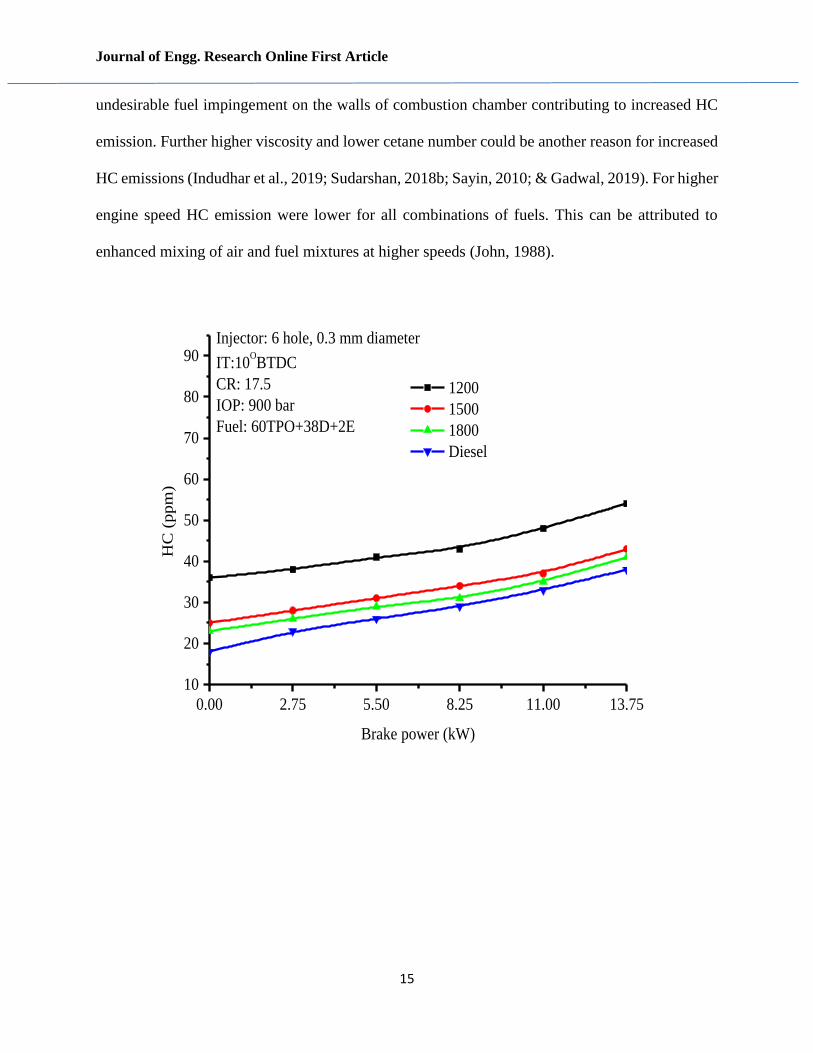
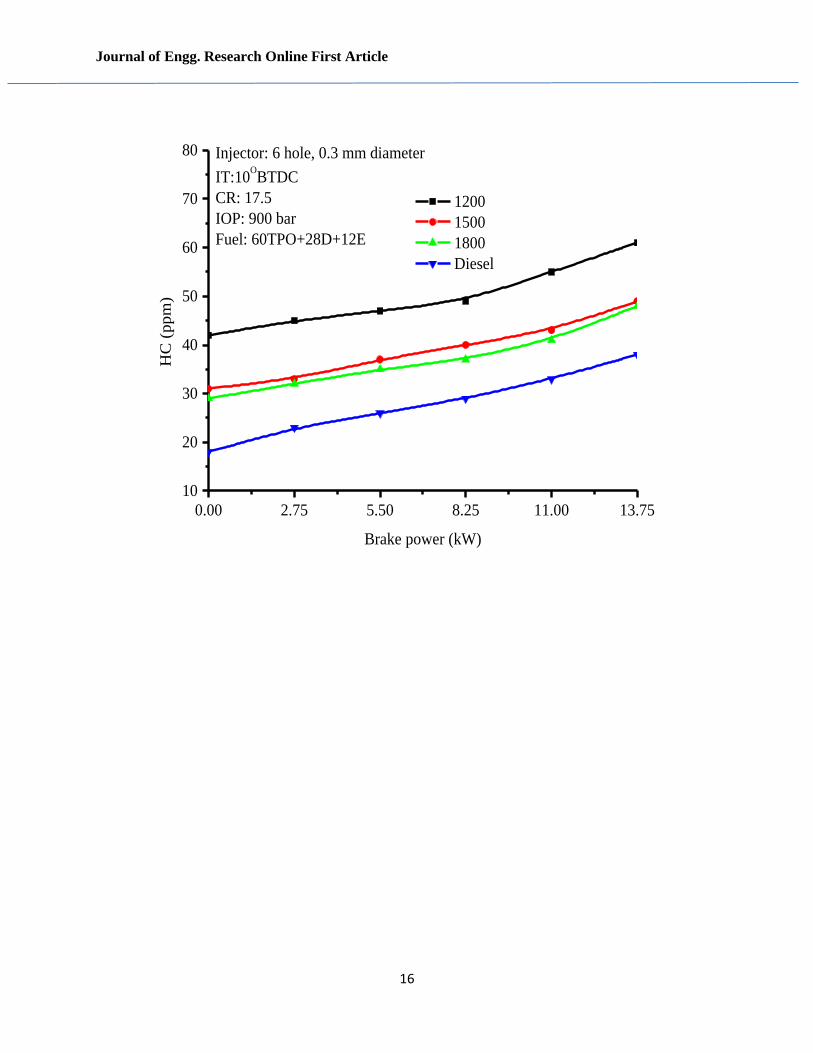
HC Emissions
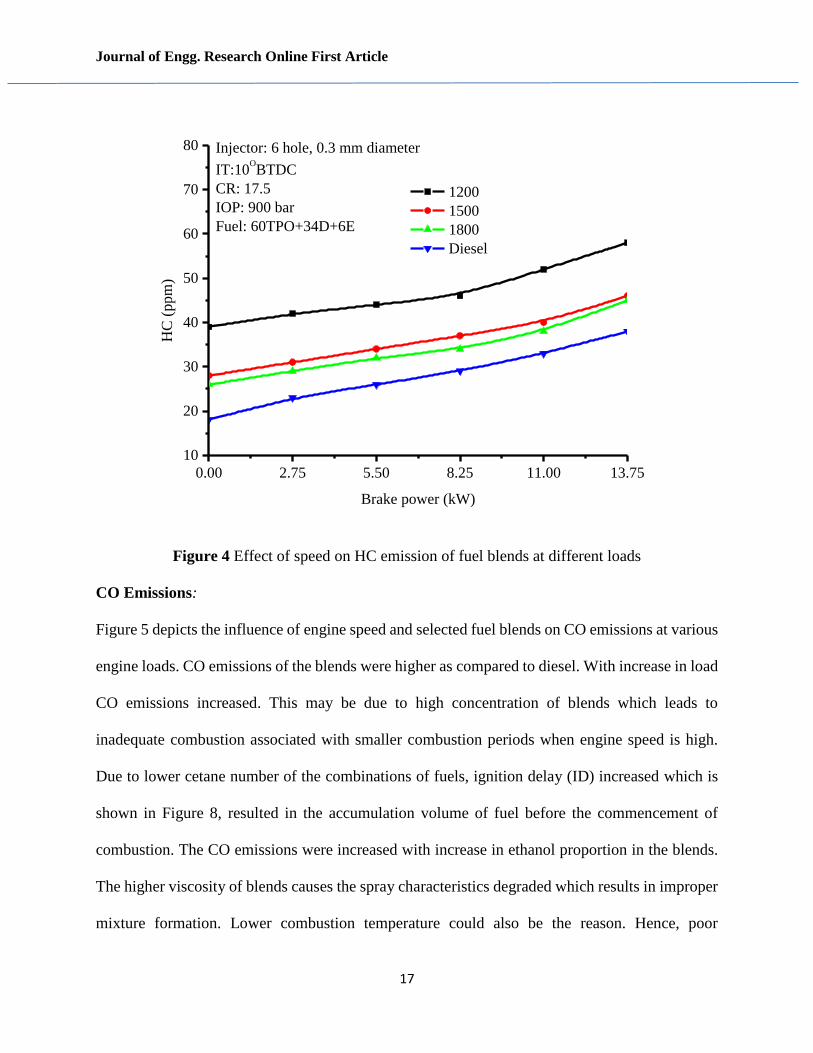
Figure 4 represents the HC emissions of CRDI engine at varied engine speeds and loads using
selected fuel blends. HC emissions were higher than the diesel for all fuel blends and speeds. It
was observed that HC increases with increase in load. Increase in proportion of ethanol increased
emissions of HC. Slow evaporation of ethanol blends due to high heat of vaporization results in
poor mixing of air-fuel mixture. This leads to increase in spray dispersion which causes
Journal of Engg. Research Online First Article
15
undesirable fuel impingement on the walls of combustion chamber contributing to increased HC
emission. Further higher viscosity and lower cetane number could be another reason for increased
HC emissions (Indudhar et al., 2019; Sudarshan, 2018b; Sayin, 2010; & Gadwal, 2019). For higher
engine speed HC emission were lower for all combinations of fuels. This can be attributed to
enhanced mixing of air and fuel mixtures at higher speeds (John, 1988).
0.00 2.75 5.50 8.25 11.00 13.75
10
20
30
40
50
60
70
80
90Injector: 6 hole, 0.3 mm diameter
IT:10OBTDC
CR: 17.5
IOP: 900 bar
Fuel: 60TPO+38D+2E
1200
1500
1800
Diesel
HC
(ppm
)
Brake power (kW)
Journal of Engg. Research Online First Article
16
0.00 2.75 5.50 8.25 11.00 13.75
10
20
30
40
50
60
70
80 Injector: 6 hole, 0.3 mm diameter
IT:10OBTDC
CR: 17.5
IOP: 900 bar
Fuel: 60TPO+28D+12E
1200
1500
1800
Diesel
HC
(ppm
)
Brake power (kW)
Journal of Engg. Research Online First Article
17
0.00 2.75 5.50 8.25 11.00 13.75
10
20
30
40
50
60
70
80 Injector: 6 hole, 0.3 mm diameter
IT:10OBTDC
CR: 17.5
IOP: 900 bar
Fuel: 60TPO+34D+6E
1200
1500
1800
Diesel
HC
(ppm
)
Brake power (kW)
Figure 4 Effect of speed on HC emission of fuel blends at different loads
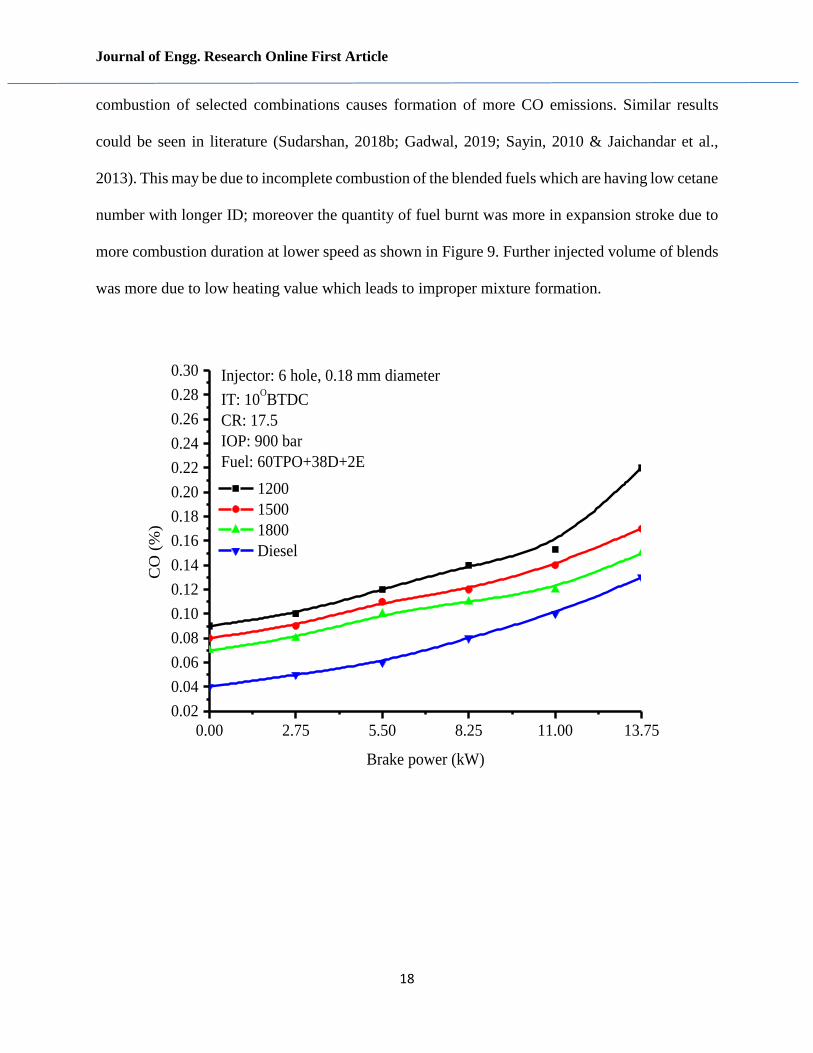
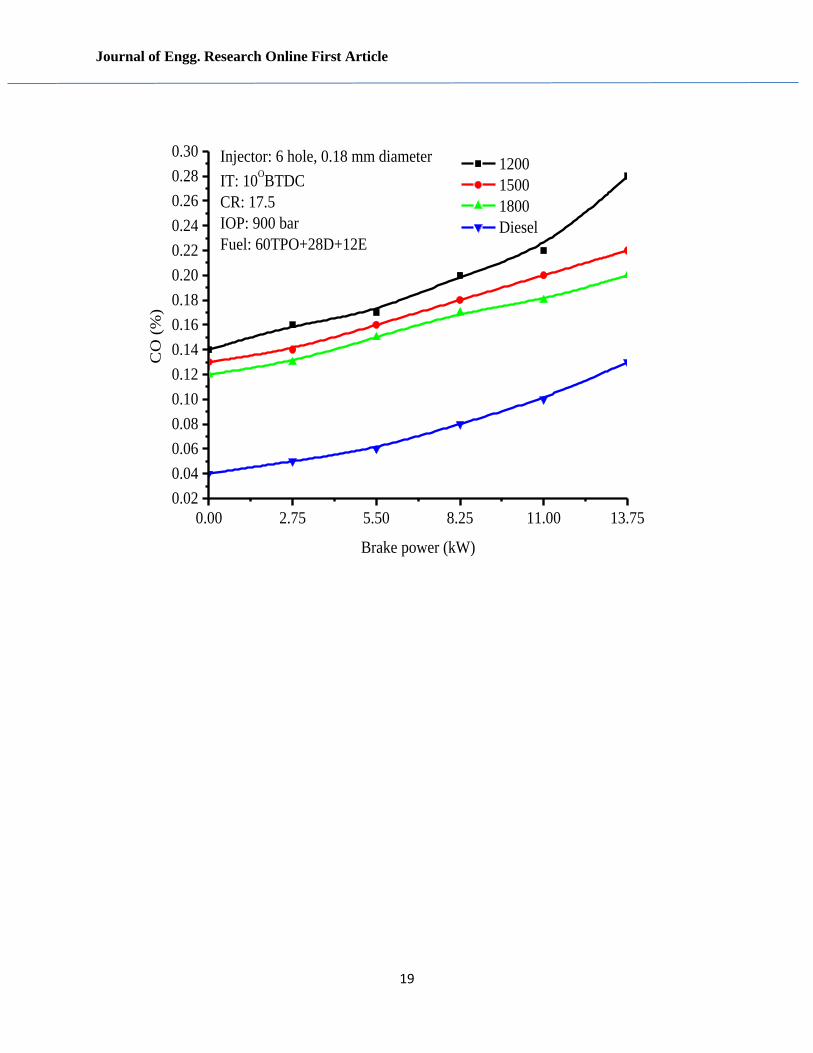
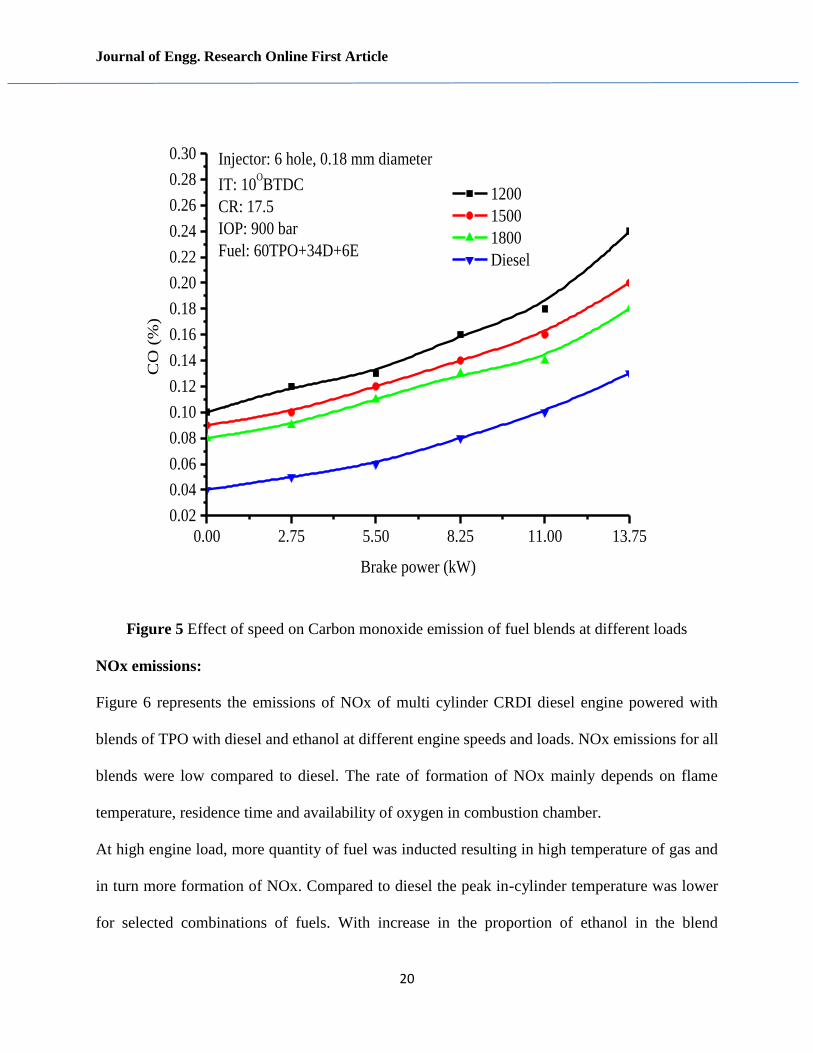
CO Emissions:
Figure 5 depicts the influence of engine speed and selected fuel blends on CO emissions at various
engine loads. CO emissions of the blends were higher as compared to diesel. With increase in load
CO emissions increased. This may be due to high concentration of blends which leads to
inadequate combustion associated with smaller combustion periods when engine speed is high.
Due to lower cetane number of the combinations of fuels, ignition delay (ID) increased which is
shown in Figure 8, resulted in the accumulation volume of fuel before the commencement of
combustion. The CO emissions were increased with increase in ethanol proportion in the blends.
The higher viscosity of blends causes the spray characteristics degraded which results in improper
mixture formation. Lower combustion temperature could also be the reason. Hence, poor
Journal of Engg. Research Online First Article
18
combustion of selected combinations causes formation of more CO emissions. Similar results
could be seen in literature (Sudarshan, 2018b; Gadwal, 2019; Sayin, 2010 & Jaichandar et al.,
2013). This may be due to incomplete combustion of the blended fuels which are having low cetane
number with longer ID; moreover the quantity of fuel burnt was more in expansion stroke due to
more combustion duration at lower speed as shown in Figure 9. Further injected volume of blends
was more due to low heating value which leads to improper mixture formation.
0.00 2.75 5.50 8.25 11.00 13.75
0.02
0.04
0.06
0.08
0.10
0.12
0.14
0.16
0.18
0.20
0.22
0.24
0.26
0.28
0.30 Injector: 6 hole, 0.18 mm diameter
IT: 10OBTDC
CR: 17.5
IOP: 900 bar
Fuel: 60TPO+38D+2E
1200
1500
1800
Diesel
CO
(%
)
Brake power (kW)
Journal of Engg. Research Online First Article
19
0.00 2.75 5.50 8.25 11.00 13.75
0.02
0.04
0.06
0.08
0.10
0.12
0.14
0.16
0.18
0.20
0.22
0.24
0.26
0.28
0.30 Injector: 6 hole, 0.18 mm diameter
IT: 10OBTDC
CR: 17.5
IOP: 900 bar
Fuel: 60TPO+28D+12E
1200
1500
1800
Diesel
CO
(%
)
Brake power (kW)
Journal of Engg. Research Online First Article
20
0.00 2.75 5.50 8.25 11.00 13.75
0.02
0.04
0.06
0.08
0.10
0.12
0.14
0.16
0.18
0.20
0.22
0.24
0.26
0.28
0.30 Injector: 6 hole, 0.18 mm diameter
IT: 10OBTDC
CR: 17.5
IOP: 900 bar
Fuel: 60TPO+34D+6E
1200
1500
1800
Diesel
CO
(%
)
Brake power (kW)
Figure 5 Effect of speed on Carbon monoxide emission of fuel blends at different loads
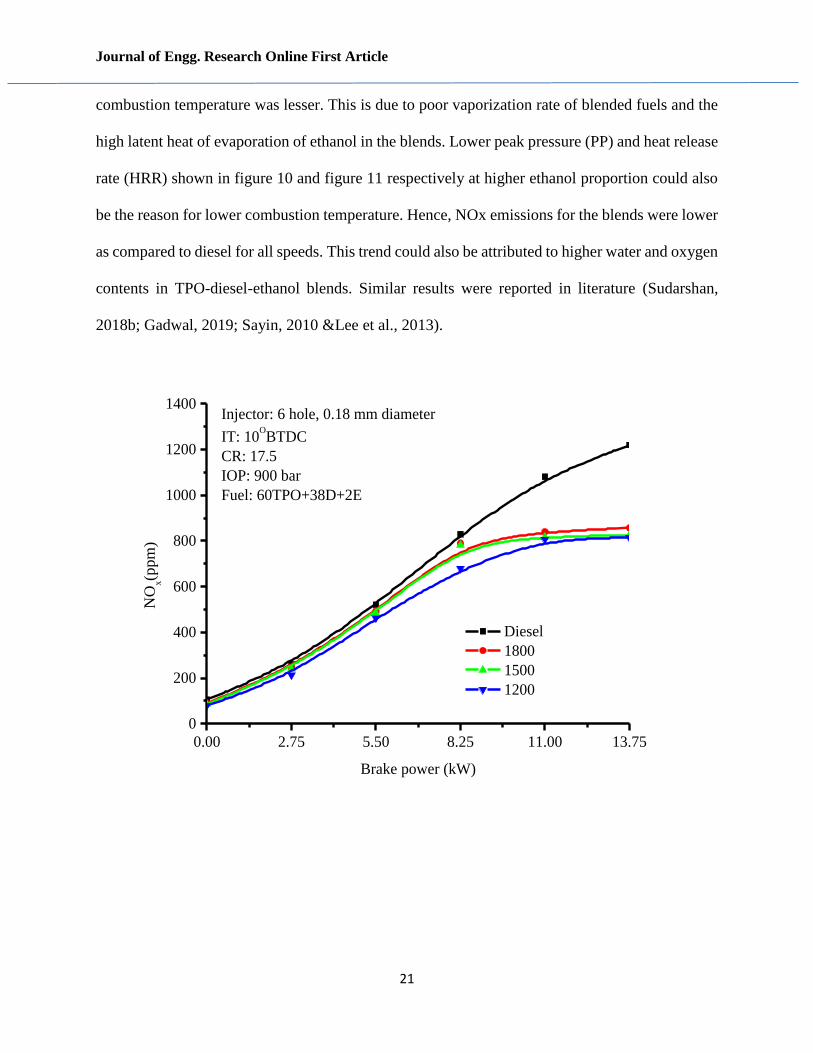
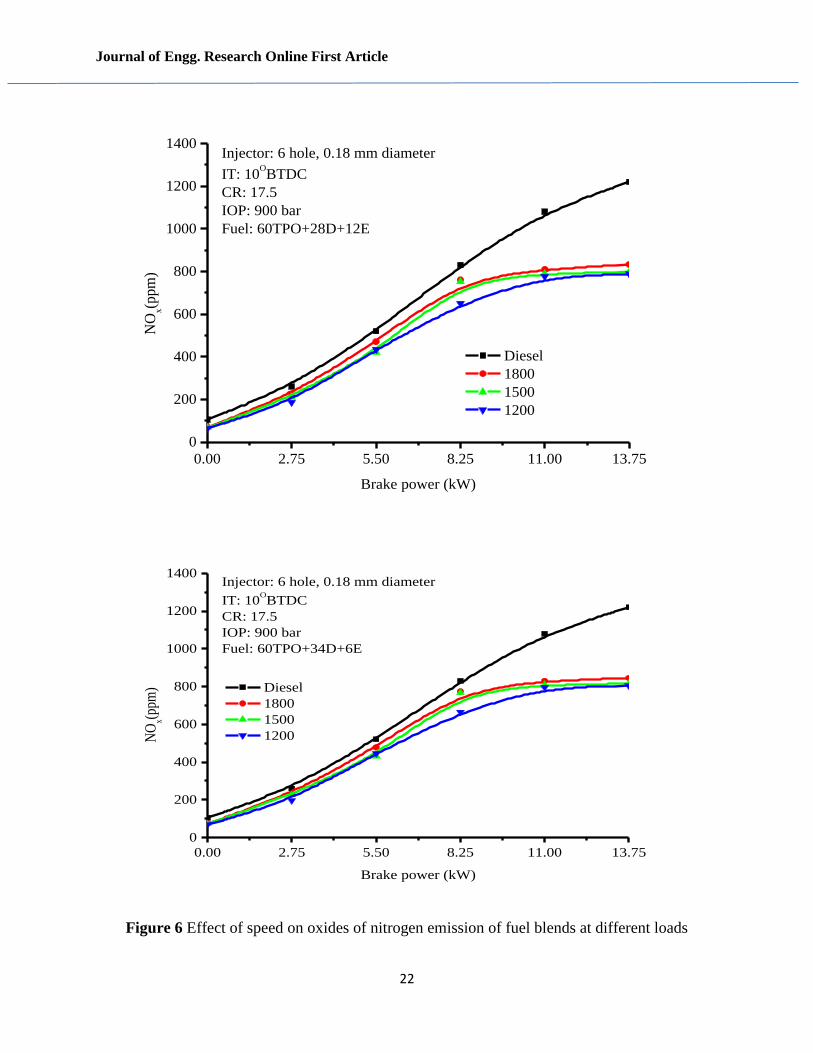
NOx emissions:
Figure 6 represents the emissions of NOx of multi cylinder CRDI diesel engine powered with
blends of TPO with diesel and ethanol at different engine speeds and loads. NOx emissions for all
blends were low compared to diesel. The rate of formation of NOx mainly depends on flame
temperature, residence time and availability of oxygen in combustion chamber.
At high engine load, more quantity of fuel was inducted resulting in high temperature of gas and
in turn more formation of NOx. Compared to diesel the peak in-cylinder temperature was lower
for selected combinations of fuels. With increase in the proportion of ethanol in the blend
Journal of Engg. Research Online First Article
21
combustion temperature was lesser. This is due to poor vaporization rate of blended fuels and the
high latent heat of evaporation of ethanol in the blends. Lower peak pressure (PP) and heat release
rate (HRR) shown in figure 10 and figure 11 respectively at higher ethanol proportion could also
be the reason for lower combustion temperature. Hence, NOx emissions for the blends were lower
as compared to diesel for all speeds. This trend could also be attributed to higher water and oxygen
contents in TPO-diesel-ethanol blends. Similar results were reported in literature (Sudarshan,
2018b; Gadwal, 2019; Sayin, 2010 &Lee et al., 2013).
0.00 2.75 5.50 8.25 11.00 13.75
0
200
400
600
800
1000
1200
1400Injector: 6 hole, 0.18 mm diameter
IT: 10OBTDC
CR: 17.5
IOP: 900 bar
Fuel: 60TPO+38D+2E
Diesel
1800
1500
1200
NO
x(p
pm
)
Brake power (kW)
Journal of Engg. Research Online First Article
22
0.00 2.75 5.50 8.25 11.00 13.75
0
200
400
600
800
1000
1200
1400Injector: 6 hole, 0.18 mm diameter
IT: 10OBTDC
CR: 17.5
IOP: 900 bar
Fuel: 60TPO+28D+12E
Diesel
1800
1500
1200
NO
x(p
pm
)
Brake power (kW)
0.00 2.75 5.50 8.25 11.00 13.75
0
200
400
600
800
1000
1200
1400Injector: 6 hole, 0.18 mm diameter
IT: 10OBTDC
CR: 17.5
IOP: 900 bar
Fuel: 60TPO+34D+6E
Diesel
1800
1500
1200NO
x(ppm
)
Brake power (kW)
Figure 6 Effect of speed on oxides of nitrogen emission of fuel blends at different loads
Journal of Engg. Research Online First Article
23
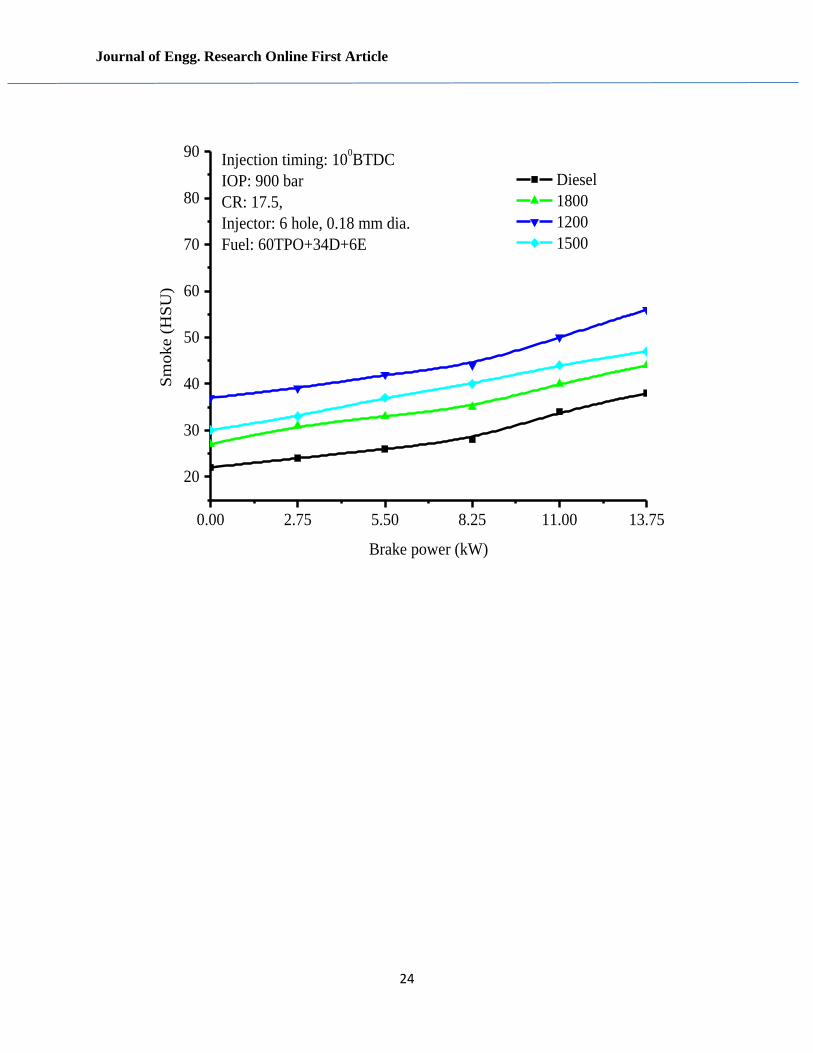
Smoke emissions:
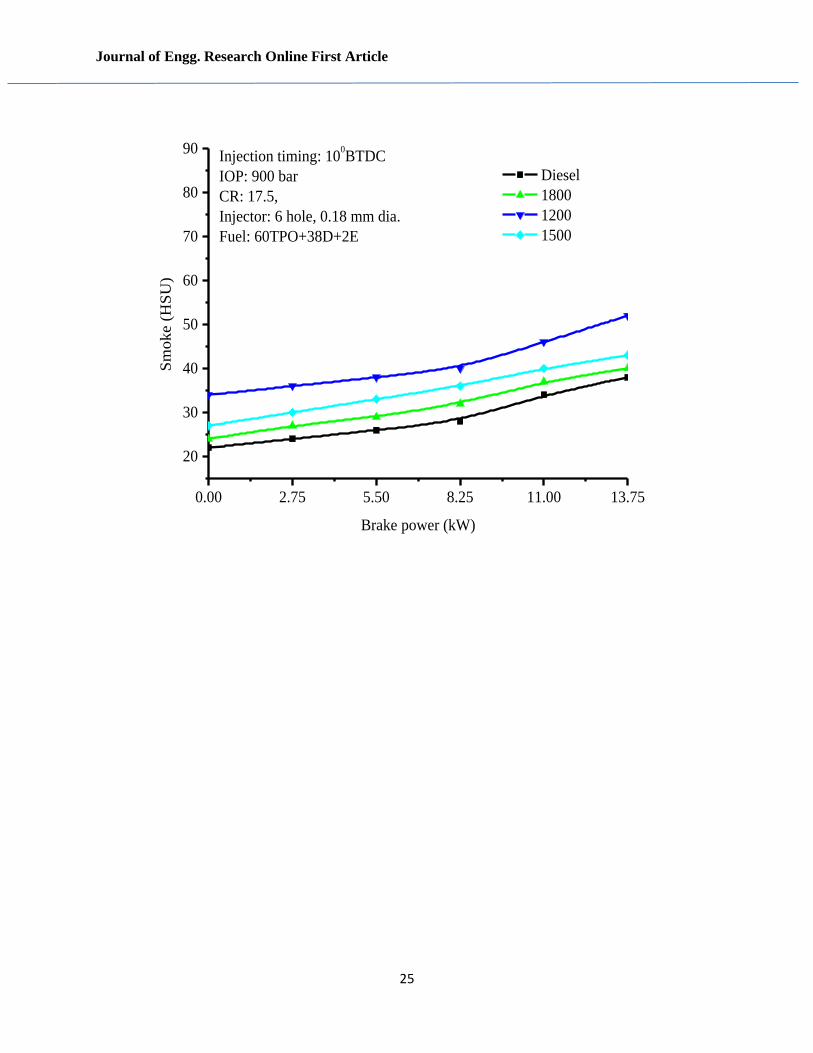
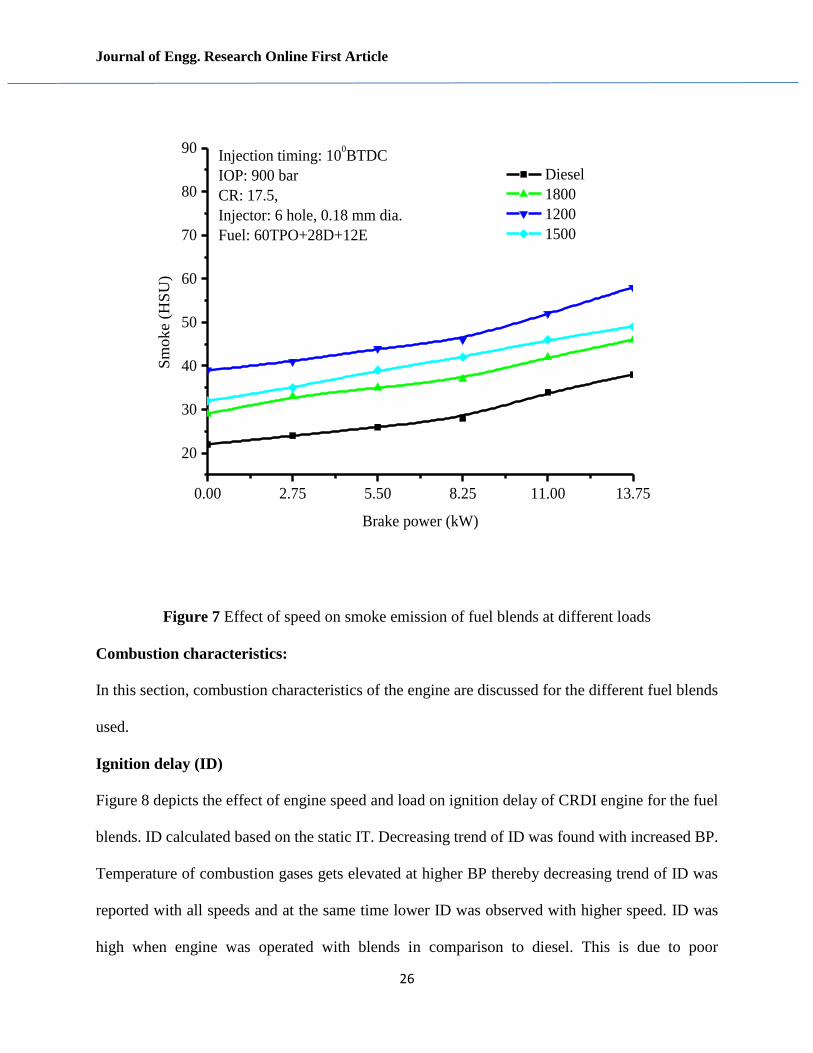
Figure 7 shows the influence of engine speed and load on smoke emissions of CRDI engine for
the fuel blends. Increased smoke opacity was observed with increased loading operation for all the
fuel blends for the three speeds of engine operation. Smoke formation is spontaneous at higher
loads (Soudagar et al., 2019). Increased quantity of fuel injected during higher engine loads,
decreased air-fuel ratio that leads to higher smoke emissions. Smoke emissions were high when
engine was operated with blends as compared to diesel. This is due to poor vaporization rate of
blended fuels and the high latent heat of evaporation of ethanol in the blends. Smoke emissions
decreased with increased speed which may be attributed to earlier injection that leads to higher in-
cylinder temperatures, facilitating more time for oxidation of the soot particles before opening of
exhaust valve. Inbuilt fuel oxygen and improved mixing at higher speeds reduces the smoke
formation. Similar results could be seen in literature (Sudarshan, 2018b; Gadwal, 2019;
Banapurmath et al., 2008; Hulwan et al., 2011).
Journal of Engg. Research Online First Article
24
0.00 2.75 5.50 8.25 11.00 13.75
20
30
40
50
60
70
80
90
Diesel
1800
1200
1500
Injection timing: 100BTDC
IOP: 900 bar
CR: 17.5,
Injector: 6 hole, 0.18 mm dia.
Fuel: 60TPO+34D+6E
Sm
oke (
HS
U)
Brake power (kW)
Journal of Engg. Research Online First Article
25
0.00 2.75 5.50 8.25 11.00 13.75
20
30
40
50
60
70
80
90
Diesel
1800
1200
1500
Injection timing: 100BTDC
IOP: 900 bar
CR: 17.5,
Injector: 6 hole, 0.18 mm dia.
Fuel: 60TPO+38D+2E
Sm
oke (
HS
U)
Brake power (kW)
Journal of Engg. Research Online First Article
26
0.00 2.75 5.50 8.25 11.00 13.75
20
30
40
50
60
70
80
90
Diesel
1800
1200
1500
Injection timing: 100BTDC
IOP: 900 bar
CR: 17.5,
Injector: 6 hole, 0.18 mm dia.
Fuel: 60TPO+28D+12E
Sm
oke (
HS
U)
Brake power (kW)
Figure 7 Effect of speed on smoke emission of fuel blends at different loads
Combustion characteristics:
In this section, combustion characteristics of the engine are discussed for the different fuel blends
used.
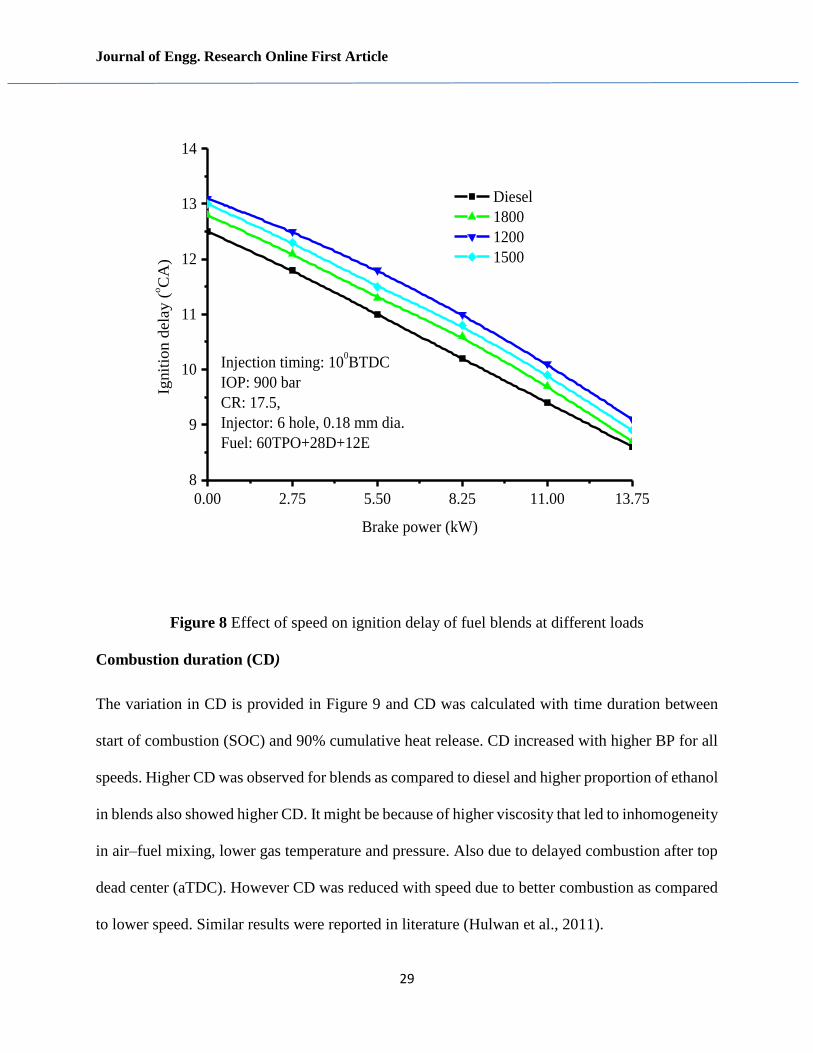
Ignition delay (ID)
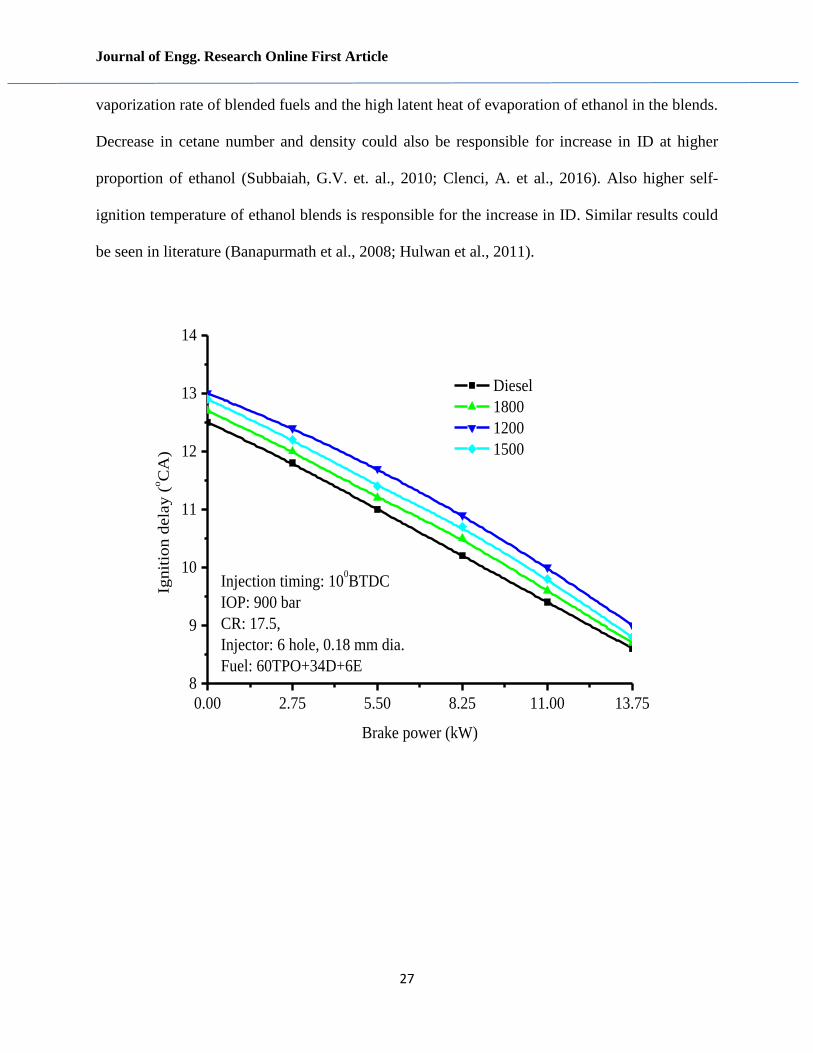
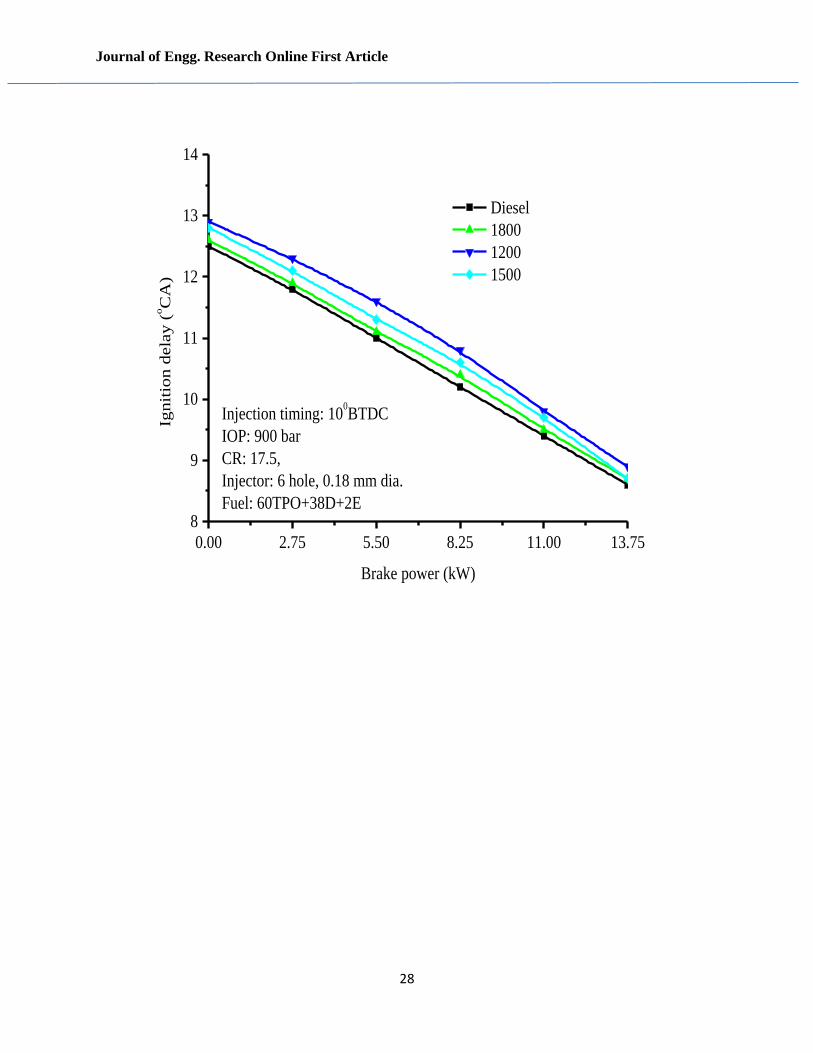
Figure 8 depicts the effect of engine speed and load on ignition delay of CRDI engine for the fuel
blends. ID calculated based on the static IT. Decreasing trend of ID was found with increased BP.
Temperature of combustion gases gets elevated at higher BP thereby decreasing trend of ID was
reported with all speeds and at the same time lower ID was observed with higher speed. ID was
high when engine was operated with blends in comparison to diesel. This is due to poor
Journal of Engg. Research Online First Article
27
vaporization rate of blended fuels and the high latent heat of evaporation of ethanol in the blends.
Decrease in cetane number and density could also be responsible for increase in ID at higher
proportion of ethanol (Subbaiah, G.V. et. al., 2010; Clenci, A. et al., 2016). Also higher self-
ignition temperature of ethanol blends is responsible for the increase in ID. Similar results could
be seen in literature (Banapurmath et al., 2008; Hulwan et al., 2011).
0.00 2.75 5.50 8.25 11.00 13.75
8
9
10
11
12
13
14
Diesel
1800
1200
1500
Injection timing: 100BTDC
IOP: 900 bar
CR: 17.5,
Injector: 6 hole, 0.18 mm dia.
Fuel: 60TPO+34D+6E
Ignit
ion d
ela
y (
oC
A)
Brake power (kW)
Journal of Engg. Research Online First Article
28
0.00 2.75 5.50 8.25 11.00 13.75
8
9
10
11
12
13
14
Diesel
1800
1200
1500
Injection timing: 100BTDC
IOP: 900 bar
CR: 17.5,
Injector: 6 hole, 0.18 mm dia.
Fuel: 60TPO+38D+2E
Ignit
ion d
ela
y (
oC
A)
Brake power (kW)
Journal of Engg. Research Online First Article
29
0.00 2.75 5.50 8.25 11.00 13.75
8
9
10
11
12
13
14
Diesel
1800
1200
1500
Injection timing: 100BTDC
IOP: 900 bar
CR: 17.5,
Injector: 6 hole, 0.18 mm dia.
Fuel: 60TPO+28D+12E
Ignit
ion d
ela
y (
oC
A)
Brake power (kW)
Figure 8 Effect of speed on ignition delay of fuel blends at different loads
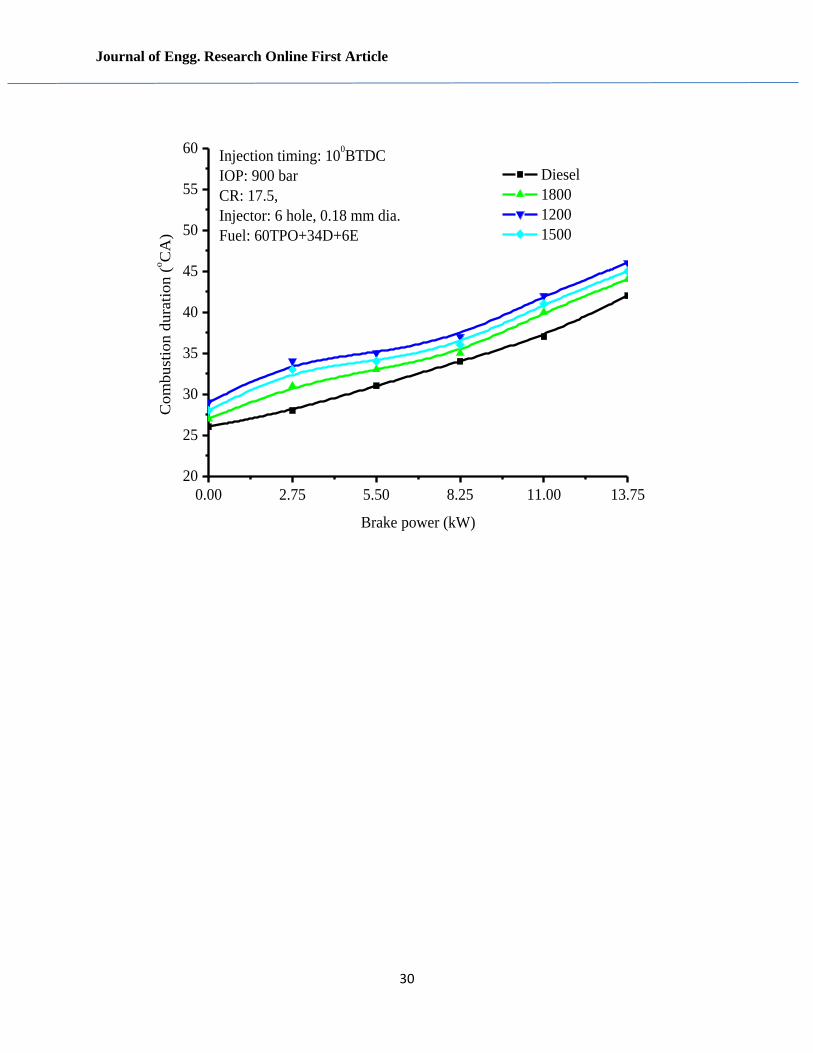
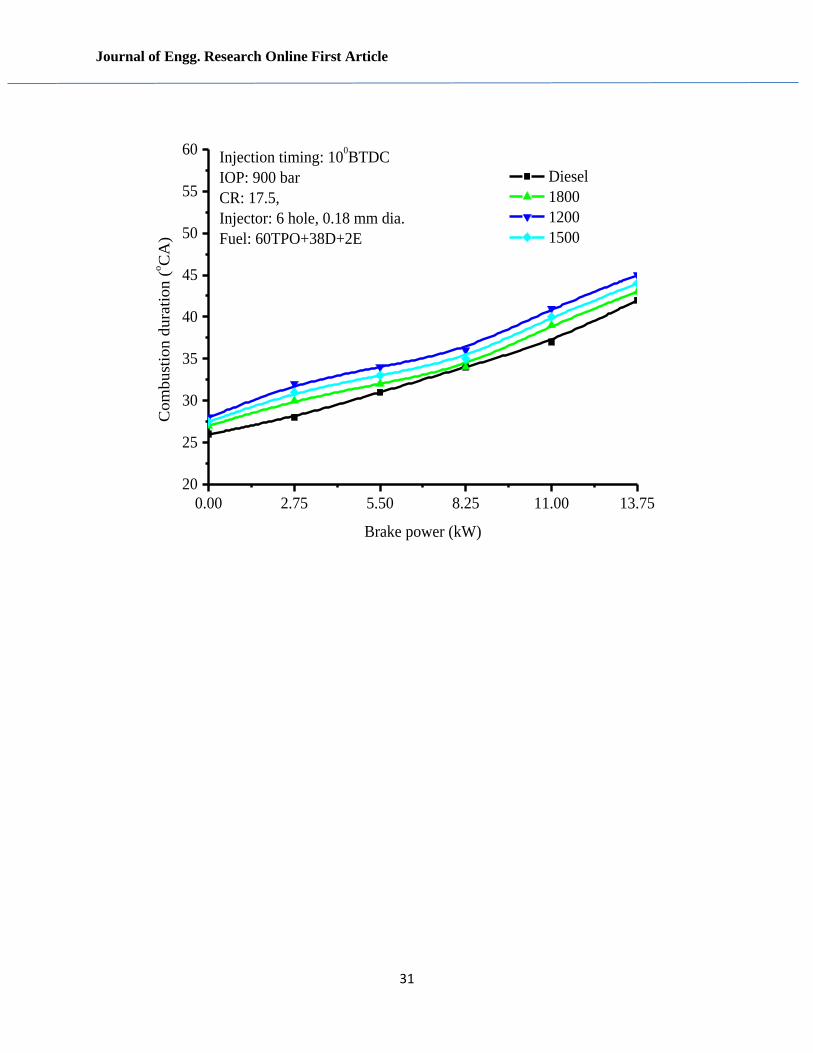
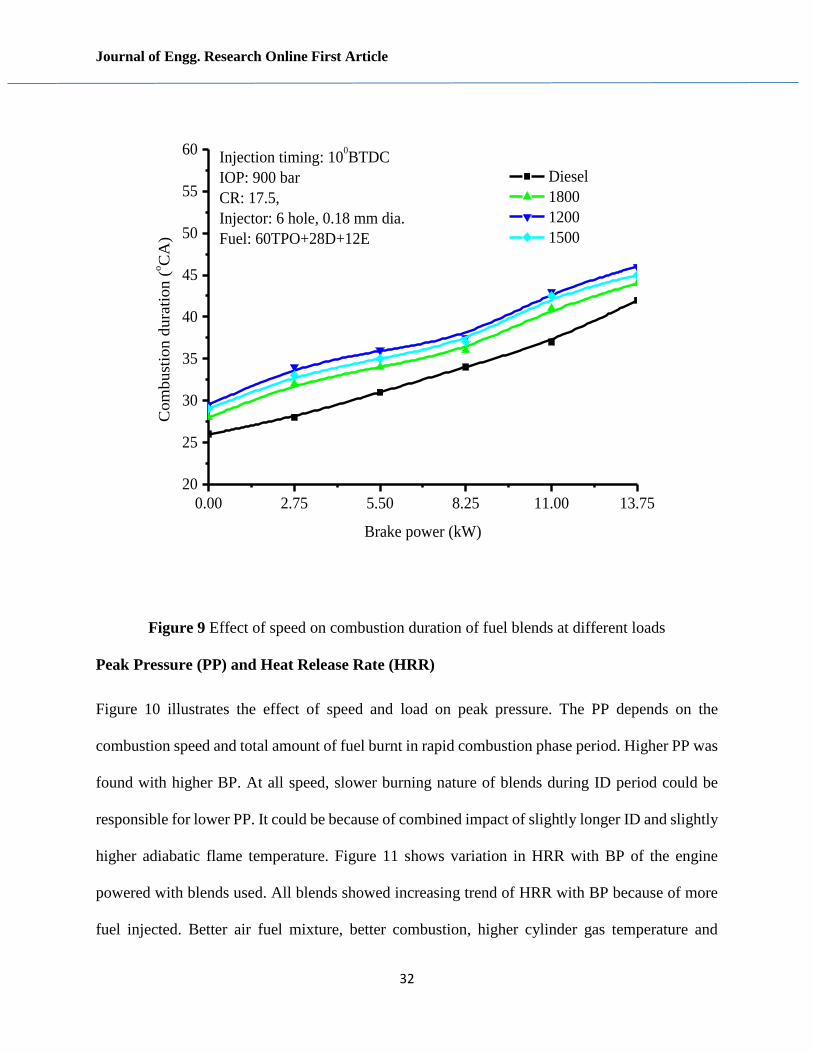
Combustion duration (CD)
The variation in CD is provided in Figure 9 and CD was calculated with time duration between
start of combustion (SOC) and 90% cumulative heat release. CD increased with higher BP for all
speeds. Higher CD was observed for blends as compared to diesel and higher proportion of ethanol
in blends also showed higher CD. It might be because of higher viscosity that led to inhomogeneity
in air–fuel mixing, lower gas temperature and pressure. Also due to delayed combustion after top
dead center (aTDC). However CD was reduced with speed due to better combustion as compared
to lower speed. Similar results were reported in literature (Hulwan et al., 2011).
Journal of Engg. Research Online First Article
30
0.00 2.75 5.50 8.25 11.00 13.75
20
25
30
35
40
45
50
55
60
Diesel
1800
1200
1500
Injection timing: 100BTDC
IOP: 900 bar
CR: 17.5,
Injector: 6 hole, 0.18 mm dia.
Fuel: 60TPO+34D+6E
Com
bust
ion d
ura
tion (
oC
A)
Brake power (kW)
Journal of Engg. Research Online First Article
31
0.00 2.75 5.50 8.25 11.00 13.75
20
25
30
35
40
45
50
55
60
Diesel
1800
1200
1500
Injection timing: 100BTDC
IOP: 900 bar
CR: 17.5,
Injector: 6 hole, 0.18 mm dia.
Fuel: 60TPO+38D+2E
Com
bust
ion d
ura
tion (
oC
A)
Brake power (kW)
Journal of Engg. Research Online First Article
32
0.00 2.75 5.50 8.25 11.00 13.75
20
25
30
35
40
45
50
55
60
Diesel
1800
1200
1500
Injection timing: 100BTDC
IOP: 900 bar
CR: 17.5,
Injector: 6 hole, 0.18 mm dia.
Fuel: 60TPO+28D+12E
Com
bust
ion d
ura
tion (
oC
A)
Brake power (kW)
Figure 9 Effect of speed on combustion duration of fuel blends at different loads
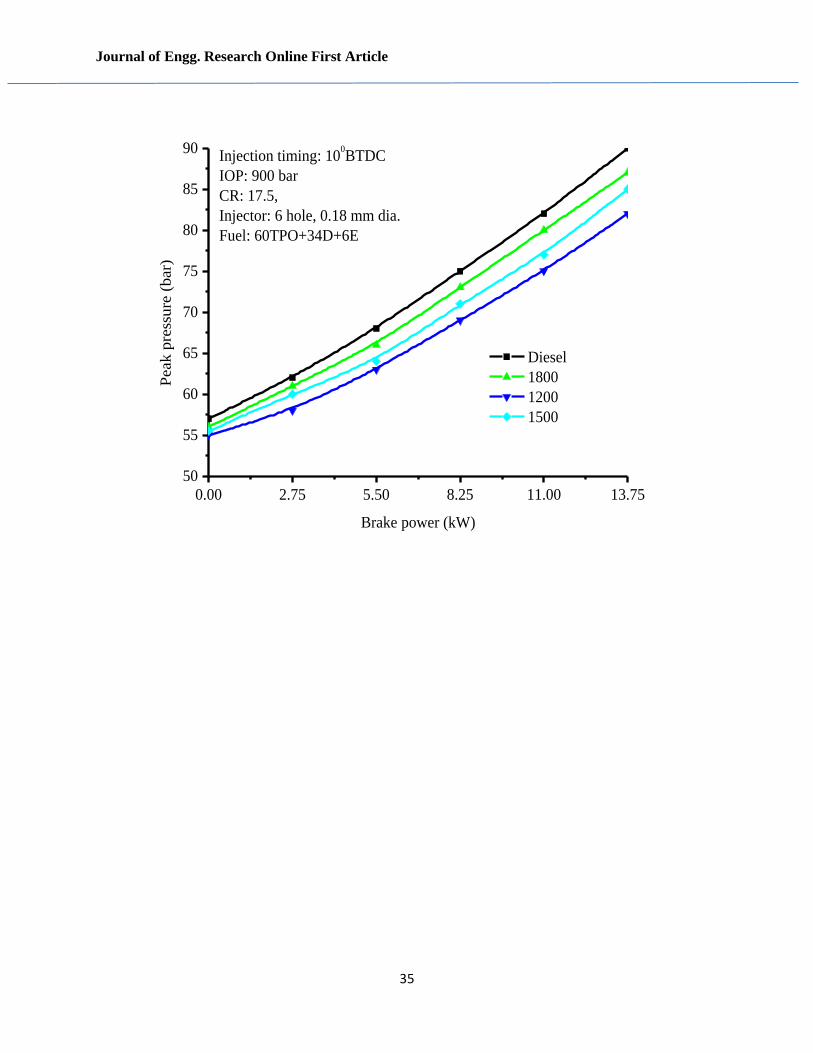
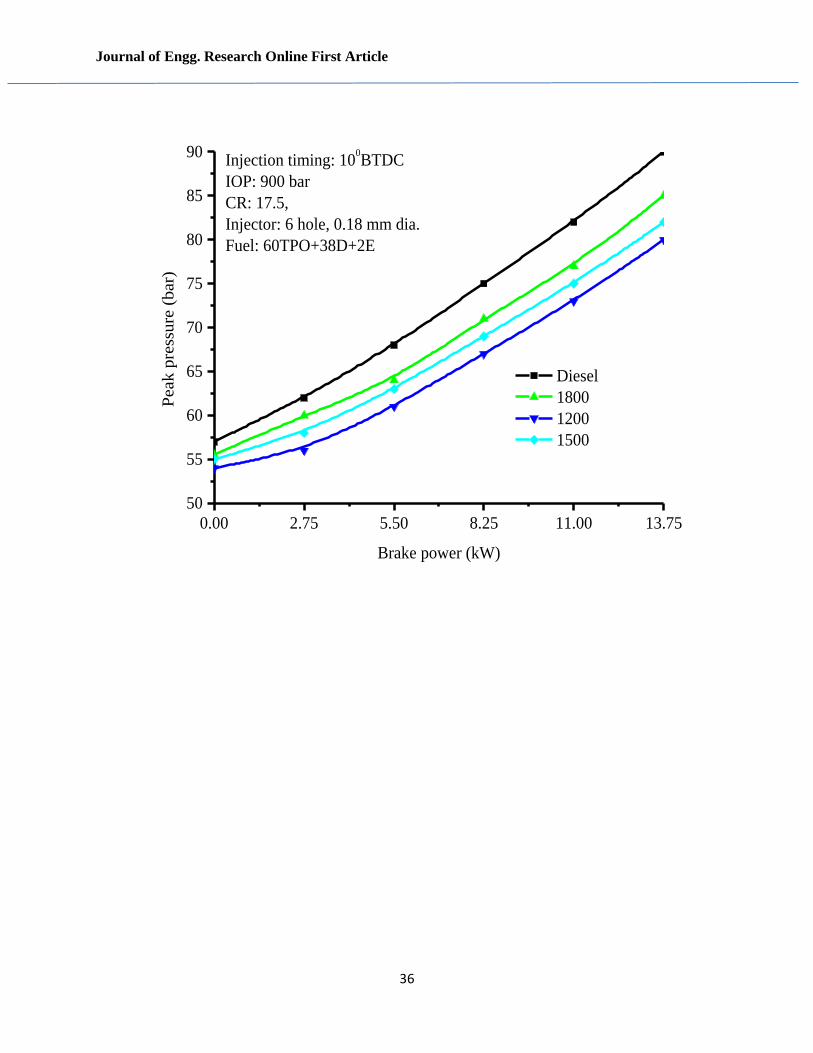
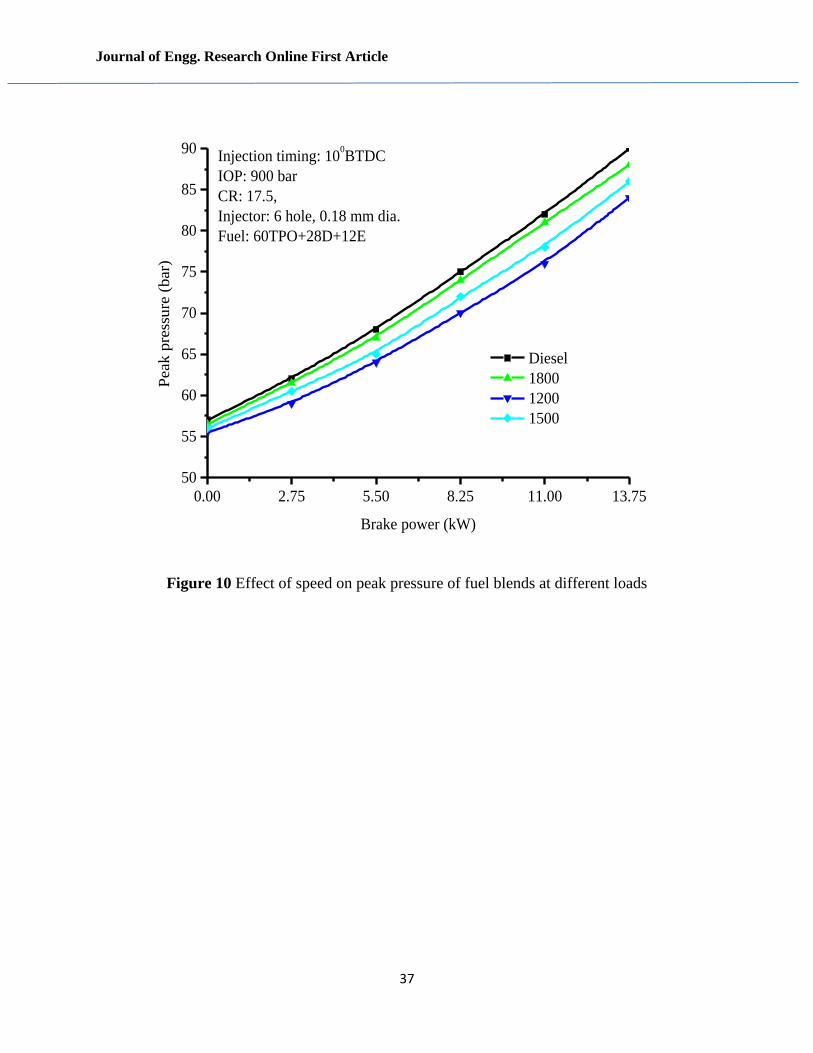
Peak Pressure (PP) and Heat Release Rate (HRR)
Figure 10 illustrates the effect of speed and load on peak pressure. The PP depends on the
combustion speed and total amount of fuel burnt in rapid combustion phase period. Higher PP was
found with higher BP. At all speed, slower burning nature of blends during ID period could be
responsible for lower PP. It could be because of combined impact of slightly longer ID and slightly
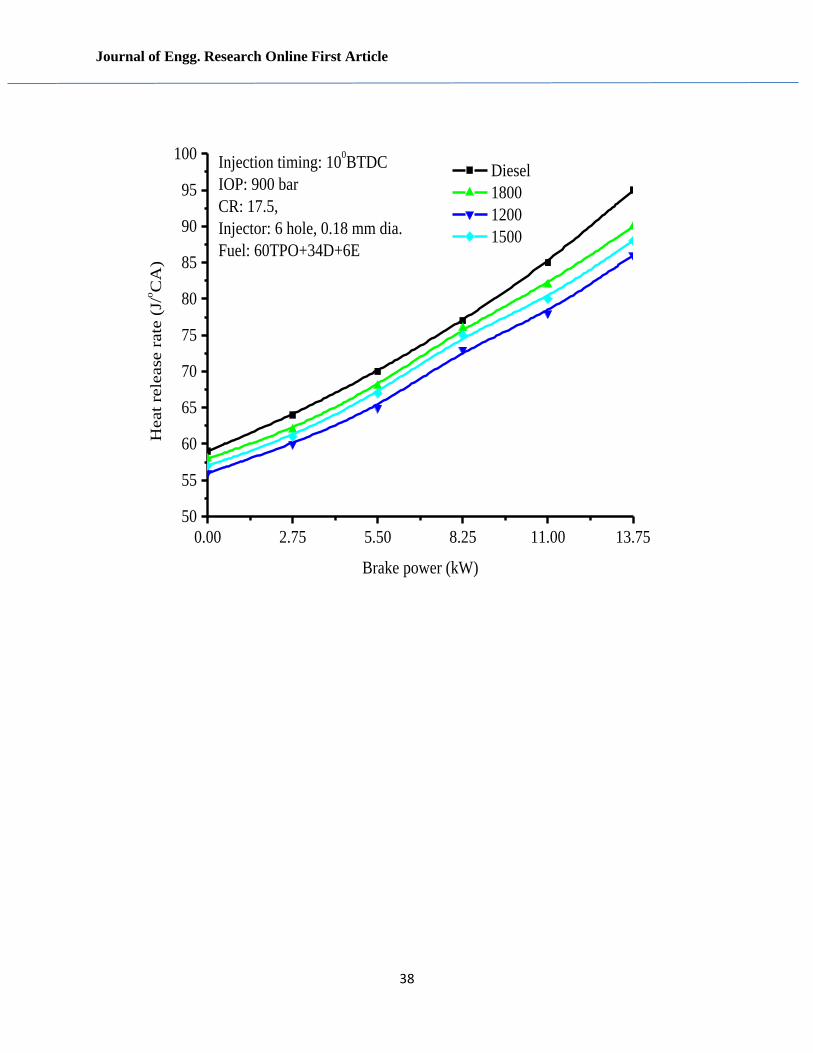
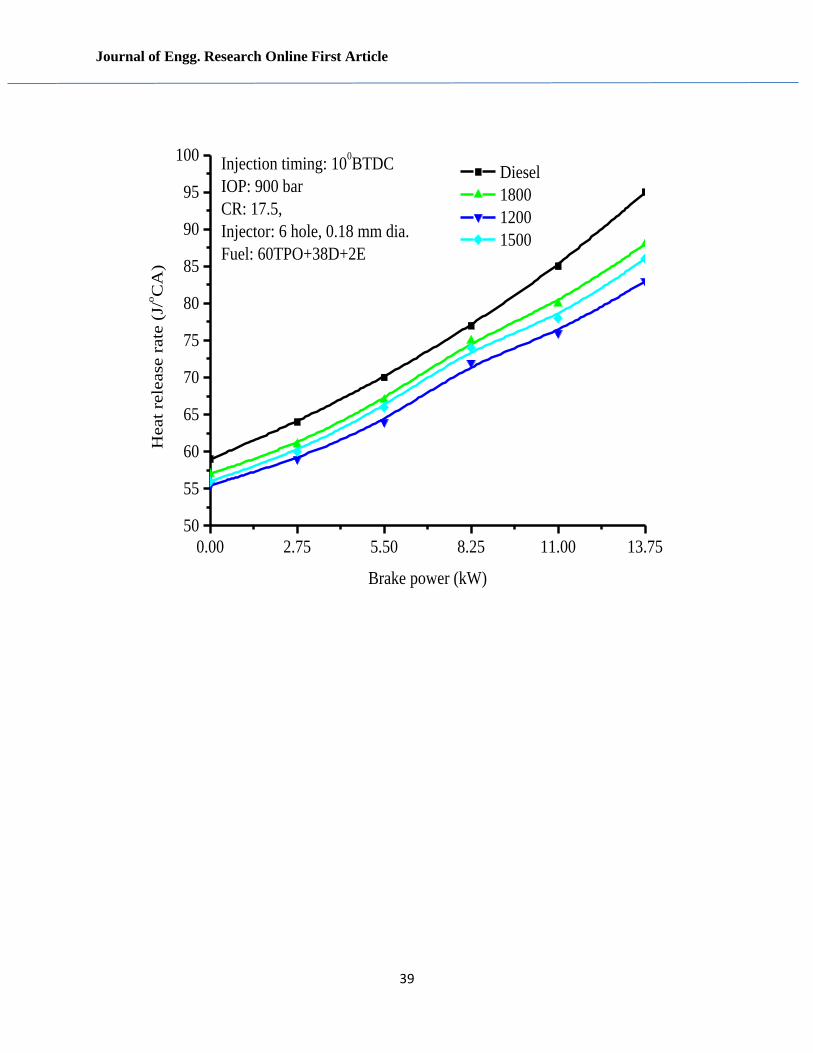
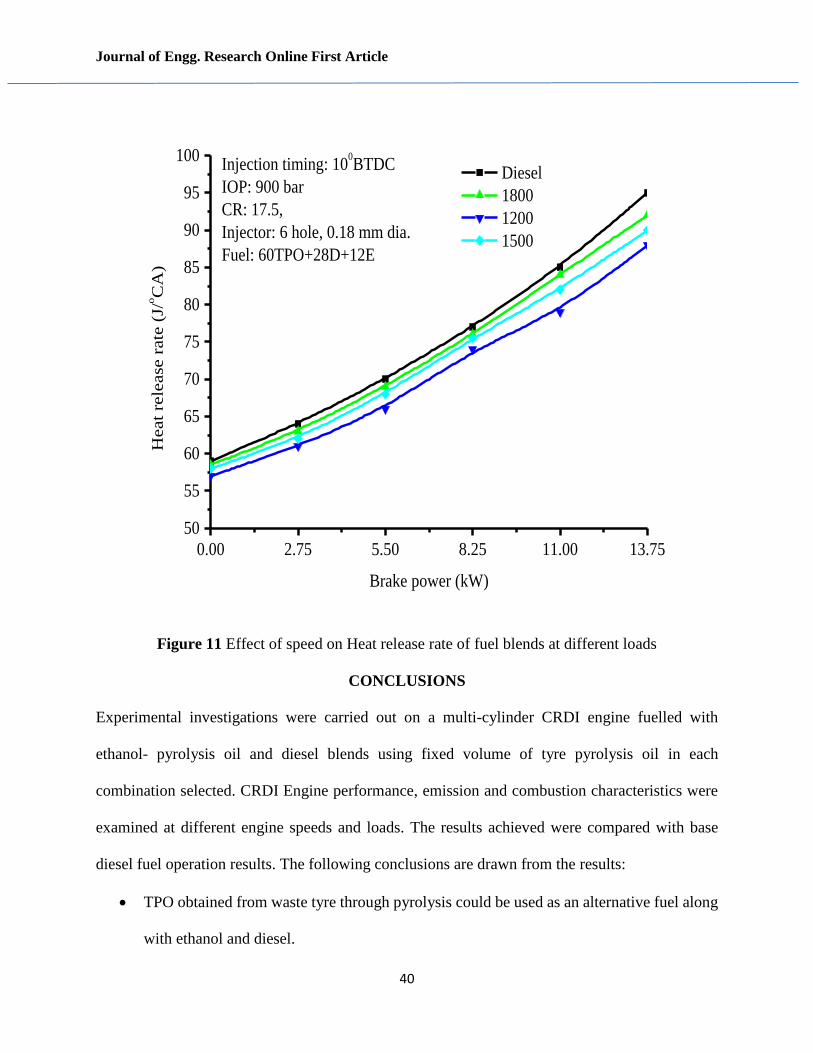
higher adiabatic flame temperature. Figure 11 shows variation in HRR with BP of the engine
powered with blends used. All blends showed increasing trend of HRR with BP because of more
fuel injected. Better air fuel mixture, better combustion, higher cylinder gas temperature and
Journal of Engg. Research Online First Article
33
pressure prevailed might be the reason for the higher HRR at higher speed. Blends showed lower
HRR as compared to diesel due to poor combustion qualities. For higher ethanol proportion in
blends, rapid premixed combustion and improved diffusive combustion were observed at high
loads. Similar results were reported in literature (Hulwan et al., 2011, Tutak W et.al., 2016).
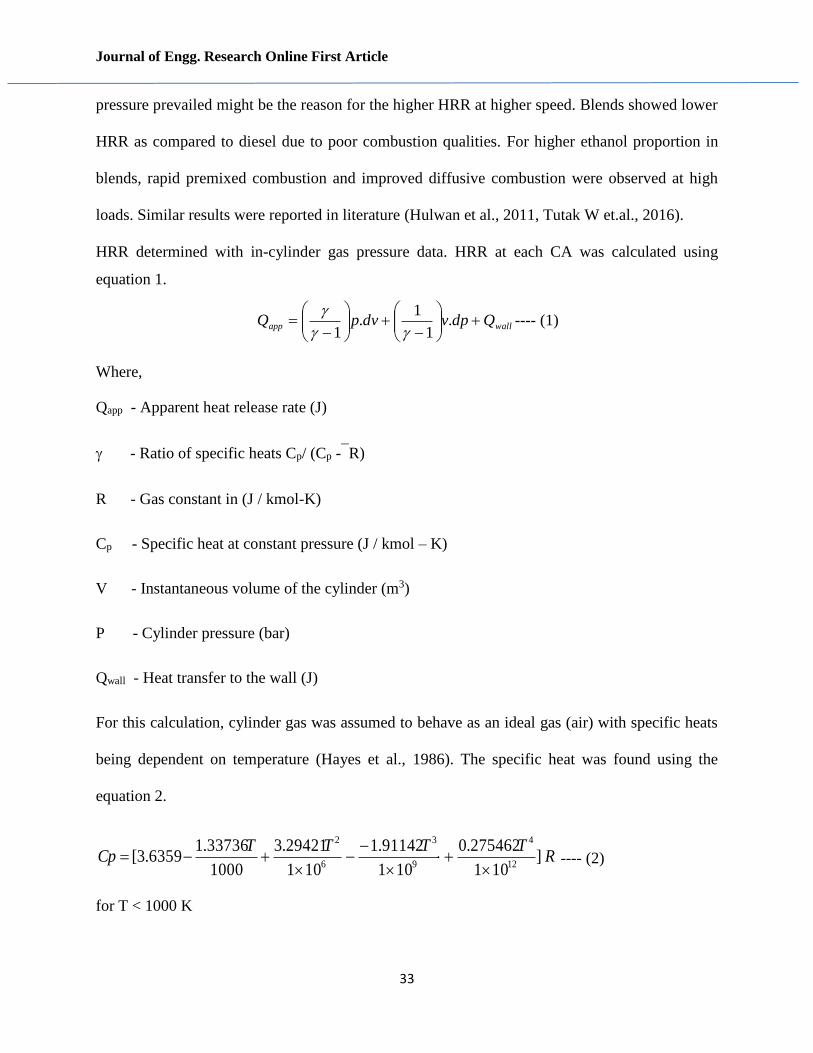
HRR determined with in-cylinder gas pressure data. HRR at each CA was calculated using
equation 1.
---- (1)
Where,
Qapp - Apparent heat release rate (J)
- Ratio of specific heats Cp/ (Cp -R)
R - Gas constant in (J / kmol-K)
Cp - Specific heat at constant pressure (J / kmol – K)
V - Instantaneous volume of the cylinder (m3)
P - Cylinder pressure (bar)
Qwall - Heat transfer to the wall (J)
For this calculation, cylinder gas was assumed to behave as an ideal gas (air) with specific heats
being dependent on temperature (Hayes et al., 1986). The specific heat was found using the
equation 2.
---- (2)
for T < 1000 K
wallapp QdpvdvpQ
.
1
1.
1
RTTTT
Cp ]101
275462.0
101
91142.1
101
29421.3
1000
33736.16359.3[
12
4
9
3
6
2
Journal of Engg. Research Online First Article
34
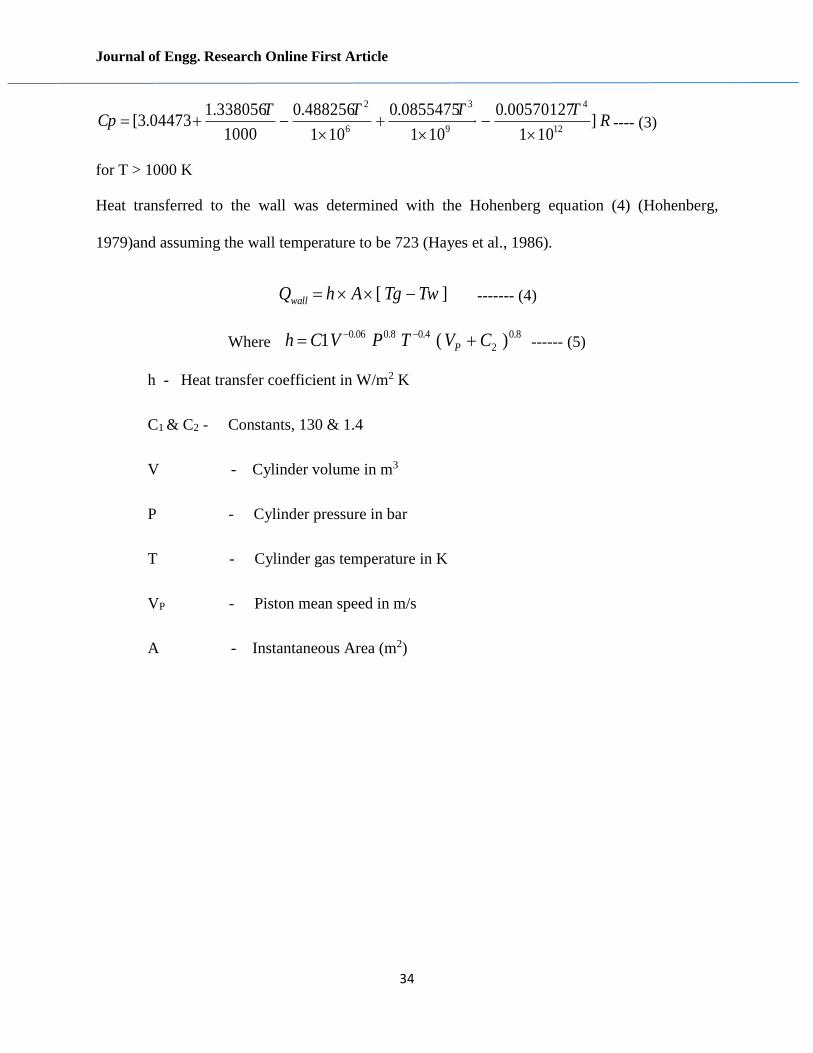
---- (3)
for T > 1000 K
Heat transferred to the wall was determined with the Hohenberg equation (4) (Hohenberg,
1979)and assuming the wall temperature to be 723 (Hayes et al., 1986).
------- (4)
Where ------ (5)
h - Heat transfer coefficient in W/m2 K
C1 & C2 - Constants, 130 & 1.4
V - Cylinder volume in m3
P - Cylinder pressure in bar
T - Cylinder gas temperature in K
VP - Piston mean speed in m/s
A - Instantaneous Area (m2)
RTTTT
Cp ]101
00570127.0
101
0855475.0
101
488256.0
1000
338056.104473.3[
12
4
9
3
6
2
][ TwTgAhQwall
8.0
2
4.08.006.0 )(1 CVTPVCh P
Journal of Engg. Research Online First Article
35
0.00 2.75 5.50 8.25 11.00 13.75
50
55
60
65
70
75
80
85
90
Diesel
1800
1200
1500
Injection timing: 100BTDC
IOP: 900 bar
CR: 17.5,
Injector: 6 hole, 0.18 mm dia.
Fuel: 60TPO+34D+6E
Peak p
ress
ure
(bar)
Brake power (kW)
Journal of Engg. Research Online First Article
36
0.00 2.75 5.50 8.25 11.00 13.75
50
55
60
65
70
75
80
85
90
Diesel
1800
1200
1500
Injection timing: 100BTDC
IOP: 900 bar
CR: 17.5,
Injector: 6 hole, 0.18 mm dia.
Fuel: 60TPO+38D+2E
Peak p
ress
ure
(bar)
Brake power (kW)
Journal of Engg. Research Online First Article
37
0.00 2.75 5.50 8.25 11.00 13.75
50
55
60
65
70
75
80
85
90
Diesel
1800
1200
1500
Injection timing: 100BTDC
IOP: 900 bar
CR: 17.5,
Injector: 6 hole, 0.18 mm dia.
Fuel: 60TPO+28D+12E
Peak p
ress
ure
(bar)
Brake power (kW)
Figure 10 Effect of speed on peak pressure of fuel blends at different loads
Journal of Engg. Research Online First Article
38
0.00 2.75 5.50 8.25 11.00 13.75
50
55
60
65
70
75
80
85
90
95
100 Diesel
1800
1200
1500
Injection timing: 100BTDC
IOP: 900 bar
CR: 17.5,
Injector: 6 hole, 0.18 mm dia.
Fuel: 60TPO+34D+6E
Heat
rele
ase
rate
(J/
oC
A)
Brake power (kW)
Journal of Engg. Research Online First Article
39
0.00 2.75 5.50 8.25 11.00 13.75
50
55
60
65
70
75
80
85
90
95
100 Diesel
1800
1200
1500
Injection timing: 100BTDC
IOP: 900 bar
CR: 17.5,
Injector: 6 hole, 0.18 mm dia.
Fuel: 60TPO+38D+2E
Heat
rele
ase
rate
(J/
oC
A)
Brake power (kW)
Journal of Engg. Research Online First Article
40
0.00 2.75 5.50 8.25 11.00 13.75
50
55
60
65
70
75
80
85
90
95
100 Diesel
1800
1200
1500
Injection timing: 100BTDC
IOP: 900 bar
CR: 17.5,
Injector: 6 hole, 0.18 mm dia.
Fuel: 60TPO+28D+12E
Heat
rele
ase
rate
(J/
oC
A)
Brake power (kW)
Figure 11 Effect of speed on Heat release rate of fuel blends at different loads
CONCLUSIONS
Experimental investigations were carried out on a multi-cylinder CRDI engine fuelled with
ethanol- pyrolysis oil and diesel blends using fixed volume of tyre pyrolysis oil in each
combination selected. CRDI Engine performance, emission and combustion characteristics were
examined at different engine speeds and loads. The results achieved were compared with base
diesel fuel operation results. The following conclusions are drawn from the results:
TPO obtained from waste tyre through pyrolysis could be used as an alternative fuel along
with ethanol and diesel.
Journal of Engg. Research Online First Article
41
BTE increased with increase in load and speed but engine operation with blends selected
showed lower performance in comparison to diesel. Further, BTE decreased with increase
in ethanol proportion in blends.
Engine yielded more CO, HC and smoke emissions with all blends at different loads as
compared to diesel but lowered to some extent with speed. However NOx emissions with
blends were less as compared to diesel.
Combustion parameters like ID, PP and HRR decreased with increase in ethanol content
in the blend. However, CD increased with ethanol proportion in the blends.
Overall it could be concluded that 2% of ethanol with 38% diesel and 60% TPO blend gave better
results as compared to other combinations selected in the study with little penalty on BTE.
ACKNOWLEDGEMENT
The authors extend their appreciation to the Deanship of Scientific Research at King Khalid
University for funding this work through research groups program under grant number
(R.G.P 2/107/41).
Journal of Engg. Research Online First Article
42
REFERENCES
Asif, A., Mohammed K. & Abdul R.R.K. 2018. Production of biodiesel from various sources
and comparative engine performance studies by using different biodiesel blends. Journal
of Engineering Research 6 (4): 1-21.
Ahoor, A.H.& Navid, Z. A. 2014. Fuel production based on catalytic pyrolysis of waste tires as
an optimized model. Energy Conversion and Management 87: 653-669.
Alenezi, R. & Al-Anzi, B. 2013. Kinetic mechanism of transesterification of vegetable oil with
supercritical methanol for Biodiesel production. Journal of Engineering Research 1: 81-96.
Al-lwayzy, S.H.; Yusaf, T. 2015. Combustion of microalgae oil and ethanol blended with diesel
fuel. Energies, 8, 13985–13995.
An, H., Yang, W.M., Chou, S.K. & Chua, K.J. 2012. Combustion and emissions characteristics
of diesel engine fueled by biodiesel at partial load conditions. Applied energy 99: 363-371.
Antoniou, N.& Zabaniotou, A. 2013. Features of an efficient and environmentally attractive used
tyres pyrolysis with energy and material recovery. Renewable and Sustainable Energy
Reviews 20: 539-558.
Armas, O., Hernandez, J.J. & CardenasM.D. 2006. Reduction of diesel smoke opacity from
vegetable oil methyl esters during transient operation. Fuel 85: 2427-2438.
Arya, S., Sharma, A., Rawat, M.&Agrawal,A. 2020. Tyre pyrolysis oil as an alternative fuel: A
review. Materials Today: Proceedings.
Avulapati, M.M., Ganippa, L.C., Xia, J. &Megaritis A. 2016.Puffing and micro-explosion of
diesel–biodiesel–ethanol blends. Fuel 166: 59-66.
Aydın, H. &Cumali,I. 2012. Optimization of fuel production from waste vehicle tires by pyrolysis
and resembling to diesel fuel by various desulfurization methods. Fuel 102: 605-612.
Aydın, H. & Cumali, I. 2015. Analysis of combustion, performance and emission characteristics
of a diesel engine using low sulfur tire fuel. Fuel 143: 373-382.
Banapurmath, N.R. &, Tewari, P.G. 2010. Performance, combustion, and emissions
characteristics of a single-cylinder compression ignition engine operated on ethanol—
biodiesel blended fuels. Proceedings of the Institution of Mechanical Engineers, Part A:
Journal of Power and Energy 224: 533-543.
Journal of Engg. Research Online First Article
43
Banapurmath, N.R.,Tewari, P.G. & Hosmath, R.S. 2008. Performance and emission
characteristics of a DI compression ignition engine operated on Honge, Jatropha and
sesame oil methyl esters. Renewable energy 33: 1982-1988.
Beatrice, C., Napolitano, P., Guido, C. Injection parameter optimization by DoE of a light-duty
diesel engine fed by Bio-ethanol/RME/diesel blend. Appl. Energy 2014, 113, 373–384.
Bucolo, M., Buscarino, A., Famoso, C., Fortuna, L. & Frasca, M. 2019. Control of imperfect
dynamical systems. Nonlinear Dynamics 98, 2989–2999
Clenci, A.; Niculescu, R.; Danlos, A.; Iorga-Simăn, V.; Trică, A. Impact of biodiesel blends
and Di-Ethyl-Ether on the cold starting performance of a compression ignition engine.
Energies 2016, 9, 284.
Dawodu, F.A.,Olubunmi,A., Xin, J., Zhang, S. & Yan, D. 2014. Effective conversion of non-
edible oil with high free fatty acid into biodiesel by sulphonated carbon catalyst. Applied
energy 114: 819-826.
Elbaba, I.F. & Williams, P.T. 2012. Two stage pyrolysis-catalytic gasification of waste tyres:
Influence of process parameters. Applied Catalysis B: Environmental 125: 136-143.
Frigo, S., Seggiani, M., Puccini, M. & Vitolo, S. 2014. Liquid fuel production from waste tyre
pyrolysis and its utilisation in a Diesel engine. Fuel 116: 399-408.
Gadwal, S.B., Banapurmath, N.R, Kamoji, M.A., Rampure, P.B. & Khandal, S.V. 2019.
Performance and emission characteristic studies on CRDI diesel engine fuelled with plastic
pyrolysis oil blended with ethanol and diesel. International Journal of Sustainable
Engineering 12: 262-271.
García, M.; Gonzalo, A.; Sánchez, J.L.; Arauzo, J.; Peña, J.Á. Prediction of normalized
biodiesel properties by simulation of multiple feedstock blends. Bioresour. Technol. 2010,
101, 4431–4439.
Hariharan, S., Murugan, S. & Nagarajan, G, 2013. Effect of diethyl ether on Tyre pyrolysis oil
fueled diesel engine. Fuel 104: 109-115.
Hayes, T. K., Savage L.D. & Soreson S.C. 1986. Cylinder Pressure Data Acquisition and Heat
Release Analysis on a Personal Computer. Society of Automotive Engineers, Paper No.
860029, USA.1986.
Hohenberg, G.F. 1979. Advanced approaches for heat transfer calculations. SAE paper 1979.
790825.
Hossain, A.K. & Davies, P.A. 2013. Pyrolysis liquids and gases as alternative fuels in internal
combustion engines–A review. Renewable and Sustainable Energy Reviews 21: 165-189.
Journal of Engg. Research Online First Article
44
How, H.G., Masjuki, H.H., Kalam M.A., Teoh Y.H. Engine performance, emission and
combustion characteristics of a common-rail diesel engine fuelled with bioethanol as a fuel
additive in coconut oil biodiesel blends. Energy Procedia 2014, 61, 1655–1659.
Hulwan, D. B., & Joshi, S.V. 2011. Performance and Combustion Characteristics of a Multi-
Cylinder DI Diesel Engine Running Diesel- Ethanol-Biodiesel Blends of High Ethanol
Content. Applied Energy 88: 5042–5055.
Indudhar, M., Banapurmath, N.R., Rajulu, K. G., Khan, T.M.Y, Manoj, E.K. 2019. Effects
of single and split injection on the performance, emission and combustion attributes of a
CRDI engine powered with diesel and honge biodiesel. Sustainable Energy & Fuels 3:
2275-2286.
Jaichandar, S. & Annamalai, K. 2013. Combined impact of injection pressure and combustion
chamber geometry on the performance of a biodiesel fueled diesel engine. Energy 55: 330-
339.
Jang, J.W., Yoo, T.S., Oh, J.H. & Iwasaki,I. 1998. Discarded tire recycling practices in the
United States, Japan and Korea. Resources, conservation and recycling 22: 1-14.
John, H. 1988. Internal combustion engine fundamentals, McGraw-Hill Science.
Khan, T.M.Y., Atabani., A.E., Badruddin, I.A., Badarudin, A., Khayoon, M.S. &
Triwahyono, S. 2014. Recent scenario and technologies to utilize non-edible oils for
biodiesel production. Renewable and Sustainable Energy Reviews 37: 840-851.
Khandal, S.V., Sudershan, B., Raikar, V.A.,Khan, T.M.Y. & Badruddin, I.A. (2020). An
experimental-based artificial neural network performance study of common rail direct
injection engine run on plastic pyrolysis oil. International Journal of Sustainable
Engineering: 1-10.
Kwanchareon, P., Luengnaruemitchai, A. & S J.In. 2007. Solubility of a diesel–biodiesel–
ethanol blend, its fuel properties, and its emission characteristics from diesel engine. Fuel
86: 1053-1061.
Lee, S., Jang, Y., Kim, T.Y., Kang, K.Y., Kim, H. & Lim, J. 2013. Performance and emission
characteristics of a diesel engine fueled with pyrolysis oil-ethanol blend with diesel and
biodiesel pilot injection. SAE International Journal of Fuels and Lubricants 6: 785-793.
Lee, S.K. &Young,T. 2015. Feasibility study of using wood pyrolysis oil–ethanol blended fuel
with diesel pilot injection in a diesel engine. Fuel 162: 65-73.
Manjunath, N., Rajashekhar, C.R., Khan, T.M.Y., Badruddin, I.A., Kamangar, S. &
Khandal, S.V. 2019. Augmented Turbulence for Progressive and Efficient Combustion in
Biodiesel–Diesel Engine. Arabian Journal for Science and Engineering 44: 7957-7966.
Journal of Engg. Research Online First Article
45
Martínez, J.D., Felipe,C., Cardona-U.N., Arenas, C.N. & Munoz, L.D. 2020. Waste tire
valorization by intermediate pyrolysis using a continuous twin-auger reactor: Operational
features. Waste management 113: 404-412.
Martínez, J. D., Jose, R.F., Sanchez, V.J., Murillo, R. & Garcia, T. 2014.Performance and
emissions of an automotive diesel engine using a tire pyrolysis liquid blend. Fuel 115: 490-
499.
McNeil, J., Day, P. & Sirovski, F. 2012. Glycerine from biodiesel: The perfect diesel fuel. Process
Safety and Environmental Protection 90: 180-188.
Montajir, R.M., Tsunemoto, H., Ishitani, H. & Minami, T. 2000. Fuel spray behavior in a small
DI diesel engine: effect of combustion chamber geometry, SAE Technical Paper.
Murugan, S.,Ramaswamy, M.C. & Nagarajan, G. 2008. The use of tyre pyrolysis oil in diesel
engines. Waste management 28: 2743-2749.
Sayin, C. 2010. Engine performance and exhaust gas emissions of methanol and ethanol–diesel
blends. Fuel 89: 3410-3415.
Seljak, T.O., Samuel R. & Katrasnik, T. 2015. Combustion characteristics of tire pyrolysis oil
in turbo charged compression ignition engine. Fuel 150: 226-235.
Sharma, A. & Murugan, S. 2013. Investigation on the behaviour of a DI diesel engine fueled
with Jatropha Methyl Ester (JME) and Tyre Pyrolysis Oil (TPO) blends. Fuel 108: 699-
708.
Sharma, A. & Murugan, S. 2015 (a). Combustion, performance and emission characteristics of
a DI diesel engine fuelled with non-petroleum fuel: a study on the role of fuel injection
timing. Journal of the Energy Institute 88: 364-375.
Sharma, A. & Murugan, S. 2015 (b). Potential for using a tyre pyrolysis oil-biodiesel blend in a
diesel engine at different compression ratios. Energy Conversion and Management 93:
289-297.
Sjoberg, M.D. & John, E. 2005. Effects of engine speed, fueling rate, and combustion phasing
on the thermal stratification required to limit HCCI knocking intensity. SAE transactions:
1472-1486.
Soudagar, M.E.M., Nik-Nazri,N.G., Kalam, M.A., Badruddin, I. A., Banapurmath, N.R.,
Khan, T.M.Y., Bashir, M.N., Akram, N., Farade, R. & Afzal, A. 2019. The effects of
graphene oxide nanoparticle additive stably dispersed in dairy scum oil biodiesel-diesel
fuel blend on CI engine: performance, emission and combustion characteristics. Fuel 257:
116015.
Journal of Engg. Research Online First Article
46
Subbaiah, G.V.; Gopal, K.R.; Hussain, S.A.; Prasad, B.D.; Reddy, K.T.; Pradesh, A. Rice
Bran Oil Biodiesel As an Additive in Diesel-Ethanol Blends for Diesel Engines. Int. J.
Recent Res. Appl. Stud. 2010.
Sudershan, B.G., Kamoji., M.A., Rampure, P.B., Banapurmath, N.R. & Khandal, S.V.
2018a.Experimental Studies on the Use of Pyrolysis Oil for Diesel Engine Applications
and Optimization of Engine Parameters of Injection Timing, Injector Opening Pressure and
Injector Nozzle Geometry. Arabian Journal for Science and Engineering 43: 4517-4530.
Sudershan, B.G., Nagaraj, R.B., Kamoji, M.A., Rampure, P.B. & Sanjeevkumar V.K. 2018b.
Experimental investigation of a CRDI engine in terms of performance and emission under
the effect of injection strategy using a moderate percentage of plastic pyrolysis oil and its
blends with diesel and ethanol. Biofuels: 1-15.
Tomic, M.D., Savin L.D., Micic, R.D., Simikic M.D. & Furman T.F. 2013. Effects of fossil
diesel and biodiesel blends on the performances and emissions of agricultural tractor
engines. Thermal Science 17: 263-278.
Tutak, W.; Jamrozik, A.; Pyrc, M.; Sobiepan´ski, M. Investigation on combustion process and
emissions characteristic in direct injection diesel engine powered by wet ethanol using
blend mode. Fuel Process. Technol. 2016, 149, 86–95.
Van de Beld, B., Holle, E.& Florijn, J. 2013. The use of pyrolysis oil and pyrolysis oil derived
fuels in diesel engines for CHP applications. Applied energy 102: 190-197.
Wang, H.,Xu; H. &Xuan, X. 2010. Review of Waste Tire Reuse& Recycling in China—current
situation, problems and countermeasures. Advances in Natural Science 2: 31-39.