Circulating FluidisedCirculating_fluidised_bed_combustion_boiler.

1
PERFORMANCE ANALYSIS OF A RE-CIRCULATING HEAT PUMP
DRYER
Nurettin YAMANKARADENIZ1, K. Furkan SOKMEN
2, Salih COSKUN
1,*, Omer KAYNAKLI
3,
Bilsay PASTAKKAYA4
1 Uludag University, Vocational School of Technical Science, Electric and Energy Department, Air
Conditioning and Refrigeration Technology Program, Gorukle, 16059, Bursa, Turkey
2Uludağ University, Institute of Science, Mechanical Engineering Department, Görükle, Bursa, Turkey
3 Uludag University, Engineering and Architecture Faculty, Mechanical Engineering Department,
Gorukle, 16059, Bursa, Turkey
4 Uludag University, Orhangazi Vocational School, Machinery Program, Orhangazi, Bursa, Turkey
* Correspondence Author. E-mail address: [email protected]
A re-circulating heat pump dryer (HPD) system was designed, constructed and tested at steady state and transient conditions. Refrigerant 134a was used as a refrigerant in this system. The
tests were performed to observe behavior of HPD system. So, changes of temperature and relative
humidity of drying air through the dryer and heat pump operating temperatures were observed during the drying process and effects of bypass air ratio (BAR) on the system’s parameters as system
performance and specific moisture extracted ratio (SMER) at steady state were investigated. The HPD
system was also tested to investigate temperatures and relative humidity changes of drying air during drying process on the system’s parameters depend on time. Air flow rate circulated through the HPD
system was 554m3/h during the all tests. According to test results, the system’s parameters did not
change up to 40% of BAR. Then the COP and SMER values were decreased after 40% of BAR. While
SMER values changed between 1.2 and 1.4, COPsys changed between 2.8 and 3.3 depend on BAR. As well as during the drying process, the COP and SMER values were also affected and decreased
depend on time.
Keywords: Drying; dryer; heat pump; bypass air ratio; heat pump assisted dryer

2
1. Introduction
A drying system that is both energy efficiency and preserves product quality is desired. Some products
need to be dried at low temperature (30-35°C) for product quality. Heat pump dryer systems are
suitable for some sensitive products need to be dried at low temperature. Re-circulating HPDs
especially are more efficient than conventional dryers. In the re-circulating HPDs, both sensible and
latent heat can be recovered from dryer exhaust air, improving the overall thermal performance. There are a lot of studies in literature about heat pump assisted drying (HPD) systems [1-7]. In the drying
process, the moisture of the air must be regulated. Firstly, in order to control the dehumidification rate
during the whole drying process in terms of productivity and the quality of the product. Because the evaporator is the heat exchanger responsible for the recovery of latent heat from the air, changing the
mass flow through the evaporator will impact the performance of the heat pump [8]. Secondly, in
order to mix the air leaving the evaporator at 80-90% relative humidity with the air leaving the dryer. This supplies a sufficient air flow rate through the condenser to avoid excessive compressor discharge
pressures and temperatures. At the same time, the mixing process allows the condenser to reach the
desired air supply temperature without over-designing the heat transfer surface. The heat pump
evaporator may also be provided with a variable speed fan to improve the control of the material drying rate. The combined action of the bypassing air and the fan variable speed provides optimum air
flow rate through the evaporator, independently to the air flow rate through the condenser [9]. There
are some studies about the BAR effect on the system’s parameters in the literature. Achariyaviriya et al. [10] reported that COP decreased when the fraction of the BAR through the evaporator increased.
Oktay [11] explored the parameters affected by the performance of the HPD. According to Oktay, the
BAR, the total air flow rate and the exhaust flow rate are the key parameters that affect the system's
performance. According to Chua et al. [12], since the evaporator is the heat exchanger responsible for the recovery of latent heat from air, changing the mass flow through the evaporator will impact the
performance of the heat pump. BAR to evaporator was increased beyond a level, the total heat
recovered at the evaporators reduced. For every 20% increment in the BAR over the 40% mark, the drop in heat recovered ranged between 0.6 to 0.8 kW. In the study by Qi-Long Shi [13], the BAR and
air velocity on the drying characteristics of horse mackerel were studied. According to Teeboonma et
al. [14], the most important factors, while examining the optimum conditions for HPD and for minimizing the HPD’s cost, were the recycled air ratio, the BAR, air flow rates, and the drying air
temperature. The results illustrated that the optimum conditions of each test material are not similar,
especially the optimum air flow rate and the BAR. The physical properties of the test material
significantly affect the optimum airflow rate and the BAR. In another study, Clements et al. [15] have recommended that the BAR should be in the range of 60-70% to obtain the optimum ratio for the
SMER. In this study, a re-circulating HPD system was designed, constructed and tested. Experimental
analysis was performed on this system to determine the optimum working conditions at steady state
and transient conditions.
2. Experimental setup and measurements
2.1. Experimental Setup
The experimental setup was designed and constructed at the Air Conditioning and
Refrigeration Laboratory, Vocational School of Technical Science, Uludag University, Bursa, Turkey as seen from in fig (1). It consisted of two main parts: (1) heat pump, (2) drying chamber. The air was
heated by a heat pump system including a reciprocating compressor, a condenser (internal and external
ones), a thermostatic expansion valve and an evaporator. Refrigerant 134a was used as a refrigerant in this system. Drying air was circulated by a radial fan in a duct system and fresh air was not used
during the drying process. There are a bypass and a flow damper to adjust bypass air flow rate. There
are two condensers as internal and external. When there was an increase at discharge pressure and

3
temperature of the heat pump system. The external condenser was cut in to decrease the discharge
pressure and temperature.
Fig (1): Schematic description of the HPD system
1. Bypass damper, 2. Flow damper, 3.Evaporator, 4. Drain pan, 5. Internal condenser, 6. Radial fan, 7.Evaporative cellulose pad, 8.
Reservoir, 9. Float, 10.Water circulating pumps, 11.Water tank, 12. Compressor, 13. Accumulator, 14. Drying chamber, 15. Control panel,
16. Velocity measurement points, 17. External condenser
In this study, a humidification unit was installed in the drying chamber instead of the product. Since the aim of this study was to investigate the HPD unit and dryer system performance rather than the
product. Thus, a large degree of flexibility, reliability and modularity have been provided. The humidification unit consists of an evaporative cellulose pad, a reservoir, a water storage tank and two
circulating pumps. Water is pumped to the evaporative cellulose pad from the water storage tank at
20°C to obtain humid air conditions at the outlet of the drying chamber constantly during the
experiment.
During the sizing of the HPD system components, appropriate correlation between the initial mass and moisture content, the moisture migration and extraction rate of each dried product and the heat pump
dehumidification capacity has to be provided for any drying process. Matching the dewatering
capacity of the dried material with the heat pump dehumidification capacity is a major issue for any heat pump dryer [16]. So, humidity extracted from product should be determined. In this study, after
predetermined air mass flow rate, air inlet and outlet conditions (shown as A, B, C and D points)
through the dryer and then humidity content sprayed into the air were determined by means of
psychometric diagram. The heat pump dehumidification capacity depends on the quantity of water to be removed from the dried material. The ratio between the heat pump dehumidification capacity and
the heat pump input power has to be as high as possible. Then capacities of heat pump components
(i.e. evaporator, condenser and compressor) were specified by using heat transfer equations between air and refrigerant. Condensing and evaporating design temperatures was selected as about 50°C and
7.5°C respectively. The condensing temperature was not selected higher temperature than 50°C.
Because higher condensing temperature leads higher compressor outlet temperature and consequently, compressor damaged.

4
In this experimental setup, the recirculating drying air primarily enters the condenser. While
the temperature of the drying air increases, the relative humidity decreases throughout the condenser
by absorbing heat from the refrigerant. The refrigerant also condenses in the condenser coils by giving
heat to the circulating air. The circulating air leaving the condenser is delivered into the drying chamber, where the warm air is humidified then the moist air with increased humidity enters the
evaporator. The air flow rate passing and bypassing the evaporator is controlled during the
experimental analysis by setting up the flow and the bypass damper. One part of the air is passed to the evaporator, and the other part is bypassed. Warm and humid air passing through the evaporator
provides heat to the refrigerant in the coils which cool down as condensation occurs over their surface.
Air passing and bypassing from the evaporator is mixed at the outlet of the evaporator and is sent to the condenser. Air passing to the condenser absorbs the heat from the refrigerant in the condenser coils
and leaves the condenser warmer. Finally, the exhaust air is sent to the drying chamber by means of
the radial fan. Change of the drying air during the drying process was shown on the psychometric
diagram in fig (2). Technical specifications of the main components of the HPD system were given in
Table (1).
Fig (2): Change of the air properties during the drying process on the psychometric diagram
Table (1): Specification of main components of HPD unit
Main
Components
Technical specifications
Fan Radial fan, 1080 rpm for 50Hz, 1.5 A max., 3 stage
Compressor 2875 rpm, 1 ½ HP, displacement 32.7 cm3
Evaporator Number of vertical pipe: 12, number of horizontal pipe: 3, number of fin: 196 Dimension of exchanger: 380mm high x85mm width x450mm length, pipe outside diameter: 0.9525m
Internal condenser
Number of vertical pipe: 12, number of horizontal pipe: 3, number of fin: 196 Dimension of exchanger: 380mm high x85 mm width x450mm length, pipe outside diameter: 0.9525m
External condenser
Number of vertical pipe: 12, number of horizontal pipe: 2, number of fin: 117 Dimension of exchanger: 360 mm high x145 mm width x410 mm length, pipe outside diameter: 0.9525m

5
2.3. Measurements
Some measurements were achieved during the experiment. Air velocity was measured
carefully according to Tchebycheff method to calculate air flow rate correctly [16]. The air velocity
was measured by a hotwire anemometer. The velocity measurement was conducted. The duct cross
section is rectangular and it is 530 mm width and 385 mm height. Using the log-Tchebycheff method, the duct is divided into rectangular areas, which are further adjusted in size to account for effects of
the duct wall on the airflow. 30 points were measured in order to get a good average. Mean air
velocity was measured as 0.77 m/s and mean air flow rate was calculated as 554 m3/h air flow rate.
The recirculating air temperature and relative humidity values were also measured by multipurpose
data acquisition modules from points A, B, C and D as shown in fig. 1. Temperature and humidity
probes were placed in a hole on the duct wall at these points. Operating temperatures in the heat pump system were measured from pipe surface by means of thermocouples. Condensed water through the
evaporator was collected in a container and measured by a sensitive scale and power consumption of
the fan and the compressor were also measured by an electric meter during the experiment. The tests
were carried out on the HPD system under steady state conditions to determine BAR the system performance. All measured data were recorded by a data logger and transferred to the computer. The
accuracies of the measurement devices are given in Table (2).
Table (2): The accuracies of the measurement devices
Measured quantity Measurement device Measurement range Accuracy
Total power consumption (fan and compressor)
Digital three phase electric meter 0 - 3000 W ± 0.02 %
Moisture extraction ratio Air temperature Air Humidity
Air velocity
Digital weighing scale Data sheet SHT71 humidity and temperature sensor Data sheet SHT71 humidity and temperature sensor
TESTO 0635 1047 Hot wire NTC
0 - 55 kg -40 - 123°C 0 – 100 % RH
0 – 20 m/s
±0.01% ±0.4% ±3%
±4%
2.4. Uncertainty Analysis
Uncertainty is considered as a possible perturbation of a given quantity around its nominal
value. The experimental uncertainties in this study were calculated using standard uncertainty analysis
methods reported by Moffat [17]. Uncertainties of the calculated parameters were determined by using accuracies of related measured variables and calculated total uncertainties. The estimated uncertainties
of the COPhp, COPsys, MER and SMER were the within the range of ±1.2%, ±1.2%, ±2.1% and ±1%
of the nominal values, respectively. A summary of the representative mean values of the measured
parameters and experimental results are given in Table (3).
6
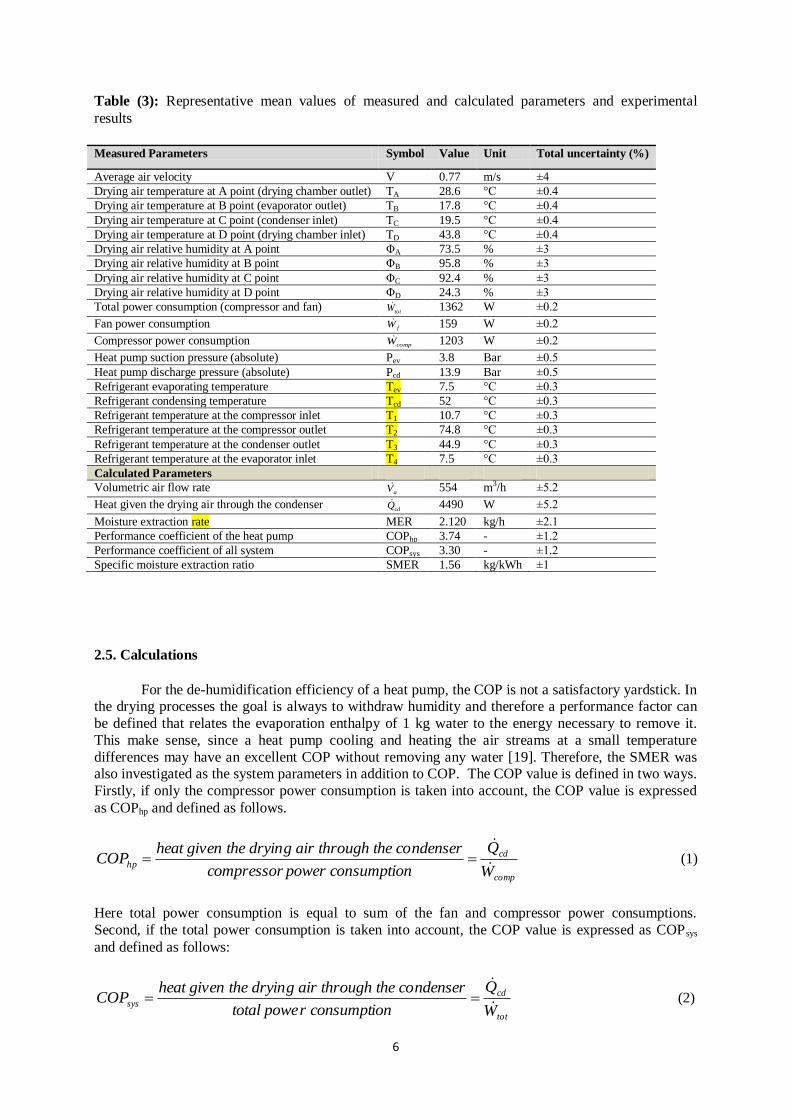
Table (3): Representative mean values of measured and calculated parameters and experimental
results
Measured Parameters Symbol Value Unit Total uncertainty (%)
Average air velocity V 0.77 m/s ±4
Drying air temperature at A point (drying chamber outlet) TA 28.6 °C ±0.4
Drying air temperature at B point (evaporator outlet) TB 17.8 °C ±0.4
Drying air temperature at C point (condenser inlet) TC 19.5 °C ±0.4
Drying air temperature at D point (drying chamber inlet) TD 43.8 °C ±0.4
Drying air relative humidity at A point ΦA 73.5 % ±3
Drying air relative humidity at B point ΦB 95.8 % ±3
Drying air relative humidity at C point ΦC 92.4 % ±3
Drying air relative humidity at D point ΦD 24.3 % ±3
Total power consumption (compressor and fan) totW
1362 W ±0.2
Fan power consumption fW
159 W ±0.2
Compressor power consumption compW
1203 W ±0.2
Heat pump suction pressure (absolute) Pev 3.8 Bar ±0.5
Heat pump discharge pressure (absolute) Pcd 13.9 Bar ±0.5
Refrigerant evaporating temperature Tev 7.5 °C ±0.3
Refrigerant condensing temperature Tcd 52 °C ±0.3
Refrigerant temperature at the compressor inlet T1 10.7 °C ±0.3
Refrigerant temperature at the compressor outlet T2 74.8 °C ±0.3
Refrigerant temperature at the condenser outlet T3 44.9 °C ±0.3
Refrigerant temperature at the evaporator inlet T4 7.5 °C ±0.3
Calculated Parameters
Volumetric air flow rate aV 554 m3/h ±5.2
Heat given the drying air through the condenser cdQ 4490 W ±5.2
Moisture extraction rate MER 2.120 kg/h ±2.1
Performance coefficient of the heat pump COPhp 3.74 - ±1.2
Performance coefficient of all system COPsys 3.30 - ±1.2
Specific moisture extraction ratio SMER 1.56 kg/kWh ±1
2.5. Calculations
For the de-humidification efficiency of a heat pump, the COP is not a satisfactory yardstick. In the drying processes the goal is always to withdraw humidity and therefore a performance factor can
be defined that relates the evaporation enthalpy of 1 kg water to the energy necessary to remove it.
This make sense, since a heat pump cooling and heating the air streams at a small temperature
differences may have an excellent COP without removing any water [19]. Therefore, the SMER was also investigated as the system parameters in addition to COP. The COP value is defined in two ways.
Firstly, if only the compressor power consumption is taken into account, the COP value is expressed
as COPhp and defined as follows.
comp
cd
hpW
Q
sumption power concompressor
ndenserugh the cog air thro the dryinheat givenCOP
(1)
Here total power consumption is equal to sum of the fan and compressor power consumptions.
Second, if the total power consumption is taken into account, the COP value is expressed as COPsys
and defined as follows:
tot
cd
sysW
Q
ionr consumpttotal powe
ndenserugh the cog air thro the dryinheat givenCOP
(2)

7
The heat given the drying air through the condenser is calculated from the following equation.
)( CDpaaacd TTcVQ (3)
MER called as “moisture extraction rate” is the amount of water removed from the product per hour and SMER called as “specific moisture extraction rate” is the energy required to remove a unit
mass of water and defined as the following equation. In this study, MER was obtained from evaporator
by measuring condensed water as kg per hour.
totW
MER
n consumptiopowertotal
rateextractionmoistureSMER
(4)
The bypass air ratio represents the amount of air without contact with evaporator surface. The
BAR is calculated as a function of the temperatures as follows,
BA
BC
TT
TTBAR
(5)
3. Result and discussion
This study can be evaluated as two parts. First part is steady state analysis. In this section, the
experiments were conducted to observe temperature and relative humidity changes of drying air,
change of heat pump operating temperatures and capacities and also investigate effects of bypass air ratio on the system’s parameters (MER, SMER, COPhp and COPsys). Second part is transient analysis.
In this section, The HPD system was tested to investigate behavior depend on time. So, temperatures
and relative humidity changes of drying air during drying process on the system’s parameters were
investigated. Air flow rate circulated through the HPD system was 554 m3/h during the all tests.
3.1. Steady State Analysis
The HPD system was operated after obtaining the steady state conditions. It was tested for various BAR value which adjusted by two damper, one of them was called as “flow damper” placed in
front of the evaporator, the other was called as “bypass damper” which bypassed the humid air from
the evaporator. During the setting of the BAR, as the flow damper was throttled, bypass damper was
turned on. The HPD system was operated and tested for one hour for every BAR settings and in the meantime, constant humidity was supplied by two water circulating pumps instead of product.
Although the bypass damper was closed tightly, because of leakage, the minimum BAR was
calculated as about 18%.
The changes of the drying air temperatures and relative humidifies at the HPD system depend on the BAR are shown in fig (3). Heat transfer between air and refrigerant at the evaporator decreased
with increasing the BAR because of less air flow rate through the evaporator. Condenser capacity was
also affected and decreased depend on the evaporator capacity. With increasing the BAR, the highest temperature falling was observed at the outlet of the evaporator and this caused to increase air
temperature at the condenser inlet. Because, the drying air at the condenser inlet is the mixing of
cooled air which passed the evaporator and bypassed air.

8
The temperature and relative humidity of the drying air entered the drying chamber (D) was
about 41.5°C and 25% as dampers were closed. They increased and reached about 45°C and 30% at
40% of BAR, owing to increasing the drying air temperature at the condenser inlet and then drying air
temperature at drying chamber inlet (D) decreased while relative humidity increased with increasing BAR.
Fig (3): Changes in drying air temperatures and relative humilities depend on the BAR
Fig (4): Changes in heat pump operating temperatures and capacities depend on the BAR
As shown in fig. 4, heat pump operating temperatures and capacities affected with BAR. Decreasing
cooling and dehumidifying capacity of the evaporator affected condenser capacity and other operating
temperatures because of lessen air flow rate through the evaporator. All operating temperatures such as compressor inlet, outlet gas temperatures, condensing and evaporating temperature, etc. also
decreased after 40% of BAR.

9
Fig (5): MER, SMER, COPhp, COPsys values depend on the BAR
MER, SMER, COPhp and COPsys values depend on BAR value were obtained as shown in fig.
(5). All of these parameters decreased after about 40% of BAR. While SMER values changed
between 1.2 and 1.4, COPsys changed between 2.8 and 3.3 depend on BAR. According to Jolly et al.
[20], the SMER of the HPD systems were in the range of 1.0 – 4.0 kg/kWh, which confirms the results of the present study. Jia et al. [18] also found that the SMER increased with increasing of the BAR up
to the optimal BAR and then it decreased. But, air around the evaporator could only improve the
SMER by approximately 20% and the maximum SMER was not very sensitive to the bypass air ratio. According to Chu et al. [1], the SMER was significantly affected by the BAR. A higher BAR would
reduce the SMER when the amount of bypass air was increased. Both the heat transfer and transfer
coefficient in the evaporator would then decrease as a result of lower air flow rate and lower air velocity through the evaporator. Therefore, by employing the bypass air across the evaporator method
to control the air humidity, the resulting consequence would be a reduction in the heat pump dryer
performance. Tai et al. [21] reported that the maximum SMER was obtained when the COP at
maximum. However, later studies presented by Jia et al. [18] and Prasertsan et al. [22] reported that maximum COP and SMER did not necessarily occur under the same working conditions. According to
Oktay [11], this phenomenon was explained by the interaction between the process air in the dryer
system and the refrigeration in the heat pump. Because of this interaction, the heat pump and dryer should be evaluated together.
3.2. Transient Analysis
System was also tested depend on time to investigate temperatures and relative humidifies of
drying air through the dryer and the effects of the drying air relative humidity changes at the drying chamber outlet on the system parameters such as MER, SMER, COPhp and Copsys. For this, before
starting test, evaporative cellulose was humidified completely and then water circulating pumps were
stopped. So, humidity evaporative cellulose pad was allowed to dry. For this, firstly two circulating pumps were operated. Second, only one circulating pump was operated and finally, all circulating
pumps were cut out. During the drying process, bypass damper was closed tightly.
As seen from fig. (6), during the drying process, temperature and relative humidity of drying
air at the dryer inlet was changed about 43°C and 22% to 46°C and 18%, while temperature and
relative humidity of drying air at the dryer outlet changed from about 30°C and 70% to 38°C and 30%
depend on time.

10
Fig. (6). Drying air temperatures and relative humilities in the dryer depend on time
The HPD system was tested depend on changing of relative humidifies at the drying chamber outlet.
As seen from fig (7), when the relative humidity at the drying chamber outlet was reduced, all system
parameters also decreased depend on time.
Fig (7): Changes of system parameter’s depend on the relative humidify changes at the drying
chamber outlet
4. Conclusions
In this study, a re-circulating heat pump assisted dryer was tested to investigate effects of the BAR on
the system parameters such as MER, SMER, COPhp and COPsys and observe temperature and relative humidity changes of air and refrigerant temperature change through the HPD system at steady state
condition, moreover, the effects of the drying air relative humidity changes at the drying chamber
outlet on the system parameters depend on time. At the end of the experiments, the following
conclusions may be drawn from the present experimental study:
1. According to Jolly et al. [18], the SMER of the HPD is in the range of 1.0-4.0 kg/kWh, whereas the
SMER of a conventional dryer is in the range of 0.2- 0.6 kg/kWh. The SMER value is obtained as
about 1.5 kg/kWh in this study. So, the re-circulating HPD system should be preferred instead of
conventional dryer.

11
2. When the BAR is used in order to control the dehumidification rate during the drying process or to
mix the air leaving the evaporator with the air leaving the drying chamber to avoid excessive
compressor discharge pressures and temperatures, the BAR should not exceed 40%, otherwise
system’s performance will be affected negatively and the COP and SMER values will decrease.
3. When the relative humidity of drying air at the drying chamber outlet decreased during the drying process depend on time, MER, SMER and COP values also decreased. However, the discharge
pressure and temperature values increased depend on time and so this increment should be considered
at design stage. So, the external condenser should be mounted.
Acknowledgement
This work was supported by Uludag University Research Project Foundation (Project No: M-2008/63.
Residential and industrial heat pump applications), the authors wish to thank Uludag University.
References
[1]. Chua KJ, Mujumdar AS, Hawlader MNA, Chou SK, Ho JC, Batch drying of banana pieces effect of stepwise change in drying air temperature on drying kinetics and product color, Food Research
International, 34 (2001), pp. 721–731.
[2]. Ogura H, Yamamoto T, Otsubo Y, Ishida H, Kage H, Mujumdar AS, A control strategy for
chemical heat pump dryer, Drying Technology, 23 (2005), pp. 1189–1203.
[3]. Ameen A, Bari S., Investigation into the effectiveness of heat pump assisted clothes dryer for
humid tropics, Energy Conversion & Management, 45 (2004), pp. 1397–1405.
[4]. Adapa PK, Schoenau GJ., Re-circulating heat pump assisted continuous bed drying and energy
analysis, International Journal of Energy Research, 29 (2005), pp.961–972.
[5]. Bannister P, Carrington G, Chen G., Heat pump dehumidifier drying technology-status, potential
and prospects, Proceedings of 7th IEA heat pump conference. Beijing, China May 19–22, (2002).
[6]. Hawlader MNA, Perera CO, Tian M., Properties of modified atmosphere heat pump dried foods,
Journal of Food Engineering, 74 (2006), pp.392–401.
[7]. Lee KH, Kim O., Investigation on drying performance and energy savings of the batch-type heat
pump dryer. Drying Technology, 27 (2009), 565 - 573.
[8]. Geeraert B., Air drying by heat pumps with special reference to timber drying, in: Camatini E,
Kester T Editors, Heat pumps and their contribution to energy conservation, NATO advanced study
institute series E, Applied Science (1976), pp. 219–246.
[9]. Minea V. Improvements of high-temperature drying heat pumps, International Journal of Energy
Research, 33 (2010), 180-195.
[10]. Achariyaviriya S, Soponronnarit S, Terdyothin, Mathematical model development and
simulation of heat pump fruit dryer. Drying Technology, 18 (2000), pp.479–491.
[11]. Oktay Z., Testing of a heat-pump assisted mechanical opener dryer. Applied Thermal
Engineering, 23 (2003), pp.153–162.

12
[12]. Chua KJ, Chou SK., A modular approach to study the performance of a two-stage heat pump
system for drying. Applied Thermal Engineering, 25 (2005), pp.363–1379.
[13]. Qi-Long S, Chang-Hu X, Ya Z, Zhao-Jie L, Xiang-You W, Drying characteristics of horse
mackerel (Trachurusjaponicus) dried in a heat pump dehumidifier, Food Engineering, 84 (2008),
pp.12–20.
[14]. Teeboonma U, Tiansuwan J, Soponronnarit S., Optimization of heat pump fruit dryers, Journal
of Food Engineering, 59 (2003), pp.369–377.
[15]. Clement S, Jia X, Jolly P., Experimental verification of a heat pump assisted-continuous dryer
simulation model, International Journal of Energy Research, 17 (1993), pp.19–28.
[16]. ASHRAE Handbook Fundamental, Chapter 14, Measurement and Instruments, (2005).
[17]. Moffat RJ., Describing the uncertainties in experimental results, Experimental Thermal and
Fluid Science 1 (1988), pp.3-17.
[18]. Jia X, Jolly P, Clements S., Heat pump assisted continuous drying part 2: Simulatıon results,
International Journal of Energy Research, 14 (1990) pp.71-782.
[19]. Moser F, Schnitzer H., Heat Pumps in Industry, Elsevier, Amsterdam, (1985).
[20]. Jolly P, Jia X, Clements S., Heat pump assisted continuous drying part 1: Simulation model,
International Journal of Energy Research, 14 (1990), pp.757-770.
[21]. Tai KW, Devotta S, Watson FA, Holland FA., The potential for heat pumps in drying and
dehumidification system using R114, International Journal of Energy Research, 6 (1982), pp.333-340.
[22]. Prasertsan S, Saen-Saby P., Heat pump drying of agricultural materials, Drying Technology, 16
(1988), pp.235-250.
[23]. Almeida MSV, Gouveia MC, Zdebsky SR, Parise JAR., Performance analysis of a heat pump
assisted drying system, International Journal of Energy Research, 14 (1990), pp.397-406.