PC - Electricals Sector - IC -...
38
INSTITUTIONAL EQUITY RESEARCH India Electricals Cranking up the voltage INDIA | MIDCAP‐ELECTRICALS | Sector Update 13 October 2015 The growth of the Indian economy over the past decade is well documented. With GDP registering a CAGR of 13% over the last 10 years (nominal), per capita income (nominal) has trebled, resulting in higher consumption levels across products and services. This has not only reflected in higher discretionary spending, but also spurred upgrades in purchases of nondiscretionary items. However, despite being the second‐most populous country in the world, India has a shockingly low per‐capita electricity consumption, especially in rural parts of the country. With structural improvements underway, such as the increase in housing stock, increase in power generation availability, and the improving demographic profile of the population, there is immense potential for growth of electrical products. Using this as the backdrop, we are initiating coverage on four companies in the consumer electrical space. We have prioritised cash flows and working capital management, in addition to soundness of the business model; while evaluating companies in the space. Havells India A cash‐generating giant, Havells has rapidly expanded its product basket and distribution reach over the past decade. With its huge distribution network and short working capital cycle, the company’s domestic operations generate significant cash, which form the bedrock of its valuation. We have a Buy rating with a target price of Rs 297. Finolex Cables As one of the most trusted brands in electrical wires and cables, Finolex Cables is slowly expanding its distribution network outside its traditional strongholds of southern and western India. Simultaneously, it plans to introduce new products in an effort to leverage its extensive distribution network. Trading at a significant discount to similar sized peers, we have a BUY recommendation on the company and a target price of Rs 323. V Guard Industries From a mid‐sized player focused on south India to an emerging national player, V Guard has delivered scorching growth over the past few years. Using an ‘asset‐light’ model, it has rapidly ramped up its distribution network while steadily strengthening its balance sheet. While we are positive about the company’s prospects, we believe that it is trading close to its fair value of Rs 919. Hence, we initiate coverage with a NEUTRAL rating. Bajaj Electricals One of the oldest companies in the country, Bajaj Electricals has witnessed turbulence in its operations off late, as the sheen of its electrical operations were dulled by the performance of its engineering projects (EP) division. Given the uncertain performance of the EP business and lower potential returns, we initiate coverage with a SELL recommendation and a price objective of Rs 206. Companies Havells India Ltd Reco BUY CMP, Rs 259 Target Price, Rs 297 Finolex Cables Ltd Reco BUY CMP, Rs 232 Target Price, Rs 323 V‐Guard Industries Ltd Reco NEUTRAL CMP, Rs 908 Target Price, Rs 919 Bajaj Electricals Ltd Reco SELL CMP, Rs 246 Target Price, Rs 206 Amol Rao (+ 9122 6667 9952) [email protected] Deepak Agarwal (+ 9122 6667 9944) [email protected]
Transcript of PC - Electricals Sector - IC -...

INSTITUTIONAL EQUITY RESEARCH
India Electricals Cranking up the voltage INDIA | MIDCAP‐ELECTRICALS | Sector Update
13 October 2015
The growth of the Indian economy over the past decade is well documented. With GDP registering a CAGR of 13% over the last 10 years (nominal), per capita income (nominal) has trebled, resulting in higher consumption levels across products and services. This has not only reflected in higher discretionary spending, but also spurred upgrades in purchases of nondiscretionary items. However, despite being the second‐most populous country in the world, India has a shockingly low per‐capita electricity consumption, especially in rural parts of the country. With structural improvements underway, such as the increase in housing stock, increase in power generation availability, and the improving demographic profile of the population, there is immense potential for growth of electrical products. Using this as the backdrop, we are initiating coverage on four companies in the consumer electrical space. We have prioritised cash flows and working capital management, in addition to soundness of the business model; while evaluating companies in the space. Havells India A cash‐generating giant, Havells has rapidly expanded its product basket and distribution reach over the past decade. With its huge distribution network and short working capital cycle, the company’s domestic operations generate significant cash, which form the bedrock of its valuation. We have a Buy rating with a target price of Rs 297. Finolex Cables As one of the most trusted brands in electrical wires and cables, Finolex Cables is slowly expanding its distribution network outside its traditional strongholds of southern and western India. Simultaneously, it plans to introduce new products in an effort to leverage its extensive distribution network. Trading at a significant discount to similar sized peers, we have a BUY recommendation on the company and a target price of Rs 323. V Guard Industries From a mid‐sized player focused on south India to an emerging national player, V Guard has delivered scorching growth over the past few years. Using an ‘asset‐light’ model, it has rapidly ramped up its distribution network while steadily strengthening its balance sheet. While we are positive about the company’s prospects, we believe that it is trading close to its fair value of Rs 919. Hence, we initiate coverage with a NEUTRAL rating. Bajaj Electricals One of the oldest companies in the country, Bajaj Electricals has witnessed turbulence in its operations off late, as the sheen of its electrical operations were dulled by the performance of its engineering projects (EP) division. Given the uncertain performance of the EP business and lower potential returns, we initiate coverage with a SELL recommendation and a price objective of Rs 206.
Companies Havells India Ltd Reco BUY CMP, Rs 259 Target Price, Rs 297 Finolex Cables Ltd Reco BUY CMP, Rs 232 Target Price, Rs 323 V‐Guard Industries Ltd Reco NEUTRAL CMP, Rs 908 Target Price, Rs 919 Bajaj Electricals Ltd Reco SELL CMP, Rs 246 Target Price, Rs 206 Amol Rao (+ 9122 6667 9952) [email protected] Deepak Agarwal (+ 9122 6667 9944) [email protected]

MIDCAP‐ELECTRICALS SECTOR UPDATE
Introduction With a size of Rs 640bn, the Indian electrical industry is a lead indicator of industrial capex as well as individual household capex. It has direct links to frontline sectors of the Indian economy such as banking, power, roads, logistics, etc., which have enabled it to clock a CAGR of 3% over the last five years, despite sluggish economic conditions. Over the past several years, the industry has been transforming, with some of the noteworthy trends being fall in market share of unorganized players, consumer preference for premiumisation, and reducing working capital intensity of organized players. Indian electrical industry in FY15 (Rs bn)
Source: IEEMA We believe that the drivers for the electrical industry still remain in place and are gradually building up momentum, thereby making the sector a worthwhile investment opportunity. Rising housing stock: With more than 25mn houses built in rural areas under the Indira Awaas Yojana (IAY) (FY13) and increasing budgetary allocation for this in successive budgets, housing is proving to be a big source of consumption of household electricals. This, coupled with stable crop prices over the past few years, has resulted in a rise in rural incomes, boosting conspicuous consumption in these areas. This has served to improve consumption of electrical goods in the country. Rural housing stock in India No. of electrified villages in India
Source: CEA, Lok Sabha Secretariat, GoI; * Provisional numbers
Motors & AC Generators, 65
Power TRF, 40
Distribution TRF, 66
Capacitors, 54
HT Switchgear, 33
LT Switchgear and Misc Prod, 115
Cables, 360
Insulators, 21
Energy Meters, 29
0
1
2
3
4
450,000
500,000
550,000
600,000
2007‐08 2008‐09 2009‐10 2010‐11 2011‐12 2012‐13

MIDCAP‐ELECTRICALS SECTOR UPDATE
Trend in farm incomes – Agri GDP ‐ Current Price (Rs bn) Rising Annual personal disposable household income (Rs bn)
Source: CEA, Ministry of Power Structural changes boosting demand. Low per capita consumption of electricity in the country, especially due to poor availability in rural areas, has hampered offtake of electrical products. However, a gradual rectification of this problem is underway, through increased generation and improving availability — this will be one of the largest drivers of sales for the electricals sector, but not necessarily large, organized players. Low per capita consumption of electricity vs. other countries Rising power‐generation capacity (‘000 MW)
Source: CIA Factbook, 2015 Source: CEA, Ministry of Power Change in consumer preferences. A variety of factors such as increase in literacy and affordability, higher standards of living, and heightened quality consciousness, have contributed to a gradual change in consumption patterns over the last decade. Increasing sales of TVs, refrigerators, washing machines and other appliances like micro‐waves and ovens have also contributed to the increasing consumption of electrical goods such as wires and switchgears. While this shift has been more pronounced in urban India, the proliferation of satellite television has resulted in an emergence of this phenomenon in rural India as well.
0
2000
4000
6000
8000
10000
12000
14000
1600019
98‐99
1999
‐00
2000
‐01
2001
‐02
2002
‐03
2003
‐04
2004
‐05
2005
‐06
2006
‐07
2007
‐08
2008
‐09
2009
‐10
2010
‐11
2011
‐12
2012
‐13
0
20000
40000
60000
80000
100000
120000
1998
‐99
1999
‐00
2000
‐01
2001
‐02
2002
‐03
2003
‐04
2004
‐05
2005
‐06
2006
‐07
2007
‐08
2008
‐09
2009
‐10
2010
‐11
2011
‐12
2012
‐13
2013
‐14
2014
‐15
0 5,000 10,000 15,000
United StatesAustraliaSingaporeGermany
FranceSaudi Arabia
JapanIsrael
United KingdomChina
MalaysiaIran
MedianIndia
0
200
400
600
800
1000
1200

MIDCAP‐ELECTRICALS SECTOR UPDATE
Per capita income growth ‐ Current Price Rs.
Source: RBI, GOI Household requirement of electricals Component Unit RequirementCables (m) 280‐300Switches (no.s) 22Switchgears (no.s) 2Fans (no.s) 3FTL (no.s) 4CFL / LED bulb (no.s) 4
Source: Electrical Industry Scale and reach of electrical companies. Mindful of the rapidly evolving consumption pattern of electrical goods, large and mid‐sized players are gradually squeezing out the unorganized sector. While a balanced product profile, efficient operations, and extensive distribution are common in most companies, a key differentiating factor is the pedigree of the management. Return on Capital Employed (%)
Source: Company, PhillipCapital India Research
0
10000
20000
30000
40000
50000
60000
70000
80000
0%
5%
10%
15%
20%
25%
30%
35%
FY07 FY08 FY09 FY10 FY11 FY12 FY13 FY14 FY15 FY16e FY17e
Electricals Sector Electricals (Ex. Bajaj)

MIDCAP‐ELECTRICALS SECTOR UPDATE
Return on Equity (%)
Electricals Sector‐ Free Cash Flows (Rs bn)
Electricals Sector Picks
Source: Company, PhillipCapital India Research
0%
5%
10%
15%
20%
25%
30%
35%
FY07 FY08 FY09 FY10 FY11 FY12 FY13 FY14 FY15 FY16e FY17e
Electricals Sector Electricals (Ex. Bajaj)
‐10,000
‐5,000
0
5,000
10,000
15,000
FY07 FY08 FY09 FY10 FY11 FY12 FY13 FY14 FY15 FY16e FY17e
Total Total (Ex. Bajaj)
Havells
Finolex V‐Guard
Bajaj E0%
10%
20%
30%
40%
10 12 14 16 18 20 22 24 26
CAGR ‐P
AT (10
‐17E)
P/E
BUY
BUY
NEU
Sell

INSTITUTIONAL EQUITY RESEARCH
Havells India Ltd (HAVL IN) Electrical juggernaut INDIA | MIDCAP‐ELECTRICALS | Re‐Initiating Coverage
13 October 2015
As one of India's leading electrical goods and appliances companies, Havells is an established player with a pan‐India presence. Its sizeable manufacturing operations are backed by wide reach and savvy marketing. The company also has significant international operations in the EU and Latin America, through the Sylvania brand. We believe that the company is on a strong footing because of (1) depth and relevance of product portfolio in India, (2) superlative working capital management, and (3) steady increase in distribution reach and systematic widening of product basket. Comprehensive product portfolio Havells has a vast product range, which spans several verticals in the electrical industry. Though seemingly diverse, products like cables, switchgear, lighting products, and consumer appliances have enabled it to maximise its share of discretionary spending on household electricals. Over the years, the company has consistently managed to maintain traction in revenues across product categories through the regular introduction of new products and variants, targeting the premium, and of late, mid‐market segments in the Indian economy. Robust operating setup The company has built up large production capacities in almost all its products, with the purpose of maintaining strict quality controls and to derive benefits from economies of large‐scale manufacturing. To back this up, it has adopted a marketing strategy cantered on brand recall, where its ad‐spends are on par with multinational peers and designed to showcase individual products. It has also backed this up with a formidable distribution network in tier 1‐2 cities and is now focusing on deepening its penetration in the rural hinterland. Strong cash conversion Havells securitises its domestic receivables through a consortium of banks. Additionally, many of its vendors avail of channel‐financing facilities and with near‐zero delinquencies, the company has a negative working capital cycle in India. Encouragingly, it has also started factoring its receivables in its international operations housed in Sylvania, thereby shrinking its working capital cycle at the enterprise level. Near‐term slowdown could rapidly give way to high growth. Subdued industrial activity in India resulted in subdued sales for Havells in FY15. While consumer spending has slowed, the company has persisted with the addition of new products like air coolers in its line‐up and remains focused on increasing its distribution reach in untapped areas of the country. We believe that increased government spending on infrastructure creation coupled with a pick‐up in industrial activity in FY16 could pave the way for a broad‐based recovery in FY17. Havells could be best placed to capitalize on this, given its product basket and distribution reach. Valuation As one of the marquee names in the Indian electricals sector, Havells has built its business on a solid tripod of distribution, large‐scale manufacturing, and customer outreach. As the cash flow generation is impressive and the company’s return ratios are set to improve, Sylvania notwithstanding, growth over the next few quarters could see a revival. With impressive generation of cash flows in India and Sylvania’s working capital set to ease, the company will be in a position to consolidate its leadership in the sector. Hence, we initiate coverage on it with a Buy recommendation and price objective of Rs 297, which represents an upside of 15% from its current price.
BUY CMP RS 259 TARGET RS 297 (+15%) COMPANY DATA O/S SHARES (MN) : 625MARKET CAP (RSBN) : 162MARKET CAP (USDBN) : 2.552 ‐ WK HI/LO (RS) : 346 / 240LIQUIDITY 3M (USDMN) : 3.4PAR VALUE (RS) : 1 SHARE HOLDING PATTERN, % Jun 15 Mar 15 Dec 14PROMOTERS : 61.6 61.6 61.6FII / NRI : 26.4 26.9 26.6FI / MF : 3.1 2.6 2.9NON PRO : 2.1 2.2 2.5PUBLIC & OTHERS : 7.5 7.6 7.6 PRICE PERFORMANCE, %
1MTH 3MTH 1YRABS 0.1 ‐12.9 ‐2.7REL TO BSE ‐4.9 ‐10.2 ‐5.0 PRICE VS. SENSEX
Source: Phillip Capital India Research KEY FINANCIALS Rs mn FY15 FY16E FY17ENet Sales 85,698 93,952 105,664EBIDTA 7,215 9,023 11,056Net Profit 3,854 5,342 6,655EPS, Rs 6.2 8.6 10.7PER, x 41.9 30.3 24.3EV/EBIDTA, x 20.3 16.3 13.0P/BV, x 8.9 7.6 6.3ROE, % 0.2 0.1 0.1
Source: PhillipCapital India Research Est. Amol Rao (+ 9122 6667 9952) [email protected] Deepak Agarwal (+ 9122 6667 9944) [email protected]
0
100
200
300
Apr‐13 Apr‐14 Apr‐15Havells BSE Sensex

HAVELLS INDIA LTD RE‐INITIATING COVERAGE
Comprehensive product range Havells has a vast product range spanning several verticals. Though distinct in applications, its products are priced and designed to encompass the widest possible range of utility, enabling it to maximise its share of the consumer discretionary spending on household electricals. Havells – revenue break up
Source: Company, PhillipCapital India Research Cables and wires: Manufacturing cables (for industry) and wires (for households), Havells has an extensive range consisting of low‐tension (1.1‐11 kV) and high‐tension (11‐66 kV) cables. Even though this category is highly commoditised and extremely price sensitive with intense competition from the unorganised sector, Havells persists with it in order to offer its customers a well‐rounded product profile. Its product quality and brand perception have consistently enabled the company to enjoy a 2‐3% premium to peers in this product category. The company derives ~27% of its overall revenues from this vertical, with margins ranging from 8‐10%. Switchgear: Havells is one of the country’s leading manufacturers of switchgear. Leading the market in categories such as miniature circuit breakers (MCBs), residual circuit breakers (RCBs) and other associated equipment in domestic switchgear, it commands a ~20% market share in this vertical. It also manufactures industrial switchgear, though on a smaller scale. This is due to industry dynamics where most sales are direct (B2B), necessitating a large sales force. Consequently, it has a meagre 9% market share in this segment. As a whole, this vertical contributed ~15% to its revenues in FY15 with rich gross margins of 32%, making it the company’s most lucrative product vertical. Lighting and luminaires: Havells manufactures CFLs and energy‐saving FTLs (fluorescent tube lights) with a wide array of luminaires and fixtures. It is one of the top‐five domestic manufacturers in this segment. Its domestic lighting and luminaires contribute ~9% to overall revenues, while its international operations, housed in Sylvania, make up ~36% of consolidated revenues. Sylvania enjoys tremendous brand equity, has an extensive and contemporary product range, and impressive access to markets in over 40 countries, covering Europe, Latin America, and the Far East. The margin profile of domestic and international lighting operations is sharply divergent, with Havells earning ~20% margins in India and low single digit margins overseas. However, the lighting business at home and abroad has been buffeted by shift in consumer preference to LEDs, resulting in falling volumes and margin erosion. Electrical consumer durables: Under this vertical, Havells launched fans in CY04 and presently is one of the top‐five national brands in this segment. It then launched hot‐water geysers, imported from China, in CY10, ramping up by selectively launching a new product in this vertical every 12‐18 months. In September 2011, it launched consumer appliances such as irons, ovens, and electric kettles, garnering Rs 350mn in sales in its first year. It launched air coolers in CY15, thereby maintaining its trend of launching new product categories every six quarters and converting them into Rs 1bn streams of recurring revenue over a period of five to six quarters. Through a mix of
HavellsFY15 Rev ‐ Rs. 85bn
SwitchgearsRev . ‐ Rs. 14Bn
Cables & WiresRev . ‐ 25Bn
Lighting & Fixtures Rev. ‐ 44Bn
Electrical Consumer Durables
Rev. ‐ 11Bn

HAVELLS INDIA LTD RE‐INITIATING COVERAGE
manufacturing operations and outsourcing, the company intends to scale up revenues from electrical consumer durables to Rs 4.0‐4.5bn by FY17. Havells: S.A. revenue break up (Rs bn) Havells: Consolidated revenue break up (Rs bn)
Source: Company, PhillipCapital India Research
Formidable manufacturing operations Since its inception, Havells has maintained a policy of in‐house manufacturing. It has plants for all major products in its portfolio with the exception of certain consumer appliances, LEDs and particular varieties of lighting fixtures, which it outsources. This is due to its policy of optimum utilisation of raw material and stringent quality standards. Consequently, it has a contemporary product repertoire coupled with impeccable quality, which is borne out by lower rejection / defects and repeat customer purchases. As a matter of policy, Havells manufactures products whose revenue streams are sizeable enough to justify in‐house manufacturing. It has continuously ramped up its manufacturing capacity across verticals and is the country’s largest manufacturer of CFLs, motors and fans. It is also one of the top‐three manufacturers of wires, switchgear, and electrical fixtures. It has decided to opt for outsourcing in select product categories, such as consumer appliances, in order to cut down on the lead time to markets. By opting to monitor quality standards and focus on advertising and distribution, it has adopted an ‘asset‐light’ model in this segment. As this industry is characterised by rapidly changing consumer preferences in terms of products and designs, inflexible manufacturing facilities often face the risk of obsolescence. Hence, this limited outsourcing will be beneficial for Havells’ balance sheet and operating parameters, as it leaves the company free to leverage its marketing and distribution competencies to the hilt and simultaneously boost return ratios. Havells: Manufacturing locations Location Product Alwar Cables & wires Noida Capacitors, LightingBaddi Switchgears Haridwar Fans Neemrana Motors, Lighting & FixturesSahibabad Switchgears Faridabad Switchgear, Lighting
Source: Company, PhillipCapital India Research
0
13
26
39
52
65
78
91 Electrical Consumer DurablesLighting & FixturesCables & WiresSwitchgears
‐
20
40
60
80
100
120 Electrical Consumer DurablesLighting & FixturesCables & WiresSwitchgears

HAVELLS INDIA LTD RE‐INITIATING COVERAGE
Very effective marketing, vast distribution network Over the years, through aggressive national advertising, Havells has emerged as a strong brand. With ad spends comparable to some FMCG players, its products are marketed as technologically superior and ‘value‐for‐money’ propositions. As a policy, the company earmarks ~5% of its domestic revenues towards its ad budget, a large chunk of which is spent during important cricket tournaments such as the Indian Premier League. Consequently, it is one of the ‘top‐five’ consumer brands in electricals in the country. The cornerstone of its spectacular growth in revenue in the past several years has been the successful leveraging of its distribution network. With over 6,000 distributors and 40,000 retailers across the country, Havells has one of the most extensive setups in the industry. Over the years, it has cultivated its dealers through trade‐friendly practices, enabling it to launch a wide variety of products in seemingly different verticals. The efficiency and reliability of its distribution channels are borne out by its market share in most product categories and improved revenues and operating profits, which have registered respectively 16% and 18% CAGRs in the past four years (FY10‐15). Havells: Bill discounting and channel financing trend
Source: Company, PhillipCapital India Research
Extremely short domestic cash‐conversion cycle In its domestic operations, Havells securitises its receivables through a consortium of banks. With near‐zero delinquencies from its domestic dealers, it secures attractive rates. It has arranged for channel finance for many of its vendors. As a result, it operates on a near‐zero working‐capital cycle in India, thus generating healthy amounts of cash in the process. In a positive development, Havells has recently secured a line of euro 35m for Sylvania’s operations, thereby reducing debt on its balance sheet.
1,88
5
1,99
3 2,41
0
2,44
8
3,41
1
3,41
0
4,18
8
221 423
1,16
7
2,69
5 3,25
9 3,56
5
3,71
9
0
900
1,800
2,700
3,600
4,500
FY09 FY10 FY11 FY12 FY13 FY14 FY15
Bills discounted Channel Financing

HAVELLS INDIA LTD RE‐INITIATING COVERAGE
Havells: Profile of return ratios (S.A)
Source: Company, PhillipCapital India Research
Sylvania – A mixed bag In CY07 Havells acquired Germany‐based SLI Sylvania for an enterprise value of € 227mn. Sylvania’s operations were a part of OSRAM, a division of Siemens. On the restructuring of the Siemens group, SLI's ownership vested with financial investors. The SLI acquisition was routed through a 100% SPV, i.e., Havells Netherlands BV with the following objectives: 1. Capitalising on Sylvania’s design and engineering capabilities 2. Monetising Sylvania's brands (Sylvania, Concord Marlin, Luminance, SLI Lighting,
Zenith, and Linolite) and expanding the breadth of its product offerings in India and globally.
3. Entering new areas in Europe and Latin America and parts of the Far East and leveraging Sylvania’s distribution network in Europe to propel the growth of its switchgear business.
Sylvania ‐ lighting and fixtures – revenue (Rs bn) Operating profit and margin
Source: Company, PhillipCapital India Research The total consideration for the acquisition routed through HIL’s subsidiary Havells Netherlands was € 227mn. Of this, pension liability amounted ~€ 35mn, which was to be paid when it arose. Thus, against an immediate liability of € 192mn, Havells raised debt, which was a mix of non‐recourse (€ 120mn) and recourse type (€ 72mn). Of the latter, ~€ 50mn was funded through equity infusion by way of ~4.2mn shares issued to Warburg Pincus at Rs 625 a share (F.V of Rs 10). However, things turned sour when
‐
10
20
30
40
50
FY07 FY08 FY09 FY10 FY11 FY12 FY13 FY14 FY15 FY16E FY17E
ROCE (%) ROE (%)
30
33
29
27
31
33
37
36 36
37
25
27
29
31
33
35
37
39
0%
2%
4%
6%
8%
10%
0
500
1,000
1,500
2,000
2,500Operating Profit OPM (%)

HAVELLS INDIA LTD RE‐INITIATING COVERAGE
Sylvania started bleeding operationally during the economic downturn of FY09. The company defaulted on a couple of monthly repayments of working capital borrowings to a consortium of international banks. Consequently, Havells undertook a two‐phased restructuring programme. Sylvania Europe: Revenue (mn euros) Sylvania Europe: EBITDA (mn euros) and OPM
Source: Company, PhillipCapital India Research Sylvania LatAm & USA: Revenue (mn euros) Sylvania LatAm & USA: EBITDA (mn euros) and OPM
Source: Company, PhillipCapital India Research While Sylvania gradually stabilized operationally, the company has been encountering some headwinds in the form of provisioning for pension liabilities. The fluctuating bond yields compelled the company to make provisions for the shortfall in their liabilities. Consequently, Sylvania has been in the red on the net profit front for a few quarters in FY15. Importantly, since these provisions are a non‐cash item, Sylvania has had no difficulty in meeting its debt repayment obligations. However, a more pressing worry for Sylvania is the reducing traction in revenues as consumers switch from CFL to LED‐based lighting. While the company is aligning its operations by stepping up its outsourcing of LED components and cutting down its CFL manufacturing operations, it could be a few quarters until a sustainable growth in revenues is achieved.
50
55
60
65
70
75
80
‐10%
‐5%
0%
5%
10%
15%
‐6
‐4
‐2
0
2
4
6
8
10
12 Operating Profit OPM %
20
25
30
35
40
45
1QFY11
2QFY11
3QFY11
4QFY11
1QFY12
2QFY12
3QFY12
4QFY12
1QFY13
2QFY13
3QFY13
4QFY13
1QFY14
2QFY14
3QFY14
4QFY14
1QFY15
2QFY15
3QFY15
4QFY15
1QFY16
0%
2%
4%
6%
8%
10%
12%
0
1
2
3
4
5 Operating ProfitOPM %

HAVELLS INDIA LTD RE‐INITIATING COVERAGE
Financials Havells’ Indian operations have always been on a firm footing, clocking consistent improvement in revenues over the past six years. Backed by an aggressive advertising campaign and regular launches of products, its monthly revenues currently hover around Rs 4.3bn (vs. Rs 2.4bn five years ago). An increase in scale of operations, coupled with its focus on product quality and tight controls on costs, has ensured that its OPM has inched up 150bps — from FY11 to 13.3% in FY15. In its international operations, Sylvania’s operations and financials have been a mixed bag. While the operational performance of the company has been satisfactory, developments on the pension liability have negatively impacted overall numbers. We expect Havells’ domestic revenues in FY16 at Rs 58bn, with an OPM of 13.5% and Rs 5bn in PAT. The muted state of the economy will reflect in the overall performance of the company across its traditional verticals (cables and wires, lighting, switchgear); however, fresh momentum could emerge because of two reasons: 1. Increasing penetration: Havells is augmenting its dealer network in India’s
quality and price‐conscious hinterland, currently serviced by the unorganized sector. The management is simultaneously bolstering its after‐sales service network in new geographies in order to enhance customer experience.
2. Added focus on new price segments: While the company has traditionally been associated with products from the premium segment, Havells is gradually extending the price points it addresses across several key product categories. It has already achieved price segmentation into the economy and luxury sub‐segments in product lines such as switchgear and fans. The company plans to extend this strategy to other product lines as well.
S.A. ‐ OP (Rs bn) and margin trend (%) Cons. ‐ OP (Rs bn) and margin trend (%)
Source: Company, PhillipCapital India Research
0
2
4
6
8
10
12
14
16
1
3
4
6
7
9
10 Operating Profit OPM (%)
0%
2%
4%
6%
8%
10%
12%
0.0
2.5
5.0
7.5
10.0
12.5 Operating Profit OPM (%)

HAVELLS INDIA LTD RE‐INITIATING COVERAGE
S.A. PAT (Rs bn) Cons. PAT (RS bn)
Source: Company, PhillipCapital India Research We expect Havells to maintain the tempo in revenue growth and cash‐flow generation with FY16 domestic revenues and EBIDTA at Rs 58bn and Rs 7.8bn and PAT at Rs 5bn. About Sylvania, we are not very hopeful of a recovery in Europe and see revenues settling at € 518mn in FY16. While sales might see a marginal dip in Europe, revenues from Latin America could take up the slack. On the profitability front, we expect a combination of cost control measures in Europe coupled with operating leverage in the Americas to enable the company to clock € 16mn in FY16 EBIDTA, without accounting for any extraordinary items. The crucial factor is the generation of sustainable cash flows, which would enable Havells to meet Sylvania’s debt‐reduction obligations without necessitating the latter’s recapitalisation. We expect the company to register consolidated revenues of Rs 94bn and Rs 105bn in FY16 and FY17 respectively, EBIDTA at ~Rs 9bn and Rs 10.8bn, and corresponding PAT at Rs 5.3bn and Rs 6.4bn. S.A debt/ equity Cons. debt /equity
Source: Company, PhillipCapital India Research
‐
1,000
2,000
3,000
4,000
5,000
6,000
7,000 PAT
(3,000)(2,000)(1,000)
‐1,000 2,000 3,000 4,000 5,000 6,000 7,000 PAT
‐
0.60
1.20
1.80
2.40
3.00 Debt/Equity (x)
‐
0.05
0.10
0.15
0.20
0.25 Debt:Equity (x)

HAVELLS INDIA LTD RE‐INITIATING COVERAGE
Cash from operations trend
Source: Company, PhillipCapital India Research Outlook and valuations Havells’ domestic business has an extremely impressive growth record. It is indeed creditable that the company has increased its monthly revenues from Rs 1.4bn in FY07 to Rs 4.4bn at present without leveraging its balance sheet. While Sylvania’s sedate performance would prove to be a drag on overall return ratios, we believe that the international business will not require any infusion of cash from the parent and will be able to meet its debt repayment obligations from its own cash flows. However, in the event of an unforeseen recovery in Europe, the business could generate some operating leverage and cash flows. Sylvania’s performance in Latin America holds promise and could improve the profitability profile of the entity over the next 2‐3 years. We have ascribed an earnings multiple of 28x to the standalone FY17 profits of Rs 6bn while assigning a multiple of 6x to Sylvania’s FY17 EBIDTA of Rs 475mn. We arrive at a target of Rs 297, which represents an upside of 15% from current levels. We initiate coverage with a BUY recommendation.
(2)
‐
2
4
6
8
10
FY07 FY08 FY09 FY10 FY11 FY12 FY13 FY14 FY15 FY16E FY17E

HAVELLS INDIA LTD RE‐INITIATING COVERAGE
Financials Income Statement Y/E Mar, Rs mn FY14 FY15 FY16e FY17eNet sales 81,858 85,698 93,952 105,664Growth, % 12.9% 4.7% 9.6% 12.5%Raw Material expenses 46,398 48,292 52,758 59,635Operating expenses 17,167 18,316 19,539 21,457Employee expenses 10,869 11,875 12,632 13,515EBITDA (Core) 7,425 7,215 9,023 11,056Growth, % 11.0% ‐2.8% 25.1% 22.5%Margin, % 9.1% 8.4% 9.6% 10.5%Depreciation 1,155 1,389 1,650 1,844EBIT 6,270 5,827 7,373 9,213Growth, % 12.1% ‐7.1% 26.5% 25.0%Margin, % 7.7% 6.8% 7.8% 8.7%Interest paid 741 642 250 171Other Non‐Operating Income 413 505 400 400Pre‐tax profit 5,941 5,690 7,522 9,441Tax provided 1,478 1,836 2,181 2,787Profit after tax 4,463 3,854 5,342 6,655( ‐ ) Exceptional Expenses Net Profit 4,463 3,854 5,342 6,655Growth, % 15.3% ‐13.7% 38.6% 24.6%Margin, % 5.5% 4.5% 5.7% 6.3%Net Profit (adjusted) 4,463 3,854 5,342 6,655 Balance Sheet Y/E Mar, Rs mn FY14 FY15 FY16e FY17eCash & bank 8,819 7,775 10,249 14,485Debtors 10,005 6,232 6,785 7,631Inventory 14,934 13,663 14,863 16,556Loans & advances 2,920 2,304 2,304 2,304Other current assets 197 1,972 1,972 1,972Total current assets 36,876 31,946 36,174 42,948Gross fixed assets 36,460 37,133 38,332 39,442Less: Depreciation 20,451 21,840 23,490 25,334Add: Capital WIP 439 500 482 490Net fixed assets 16,447 15,793 15,325 14,598Total assets 53,323 47,739 51,498 57,547Current liabilities 20,630 18,690 20,053 22,338Provisions 7,326 8,046 8,046 8,046Total current liabilities 27,957 26,735 28,098 30,383Debt 8,240 2,960 2,260 1,560Deferred Tax Liability 467 ‐138 ‐138 ‐138Total liabilities 36,663 29,557 30,220 31,805Paid‐up capital 624 624 624 624Reserves & surplus 16,036 17,557 20,654 25,117Shareholders’ equity 16,660 18,182 21,278 25,741Total equity & liabilities 53,323 47,739 51,498 57,547 Source: Company, PhillipCapital India Research Estimates
Cash Flow Y/E Mar, Rs mn FY14 FY15 FY16e FY17ePre‐tax profit 5,941 5,690 7,522 9,441Depreciation 1,155 1,389 1,650 1,844Chg in working capital 1,719 2,664 (390) (254)Total tax paid (1,336) (1,836) (2,181) (2,787)Other operating activities 1,201 137 (150) (229)Cash flow from operating activities 8,681 8,043 6,452 8,015Capital expenditure (1,733) (1,533) (1,182) (1,117)Other investing activities (2,029) 505 400 400Cash flow from investing activities (3,762) (1,029) (782) (717)Free cash flow 4,919 7,014 5,670 7,298Debt raised/(repaid) (748) (5,279) (700) (700)Dividend (incl. tax) (1,826) (2,192) (2,192) (2,192)Other financing activities (524) (642) (250) (171)Cash flow from financing activities (3,097) (8,113) (3,142) (3,063)Net chg in cash 1,822 (1,098) 2,528 4,235 Valuation Ratios
FY14 FY15 FY16e FY17ePer Share dataDil. EPS (INR) 7.2 6.2 8.6 10.7Growth, % ‐23% ‐83% 39% 25%Book NAV/ FD share (INR) 26.7 29.1 34.1 41.3CEPS (INR) 45.0 8.4 11.2 13.6CFPS (INR) 13.9 12.9 10.3 12.8DPS (INR) 2.5 3.0 3.0 3.0Return ratiosReturn on assets (%) 17.6 18.3 22.8 24.5Return on equity (%) 28.7 22.1 27.1 28.3Return on capital employed (%) 27.5 27.3 35.0 38.0Turnover ratios Sales/Total assets (x) 3.3 4.2 4.2 4.0Sales/Net FA (x) 7.3 7.6 8.7 10.4Working capital/Sales (x) 0.1 0.1 0.1 0.1Fixed capital/Sales (x) 0.1 0.1 0.1 0.1Receivable days 44.0 26.2 26.0 26.0Inventory days 72.2 62.7 63.0 63.0Loans, Adv (days) 13.7 18.0 16.4 14.6Payable days 99.8 85.7 85.0 85.0Working capital days 30.2 21.1 20.4 18.6Liquidity ratios Current ratio (x) 1.3 1.2 1.3 1.4Quick ratio (x) 0.8 0.7 0.8 0.9Interest cover (x) 8.6 9.2 28.9 50.6Dividend cover (x) 2.9 2.1 2.9 3.6Total debt/Equity (%) 0.5 0.2 0.1 0.1Net debt/Equity (%) (0.0) (0.3) (0.4) (0.5)Valuation PER (x) 36.2 41.9 30.3 24.3PEG (x) ‐ y‐o‐y growth (1.6) (3.1) 0.8 1.0Price/Book (x) 9.7 8.9 7.6 6.3Yield (%) 1.0 1.2 1.2 1.2EV/Net sales (x) 0.4 1.8 1.6 1.4EV/EBITDA (x) 4.0 20.3 16.3 13.0EV/EBIT (x) 4.7 24.8 19.8 15.5

INSTITUTIONAL EQUITY RESEARCH
Finolex Cables Ltd (FNXC IN) In a sweet spot INDIA | MIDCAP‐ELECTRICALS | Initiating Coverage
13 October 2015
As one of India's largest manufacturers of electrical wires & cables (EWC), Finolex has the most extensive product portfolio in the industry at present. It is an established player with market leadership in southern and western India, and has gradually expanded its reach to other parts of the country over the past couple of years. While largely an EWC player, Finolex also manufactures telecommunication cables. Formidable scale and reach Finolex has one of the largest distribution networks in the domestic EWC segment. It has 3,500 dealers and distributors in its traditional strongholds of south and west India, with over 500 channel partners in the north. Its market leadership in southern and western India and steadily improved EBIDTA over the years, despite negligible advertising, is a testament to its brand equity and customer recall. Capacity expansion and new product lines It has planned a capex of Rs 1.25bn in FY16 for production of fans and expansion of its core EWC capacity. Along with a gradual ramp up of products like switches and LED lights, Finolex should be able to leverage its extensive channel network to effect growth in revenues and cash flows. This should also bring down the logistics costs of distribution in new territories, thereby becoming margin‐accretive in the long run. This could also set the stage for a possible foray into other allied products at a later stage, through the outsourcing model. Derivative contracts wrapped up Over FY06‐13, Finolex suffered losses of Rs 3.1bn on derivative contracts, entered into originally as a hedge to its ECB. This constituted a serious overhang on valuations, as the extent of losses suffered because of these derivatives was uncertain and fluctuated wildly. However, over the years, the company has gradually wound down such exposure and has wrapped up all such instruments in FY15. With no risk to profits and cash flows, the company would be able to command better valuation multiples. Valuation As one of the oldest in the Indian EWC space, Finolex has successfully demonstrated the robustness of its business model through steady operational profitability. Having put its derivative losses behind, the company continues focus on expanding scale in existing products, in addition to launching new products and widening its already extensive distribution network. The lateral expansion of its product profile and increased channel sweating in conjunction with a strong velocity of working capital churn have the potential to improve its revenue streams significantly. At the CMP of Rs 232, the stock quotes at a discount to its peers in the EWC space, rendering it a strong candidate for re‐rating. Hence, we initiate coverage with a Buy recommendation and price objective of Rs 323 (based on our FY17 estimates), which represents an upside of 39% from its current price.
BUY CMP RS 232 TARGET RS 323 (+39%) COMPANY DATA O/S SHARES (MN) : 153MARKET CAP (RSBN) : 35MARKET CAP (USDBN) : 0.552 ‐ WK HI/LO (RS) : 306 / 212LIQUIDITY 3M (USDMN) : 0.4PAR VALUE (RS) : 2 SHARE HOLDING PATTERN, % Jun 15 Mar 15 Dec 14PROMOTERS : 35.9 35.9 35.9FII / NRI : 8.2 9.7 9.4FI / MF : 14.2 12.8 12.3NON PRO : 7.9 8.0 7.9PUBLIC & OTHERS : 29.8 29.8 30.5 PRICE PERFORMANCE, %
1MTH 3MTH 1YRABS ‐1.9 ‐8.5 5.8REL TO BSE ‐6.9 ‐5.7 3.5 PRICE VS. SENSEX
Source: Phillip Capital India Research KEY FINANCIALS Rs mn FY15 FY16E FY17ENet Sales 24,491 25,743 30,301EBIDTA 2,598 2,868 3,808Net Profit 1,987 2,036 2,748EPS, Rs 13.0 13.3 18.0PER, x 17.9 17.4 12.9EV/EBIDTA, x 10.2 9.4 6.8P/BV, x 2.8 2.5 2.2ROE, % 16.8 15.1 17.8
Source: PhillipCapital India Research Est. Amol Rao (+ 9122 6667 9952) [email protected] Deepak Agarwal (+ 9122 6667 9944) [email protected]
0100200300400500600700
Apr‐13 Apr‐14 Apr‐15
Finolex BSE Sensex

FINOLEX CABLES LTD INITIATING COVERAGE
Strong bouquet of products Over the past several decades, Finolex has carved an enviable niche for itself in the domestic EWC market, characterised by fierce competition and sizeable presence of unregulated operators (~40% of the overall market). The soundness of its business model arises from its three pillars of operations: A comprehensive product basket, distribution reach and ‘best‐in‐class’ scale in manufacturing. Finolex – revenue break up
Source: Company, PhillipCapital India Research Comprehensive product portfolio The company manufactures electrical wire, which make up 85% of its revenues. It has one of the most extensive product baskets in the EWC arena, with more than 4,500 SKUs in the range of 1.1kV to 66kV. Consequently, its products find numerous applications from household wiring to automobiles to intra‐city power distribution. This, in turn, has enabled it to tap various end‐user industries and diversify its clientele. The mix of distribution‐based and institutional sales is ~60:40. The company also manufactures telecommunications cables (TC), which comprise 8% of its turnover. Here, its product repertoire extends from optic‐fibre cables (OFC) to jelly‐filled telecom cables (JFTC). This business is largely a tender‐based institutional‐buyer segment. The company also has minuscule sales of lamps, both CFL and LED, and electrical switches, which account for 1% of revenues and are sold through the distribution channels for EWC products. Product profile Electrical Cables Communication Cables Copper Rod Lighting Switchgear 1. Auto & battery wiring 1. Lan cables 1. Continuous cast copper rod 1. CFL 1. Household switches
2. UPS cables 2. Speaker & VSAT cables 2. FTL 2. Commercial grade switches
3. Underground LV & HV cables 3. JFTC & OFC 4. Submersile pumps & electrical Motors 4. Co axial cables Superlative manufacturing scale and reach With an estimated capacity of 3.1m ckm, the company is one of the top‐three domestic manufacturers of wires and cables — only peers like Polycab and Havells have comparable manufacturing scale. Its various products in the EWC range are manufactured at its plants in Maharashtra and Goa. Interestingly, Finolex manufactures copper rods (CR), the raw material for its EWC products, thereby facilitating backward integration. A rated capacity of 60,000 tonnes and current utilisation of 55% allows it to control the quality and cost of its most crucial input. This also contributes to lower rejection rates and better throughput in the EWC operations. Against the backdrop of its present manufacturing operations, it is hardly surprising that a bulk of its revenues results from western and southern India. Our channel checks have indicated that it has a formidable presence and strong brand recall in these regions. Additionally, it has a superlative reputation for product quality and is considered an industry benchmark. In FY15, it had ~3,500 distributors and dealers in
Finolex CableRevenue FY15 Rs 25.6bn
Electrical CablesRevenue Rs 22bn
Communication Optic Fiber Cables Revenue Rs 2.5bn
Continuous Cast Copper Rods
Revenue Rs1bn

FINOLEX CABLES LTD INITIATING COVERAGE
these geographical areas. Approximately 90% of its average monthly sales of Rs 1.8bn came from the west and south of India. Chart: Electrical cables production (MT)
Source: Company, PhillipCapital India Research
Promising expansions on the anvil The management has outlined a three‐pronged strategy for future growth. Finolex is gradually diversifying its geographical base of revenues by widening its dealer network in fresh territories in northern and central India. In the past several quarters, through the gradual addition of ~600 dealers and distributors, it has made tentative inroads with its EWC range in these regions. The second leg of its strategy involves augmenting its existing EWC portfolio. The company has decided to increase capacities across its household wiring range and is also adding some products to its repertoire. The management has outlined a capex of Rs 1.2bn on expanding manufacturing capacities — While Rs 700m will be spent for installing a capacity of 2.4mn fans, the rest will be the cost for expansion of its existing EWC capacity. The management is set to expand its product basket in order to improve its ‘channel‐sweating’. With an envisaged a capex of Rs 700mn, Finolex is venturing into the manufacture of fans (capacity of 2.4mn fans p.a) by 4QFY16. It plans to simultaneously ramp up its existing sales of outsourced products like LED lighting products, switchgear, and lighting fixtures in a phased manner. Capex trend
Source: Company, PhillipCapital India Research
24,636
23,211
27,757
28,906
32,669
33,297
45,348
50,445
54,423
50,716
56,213
64,410
0
10,000
20,000
30,000
40,000
50,000
60,000
70,000
FY06
FY07
FY08
FY09
FY10
FY11
FY12
FY13
FY14
FY15
FY16
e
FY17
e
Production (MT)
0
200
400
600
800
1000
1200
FY07 FY08 FY09 FY10 FY11 FY12 FY13 FY14e FY15e FY16e FY17e
Capex (Rsmn)

FINOLEX CABLES LTD INITIATING COVERAGE
Core business on a strong footing Despite its rocky experience with forex derivatives, its focus on its core EWC business hasn’t wavered. It has steadily expanded operations to capitalise on stable demand for these products. Consequently, the segment has registered a 16% CAGR in revenue over FY06‐15. In this period, it has delivered 17% CAGR in segment profits, with the margin stabilising at ~12% over the past three years. The noteworthy aspect here is that the company has achieved this growth without compromising its terms of trade or significant capex. In fact, core working capital over the years has steadily come down to ~45 days at present from ~60 days earlier. Revenue break up trend
Source: Company, PhillipCapital India Research Smaller businesses not a drain As mentioned earlier, the company has three other businesses, which bring in ~15% of revenues. The largest of these is the telecom cables (TC) business, set up in the 1980s. Its products are part of its legacy business and are self‐sustaining in terms of demand and working capital churn. The profit margin in this business is pedestrian at best, and the RoCE has fluctuated wildly, depending on price and profitability. The TC segment comprises only 10% of its revenue and doesn’t significantly alter its overall return ratios. The copper rods business (CR) is minuscule (~4% of revenue) and commands very low margins. However, it plays a vital part in the EWC and TC businesses, as it facilitates backward integration in these divisions apart from ensuring stable throughput and quality control. ROCE and ROE trend
Source: Company, PhillipCapital India Research
8 9 9 11 14
18 21 20 22 23
27
1 1 1
1 1
2 2 2
2 3
3
2 3 3
4
5 2
1 1 1 1
1
2 3 2
2
2 0 0 0
0 1
1
0
5
10
15
20
25
30
35
FY07 FY08 FY09 FY10 FY11 FY12 FY13 FY14 FY15 FY16e FY17e
Electrical Cables Communication Cables Copper Rods Others
‐10
‐5
0
5
10
15
20
25
FY07 FY08 FY09 FY10 FY11 FY12 FY13 FY14e FY15e FY16e FY17e
RoE (%) RoCE (%)

FINOLEX CABLES LTD INITIATING COVERAGE
Financials As one of the most reputed companies in the domestic EWC segment, Finolex has consistently expanded its product profile and scale, thereby monetising its brand to the hilt. Its operating performance has closely mirrored the fortunes of the Indian economy over the past 10 years, from FY06 to FY15, when its revenues and EBIDTA rose at CAGRs of 16% each. Interestingly, even at the PAT level, it registered 20% CAGR in the past 10 years, conveying that it has comfortably managed to tide over the fiasco of forex derivatives and sudden shock of commodity prices in FY09. Operating matrix Copper as a major RM cost
Source: Company, PhillipCapital India Research Continuous improvement in balance sheet – Networth trend...
Source: Company, PhillipCapital India Research While it lost ~Rs 3.6bn from FY08 to FY13 in the currency derivatives fiasco, the company has always been operationally firm. Finolex earned a cumulative EBIDTA of Rs 5.7bn during the same period and undertook a capex of Rs 3.8bn while deleveraging by Rs 1bn. While the balance sheet did come under some pressure, Finolex managed to contain interest payouts (as percentage of revenue) to 1.5%‐1.8%, and always generated cash flows from operations. The exception in both cases was FY09, when it (and its peers) grappled with severe global headwinds arising from the financial meltdown.
11.1 12.6
(2)
0
2
4
6
8
10
12
14
40
50
60
70
80
90
100
FY07
FY08
FY09
FY10
FY11
FY12
FY13
FY14
e
FY15
e
FY16
e
FY17
e
RM Cost S&D Exp. Personnel CostsManf. Exp. Power OPM (RHS)
8 11 10
12 16 16 17 17 17 18
21 79.1 79.8
75.9
79.6
83.6
85.9
81.9 81.9
78.0
81.4 81.4
68
72
76
80
84
88
0
5
10
15
20
25 Total RM Cost (INRbn) Copper as % of total RM
5.5
7.5
9.5
11.5
13.5
15.5
17.5
FY07 FY08 FY09 FY10 FY11 FY12 FY13 FY14e FY15e FY16e FY17e

FINOLEX CABLES LTD INITIATING COVERAGE
EBITDA and margin trend PAT CAGR at 18% from FY15 to FY17
Source: Company, PhillipCapital India Research A closer inspection of its performance over the past decade reveals that with the exception of FY09, profitability has been fairly steady, hovering at around 10% — this is extremely creditable, considering the commoditised nature of the primary product and the keenly competitive business landscape. Additionally, it has consistently maintained creditable return ratios over the past three years through a mix of judicious capex and steady asset sweating. Its foray into fans and imminent ramp up of utilization in its EWC business show promise. The expansion of its product basket through outsourced products puts it in a position to pump its channels, thereby increasing ‘channel‐throughput’. This has the potential to not only boost revenues and cash flows, but also return ratios from the ruling levels of ~19‐20%. We expect Finolex to clock revenue of Rs 26bn (5% yoy growth) in FY16, while its OPM should come in at 11.2% (a 70bps yoy improvement), following efficiencies derived from improved scale at its plants in Pune and Goa; it could end the fiscal (FY16) with Rs 2.1bn in profits. However, FY17 is where we see traction emerging in its revenues and cash flows. We estimate 18% growth in turnover to Rs 30bn, as it commissions and stabilises its fans facility. The introduction of outsourced products, greater scale, and deeper market penetration should facilitate margin improvement of 120bps to 12.6% and net profits of Rs 2.9bn. Net cash flow Debt:Equity to remain negligible
Source: Company, PhillipCapital India Research
‐3%
0%
3%
6%
9%
12%
15%
‐1,000
0
1,000
2,000
3,000
4,000
5,000EBITDA (Rs mn) EBITDA Margin (rhs)
690
889
‐355
577
868
982
1,45
3
2,07
7
1,98
7
2,03
6
2,74
8
(1,000)
(500)
‐
500
1,000
1,500
2,000
2,500
3,000
FY07
FY08
FY09
FY10
FY11
FY12
FY13
FY14
FY15
FY16
e
FY17
e
PAT (Rs mn)
0.8
0.1
2.2
1.0
0.4
2.1
1.6
2.2
1.8
2.2
2.8
0.0
0.5
1.0
1.5
2.0
2.5
3.0
2,65
4
2,87
7
2,95
8
2,75
2
1,26
2
1,54
5
1,62
3
1,28
5
512
515
606
0.5 0.4 0.5
0.4
0.2 0.2 0.2 0.1
0.0 0.0 0.0 ‐
0.1
0.2
0.3
0.4
0.5
0.6
0
500
1,000
1,500
2,000
2,500
3,000
3,500Debt (Rs Mn) Debt:Equity (x)

FINOLEX CABLES LTD INITIATING COVERAGE
Outlook and valuations Finolex has successfully exorcised the spectre of its derivatives trades and is firmly focused on leveraging its distribution network through a judicious mix of geographical and product expansion. Despite the economic slump and commodity price correction, the company has maintained a strong balance sheet and robust cash flows. Introduction of new products will enable the company to monetize its vast distribution network, which in turn, should bolster the float generation in the business. In the backdrop of its operational strengths and financial soundness, we believe that the valuation gap between Finolex and its peers in the electrical industry will narrow. At the CMP of Rs 232, the stock trades at a P/E of 12.9x and EV/EBIDTA of 6.8x discounting its FY17 earnings. Assigning an earnings multiple of 18x, we arrive at a price target of Rs 323, representing a 39% upside. Hence, we initiate coverage with a BUY recommendation.

FINOLEX CABLES LTD INITIATING COVERAGE
Financials
Income Statement Y/E Mar, Rs mn FY14 FY15 FY16e FY17eNet sales 23,590 24,491 25,743 30,301Growth, % 3.9% 3.8% 5.1% 17.7%Raw Material expenses 17,328 17,884 18,538 21,478Operating expenses 2,932 3,070 3,303 3,857Employee expenses 848 940 1,034 1,158EBITDA (Core) 2,482 2,598 2,868 3,808Growth, % 8.2% 4.7% 10.4% 32.8%Margin, % 11% 11% 11% 13%Depreciation 484 640 754 809EBIT 1,998 1,958 2,115 2,999Growth, % 9.2% ‐2.0% 8.0% 41.8%Margin, % 8% 8% 8% 10%Interest paid 145 137 51 56Other Non‐Operating Income 484 585 450 450Non‐recurring Items 104 225 0 0Pre‐tax profit 2,337 2,406 2,513 3,393Tax provided 363 645 478 645Profit after tax 1,973 1,761 2,036 2,748Net Profit 1,973 1,761 2,036 2,748Growth, % 17.3% ‐10.7% 15.6% 35.0%Margin, % 8.4% 7.2% 7.9% 9.1%Net Profit (adjusted) 1,973 1,761 2,036 2,748No. of Eq. Sh O/S (m nos) 153 153 153 153 Balance Sheet Y/E Mar, Rs mn FY14 FY15 FY16e FY17eCash & bank 649 1,384 2,519 4,770Debtors 1,452 1,186 1,355 1,595Inventory 3,524 3,186 3,177 3,680Loans & advances 918 935 935 935Other current assets 1 0 0 0Total current assets 6,543 6,692 7,986 10,980Investments 4,031 4,942 4,942 4,942Gross fixed assets 10,612 10,975 11,752 12,252Less: Depreciation 5,653 6,338 7,091 7,900Add: Capital WIP 107 67 400 400Net fixed assets 5,066 4,705 5,061 4,752Total assets 15,640 16,338 17,989 20,674Current liabilities 2,117 2,408 2,415 2,796Provisions 909 469 469 469Total current liabilities 3,026 2,877 2,884 3,266Debt 1,285 512 515 606Deferred Tax Liability 295 301 301 301Total liabilities 4,606 3,690 3,699 4,172Paid‐up capital 306 306 306 306Reserves & surplus 10,728 12,342 13,985 16,196Shareholders’ equity 11,034 12,648 14,290 16,502Total equity & liabilities 15,640 16,338 17,989 20,674 Source: Company, PhillipCapital India Research Estimates
Cash Flow Y/E Mar, Rs mn FY14 FY15 FY16e FY17ePre‐tax profit 2,440 2,631 2,513 3,393Depreciation 484 640 754 809Chg in working capital ‐152 ‐470 ‐153 ‐361Total tax paid ‐219 ‐474 ‐478 ‐645Other operating activities ‐318 ‐482 ‐399 ‐394Cash flow from operating activities 2,236 1,845 2,238 2,803Capital expenditure ‐953 ‐321 ‐1,110 ‐500Chg in investments ‐46 297 0 0Other investing activities 327 336 450 450Cash flow from investing activities ‐672 312 ‐660 ‐50Free cash flow 1,564 2,157 1,578 2,753Debt raised/(repaid) ‐356 ‐203 2 91Dividend (incl. tax) ‐214 ‐286 ‐394 ‐537Other financing activities ‐41 89 ‐51 ‐56Cash flow from financing activities (611) (401) (443) (502)Net chg in cash 954 1,757 1,136 2,251 Valuation Ratios
FY14 FY15 FY16e FY17ePer Share data Dil. EPS (INR) 13.6 13.0 13.3 18.0Growth, % 43.0 (4.4) 2.5 35.0Book NAV/ FD share (INR) 72.1 82.7 93.4 107.9CEPS (INR) 16.7 17.2 18.2 23.3CFPS (INR) 14.6 12.1 14.6 18.3DPS (INR) 1.6 1.8 2.2 3.0Return ratiosReturn on assets (%) 12.6 10.8 11.3 13.3Return on equity (%) 20.5 16.8 15.1 17.8Return on capital employed (%) 20.8 19.5 18.0 21.2Turnover ratiosSales/Total assets (x) 2.0 1.9 1.8 1.8Sales/Net FA (x) 5.1 5.6 5.8 7.3Working capital/Sales (x) 0.1 0.2 0.2 0.3Fixed capital/Sales (x) 0.2 0.2 0.2 0.2Receivable days 22.2 17.4 18.0 18.0Inventory days 60.1 52.4 50.0 50.0Loans, Adv (days) 14.0 13.7 13.1 11.1Payable days 36.1 39.6 38.0 38.0Working capital days 60.2 44.0 43.1 41.1Liquidity ratios Current ratio (x) 2.2 2.3 2.8 3.4Quick ratio (x) 1.0 1.2 1.7 2.2Interest cover (x) 18.7 20.2 55.3 64.5Dividend cover (x) 8.5 7.2 6.1 6.0Total debt/Equity (%) 0.1 0.0 0.0 0.0Net debt/Equity (%) 0.1 (0.1) (0.1) (0.3)Valuation PER (x) 17.1 17.9 17.4 12.9PEG (x) ‐ y‐o‐y growth 0.4 (4.1) 7.0 0.4Price/Book (x) 3.2 2.8 2.5 2.2Yield (%) 0.7 0.8 0.9 1.3EV/Net sales (x) 1.4 1.3 1.2 1.0EV/EBITDA (x) 11.4 10.2 9.4 6.8EV/EBIT (x) 13.6 12.7 12.2 8.4
INSTITUTIONAL EQUITY RESEARCH
V‐Guard Industries Ltd (VGRD IN) Breaking out of the south INDIA | MIDCAP‐ELECTRICALS | Initiating Coverage
13 October 2015
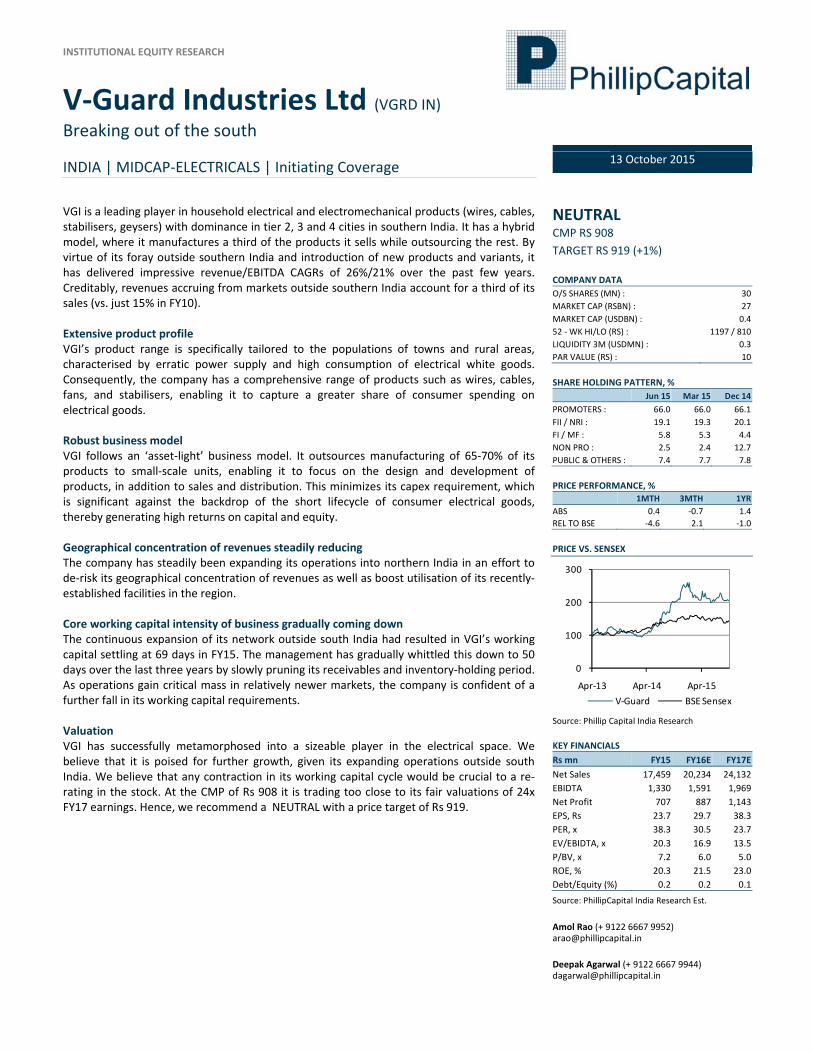
VGI is a leading player in household electrical and electromechanical products (wires, cables, stabilisers, geysers) with dominance in tier 2, 3 and 4 cities in southern India. It has a hybrid model, where it manufactures a third of the products it sells while outsourcing the rest. By virtue of its foray outside southern India and introduction of new products and variants, it has delivered impressive revenue/EBITDA CAGRs of 26%/21% over the past few years. Creditably, revenues accruing from markets outside southern India account for a third of its sales (vs. just 15% in FY10). Extensive product profile VGI’s product range is specifically tailored to the populations of towns and rural areas, characterised by erratic power supply and high consumption of electrical white goods. Consequently, the company has a comprehensive range of products such as wires, cables, fans, and stabilisers, enabling it to capture a greater share of consumer spending on electrical goods. Robust business model VGI follows an ‘asset‐light’ business model. It outsources manufacturing of 65‐70% of its products to small‐scale units, enabling it to focus on the design and development of products, in addition to sales and distribution. This minimizes its capex requirement, which is significant against the backdrop of the short lifecycle of consumer electrical goods, thereby generating high returns on capital and equity. Geographical concentration of revenues steadily reducing The company has steadily been expanding its operations into northern India in an effort to de‐risk its geographical concentration of revenues as well as boost utilisation of its recently‐established facilities in the region. Core working capital intensity of business gradually coming down The continuous expansion of its network outside south India had resulted in VGI’s working capital settling at 69 days in FY15. The management has gradually whittled this down to 50 days over the last three years by slowly pruning its receivables and inventory‐holding period. As operations gain critical mass in relatively newer markets, the company is confident of a further fall in its working capital requirements. Valuation VGI has successfully metamorphosed into a sizeable player in the electrical space. We believe that it is poised for further growth, given its expanding operations outside south India. We believe that any contraction in its working capital cycle would be crucial to a re‐rating in the stock. At the CMP of Rs 908 it is trading too close to its fair valuations of 24x FY17 earnings. Hence, we recommend a NEUTRAL with a price target of Rs 919.
NEUTRAL CMP RS 908 TARGET RS 919 (+1%) COMPANY DATA O/S SHARES (MN) : 30MARKET CAP (RSBN) : 27MARKET CAP (USDBN) : 0.452 ‐ WK HI/LO (RS) : 1197 / 810LIQUIDITY 3M (USDMN) : 0.3PAR VALUE (RS) : 10 SHARE HOLDING PATTERN, % Jun 15 Mar 15 Dec 14PROMOTERS : 66.0 66.0 66.1FII / NRI : 19.1 19.3 20.1FI / MF : 5.8 5.3 4.4NON PRO : 2.5 2.4 12.7PUBLIC & OTHERS : 7.4 7.7 7.8 PRICE PERFORMANCE, %
1MTH 3MTH 1YRABS 0.4 ‐0.7 1.4REL TO BSE ‐4.6 2.1 ‐1.0 PRICE VS. SENSEX
Source: Phillip Capital India Research KEY FINANCIALS Rs mn FY15 FY16E FY17ENet Sales 17,459 20,234 24,132EBIDTA 1,330 1,591 1,969Net Profit 707 887 1,143EPS, Rs 23.7 29.7 38.3PER, x 38.3 30.5 23.7EV/EBIDTA, x 20.3 16.9 13.5P/BV, x 7.2 6.0 5.0ROE, % 20.3 21.5 23.0Debt/Equity (%) 0.2 0.2 0.1
Source: PhillipCapital India Research Est. Amol Rao (+ 9122 6667 9952) [email protected] Deepak Agarwal (+ 9122 6667 9944) [email protected]
0
100
200
300
Apr‐13 Apr‐14 Apr‐15V‐Guard BSE Sensex

V‐GUARD INDUSTRIES LTD INITIATING COVERAGE
Extensive product basket VGI has forged its reputation by marketing products tailored to semi‐urban agglomerations as well as for in rural clusters in southern India, characterised by erratic electricity supply and conspicuous consumption of white goods (televisions, air conditioners, refrigerators). Its products encompass a large part of the value chain, ranging from cables, wires, and solar water heaters to electrical appliances such as stabilisers, UPSs, water heaters, pumps, and fans. Apart from regularly upgrading its products, the company follows the practice of launching products to capture a greater portion of spending on household electricals. This policy of having a well‐rounded product basket has enabled it to emerge as one of the market leaders in southern India, and translated to consistent revenue growth over the years. VGI Sales break‐up (Rs mn)
Source: Company, PhillipCapital India Research Asset‐light model VGI outsources the manufacturing of ~60% of its product range, while concentrating on product design and aesthetics. This is of particular significance given the shortening lifecycle of consumer electrical products. This has enabled it to rationalise its capex requirement and concentrate on designing and launching products at regular intervals, in addition to advertising and distribution. VGI operates through 536 distributors, 8,000 retailers and 235 service centres across the country. The ability to launch competitively priced and appropriately designed products, coupled with scaling‐up of its sales network in the past several years, has enabled it to register a 30% CAGR in revenue and profit in the last seven years. It tries to match its receivables and payables cycles of 50 days and 80 days with an inventory position of 60 days. This is a sharp improvement from FY12, when it had made a foray outside southern India on a large scale. Its working capital cycle had then ballooned to 70+ days due to increased credit to distributors and more inventory in the system. This situation has been gradually remedied with the increasing acceptance of the company’s brand and products. As the company ramps up its sales, we believe it will curtail the need to increase working capital by resorting to bill discounting. Additionally, it is slowly increasing the incidence of channel financing to help push the sales of its products.
0
2,000
4,000
6,000
8,000
10,000
12,000
14,000
FY10 FY11 FY12 FY13 FY14 FY15
PVC Wires & Cables Water Heaters Pumps Stabilisers
0
1,000
2,000
3,000
4,000
5,000
FY10 FY11 FY12 FY13 FY14 FY15
Fans Digital UPS Others

V‐GUARD INDUSTRIES LTD INITIATING COVERAGE
VGI: Growth in outsourced product revenue VGI: Working capital cycle
Source: Company, PhillipCapital India Research Geographical diversification of revenues Until FY09, VGI primarily operated in southern India (with minuscule sales in the rest of the country). This was because of an extremely mature sales‐and‐distribution network in the region, coupled with superior brand equity, which enabled it to grow without much effort. Additionally, its network and pedigree allowed it to test the market and launch products easily without much competition from domestic and international brands. In FY09, it decided to increase the scale of its operations and venture outside southern India. Apart from catering to the untapped demand from the rural hinterland outside southern India, another underlying reason for the geographical diversification was to reduce the regional concentration of revenues. In its new territories, it adopted the strategy to market and sell products that were well accepted in southern India. This strategy has paid off — in FY15, while ~67% of sales originated from the four southern Indian states of Andhra Pradesh, Karnataka, Kerala and Tamil Nadu, the remaining 33% (Rs 5.8bn) came from the rest of India, a steep improvement from Rs 139mn in FY08. VGI: Geographical break‐up of revenues
Source: Company, PhillipCapital India Research
0 1 1 1 2 3 4 5 7 7 7 81 2 2 2 3
4 6
8 9 11
13 16
0
5
10
15
20
25
30Manufactured Products Outsourced Products
56 55
0102030405060708090
100Working Capital (days)
76%
81%
79%
77%
74%
80%
78%
83%
73%
77%
77%
75%
69%
72%
70%
71%
65%
67%
68%
67%
67%
24%
19%
21%
23%
26%
20%
22%
17%
27%
23%
23%
25%
31%
28%
30%
29%
35%
33%
32%
33%
33%
0%
20%
40%
60%
80%
100%
1QFY11
2QFY11
3QFY11
4QFY11
1QFY12
2QFY12
3QFY12
4QFY12
1QFY13
2QFY13
3QFY13
4QFY13
1QFY14
2QFY14
3QFY14
4QFY14
1QFY15
2QFY15
3QFY15
4QFY15
1QFY16
Rest of India (%) South Zone (%)

V‐GUARD INDUSTRIES LTD INITIATING COVERAGE
Strong balance sheet, cash flows to improve Despite its heady growth in the past several years, VGI has maintained a healthy debt‐equity ratio. At its peak, in FY06, its gearing ratio reached 1x. Ever since, the management has used cash flows to deleverage its balance sheet and pay off term debt. At present, the company has term debt of Rs 285mn on its books. It intends to pay this off in the next couple of years. Additionally, working capital borrowings now stand at Rs 285mn (June 2015), which is backed by receivables and inventories. This is a creditable reduction from Rs 1 bn in September 2012. Lastly, the gearing ratio is extremely comfortable given an implied debt‐EBIDTA ratio of 0.5x. On the cash‐flow front, with the exception of FY10‐11 when the company was assiduously trying to ramp up sales, it has always posted positive operational cash‐flows. We expect it to maintain this trend and see its ‘free cash flow’ (FCF) positive status sustaining FY16E‐17. VGI: FCF and cash from operation (CFO) trend VGI: Debt: Equity to come down to 0.1x in FY17
Source: Company, PhillipCapital India Research
Financials We estimate VGI to clock revenues of Rs 20.2bn (up 16%) in FY16 with an OPM of 7.9%. Topline growth would primarily come from higher sales of manufactured products (wires and cables, SWH and pumps in northern India), as well as an increase in sales of outsourced products by a similar percentage in southern India. As the company consolidates its foothold outside southern India, we expect its focus on sales of manufactured products to generate slight operating leverage. Simultaneously, we estimate sales of outsourced product growth to maintain similar momentum. Additionally, as new branches set up in these territories achieve breakeven, margins should improve gradually. Hence, we expect the improvement in margins to be 30bps in FY16 to 7.9% and EBIDTA and net profit at Rs 1.6bn and Rs 887mn. We believe that the additional working capital required because of the jump in sales would be met internally without much working capital borrowing. This, coupled with the absence of capex and better asset sweating, should see the company maintain its FCF positive status into FY16. In FY17, we expect revenues to of Rs 24bn, and EBIDTA and OPM at Rs 2bn and 8.2%. We expect net profit at Rs 1.1bn, implying 29% growth.
588 629
897 937
(800)(600)(400)(200)
‐200 400 600 800
1,000 1,200
Mar‐07
Mar‐08
Mar‐09
Mar‐10
Mar‐11
Mar‐12
Mar‐13
Mar‐14
Mar‐15
Mar‐16e
Mar‐17e
FCF CFO
303
361
359
263
805
127
1,04
9
1,57
4
992
705
692 632
0.2 0.1
‐
0.2
0.4
0.6
0.8
1.0
1.2
0200400600800
1,0001,2001,4001,6001,800
Mar‐06
Mar‐07
Mar‐08
Mar‐09
Mar‐10
Mar‐11
Mar‐12
Mar‐13
Mar‐14
Mar‐15
Mar‐16e
Mar‐17e
Total Debt (LHS) Debt:Equity (x) (RHS)

V‐GUARD INDUSTRIES LTD INITIATING COVERAGE
VGI: EBITDA and OPM trend VGI: PAT – CAGR trend
Source: Company, PhillipCapital India Research While the company has always had superlative return ratios, we expect these metrics to sustain and improve slightly — the company’s RoCE should settle at ~30% in FY16‐17 while RoNW would be >21% from FY16. VGI: ROCE & ROE trend
Source: Company, PhillipCapital India Research Outlook and valuations VGI has successfully negotiated a tricky point in its existence by expanding its geographical base of operations while successfully managing its working capital funding. During FY10‐11, its working capital predictably bloated. However, by rationalizing its operations after stabilizing itself in newer territories, it has returned to efficient working‐capital levels. While we have factored in stable selling and distribution expenses into our calculations, higher utilisation of manufacturing capacities and a stable currency rate could generate a slight improvement in profitability in FY16‐17. We are convinced that VGI will continue to successfully monetise its brand equity in southern India while increasing channel sweating in the rest of the country. At a CMP of Rs 908, the stock trades at an FY17 P/E of 23.7x and EV/EBIDTA of 13.5x. Assigning an earnings multiple of 24x, we arrive at a price target of Rs 919. At CMP, the stock is fairly valued —we initiate coverage with a NEUTRAL recommendation.
184
262
298
314
504
730
935
1,09
9
1,22
5
1,33
0
1,59
1
1,96
9
10.8 11.8
10.7 9.9
11.1 10.1 9.7
8.1 8.1 7.6 7.9 8.2
0
2
4
6
8
10
12
14
0
500
1,000
1,500
2,000
2,500Mar‐06
Mar‐07
Mar‐08
Mar‐09
Mar‐10
Mar‐11
Mar‐12
Mar‐13
Mar‐14
Mar‐15
Mar‐16e
Mar‐17e
EBITDA OPM (%)
255
426508
629701 707
887
1,143
0
200
400
600
800
1,000
1,200
1,400
Mar‐10
Mar‐11
Mar‐12
Mar‐13
Mar‐14
Mar‐15
Mar‐16e
Mar‐17e
PAT
29.6 31.8
21.5 23.0
0
10
20
30
40
50
60
Mar‐06
Mar‐07
Mar‐08
Mar‐09
Mar‐10
Mar‐11
Mar‐12
Mar‐13
Mar‐14
Mar‐15
Mar‐16e
Mar‐17e
ROCE (%) ROE (%)

V‐GUARD INDUSTRIES LTD INITIATING COVERAGE
Financials
Income Statement Y/E Mar, Rs mn FY14 FY15 FY16e FY17eNet sales 15,176 17,459 20,234 24,132Growth, % 11.6% 15.0% 15.9% 19.3%Raw Material expenses 11,300 12,901 14,860 17,710Operating expenses 1,802 2,131 2,480 2,954Employee expenses 848 1,097 1,303 1,498EBITDA (Core) 1,225 1,330 1,591 1,969Growth, % 11.5% 8.5% 19.6% 23.8%Margin, % 8% 8% 8% 8%Depreciation 120 154 173 188EBIT 1,105 1,176 1,418 1,781Growth, % 12.2% 6.4% 20.6% 25.5%Margin, % 7% 7% 7% 7%Interest paid 211 206 182 176Other Non‐Operating Income 48 45 40 40Pre‐tax profit 943 1,014 1,277 1,645Tax provided 241 307 389 502Profit after tax 701 707 887 1,143Net Profit 701 707 887 1,143Growth, % 11.5% 0.8% 25.5% 28.8%Margin, % 4.6% 4.1% 4.4% 4.7%Net Profit (adjusted) 701 707 887 1,143No. of Eq. Sh O/S (m nos) 30 30 30 30 Balance Sheet Y/E Mar, Rs mn FY14 FY15 FY16e FY17eCash & bank 28 22 333 730Debtors 2,121 2,437 2,698 3,083Inventory 2,525 2,609 2,952 3,448Loans & advances 379 545 545 545Total current assets 5,053 5,613 6,528 7,806Gross fixed assets 2,280 2,374 2,682 2,990Less: Depreciation 618 773 945 1,134Add: Capital WIP 35 35 35 35Net fixed assets 1,697 1,636 1,772 1,891Total assets 6,750 7,249 8,300 9,697Current liabilities 2,161 2,239 2,589 3,078Provisions 317 436 436 436Total current liabilities 2,478 2,674 3,025 3,514Debt 992 705 692 632Deferred Tax Liability 95 92 92 92Total liabilities 3,565 3,472 3,809 4,238Paid‐up capital 298 300 300 300Reserves & surplus 2,886 3,478 4,191 5,160Shareholders’ equity 3,184 3,777 4,491 5,459Total equity & liabilities 6,750 7,249 8,300 9,697 Source: Company, PhillipCapital India Research Estimates
Cash Flow FY14 FY15 FY16e FY17e
Pre‐tax profit 943 1,014 1,277 1,645Depreciation 120 154 173 188Chg in working capital ‐23 ‐370 ‐253 ‐393Total tax paid ‐189 ‐307 ‐389 ‐502Other operating activities 257 161 142 136Cash flow from operating activities 1,108 653 949 1,075Capital expenditure ‐324 ‐94 ‐308 ‐308Chg in investments 25 0 0 0Other investing activities 19 45 40 40Cash flow from investing activities ‐280 ‐49 ‐268 ‐268Free cash flow 828 604 680 807Equity raised/(repaid) 0 1 0 0Debt raised/(repaid) ‐553 ‐287 ‐13 ‐60Dividend (incl. tax) ‐122 ‐157 ‐174 ‐174Other financing activities ‐243 ‐168 ‐182 ‐176Cash flow from financing activities (919) (610) (369) (410)Net chg in cash (91) (6) 311 397 Valuation Ratios
FY14 FY15 FY16e FY17ePer Share dataDil. EPS (INR) 23.5 23.7 29.7 38.3Growth, % 11.5 0.8 25.5 28.8Book NAV/ FD share (INR) 106.7 126.6 150.4 182.9CEPS (INR) 27.5 28.7 35.4 44.4CFPS (INR) 37.1 21.9 31.8 36.0DPS (INR) 4.5 4.5 5.0 5.0Return ratiosReturn on assets (%) 10.4 9.8 10.7 11.8Return on equity (%) 24.2 20.3 21.5 23.0Return on capital employed (%) 27.0 27.6 29.6 31.8Turnover ratios Sales/Total assets (x) 3.6 3.8 3.8 3.9Sales/Net FA (x) 9.1 10.9 11.6 13.0Working capital/Sales (x) 0.2 0.2 0.2 0.2Fixed capital/Sales (x) 0.1 0.1 0.1 0.1Receivable days 50.3 50.3 48.0 46.0Inventory days 65.2 58.2 57.0 56.0Loans, Adv (days) 9.0 11.2 9.7 8.1Payable days 55.8 50.0 50.0 50.0Working capital days 68.7 69.8 64.7 60.1Liquidity ratios Current ratio (x) 2.0 2.1 2.2 2.2Quick ratio (x) 1.0 1.1 1.2 1.2Interest cover (x) 4.9 5.2 6.8 8.6Dividend cover (x) 5.2 5.2 5.9 7.6Total debt/Equity (%) 0.3 0.2 0.2 0.1Net debt/Equity (%) 0.3 0.2 0.1 (0.0)Valuation PER (x) 38.6 38.3 30.5 23.7PEG (x) ‐ y‐o‐y growth 3.4 45.7 1.2 0.8Price/Book (x) 8.5 7.2 6.0 5.0Yield (%) 0.5 0.5 0.6 0.6EV/Net sales (x) 1.8 1.6 1.4 1.1EV/EBITDA (x) 22.0 20.3 16.9 13.5EV/EBIT (x) 24.3 22.8 18.9 14.9

INSTITUTIONAL EQUITY RESEARCH
Bajaj Electricals Ltd (BJE IN) In a muddle INDIA | MIDCAP‐ELECTRICALS | Initiating Coverage
13 October 2015
BEL is one of the largest and the most renowned Indian players in the domestic lighting and consumer electricals space, with a vast portfolio across both segments. A combination of different brands has enabled the company to develop a large customer base across various price points. BEL also has a projects business, where it undertakes engineering projects on a turnkey basis in street lighting, illumination solutions for commercial facilities, and rural electrification. Asset‐light model in consumer appliances and lighting BEL outsources more than 75% of its products in consumer appliances from small‐scale units, as it concentrates on design, development, sales, and distribution. It has a similar model in its lighting business, where most of its lighting products are sourced from its associate/group companies. This ‘asset‐light’ model helps curtail capex requirements, which is significant considering the short lifecycle of consumer electricals and appliances. Margins in appliances and lighting seeing a gradual decline Appliances and lighting businesses have accounted for more than two thirds of BEL’s since FY07. While the company has seen its revenues and cash flows swell over the past few years, margins in these businesses have declined gradually. The contraction in profitability is most pronounced in lighting, where consumer preference for LED lighting solutions resulted in a fall in revenues and margins in FY15. This diminution in margins and resultant weakening of cash flows is a slight cause for concern since it reduces the quantum of cash flows available for deployment in the projects business. Projects division recovering from a troubled past BEL started its electrical projects business to leverage its expertise in lighting and luminaires, and to usefully deploy its cash flows from its consumer‐facing businesses. With projects ranging from street lighting to solutions for sporting and industrial facilities, the company encountered success initially, but ran into trouble with more complex projects like transmission lines and rural electrification. It incurred cost overruns and consequently encountered cumulative EBIDTA losses of Rs 2.8bn from FY13‐15. While all un‐remunerative projects are now over, margins in this business are unlikely to be lucrative in the near term, given the limited improvement in the macro‐economic scenario. Further, timely financial closure of some larger projects could see delays in execution, resulting in lower‐than‐expected profitability or possibly even losses in this segment. Valuation BEL’s prospects hinge upon increasing traction in consumer businesses viz. appliances and lighting while simultaneously boosting the profitability of its projects vertical. The uncertainty surrounding the prospects of the latter coupled with its implications for the company’s cash flows and balance sheet compel us to value it at a discount to its peers in the domestic electrical business. BEL currently trades at a P/E of 20x and EV/EBIDTA of 10x, discounting our FY17 earnings. We initiate coverage with a SELL recommendation and a price target of Rs 206 (based on our FY17 numbers), a 16% downside from its CMP.
SELL CMP RS 246 TARGET RS 206 (‐16%) COMPANY DATA O/S SHARES (MN) : 101MARKET CAP (RSBN) : 25MARKET CAP (USDBN) : 0.452 ‐ WK HI/LO (RS) : 310 / 191LIQUIDITY 3M (USDMN) : 1.2PAR VALUE (RS) : 2 SHARE HOLDING PATTERN, % Jun 15 Mar 15 Dec 14PROMOTERS : 63.0 63.1 65.6FII / NRI : 19.5 18.2 14.9FI / MF : 5.0 4.9 5.0NON PRO : 7.3 6.3 2.7PUBLIC & OTHERS : 10.6 12.2 12.8 PRICE PERFORMANCE, %
1MTH 3MTH 1YRABS ‐0.5 ‐14.9 ‐11.3REL TO BSE ‐5.6 ‐12.1 ‐13.6 PRICE VS. SENSEX
Source: Phillip Capital India Research KEY FINANCIALS Rs mn FY15 FY16E FY17ENet Sales 42,581 46,479 52,025EBIDTA 890 2,579 3,159Net Profit ‐140 858 1,219EPS, Rs (1.4) 8.6 12.2PER, x (175.7) 28.6 20.1EV/EBIDTA, x 28.9 11.8 9.6P/BV, x 3.6 3.2 2.9ROE, % (2.0) 11.9 15.1Debt/Equity (%) 1.2 1.1 0.9
Source: PhillipCapital India Research Est. Amol Rao (+ 9122 6667 9952) [email protected] Deepak Agarwal (+ 9122 6667 9944) [email protected]
0
100
200
300
Apr‐13 Apr‐14 Apr‐15Bajaj Elec BSE Sensex

BAJAJ ELECTRICALS LTD INITIATING COVERAGE
Sizeable consumer‐facing businesses Over its seven decades of operations, BEL has continuously strived towards garnering a larger portion of consumer spends on electricals and appliances. Consequently, the company has opted to concentrate wholly on the design and development of products and monitoring of quality. Its outsourcing model has enabled it to routinely introduce new products in various verticals while cutting the lead‐time to market. It has leveraged its brand and customer service initiatives over the years to emerge as one of the most trustworthy consumer brands in the country. Bajaj Electricals – revenue break up
Source: Company, PhillipCapital India Research BEL’s consumer electricals businesses are: Consumer appliances: In addition to selling products under its own brand, BEL has a technical collaboration and brand‐licensing agreement with UK’s leading home appliances company, Morphy Richards, to sell its products in India. The company also has a tie up with Nardi, Italy, to sell gas‐based cooking ranges/hobs. BEL also sells fans under this vertical and is one of the market leaders in this product category — 75% of fans sold by the company are manufactured in‐house at its facility in Chakan, Maharashtra, while the remainder is procured from Midea, China, which is one of the world’s largest manufacturers of TPW (table, pedestal, wall‐mounted) fans. BEL is now focussing its efforts on increasing its sales of industrial fans and other products in this vertical viz. designer and premium fans. Consumer appliances are the largest revenue generator for BEL, with ~47% of income coming from this segment. Its market share ranges from 15‐30% across products. It outsources manufacturing of all its products from dedicated vendors across the country, in addition to outsourcing from China. BEL: Performance of the consumer durables business BEL: Performance of the lighting business
Source: Company, PhillipCapital India Research
Bajaj ElectricalFY15 Revenue Rs 42.6bn
LightingRevenue Rs 9bn
Consumer DurablesRevenue Rs 20bn
Engineering & ProjectsRevenue Rs 13bn
4,45
4
6,03
2
7,58
0
9,54
4
12,769
15,005
18,377
19,252
20,237
7%
10%9%
13%11%
10% 9%
8%7%
0%
2%
4%
6%
8%
10%
12%
14%
‐
5,000
10,000
15,000
20,000
25,000
FY07 FY08 FY09 FY10 FY11 FY12 FY13 FY14 FY15
Consumer Durables ‐Revenue (Rs mn)Consumer Durable ‐PBIT (%)
3,26
7
4,07
3
4,88
3
5,35
9
6,31
1
7,64
8
8,60
4
9,53
0
8,98
3
5%
7% 8%
6%5%
7% 7%
5%
3%
0%
2%
4%
6%
8%
10%
‐
2,000
4,000
6,000
8,000
10,000
12,000
FY07 FY08 FY09 FY10 FY11 FY12 FY13 FY14 FY15
Lighting ‐Revenue (Rs mn)Lighting ‐PBIT (%)

BAJAJ ELECTRICALS LTD INITIATING COVERAGE
Lighting: Until recently, BEL was a leading domestic player in lighting products, with a presence and top brand recall across all major product categories. It has a formidable range across GLS and FTL products, which it sources from its sister concern Hindustan Lamps Ltd., U.P., and its CFLs from another sister concern, Starlite Lighting Ltd, Nashik. However, the swift change in consumer preference for LEDs over traditional lighting media such as CFL and GLS has resulted in reducing revenue and profit traction for BEL in this vertical over the past three years. The company has now stepped up its sourcing of LEDs and had secured sizeable government order of ~Rs 450mn for the supply of LED bulbs.
Projects business emerging from a troubled past BEL’s project business falls into three buckets, viz. towers for power and telecom, special projects for facilities lighting, and high masts and poles. While the vertical started promisingly, with double‐digit EBIT margins (FY07‐10), problems in execution of certain large projects coupled with delays started taking a toll on margins and cash flows. Consequently, the company recorded three straight years of losses in this business (FY13‐15), with cumulative EBIDTA losses of ~Rs 2.8bn. In addition to cash flows from its consumer businesses, the company had to resort to debt to complete orders on hand. Debt on the books ballooned to Rs 8.4bn in FY15 from Rs 3.5bn in FY12. BEL: Performance of engineering and projects business
Source: Company, PhillipCapital India Research With 11 consecutive quarters of EBIT losses, the company finally managed to turn profits in this vertical from 4QFY15. While this bodes well for the company’s cash flows and will facilitate partial de‐leveraging of BEL’s balance sheet, we are not very confident of this business generating lucrative margins in the near term, given the sluggish economic scenario. Additionally, with a working capital churn of 0.5x and low returns on capital, we believe that any growth in this business will suck out valuable float from the consumer businesses, thereby suppressing return ratios at the enterprise level. Dipping profitability in consumer businesses problematic Over the past eight quarters, BEL has managed to maintain momentum in revenues of its appliances and lighting businesses. However, profitability in these segments has been ebbing. The drop is more pronounced in the lighting business, where the portfolio, consisting largely of conventional products like CFLs, FTLs, and GLS bulbs, is being less favoured compared to LED‐based solutions. While BEL is stepping up its outsourcing and assembly of LED‐based lighting products, sales in this vertical may take some time to normalize.
3,05
2
3,62
7 5,22
6 7,36
8
8,31
4
8,31
9
6,88
0
11,501
13,355
12% 13% 13%11%
9%
3%
‐18%
‐9%‐7%
‐20%
‐15%
‐10%
‐5%
0%
5%
10%
15%
‐
2,000
4,000
6,000
8,000
10,000
12,000
14,000
16,000
FY07 FY08 FY09 FY10 FY11 FY12 FY13 FY14 FY15
E&P ‐Revenue E&P ‐PBIT (%)

BAJAJ ELECTRICALS LTD INITIATING COVERAGE
Simultaneously, the company is implementing a new distribution framework based on the ‘Theory of Constraints’. It expects to reduce the working capital cycle in its consumer businesses by optimizing replenishment of stock, and in turn, hopes to improve margins by cutting down on incentives offered. However, we expect this transition to play out over a few quarters, and teething problems in this system could have an impact on sales and profitability in both consumer‐facing businesses. The broader issue at hand is the investment of profit generated from the consumer businesses into the capital‐intensive projects business. With lesser surplus available, de‐leveraging may be more difficult to accomplish. The deployment of surpluses into a lower‐return‐yielding project business could further impact enterprise‐level return ratios. Financials As one of the oldest brands in the domestic appliances and lighting segments, BEL enjoys instant recall and tremendous brand equity. It has successfully ridden the wave of consumerism in the Indian economy, especially through its consumer appliances business, which has clocked a superlative CAGR of 22% over the past nine years. Its lighting business, which has delivered a more modest 10% CAGR in the same period, has also grown thanks to its vast distribution and legacy of a trusted brand. However, a cause of concern is that while profits in these segments have grown, profitability has been slipping from historical highs. While some of this could be due to the tough economic environment, increasing competition and product lifecycle management are also credible reasons. BEL: Segmental revenues
Source: Company, PhillipCapital India Research The projects business, which started off well initially, has over the past few years weakened the company’s balance sheet and guzzled most of the cash generated by BEL’s asset‐light consumer businesses. Eleven consecutive quarters of losses (FY13‐15) due to delays in project execution and other complications resulted in write‐offs / provisions that drove the company into operational losses. A more serious fallout of this was the inordinate expansion of the working capital cycle, which in turn was funded by debt. Going ahead, we expect BEL to clock sales of Rs 46bn in FY16, up 9% yoy. This would be because of higher sales across all its business segments. With no losses expected in the projects division, we expect OPM at 5.5% as EBIDTA and profits settle at Rs
4 3 4 5 5 6 8 9 10 9 10 10 3 4 6 8 10 13
15 18 19 20 22 25
1 3 4
5 7
8 8
7 12 13
15 16
‐
10
20
30
40
50
60
FY06 FY07 FY08 FY09 FY10 FY11 FY12 FY13 FY14 FY15 FY16E FY17E
Lighting Consumer Durables Engineering & Projects

BAJAJ ELECTRICALS LTD INITIATING COVERAGE
2.6bn and Rs 1.3bn respectively. In FY17, we expect revenues of Rs 52bn and a growth of 12% yoy. We estimate OPM at 6% with EBIDTA and net profits at Rs 2.9bn and Rs 1.2bn respectively. We have listed our assumptions for revenues in various verticals in the table below. BEL: Operational profitability BEL: PAT profile
Source: Company, PhillipCapital India Research Our primary concern remains the operational profitability of the engineering projects business, which has an order book of Rs 34bn. Any inordinate delays in execution could see repeat of losses in this business, thereby impacting our cash‐flow estimates and calculations for returns on capital employed and equity. BEL: Debt and gearing
Source: Company, PhillipCapital India Research Outlook and valuation Intensifying competition in the consumer appliances segment coupled with lacklustre profitability, inappropriate product mix in its lighting business, and uncertainty in execution timelines of new projects are potent spoilers for BEL’s valuations. At present, our estimates for BEL’s profits and cash flows have more downside risks than positive surprises. Hence, we initiate coverage on the company with a SELL rating and a price objective of Rs 206 (17x our FY17 earnings).
614
785
1,30
6
1,81
8
2,19
9
2,32
5
2,20
8
1,10
8
819
890
2,57
9
3,15
9
7% 7%
10%10%10%
8%
7%
3%2% 2%
6%6%
0%
2%
4%
6%
8%
10%
12%
0
500
1,000
1,500
2,000
2,500
3,000
3,500EBITDA (Rs. Mn) OPM (%)
301
605
924
1,09
7
1,21
4
1,01
6
511
‐53
‐140
858
1,21
9
‐400
‐200
0
200
400
600
800
1,000
1,200
1,400
FY07
FY08
FY09
FY10
FY11
FY12
FY13
FY14
FY15
FY16
E
FY17
E
PAT (Rs. Mn)
1,92
8
2,37
2
2,36
7
2,13
9 1,51
8
1,16
5
3,50
3
3,68
3
6,83
5
8,37
0
7,98
0
7,55
5
2.1 2.0
1.4
0.9
0.3 0.2
0.5 0.5
1.0
1.2 1.1
0.9
‐
0.5
1.0
1.5
2.0
2.5
‐
1,000
2,000
3,000
4,000
5,000
6,000
7,000
8,000
9,000
FY06 FY07 FY08 FY09 FY10 FY11 FY12 FY13 FY14 FY15 FY16E FY17E
Debt (Rs. Mn) Debt:Equity (x)

BAJAJ ELECTRICALS LTD INITIATING COVERAGE
Financials
Income Statement Y/E Mar, Rs mn FY14 FY15 FY16e FY17eNet sales 40,298 42,581 46,479 52,025 Growth, % 19.0% 5.7% 9.2% 11.9%Raw Material expenses 28,856 30,143 32,768 36,522 Operating expenses 8,798 9,312 8,785 9,833 Employee expenses 1,825 2,236 2,348 2,512 EBITDA (Core) 819 890 2,579 3,159 Growth, % ‐26.0% 8.6% 189.8% 22.5%Margin, % 2.0% 2.1% 5.5% 6.1%Depreciation 247 290 323 387 EBIT 572 600 2,256 2,771 Growth, % ‐40.6% 4.9% 276.2% 22.8%Margin, % 1.4% 1.4% 4.9% 5.3%Interest paid 783 1,051 1,104 1,049 Other Non‐Operating Income 151 243 200 200 Pre‐tax profit (60) (208) 1,353 1,923 Tax provided (7) (69) 495 704 Profit after tax (53) (140) 858 1,219 ( ‐ ) Exceptional Expenses 0 0 0 0 Net Profit (53) (140) 858 1,219 Growth, % ‐110.4% 162.7% ‐714.5% 42.1%Margin, % ‐0.1% ‐0.3% 1.8% 2.3%Net Profit (adjusted) (53) (140) 858 1,219 No. of Eq. Sh O/S (m nos) 100 101 101 101 Balance Sheet Y/E Mar, Rs mn FY14 FY15 FY16e FY17eCash & bank 543 377 63 154Debtors 16,180 16,757 18,075 20,087Inventory 4,467 4,746 4,634 4,751Loans & advances 2,216 2,526 2,526 2,526Other current assets 0 0 0 0Total current assets 23,406 24,406 25,298 27,518Investments 673 594 594 594Gross fixed assets 3,723 4,319 4,719 4,919Less: Depreciation 1,231 1,543 1,866 2,253Add: Capital WIP 26 32 50 50Net fixed assets 2,518 2,808 2,904 2,716Total assets 26,597 27,808 28,796 30,829 Current liabilities 12,000 11,859 12,560 13,981Provisions 925 1,194 1,194 1,194Total current liabilities 12,925 13,052 13,754 15,175Debt 6,835 8,370 7,980 7,555Deferred Tax Liability ‐253 ‐489 ‐489 ‐489Total liabilities 19,506 20,933 21,245 22,241Paid‐up capital 199 202 202 202Reserves & surplus 6,891 6,673 7,349 8,386Shareholders’ equity 7,090 6,875 7,551 8,588Total equity & liabilities 26,597 27,808 28,796 30,829 Source: Company, PhillipCapital India Research Estimates
Cash Flow Y/E Mar, Rs mn FY14 FY15 FY16e FY17ePre‐tax profit (60) (208) 1,353 1,923 Depreciation 247 290 323 387 Chg in working capital (1,296) (420) (504) (708)Total tax paid (302) (308) (495) (704)Other operating activities 1,348 1,533 904 849 Cash flow from operating activities (63) 887 1,580 1,747 Capital expenditure (472) (624) (418) (200)Chg in investments (291) 133 0 0 Other investing activities 0 0 200 200 Cash flow from investing activities (764) (491) (218) 0 Free cash flow (826) 396 1,362 1,747 Equity raised/(repaid) 41 127 0 0 Debt raised/(repaid) 1,844 425 (390) (425)Dividend (incl. tax) (288) (227) (182) (182)Other financing activities (727) (888) (1,104) (1,049)Cash flow from financing activities 869 (562) (1,676) (1,655)Net chg in cash 43 (166) (314) 91 Valuation Ratios
FY14 FY15 FY16e FY17ePer Share data Dil. EPS (INR) (0.5) (1.4) 8.6 12.2 Growth, % ‐110% 163% ‐715% 42%Book NAV/ FD share (INR) 71.2 69.0 75.8 86.2 CEPS (INR) 2.0 1.5 11.7 15.9 CFPS (INR) (0.6) 8.9 15.9 17.5 DPS (INR) 1.5 1.5 1.5 1.5 Return ratios Return on assets (%) (0.2) (0.5) 3.0 4.0 Return on equity (%) (0.7) (2.0) 11.9 15.1 Return on capital employed (%) 5.9 5.9 16.5 19.4 Turnover ratios Sales/Total assets (x) 2.9 2.9 3.1 3.3 Sales/Net FA (x) 16.2 15.3 16.3 19.5 Working capital/Sales (x) 0.3 0.3 0.2 0.2 Fixed capital/Sales (x) 0.1 0.1 0.1 0.1 Receivable days 144.5 141.7 140.0 139.0 Inventory days 40.7 41.0 38.0 35.0 Loans, Adv (days) 19.8 21.4 19.6 17.5 Payable days 109.4 102.4 103.0 103.0 Working capital days 95.6 101.6 94.6 88.5Liquidity ratios Current ratio (x) 1.8 1.9 1.8 1.8 Quick ratio (x) 1.5 1.5 1.5 1.5 Interest cover (x) 1.2 1.1 2.1 2.5 Dividend cover (x) (0.4) (0.9) 5.7 8.1 Total debt/Equity (%) 1.0 1.2 1.1 0.9Net debt/Equity (%) 0.9 1.2 1.0 0.9 Valuation PER (x) (461.6) (175.7) 28.6 20.1 PEG (x) ‐ y‐o‐y growth 4.2 (1.1) (0.0) 0.5 Price/Book (x) 3.5 3.6 3.2 2.9 Yield (%) 0.6 0.6 0.6 0.6 EV/Net sales (x) 0.8 0.8 0.7 0.6EV/EBITDA (x) 31.7 28.9 11.8 9.6EV/EBIT (x) 42.6 38.9 13.3 10.8

MIDCAP‐ELECTRICALS SECTOR UPDATE
Rating Methodology We rate stock on absolute return basis. Our target price for the stocks has an investment horizon of one year. Rating Criteria Definition
BUY >= +15% Target price is equal to or more than 15% of current market price
NEUTRAL ‐15% > to < +15% Target price is less than +15% but more than ‐15%
SELL <= ‐15% Target price is less than or equal to ‐15%.
Contact Information (Regional Member Companies)
SINGAPORE: Phillip Securities Pte Ltd 250 North Bridge Road, #06‐00 Raffles City Tower,
Singapore 179101 Tel : (65) 6533 6001 Fax: (65) 6535 3834
www.phillip.com.sg
MALAYSIA: Phillip Capital Management Sdn Bhd B‐3‐6 Block B Level 3, Megan Avenue II,
No. 12, Jalan Yap Kwan Seng, 50450 Kuala Lumpur Tel (60) 3 2162 8841 Fax (60) 3 2166 5099
www.poems.com.my
HONG KONG: Phillip Securities (HK) Ltd 11/F United Centre 95 Queensway Hong Kong Tel (852) 2277 6600 Fax: (852) 2868 5307
www.phillip.com.hk
JAPAN: Phillip Securities Japan, Ltd 4‐2 Nihonbashi Kabutocho, Chuo‐ku
Tokyo 103‐0026 Tel: (81) 3 3666 2101 Fax: (81) 3 3664 0141
www.phillip.co.jp
INDONESIA: PT Phillip Securities Indonesia ANZ Tower Level 23B, Jl Jend Sudirman Kav 33A,
Jakarta 10220, Indonesia Tel (62) 21 5790 0800 Fax: (62) 21 5790 0809
www.phillip.co.id
CHINA: Phillip Financial Advisory (Shanghai) Co. Ltd. No 550 Yan An East Road, Ocean Tower Unit 2318
Shanghai 200 001 Tel (86) 21 5169 9200 Fax: (86) 21 6351 2940
www.phillip.com.cn
THAILAND: Phillip Securities (Thailand) Public Co. Ltd. 15th Floor, Vorawat Building, 849 Silom Road,
Silom, Bangrak, Bangkok 10500 Thailand Tel (66) 2 2268 0999 Fax: (66) 2 2268 0921
www.phillip.co.th
FRANCE: King & Shaxson Capital Ltd. 3rd Floor, 35 Rue de la Bienfaisance
75008 Paris France Tel (33) 1 4563 3100 Fax : (33) 1 4563 6017
www.kingandshaxson.com
UNITED KINGDOM: King & Shaxson Ltd. 6th Floor, Candlewick House, 120 Cannon Street
London, EC4N 6AS Tel (44) 20 7929 5300 Fax: (44) 20 7283 6835
www.kingandshaxson.com
UNITED STATES: Phillip Futures Inc. 141 W Jackson Blvd Ste 3050
The Chicago Board of Trade Building Chicago, IL 60604 USA
Tel (1) 312 356 9000 Fax: (1) 312 356 9005
AUSTRALIA: PhillipCapital Australia Level 37, 530 Collins Street
Melbourne, Victoria 3000, Australia Tel: (61) 3 9629 8380 Fax: (61) 3 9614 8309
www.phillipcapital.com.au
SRI LANKA: Asha Phillip Securities Limited Level 4, Millennium House, 46/58 Navam Mawatha,
Colombo 2, Sri Lanka Tel: (94) 11 2429 100 Fax: (94) 11 2429 199
www.ashaphillip.net/home.htm
INDIA: PhillipCapital (India) Private Limited No. 1, 18th Floor, Urmi Estate, 95 Ganpatrao Kadam Marg, Lower Parel West, Mumbai 400013
Tel: (9122) 2300 2999 Fax: (9122) 6667 9955 www.phillipcapital.in
Management(91 22) 2300 2999
Kinshuk Bharti Tiwari (Head – Institutional Equity) (91 22) 6667 9946(91 22) 6667 9735
Research Engineering, Capital Goods Midcap
Dhawal Doshi (9122) 6667 9769 Jonas Bhutta (9122) 6667 9759 Amol Rao (9122) 6667 9952Nitesh Sharma, CFA (9122) 6667 9965 Hrishikesh Bhagat (9122) 6667 9986
Portfolio StrategyAgri Inputs Infrastructure & IT Services Anindya Bhowmik (9122) 6667 9764Gauri Anand (9122) 6667 9943 Vibhor Singhal (9122) 6667 9949
Deepan Kapadia (9122) 6667 9992 TechnicalsBanking, NBFCs Subodh Gupta, CMT (9122) 6667 9762Manish Agarwalla (9122) 6667 9962 Logistics, Transportation & MidcapPradeep Agrawal (9122) 6667 9953 Vikram Suryavanshi (9122) 6667 9951 Production ManagerParesh Jain (9122) 6667 9948 Ganesh Deorukhkar (9122) 6667 9966
MetalsConsumer, Media, Telecom Dhawal Doshi (9122) 6667 9769 Mid‐Caps & Database ManagerNaveen Kulkarni, CFA, FRM (9122) 6667 9947 Yash Doshi (9122) 6667 9987 Deepak Agarwal (9122) 6667 9944Jubil Jain (9122) 6667 9766Manoj Behera (9122) 6667 9973 Oil & Gas Editor
Sabri Hazarika (9122) 6667 9756 Roshan Sony 98199 72726CementVaibhav Agarwal (9122) 6667 9967 Pharma Sr. Manager – Equities Support
Surya Patra (9122) 6667 9768 Rosie Ferns (9122) 6667 9971Economics Mehul Sheth (9122) 6667 9996Anjali Verma (9122) 6667 9969
Sales & Distribution Ashvin Patil (9122) 6667 9991 Sales Trader Zarine Damania (9122) 6667 9976Shubhangi Agrawal (9122) 6667 9964 Dilesh Doshi (9122) 6667 9747 Kishor Binwal (9122) 6667 9989 Suniil Pandit (9122) 6667 9745Sidharth Agrawal (9122) 6667 9934 ExecutionBhavin Shah (9122) 6667 9974 Mayur Shah (9122) 6667 9945
Corporate Communications
Vineet Bhatnagar (Managing Director)
Jignesh Shah (Head – Equity Derivatives)
Automobiles

MIDCAP‐ELECTRICALS SECTOR UPDATE
Disclosures and Disclaimers PhillipCapital (India) Pvt. Ltd. has three independent equity research groups: Institutional Equities, Institutional Equity Derivatives, and Private Client Group. This report has been prepared by Institutional Equities Group. The views and opinions expressed in this document may, may not match, or may be contrary at times with the views, estimates, rating, and target price of the other equity research groups of PhillipCapital (India) Pvt. Ltd.
This report is issued by PhillipCapital (India) Pvt. Ltd., which is regulated by the SEBI. PhillipCapital (India) Pvt. Ltd. is a subsidiary of Phillip (Mauritius) Pvt. Ltd. References to "PCIPL" in this report shall mean PhillipCapital (India) Pvt. Ltd unless otherwise stated. This report is prepared and distributed by PCIPL for information purposes only, and neither the information contained herein, nor any opinion expressed should be construed or deemed to be construed as solicitation or as offering advice for the purposes of the purchase or sale of any security, investment, or derivatives. The information and opinions contained in the report were considered by PCIPL to be valid when published. The report also contains information provided to PCIPL by third parties. The source of such information will usually be disclosed in the report. Whilst PCIPL has taken all reasonable steps to ensure that this information is correct, PCIPL does not offer any warranty as to the accuracy or completeness of such information. Any person placing reliance on the report to undertake trading does so entirely at his or her own risk and PCIPL does not accept any liability as a result. Securities and Derivatives markets may be subject to rapid and unexpected price movements and past performance is not necessarily an indication of future performance.
This report does not regard the specific investment objectives, financial situation, and the particular needs of any specific person who may receive this report. Investors must undertake independent analysis with their own legal, tax, and financial advisors and reach their own conclusions regarding the appropriateness of investing in any securities or investment strategies discussed or recommended in this report and should understand that statements regarding future prospects may not be realised. Under no circumstances can it be used or considered as an offer to sell or as a solicitation of any offer to buy or sell the securities mentioned within it. The information contained in the research reports may have been taken from trade and statistical services and other sources, which PCIL believe is reliable. PhillipCapital (India) Pvt. Ltd. or any of its group/associate/affiliate companies do not guarantee that such information is accurate or complete and it should not be relied upon as such. Any opinions expressed reflect judgments at this date and are subject to change without notice.
Important: These disclosures and disclaimers must be read in conjunction with the research report of which it forms part. Receipt and use of the research report is subject to all aspects of these disclosures and disclaimers. Additional information about the issuers and securities discussed in this research report is available on request.
Certifications: The research analyst(s) who prepared this research report hereby certifies that the views expressed in this research report accurately reflect the research analyst’s personal views about all of the subject issuers and/or securities, that the analyst(s) have no known conflict of interest and no part of the research analyst’s compensation was, is, or will be, directly or indirectly, related to the specific views or recommendations contained in this research report.
Additional Disclosures of Interest: Unless specifically mentioned in Point No. 9 below: 1. The Research Analyst(s), PCIL, or its associates or relatives of the Research Analyst does not have any financial interest in the company(ies) covered in
this report. 2. The Research Analyst, PCIL or its associates or relatives of the Research Analyst affiliates collectively do not hold more than 1% of the securities of the
company (ies)covered in this report as of the end of the month immediately preceding the distribution of the research report. 3. The Research Analyst, his/her associate, his/her relative, and PCIL, do not have any other material conflict of interest at the time of publication of this
research report. 4. The Research Analyst, PCIL, and its associates have not received compensation for investment banking or merchant banking or brokerage services or for
any other products or services from the company(ies) covered in this report, in the past twelve months. 5. The Research Analyst, PCIL or its associates have not managed or co‐managed in the previous twelve months, a private or public offering of securities for
the company (ies) covered in this report. 6. PCIL or its associates have not received compensation or other benefits from the company(ies) covered in this report or from any third party, in
connection with the research report. 7. The Research Analyst has not served as an Officer, Director, or employee of the company (ies) covered in the Research report. 8. The Research Analyst and PCIL has not been engaged in market making activity for the company(ies) covered in the Research report. 9. Details of PCIL, Research Analyst and its associates pertaining to the companies covered in the Research report: Sr. no. Particulars Yes/No
1 Whether compensation has been received from the company(ies) covered in the Research report in the past 12 months for investment banking transaction by PCIL
No
2 Whether Research Analyst, PCIL or its associates or relatives of the Research Analyst affiliates collectively hold more than 1% of the company(ies) covered in the Research report
No
3 Whether compensation has been received by PCIL or its associates from the company(ies) covered in the Research report No 4 PCIL or its affiliates have managed or co‐managed in the previous twelve months a private or public offering of securities for the
company(ies) covered in the Research report No
5 Research Analyst, his associate, PCIL or its associates have received compensation for investment banking or merchant banking or brokerage services or for any other products or services from the company(ies) covered in the Research report, in the last twelve months
No
Independence: PhillipCapital (India) Pvt. Ltd. has not had an investment banking relationship with, and has not received any compensation for investment banking services from, the subject issuers in the past twelve (12) months, and PhillipCapital (India) Pvt. Ltd does not anticipate receiving or intend to seek compensation for investment banking services from the subject issuers in the next three (3) months. PhillipCapital (India) Pvt. Ltd is not a market maker in the securities mentioned in this research report, although it, or its affiliates/employees, may have positions in, purchase or sell, or be materially interested in any of the securities covered in the report.
Suitability and Risks: This research report is for informational purposes only and is not tailored to the specific investment objectives, financial situation or particular requirements of any individual recipient hereof. Certain securities may give rise to substantial risks and may not be suitable for certain investors. Each investor must make its own determination as to the appropriateness of any securities referred to in this research report based upon the legal, tax and accounting considerations applicable to such investor and its own investment objectives or strategy, its financial situation and its investing experience. The value of any security may be positively or adversely affected by changes in foreign exchange or interest rates, as well as by other financial, economic, or political factors. Past performance is not necessarily indicative of future performance or results.

MIDCAP‐ELECTRICALS SECTOR UPDATE
Sources, Completeness and Accuracy: The material herein is based upon information obtained from sources that PCIPL and the research analyst believe to be reliable, but neither PCIPL nor the research analyst represents or guarantees that the information contained herein is accurate or complete and it should not be relied upon as such. Opinions expressed herein are current opinions as of the date appearing on this material, and are subject to change without notice. Furthermore, PCIPL is under no obligation to update or keep the information current. Without limiting any of the foregoing, in no event shall PCIL, any of its affiliates/employees or any third party involved in, or related to computing or compiling the information have any liability for any damages of any kind including but not limited to any direct or consequential loss or damage, however arising, from the use of this document.
Copyright: The copyright in this research report belongs exclusively to PCIPL. All rights are reserved. Any unauthorised use or disclosure is prohibited. No reprinting or reproduction, in whole or in part, is permitted without the PCIPL’s prior consent, except that a recipient may reprint it for internal circulation only and only if it is reprinted in its entirety.
Caution: Risk of loss in trading/investment can be substantial and even more than the amount / margin given by you. The recipient should carefully consider whether trading/investment is appropriate for the recipient in light of the recipient’s experience, objectives, financial resources and other relevant circumstances. PCIPL and any of its employees, directors, associates, group entities, or affiliates shall not be liable for losses, if any, incurred by the recipient. The recipient is further cautioned that trading/investments in financial markets are subject to market risks and are advised to seek trading/investment advice before investing. There is no guarantee/assurance as to returns or profits or capital protection or appreciation. PCIPL and any of its employees, directors, associates, group entities, affiliates are not inducing the recipient for trading/investing in the financial market(s). Trading/Investment decision is the sole responsibility of the recipient.
For U.S. persons only: This research report is a product of PhillipCapital (India) Pvt Ltd., which is the employer of the research analyst(s) who has prepared the research report. The research analyst(s) preparing the research report is/are resident outside the United States (U.S.) and are not associated persons of any U.S.‐regulated broker‐dealer and therefore the analyst(s) is/are not subject to supervision by a U.S. broker‐dealer, and is/are not required to satisfy the regulatory licensing requirements of FINRA or required to otherwise comply with U.S. rules or regulations regarding, among other things, communications with a subject company, public appearances, and trading securities held by a research analyst account.
This report is intended for distribution by PhillipCapital (India) Pvt Ltd. only to "Major Institutional Investors" as defined by Rule 15a‐6(b)(4) of the U.S. Securities and Exchange Act, 1934 (the Exchange Act) and interpretations thereof by the U.S. Securities and Exchange Commission (SEC) in reliance on Rule 15a 6(a)(2). If the recipient of this report is not a Major Institutional Investor as specified above, then it should not act upon this report and return the same to the sender. Further, this report may not be copied, duplicated, and/or transmitted onward to any U.S. person, which is not a Major Institutional Investor.
In reliance on the exemption from registration provided by Rule 15a‐6 of the Exchange Act and interpretations thereof by the SEC in order to conduct certain business with Major Institutional Investors, PhillipCapital (India) Pvt Ltd. has entered into an agreement with a U.S. registered broker‐dealer, Marco Polo Securities Inc. ("Marco Polo"). Transactions in securities discussed in this research report should be effected through Marco Polo or another U.S. registered broker dealer PhillipCapital (India) Pvt. Ltd. Registered office: No. 1, 18th Floor, Urmi Estate, 95 Ganpatrao Kadam Marg, Lower Parel West, Mumbai 400013