Pavement Surface Characteristics · 2008-12-12 · Pavement Surface Texture A pavement’s...
74
Relationship Between Skid Resistance Numbers Measured with Ribbed and Smooth Tire and Wet-Accident Locations B-1 APPENDIX B. SYNTHESIS ON PAVEMENT SURFACE CHARACTERISTICS Introduction Since at least the 1980s, the United States has suffered over 40,000 annual fatalities on its highways, with an estimated total annual cost of $260 billion (in year 2000 dollars). There are a number of factors contributing to this high number of fatalities, including poor roadway geometry, improper roadside design, poor surface characteristics, and unsafe drivers behavior (e.g., aggressive or impaired driving, not using a seat belt, and so on). Poor surface characteristics have been identified as a contributing factor in about 30 percent of the annual highway fatalities in the U.S. (Larson 2005). Additionally, the National Transportation Safety Board (NTSB) and the Federal Highway Administration (FHWA) have reported that 13.5 percent of fatal crashes and 18.8 percent of all crashes occur when the pavement surface is wet (Dahir and Gramling 1990). It is also estimated that 40 to 50 percent of all nonrecurring congestion is associated with traffic incidents (AAA 2008). Considering these statistics, many agencies on the Federal and State level, including the Ohio Department of Transportation (ODOT), have become interested in crash reduction programs with emphasis on a better understanding of the relationship between measurable surface characteristics (e.g. friction and texture) and the occurrence of roadway crashes. A recent study for the North Carolina DOT found that crashes decrease significantly with an increase in pavement macrotexture (Pulugurtha, Kusam, and Patel 2008). Pavement macrotexture greater than or equal to 0.06 inches (1.5 mm) but typically less than 0.12 inches (3.0 mm) was found to be most appropriate to provide safe and efficient transportation to road users (Pulugurtha, Kusam and Patel 2008). Similarly, research underway in Canada indicated a mean texture depth of 0.07 inches (1.8 mm) would probably be adequate, but also noted that hot- mix asphalt (HMA) surfaces with complex macrotexture perform differently than portland cement concrete (PCC) pavements with simple macrotexture patterns (Ahammed and Tighe 2008). The above findings notwithstanding, researchers from New Zealand found the road geometry factors (e.g., curvature and gradient) to have a more significant effect on the crash rate than the surface friction (Davies, Cenek and Henderson 2005). Furthermore, the effect of surface texture on the crash rate was found to be statistically insignificant. Considering the somewhat conflicting results, more research is needed to determine the effect of pavement surface conditions on road safety. To address some of the shortcomings in this topic of research, the Ohio DOT is sponsoring this study to investigate the relationship between skid resistance, macrotexture, and wet-crash locations. Therefore the objective of the literature review is to determine the state-of-the-practice in what quantifiable pavement characteristics correlate with wet pavement and total and rear-end crashes. The literature review will focus on the following topics: • Definition of and measuring techniques for pavement surface characteristics.
Transcript of Pavement Surface Characteristics · 2008-12-12 · Pavement Surface Texture A pavement’s...

Relationship Between Skid Resistance Numbers Measured with Ribbed and Smooth Tire and Wet-Accident Locations
B-1
APPENDIX B. SYNTHESIS ON PAVEMENT SURFACE CHARACTERISTICS
Introduction Since at least the 1980s, the United States has suffered over 40,000 annual fatalities on its highways, with an estimated total annual cost of $260 billion (in year 2000 dollars). There are a number of factors contributing to this high number of fatalities, including poor roadway geometry, improper roadside design, poor surface characteristics, and unsafe drivers behavior (e.g., aggressive or impaired driving, not using a seat belt, and so on). Poor surface characteristics have been identified as a contributing factor in about 30 percent of the annual highway fatalities in the U.S. (Larson 2005). Additionally, the National Transportation Safety Board (NTSB) and the Federal Highway Administration (FHWA) have reported that 13.5 percent of fatal crashes and 18.8 percent of all crashes occur when the pavement surface is wet (Dahir and Gramling 1990). It is also estimated that 40 to 50 percent of all nonrecurring congestion is associated with traffic incidents (AAA 2008). Considering these statistics, many agencies on the Federal and State level, including the Ohio Department of Transportation (ODOT), have become interested in crash reduction programs with emphasis on a better understanding of the relationship between measurable surface characteristics (e.g. friction and texture) and the occurrence of roadway crashes. A recent study for the North Carolina DOT found that crashes decrease significantly with an increase in pavement macrotexture (Pulugurtha, Kusam, and Patel 2008). Pavement macrotexture greater than or equal to 0.06 inches (1.5 mm) but typically less than 0.12 inches (3.0 mm) was found to be most appropriate to provide safe and efficient transportation to road users (Pulugurtha, Kusam and Patel 2008). Similarly, research underway in Canada indicated a mean texture depth of 0.07 inches (1.8 mm) would probably be adequate, but also noted that hot-mix asphalt (HMA) surfaces with complex macrotexture perform differently than portland cement concrete (PCC) pavements with simple macrotexture patterns (Ahammed and Tighe 2008). The above findings notwithstanding, researchers from New Zealand found the road geometry factors (e.g., curvature and gradient) to have a more significant effect on the crash rate than the surface friction (Davies, Cenek and Henderson 2005). Furthermore, the effect of surface texture on the crash rate was found to be statistically insignificant. Considering the somewhat conflicting results, more research is needed to determine the effect of pavement surface conditions on road safety. To address some of the shortcomings in this topic of research, the Ohio DOT is sponsoring this study to investigate the relationship between skid resistance, macrotexture, and wet-crash locations. Therefore the objective of the literature review is to determine the state-of-the-practice in what quantifiable pavement characteristics correlate with wet pavement and total and rear-end crashes. The literature review will focus on the following topics:
• Definition of and measuring techniques for pavement surface characteristics.

Relationship Between Skid Resistance Numbers Measured with Ribbed and Smooth Tire and Wet-Accident Locations
B-2
• Road safety criteria, methods of assessment of the safety on the roads, and factors affecting road safety.
• Investigation of the relationship between surface characteristics and site conditions and roadway safety, including methods of crash data assessment, field data collection, and methods of data analysis.
• Identification of minimum and desirable levels of texture/friction for highway networks. Pavement Surface Characteristics Definitions of Surface Characteristics Pavement Surface Friction Pavement surface friction (or skid resistance) is the retarding force developed at the tire-pavement interface that resists sliding when braking forces are applied to the vehicle tires (Dahir and Gramling 1990). While adequate surface friction generally exists on dry pavements (although there are exceptions), the presence of water reduces the direct contact between the pavement surface and the tire. This film of water combined with the high speed of vehicle may result in hydroplaning (Hoerner and Smith 2002). A number of quantitative friction indices have been developed since the late 1940s, when the skid number (SN) number was first introduced. The preferred term is now friction number (FN). The most popular and useful measures of a pavement’s friction are discussed in the next sections.
Friction Number (FN) The friction number is computed as 100 times the force required to slide the locked tire (at the stated speed, usually 40 mi/hr [64 km/hr]) divided by the effective wheel load (Kuemmel et al. 2000). Friction numbers are reported in the form of: FN (Test Speed [in mi/hr]) followed by an R if a ribbed tire was used or an S if a smooth-tread tire was used. If the test speed is expressed in km/hr, it is enclosed in parentheses. For example, if a ribbed tire was used in a locked-wheel trailer test at a test speed of 40 mi/hr (64 km/hr), the friction number is reported as FN(64)R or FN40R (metric and English units, respectively). Usually, FN40R values in the range of 30 to 40 are targeted for major highways (interstate highways and other roads with design speeds of more than 40 mi/hr [64 km/hr]). Lower friction numbers are generally acceptable for low-speed and low-volume pavements with daily traffic less than 3000 vehicles a day (Hoerner and Smith 2002).
International Friction Index (IFI) In 1992, the Permanent International Association of Road Congresses (PIARC) proposed the International Friction Index (IFI) as a method of incorporating simultaneous measurements of friction and macrotexture into a single index representative of a pavement’s frictional characteristics (Henry 2000). The IFI is dependent on two parameters that describe the pavement surface friction: a speed constant (Sp) derived from the macrotexture measurement that indicates the speed dependence of the friction, and a friction number (F60) that is a harmonized level of friction for a speed of 36 mi/hr (60 km/hr). Equation forms for these IFI parameters are as follows (Henry 2000):
Relationship Between Skid Resistance Numbers Measured with Ribbed and Smooth Tire and Wet-Accident Locations
B-3
TXbaSP *+= (A-1)
TXCeFRSBAF PSS
***6060
++=−
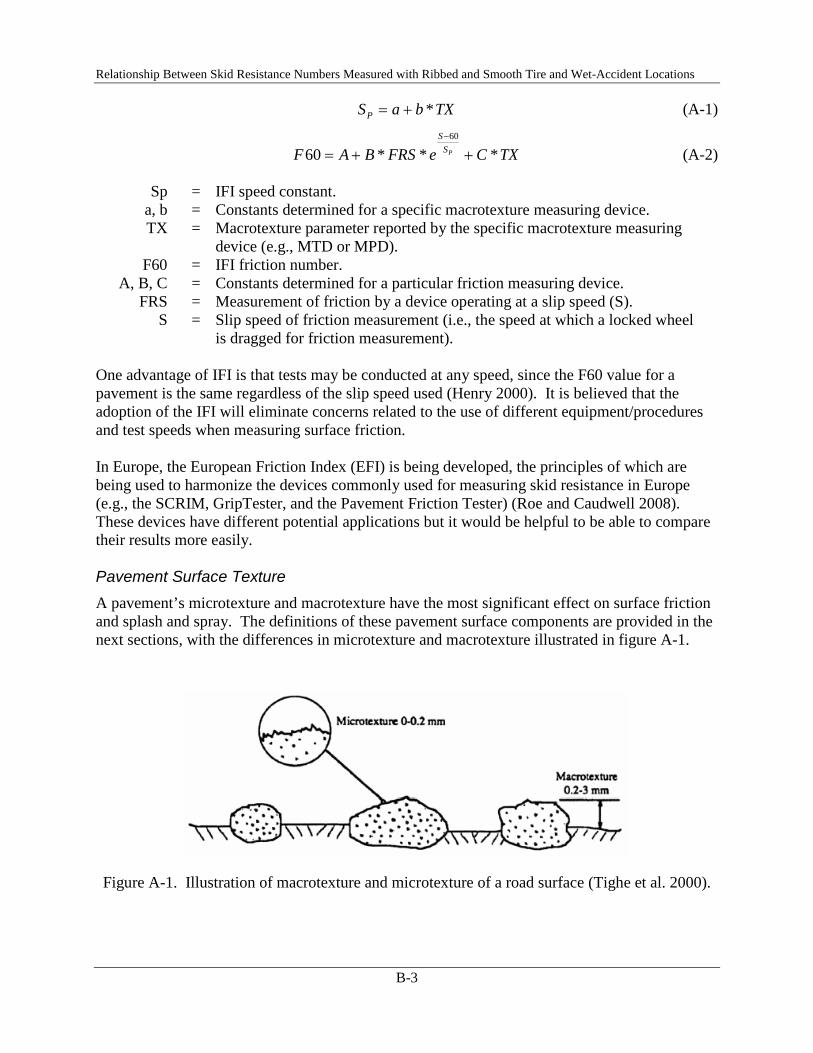
(A-2) Sp = IFI speed constant. a, b = Constants determined for a specific macrotexture measuring device. TX = Macrotexture parameter reported by the specific macrotexture measuring device (e.g., MTD or MPD). F60 = IFI friction number. A, B, C = Constants determined for a particular friction measuring device. FRS = Measurement of friction by a device operating at a slip speed (S). S = Slip speed of friction measurement (i.e., the speed at which a locked wheel is dragged for friction measurement). One advantage of IFI is that tests may be conducted at any speed, since the F60 value for a pavement is the same regardless of the slip speed used (Henry 2000). It is believed that the adoption of the IFI will eliminate concerns related to the use of different equipment/procedures and test speeds when measuring surface friction. In Europe, the European Friction Index (EFI) is being developed, the principles of which are being used to harmonize the devices commonly used for measuring skid resistance in Europe (e.g., the SCRIM, GripTester, and the Pavement Friction Tester) (Roe and Caudwell 2008). These devices have different potential applications but it would be helpful to be able to compare their results more easily. Pavement Surface Texture A pavement’s microtexture and macrotexture have the most significant effect on surface friction and splash and spray. The definitions of these pavement surface components are provided in the next sections, with the differences in microtexture and macrotexture illustrated in figure A-1.
Figure A-1. Illustration of macrotexture and microtexture of a road surface (Tighe et al. 2000).
Relationship Between Skid Resistance Numbers Measured with Ribbed and Smooth Tire and Wet-Accident Locations
B-4
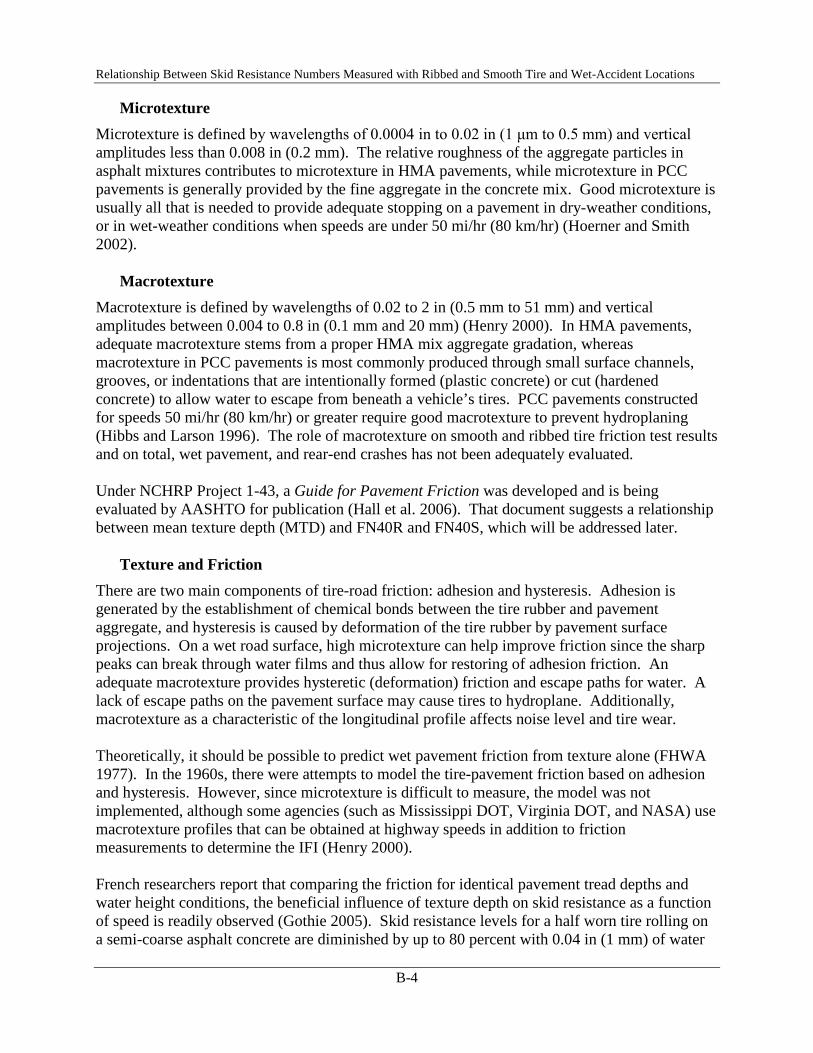
Microtexture Microtexture is defined by wavelengths of 0.0004 in to 0.02 in (1 μm to 0.5 mm) and vertical amplitudes less than 0.008 in (0.2 mm). The relative roughness of the aggregate particles in asphalt mixtures contributes to microtexture in HMA pavements, while microtexture in PCC pavements is generally provided by the fine aggregate in the concrete mix. Good microtexture is usually all that is needed to provide adequate stopping on a pavement in dry-weather conditions, or in wet-weather conditions when speeds are under 50 mi/hr (80 km/hr) (Hoerner and Smith 2002).
Macrotexture Macrotexture is defined by wavelengths of 0.02 to 2 in (0.5 mm to 51 mm) and vertical amplitudes between 0.004 to 0.8 in (0.1 mm and 20 mm) (Henry 2000). In HMA pavements, adequate macrotexture stems from a proper HMA mix aggregate gradation, whereas macrotexture in PCC pavements is most commonly produced through small surface channels, grooves, or indentations that are intentionally formed (plastic concrete) or cut (hardened concrete) to allow water to escape from beneath a vehicle’s tires. PCC pavements constructed for speeds 50 mi/hr (80 km/hr) or greater require good macrotexture to prevent hydroplaning (Hibbs and Larson 1996). The role of macrotexture on smooth and ribbed tire friction test results and on total, wet pavement, and rear-end crashes has not been adequately evaluated. Under NCHRP Project 1-43, a Guide for Pavement Friction was developed and is being evaluated by AASHTO for publication (Hall et al. 2006). That document suggests a relationship between mean texture depth (MTD) and FN40R and FN40S, which will be addressed later.
Texture and Friction
There are two main components of tire-road friction: adhesion and hysteresis. Adhesion is generated by the establishment of chemical bonds between the tire rubber and pavement aggregate, and hysteresis is caused by deformation of the tire rubber by pavement surface projections. On a wet road surface, high microtexture can help improve friction since the sharp peaks can break through water films and thus allow for restoring of adhesion friction. An adequate macrotexture provides hysteretic (deformation) friction and escape paths for water. A lack of escape paths on the pavement surface may cause tires to hydroplane. Additionally, macrotexture as a characteristic of the longitudinal profile affects noise level and tire wear. Theoretically, it should be possible to predict wet pavement friction from texture alone (FHWA 1977). In the 1960s, there were attempts to model the tire-pavement friction based on adhesion and hysteresis. However, since microtexture is difficult to measure, the model was not implemented, although some agencies (such as Mississippi DOT, Virginia DOT, and NASA) use macrotexture profiles that can be obtained at highway speeds in addition to friction measurements to determine the IFI (Henry 2000). French researchers report that comparing the friction for identical pavement tread depths and water height conditions, the beneficial influence of texture depth on skid resistance as a function of speed is readily observed (Gothie 2005). Skid resistance levels for a half worn tire rolling on a semi-coarse asphalt concrete are diminished by up to 80 percent with 0.04 in (1 mm) of water

Relationship Between Skid Resistance Numbers Measured with Ribbed and Smooth Tire and Wet-Accident Locations
B-5
at 62 mi/hr (100 km/hr). Primary factors affecting the pavement include indenters over the microtexture range and surface drainage capacity which depends upon the size, shape, layout and distribution of surface aggregates (Gothie 2005). Providing Adequate Texture on the Roads As previously described, adequate pavement surface texture is an essential requirement for safety on the roads. HMA pavements develop macrotexture through an appropriate aggregate gradation, while a number of techniques are used in PCC pavements to create macrotexture. This section discusses the techniques for providing surface texture in newly constructed and rehabilitated HMA and PCC pavements. Newly Constructed HMA Surface Texturing Techniques HMA pavements designed in conformance with Superpave mix design will generally provide adequate macrotexture and microtexture without supplemental treatments (FHWA 2005). In areas where supplies of durable, nonpolishing aggregates are limited, an agency may choose to construct an asphalt pavement using high durability aggregates optimized for friction properties only in the top layer (surface course). Research is underway to incorporate friction and texture considerations during the HMA mix design process (Goodman, Hassan, and Abd El Halim, 2006; Hall et al. 2006; Noyce et al. 2007; Ahammed and Tighe 2008).
HMA Surface Courses FHWA (2005) recommends using dense-graded asphalt mixtures with a high-quality, polish-resistant aggregate to provide adequate surface texture. Because of limited availability of the high quality aggregate, dense-graded mixtures are often expensive. Open-graded HMA mixtures may be used on the top layer to provide better friction, although they have some the potential for stripping, raveling, and shoving because of higher asphalt binder contents (as compared with dense-graded HMA mixes). Additionally, the open-graded courses have limited structural capacity, and have to be placed over sound pavements with special preparations, such as sealing the existing pavement with a 50 percent diluted asphalt emulsion and heating the underlying surface to the temperature of 600 oF (315 oC) (FHWA 2005). To overcome some of the disadvantages of open-graded mixtures, some agencies use bonded wearing courses in northern climates where freeze-thaw cycles may otherwise preclude the use of porous friction courses (PFC) (Button 2004). Stone matrix asphalt courses should be designed and constructed in conformance with American Association of State Highway and Transportation Officials (AASHTO) specifications MP8 and PP41 (regulating the void content in the HMA mix) (FHWA 2005). The stone matrix mix design is based on the idea of creating the aggregate skeleton so that stone-on-stone contact is maintained in the mixture. Stone-on-stone contact will provide load carrying capacity for heavy traffic situations. To maximize skid resistance of SMA pavement surfaces, German engineers use a process called “gritting” (“sanding” in the U.S.) during initial construction. This promising process appears to deserve further study to optimize its benefits and develop field guidelines (Button 2004). However, in the United Kingdom, the benefit of this operation is controversial due to the extra cost and the reduction in macrotexture depth (Lawrence 2008).

Relationship Between Skid Resistance Numbers Measured with Ribbed and Smooth Tire and Wet-Accident Locations
B-6
HMA Mix Properties and Friction Proper texture characteristics of asphalt surfaces are very much influenced by asphalt content, voids in the mineral aggregate, dust-to-binder ratio, and void content. Proper mix design, following Superpave procedures, should be performed to ensure the necessary ratio of these elements. It is recommended that the test procedures listed in AASHTO specifications PP28 and M323 be used in performing Superpave volumetric mix design (FHWA 2005). Surface characteristics of asphalt surfaces are also dependent on aggregate characteristics. This is particularly important after the surface is exposed to wear from traffic and weather conditions. The following aggregate characteristics affect surface friction (FHWA 2005):
• Aggregate angularity. Frictional resistance of the wearing course is improved when angular aggregates are used in the HMA mixture. Increasing fractured faces of the coarse aggregate will also improve the stability of the HMA mix.
• Aggregate soundness. Soundness is an indication of an aggregate's resistance to weathering. It is tested using sodium and magnesium sulfate tests.
• Aggregate toughness. Toughness is an indication of an aggregate's resistance to abrasion and degradation during handling, construction, and in-service. The recommended specification value for a Los Angeles abrasion loss (AASHTO specification T96) ranges from 35 to 45 percent maximum.
• Polish resistance. The use of aggregates that polish easily should be avoided. It is recommended that the polishing resistance of aggregates be measured in the laboratory using tests such as AASHTO T-279 (Accelerated Polishing of Aggregates Using the British Wheel) or AASHTO T-278 (Surface Frictional Properties Using the British Pendulum Tester).
The Guide for Pavement Friction, developed under NCHRP Project 1-43 and currently being considered for adoption by AASHTO, contains additional guidance on incorporating friction and texture considerations in the mix design process (Hall et al. 2006). Similarly, research in Canada is underway to specifically address this issue in Superpave mixes (Goodman, Hassan, and Abd El Halim 2006). Surface Treatments on Existing HMA Pavements Various types of surface treatments can be used on existing HMA pavements (Whitehurst 1977). Microsurfacing is an advanced form of slurry seal that uses a combination of emulsified asphalt, water, fine aggregate, mineral filter, and polymer additives that is being used more frequently. In quick-traffic applications as thin as 0.38-in (9.5 mm), microsurfacing can increase skid resistance, color contrast, surface restoration, and service life to high-speed, heavy-traffic roadways. Microsurfacing is applied to the problem sections of roads or runways to eliminate hydroplaning problems that occur during periods of rain. Microsurfacing restores the surface profile and improves the frictional qualities of the pavement. However, macrotexture depths needed to meet user demands are often not evaluated and researchers are evaluating additional guidelines for thin surfacings (Woodward et al. 2008; Simpson 2008).

Relationship Between Skid Resistance Numbers Measured with Ribbed and Smooth Tire and Wet-Accident Locations
B-7
Thin epoxy-bonded laminates can be used to restore surface texture in existing HMA pavements (FHWA 2005). For example, volcanic mineral with a microcellular structure composed of tiny air cells combined with cement/concrete can be chosen as the overlay material. PCC overlays may also be considered to restore adequate surface texture on asphalt pavements (FHWA 2005). A recent study documents the performance of high skid resistant treatments on 23 sections in Melbourne and Geelong, Australia (Simpson 2008). The data for the sites in this project showed an overall reduction of crashes by 39% over a 5-year period on the treated areas. In addition, the investigation found the following trends (Simpson 2008):
• An overall reduction in crashes of 39 percent on the treated areas.
• High friction surface treatments were very effective reducing loss of control crashes on high speed curves with free-flowing traffic.
• High friction surface treatments appear to be more effective when placed on the approach and centre of signalized intersections compared to sites with the treatment on the approach only.
• The sites in the project showed a slight increase to more serious injury crashes, and the high friction surface treatments followed this trend.
• A minority of sites displayed an increase in crashes and a larger increase in severity of injury.
• Although the total number of crashes was reduced, the proportion of different types of crashes remained the same.
• The skid resistant treatments altered the wet/dry road accidents ratio, and reduced the number of wet road crashes.
The investigation indicates high friction surface treatment is very effective in reducing loss of control crashes on curved sites with free flowing conditions, and very effective when placed on the approach and centre of signalized intersections. It appears these types of sites with loss of control crashes can be used to target candidate sites. The crash data indicated rear-end crashes made up the bulk of the crashes. The data showed only minor changes in the types of crash for “before” and “after” crashes. The high friction surface treatment does not appear to alter the types of crash, although it has resulted in a significant total reduction of crashes. The data suggests that the total number of crashes should be considered as more important than the number of rear-end crashes when selecting candidate sites. The data also suggests the treatments have reduced the ratio of wet crashes and supports the use of wet weather ratios to select candidate sites (Simpson 2008). Newly Constructed PCC Surface Texturing Techniques
Transverse Tining Transverse tining, preceded by a longitudinal artificial carpet or burlap drag, has been the most commonly used surface texture method on new high-speed (50 mi/hr [80 km/hr] or greater) PCC pavements (Hoerner and Smith 2002). This texture proved to be a cost-effective method of
Relationship Between Skid Resistance Numbers Measured with Ribbed and Smooth Tire and Wet-Accident Locations
B-8
consistently providing a durable pavement, although it has also been associated with increased tire/pavement noise levels. To reduce noise emissions, FHWA (2005) recommends a tine width of 0.12 in (3 mm) and a tine depth of 0.12 in (3 mm). Additionally, a random spacing of either 0.5 in (13-mm) or 1 in (25-mm) average tine spacing can be provided. The recommended tine spacings for these are (FHWA 2005):
• For the 0.5- (13-mm) average spacing: 10/14/16/11/10/13/15/16/11/10/21/13/10 mm.
• For the 1-in (25-mm) average spacing: 24/27/23/31/21/34 mm.
Longitudinal Tining Longitudinal tining has been used by several highway agencies, including California, Virginia, Michigan, Iowa, and Colorado (Hibbs and Larson 1996). Longitudinally tined surfaces are generally quieter than transversely tined surfaces, although British and Australian research states that longitudinal textures may fail to provide satisfactory friction characteristics (Hibbs and Larson 1996). Recent research suggests that for the same texture configuration, transverse tining exhibited 7 to 14 percent higher skid resistance as compared to longitudinal tining (Ahammed and Tighe 2008). However, the advantage of longitudinal tining over transverse tining is realized on horizontal curve sections. To provide the adequate friction on longitudinally tined sections, the uniform tine spacing of 0.8 in (20 mm) with an average texture depth of 0.03 in (0.8 mm) and a minimum of 0.02 in (0.5 mm) for individual tests is recommended (Hibbs and Larson 1996).
Longitudinal Plastic Brushing As reported from Spain, a combination of a longitudinal burlap drag followed by a plastic brush provides high friction with low noise levels (Hibbs and Larson 1996). To provide satisfactory microtexture, the siliceous sand was used with a minimum content of 30 percent. The higher friction numbers (both with blank and ribbed testing tires) were obtained for deeper texture rather than shallower (Hibbs and Larson 1996).
Exposed Aggregate Surface (EAS) The exposed aggregate surface treatment technique is usually constructed on a pavement composed of two layers (Hibbs and Larson 1996):
• Top layer 1.6- to 2.8-in (40- to 70-mm) thick with 30 percent siliceous sand of size 0 to 0.04 in (0 to 1 mm) and 70 percent high quality chips of size of 0.16 to 0.32 in (4 to 8 mm).
• Bottom layer with maximum aggregate size 1.25 in (32 mm) with lower quality yet durable aggregates.
A high-quality concrete with low water-cement ratio and a plasticizer and entrainment admixture should be used. Several studies in Europe reported that the EAS technique provided noise similar to porous asphalt, excellent high-speed skidding resistance, and low splash and spray. For example,

Relationship Between Skid Resistance Numbers Measured with Ribbed and Smooth Tire and Wet-Accident Locations
B-9
Sweden has reduced the water-cement ratio and added microsilica to improve wear resistance against studded tires (Hibbs and Larson 1996). The United Kingdom used 0.25 to 0.4 in (6 to 10 mm) chips for a 0.055-in (1.4-mm) average texture depth and obtained excellent high-speed (81 mi/hr [130 km/hr]) performance (Hibbs and Larson 1996). Belgium has constructed CRCP in one layer with EAS by reducing the maximum aggregate size to 0.8 in (20 mm) and increasing the amount of 0.16 to 0.28-in (4 to 7-mm) chips (Hibbs and Larson 1996). The disadvantages of the EAS texturing technique are the low cost-effectiveness of the high-quality aggregates and the technological complexity of the process requiring the qualified labor. That might be a reason why this method has not seen widespread use in the U.S. (Hoerner and Smith 2002). However, the EAS texturing method has been identified as a potential implementation activity from a recent U.S. scan tour of European concrete pavement construction practices (FHWA 2007).
Other Research There is significant research underway in the U.S. to optimize PCC surface texturing. Minnesota has had long-term experience with a longitudinal artificial carpet drag and has recently evaluated the accident rate and found it to be similar to the transverse tining previously used (Izevbekhai and Eller 2008). NCHRP Project 10-69 Texturing of Concrete Pavement is nearing completion and should be available in late 2008. A joint FHWA and industry program to optimize texture and friction is underway to determine the interrelationship among noise, friction, smoothness, and texture properties of concrete pavements. Friction and noise were found to have no relationship, demonstrating that quieter concrete pavements can be achieved without compromising this important characteristic (Ferragut et al. 2007) Existing PCC Surfaces Retexturing the existing surface or applying the overlay can significantly contribute to the improvement of the friction characteristics of the existing PCC. The following rehabilitation options should be considered (Hibbs and Larson 1996):
• Longitudinal or transverse grooving with diamond saws.
• Diamond/carbide grinding or shotblasting.
• Bonded concrete overlays.
• Surface treatments like epoxy resin/calcined bauxite, Ralumac, or Novachip.
• HMA overlays (dense- or open-graded). Selection of Pavement Surface Texture and Safety Issue The primary purpose of the surface texture is to help reduce the number and severity of wet-weather crashes. To provide good friction characteristics during wet-weather conditions, the surface texture should be selected considering the following local conditions (Hibbs and Larson 1996):
• Climate.

Relationship Between Skid Resistance Numbers Measured with Ribbed and Smooth Tire and Wet-Accident Locations
B-10
• Traffic levels, including vehicle type distribution.
• Percent grade.
• Conflicting movements (intersections or frequent side approaches).
• Materials quality and cost.
• Presence of noise-sensitive receptors. Hibbs and Larson (1996) also suggested that the comparison of the texturing methods should be conducted based on friction measurement according to ASTM E-274 (locked-wheel trailer), preferably with a smooth tire (ASTM E-524). Based on the comprehensive review of the state-of-the-art in PCC texturing techniques, it was concluded that (Hibbs and Larson 1996):
• Sufficient microtexture can be provided by the following techniques and practices: − Use of PCC mix with minimum siliceous sand content of 25 to 49 percent of the fine
aggregate portion of the mix. − Two-layer construction, wet on wet, with a higher quality mix on the top in the case
where the cost-effective aggregates are not available.
• Adequate macrotexture should be provided by: − Transverse or longitudinal tining preceded by a longitudinal artificial carpet or burlap
drag. − Plastic brushing (Spanish technology). − Exposed aggregate treatment.
In HMA pavements, adequate surface friction can be achieved by the following (FHWA 2005):
• Use of the densely graded asphalt mixtures with a high-quality, polish-resistant aggregate.
• Use of surface treatments such as microsurfacing and thin epoxy-bonded laminates. Finally, the selection of the best pavement type and surface texture is a complex problem that, in addition to safety, requires consideration of several other factors, such as durability, noise, rolling resistance, cost-effectiveness, and sustainability (Austroads 2003; Hall et al. 2006; Snyder 2006; Ferragut et al. 2007; Ahammed and Tighe 2008; Woodward et al 2008). Pavement Surface Friction Measurement Techniques Measurement of Friction Number Today, the majority of agencies in the United States measure pavement friction with an ASTM E-274 locked wheel trailer using either a standard ribbed or smooth (blank) tire (in accordance with ASTM E 501 or ASTM E 524, respectively) to determine friction numbers (Henry 2000; Hall et al. 2006). However, a number of other field measurement methods along with laboratory testing methods are used abroad, specifically, in the United Kingdom, France, New Zealand, Australia, and Japan (Henry 2000; Gothie 2005). A description of those methods is provided in the following sections.
Relationship Between Skid Resistance Numbers Measured with Ribbed and Smooth Tire and Wet-Accident Locations
B-11
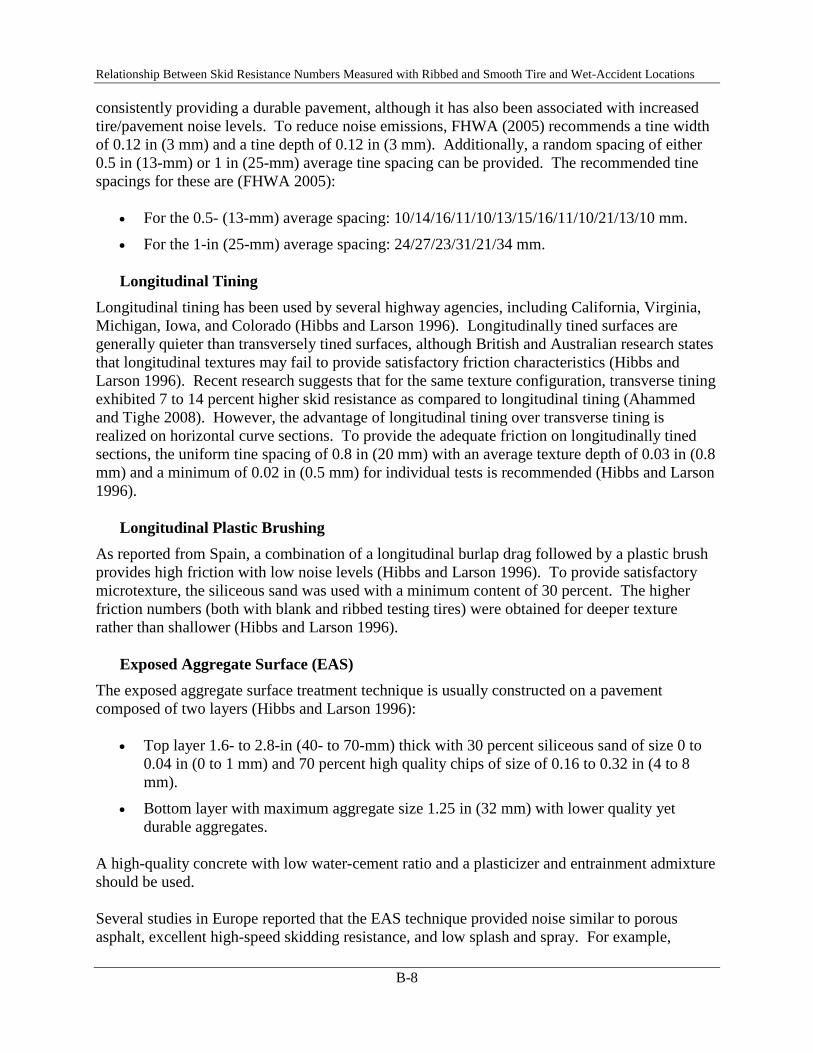
Field Testing Equipment There are four basic types of full-scale friction measuring devices: (1) locked-wheel trailer, (2) side force meter, (3) fixed slip, and (4) variable slip devices. The locked-wheel trailer (see figure A-2) produces 100 percent slip condition and measures braking and drag forces at a moment of peak friction. Two types of tire (ribbed or smooth) are used under this method. According to the ASTM E-274 standard, the friction number, either FN40R (with ribbed tire) or FN40S (with smooth tire), is reported in the test (Henry 2000).
Figure A-2. Photo of a locked-wheel trailer (http://nersp.nerdc.ufl.edu/~tia/5837-
5.pdf).
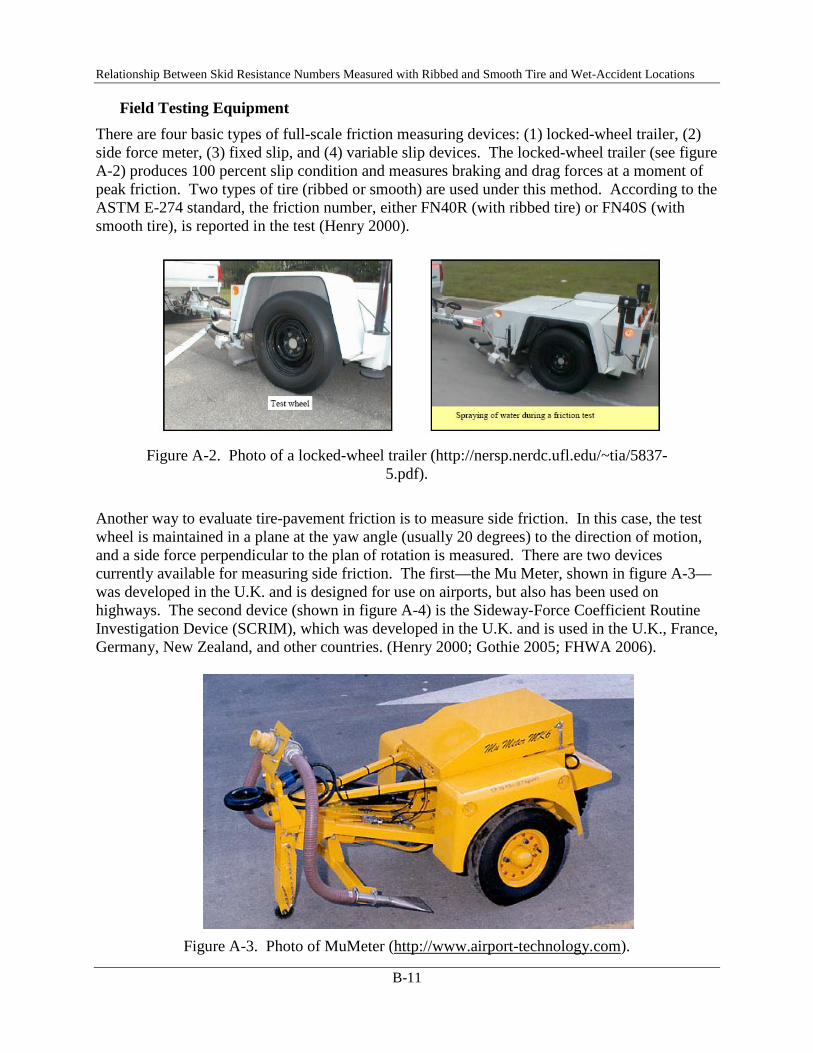
Another way to evaluate tire-pavement friction is to measure side friction. In this case, the test wheel is maintained in a plane at the yaw angle (usually 20 degrees) to the direction of motion, and a side force perpendicular to the plan of rotation is measured. There are two devices currently available for measuring side friction. The first—the Mu Meter, shown in figure A-3—was developed in the U.K. and is designed for use on airports, but also has been used on highways. The second device (shown in figure A-4) is the Sideway-Force Coefficient Routine Investigation Device (SCRIM), which was developed in the U.K. and is used in the U.K., France, Germany, New Zealand, and other countries. (Henry 2000; Gothie 2005; FHWA 2006).
Figure A-3. Photo of MuMeter (http://www.airport-technology.com).

Relationship Between Skid Resistance Numbers Measured with Ribbed and Smooth Tire and Wet-Accident Locations
B-12
.
Figure A-4. Photo of SCRIM (http://www.highwaysmaintenance.com).
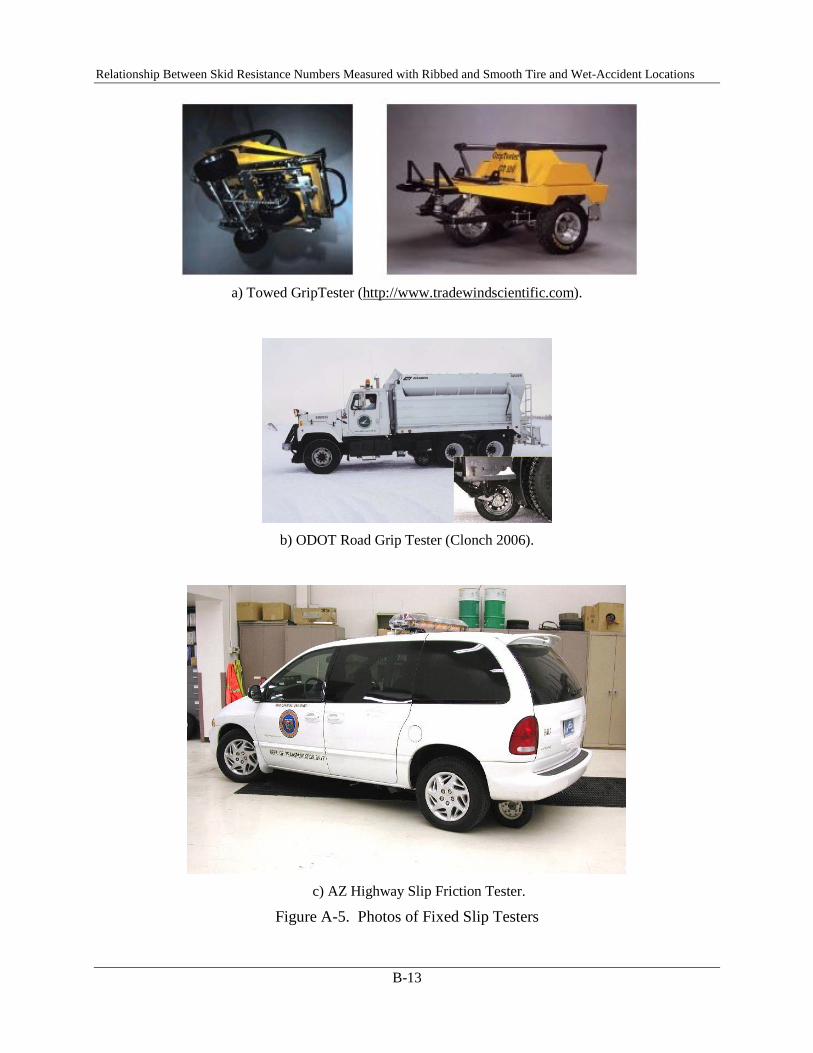
The main advantage of the side-force measuring devices is their ability to measure friction continuously over the length of the test section, whereas locked-wheel devices usually sample friction over the distance corresponding to 1 second of the vehicle travel (Henry 2000). However, because these devices are low slip speed systems, they are sensitive to microtexture, while not reflecting the macrotexture. For this reason, they are usually used in conjunction with a macrotexture measurement (Henry 2000). The third group of friction measuring devices is equipped by a braked wheel that is operated at fixed slip (usually 10 to 20 percent). The horizontal and vertical component of friction can be continuously monitored without excessive wear of tire. A low-speed friction at the slip speed V (percent slip divided by 100) is reported in the test. However, there is no ASTM currently available, which restricts the use of those devices. Nevertheless, they are often used on airports for runway friction evaluation. Several examples of fixed slip devices are shown in figure A-5. The ODOT Road Grip Tester (RGT) (figure A-5b) was developed by Ohio Department of Transportation. This system measures road surface friction by utilizing an existing hydraulic system to deploy and retract a wheel that is located in the front of the drive axle underneath the vehicle or using a wheel mounted to a tow hitch at the rear of the vehicle. The RGT provides the ability to detect deteriorated pavement surface conditions associated with winter weather that are otherwise not visibly evident (Clonch 2006). The Highway Slip Friction Tester used by the Arizona Department of Transportation is currently manufactured by Dynatest. It measures friction continuously and is one of a few of its type currently used by a state DOT for testing on highways. Florida is using a similar device on both airports and highways.
Relationship Between Skid Resistance Numbers Measured with Ribbed and Smooth Tire and Wet-Accident Locations
B-13
a) Towed GripTester (http://www.tradewindscientific.com).
b) ODOT Road Grip Tester (Clonch 2006).
c) AZ Highway Slip Friction Tester.
Figure A-5. Photos of Fixed Slip Testers

Relationship Between Skid Resistance Numbers Measured with Ribbed and Smooth Tire and Wet-Accident Locations
B-14
The final type of field friction measuring device performs a controlled sweep through a range of slip ratios, as required by ASTM E-1859 (Henry 2000). These devices are referred to as “variable slip” testers and are not used in U.S. (except for winter maintenance) but are used in a few European countries (France, Norway, and Denmark) as well as Japan. One variable slip tester (the Norsemeter) is shown in figure A-6. The Norsemeter SALTAR is being used on a winter maintenance research project by Minnesota and Michigan with the objective of optimizing the amount of salt used by continuously monitoring the friction during salt application.
Figure A-6. Image of Norsemeter variable slip tester
(http://www.norsemeter.no/Products/).
As discussed above, each method of measuring friction has its specific advantages, as follows:
• The locked-wheel method simulates emergency braking without anti-lock brakes.
• The side-force method measures the ability to maintain control during curves.
• The fixed and variable slip methods allow for assessing the effects of anti-lock braking systems.
Laboratory Testing Equipment
Laboratory methods are used for evaluating the friction characteristics of core samples or laboratory-prepared samples, and for evaluating the pavement surface friction in the field in the stationary mode. Devices that are currently in use are described in this section. Also, research on promising three-dimensional techniques including photogrammetric methods are discussed. The British Portable Tester (BPT), shown in figure A-7, has been in use since the early 1960s. The BPT complies with ASTM E-303 and is operated by releasing a pendulum from a height adjusted so that a rubber slider contacts the surface over a fixed length. As the rubber slide moves over the surface, the friction reduces the kinetic energy of the pendulum in proportion to the level of friction. The recovered height of the pendulum is measured in terms of British Pendulum Number (BPN) over a range of zero to 140 (Henry 2000).

Relationship Between Skid Resistance Numbers Measured with Ribbed and Smooth Tire and Wet-Accident Locations
B-15
Figure A-7. Photo of British Pendulum Tester (Haydon 2005).
The testing speed of BPT corresponds to the testing slip speed of 6 mi/hr (10 km/hr). The device is sensitive to microtexture due to a low slip speed and therefore, the British Pendulum Number (BPN) reported in the test is used as a surrogate for microtexture. This is very useful because the direct measurement of microtexture is difficult (Henry 2000). The Dynamic Friction Tester (DFTester) was developed in Japan and uses the following operation principle: a motor drives the disk with three rubber sliders until the tangential speed is 55 mi/hr (90 km/hr); water is then applied, the motor is disengaged, and disk contacts with a pavement surface (Henry 2000). The friction force and a speed during the spin down are reported in this method, as specified in ASTM E-1890. The main advantage of DFT is that it is able to measure high-speed friction over a range of 0 to 90 km/hr (0 to 55 mi/hr). Additionally, it provides a good estimate of the friction number of the IFI when used at speed of 12 mi/hr (20 km/hr) together with a texture measurement (Henry 2000). Figure A-8 shows images of the DFTester.
Figure A-8. Images of Dynamic Friction Tester (DFT) (Wilson and Dunn 2005).
Relationship Between Skid Resistance Numbers Measured with Ribbed and Smooth Tire and Wet-Accident Locations
B-16
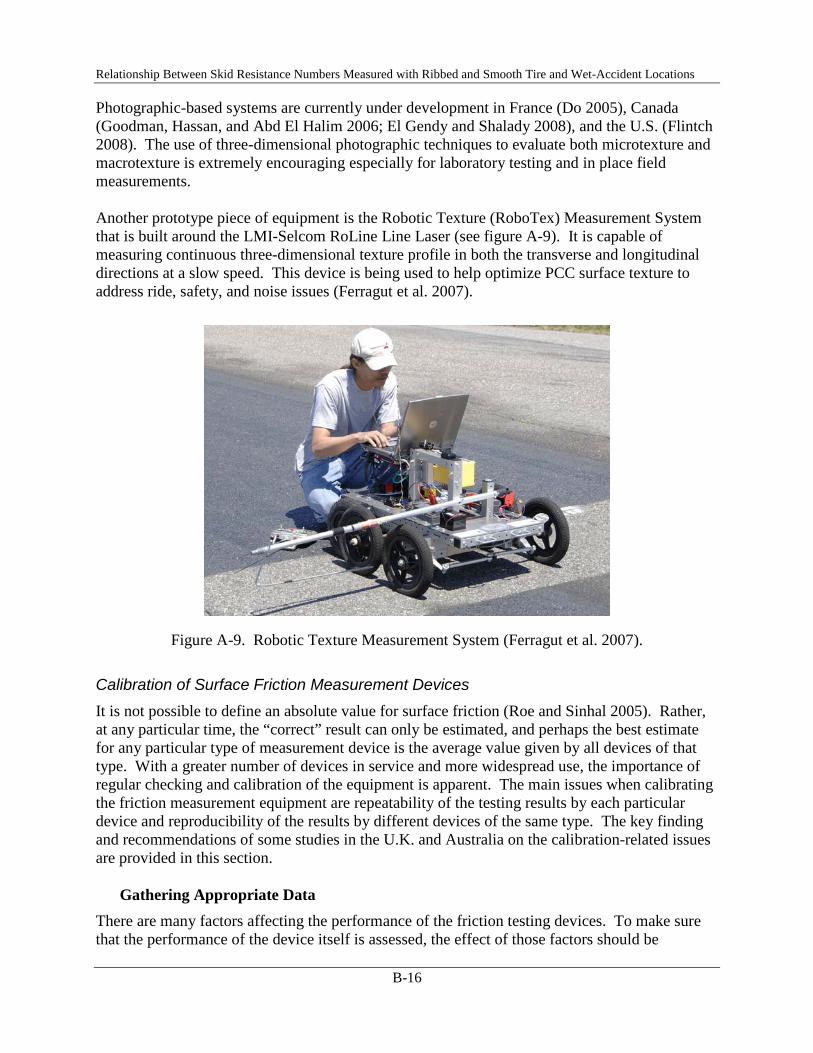
Photographic-based systems are currently under development in France (Do 2005), Canada (Goodman, Hassan, and Abd El Halim 2006; El Gendy and Shalady 2008), and the U.S. (Flintch 2008). The use of three-dimensional photographic techniques to evaluate both microtexture and macrotexture is extremely encouraging especially for laboratory testing and in place field measurements. Another prototype piece of equipment is the Robotic Texture (RoboTex) Measurement System that is built around the LMI-Selcom RoLine Line Laser (see figure A-9). It is capable of measuring continuous three-dimensional texture profile in both the transverse and longitudinal directions at a slow speed. This device is being used to help optimize PCC surface texture to address ride, safety, and noise issues (Ferragut et al. 2007).
Figure A-9. Robotic Texture Measurement System (Ferragut et al. 2007).
Calibration of Surface Friction Measurement Devices It is not possible to define an absolute value for surface friction (Roe and Sinhal 2005). Rather, at any particular time, the “correct” result can only be estimated, and perhaps the best estimate for any particular type of measurement device is the average value given by all devices of that type. With a greater number of devices in service and more widespread use, the importance of regular checking and calibration of the equipment is apparent. The main issues when calibrating the friction measurement equipment are repeatability of the testing results by each particular device and reproducibility of the results by different devices of the same type. The key finding and recommendations of some studies in the U.K. and Australia on the calibration-related issues are provided in this section.
Gathering Appropriate Data There are many factors affecting the performance of the friction testing devices. To make sure that the performance of the device itself is assessed, the effect of those factors should be

Relationship Between Skid Resistance Numbers Measured with Ribbed and Smooth Tire and Wet-Accident Locations
B-17
minimized, or at least randomized. To achieve this, Roe and Sinhal (2005) recommended the following strategies:
• All devices make a similar number of tests.
• All devices test the same surfaces.
• Surfaces are chosen to test the device over a range of skid resistance levels.
• All devices carry out three repeat tests on each surface for each set of measurements.
• All devices make at least three sets of measurements.
• All devices use the same test tires (or a subset of at least three from a pool of four or five standard tires).
• Running order is randomized during the day and an individual machine’s measurements are spread through the day in case track conditions change.
• All devices operate at a constant speed.
• The test line on each surface is clearly identified and the path followed by individual drivers is audited from time to time during the day.
Reference Sections
The set of sections tested during the calibration should include a range of surfacings with an average surface friction levels closer to the typical level found on much of the network. The sections that provide the average surface friction level against which the devices are compared should be used as the reference sections. Note that the average value may vary from day to day during the trials in certain weather conditions (Roe and Sinhal 2005).
Device Repeatability
As reported by Roe and Sinhal (2005), the units of SCRIM Reading (SR) were used at the calibration trials. The SR is the value recorded by the device every 33 ft (10 m) and equals the sideway-force coefficient (SFC) multiplied by 100. The between-run standard deviation on any individual section for any individual device and tire should be 3.0 or less. A research study conducted in Australia (Dardano and Wickham 2005) was concerned with the repeatability of the friction measurements in Sydney Airport performed by the GripTester since 1995. It was suggested that the poor repeatability could be due to the following factors:
• Environment and tire variability: the variability in results that a fully calibrated device will return along the same surface when temperature and tire are different.
• Device variability (reproducibility): the correlation between a device and another device of the same type.
In the Australian study, the measured friction value was adjusted for the change in tire wear (equation A-3) and for the temperature variations (equation A-4) using the normalization procedure.

Relationship Between Skid Resistance Numbers Measured with Ribbed and Smooth Tire and Wet-Accident Locations
B-18
CDMDCDSDGNNF
−−
= * (A-3)
20(*002.0 −−= MTGNNF ) (A-4) where:
NF = Normalized friction value. SD = Standard tire diameter = 260 mm. CD = Chain cog effective diameter = 130 mm. GN = GripTester Number recorded. MD = Measured tire diameter. MT = Mean Temperature, which is the average of air and pavement temperature. The normalized values were then harmonized by using the linear regression approach as shown in equation A-5 below: VVVV NFBAF *+= (A-5) where:
Fv = Harmonized Friction Value. Av = Harmonizing Constant. Bv = Calibration Ratio. NFv = Normalized Friction Value. V = Speed at which the testing was performed.
The normalization and harmonization of the friction testing data allowed the airport engineers in Australia to be confident in the results that the devices produced (Dardano and Wickham 2005)
Overall Fleet Variability
In the U.K. study, the reproducibility of the fleet was checked, so that each approved device gave results consistent with the rest of the fleet during normal surveys (Roe and Sinhal 2005). The maximum standard deviation between the devices means was 2.6 SR units. Because the standard deviation will be influenced by any outlying devices, those devices will be rejected, if necessary, in order to reduce the standard deviation to an acceptable level. When the between-device standard deviation exceeds the maximum permitted level, it will be necessary to identify outlying devices. The following principles were used (Roe and Sinhal 2005):
• Any device that is three standard deviations from the all-device mean would be rejected outright.
• Any device that is between two and three standard deviations from the mean would be subject to further investigation in the context of the overall distribution and performance on the full range of surfacings.

Relationship Between Skid Resistance Numbers Measured with Ribbed and Smooth Tire and Wet-Accident Locations
B-19
In the U.S., the Florida Department of Transportation (FDOT) initiated a field study to assess the level of precision of its own locked-wheel testers for field measurements (Choubane, Holzschuher, and Gokhale 2003). Four testing units measured friction on five sites representing two types of pavement surface: open-graded and dense-graded. The repeatability of the results for each unit and the variability in friction measurements between the units was assessed using statistical analysis of variance. The researchers reported a high level of repeatability and reproducibility of the friction measurements regardless of the surface texture type or level of serviceability. Thus, the standard deviation of around 4 SR units was reported, which is lower than the ASTM requirement. Correlation between Different Friction Measurement Techniques While many different devices have been developed for measuring the friction parameters, one challenge is the ability to compare their results and standards. The correlation between friction measurement techniques has been the subject of many studies. Tests with four friction measuring devices—an electronic recording decelerometer, a GripTester, a runway analyzer and recorder, and a SAAB friction tester—were conducted at Jack Garland Airport, North Bay, Ontario. The correlations between the results obtained with these devices were reported to be between 0.75 and 0.85, which indicates fair agreement of the results considering the winter conditions (snow contamination and icy surface) (Wambold 1996). Researchers in the U.K. (Roe and Sinhal 2005) compared skid measurement results obtained with the SCRIM, the GripTester, and the Pavement Friction Tester (PFT), which is the European analog of the ASTM locked-wheel trailer. An informal trial in 2004 demonstrated good correlation between GripTester and SCRIM (see figure A-10). Additionally, a reasonable correlation was found between the measurements made with the PFT at 12.5 mi/hr (20 km/hr) and those made by the SCRIM at 31 mi/hr (50 km/hr), when the equivalent slip-speed of the SCRIM tire is approximately 10.5 mi/hr (17 km/hr) (see figure A-11). However, although a linear relationship could be deduced, there was wide scatter that limited the value of applying a generalized correlation equation in a specific situation (Roe and Sinhal 2005). Further research is underway using the European Friction Index principles to harmonize the devices and the results are encouraging (Roe and Caudwell 2008). The studies discussed above indicated a need to standardize the measurements from the different devices so they can be compared to one another. The major difficulty is that, although all skid resistance testers use the same basic principles, they perform the testing differently. For example, both the British Pendulum Tester and DF Tester use the rubber slider, but the former operates the pendulum, while the latter uses rotating sliders. Additionally, the locked-wheel testers use different loads and tire sizes, and the slip force testers use different slip levels. The International Friction Index (IFI) has emerged as a harmonized criterion for skid resistance. However, its weakness is the difficulty of having sufficient confidence in precision of the results when compared through the IFI to make them of practical use (Roe and Sinhal 2005). For the purposes of predicting friction at high speed, there is a simple alternative. A texture of 0.05 in (1.25 mm) (volume of the ribbed tire grooves) is added to the texture measured on the road (Viner et al. 2000).

Relationship Between Skid Resistance Numbers Measured with Ribbed and Smooth Tire and Wet-Accident Locations
B-20
0.0 0.2 0.4 0.6 0.8 1.00.0
0.2
0.4
0.6
0.8
1.0SC = 0.823 x GN - 0.046 (R = 0.977)
Mean Grip Number, F-series tyre
Mea
n SC
RIM
Coe
fficie
nt
Figure A-10. Comparison of SCRIM and GripTester in the 1990s (Roe and Sinhal 2005).
0
0.2
0.4
0.6
0.8
1
0 20 40 60 80 100
SR
Fn a
t 20
km/h
OtherPAPLSDTPMACSMAGCTCBCEACSDFCAHRAfit
Figure A-11. Comparison of measurements from PFT with SCRIM on a range
of surfacing types (Roe and Sinhal 2005).
Relationship Between Skid Resistance Numbers Measured with Ribbed and Smooth Tire and Wet-Accident Locations
B-21
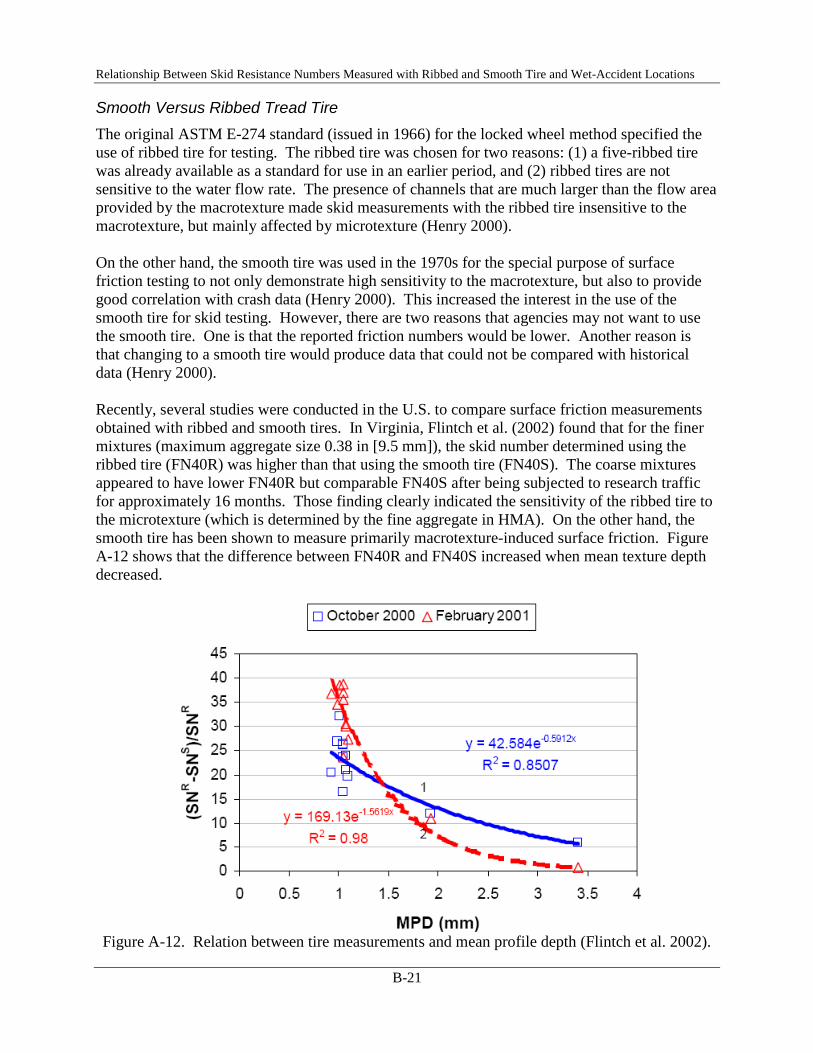
Smooth Versus Ribbed Tread Tire The original ASTM E-274 standard (issued in 1966) for the locked wheel method specified the use of ribbed tire for testing. The ribbed tire was chosen for two reasons: (1) a five-ribbed tire was already available as a standard for use in an earlier period, and (2) ribbed tires are not sensitive to the water flow rate. The presence of channels that are much larger than the flow area provided by the macrotexture made skid measurements with the ribbed tire insensitive to the macrotexture, but mainly affected by microtexture (Henry 2000). On the other hand, the smooth tire was used in the 1970s for the special purpose of surface friction testing to not only demonstrate high sensitivity to the macrotexture, but also to provide good correlation with crash data (Henry 2000). This increased the interest in the use of the smooth tire for skid testing. However, there are two reasons that agencies may not want to use the smooth tire. One is that the reported friction numbers would be lower. Another reason is that changing to a smooth tire would produce data that could not be compared with historical data (Henry 2000). Recently, several studies were conducted in the U.S. to compare surface friction measurements obtained with ribbed and smooth tires. In Virginia, Flintch et al. (2002) found that for the finer mixtures (maximum aggregate size 0.38 in [9.5 mm]), the skid number determined using the ribbed tire (FN40R) was higher than that using the smooth tire (FN40S). The coarse mixtures appeared to have lower FN40R but comparable FN40S after being subjected to research traffic for approximately 16 months. Those finding clearly indicated the sensitivity of the ribbed tire to the microtexture (which is determined by the fine aggregate in HMA). On the other hand, the smooth tire has been shown to measure primarily macrotexture-induced surface friction. Figure A-12 shows that the difference between FN40R and FN40S increased when mean texture depth decreased.
Figure A-12. Relation between tire measurements and mean profile depth (Flintch et al. 2002).

Relationship Between Skid Resistance Numbers Measured with Ribbed and Smooth Tire and Wet-Accident Locations
B-22
The International Friction Index Speed Constant (IFI Sp) incorporating the macrotexture was validated during the study conducted by Flintsch et al. (2003) on HMA pavements. The skid resistance testing indicated disagreement between results obtained using the ribbed and smooth tires. The smooth tire showed noticeably higher dependency on speed than the ribbed tire (see figure A-13). Also, the oscillations in the PNG (PNG = 100/Sp) time were observed, which were believed to be due to seasonal variations (Flintch et al. 2003). Additionally, the measured Sp did not correspond to the computed value. The researchers related this discrepancy to a possible bias provided by the equipment (Flintch et al. 2003).
Figure A-13. Variation of the average percent normalized gradient (PNG) over time:
(a) smooth tire, (b) ribbed tire (Flintch et al. 2003)

Relationship Between Skid Resistance Numbers Measured with Ribbed and Smooth Tire and Wet-Accident Locations
B-23
However, a recent paper evaluating the International Friction Index Coefficients showed that the repeatability of various locked-wheel trailers was considered acceptable and that the reproducibility obtained with the same type of tire was also good at the various speeds considered (Trifiro et al. 2008). The measurements using the locked wheel trailers with the smooth and ribbed tires did not correlate well to each other when considering all pavement surfaces included in the analysis. In all cases, the measurements obtained with the ribbed tire were higher than with the smooth tire. Finally, discrepancies in the IFI F60 values calculated for the different devices suggest that the original coefficients determined during the PIARC experiment may need to be adjusted for the device evaluated before the IFI can be implemented in the participating agencies (Trifiro et al. 2008). A high sensitivity of the smooth tire to macrotexture was also proved by the recent study in Indiana that indicated that the smooth tire may produce better results as the surface texture becomes rougher (the variation in SN decreases) (Li et al. 2005). In another study comparing tire types, the Colorado DOT tested PCC pavement surfaces with different textural characteristics using ribbed and smooth tire (Ardani and Outcalt 2005). In that study, the smooth tire showed significantly lower skid numbers for test sections that received only transverse and longitudinal astro-turf (microtexture) (sections 2 and 8 on figure A-14), and showed higher skid numbers for the rest of the test sections with higher macrotexture surfaces. Finally, both ribbed and smooth tires have their advantages in the evaluation of skid resistance, since both microtexture and macrotexture are important for assessment of pavement texture. However, the smooth tire data is more reliable for determination of friction number F60 than the ribbed tire data if the IFI is used to evaluate the surface friction characteristics (Ardani and Outcalt 2005). A recent synthesis addresses skid resistance on high speed corridors and safety issues related to splash and spray and future research needed to fill the gaps in knowledge. This information suggests that friction test results vary little at speeds greater than 60 mi/hr (96 km/hr) (Button, Fernando, and Middleton 2004). Other Considerations in Friction Testing
Sample Frequency Although fixed slip and side force devices can measure friction continuously, the locked wheel test method allows for measuring friction only at fixed intervals because test tire cannot be locked continuously without excessive tire wear. The ASTM E-274 for locked wheel method establishes the following requirements concerning the uniformity of test sections and reliability of the test:
• Test sections shall be defined as sections of pavement of uniform age and uniform composition that have been subjected to essentially uniform wear” (e.g., uniform gradient, curvature, and the cross-section slope).
• At least five skid resistance measurements, at intervals not greater than 0.6 mi (1 km), should be performed in each section .with the test vehicle at the same lateral position in any one lane and at each specified test speed.

Relationship Between Skid Resistance Numbers Measured with Ribbed and Smooth Tire and Wet-Accident Locations
B-24
Figure A-14. Ribbed-tire and smooth-tire skid numbers (Ardani and Outcalt 2005).
Wheel Path Measured Normally, pavement surface friction is lowest in the left wheelpath (LWP) of the driving lane as compared to the right wheelpath (RWP) (Henry 2000). Therefore, most of state highway agencies (SHAs) measure friction in the LWP. An Indiana study (Li et al. 2005) found that the SN was lower in the inner wheel path than that in outer wheel path, and the driving lanes demonstrated lower friction than passing lanes. France has reported 20 percent variability due to location of test in wheel path (Gothie 2005).

Relationship Between Skid Resistance Numbers Measured with Ribbed and Smooth Tire and Wet-Accident Locations
B-25
Seasonal and Short-Term Variations Pavement surface friction is expected to decrease with pavement age, largely because of two factors (Henry 2000):
• Polishing of aggregate under traffic, which decreases the microtexture.
• Wearing of aggregate, which decreases the macrotexture.
However, seasonal and short-term variations in friction measurements have been observed when taken during different seasons, or before and after rainfall (Hill and Henry 1981; Corsello 1993; Henry 2000). The seasonal effect is expressed in lower friction measurements in late summer and fall compared with those collected in spring and earlier summer. It occurs because the winter conditions (particularly in northern climates), together with winter maintenance operations (snow plowing), are likely to increase the microtexture of the aggregate. For instance, in Texas, the maximum SN was measured during the winter and early spring, and the minimum values were measured in the summer (Jayawickrama and Thomas 1998). The friction measured during dry periods is usually lower than the friction measured shortly after a rainfall (Jayawickrama and Thomas 1998; Kennedy, Haydon, and Donbavand 2005; Donbavand and Kennedy 2008). This occurs because the water applied during the test mixes with dust and oil accumulated on the pavement surface (Henry 2000). Caltrans has recently updated their estimated wet time exposures rates to improve their estimate of wet pavement crashes (Huang, Wang, and Shi 2008). Two agencies (Virginia DOT and the Slovak Road Administration) are known to account for seasonal variations (Henry 2000). Table A-1 indicates that friction can vary depending on the season up to 14 percent. In Australia, seasonal variations as large as two thirds of the above range were noted (Oliver 2005), while in France, seasonal variations up to 30 percent have been noted (Gothie 2005).
Table A-1. Seasonal correction factors (Henry 2000).
Month SLA Multiplier VDOT Reduction (SN) January
February March April May June July
August September
October November December
0.86 0.87 0.87 0.88 0.92 0.98 1.00 1.00 0.96 0.90 0.87 0.86
-3.7 -3.7 -3.1 -1.7 -0.7 -0.3 0.0 0.0 -0.6 -1.7 -3.1 -3.7
Relationship Between Skid Resistance Numbers Measured with Ribbed and Smooth Tire and Wet-Accident Locations
B-26
Hill and Henry (1981) also reported large variations in surface friction over the short term, and previous work by the Ohio DOT (Bazlamit and Reza 2005; Murad 2006) indicated that temperature adjustments to friction testing may be important. Seasonal corrections are now a very important part of the way New Zealand manages skid resistance of its network (Cook, Kennedy, and Newland 2008). However, it should be noted that some studies did not find the seasonal variation in friction to be statistically significant. For example, no significant effect of the air temperature on friction was found in Indiana (Li et al. 2005), whereas work in Washington State (Corsello 1993) concluded that no temperature adjustment was required. The U.K. has a long term study of skid resistance on in-service roads underway (Donbavand and Kennedy 2008; Greene and Caudwell 2008). A total of 39 benchmark sites are being surveyed by the SCRIM three times a year, once in each of the three SCRIM periods (early, mid and late) between May and September. It has been found that the skid resistance for the 2006 and 2007 results are significantly lower than those from the years 2002 to 2005; this suggests that the summer periods for 2006 and 2007 are dryer than they have been in the previous 4 years.
ASTM Tire versus Natural Rubber Tire Special tests were performed to evaluate the effects of temperature and speed on American Society for Testing and Materials (ASTM) tires, as opposed to natural rubber tires (Wambold 1996). In the case of the SAAB friction tester, the natural tire measures considerably below the ASTM tire, whereas in the case of the GripTester, the natural tire still measures lower, but only about half that of the SAAB friction tester (Wambold 1996). The effect of temperature on the two tires of the SAAB friction tester and GripTester showed that, in the case of the SAAB friction tester, the ASTM tire read about the same value throughout the temperature range. However, for the GripTester, both tires gave about the same values (Wambold 1996). The temperature effects on the ASTM and natural tires on the SFT and the GripTester were inconclusive. However, the natural rubber tires appeared to measure lower frictional values than the ASTM tire at all slip speeds (Wambold 1996). The TX DOT is now testing with a smooth tire with nonstandard rubber at 50 mi/hr (80 km/hr). Use of Friction Data In the late 1990s, a survey of the pavement friction measurement and evaluation practices of 43 transportation agencies in the U.S. and Canada was conducted, which revealed the following (Henry 2000):
• Hawaii, Massachusetts, and New Hampshire do not use the friction data at all.
• 28 out of 43 agencies perform network surveys for pavement management.
• 20 out of 37 agencies use friction data on a regular basis to create specifications for restoration of pavements and for newly constructed pavement evaluations.
• 26 out of 40 agencies perform friction testing at the crash sites.
• 5 out of 42 agencies (Michigan, Nebraska, New Jersey, Washington, and NASA) measure friction for winter maintenance on highway and runways.
Relationship Between Skid Resistance Numbers Measured with Ribbed and Smooth Tire and Wet-Accident Locations
B-27
A large amount of friction data has been collected and assessed under the Long Term Pavement Performance (LTPP) program (Titus-Glover and Tayabji 2000). These data can be potentially used for crash and risk assessment analysis, evaluation of the effect of pavement design features, material properties, and construction techniques on skid resistance, and evaluation of the need for intervention to improve skid resistance. In its advisory circular on friction, the Federal Aviation Administration (FAA) identifies desirable friction and texture values for both HMA and PCC airfield pavements (FAA 1997). It also provides useful specifications to implement the process. There have been some recent updates regarding the use of friction data, the most important being the draft guide for pavement friction developed under NCHRP Project 1-43 (Hall et al. 2006). Other recent reports that contain updated information on friction testing are also available (FHWA 2006; Perera, Pulipaka, and Kohn 2006; Noyce et al. 2007). FHWA is currently updating its 1980 technical advisory on skid accident reduction program (FHWA 1980), and has also proposed to revise the rules for the Highway Safety Improvement Program (Federal Register, April 24, 2008). These revised guides should be considered when updating skid resistance management programs. To use the friction data obtained from skid testing effectively, there must be other relevant and complementary data available (e.g., pavement texture, road geometry, rut depth) (Henry 2000). Such data are used with the friction data to develop models and procedures for identifying potential risk and crash areas. It is important to realize that the friction measured in skid testing cannot be used to calculate vehicle-stopping distance for many reasons (Henry 2000). The effect of friction on vehicle-stopping distance is discussed in more detail in a number of publications (Farber et al. 1974; Hall et al. 2006; Noyce et al. 2007). One of the important issues is the significantly greater stopping distances required for trucks compared to automobiles. Pavement Texture Measurement Techniques Microtexture Measurement Currently, there is no system capable of measuring microtexture profiles at highway speeds. Because of the difficulty in measuring microtexture profiles, a surrogate indicator for microtexture is usually obtained. The British Portable Tester (BPT) can be used to evaluate microtexture based on British Pendulum Number (BPN). It also yields the results highly correlated with the friction at zero-speed of the Penn State Model (µ0) (Henry 2000). DFTester measurements taken at the slip speed of 12 mi/hr (20 km/hr) are highly correlated with BPN values (R2=0.86), as the National Aeronautics and Space Administration (NASA) reported based on the results from the Wallops Flight Facility (Henry 2000). Furthermore, the variability among the DFTesters is significantly lower than in the BPTs, which allows for obtaining results that are more reliable (Henry 2000). One of the newer pavement texture testing devices is RoboTex which is a robotic texture measuring system. It is currently being used primarily to evaluate various PCC surfaces (Ferragut et al. 2007).

Relationship Between Skid Resistance Numbers Measured with Ribbed and Smooth Tire and Wet-Accident Locations
B-28
Photogrammetric based techniques to measure both microtexture and macrotexture are being investigated (Do 2005; Waters 2006; Goodman, Hassan, and Abd El Halim 2006; El Gendy and Shalady 2008). Also, a proof–of-concept test of the “static” stereo vision texture measuring system has been conducted at the Virginia Smart Road under the Transportation Pooled Fund Program (Flintsch 2008). These techniques show promise for laboratory mix design evaluations and limited field research studies. In the United Kingdom, SCRIM results are associated with microtexture. Although SCRIM operates at traffic speeds, the slip speed in SCRIM measurements is relatively low. Therefore, it can serve as a surrogate for a microtexture measurement (Henry 2000). Where the macrotexture is lower than 1.0 mm (as indicated by the sand patch), the microtexture required is increased 0.05 SR (Viner, Sinhal, and Parry 2004).
Polished Stone Value and Aggregate Abrasion Value The polished stone value (PSV) is used in U.K., Australia, and New Zealand to assess the susceptibility of aggregate to polishing and to study the relationship between surfacing materials and safety. The procedure includes two steps (Haydon 2005):
1. Accelerated polishing of the aggregate using an accelerated polishing machine (see figure A-15).
2. Determination of the resulting friction using the British Pendulum tester (shown previously in figure A-7).
Figure A-15. Accelerated polishing machine (Haydon 2005).
The aggregate abrasion value (AAV) test measures resistance of the surface to the wear by abrasion under traffic. Poor abrasion resistance can lead to early loss of the texture required for high-speed skid resistance. The test measures different aggregate properties, as compared to the Los-Angeles AAV (LAAV) specified by ASTM C131 (percent weight loss due to abrasion). The problem is that there is no or poor correlation between PSV and AAV (Haydon 2005).

Relationship Between Skid Resistance Numbers Measured with Ribbed and Smooth Tire and Wet-Accident Locations
B-29
The Micro-Deval test is also being used more frequently to evaluate the quality of aggregates. Typical ranges of test results for various aggregate properties, including the Micro-Deval test, are included in the proposed draft guide for pavement friction (Hall et al. 2006)
Polished Stone Value and Skid Resistance Based on the friction surveys conducted in New Zealand, the following relationship between the polished stone value (PSV) and the skid resistance (SR) value was established (Haydon 2005): 6.2*00663.0*100 ++= CVDSRPSV (A-6)
where:
SR = Investigatory level (IL or TL) for the site. CVD = Commercial Vehicles (>3.5 ton)/lane/day at the end of surfacing life. PSV = Polished Stone Value of the surfacing aggregate.
It was found that even the aggregates with high PSV rapidly lose skid resistance. Therefore, more experimental data are needed to better correlate PSV and SR (Haydon 2005). The German Wehner Schulze test is now being proposed within Europe as a replacement for the PSV test (Allen et al. 2008). The test device (see figure A-16) subjects laboratory prepared asphalt samples or cores extracted from the roadway to simulated traffic and measures the change in skidding resistance with time. This test has been accepted by German contractors to predict performance of the mix.
Figure A-16. Wehner Schulze machine (Dunford 2008)

Relationship Between Skid Resistance Numbers Measured with Ribbed and Smooth Tire and Wet-Accident Locations
B-30
A description of the test procedure and the results of an experiment to test asphalt samples using similar PSV aggregate has been reported. Research on the capabilities of this equipment is ongoing in both the UK (Dunford 2008; Allen et al. 2008) and France (Ledee, Delalande, and Dupont 2005). The availability of both a test device and method for proceeding with laboratory measurements not only on polishing resistance of aggregates, but also directly on the wearing course materials (for the purpose of predicting, as of the mix design stage, the skid resistance potential generated under actual site conditions) now appears to be of fundamental importance (Ledee, Delalande, and Dupont 2005). Measuring Macrotexture Measuring pavement macrotexture has been a common practice in Europe for many years. The U.K. has specified macrotexture depths on construction since 1976. France started measuring macrotexture in 2002 (Dupont and Bauduin 2005). Recognition of the importance of the role of pavement macrotexture in providing adequate surface friction is increasing in the U.S. For example, research in North Carolina demonstrated significantly fewer accidents if the mean texture depth was 0.06 in (1.5mm) or greater (Pulugurtha, Kusam, and Patel 2008). The values of low-speed friction and average texture depth, both of which help explain the conventional longitudinal skid resistance measurements, prove insufficient when it comes to predicting the level of skid resistance mobilized with antilock brake systems. Other indices in the area of macrotexture, and more specifically the density and angularity of indenters, play a vital role in the frictional force generation process at the tire/pavement interface (Delanne 2005). A number of different methods have been used to measure surface texture. Some of the most commonly used texture parameters, and the measurement methods used to collect the data needed to compute them, are described below.
Mean Texture Depth (MTD) The mean texture depth (MTD) is a texture characteristic that is determined using the traditional volumetric method (commonly referred to as the “sand patch test,” shown in figure A-17). As specified in ASTM E-965, the volumetric method uses a special tool to spread a specified volume of very small glass spheres (similar to the size of sand particles) on the pavement in a circular motion. The MTD is computed by dividing the known volume of glass spheres by the calculated average of four equally spaced diameters of the circular patch (Henry 2000).
Figure A-17. Sand-patch test (Hanson and Prowell 2004)
Relationship Between Skid Resistance Numbers Measured with Ribbed and Smooth Tire and Wet-Accident Locations
B-31
To provide adequate surface friction, the average MTD should be 0.03 in (0.8 mm) with a minimum of 0.02 in (0.5 mm) for any individual test (Hibbs and Larson 1996). A recent survey found that New Zealand, Quebec, and South Australia specified MTD intervention levels in the 0.015 to 0.035-in (0.4 to 0.9-mm) range on higher speed roadways (Henry 2000). Great Britain has also reported a goal of providing an MTD of 0.06 in (1.5 mm) on their newly constructed PCC pavements (Henry 2000). In the U.S., the Minnesota DOT requires a minimum 0.04-in (1-mm) deep macrotexture for newly constructed PCC pavements with a longitudinal artificial carpet drag (MnDOT 2001). However, it is reported that 0.01 in (0.3 mm )depth is lost the first winter due to snowplowing operations (Izevbekhai and Eller 2008).
Mean Profile Depth (MPD) and Mean Texture Depth (MTD) In the past decade, advances in laser technology and computational power have led to the development of systems that measure pavement longitudinal profile at traffic speeds (Henry 2000). The mean profile depth (MPD) is a statistic computed by analyzing 4-in (102-mm) long segments of the collected profile data. After dividing each segment in half, the average of the highest profile peaks in each half is computed (peaks are measured in relation to a determined zero mean profile). The MPD is then computed as the average of all individual segment peaks averages (Henry 2000). The measured MPD may be used to estimate the more traditional MTD measurement. However, when MPD is used to predict MTD, the result is referred to as an estimated texture depth (ETD). The ETD is comparable to the MTD value that results from the volumetric method (Henry 2000). The expression given for the ETD in the ISO and ASTM practices for calculating MPD is the following (ASTM E-1845):
2.0*8.0 += MPDETD (A-7) where: ETD = Estimated texture depth (mm). MPD = Mean profile depth (mm). The MPD is measured using modern high-speed vehicle-mounted laser-based measuring devices or using portable devices. Two of those devices are briefly described below. The Road Surface Analyzer (ROSAN) system, shown in figure A-18, consists of a van equipped with laser sensors mounted on the front bumper. The instruments can measure the profile accurately at speeds up to 70 mi/hr (112 km/hr) (Henry 2000). The laser measurements are then analyzed and used to compute ETD. However, Flintsch et al. (2003) reported that the laser profiler they tested yielded relationships different than the one used in ASTM E-1845, which suggested a possible bias of approximately 10 percent in the device. Furthermore, some researchers believe that macrotexture measurements on open-graded surfaces are questionable because the laser profiler cannot detect some of the voids that are filled with sand (Flintsch et al. 2003).
Relationship Between Skid Resistance Numbers Measured with Ribbed and Smooth Tire and Wet-Accident Locations
B-32
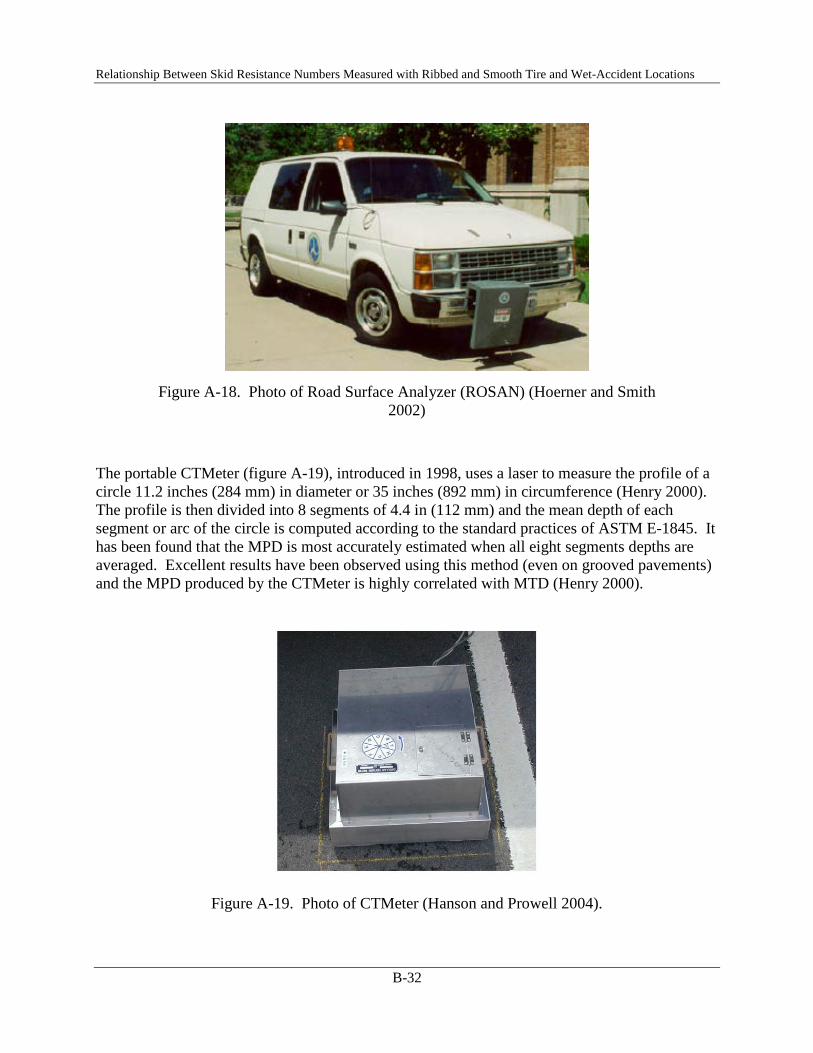
Figure A-18. Photo of Road Surface Analyzer (ROSAN) (Hoerner and Smith
2002)
The portable CTMeter (figure A-19), introduced in 1998, uses a laser to measure the profile of a circle 11.2 inches (284 mm) in diameter or 35 inches (892 mm) in circumference (Henry 2000). The profile is then divided into 8 segments of 4.4 in (112 mm) and the mean depth of each segment or arc of the circle is computed according to the standard practices of ASTM E-1845. It has been found that the MPD is most accurately estimated when all eight segments depths are averaged. Excellent results have been observed using this method (even on grooved pavements) and the MPD produced by the CTMeter is highly correlated with MTD (Henry 2000).
Figure A-19. Photo of CTMeter (Hanson and Prowell 2004).

Relationship Between Skid Resistance Numbers Measured with Ribbed and Smooth Tire and Wet-Accident Locations
B-33
Outflow Time (OFT) The outflow time (OFT) is a texture-related statistic measured using the Outflow Meter (see figure A-20). The Outflow Meter consists of a transparent vertical cylinder that rests on a rubber annulus placed on the pavement. A valve at the bottom of the cylinder is closed and the cylinder is filled with water. The valve is then opened and the time it takes for the water level to fall by a fixed amount is measured, with the measured amount of time reported as the OFT (Hoerner and Smith 2002). The OFT is highly correlated with the MTD and the MPD on non-porous pavements (Henry 2000). The correlation between MTD and OFT, as measured by the FHWA outflow meter for nonporous surfaces at the NASA Wallops Flight Facility, was found to be as follows (Henry 2000):
15.0*58.01−= MTD
OFT (A-8)
where: OFT = Outflow time, seconds. MTD = Mean texture depth, mm.
Figure A-20. Outflow Meter (Hoerner and Smith 2002). Use of Texture Data Henry (2000) identified the following areas where the texture measurements are used by transportation authorities worldwide: routine survey, crash analysis, construction, rehabilitation, and pavement management. According to a survey in the U.S., only five SHAs, as well as NASA, use texture data to evaluate pavement surface, as compared with 26 SHAs using the friction measurements (Henry 2000). Among the U.S. state highway agencies, only Louisiana conducts routine surveys of texture, Minnesota incorporated the texture depth requirements into the warranty policies for newly constructed PCC pavements (MnDOT 2001), and Mississippi and Virginia included texture data in their pavement management system.

Relationship Between Skid Resistance Numbers Measured with Ribbed and Smooth Tire and Wet-Accident Locations
B-34
Several recent studies in the U.K., New Zealand, and Australia (Viner, Sinhal, and Parry 2004; Davies, Cenek, and Henderson 2005; Oliver 2005) indicated that, while the correlation of the crash rate with surface friction appeared to be questionable, the pavement texture depth was found to have a strong relationship with the crash rate. Therefore, including the texture measurements along with friction data in the crash analysis should not be neglected. The relationship between texture and crashes is being evaluated in a number of current projects. New Zealand reports considerable success in reducing total road crashes 17.5 percent over the past 12 years since beginning an annual SCRIM survey and requiring minimum texture depths on new projects (Owen, Cook, and Cenek 2008). The State of Victoria, Australia recently reported on an analysis of the relationship between road surface characteristics and crashes on undivided two-way roads (Cairney and Bennett 2008). Surface condition data from multi-laser profilometer surveys was linked to geometry, traffic, and crash data using GIS and the resulting tables analyzed to investigate the relationships. The three road surface characteristics were either uncorrelated or showed small enough correlations to disregard possible interactions among the variables. Crash rates were higher for road sections with low macrotexture and were also higher for roads where roughness was extreme. No clear relationship emerged between rutting and crash rate. VicRoads has for some years relied on macrotexture as the basis for its rural skid resistance monitoring program, and adopts a minimum SPTD of 0.05 in (1.2) mm in its maintenance guidelines. The NC DOT recently conducted an analysis of macrotexture vs. crash rates on 330 ft (100 m) segments on five different projects (Pulugurtha, Kusam, and Patel 2008). The analysis showed a strong relationship exists between pavement macrotexture and crash incidences on NC roads. Analysis and evaluation indicate that crashes decrease with an increase in pavement macrotexture. Pavement macrotexture greater than or equal to 0.06 in (1.5 mm) but typically less than 0.12 in (3 mm) was considered most appropriate to provide safe and efficient transportation to road users (Pulugurtha, Kusam, and Patel 2008). Finally, the fact that the texture data have not yet seen widespread use may be explained by the false belief that macrotexture is highly correlated with skid numbers, which can be obtained by testing at the traffic speeds. Conversely, it was recently believed that the most reliable macrotexture measuring devices are static and require interruption of the traffic flow, while the laser profiler has not yet reached the desirable level of reliability. Recent research has shown both of these beliefs to be either incorrect or misleading. However, research also has revealed that better information on detailed microtexture and macrotexture characteristics related to specific mixes is necessary to develop prediction of performance and to improve the correlation of texture with both total and wet crash rates. Relationship Between Pavement Texture, Friction Number and Skid Resistance The surface friction of a pavement is an important component of overall road safety. Therefore, there is a desire to predict the changes in surface friction over time using currently available friction and texture data. The following three options have been proposed for predicting the skid resistance (FHWA 1977):

Relationship Between Skid Resistance Numbers Measured with Ribbed and Smooth Tire and Wet-Accident Locations
B-35
1. Obtain the skid number (SNV) at a particular speed by interpolation or extrapolation from SN values obtained at two different speeds.
2. Predict SNV at a specified speed from the measurements of SN40 and from the evaluation of macrotexture.
3. Predict SNV from parameters of microtexture and macrotexture. Interpolation (Extrapolation) Method Based on the data obtained from 31 test sections subjected to three different surface treatments (sprinkle, hot-mix, and seal-coat) and three speeds of testing (40, 50, and 60 mi/hr [64, 80, and 96 km/hr]), the linear relationship between the test speed and SN was analyzed by linear regression method. As shown in figure A-21, the results yielded high coefficients of correlation between predicted and measured SN50 (r = 0.99 for interpolation and r = 0.98 for extrapolation), while the extrapolation errors were larger. Nevertheless, the variations were tolerable with standard deviation of 1.66SN (FHWA 1977).
Figure A-21. Comparison of two prediction equations (FHWA 1977).

Relationship Between Skid Resistance Numbers Measured with Ribbed and Smooth Tire and Wet-Accident Locations
B-36
Prediction of SNV from the Measurement of SN40 and from the Evaluation of Macrotexture
Texture and Friction in Asphalt Pavements According to a model developed by the European corporation ENSCO, the skid number SNV at a specified speed V can be derived from the skid number SN40 obtained at the speed of 40 mi/hr (64 km/hr) and the speed gradient PNG, as follows:
100)40(
40
−−=
VPNG
V eSNSN (A-9) where: SNV = Skid number at a specified speed V. V = Speed of testing, mi/hr. SN40 = Skid number at the speed of 40 mi/hr (64 km/hr)
PNG = Percent normalized gradient (the speed gradient times 100 divided by the friction).
The gradient PNG was modeled in the ENSCO procedure based on the West Virginia asphalt pavement texture data. The mean texture depth (MTD) measured by sand-patch method was used as a predictor, and the following exponential relationship was modeled: )(** MTDBeAPNG −= (A-10) where: MTD = Mean texture depth, mm A, B = Regression coefficients The Pennsylvania Transportation Institute (PTI) independently developed a different model based on the same (West Virginia) data. This model involved the power relationship between PNG and MTD, expressed as follows: DMTDCPNG −= )(* (A-11)
where C and D are regression coefficients. As can be observed from figure A-22, the PTI model corresponds well with the ENSCO model for values of MTD not exceeding 0.02 in (0.5 mm) and PNG calculated for speed varying between 30 and 40 mi/hr (48 to 64 km/hr). However, for deeper texture, the PTI tends to predict much higher PNG compared with the ENSCO model, which results in underestimating skid resistance (SNV). Nevertheless, the field measurements conducted in Texas to verify those models yielded a very good correlation between predicted and measured skid resistance at a speed of 60 mi/hr (96 km/hr) (SN60), as shown in figure A-23 (FHWA 1977).

Relationship Between Skid Resistance Numbers Measured with Ribbed and Smooth Tire and Wet-Accident Locations
B-37
Figure A-22. Comparison of equations for predicting PNG from
macrotexture (sand-patch) measurements (FHWA 1977).
Figure A-23. Predicted versus measured SN60 from Texas study (FHWA 1977).
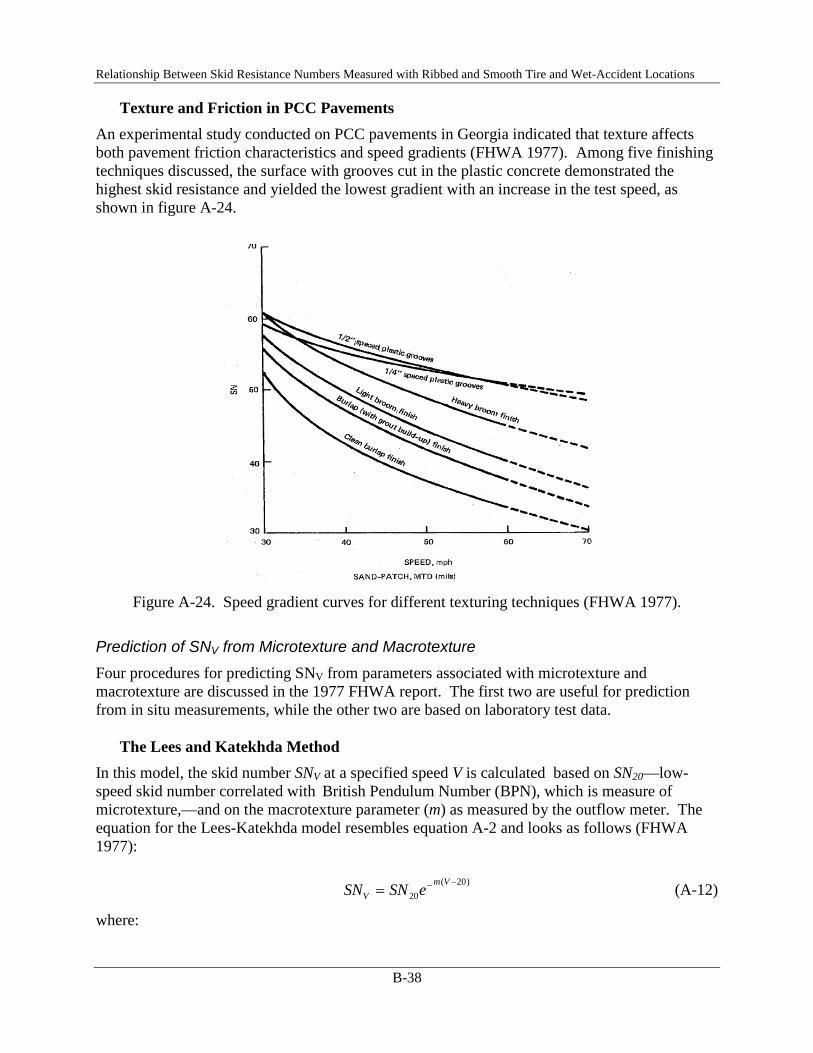
Relationship Between Skid Resistance Numbers Measured with Ribbed and Smooth Tire and Wet-Accident Locations
B-38
Texture and Friction in PCC Pavements An experimental study conducted on PCC pavements in Georgia indicated that texture affects both pavement friction characteristics and speed gradients (FHWA 1977). Among five finishing techniques discussed, the surface with grooves cut in the plastic concrete demonstrated the highest skid resistance and yielded the lowest gradient with an increase in the test speed, as shown in figure A-24.
Figure A-24. Speed gradient curves for different texturing techniques (FHWA 1977).
Prediction of SNV from Microtexture and Macrotexture Four procedures for predicting SNV from parameters associated with microtexture and macrotexture are discussed in the 1977 FHWA report. The first two are useful for prediction from in situ measurements, while the other two are based on laboratory test data.
The Lees and Katekhda Method
In this model, the skid number SNV at a specified speed V is calculated based on SN20—low-speed skid number correlated with British Pendulum Number (BPN), which is measure of microtexture,—and on the macrotexture parameter (m) as measured by the outflow meter. The equation for the Lees-Katekhda model resembles equation A-2 and looks as follows (FHWA 1977): )20(
20−−=
VmV eSNSN (A-12)
where:
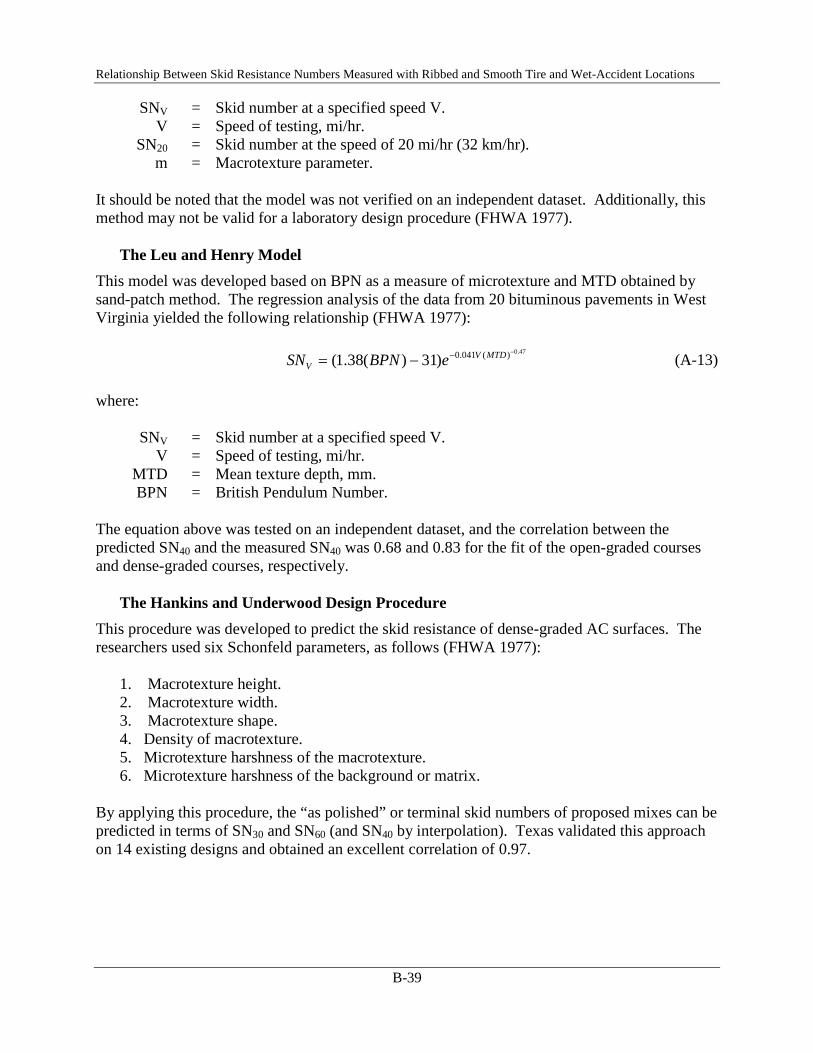
Relationship Between Skid Resistance Numbers Measured with Ribbed and Smooth Tire and Wet-Accident Locations
B-39
SNV = Skid number at a specified speed V. V = Speed of testing, mi/hr. SN20 = Skid number at the speed of 20 mi/hr (32 km/hr). m = Macrotexture parameter. It should be noted that the model was not verified on an independent dataset. Additionally, this method may not be valid for a laboratory design procedure (FHWA 1977).
The Leu and Henry Model
This model was developed based on BPN as a measure of microtexture and MTD obtained by sand-patch method. The regression analysis of the data from 20 bituminous pavements in West Virginia yielded the following relationship (FHWA 1977):
47.0)(041.0)31)(38.1(−−−= MTDV
V eBPNSN (A-13) where: SNV = Skid number at a specified speed V. V = Speed of testing, mi/hr. MTD = Mean texture depth, mm. BPN = British Pendulum Number. The equation above was tested on an independent dataset, and the correlation between the predicted SN40 and the measured SN40 was 0.68 and 0.83 for the fit of the open-graded courses and dense-graded courses, respectively.
The Hankins and Underwood Design Procedure
This procedure was developed to predict the skid resistance of dense-graded AC surfaces. The researchers used six Schonfeld parameters, as follows (FHWA 1977):
1. Macrotexture height. 2. Macrotexture width. 3. Macrotexture shape. 4. Density of macrotexture. 5. Microtexture harshness of the macrotexture. 6. Microtexture harshness of the background or matrix.
By applying this procedure, the “as polished” or terminal skid numbers of proposed mixes can be predicted in terms of SN30 and SN60 (and SN40 by interpolation). Texas validated this approach on 14 existing designs and obtained an excellent correlation of 0.97.
Relationship Between Skid Resistance Numbers Measured with Ribbed and Smooth Tire and Wet-Accident Locations
B-40
Relationship Among Surface Characteristics and Roadway Safety Safety (reducing deaths, injuries and traffic delays) on public roads and highways is becoming a prevailing concern to transportation authorities, as well as to highway users. While many other factors (driver awareness, driver behavior, automobile safety features, and so on) affect road safety, poor pavement surface parameters (including surface friction and texture) are reported to contribute to (not cause) approximately 30 percent of the annual fatalities in U.S. (Larson 2005). Before analyzing the relationship between safety and its influencing factors, the quantitative and qualitative criteria of road safety are described in the following sections. Definitions of Roadway Safety Criteria This section describes quantitative and qualitative definitions of road safety criteria used by the transportation authorities in the U.S. and overseas. It also discusses the approach to a crash data assessment. Crash Risk When road safety is assessed, the crash risk, or the risk of involvement in an injury-producing crash, is used as the primary criterion. It is usually defined as a qualitative parameter (e.g., high, moderate, and low crash risk), although it is assessed using quantitative components (Haydon and Rambisheswar 2005). Thus, according to the Australian guidelines of risk management, risk has three components: the hazard, the consequence of that hazard (safety, environmental and economic) and the likelihood with which the hazard occurs, or is expected to occur (Haydon and Rambisheswar 2005). These three terms can be combined, as shown below. Riskhazard = Consequence x Likelihood (A-14) Figure A-25 illustrates the risk matrix for the Aukland city network obtained by production of the consequence and likelihood matrices (Haydon and Rambisheswar 2005). The consequence matrix is associated with each hazardous situation and takes into account speed, environment, visibility, event category (e.g. pedestrian crossing, one-way bridges, and so on), and potential skid hazard (in Australia and NZ, this is related to the use of PSV 52-54 aggregates). The likelihood matrix involves traffic volume as an indicator of the exposure to the risk suggesting that high traffic volumes are usually associated with greater crash risk. The quantitative values of likelihood and consequences are translated to the qualitative descriptors associated with the risk investigation routine, and the risk matrix is created as shown in figure A-25. The letters in side each cell depict high (H), medium (M), and low (L) level of the crash risk, while the digit presents the number of sites associated with this level of the crash risk. Crash Rate and Crash Density The crash rate is one of the criteria of the crash risk used in New Zealand (Kennedy, Haydon, and Donbavand 2005). It is defined as a ratio of the total average number of injury crashes per site over the total average daily number of vehicles entering the site over year divided by 108. Usually, the crash rate is used to assess the existing investigatory levels of surface friction and to establish the new ones, when the crash rates changes.

Relationship Between Skid Resistance Numbers Measured with Ribbed and Smooth Tire and Wet-Accident Locations
B-41
Consequence
Likelihood Insignificant (No injuries)
Minor (First Aid required)
Moderate (Med/Hospital
treatment)
Major (Extensive
injury)
Critical (Fatal, v.serious
injury) A
(almost certain)
H-0 H-0 E-0 E-0 E-0
B (likely) M-0 H-6 H-0 E-0 E-0
C (possible) L-9 M-29 H-9 E-3 E-0
D (unlikely) L-15 L-22 M-10 H-4 E-0
E (rare) L-59 L-65 M-7 H-4 H-0
Figure A-25. Skid risk matrix for Auckland city network (Haydon and Rambisheswar 2005).
The crash density is the number of crashes per year for each kilometer of the road and is calculated for each of the sites (Kennedy, Haydon, and Donbavand 2005). This factor does not depend on traffic and, when used in conjunction with the crash rate, can be very useful in the investigation of road safety issues. Crash Data Assessment Before linking crash data with the influencing factors, it should be assessed in terms of site classification and crash location. The practice of crash site classifications differs between the transportation agencies, as do the crash location techniques. However, the main goal of the crash data assessment is identifying the relationship between pavement geometric characteristics, friction measurements, and prevailing climatic conditions and the crash data. Crash Database and Site Classifications
U.S. Experience Larson (2005) reported that the Highway Safety Information System (HSIS) is a comprehensive multi-State safety database containing crash, road inventory, and traffic volume data from nine state (California, Illinois, Maine, Michigan, Minnesota, North Carolina, Ohio, Utah, and Washington State) roadway systems. He noted that, although the HSIS data are used for studying the current safety issues and for evaluating the effectiveness of crash countermeasures, the HSIS system does not include detailed pavement condition and surface characteristics data (Larson 2005). However, the expected publication of the Highway Safety Manual in the U.S. in 2009 includes safety tools (the Integrated Highway Safety Design Model-IHSDM and the SafetyAnalyst model) to evaluate these issues.

Relationship Between Skid Resistance Numbers Measured with Ribbed and Smooth Tire and Wet-Accident Locations
B-42
Council and Harkey (2006) emphasized the need of improving safety data in the U.S. before making sound decision on the roadway design and operation. The authors suggested the following strategies to overcome deficiencies in safety databases (Council and Harkey 2006):
• Increase support for both safety programs and safety information systems from top-level administrators in State and local transportation agencies.
• Define good inventory data and institutionalize continual improvement toward established performance measures.
• Make safety data easier to collect, store, and use.
• Increase the use of critical safety analysis tools.
• Store and link safety data with critical nonsafety data.
U.K. Experience A comprehensive safety study was conducted in the U.K. based on the English trunk roads database (Viner, Sinhal, and Parry 2005). In this database, the network was divided into lengths of 1660 ft (500 m) on motorways and 660 ft (200 m) for other roads. All crash sites were classified into 13 site categories, as shown in table A-2, and were linked to the pavement condition and road geometry data available from routine surveys of the trunk road network. Details of over 100,000 personal injury crashes recorded in the period between 1994 and 2000 were examined, along with other applicable information such as the condition of the road at the time of the crash (wet/dry) and whether skidding was involved. However, it is known that skidding accidents are significantly underreported, and in a subsequent study, it was decided to incorporate all accidents that occurred on wet/damp surfaces, not just wet skidding accidents (Morrison, Grant, and Donbavand 2008).
New Zealand Experience The 22,000-mi (35,000-km) long network safety database was analyzed in New Zealand (Davies, Cenek, and Henderson 2005). In that study, the crash data was divided into the following four subsets:
• All injury and fatal crashes.
• Selected crashes involving different types of vehicle movement (see table A-3).
• Wet weather crashes.
• Crashes satisfying both wet and selected criteria. The researchers reported that only about 75 percent of data could be retrieved, largely due to the following reasons: (1) insufficient data about the location, (2) location data do not correspond to a valid section of state highway, (3) location not surveyed by Sideway-Force Coefficient Routine Investigation Device (SCRIM).
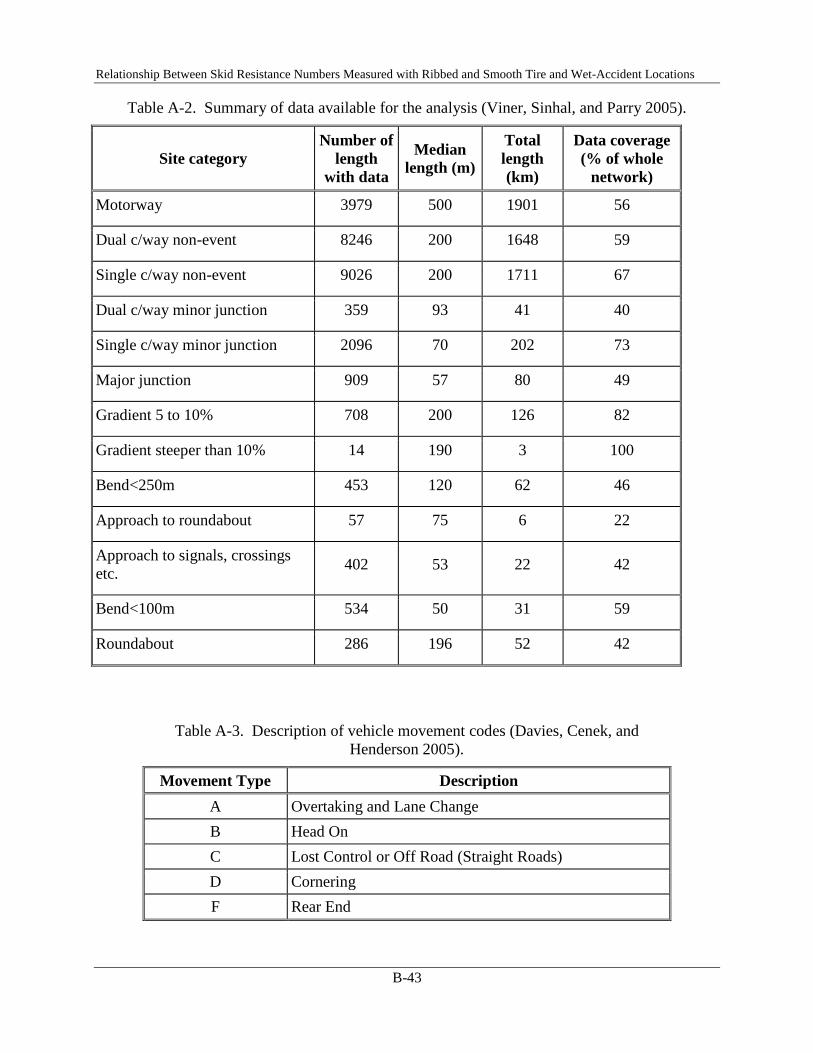
Relationship Between Skid Resistance Numbers Measured with Ribbed and Smooth Tire and Wet-Accident Locations
B-43
Table A-2. Summary of data available for the analysis (Viner, Sinhal, and Parry 2005).
Site category Number of
length with data
Median length (m)
Total length (km)
Data coverage (% of whole
network)
Motorway 3979 500 1901 56
Dual c/way non-event 8246 200 1648 59
Single c/way non-event 9026 200 1711 67
Dual c/way minor junction 359 93 41 40
Single c/way minor junction 2096 70 202 73
Major junction 909 57 80 49
Gradient 5 to 10% 708 200 126 82
Gradient steeper than 10% 14 190 3 100
Bend<250m 453 120 62 46
Approach to roundabout 57 75 6 22
Approach to signals, crossings etc. 402 53 22 42
Bend<100m 534 50 31 59
Roundabout 286 196 52 42
Table A-3. Description of vehicle movement codes (Davies, Cenek, and Henderson 2005).
Movement Type Description A Overtaking and Lane Change B Head On C Lost Control or Off Road (Straight Roads) D Cornering F Rear End

Relationship Between Skid Resistance Numbers Measured with Ribbed and Smooth Tire and Wet-Accident Locations
B-44
Locating Crashes The transportation authorities in the U.S. use different methods of crash site identification, as was reported in a 1990 survey (Dahir and Grambling 1990). When asked how the crash locations are identified and reported, 52 percent of the agencies answered that they use a milepost system, 24 percent reported using a variation of a log mile, and the remaining 24 percent of the participants used nodes of the nearest landmark. The participants of the survey reported a great variability in the accuracy of the crash location. In 32 of 50 agencies surveyed, it varied from 0.01 mile (0.016 km) to 0.5 mile (0.8 km). Eight agencies reported the accuracy over the range of 40 to 93 percent. The other 10 agencies gave descriptive responses (2 − good, 1 − fairly good, 2 − as good as report, 1 − poor to excellent, 2 – unknown) (Dahir and Grambling 1990). Finally, the survey indicated concern about how many of the crashes reported are located with sufficient accuracy to satisfy the analysis requirements of the data. Improved tools for locating crashes are being developed in conjunction with the development of the Highway Safety Manual. Information on GIS based Safety Tools is available from the FHWA Turner-Fairbank Highway Research Center. Additional information on using new technology in safety analysis is found in a recent NCHRP synthesis (Ogle 2007). Overseas, researchers have utilized advanced techniques for reporting crash locations. For example, in the U.K., researchers used a GIS package (Viner, Sinhal, and Parry 2004), while in New Zealand, researchers reported using X/Y coordinates of crashes to the nearest centerline point of the appropriate road section (Davies, Cenek, and Henderson 2005). Nevertheless, there exists a concern about the precision of locating the crash, if the section length is small. Haydon (2005) found that instability in the data was influenced by the following factors: (1) small sample size (small amount of data), (2) short sections length (166 ft [50 m]), and (3) relatively great tolerance permitted by the local marking standard (33 ft [10m] +0.3 percent). As a result, the crash location could be in error of 150 to 230 ft (45 to 70 m) over a 9.5 to 12.5 mile (15 to 20 km) route. A new method of referencing skid resistance measurements has been developed in New Zealand. The use of a differential global position system is used to produce an improved method of location along a linear-based referencing system. One obvious deficiency of this system is in locations where GPS coverage is not available (Blagdon, Kennedy, and Mitchell 2008). After the crash data are assessed, as discussed above, the next step is to identify the factors affecting safety and analyze the relationship between those factors and crash risk, as presented in the next section. Factors Affecting Safety Understanding the factors affecting road safety is vital for minimizing the number of roadway crashes. The results from a number of crash investigations have suggested that there are relationships between crash occurrence and pavement conditions. Researchers have not yet reached an agreement regarding which factor is most important to safety. For instance, some research identified the environmental and climatic conditions as most important for drivers (Tighe et al. 2000). However, other investigations estimate that poor surface conditions

Relationship Between Skid Resistance Numbers Measured with Ribbed and Smooth Tire and Wet-Accident Locations
B-45
including low friction and inadequate pavement texture contribute to approximately 30 percent of annual highway fatalities (Larson 2005). This section documents the findings from several studies on the investigation of the following groups of factors that potentially affect road safety:
• Pavement surface characteristics (skid resistance and texture).
• Pavement roughness (IRI) and surface distresses (ruts, faults, potholes, cracks and others).
• Pavement geometric design (gradient, horizontal curvature, cross-sectional slope).
• Other factors (environmental and weather conditions, visibility of the surface, paving materials and pavement mix design, lane marking, safety signs, and roadside obstacles).
Analysis Approach
Choosing Variables and Data Collection The texture depth (MPD) and skid resistance (SCRIM coefficient) were collected to evaluate the relationship between surface friction and number of crashes in the U.K. (Viner, Sinhal, and Parry 2004) and New Zealand (Davies, Cenek, and Henderson 2005). Other pavement data collected by the SCRIM device and used in the analysis included:
• Gradient, percent.
• Horizontal curvature radius, m.
• Cross-sectional slope, percent.
• International Roughness Index (IRI), m/km.
• Rut depth, mm. The data were collected over 33 ft (10 m) intervals (with the exception that IRI and rut depth were obtained at 66 ft [20 m] intervals) and were linked to the crash data by the survey year.
Methods of the Data Analysis Two outstanding studies related to the investigation of the relationship between surface characteristics and road safety in the U.K. and New Zealand are discussed below in terms of the analysis approach.
Viner, Sinhal, and Parry 2004
A two-stage analysis was conducted in the U.K. study based on the data collected from English trunk roads (Viner, Sinhal, and Parry 2004). First, the mean and 95 percentile crash risk was calculated for each site category to relate the crash rate to the specific range of investigatory levels (IL) of skid resistance. Crash risk was defined as the total number of crashes per 100 million-vehicle km driven. Then, the crash models were developed using a Generalized Linear Modeling (GLM) approach to evaluate the effect of other factors, such as traffic flow, road condition and geometry, on the skid resistance. All variables that were significant individually were then combined in a model of the form (Viner, Sinhal, and Parry 2004):

Relationship Between Skid Resistance Numbers Measured with Ribbed and Smooth Tire and Wet-Accident Locations
B-46
)exp(*** 2211 ii xaxaxaLQkR ++= βα (A-15)
where:
R = Number of crashes. Q = Traffic flow. L = Length of the road section. x1 to xi = Other variables including the skid resistance. k, α, β = Regression coefficients. a1 to ai = Regression coefficients. Any variables found to be non-significant in the combined model were dropped, starting with the least significant, until a final model was reached and the contribution of skid resistance could be assessed for each site category (backward-eliminating method of regression analysis).
Davies, Cenek, and Henderson 2005
To evaluate the effect of skid resistance and texture depth along with other pavement characteristics on crash risk in the New Zealand state highway network, the analysis of the crash and road data was conducted using two methods:
1) One-way and two-way table analysis to indicate the factors affecting the crash risk.
2) Regression analysis based on Poisson’s distribution to identify the important variables and estimate their influence.
One-Way Tables
Segments of the State Highway network were divided into categories using only one road characteristic (e.g. Annual Daily Traffic [ADT], horizontal curvature [R], SCRIM Coefficient [SC]) and average crash rate for each category. The results are summarized in table A-4, presenting crash rate versus the SCRIM coefficient.
Table A-4. Classification by pavement skid resistance (Davies, Cenek, and Henderson 2005).
SCRIM Coefficient (SC)
Road Length (km)
Number of Crashes between 1997 & 2002
Total Traffic Exposure (106 v-km)
Crash Rate (108 vkt)
SC < 0.3 18 40 150 27
0.3 < SC < 0.4 294 730 3125 23
0.4 < SC < 0.5 2610 5144 28048 18
0.5 < SC < 0.6 4953 5421 32649 17
0.6 < SC < 0.7 2046 1287 7637 17
SC > 0.7 116 62 372 17
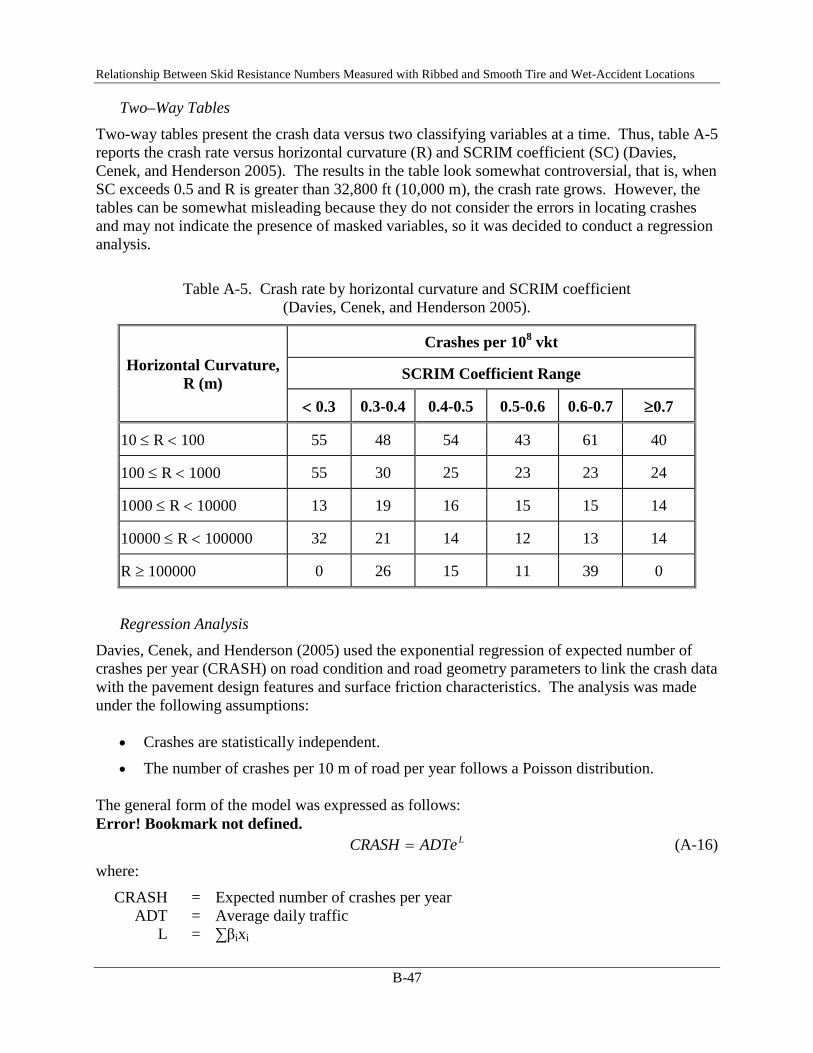
Relationship Between Skid Resistance Numbers Measured with Ribbed and Smooth Tire and Wet-Accident Locations
B-47
Two–Way Tables Two-way tables present the crash data versus two classifying variables at a time. Thus, table A-5 reports the crash rate versus horizontal curvature (R) and SCRIM coefficient (SC) (Davies, Cenek, and Henderson 2005). The results in the table look somewhat controversial, that is, when SC exceeds 0.5 and R is greater than 32,800 ft (10,000 m), the crash rate grows. However, the tables can be somewhat misleading because they do not consider the errors in locating crashes and may not indicate the presence of masked variables, so it was decided to conduct a regression analysis.
Table A-5. Crash rate by horizontal curvature and SCRIM coefficient (Davies, Cenek, and Henderson 2005).
Horizontal Curvature, R (m)
Crashes per 108 vkt
SCRIM Coefficient Range
< 0.3 0.3-0.4 0.4-0.5 0.5-0.6 0.6-0.7 ≥0.7
10 ≤ R < 100 55 48 54 43 61 40
100 ≤ R < 1000 55 30 25 23 23 24
1000 ≤ R < 10000 13 19 16 15 15 14
10000 ≤ R < 100000 32 21 14 12 13 14
R ≥ 100000 0 26 15 11 39 0
Regression Analysis
Davies, Cenek, and Henderson (2005) used the exponential regression of expected number of crashes per year (CRASH) on road condition and road geometry parameters to link the crash data with the pavement design features and surface friction characteristics. The analysis was made under the following assumptions:
• Crashes are statistically independent.
• The number of crashes per 10 m of road per year follows a Poisson distribution. The general form of the model was expressed as follows:
LADTeCRASH =Error! Bookmark not defined. (A-16)
where:
CRASH = Expected number of crashes per year ADT = Average daily traffic L = ∑βixi
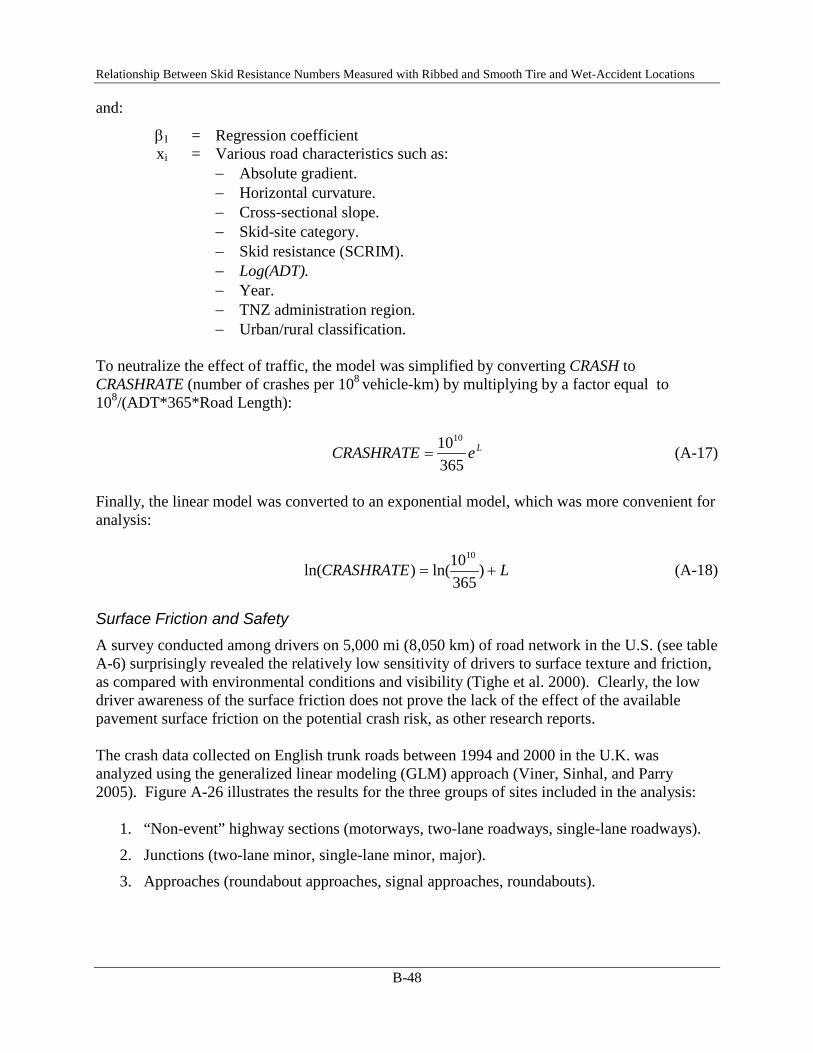
Relationship Between Skid Resistance Numbers Measured with Ribbed and Smooth Tire and Wet-Accident Locations
B-48
and:
βI = Regression coefficient xi = Various road characteristics such as:
− Absolute gradient. − Horizontal curvature. − Cross-sectional slope. − Skid-site category. − Skid resistance (SCRIM). − Log(ADT). − Year. − TNZ administration region. − Urban/rural classification.
To neutralize the effect of traffic, the model was simplified by converting CRASH to CRASHRATE (number of crashes per 108 vehicle-km) by multiplying by a factor equal to 108/(ADT*365*Road Length):
LeCRASHRATE3651010
= (A-17)
Finally, the linear model was converted to an exponential model, which was more convenient for analysis:
LCRASHRATE += )36510ln()ln(
10
(A-18)
Surface Friction and Safety A survey conducted among drivers on 5,000 mi (8,050 km) of road network in the U.S. (see table A-6) surprisingly revealed the relatively low sensitivity of drivers to surface texture and friction, as compared with environmental conditions and visibility (Tighe et al. 2000). Clearly, the low driver awareness of the surface friction does not prove the lack of the effect of the available pavement surface friction on the potential crash risk, as other research reports. The crash data collected on English trunk roads between 1994 and 2000 in the U.K. was analyzed using the generalized linear modeling (GLM) approach (Viner, Sinhal, and Parry 2005). Figure A-26 illustrates the results for the three groups of sites included in the analysis:
1. “Non-event” highway sections (motorways, two-lane roadways, single-lane roadways).
2. Junctions (two-lane minor, single-lane minor, major).
3. Approaches (roundabout approaches, signal approaches, roundabouts).

Relationship Between Skid Resistance Numbers Measured with Ribbed and Smooth Tire and Wet-Accident Locations
B-49
Table A-6. Classes of factors associated with safety attributes (Tighe et al. 2000).
Class of Factors Safety Attributes or Indicators Sensitivity of Drivers
Surface Texture or Friction
• macrotexture and microtexture characteristics, such as International Friction Index (IFI)
• skid resistance or skid number measures
• vehicle tire type standards
Low
Pavement Roughness or Riding Quality
• riding comfort rating, or roughness, such as International Roughness Index (IRI)
• roughness vs. speed relationship
High
Pavement Surface Distress
• severity and extent of surface distresses, such as ruts, faults, potholes, cracks, spalls, etc.
• distress index
Medium
Pavement Geometric Design and Location
• widths of lanes and shoulders, median, and pedestrian paths, paved or gravel shoulders
• cross slopes of pavement surface
Medium
Visibility of Pavement Surface Features
• pavement surface color and reflectivity
• lane markings and signings • visibility at night and bad
weather conditions
High
Pavement Materials and Pavement Mix Design
• type of pavement • texture and color of paving
materials • mineralogy and anti-skid
properties
Low
Road Safety Measures and Facilities
• safety warning signs • safety protection facilities High
Environmental and Weather Conditions
• place and time of crash occurrence
• roadside obstacles and safety facilities
• precipitation (fog, rain, snow) and wind, etc.
Very High
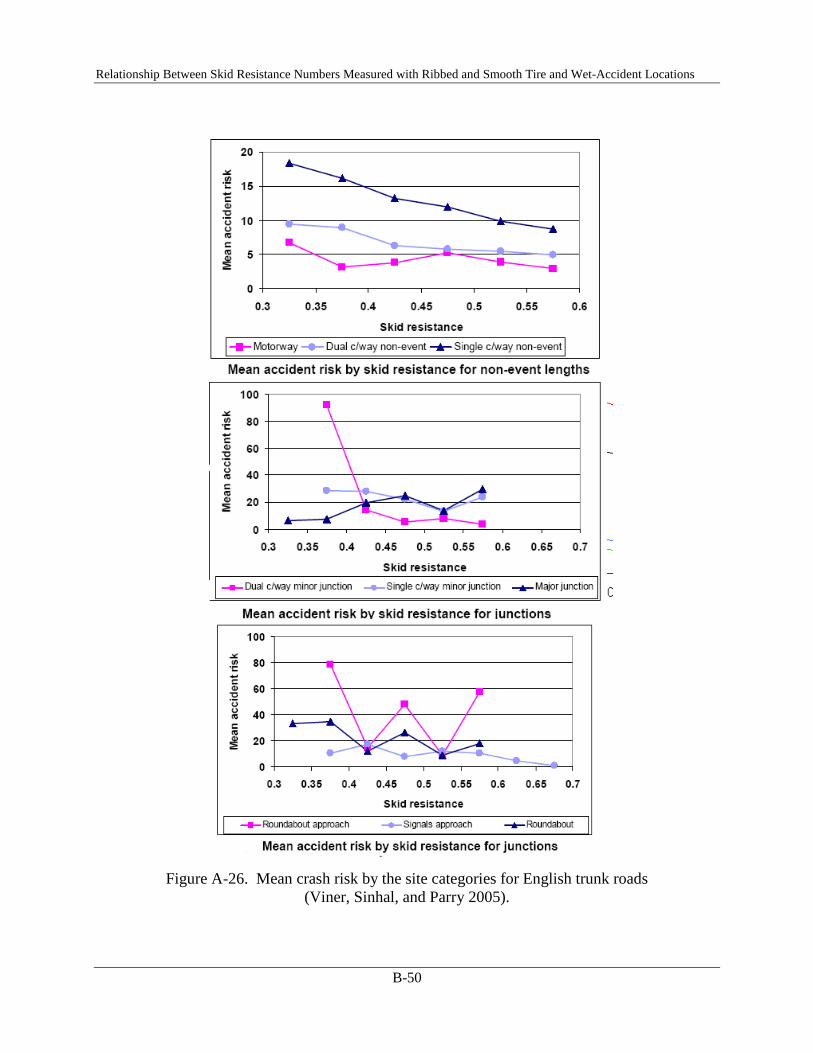
Relationship Between Skid Resistance Numbers Measured with Ribbed and Smooth Tire and Wet-Accident Locations
B-50
Figure A-26. Mean crash risk by the site categories for English trunk roads (Viner, Sinhal, and Parry 2005).

Relationship Between Skid Resistance Numbers Measured with Ribbed and Smooth Tire and Wet-Accident Locations
B-51
The following conclusions could be drawn from the analysis of the trends presented in figure A-26 (Viner, Sinhal, and Parry 2005):
• The effect of skid resistance on the mean crash risk on motorways is not significant, although there is a small increase in crash risk when the SCRIM Coefficient (SC) is below 0.35.
• The effect of skid resistance on the mean crash risk on carriageways is consistent, while the single-way pavements (one traffic lane in each direction) are prone to a greater crash risk than the dual-way pavements (two traffic lanes in each direction).
• For junctions, a clear relationship between the mean crash risk and skid resistance was observed for two-lane minor junctions and signal approaches. However, the main conclusion that can be drawn from figure A-26 is that the skid coefficient alone cannot be used to predict the crash on junctions and roundabouts, since other more important factors are present.
In a study of freeways in Switzerland, based on a very large data set obtained between 1999 and 2002, researchers failed to identify any conclusive relation between pavement skid resistance and crash occurrence for either wet or dry pavements (Lindenmann 2004). Figure A-27 shows the trends that were observed. However, it was concluded in this study that a systematic search for areas with very low skid resistance (SFC<0.32) would allow identifying individual, randomly distributed danger zones.
Figure A-27. Correlation of skid resistance and crash rate/wet crash rate (Lindenmann 2004)
An investigation performed in New Zealand involved crash data collected between 1996 and 2002 on a 13,660-mi (22,000-km) long highway network, and showed the strong association of the crash rate with skid resistance (SCRIM coefficient was used as a measure of friction) (Davies, Cenek, and Henderson 2005). Figure A-28 illustrates the decrease in crash rate with the increase in skid number.
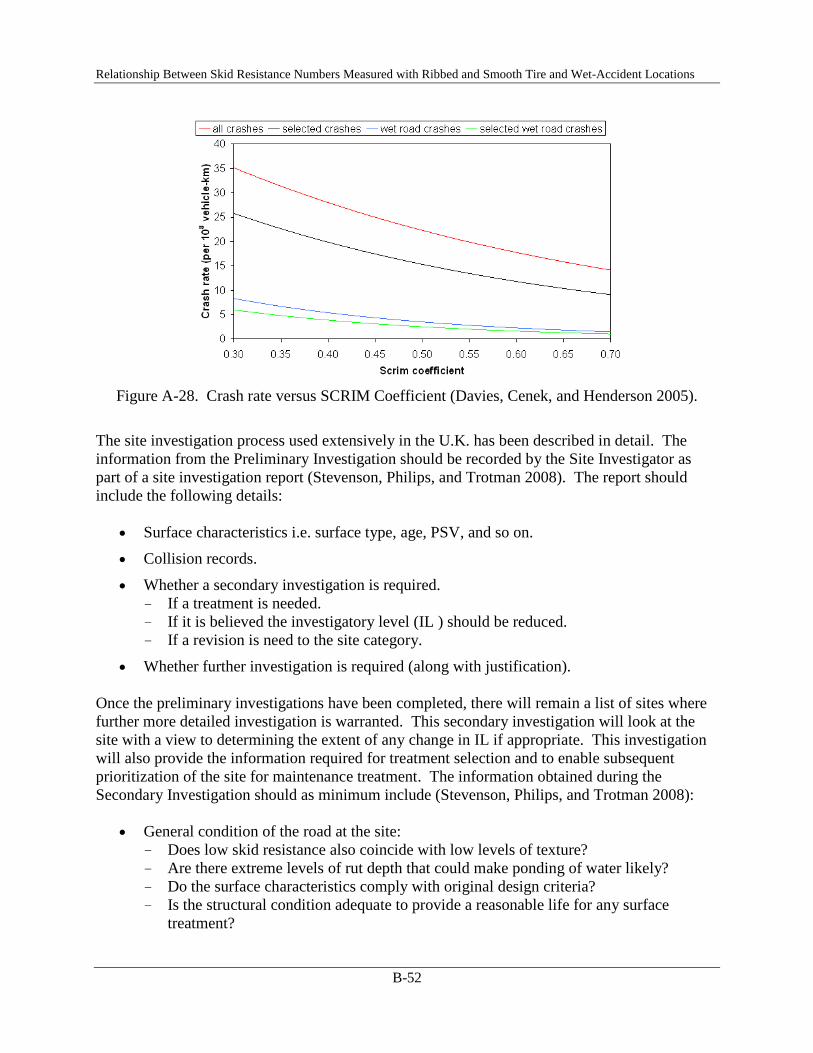
Relationship Between Skid Resistance Numbers Measured with Ribbed and Smooth Tire and Wet-Accident Locations
B-52
Figure A-28. Crash rate versus SCRIM Coefficient (Davies, Cenek, and Henderson 2005).
The site investigation process used extensively in the U.K. has been described in detail. The information from the Preliminary Investigation should be recorded by the Site Investigator as part of a site investigation report (Stevenson, Philips, and Trotman 2008). The report should include the following details:
• Surface characteristics i.e. surface type, age, PSV, and so on.
• Collision records.
• Whether a secondary investigation is required. – If a treatment is needed. – If it is believed the investigatory level (IL ) should be reduced. – If a revision is need to the site category.
• Whether further investigation is required (along with justification). Once the preliminary investigations have been completed, there will remain a list of sites where further more detailed investigation is warranted. This secondary investigation will look at the site with a view to determining the extent of any change in IL if appropriate. This investigation will also provide the information required for treatment selection and to enable subsequent prioritization of the site for maintenance treatment. The information obtained during the Secondary Investigation should as minimum include (Stevenson, Philips, and Trotman 2008):
• General condition of the road at the site: – Does low skid resistance also coincide with low levels of texture? – Are there extreme levels of rut depth that could make ponding of water likely? – Do the surface characteristics comply with original design criteria? – Is the structural condition adequate to provide a reasonable life for any surface
treatment?
Relationship Between Skid Resistance Numbers Measured with Ribbed and Smooth Tire and Wet-Accident Locations
B-53
• Volume and type of traffic including vulnerable road users: – Are the observed traffic speeds appropriate to the nature of the site? – What are the types of maneuvering made at the site and the consequences of not
completing them successfully (e.g., potential for head-on or side impact at speed)? – Is there a need to redesign junction areas to control maneuvers? – Are other road users vulnerable (i.e., pedestrians, cyclists, and motor cyclists)?
• Road layout: – Does the road layout deviate significantly from the current standards for geometric
design?
• Visibility: − What is the general visibility for the road user?
• Pavement markings: – Are the warnings and direction signs appropriate and effective? – Are the marking clearly visible?
• Reasons for a proposed change in the sites IL and the suggested new level. The comprehensive review of studies related to the safety and pavement condition issues showed that the majority of studies identified skid resistance as a very important factor to decrease the crash rate (Larson 2005). Although a significant amount of friction-related research is being conducted in other countries (U.K., Australia, and New Zealand), a few U.S. states are initiating surface friction studies in an effort to establish new standards and enhance safety. Pavement Texture and Safety It has been reported that 16 to 19 percent of the fatal crashes occurred on wet pavement when the tire-surface friction was minimal (Hoerner and Smith 2002; Larson, Scofield, and Sorenson 2004). However, since the 1980s, considerable research (in the U.K., New Zealand, France, and Australia) has been conducted to evaluate the effect of pavement texture as an essential surface characteristic on the potential crash risk. The key findings of some noticeable studies are discussed in this section. The analysis of the crash rate on English trunk roads in the period between 1994 and 2000 showed texture depth to be a significant variable in a number of categories (Viner, Sinhal, and Parry 2004). It was observed that the highest crash risk arises from a combination of low skid resistance and low texture depth and that the trend with skid resistance is even more pronounced at low texture depth (see figure A-29).

Relationship Between Skid Resistance Numbers Measured with Ribbed and Smooth Tire and Wet-Accident Locations
B-54
Figure A-29. Crash model for skid resistance and texture depth on single carriageways (Viner, Sinhal, and Parry 2004).
Larson, Scofield, and Sorenson (2004) estimated that 70 percent of wet weather crashes could be prevented with improved texture/friction. Therefore, an analysis of friction and texture versus average crash rate would more clearly demonstrate the benefit of increased texture and friction on reducing fatalities and serious injuries. Davies, Cenek, and Henderson (2005) in New Zealand found that reduced mean crash risk was apparently associated with increasing texture, although this relationship was not statistically significant. As shown in figure A-30, a texture depth increase from 0.02 to 0.12 in (0.5 to 3.0 mm) reduces crash risk from 18.8 to 17.6 crashes per 108 vehicle-km in the model considered here (i.e., a reduction of 1.2 crashes per 108 vehicle-km, corresponding to a 7 percent reduction in crash rate).
Figure A-30. Crash rate versus texture (Davies, Cenek, and Henderson 2005)

Relationship Between Skid Resistance Numbers Measured with Ribbed and Smooth Tire and Wet-Accident Locations
B-55
Several studies in the U.K. and Australia showed a strong correlation between crash rate and macrotexture (Oliver 2005). It was thought that high macrotexture permits increased levels of hysteretic (deformation) friction to be developed by vehicle tires thus reducing crashes. Figure A-31 demonstrates that the crash rate on pavements with texture depth shallower than 0.04 in (1 mm) was significantly higher than on pavements with texture depth deeper than 0.04 in (1 mm).
Figure A-31. Proportion of crashes of different types at different texture levels compared
with distribution of texture levels in Network C (Oliver 2005).
It was also found that the SCRIM results associated with microtexture underestimated the available friction, which implied that including the macrotexture requirement in pavement management guides might be more effective in reducing crash rates on high speed roads than the skid resistance requirements associated with SCRIM numbers (Oliver 2005). As opposed to the U.K. study, the analysis of the macrotexture data against the crash data in three Australian states (Western Australia, South Australia, and Victoria) did not yield conclusive results (Oliver 2005). In Western Australia, for example, a strong association of the higher crash rate with low level macrotexture was found for all rural sites on the Great Eastern Highway, and for some urban sections. However, in South Australia and Victoria, the statistical analysis identified mixed trends. A significant correlation was found between crashes and macrotexture for rural sections in the South Australian network, but such correlation for rural sites in the Victorian network was nonsignificant at the 5 percent level. In the case of urban sections, the researchers did not find a significant correlation for South Australian sites but did find a highly significant correlation for Victorian sites (Oliver 2005). Furthermore, crashes involving heavy vehicles appeared to be concentrated on sections with a high level of macrotexture rather than on sections with a low level of macrotexture for both rural and urban sites.

Relationship Between Skid Resistance Numbers Measured with Ribbed and Smooth Tire and Wet-Accident Locations
B-56
Despite the controversial results obtained in some Australian studies presented above, the following findings appear to be accepted (Oliver 2005):
• The low-speed skid resistance (as measured by SCRIM) did not correlate with the crashes on the high speed roads.
• The increased risk of crashes was highly associated with a low level of macrotexture (less than 0.04 in [1 mm]).
A recent paper reports on an analysis of the relationship between road surface characteristics and crashes on high speed undivided two-way roads in the state of Victoria, Australia (Cairney and Bennett 2008). The crash rate was observed to be higher for road sections with low macrotexture, and an economic analysis suggests that resurfacing sites with macrotexture of 0.04 in (1 mm) SPTD or less would produce crash savings which would provide a very good return on the investment (Cairney and Bennett 2008). The North Carolina DOT recently completed a study evaluating the role of pavement macrotexture in crashes on selected roads (Pulugurtha, Kusam, and Patel 2008). Laser profilometer data were processed to calculate estimated pavement macrotexture at 330-ft (100 m) intervals. Crash data were collected over the same lengths. The resulting data analysis showed a strong relationship between macrotexture and crash incidences on the five projects evaluated, and indicated that crashes decrease with an increase in pavement macrotexture. Macrotexture greater than or equal 0.06 in (1.5 mm) but typically less than 0.12 in (3 mm) would be the most appropriate to provide safe and efficient transportation to road users (Pulugurtha, Kusam, and Patel 2008). Relationship Between Safety and Pavement Roughness and Surface Distress The impact of pavement conditions and surface distress on rural roads was recently investigated (Tighe et al. 2000). The effect of the International Roughness Index (IRI) and Pavement Serviceability Rating (PSR) on single-vehicle, multiple-vehicle, and total crash rates was evaluated using mathematical modeling and regression analysis. Based on the regression analysis, it was found that a decrease in single-vehicle crash rate was associated with an increase in IRI, or with the deterioration of ride quality. It might be explained by the decrease in operational speed due to reduction in the quality of driving, and consequent reduction in the probability of crashes. Conversely, an increase in the multiple-vehicle crash rate was associated with the increase in roughness, which could be explained by the following two factors (Tighe et al. 2000):
• The increase in the lateral variation in the vehicle path with increase in roughness, and consequent reduction in the clearance distance between vehicles.
• The presence of road defects (potholes, severe alligator cracks, and so on) that force drivers to change their driving speeds abruptly.

Relationship Between Skid Resistance Numbers Measured with Ribbed and Smooth Tire and Wet-Accident Locations
B-57
Davies, Cenek, and Henderson (2005) in New Zealand attempted to predict crash rates from a number of factors, among them pavement roughness (IRI) and rut depth in the top asphalt layer. The fitted regression plots presented in figure A-32 suggests no relationship between the crash rate and the rut depth; however, the effect of IRI on crash rate appeared to be significant. When observing the fitted line on the plot of crash rate versus IRI, one should take in account only the part of line starting with logIRI=0.3, which corresponds to an IRI of 126 in/mi (2 m/km) (lower boundary of the IRI range included in the model).
Figure A-32. Crash rate versus IRI and rut depth (Davies, Cenek, and Henderson 2005).
An updated report on “The Influence of Roadway Surface Discontinuities on Safety” has been prepared, with a number of important changes since the original 1983 document, including (TRB 2008):
1. Hydroplaning – It was found, contrary to common engineering understanding in 1983. that large tractor/trailer rigs are also subject to hydroplaning at usual highway speeds when in an unloaded condition. Further advances were made in predicting hydroplaning critical speeds.
2. Holes and Bumps – Research was completed in defining road roughness frequencies that are most influential in affecting tire-pavement friction. For example, the movement to 17 to 20 in (432 to 508 mm ) rims in many new automobiles are more susceptible to damage due to interaction with holes, bumps and edges.
3. Edge Conditions – In 1983, few tests of edge conditions above 55 mi/hr (88 km/hr) had been conducted. With speed limits of 70 mi/hr (112 km/hr) now more common, research has shown some pavement edges to be of more concern at elevated speeds. Research on certain edge shapes has shown safety improvements that can be made during construction and maintenance. These improved methods are gaining acceptance through a combination of research and positive experience.
4. Discontinuities – A new chapter has been added that deals with positive influences of discontinuities such as rumble lines, rumble strips, rumble zones and speed bumps.
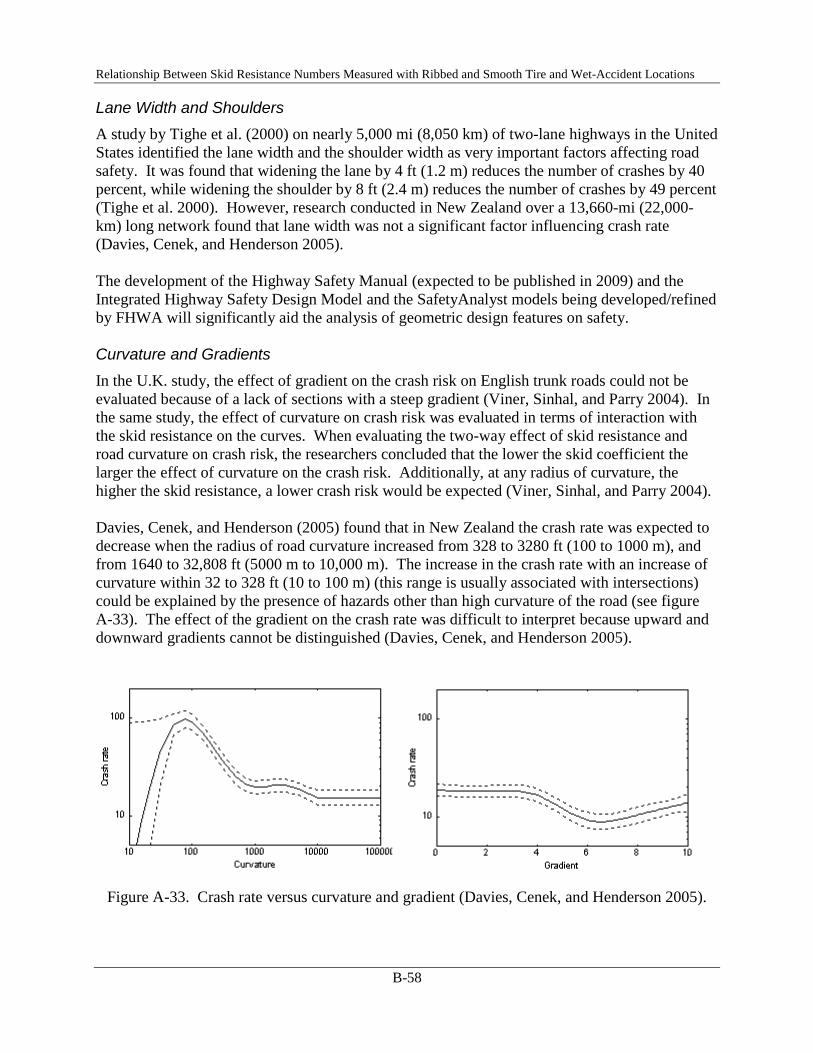
Relationship Between Skid Resistance Numbers Measured with Ribbed and Smooth Tire and Wet-Accident Locations
B-58
Lane Width and Shoulders A study by Tighe et al. (2000) on nearly 5,000 mi (8,050 km) of two-lane highways in the United States identified the lane width and the shoulder width as very important factors affecting road safety. It was found that widening the lane by 4 ft (1.2 m) reduces the number of crashes by 40 percent, while widening the shoulder by 8 ft (2.4 m) reduces the number of crashes by 49 percent (Tighe et al. 2000). However, research conducted in New Zealand over a 13,660-mi (22,000-km) long network found that lane width was not a significant factor influencing crash rate (Davies, Cenek, and Henderson 2005). The development of the Highway Safety Manual (expected to be published in 2009) and the Integrated Highway Safety Design Model and the SafetyAnalyst models being developed/refined by FHWA will significantly aid the analysis of geometric design features on safety. Curvature and Gradients In the U.K. study, the effect of gradient on the crash risk on English trunk roads could not be evaluated because of a lack of sections with a steep gradient (Viner, Sinhal, and Parry 2004). In the same study, the effect of curvature on crash risk was evaluated in terms of interaction with the skid resistance on the curves. When evaluating the two-way effect of skid resistance and road curvature on crash risk, the researchers concluded that the lower the skid coefficient the larger the effect of curvature on the crash risk. Additionally, at any radius of curvature, the higher the skid resistance, a lower crash risk would be expected (Viner, Sinhal, and Parry 2004). Davies, Cenek, and Henderson (2005) found that in New Zealand the crash rate was expected to decrease when the radius of road curvature increased from 328 to 3280 ft (100 to 1000 m), and from 1640 to 32,808 ft (5000 m to 10,000 m). The increase in the crash rate with an increase of curvature within 32 to 328 ft (10 to 100 m) (this range is usually associated with intersections) could be explained by the presence of hazards other than high curvature of the road (see figure A-33). The effect of the gradient on the crash rate was difficult to interpret because upward and downward gradients cannot be distinguished (Davies, Cenek, and Henderson 2005).
Figure A-33. Crash rate versus curvature and gradient (Davies, Cenek, and Henderson 2005).
Relationship Between Skid Resistance Numbers Measured with Ribbed and Smooth Tire and Wet-Accident Locations
B-59
Other Factors Affecting Safety Tighe et al. (2000) evaluated the potential effect of different factors on the crash occurrence based on the results of the survey conducted on 5,000 mi (8050 km) of U.S. highways. They revealed that the environmental and weather conditions including place and time of the crash occurrence, road obstacles, and precipitation were the most sensitive issue for drivers. In addition, the study identified the high sensitivity of drivers to the visibility of pavement surface features, which included pavement surface color and reflectivity, lane marking and signings, and visibility at night and during bad weather conditions. Another survey conducted on English trunk roads reported that drivers had a low awareness of the slippery road warning signs (Sinhal 2005). As a result, the following was recommended:
• Warning signs should be fewer in number but better targeted.
• Warning signs should be erected as soon as possible following receipt of data. The review of literature related to the investigation of the factors affecting safety revealed no strong agreement among researchers about the significance of the correlation between friction number as measure of the surface friction and the crash risk. On the other hand, the effect of macrotexture on the crash rate was indicated in the majority of the studies. Nevertheless, as the low speed friction is acknowledged to be the microtexture-related parameter, the friction measurements along with texture measurement are included by many transportation agencies (primarily in Australia, Europe, and New Zealand) in their guidance on assessing road safety. Development of Desirable Levels of Texture/Friction for Highway Networks The review of the state of practice related to the road safety in the U.S. and overseas showed that the pavement surface friction and texture significantly affect the wet-crash risk. Managing the pavement skid resistance at the appropriate level allows for reducing the probability of crashes. Therefore, assuring the appropriate level of safety on the roads should be included in pavement management system. However, different site categories may require different level of skid resistance and macrotexture. For example, junctions and bends with low radius of curvature require higher levels of friction and texture than high-speed highways in rural areas (Viner, Sinhal, and Parry 2004). The definitions and approach to establishing the skidding standards for use in pavement management activities are discussed in this section. Determining Intervention Levels of Skid Resistance As discussed previously, surface friction and texture depth measurements can be used to assess the pavement safety conditions. Additionally, these parameters can help pavement engineers determine pavement maintenance strategy and programs (Tighe et al. 2000). For example, the SCRIM coefficient along with MPD may be used to guide maintenance treatment strategies, as illustrated in figure A-34.

Relationship Between Skid Resistance Numbers Measured with Ribbed and Smooth Tire and Wet-Accident Locations
B-60
Figure A-34. Safety intervention levels for a SCRIM texture measuring device
(Tighe et al. 2000).
In this figure, the chart is broken into four quadrants. The upper right-hand quadrant represents a pavement that meets the agency’s standards for friction and safety levels from a pavement surface point of view. The bottom right quadrant represents pavements that have good macrotexture (MPD), but poor microtexture (which is associated with SCRIM). The opposite conditions exist in the upper left quadrant, where the microtexture is good but the macrotexture needs improvement. In the bottom left quadrant, both macrotexture and microtexture are in need of improvement. Although each agency must develop its own chart for establishing the friction trigger levels based on the equipment being used to measure these values, the approach shown above provides a framework for establishing guidelines to address a strategic issue such as safety in a consistent manner throughout the agency. Each agencies pavement preservation program provides an opportunity to significantly improve the overall friction and texture on their network (Zimmerman and Larson 2005). While the emphasis in the U.S has been on setting minimum friction levels rather than desirable levels, the U.K. and New Zealand use desirable and investigatory levels of skid resistance in their safety management programs, as described in the next section. Threshold versus Investigatory Levels of Skid Resistance Extensive research has been conducted since the 1930s in the U.K. to determine an appropriate level of skid resistance. By the early 1970s, different skidding standards were assigned to three types of sites (Viner, Sinhal, and Parry 2004):
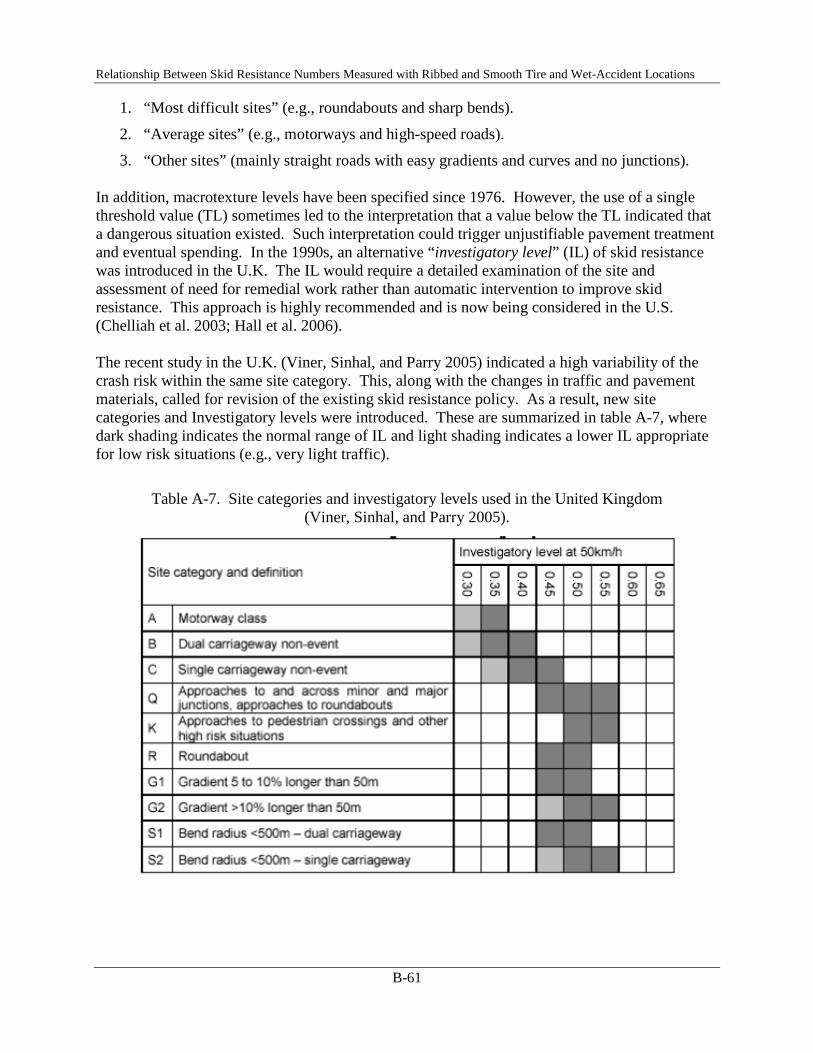
Relationship Between Skid Resistance Numbers Measured with Ribbed and Smooth Tire and Wet-Accident Locations
B-61
1. “Most difficult sites” (e.g., roundabouts and sharp bends).
2. “Average sites” (e.g., motorways and high-speed roads).
3. “Other sites” (mainly straight roads with easy gradients and curves and no junctions). In addition, macrotexture levels have been specified since 1976. However, the use of a single threshold value (TL) sometimes led to the interpretation that a value below the TL indicated that a dangerous situation existed. Such interpretation could trigger unjustifiable pavement treatment and eventual spending. In the 1990s, an alternative “investigatory level” (IL) of skid resistance was introduced in the U.K. The IL would require a detailed examination of the site and assessment of need for remedial work rather than automatic intervention to improve skid resistance. This approach is highly recommended and is now being considered in the U.S. (Chelliah et al. 2003; Hall et al. 2006). The recent study in the U.K. (Viner, Sinhal, and Parry 2005) indicated a high variability of the crash risk within the same site category. This, along with the changes in traffic and pavement materials, called for revision of the existing skid resistance policy. As a result, new site categories and Investigatory levels were introduced. These are summarized in table A-7, where dark shading indicates the normal range of IL and light shading indicates a lower IL appropriate for low risk situations (e.g., very light traffic).
Table A-7. Site categories and investigatory levels used in the United Kingdom (Viner, Sinhal, and Parry 2005).

Relationship Between Skid Resistance Numbers Measured with Ribbed and Smooth Tire and Wet-Accident Locations
B-62
Allocating Skid Resistance Investigatory Levels on the Basis of Risk Analysis The research in the U.K. demonstrated the advantage of using a range of ILs for each category site (Viner, Sinhal, and Parry 2005). It allowed for lowering IL for the sites with a lower risk of crash than would be expected for the particular site and, consequently, for allocating funds to those sites where improvements are required. On the other hand, the sites with a greater crash risk would be assigned a higher IL. A study was conducted in New Zealand to apply the concepts of variable IL and to access the benefits and cost of changing the skid resistance policy (Kennedy, Haydon, and Donbavand 2005). A methodology consisting of the following five steps was employed:
1. Select a sample network.
2. Validate the site category definition.
3. Incorporate the latest friction survey data and evaluate.
4. Assessment of the crash risk. − Site visits. − Incorporate crash data into the database. − Investigate the overall risk associated with the validated sites.
5. Determine benefits and costs of changing from the current policy to a risk management based approach
Both the U.K. (Viner, Sinhal, and Parry 2005) and the New Zealand study (Kennedy, Haydon, and Donbovand 2005) found, as follows:
• The risk management approach can be objectively used to assign appropriate investigatory levels of skid resistance and to estimate the saving in number of crashes.
• The benefit cost analysis indicated that even when using expensive surface treatments (e.g., calcined bauxite), the benefits due to crash savings outweighed the cost of treatment.
Since 1995, New Zealand has conducted an annual SCRIM survey and also introduced a mandatory macrotexture survey, which is measured in terms of Mean Profile Depth (MPD). New surfacings require a minimum of 0.03 in (0.9 mm) MPD and a Threshold Level of 0.02 in (0.5 mm) MPD. It has been determined that SCRIM data are a valuable input into the selection of surfacings and aggregate and is a good project tool (Boyle 2008). An evaluation of the effectiveness of Transit New Zealand’s T/10 specification for skid resistance was recently undertaken, evaluating time-series data over a 12-year period from 1995 to 2006 (Owen, Cook, and Cenek 2008). The principal findings from the analysis are summarized below (Owen, Cook, and Cenek 2008):

Relationship Between Skid Resistance Numbers Measured with Ribbed and Smooth Tire and Wet-Accident Locations
B-63
• There has been a significant reduction (between 25 and 50 percent) in crash rates between 1995 and 1998 for all crash categories investigated, with the reductions being greater for urban roads than for rural roads and for “wet” crashes than for “all” crashes.
• The fatal and injury crash rate on wet rural State Highways over the period 1998 to 2006 is trending downwards (reducing 1.1 percent per year), whereas the rate of all crashes is largely static for this period. By comparison, both “all” and “wet” crash rates on local authority rural roads are trending upwards, with the “all” crash rate increasing by 1.2 percent per year since 1998 and the “wet” crash rate increasing by 0.9 percent per year.
• The “all” and “wet” crash rates for urban roads has remained relatively static for both State Highways and Territorial Local Authorities over the period 1998 to 2006.
Improvements in macrotexture and microtexture, as demonstrated by annual measurements, have helped to improve the skid resistance of the state highway network, thereby reducing the risk of loss of control type crashes in wet conditions and consequently contributed to the wet road crash statistics. This data supports the effectiveness of New Zealand efforts to improve friction and texture on their State Highway network (Owen, Cook, and Cenek 2008). In September 2007, the U.K. issued an interim document providing guidance on implementing their skid resistance policy, with specific information on setting the investigatory level, conducting the site investigation, prioritizing treatments, and using slippery road warning signs (Highways Agency 2007). A summary of guidance on implementation and a discussion of the objectives of the additional guidance is also available (Viner and Caudwell 2008). Twenty years after the introduction of Standards in the U.K. for aggregates used in road surfacing materials and for in-service skid resistance, it is clear that these approaches have been widely adopted and have produced a number of benefits, including better skid resistance and keeping claims arising from slippery surfaces to an acceptably low level. However, benefits in terms of accident reduction have not been quantified adequately, and so it is difficult to assess whether the anticipated benefits of these Standards are being delivered in practice. Gathering information to allow better monitoring of in-service skid resistance and to support quantification of accident benefits is therefore a future priority for the Highways Agency (Sinhal and Viner 2008). Approaches similar to that used by the U.K. are now being considered in the U.S. (Hall et al. 2006). The Highway Safety Manual currently being developed and expected to be published in 2009 will significantly expand guidance in this area. In addition, the work under NCHRP 17-25 will contain an appendix that includes an evaluation of crash modification factors for improving the pavement surface friction and texture (Lyon and Persaud 2008). This is the first time that skid resistance has been included as a specific countermeasure. Determining Safety on the Network Using Macrotexture Australia has conducted an analysis of the relationship between road surface characteristics and crashes on high speed rural undivided two-way roads in the state of Victoria (Cairney and Bennett 2008). The research results indicated a power relationship between crash rate and macrotexture, and a polynomial relationship between crash rate and roughness, both of which

Relationship Between Skid Resistance Numbers Measured with Ribbed and Smooth Tire and Wet-Accident Locations
B-64
will need further scrutiny. The crash rate for the lowest texture category is more than double the crash rate for most of the range. Macrotexture was less than 0.04 in (1.0 mm) SPTD on 5.7 percent of the network. From an economic analysis, it was postulated that resurfacing sections where macrotexture is 0.04 in (1.0 mm) SPTD or less would have substantial benefits in terms of crash reductions. VicRoads has for some years relied on macrotexture as the basis for its rural skid resistance monitoring program and adopts a minimum SPTD of 0.05 in (1.2 mm) in its maintenance guidelines (Cairney and Bennett 2008). Safer communities is one of the five key long-term priority objectives of Queensland, Australia and safer roads is one of its top four key outcomes (Weligamage and Dowling 2008). During the period from 1992 to 2003, the fatality rate dropped 40 percent and has recently remained stable with about 330 annual fatalities (Weligmage and Dowling 2008). Introduction of the new emphasis on skid resistance prompted the Queensland Department of Main Roads (QDMR) to compile a Skid Resistance Management Plan (SRMP), which (Weligamage 2006):
• Defines QDMR’s overall objective and central strategy for managing skid resistance.
• Establishes a corresponding suite of Key Performance Indicators (KPIs).
• Describes action necessary to achieve the overall objective and to implement the central strategy for skid resistance.
• Identifies QDMR’s processes for managing skid resistance. The SRMP also serves as an interim depository for technical guidelines on skid resistance, such as the measurement regimes for skid resistance and surface macrotexture, pending completion of sufficient research and development to warrant issuing QDMR guidelines. The SRMP is structured around the generic asset management framework used by QDMR, and comprises a six-step process of (Weligamage 2006):
1. Consistent measurement of skid resistance and surface texture (Chapter 5);
2. Consistent management of data on skid resistance and surface texture (Chapter 6);
3. Consistent analysis of data on skid resistance and surface texture (Chapter 7);
4. Consistent use of data in reaching decisions about remedial actions (Chapter 8);
5. Consistent design, construction and maintenance practices (Chapter 9); and
6. Quantified performance targets, regular reviews and feedback (Chapter 10). In addition, Chapter 11 in the SRMP suggests 38 future actions for QDMR to consider that are likely to support further improvements in the management of skid resistance. These future actions are similar to the “Suggested Improvements to Friction Practices and Desired Areas of Friction Guidance” found in Appendix D of the recent NCHRP guide document (Hall et al. 2006). The suggested improvements listed clearly indicate the need for additional research and guidance to practicing engineers to help provide the public the safer roads that they deserve and expect.
Relationship Between Skid Resistance Numbers Measured with Ribbed and Smooth Tire and Wet-Accident Locations
B-65
Closing Remarks A review of published studies and ongoing research concerning the effect of pavement surface conditions on road safety suggests that providing an adequate pavement surface friction and texture could significantly reduce the number of wet weather and total crashes in the U.S. However, other pavement characteristics (surface distress, roughness), geometry, and roadside design should not be neglected when designing for safe pavements. Traffic volumes and climatic conditions also have a significant effect. Skid testing along with texture depth measurements provide a robust estimate of surface friction characteristics. While a wide range of skid testing and texture measuring devices are used in the U.S. and overseas, the main concern is the correlation between different measuring techniques and their harmonization to make the test results meaningful to practicing engineers. The calibration of testing devices is essential to minimize the errors and to provide repeatability and reproducibility of the testing results. In the future, greater quantification of the pavement texture will be needed to improve correlations of smooth tire friction test data and crashes and to better quantify the friction developed by anti-lock brake systems. However, it must be recognized that no single variable (ribbed tire friction, smooth tire friction, or macrotexture) by itself is highly correlated to crash rates. The correlation of these single variables and crash rates is always less than 10 percent. Therefore it is critical that the wet/total crash rate and a minimum number of annual wet crashes also be considered in identifying sections where surface treatments will be cost effective. Understanding the factors affecting road safety is vital for minimizing the number of roadway crashes. The results from a number of crash investigations have suggested that there are relationships between crash occurrence and pavement conditions. Analysis of the correlation between skid and texture data and crash risk allows for the prediction of crash risk in the future and for the planning of pavement management activities based on safety considerations. Managing the pavement skid resistance and texture depth at the appropriate level allows for reducing the probability of crashes. Given the current state of the practice, it is essential that fatal and serious injury accidents be accurately identified, located, and quickly entered into a database for analysis. The total and wet/total crash rates are critical for identifying sections where low friction/texture may be contributing to increased numbers of accidents. Other factors like surface distress, roughness, and traffic levels must not be ignored. Therefore, assuring an appropriate level of safety on the roads should be included in pavement and asset management systems. Monitoring systems should be developed to include key performance indicators that are updated annually to verify that improvements are being made to the overall system and that they are cost effective. As mentioned throughout this appendix, there is a significant amount of research underway in this area. Some of the major products expected within the next year include:
• Publication of the Guide for Pavement Friction (conducted under NCHRP project 1-43) as an AASHTO document.

Relationship Between Skid Resistance Numbers Measured with Ribbed and Smooth Tire and Wet-Accident Locations
B-66
• Updated guidance on Highway Safety Improvement Programs (See Notice of Proposed Rulemaking 23 CFR 924 4/24/08).
• Updated 1980 FHWA Technical Advisory on Skid Accident Reduction Program.
• Iowa State University Report of PCC Pavement Surface Texturing.
• Completion of NCHRP Project 10-69, Texturing of Concrete Pavement. • In 2009, the TRB Highway Safety Manual.
References American Automobile Association (AAA). 2008. Crashes vs. Congestion: What’s the Cost to Society? American Automobile Association, Heathrow, FL (available at (www.aaanewsroom.net/Assets/Files/20083591910.CrashesVsCongestionFullReport2.28.08.pdf) Ahammed, M. A. and S. L. Tighe. 2008. “Pavement Surface Mixture, Texture and Skid Resistance: A Factorial Analysis.” Draft Paper. ASCE 2008 Airfield and Highway Pavements Conference. Seattle, WA. Allen, B. P. Phillips, D. Woodward, and A. Woodside. 2008. “Prediction of UK Surfacing Skid Resistance Using Wehner Schulze and PSV.” Proceedings, Second International Safer Roads Conference, Cheltenham, England. Ardani, A. and S. Outcalt. 2005. PCCP Texturing Methods. Report No. CDOT-DTD-R-2005-21. Colorado Department of Transportation, Denver, CO. Austroads. 2003. Guide to the Selection of Road Surfacings. Austroads Publication No. AP-G63/03. Sidney, Australia. Bazlamit, S. M. and F. Reza. 2005. “Changes in Asphalt Pavement Friction Components and Adjustment of Skid Numbers for Temperature.” Journal of Transportation Engineering, Vol. 131, Number 6. American Society of Civil Engineers, Reston, Virginia. Blagdon, P., C. Kennedy, and J. Mitchell. 2008. “A New Method for Referencing Skid Resistance Measurements.” Proceedings, Second International Safer Roads Conference, Cheltenham, England. Boyle, T. 2008. “SCRIM: A Project Tool!” Proceedings, Second International Safer Roads Conference, Cheltenham, England. Button, J. W., E. G. Fernando, and D. R. Middleton. 2004. Synthesis of Pavement Related Issues Related to High-Speed Corridors. Technical Report FHWA/TX-05/0-4756-1. Texas Department of Transportation, Austin, Texas. Cairney, P. and P. Bennett. 2008. “Managing Road Surfaces for Safety at the Network Level: Is Macrotexture Enough?” Proceedings, Second International Safer Roads Conference, Cheltenham, England.

Relationship Between Skid Resistance Numbers Measured with Ribbed and Smooth Tire and Wet-Accident Locations
B-67
Chelliah, T., P. Stephanos, T. Smith, and B. Kochen. 2003. “Developing a Design Policy to Improve Pavement Surface Characteristics.” 2003 TRB Preprint CD. Transportation Research Board, Washington, DC. Choubane, B., C. R. Holzschuher, and S. Gokhale. 2003. Precision of Locked Wheel Testers for Measurement of Roadway Surface Friction Characteristics. Research Report FL/DOT/SMO/03-464. Florida Department of Transportation, Tallahassee, FL. Clonch, D. 2006. “Ohio Department of Transportation Road Grip Tester Project.” Proceedings, GIS for Transportation Symposium. Columbus, OH. Cook, D., C. Kennedy, and D. Newland. 2008. “Establishing Equilibrium Skid Resistance.” Proceedings, Second International Safer Roads Conference, Cheltenham, England. Corsello, P. 1993. Evaluation of Surface Friction Guidelines for Washington State Highways. Final Report WA-RD 312.1. Washington State Department of Transportation, Olympia, WA. Council, F. M. and D. L Harkey. 2006. Traffic Safety Information Systems International Scan: Strategy Implementation White Paper. FHWA-HRT-06-099. Federal Highway Administration, McLean, VA. Dahir, S. H. and W. L. Gramling. 1990. Wet-Pavement Safety Programs. NCHRP Synthesis of Highway Practice 158. Transportation Research Board, Washington, DC. Dardano, J. and G. Wickham. 2005. “Australia’s National Friction Testing Program.” Proceedings, International Conference for Surface Friction for Roads and Runways. Christchurch, New Zealand. Davies, R. B., P. D. Cenek, and R. J. Henderson. 2005. “The Effect of Skid Resistance and Texture on Crash Risk.” International Conference for Surface Friction for Roads and Runways. Christchurch, New Zealand. Delanne, Y. 2005. “Skid Resistance of Tires: Conventional Skid Resistance, Comparison and Correlation with Texture.” Bulletin Des Laboratories Des Ponts et Chaussees 255. French Public Works Research Laboratory, Paris, France. Do, Mt. 2005. “Relationship Between Microtexture and Skid Resistance.” Bulletin Des Laboratories Des Ponts et Chaussees 255. French Public Works Research Laboratory, Paris, France. Donbavand, J. and C. Kennedy. 2008. “Long Term Study of Skid Resistance on In-Service Roads in England.” Proceedings, Second International Safer Roads Conference, Cheltenham, England.

Relationship Between Skid Resistance Numbers Measured with Ribbed and Smooth Tire and Wet-Accident Locations
B-68
Dunford, A. 2008. “The Wehner Schulze Machine and its Potential Use to Improve Aggregate Specification.” Proceedings, Second International Safer Roads Conference, Cheltenham, England. Dupont, P. and A. Bauduin. 2005. “The Skid Resistance Circular Recently Issued by the French National Highways Administration.” Bulletin Des Laboratories Des Ponts et Chaussees 255. French Public Works Research Laboratory, Paris, France. El Gendy, A. and A. Shalady. 2008. “Image Requirements for 3D Measurements of Pavement Macrotexture.” TRB Preprint CD. Transportation Research Board, Washington, DC. Farber, E., M. S. Janoff, S. Cristinzio, J. G. Blubaugh, W. Reisener, and W. Dunning. 1974. Determining Pavement Skid-Resistance Requirements at Intersections and Braking Sites. NCHRP Report 154. Transportation Research Board, Washington, DC. Federal Aviation Administration (FAA). 1997. Measurement, Construction, and Maintenance of Skid Resistant Airport Pavement Surfaces. Advisory Circular AC 150/5320-12C. Federal Aviation Administration, Washington, DC. Federal Highway Administration (FHWA). 1977. Pavement Texture and Available Skid Resistance. Federal Highway Administration, Washington, DC. Federal Highway Administration (FHWA). 1980. Skid Accident Reduction Program. FHWA Technical Advisory T5040.17. Federal Highway Administration, Washington, DC. Federal Highway Administration (FHWA). 2005. Surface Texture for Asphalt and Concrete Pavements. FHWA Technical Advisory T 5040.31. Federal Highway Administration, Washington, DC. Federal Highway Administration (FHWA). 2006. Assessment of Friction-Based Pavement Methods and Regulations. Final Report Task 2003E1, Cooperative Agreement #DTFH61-03-X-00030 with NTRCI. Federal Highway Administration, Washington, DC. Federal Highway Administration (FHWA). 2007. Long-Life Concrete Pavements in Europe and Canada. FHWA-PL-07-027. Federal Highway Administration, Washington, DC. Ferragut, T., R. O. Rasmussen, P. Wiegand, E. Mun, and E. T. Cackler. 2007. ISU-FHWA-ACPA Concrete Pavement Surface Characteristics Program Part 2: Preliminary Field Data Collection. DTFH61-01-X-00042 (Project 15, Part 2). Federal Highway Administration, Washington, D.C. Flintsch, G. W., E. de Leon, K. K. McGhee, and I. L. Al-Qadi. 2003. “Pavement Surface Macrotexture Measurement and Applications.” Transportation Research Record 1860. Transportation Research Board, Washington, DC.

Relationship Between Skid Resistance Numbers Measured with Ribbed and Smooth Tire and Wet-Accident Locations
B-69
Flintsch, G. W. 2008. Consortium for Pavement Surface Properties. Contract/Grant Progress Report (2/28/08), TPF-5(141). Virginia Department of Transportation (available at www.pooledfund.org). Goodman, S. N., Y. Hassan, and A. O. Abd El Halim. 2006. “Preliminary Estimation of Asphalt Pavement Friction Properties from Superpave Gyratory Specimens and Mix Parameters.” Transportation Research Record 1949. Transportation Research Board, Washington, DC. Gothie, M. 2005. “Skid Resistance Measurements on French Pavements and Their Interpretation.” Bulletin Des Laboratories Des Ponts et Chaussées 255. French Public Works Research Laboratory, Paris, France. Greene, M. J. and L. Caudwell. 2008. “Early Life Skid Resistance – An Assessment of Accident Risk.” Proceedings, Second International Safer Roads Conference, Cheltenham, England. Hall, J. W., L. Titus-Glover, K. L. Smith, L. D. Evans, J. C. Wambold, T. J. Yager, and Z. Rado. 2006. Guide for Pavement Friction: Final Guide. Final Report for NCHRP Project 1-43. Transportation Research Board, Washington, DC (available at http://transportation.org/sites/design/ docs/friction). Hanson D. I. and B. D. Prowell. 2004. Evaluation of Circular Texture Meter for Measuring Surface Texture of Pavements. NCAT Report 04-05. Federal Highway Administration, Washington, DC. Haydon, M. 2005. “The Management of Skid Resistance on a State Highway Network.” Proceedings, International Conference for Surface Friction for Roads and Runways. Christchurch, New Zealand. Haydon, M. and V. Rambisheswar. 2005. “Risk Assessment and Management of an Urban Network.” Proceedings, International Conference for Surface Friction for Roads and Runways. Christchurch, New Zealand. Henry, J. J. 2000. Evaluation of Pavement Friction Characteristics. NCHRP Synthesis of Highway Practice 291. Transportation Research Board, Washington, DC. Hibbs, B. O. and R. M. Larson. 1996. Tire Pavement Noise and Safety Performance, PCC Surface Texture Technical Working Group. FHWA-SA-96-068. Federal Highway Administration, Washington, DC. Highway Agency. 2007. Interim Advice Note 98/07 Guidance for HA Service Providers on Implementing the Skid Resistance Policy (HD28/04). Highway Agency, United Kingdom. Hill, B. J., and J. J. Henry. 1981. “Short-Term, Weather-Related Skid Resistance Variations.” Transportation Research Record 836. Transportation Research Board, Washington, DC.
Relationship Between Skid Resistance Numbers Measured with Ribbed and Smooth Tire and Wet-Accident Locations
B-70
Hoerner, T .E. and K. D. Smith. 2002. High Performance Concrete Pavement: Pavement Texturing and Tire-Pavement Noise. FHWA-IF-02-020. Federal Highway Administration, Washington, DC. Huang, J., S. Wang, and X. Shi. 2008. “Estimating the Wet-Pavement Exposure with Historical Precipitation Data in the State of California.” TRB 2008 Annual Meeting CD-ROM, Transportation Research Board, Washington, DC. Izevbekhai, B.I. and A. Eller. 2008. “Evaluation of Current Texturing Practices in Minnesota.” Preprint paper 08-2261, TRB Annual Meeting. Transportation Research Board, Washington, DC. Jayawickrama, P. W. and B. Thomas. 1998. “Correction of Field Skid Measurements for Seasonal Variations in Texas.” Transportation Research Record 1639. Transportation Research Board, Washington, DC. Kennedy, C., M. Haydon, and J. Donbavand. 2005. “Allocating Skid Resistance Investigatory Levels on the Basis of Risk Analysis.” Proceedings, International Conference for Surface Friction for Roads and Runways. Christchurch, New Zealand. Kuemmel, D. A., R. C. Sonntag, J. C. Crovetti, Y. Becker, J. R. Jaeckel, and A. Satanovsky. 2000. Noise and Texture on PCC Pavements: Results of a Multi-State Study. Wisconsin DOT Highway Research Study No. 93-05, Wisconsin Department of Transportation, Madison, WI. Larson, R. M. 2005. “Using Friction and Texture Data to Reduce Traffic Fatalities, Serious Injuries, and Traffic Delays.” Proceedings, International Conference for Surface Friction for Roads and Runways. Christchurch, New Zealand. Larson, R., L. Scofield, and J. Sorenson. 2004. “Pavement Functional Surface Characteristics.” SURF 2004. 5th Symposium on Pavement Surface Characteristics - Roads and Airports. Toronto, Ontario. Lawrence, E. 2008. “Good Practice-Safe Roads: Developing and Operating a Practical Skidding Policy.” Proceedings, Second International Safer Roads Conference, Cheltenham, England. Ledee, V., G. Delalande, and P. Dupont. 2005. “Skid resistance and aggregates.” Bulletin Des Laboratories Des Ponts et Chaussees 255. French Public Works Research Laboratory, Paris, France. Li, S., K. Zhu, S. Noureldin, and D. Harris. 2005. “Identifying Friction Variations with the Standard Smooth Tire for Network Pavement Inventory Friction Testing.” Transportation Research Record 1905. Transportation Research Board, Washington, DC. Lindenmann, H .P. 2004. “Is The Correlation Between Pavement Skid Resistance and Crash Frequency Significant?” Preprint Paper TRB2004-000840, TRB Annual Meeting. Transportation Research Board, Washington, DC.
Relationship Between Skid Resistance Numbers Measured with Ribbed and Smooth Tire and Wet-Accident Locations
B-71
Lyon, C. and B. Persaud. 2008. “Safety Effects of a Targeted Skid Resistance Improvement Program.” Preprint Paper 08-2770, TRB Annual Meeting. Transportation Research Board, Washington, DC. Minnesota Department of Transportation (MnDOT). 2001. MnDOT TH 14/218 Design-Build RFP. Minnesota Department of Transportation, Saint Paul, MN. Morrison, D., W. Grant, and J. Donbavand. 2008. “Implementing a Revised Skid Policy into Scotland.” Proceedings, Second International Safer Roads Conference, Cheltenham, England. Murad, M. 2006. “Modelling Asphalt Pavement Friction and Wet-Pavement Traffic Accidents for Two-Lane Rural Highways.” International Journal of Pavements, Vol. 5, No. 1-2-3. Sao Paulo, Brazil. Noyce, D. A., H. U. Bahia, J. Yambo, J. Chapman, and A. Bill. 2007. Incorporating Road Safety into Pavement Management: Maximizing Surface Friction for Road Safety Improvement. Midwest Regional University Transportation Center Final Report MRUTC04-04, Wisconsin Department of Transportation, Madison, WI (available at http://mrutc.org/research/0404/). Ogle, J. H. 2007. Technologies for Improving Safety Data. NCHRP Synthesis of Highway Practice 367. Transportation Research Board, Washington, DC. Oliver, J. 2005. WA Skid Resistance Program - Stage 2: Development of Intervention Limits. Draft Report. ARRB Transport Research Limited, Leederville, WA, Australia. Owen, M., D. Cook, and P. Cenek. 2008. New Zealand State Highway – Skid Resistance Successes.” Proceedings, Second International Safer Roads Conference, Cheltenham, England. Perera, R.W., A. S. Pulipaka, and S. D. Kohn. 2006. Skid Crash Reduction Programs – Synthesis of Current Practice. Draft Report Contract DTFH61-04-D-00010. Federal Highway Administration, Washington, DC. Pulugurtha, S. S., P. R. Kusam, and K. Patel. 2008. Relationship between Pavement Macrotexture and Crash Incidences on North Carolina Roads. Final Report 2007-12. North Carolina Department of Transportation, Raleigh, NC. Roe, P. G. and R. Sinhal. 2005. How Do You Compare? Correlation and Calibration of Skid Resistance and Road Surface Friction Measurement Devices. Paper PA/INF/4522/05. TRL Limited, Crowthorne, U.K. Roe, P. G. and L. Caudwell. 2008. “Skid Resistance Policy in the UK – Where Did It Come From and Where is it Going?” Proceedings, Second International Safer Roads Conference, Cheltenham, England. Simpson, C. 2008. “Performance of High Skid Resistant Surfaces – Crash Trends.” Proceedings, Second International Safer Roads Conference, Cheltenham, England.
Relationship Between Skid Resistance Numbers Measured with Ribbed and Smooth Tire and Wet-Accident Locations
B-72
Sinhal, R. 2005. “The Implementation of a Skid Policy to Provide the Required Friction Demand on the Main Road Network in the United Kingdom.” Proceedings, International Conference for Surface Friction for Roads and Runways. Christchurch, New Zealand. Sinhal, R. and H. E. Viner. 2008. “Evaluating the Success of the UK Skid Policy.” Proceedings, Second International Safer Roads Conference, Cheltenham, England. Stevenson, A., M. Philips, and S. Trotman. 2008. “Using SCRIM Investigatory Levels to Identify, Manage, and Set Priorities—The Investigation Process.” Proceedings, Second International Safer Roads Conference, Cheltenham, England. Snyder, M. B. 2006. Pavement Surface Characteristics: A Synthesis and Guide. Engineering Bulletin EB235P. American Concrete Pavement Association, Skokie, IL. Tighe, S., N. Li, L. C. Falls, and R. Haas. 2000. “Incorporating Road Safety into Pavement Management.” Transportation Research Record 1699. Transportation Research Board, Washington, DC. Titus-Glover, L. and S. D. Tayabji. 1999. Assessment of LTPP Friction Data. FHWA-RD-99-037. Federal Highway Administration, Washington, DC. Transportation Research Board (TRB). 2008. Proposed Revisions to Transportation Research Board State-of-the-Art Report No. 1: The Influence of Roadway Surface Discontinuities on Safety. TRB Committee AFD90, Surface Properties–Vehicle Interaction, Transportation Research Board, Washington, DC (available at http://nautarch.tamu.edu/preview/ivey). Trifiro, F., G. W. Flintsch, G. Guerrera, E. de Leon, K.K. McGhee. 2008. “Comparison of Friction Measuring devices and Preliminary Evaluation of the International Friction Index Coefficients.” Preprint Paper, TRB Annual Meeting. Transportation Research Board, Washington, DC. Viner, H. E. and L. Caudwell. 2008. “Skid Policy – Guidance for Implementation.” Proceedings, Second International Safer Roads Conference, Cheltenham, England. Viner, H. E., P. G. Roe, A. R. Parry, and R. Sinhal. 2000. “High and Low-Speed Skidding Resistance: The Influence of Texture on Smooth and Ribbed Tire Friction.” Proceedings IVth International Symposium “SURF 2000.” World Road Association, Paris France. Viner, H., R. Sinhal, and T. Parry. 2004. “Review of UK Skid Resistance Policy.” SURF 2004. 5th Symposium on Pavement Surface Characteristics - Roads and Airports. Toronto, Ontario. Viner, H., R. Sinhal, and A. R. Parry. 2005. “Linking Road Traffic Accidents with Skid Resistance – Recent UK Developments.” International Conference for Surface Friction for Roads and Runways. Christchurch, New Zealand.

Relationship Between Skid Resistance Numbers Measured with Ribbed and Smooth Tire and Wet-Accident Locations
B-73
Wambold, J. C. 1996. Evaluation of Ground Test Friction Measuring Equipment on Runways and Taxiways under Winter Conditions. Transport Canada Airports Group – AKPE, Ottawa, Ontario, Canada. Waters, J. 2006. Road Surface Texture Measurement Using Digital Image Processing and Information Theory. Land Transport New Zealand Research Report 290. Wellington, NZ. Weligamage, J. 2006. Skid Resistant Management Plan. Queensland Department of Main Roads, Brisbane, Australia. Weligamage, J. and L. Dowling. 2008. “A Management Plan for Skid Resistance on the Queensland State-Controlled Road Network.” Proceedings, Second International Safer Roads Conference, Cheltenham, England. Whitehurst, E. A. 1977. “Aggregates, Skid Resistance and Slurry Seal.” Presentation at 15th Annual Convention of the International Slurry Seal Association and First World Congress on Slurry Seal in Madrid, Spain. Wilson D. and R. Dunn. 2005. “Polishing Aggregates to Equilibrium Skid Resistance.” Proceedings, International Conference for Surface Friction for Roads and Runways. Christchurch, New Zealand. Woodward, D., A. Woodside, R. Ellis, P. Phillips, I. Walsh and R. Sinhal. 2008. “The Effect of Aggregate Type and Size on the Performance of Thin Surfacing Materials.” Proceedings, Second International Safer Roads Conference, Cheltenham, England. Zimmerman, K. A. and R. M. Larson. 2005. “Improving Safety as Part of a Pavement Preservation Program.” Transportation Research Board E-Circular E-C078. Transportation Research Board, Washington, DC.

Relationship Between Skid Resistance Numbers Measured with Ribbed and Smooth Tire and Wet-Accident Locations
B-74