Patterns of CO2 emissions in 18 central Chinese cities ... · Accepted Manuscript Patterns of CO2...
24
Accepted Manuscript Patterns of CO 2 emissions in 18 central Chinese cities from 2000 to 2014 Xinwanghao Xu, Hong Huo, Jingru Liu, Yuli Shan, Yuan Li, Heran Zheng, Dabo Guan, Zhiyun Ouyang PII: S0959-6526(17)32337-5 DOI: 10.1016/j.jclepro.2017.10.136 Reference: JCLP 10928 To appear in: Journal of Cleaner Production Received Date: 7 August 2017 Revised Date: 2 October 2017 Accepted Date: 5 October 2017 Please cite this article as: Xu X, Huo H, Liu J, Shan Y, Li Y, Zheng H, Guan D, Ouyang Z, Patterns of CO 2 emissions in 18 central Chinese cities from 2000 to 2014, Journal of Cleaner Production (2017), doi: 10.1016/j.jclepro.2017.10.136. This is a PDF file of an unedited manuscript that has been accepted for publication. As a service to our customers we are providing this early version of the manuscript. The manuscript will undergo copyediting, typesetting, and review of the resulting proof before it is published in its final form. Please note that during the production process errors may be discovered which could affect the content, and all legal disclaimers that apply to the journal pertain.
Transcript of Patterns of CO2 emissions in 18 central Chinese cities ... · Accepted Manuscript Patterns of CO2...

Accepted Manuscript
Patterns of CO2 emissions in 18 central Chinese cities from 2000 to 2014
Xinwanghao Xu, Hong Huo, Jingru Liu, Yuli Shan, Yuan Li, Heran Zheng, DaboGuan, Zhiyun Ouyang
PII: S0959-6526(17)32337-5
DOI: 10.1016/j.jclepro.2017.10.136
Reference: JCLP 10928
To appear in: Journal of Cleaner Production
Received Date: 7 August 2017
Revised Date: 2 October 2017
Accepted Date: 5 October 2017
Please cite this article as: Xu X, Huo H, Liu J, Shan Y, Li Y, Zheng H, Guan D, Ouyang Z, Patterns ofCO2 emissions in 18 central Chinese cities from 2000 to 2014, Journal of Cleaner Production (2017),doi: 10.1016/j.jclepro.2017.10.136.
This is a PDF file of an unedited manuscript that has been accepted for publication. As a service toour customers we are providing this early version of the manuscript. The manuscript will undergocopyediting, typesetting, and review of the resulting proof before it is published in its final form. Pleasenote that during the production process errors may be discovered which could affect the content, and alllegal disclaimers that apply to the journal pertain.
MANUSCRIP
T
ACCEPTED
ACCEPTED MANUSCRIPT
Patterns of CO2 emissions in 18 central Chinese cities from 2000 to 2014 1
2
Xinwanghao Xua, Hong Huob, Jingru Liua,*, Yuli Shanc,*, Yuan Lic,d,*, Heran Zhengc, Dabo 3
Guanc, Zhiyun Ouyanga 4
5 a State Key Laboratory of Urban and Regional Ecology, Research Center for Eco-Environmental 6
Sciences, Chinese Academy of Sciences, 100085 Beijing, China 7 b Institute of Energy, Environment and Economy, Tsinghua University, Beijing 100084, China 8 c Water Security Research Centre, School of International Development, University of East Anglia, 9
Norwich NR4 7TJ, UK 10 d State Key Joint Laboratory of Environmental Simulation and Pollution Control, School of 11
Environment, Tsinghua University, Beijing 100084, China 12
13
*Corresponding authors: Jingru Liu ([email protected]), Yuli Shan ([email protected]), 14
Yuan Li ([email protected]) 15
16
Abstract 17
With the Rise of Central China Plan, the central region has had a great opportunity to develop its 18
economy and improve its original industrial structure. However, this region is also under pressure 19
to protect its environment, keep its development sustainable and reduce carbon emissions. 20
Therefore, accurately estimating the temporal and spatial dynamics of CO2 emissions and 21
analysing the factors influencing these emissions are especially important. This paper estimates 22
the CO2 emissions derived from the fossil fuel combustion and industrial processes of 18 central 23
cities in China between 2000 and 2014. The results indicate that these 18 cities, which contain an 24
average of 6.57% of the population and 7.91% of the GDP, contribute 13% of China’s total CO2 25
emissions. The highest cumulative CO2 emissions from 2000 to 2014 were from Taiyuan and 26
Wuhan, with values of 2268.57 and 1847.59 million tons, accounting for 19.21% and 15.64% of 27
the total among these cities, respectively. Therefore, the CO2 emissions in the Taiyuan urban 28
agglomeration and Wuhan urban agglomeration represented 28.53% and 20.14% of the total CO2 29
emissions from the 18 cities, respectively. The three cities in the Zhongyuan urban agglomeration 30
also accounted for a second highest proportion of emissions at 23.51%. With the proposal and 31
implementation of the Rise of Central China Plan in 2004, the annual average growth rate of total 32
CO2 emissions gradually decreased and was lower in the periods from 2005 to 2010 (5.44%) and 33
2010 to 2014 (5.61%) compared with the rate prior to 2005 (12.23%). When the 47 socioeconomic 34
sectors were classified into 12 categories, “power generation” contributed the most to the total 35
cumulative CO2 emissions at 36.51%, followed by the “non-metal and metal industry”, 36
“petroleum and chemical industry”, and “mining” sectors, representing emissions proportions of 37
29.81%, 14.79%, and 9.62%, respectively. Coal remains the primary fuel in central China, 38
accounting for an average of 80.59% of the total CO2 emissions. Industrial processes also played a 39
critical role in determining the CO2 emissions, with an average value of 7.3%. The average CO2 40
emissions per capita across the 18 cities increased from 6.14 metric tons in 2000 to 15.87 metric 41
tons in 2014, corresponding to a 158.69% expansion. However, the average CO2 emission 42
intensity decreased from 0.8 metric tons/1,000 Yuan in 2000 to 0.52 metric tons/1,000 Yuan in 43
2014 with some fluctuations. The changes in and industry contributions of carbon emissions were 44

MANUSCRIP
T
ACCEPTED
ACCEPTED MANUSCRIPT
city specific, and the effects of population and economic development on CO2 emissions varied. 45
Therefore, long-term climate change mitigation strategies should be adjusted for each city. 46
47
Keywords: CO2 emissions, central Chinese cities, emission intensity, per capita emissions 48
1. Introduction 49
Despite slowing economic activity and changing economic structure, China has remained the 50
world’s largest energy consumer and accounts for 23% of global energy consumption (BP, 2016). 51
Nearly three-quarters of the growth in global carbon emissions from the burning of fossil fuels and 52
cement production between 2010 and 2012 occurred in China (Liu et al., 2015c). In 2013, China 53
released 25% of the total global CO2, 1.5 times that released by the United States (Liu et al., 54
2015b; Mi et al., 2017). As China is the largest global source of CO2 emissions, China’s emissions 55
need to be accurately quantified and well understood (Liu et al., 2013; Wang et al., 2012; Wang 56
and Cai, 2017), and China should prioritize climate change mitigation. In its 2015 Intended 57
Nationally Determined Contributions, China promised to decrease its CO2 emissions per unit of 58
gross domestic product (GDP) by 60-65% (based on 2005 levels) by 2030 (xinhua, 2015). 59
However, in order to achieve China’s national mitigation targets, sub-administrative regions, such 60
as cities, should be assigned responsibilities accordingly. 61
Cities are the centres of wealth and creativity, and with their high population densities and 62
economies, they are being recognized as major components in the implementation of climate 63
change adaption and CO2 emission mitigation policies (Chavez and Ramaswami, 2014; Hoornweg 64
et al., 2011; Kennedy et al., 2012; Kennedy et al., 2010; Wang et al., 2012). The inventory of CO2 65
emissions listed by the energy consumption of individual cities is a quantitative emissions 66
accounting method that allows for the visualization of change trends and serves as the basis for 67
analysing the potential to reduce emissions (Bi et al., 2011). Therefore, understanding the 68
emission status of individual cities is a fundamental step for proposing mitigation actions 69
(Hoornweg et al., 2011). Although numerous studies have been carried out to investigate CO2 70
emissions at the community (Song et al., 2012), town (Feng et al., 2015), city (Cai and Zhang, 71
2014; Guo et al., 2012; Hillman and Ramaswami, 2010; Liu et al., 2012b; Shao et al., 2016b; 72
Wang et al., 2012; Yu et al., 2012), provincial (Bai et al., 2014; Geng et al., 2011b; Liu et al., 73
2012a; Zhang et al., 2017a), region (He et al., 2017), and national levels (Guan et al., 2008; Liu et 74
al., 2015c), the CO2 emission inventories of Chinese cities have not been well documented when 75
compared with the global research. This knowledge gap is due to the various definitions of city 76
boundaries, the limited quality of the emission activity data, and non-unified research methods, 77
which together make it difficult to estimate city-scale carbon emissions (Kennedy et al., 2010; Liu 78
et al., 2015b; Wang and Cai, 2017). Complete energy balance tables and CO2 emission inventories 79
are available for Chinese megacities (Beijing, Tianjin, Shanghai, and Chongqing) (Geng et al., 80
2011b) and a few provincial capital cities (Shan et al., 2017). However, another 250+ cities of 81
various sizes and developmental stages lack consistent and systematic energy statistics, and the 82
accuracy of the existing data is not absolutely guaranteed (Liu et al., 2015c). Moreover, CO2 83
emissions are calculated as the product of activity data and an appropriate emission factor (Sugar 84
et al., 2012). Most previous studies have employed the emission factor recommended by the IPCC, 85

MANUSCRIP
T
ACCEPTED
ACCEPTED MANUSCRIPT
which might not be suitable for China’s situation (Liu et al., 2015c). To accurately estimate CO2 86
emissions, Liu et al. (2015c) utilized updated emissions factors that better accord with the 87
situation in China to re-calculate the CO2 emissions. These authors found that the revised estimate 88
for CO2 emissions derived from fossil fuel and cement consumption was 2.49 GtC in 2013, 89
12%-14% less than that estimated by the UNFCCC and EDGAR. Some studies have examined 90
CO2 emissions from a sectoral perspective, such as household carbon emissions (Allinson et al., 91
2016; Zhang et al., 2017b), commercial sector (Wang and Lin, 2017) and industrial processes (Liu 92
et al., 2014), which would also provide a basis for estimating carbon emissions for cities. 93
Generally, carbon accounting can be defined as having 3 scopes: (1) all direct CO2 emissions 94
occurring within the city; (2) indirect CO2 emissions related to purchased electricity and steam and 95
heating consumption; and (3) other life-cycle emissions excluded from scopes 1 and 2 (Chavez 96
and Ramaswami, 2014; Liu et al., 2015a). Due to China’s large size and imbalanced levels of 97
development, the lifestyles, resource endowments and levels of economic development in different 98
provinces and cities are significantly different (Feng et al., 2012; Guan et al., 2017; Liu et al., 99
2012a; Wu et al., 2017; Yu et al., 2012). Consequently, a single mitigation action will not be 100
suitable for all of China’s 30 provinces and autonomous regions (Liu et al., 2015b). In addition, 101
CO2 emission mitigation policies should by adjusted according to the needs of the different cities. 102
In recent years, some cities have established CO2 emission inventories, which can help the 103
government advance and implement mitigation plans and propose pragmatic and effective 104
measures and schemes to reduce CO2 emissions (Geng et al., 2011a). Based on the considerations 105
above, the newly constructed emission inventories are compiled using the definition provided by 106
the IPCC territorial emission accounting approach and cover 47 socioeconomic sectors, 20 energy 107
types and 7 primary industry products, which in turn correspond to the national and provincial 108
inventories (Shan et al., 2017). 109
China’s level of industrialization and urbanization has become remarkable since joining the 110
WTO in 2001 (Liu et al., 2012a). The nation’s economy in 2014 was almost 4 times the size of 111
that in 2000 (Shan et al., 2016c). China’s total energy consumption has also increased dramatically 112
from 1470 million metric tons coal equivalent (tce) in 2000 to 4260 million tce in 2014 (Shan et 113
al., 2017). The adoption of the Rise of Central China Plan in 2004 offered a great opportunity for 114
the central cities to develop. The central region has also borne a significant responsibility as the 115
linkage between the eastern and western regions during the industrial structure transition. 116
Additionally, the central region is considered to be the production base of agriculture, energy and 117
raw materials, especially as the development in Shanxi and Henan has relied heavily on coal. Due 118
to imbalances in levels of economic development and resource distributions, the regional 119
characteristics of energy consumption in China also display distinct patterns (Li et al., 2016). As 120
such, local policymakers and researchers should work to understand the spatial and temporal 121
characteristics of CO2 emissions and the methods that central China employs to avoid developing 122
its economy at the expense of the environment. Consequently, this study aims to estimate the CO2 123
emissions of 18 central Chinese cities within six urban agglomerations from 2000 to 2014. 124
Moreover, we analyse and compare the characteristics of CO2 emissions and examine similarities 125
and differences in CO2 emissions in those cities and the cities located in the other regions of China 126
and abroad. The methodologies used in this study are presented in section 2, where we give a 127
general overview of the construction of the CO2 emission inventory, data sources, and research 128
objectives. In section 3, we describe the temporal and spatial variations of CO2 emissions and 129
MANUSCRIP
T
ACCEPTED
ACCEPTED MANUSCRIPT
analyse the contributions of various sectors and energy types. In this section, emissions intensity 130
and per capita emissions are also introduced to illustrate the relationships between energy 131
consumption, economic development and population expansion. Finally, in section 4, we 132
summarize our principal findings and present practical measures to mitigate CO2 emissions. 133
2. Methodology 134
2.1. Case choice 135
In this study, we selected 18 cities from 6 central provinces (including Shanxi, Henan, Anhui, 136
Hubei, Hunan, and Jiangxi) and compiled a CO2 emissions inventory for the period from 2000 to 137
2014. These 18 cities are affiliated with the Taiyuan Urban Agglomeration (TYUA), Zhongyuan 138
Urban Agglomeration (ZYUA), Wanjiang Urban Belt (WJUB), Greater Changsha Metropolitan 139
Region (GCMR), Wuhan Urban Agglomeration (WHUA), and City Cluster surrounding Poyang 140
Lake (CCPL) (NDRC, 2010) (Fig. 1). In addition, basic information about these cities is included 141
in Table 1.142
143 Fig. 1 The 18 central Chinese cities within six urban agglomerations in central China 144
Note: TYUA: Taiyuan urban agglomeration; ZYUA: Zhongyuan urban agglomeration; WJUB: Wanjiang Urban 145
Belt; GCMR: Greater Changsha Metropolitan Region; WHUA: Wuhan urban agglomeration; CCPL: City Cluster 146
surrounding Poyang Lake (The same below). 147
148

MANUSCRIP
T
ACCEPTED
ACCEPTED MANUSCRIPT
Table 1 The socio-economic characteristics of 18 central Chinese cities in 2014 149
Regions cities GDP
(108 Yuan)
Area
(km2)
Population
(104 persons)
GDP per capita
(Yuan/capita)
Population density
(persons/km2)
TYUA Taiyuan 2531.09 6988 369.7425 68455 529
Xinzhou 680.30 25152 312.8460 21746 124
Yangquan 616.62 4570 139.2674 44276 305
ZYUA Zhengzhou 6776.99 7446 937.7835 72266 1259
Jiaozuo 1844.31 4071 368.4915 50050 905
Luoyang 3284.57 15236 696.2300 47177 457
WJUB Hefei 5180.56 11445 769.6000 67315 672
Anqing 1544.32 15402 537.6000 28726 349
Chuzhou 1214.39 13516 395.5000 30705 293
GCMR Changsha 7824.81 11816 671.4121 116543 568
Xiangtan 1570.56 5008 291.5000 53879 582
Changde 2264.94 18910 608.6600 37212 322
WHUA Wuhan 10069.48 8569 1033.0000 97478 1206
Huangshi 964.25 4583 296.4600 32525 647
Xianning 1218.56 9751 244.9200 49753 251
CCPL Nanchang 3667.96 7402 517.7300 70847 699
Jiujiang 1779.96 19078 513.1300 34688 269
Shangrao 1550.20 22791 668.7968 23179 293
Source: GDP, Area, Population, GDP per capita, and Population density were derived from the statistical yearbook 150
of corresponding city in 2015. 151
The total share of the population for these aggregated 18 cities compared to the nation’s total 152
population has increased from 6.38% in 2000 to 6.85% in 2014. In addition, the percentage of 153
GDP increased from 6.45% in 2000 to 8.73% in 2012 with some fluctuations (Fig. 2A). We further 154
compared the proportions of GDP and population for the three cities to those of the provinces (Fig. 155
2B and 2C). With the exception of TYUA, the growing concentration of GDP was observed in the 156
other urban agglomerations. And in Hubei and Jiangxi province, more population was centered in 157
our research area, namely WHUA and CCPL. However, the percentage of population in ZYUA 158
accounted for an average of 17.76%. 159

MANUSCRIP
T
ACCEPTED
ACCEPTED MANUSCRIPT
1999 2000 2001 2002 2003 2004 2005 2006 2007 2008 2009 2010 2011 2012 2013 2014 2015The
perc
enta
ge o
f ag
greg
ate
d G
DP
and p
opu
latio
n
acr
oss
18 c
ities
to
those
in w
hol
e C
hin
a /
(%)
6.0
6.5
7.0
7.5
8.0
8.5
9.0
1998
2000
2002
2004
2006
2008
2010
2012
2014
2016
The
per
centa
ge o
f po
pul
atio
n in
urb
an a
gglo
mer
atio
n t
o th
e pr
ovin
ce /
(%
)
15
20
25
30
35
40
45
The percentage of GDPThe percentage of population
1998
2000
2002
2004
2006
2008
2010
2012
2014
2016
The
perc
enta
ge o
f G
DP
in
urb
an
aggl
om
erat
ion
to t
he
pro
vinc
e /
(%)
25
30
35
40
45
50
TYUA ZYUA WJUB
GCMR WHUA CCPL
A
B C
160
Fig.2. The percentage of aggregated 18 cities’ GDP and population to the national’s GDP and population (A) and 161
urban agglomeration’s population (B) and GDP (C) to those from the province during the period from 2000 to 162
2014. 163
2.2. Construction of CO2 emission inventory 164
The specific method used to calculate the carbon emissions for each sector was discussed in 165
our previous study(Shan et al., 2017), and only the most salient details are provided here. 166
To calculate the CO2 emission inventory for each city, we need to define the boundary of the 167
city (Bi et al., 2011; Cai and Zhang, 2014; Liu et al., 2015a; Satterthwaite, 2008). In this study, 168
administrative territorial boundaries were considered the boundaries for the city’s CO2 emissions. 169
These boundaries typically include urban centres, towns and rural populations (Dhakal, 2010; 170
Wang et al., 2012). The emissions generated from fossil fuel combustion and industrial processes 171
within the city are included. Energy consumed as chemical raw materials or lost during 172
transportation is removed from the total energy consumption to avoid double counting. Emissions 173
from electricity and heat generated within the city boundary are counted based on the primary 174
energy input used, such as raw coal(Shan et al., 2017). Our administrative territorial emission 175
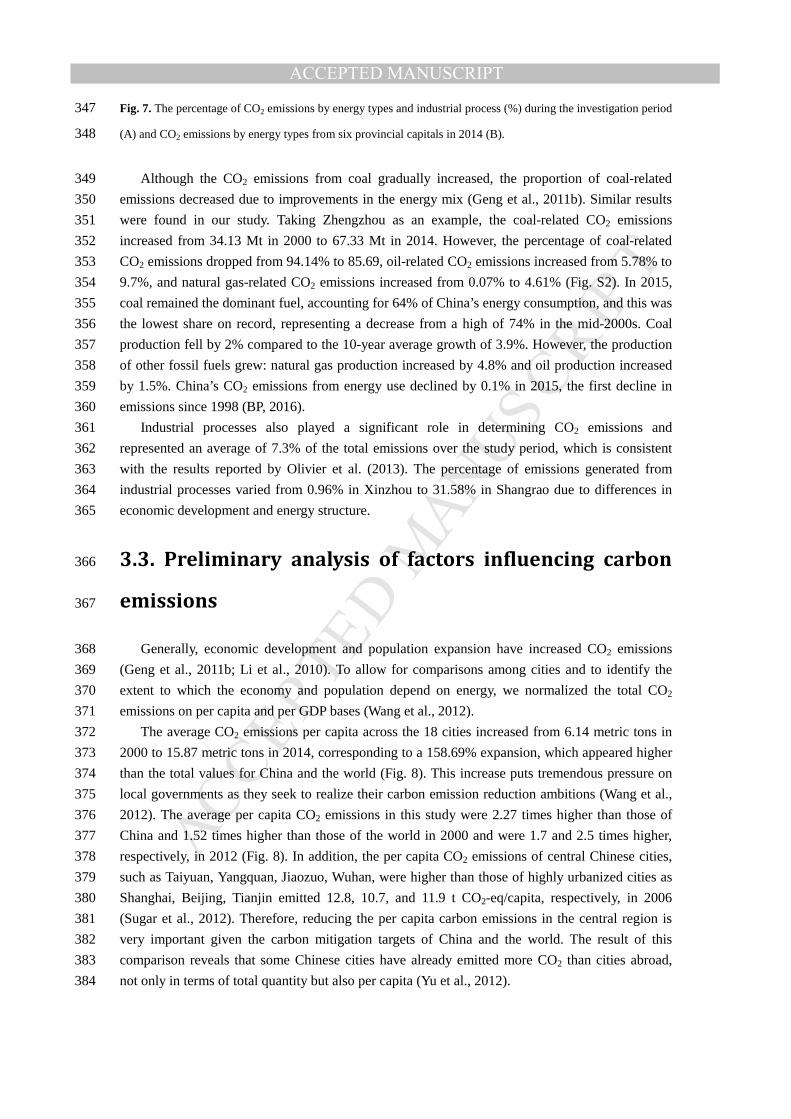
inventory excludes emissions from imported electricity and heat consumption from outside the 176
city boundary, as well as the energy consumed in inter-city transportation. We only focus on fossil 177

MANUSCRIP
T
ACCEPTED
ACCEPTED MANUSCRIPT
fuel consumed within the city boundary(Shan et al., 2017). 178
2.2.1. Energy consumption 179
In this study, CO2 emitted from energy consumption is calculated by multiplying the energy 180
consumption of different socioeconomic sectors and the corresponding emission factors (Wang et 181
al., 2012), as in Eq. (1). 182
( )energy ij ij ij i j i
CE CE AD EF= = ×∑∑ ∑∑ Eq. (1) 183
CEenergy represents the total CO2 emissions resulting from fossil fuel combustion. j [1, 47] 184
indicates the socioeconomic sectors (see SI Table S1), which include primary industry (such as 185
farming, forestry, animal husbandry, fishery and water conservation); secondary industry (such as 186
manufacturing and the construction sector); tertiary industry (such as transportation, storage, post 187
and communications, wholesale, retail sales, catering, trade and others); and residential 188
consumption (such as urban and rural). Secondary industry was further decomposed into 40 189
sub-sectors, including mining, manufacturing, and electric power, gas and water production and 190
supply. i [1, 20] represents the energy types (Shan et al., 2017), and CEij denotes the CO2 191
emissions derived from energy i in sector j. ADij represents the activity data (energy consumption), 192
and EFi refers to the emission factors of energy i. In this study, we adopt the emission factors 193
recommended by Liu et al. (2015c), which are now widely used by other scholars (Mi et al., 2017; 194
Shan et al., 2016a; Shao et al., 2016a). 195
2.2.2. Industrial processes 196
Carbon emissions from industrial processes mainly represent those emitted from the chemical 197
and physical transformation of materials during industrial production, such as cement 198
manufacturing and limestone consumption (Shan et al., 2016b; Wang et al., 2012). In the current 199
study, the CO2 emissions from industrial processes are emitted as the result of chemical reactions 200
in the production process, not as the result of the energy used by industry. The equation describing 201
these processes is shown in Eq. (2), 202
( )process t t tt t
CE CE AD EF= = ×∑ ∑ Eq. (2) 203
where CEprocess refers to the carbon emissions generated from the industrial process (t [1, 7]), 204
and EFt represents the emission factor for an industrial product. Most of the emission factors for 205
industrial processes were collected from the IPCC (2006), while the emission factor for cement 206
production was collected from our previous study (Liu et al., 2015c). 207
2.3. Data sources 208
The energy balance table (EBT) is a summary of energy production, transformation and final 209
consumption (Shan et al., 2017; Shan et al., 2016c). The activity data (ADij and ADt) were mainly 210
obtained from the EBT of the statistical yearbook on Industry, Energy and Transport of the 211
corresponding city. However, not all the cities’ statistical yearbooks contained all the required data. 212
The detailed calculation process and the updated emission factors for 2000 to 2014 followed 213

MANUSCRIP
T
ACCEPTED
ACCEPTED MANUSCRIPT
previous research (Shan et al., 2017). The annual GDP data and city populations from 2000 to 214
2014 were derived from the statistical yearbooks of the corresponding cities. In addition, the GDP 215
data in this study were standardized to currency values for the year 2000. 216
3. Results and discussion 217
3.1. Temporal and spatial variations in CO2 emissions 218
Using the methodology described above and the data that we collected, we estimated the CO2 219
emissions for 18 central Chinese cities for 2000-2014 (Fig. 3; Table S2). The results revealed that 220
the total CO2 emissions due to fossil fuel consumption and industrial processes for the aggregated 221
18 cities increased from 396.66 million tons (Mt) in 2000 to 1,145.19 million tons (Mt) in 2014, 222
with an annual average growth rate (AAGR) of 7.87% (Fig. 3). The AAGR of CO2 emissions in 223
central Chinese cities was roughly consistent with the national growth rate (7%) (Geng et al., 224
2011b; Liu et al., 2015b). Additionally, the growth rate was lower during the periods from 2005 to 225
2010 (5.44%) and from 2010 to 2014 (5.61%) compared with that from 2000 to 2005 (12.23%). 226
Trends were more evident in the provincial capital cities, where CO2 emissions increased by 227
102.97%, 37.21%, and 18.49% from 2000-2005, 2005-2010, and 2010-2014, with AAGR values 228
of 15.21%, 6.53%, and 4.33%, respectively. The increasing trend of CO2 emissions demonstrated 229
that with the ongoing economic development (the GDP increased from 640.85 billion Yuan in 230
2000 to 5458.39 billion Yuan in 2014) and technological progress, the consumption of fossil fuel 231
and industrial production processes gradually switched to high-efficiency and energy-saving 232
processes, resulting in the reduction of the AAGR. 233
Years
2000 2002 2004 2006 2008 2010 2012 2014
Tot
al C
O 2 e
mis
sion
s /
(Mt)
0
200
400
600
800
1000
1200
1400
Xinzhou Yangquan Jiaozuo Luoyang Anqing Chuzhou Xiangtan Changde Xianning Huangshi Jiujiang Shangrao
Taiyuan Zhengzhou Hefei Changsha Wuhan Nanchang
234
Fig. 3. Total CO2 emissions for 18 central Chinese cities during the period from 2000 to 2014. Note: The legends 235
MANUSCRIP
T
ACCEPTED
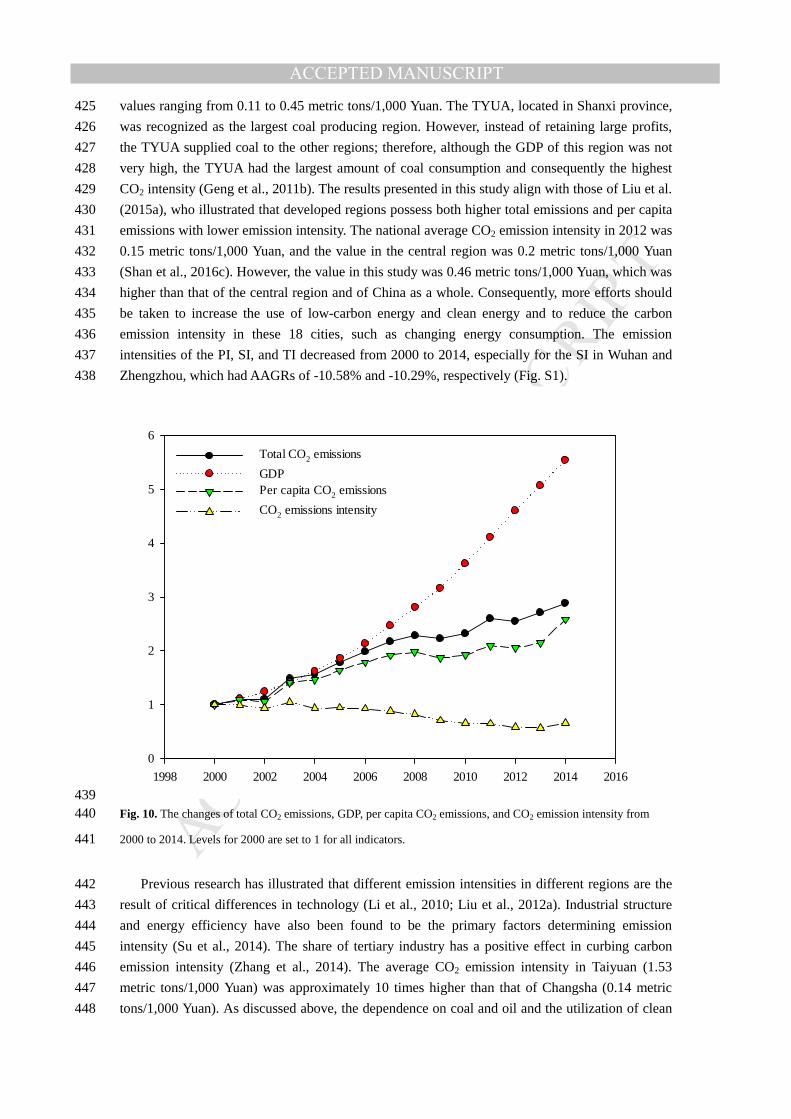
ACCEPTED MANUSCRIPT
for provincial capital cities, including Taiyuan, Zhengzhou, Hefei, Changsha, Wuhan, and Nanchang, were filled 236
with slash and presented to the bottom part. 237
Among the 18 cities, clear differences were seen in the CO2 emissions over time (Fig. 4). The 238
AAGRs for Hefei, Xinzhou, and Changsha increased rapidly, with values of 17.32%, 16.92%, and 239
15.08%, respectively (Fig. 4), due to rapid economic development and population centralization 240
(Table 2). Conversely, Jiaozuo, Luoyang, Changde, Huangshi, and Wuhan developed with very 241
low growth rates, with AAGRs of 1.37%, 2.82%, 4.12%, 5.05%, and 5.25%, respectively (Fig. 4). 242
With the addition of Zhengzhou (5.85%) and Yangquang (7.29%), 7 of the 18 cities’ AAGRs were 243
below the average level (7.87%) (Fig. 4). However, the baseline CO2 emissions for Wuhan and 244
Zhengzhou in 2000 were higher than those of the other cities (Fig. 2; Table S2), indicating a faster 245
industrialization process and an earlier awareness of environmental protection issues and CO2 246
emissions mitigation and that strategies were proposed in these regions to control the vigorous 247
growth of CO2 emissions. 248
More attention should be paid to the dynamics of the emissions of Taiyuan, which relied 249
heavily on coal and emitted the highest amount of CO2. In 2000, the total CO2 emissions varied 250
from 2.95 Mt in Xianning to 82 Mt in Wuhan (Table S2). However, in 2003, the CO2 emissions of 251
Taiyuan (119.18 Mt) exceeded those of Wuhan (90.83 Mt) for the first time. After 2003, the 252
emissions of Taiyuan have been higher than those of the other 17 cities, reaching a peak of 211.16 253
Mt in 2011 and gradually decreasing to 183.53 Mt in 2014 (Fig. 3). 254
Cumulative CO2 emissions / (Mt)
0 500 1000 1500 2000 2500
Ce
ntra
l citi
es
Taiyuan Wuhan
ZhengzhouJiaozuo
LuoyangYangquan
HefeiXiangtanXinzhou
ChangshaNanchang
JiujiangHuangshiChangdeShangrao
AnqingChuzhouXianning
Cumulative CO2 emissions
Average annual growth rate (AAGR) / (%)0 4 8 12 16 20
AAGR
255
Fig. 4. The annual average growth rate (AAGR) and the cumulative CO2 emissions of 18 central Chinese cities 256
over the study period. 257
The two cities with the highest cumulative CO2 emissions were Taiyuan and Wuhan, totalling 258

MANUSCRIP
T
ACCEPTED
ACCEPTED MANUSCRIPT
2268.57 Mt (19.21%) and 1847.59 Mt (15.64%), respectively, during the investigation period (Fig. 259
4). The emissions of Zhengzhou (975.49 Mt), Jiaozuo (904.99 Mt), Luoyang (896.80 Mt) 260
accounted for the second highest proportions of the total among the 18 cities, with proportions of 261
8.26%, 7.66%, and 7.59%, respectively (Fig. 4). The overall percentage of CO2 emissions for the 262
six provincial capital cities accounted for more than one-half of the total emissions of the 18 cities 263
after 2002, with the maximum proportion of 58.74% occurring in 2011 and the proportion 264
decreasing to 54.77% in 2014 (Fig. 3). The increasing proportion of CO2 emissions from the 265
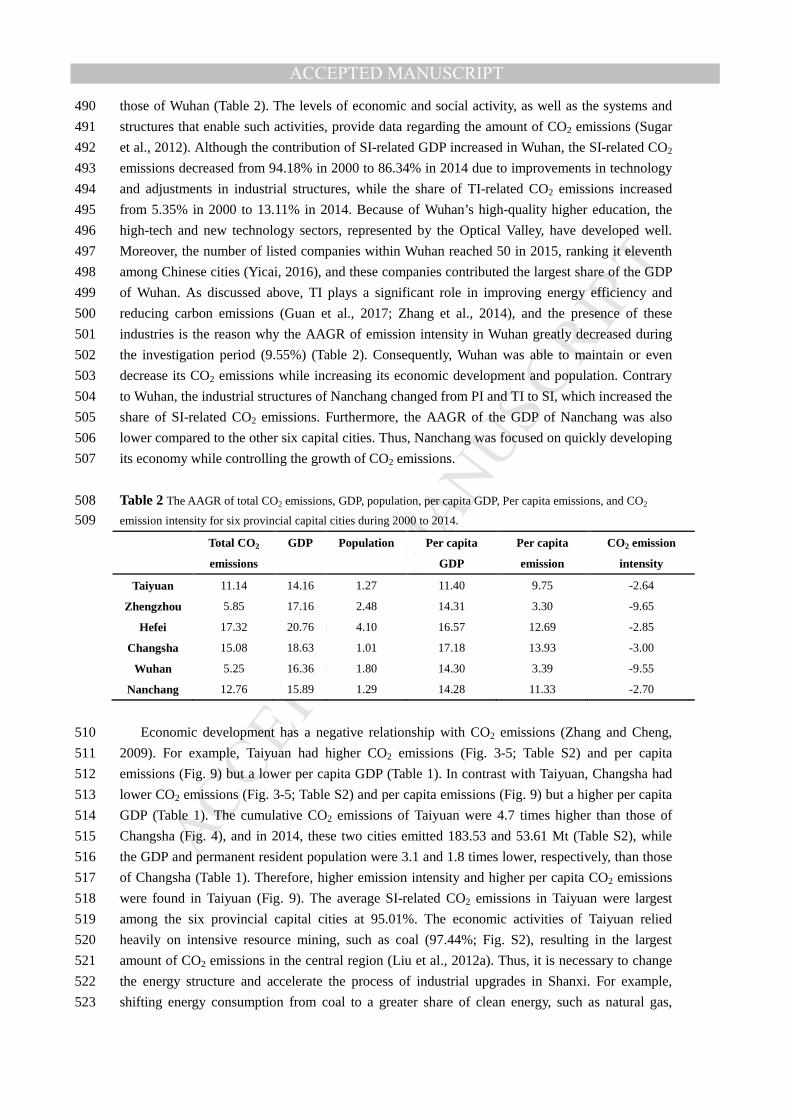
provincial capitals indicated that energy consumption has been concentrated in the provincial 266
capitals with the progression of economic development. Furthermore, the share of CO2 emissions 267
for the provincial capital cities relative to the urban agglomerations increased from 46.77% in 268
2000 to 52.29% in 2014 for the TYUA, 32.49% to 44.33% for the ZYUA, 48.95% to 65.37% for 269
the WJUB, and 20.57% to 43.90% for the GCMR, 36.06% to 40.33% for the CCPL. A slight 270
decrease for the WHUA was observed, from 80.40% to 75.9% (Fig. 3). Additionally, the share of 271
cumulative CO2 emissions for provincial capital cities relative to their respective urban 272
agglomerations was highest in the WHUA, at 77.67%, followed by the TYUA (67.32%) and the 273
WJUB (59.13%), for the study period. However, not all CO2 emission values were higher in 274
provincial capital cities than in non-provincial capitals, such as in the GCMR, where the 275
cumulative CO2 emissions from Changsha (472.98 Mt) were lower than those of Xiangtan (523.20 276
Mt) (Fig. 3; Table S2). The CO2 emissions of Changsha surpassed those of Xiangtan in 2008. 277
The spatial distribution of CO2 emissions has remained nearly stable over the past 15 years 278
and is noticeably uneven among cities (Fig. 5). In 2000, Wuhan ranked the highest at 82 Mt of 279
emissions, accounting for above one-fifth of the 18 cities’ total CO2 emissions. The other five 280
cities, including Jiaozuo, Taiyuan, Luoyang, Yangquan and Zhengzhou, primarily located in 281
ZYUA and TYUA, each emitted more than one-tenth of the total CO2 emissions (Fig. 5). In 2014, 282
the high-emission centres remained in the same places; however, between 2000 and 2014, the 283
percentage of CO2 emissions for individual cities changed. Except for Taiyuan and Hefei, in which 284
emissions increased from 10.54% and 2.26% in 2000 to 16.03% and 7.33% in 2014, respectively, 285
the proportions of CO2 emissions for the remaining four provincial capital cities declined overall. 286
In Wuhan, the proportion decreased from 20.67% to 14.56% (Fig. 5). 287
The percentage of single city's CO2 emissioins to the total CO2 emissions/(%)
-25 -20 -15 -10 -5 0
2000
0 5 10 15 20 25
XianningChuzhou
AnqingChangdeShangraoHuangshi
JiujiangXiangtan
NanchangJiaozuo
ChangshaXinzhouLuoyang
HefeiZhengzhouYangquan
WuhanTaiyuan
2014
288

MANUSCRIP
T
ACCEPTED
ACCEPTED MANUSCRIPT
Fig. 5. The percentage of single city’s CO2 emissions to the total CO2 emissions with the years of 2000 and 2014. 289
The emissions by sector and fossil fuel type, as well as by socioeconomic characteristics, are 290
discussed below to provide a deep understanding of the energy utilization structure and the factors 291
influencing carbon emissions. 292
3.2. Emissions by sector and fossil fuel type 293
Fig. 6A depicts the percentage of sectoral cumulative CO2 emissions for six urban 294
agglomerations. To further analyse the amount and proportion of sectoral CO2 emissions, Fig. 6B 295
describes the distribution of CO2 emissions by sector for different cities in 2014. To compare the 296
various sectors’ CO2 emissions at another scale, we merged 47 socioeconomic sectors into 12 297
categories (Table S1)). The results show that “power generation” represented the largest share of 298
the total cumulative CO2 emissions, accounting for an average of 36.51% among the 18 cities. In 299
Beijing, the production and supply of electric power and steam power also accounted for 32% of 300
the total direct carbon emissions (Shao et al., 2016b). The “non-metal and metal industry”, and 301
“petroleum and chemical industry”, and “mining” sectors accounted for the second largest 302
proportions of total CO2 emissions, at 29.81%, 14.79%, and 9.62%, respectively. The CO2 303
emissions generated from “mining” in the TYUA, representing the highest contribution of 28.21% 304
over the whole period, were higher than those derived from “power generation”, especially in 305
Taiyuan and Yangquan (Fig. 6). In addition, with the progression of urbanization, the “petroleum 306
and chemical industry” and “mining” sectors gradually yielded to “power generation” in Taiyuan, 307
with the percentages shifting from 30.74%, 31.83%, and 16.06% in 2003 to 22.91%, 28.21%, 308
26.39%, respectively, in 2014. 309
Tai
yuan
Wuh
an
Yan
gqua
n
Zhe
ngzh
ou
Hef
ei
Luoy
ang
Cha
ngsh
a
Jiao
zuo
Nan
chan
g
Jiuj
iang
Hua
ngsh
i
Cha
ngde
Anq
ing
Chu
zhou
Xia
nnin
g
Se
cto
r C
O 2 e
mis
sio
ns /
(M
t)
0
50
100
150
200
TY
UA
ZY
UA
WJU
B
WH
UA
GC
MR
CC
PL
The
pe
rce
nta
ge o
f se
cto
r C
O2
em
issi
ons
(%
)
0
20
40
60
80
100
120Primary industry Mining Food production Textile,paper and wood industry Petroleum and chemical industry Nonmental and metal industry Machinery Power generation Construction Transportation Commercial industry and other services Residential consumption
A B
310
Fig. 6. The percentage of cumulative sectoral CO2 emissions within six urban agglomerations over the whole 311
period (A) and CO2 emissions by sector in different cities in 2014 (B). 312
The average CO2 emissions from SI (secondary industry) accounted for the largest share of the 313
total CO2 emissions, ranging from 78.72% in Changsha to 95.01% in Taiyuan (Fig. S1). The 314
contribution of SI to the total GDP was 48.69% and 44.18% in Changsha and Taiyuan, 315

MANUSCRIP
T
ACCEPTED
ACCEPTED MANUSCRIPT
respectively, indicating that an industrial structure shift from SI to tertiary industry (TI) could be 316
beneficial not only in increasing the GDP but also in reducing carbon emissions. Three categories 317
of relationships between the contributions of SI to the total GDP and CO2 emissions were 318
observed. First, a decrease in the percentage of SI-related CO2 emissions occurred with increasing 319
contributions of SI to GDP. Cities in this category included Wuhan, Zhengzhou, and Changsha. 320
Second, the proportion of SI-related CO2 emissions increased with SI contributions to GDP. Hefei 321
and Nanchang belonged to this category. Third, the industrial structure and the contribution of 322
SI-related CO2 emissions remained roughly stable, such as in Taiyuan (Fig. S1). 323
Fig. 7A presents the proportion of CO2 emissions from fossil fuel combustion and industrial 324
processes for six urban agglomerations for the study period. Fig. 7B presents the CO2 emissions 325
from the different energy types for six provincial capital cities in 2014. The primary source of CO2 326
emissions was the use of raw coal, which contributed an average of 60.93% of the total in the 327
central region, followed by clean coal, which represented an 8.25% contribution. The 328
contributions of coke and crude oil to the total CO2 emissions were 6.22% and 4.54%, respectively. 329
Previous research also found that the share of CO2 emissions from coal combustion was 330
approximately 70% from 2005-2008 (Geng et al., 2011b) and 80% from 2000-2013 (Liu et al., 331
2015a). By merging 20 energy types into 3 categories, including coal, oil, and natural gas, we 332
further analysed the CO2 emissions by energy type (Fig. S2). 333
It is well known that coal is a high-emission fossil fuel compared with crude oil and natural 334
gas since it emits more CO2 to produce the same amount of heat compared with the other energy 335
types (Li et al., 2010). In the TYUA, 95% of the CO2 emissions were generated from coal 336
combustion, while 0.53% were from natural gas (Fig. 7A), which is why Taiyuan, which largely 337
relied on coal, contributed the most to the total CO2 emissions. Among the coal-related CO2 338
emissions, the contribution of “mining” in Taiyuan accounted for 55% in 2014 followed by 339
“power generation”. In the other five provincial capital cities, the “power generation” sector 340
contributed the most to the raw CO2 emissions, especially in Nanchang, where power generation 341
had the largest share at 95%. Taking 2014 as an example, the raw coal-related CO2 emissions were 342
higher in Taiyuan than those of the other provincial capital cities, and the emissions from Taiyuan 343
were larger than the total CO2 emissions from Zhengzhou, Hefei, Changsha and Nanchang (Fig. 344
7B). 345
Taiyua
n
Wuh
an
Zhe
ngzh
ou
Hefe
i
Cha
ngsh
a
Nanc
hang
CO
2 em
issi
ons
: M
illio
n to
ns (
Mt)
0
50
100
150
200
Raw coal Cleaned coal Other washed coal Briquettes Coke Coke oven gas
Other Gas Other coking products Crude oil Gasoline Kerosene Diesel oil
Fuel oil LPG Refinery gas Other Petroleum products Natural gas
A B
TY
UA
ZY
UA
WJU
B
WH
UA
GC
MR
CC
PL
The p
erc
ent
age
of C
O 2 em
issio
ns fro
m v
ario
us e
nerg
y ty
pes
(%)
0
20
40
60
80
100
Coal Oil Nature gas Process
346
MANUSCRIP
T
ACCEPTED
ACCEPTED MANUSCRIPT
Fig. 7. The percentage of CO2 emissions by energy types and industrial process (%) during the investigation period 347
(A) and CO2 emissions by energy types from six provincial capitals in 2014 (B). 348
Although the CO2 emissions from coal gradually increased, the proportion of coal-related 349
emissions decreased due to improvements in the energy mix (Geng et al., 2011b). Similar results 350
were found in our study. Taking Zhengzhou as an example, the coal-related CO2 emissions 351
increased from 34.13 Mt in 2000 to 67.33 Mt in 2014. However, the percentage of coal-related 352
CO2 emissions dropped from 94.14% to 85.69, oil-related CO2 emissions increased from 5.78% to 353
9.7%, and natural gas-related CO2 emissions increased from 0.07% to 4.61% (Fig. S2). In 2015, 354
coal remained the dominant fuel, accounting for 64% of China’s energy consumption, and this was 355
the lowest share on record, representing a decrease from a high of 74% in the mid-2000s. Coal 356
production fell by 2% compared to the 10-year average growth of 3.9%. However, the production 357
of other fossil fuels grew: natural gas production increased by 4.8% and oil production increased 358
by 1.5%. China’s CO2 emissions from energy use declined by 0.1% in 2015, the first decline in 359
emissions since 1998 (BP, 2016). 360
Industrial processes also played a significant role in determining CO2 emissions and 361
represented an average of 7.3% of the total emissions over the study period, which is consistent 362
with the results reported by Olivier et al. (2013). The percentage of emissions generated from 363
industrial processes varied from 0.96% in Xinzhou to 31.58% in Shangrao due to differences in 364
economic development and energy structure. 365
3.3. Preliminary analysis of factors influencing carbon 366
emissions 367
Generally, economic development and population expansion have increased CO2 emissions 368
(Geng et al., 2011b; Li et al., 2010). To allow for comparisons among cities and to identify the 369
extent to which the economy and population depend on energy, we normalized the total CO2 370
emissions on per capita and per GDP bases (Wang et al., 2012). 371
The average CO2 emissions per capita across the 18 cities increased from 6.14 metric tons in 372
2000 to 15.87 metric tons in 2014, corresponding to a 158.69% expansion, which appeared higher 373
than the total values for China and the world (Fig. 8). This increase puts tremendous pressure on 374
local governments as they seek to realize their carbon emission reduction ambitions (Wang et al., 375
2012). The average per capita CO2 emissions in this study were 2.27 times higher than those of 376
China and 1.52 times higher than those of the world in 2000 and were 1.7 and 2.5 times higher, 377
respectively, in 2012 (Fig. 8). In addition, the per capita CO2 emissions of central Chinese cities, 378
such as Taiyuan, Yangquan, Jiaozuo, Wuhan, were higher than those of highly urbanized cities as 379
Shanghai, Beijing, Tianjin emitted 12.8, 10.7, and 11.9 t CO2-eq/capita, respectively, in 2006 380
(Sugar et al., 2012). Therefore, reducing the per capita carbon emissions in the central region is 381
very important given the carbon mitigation targets of China and the world. The result of this 382
comparison reveals that some Chinese cities have already emitted more CO2 than cities abroad, 383
not only in terms of total quantity but also per capita (Yu et al., 2012). 384

MANUSCRIP
T
ACCEPTED
ACCEPTED MANUSCRIPT
1998 2000 2002 2004 2006 2008 2010 2012 2014 2016
Pe
r ca
pita
CO 2
emis
sio
ns /
(t
/ p
erso
n)
0
4
8
12
16
20
This studyChina World Liu et al. (2012a)
385
Fig. 8. The average per capita CO2 emissions across various scales. Note: The data of China and world were obtained 386
from Carbon Dioxide Information Analysis Center, Environmental Sciences Division, Oak Ridge National Laboratory, Tennessee, 387
and United States. The data of positive triangle of orange were obtained from Liu et al. (2012a) 388
The increasing tendency of per capita CO2 emissions differed among individual cities due to 389
differences in development stages and pathways. The AAGR of per capita CO2 emissions 390
increased rapidly in Xinzhou (16.39%), Changsha (13.93%), Xianning (13.81%). However, the 391
per capita emissions in Jiaozuo exhibited a slow growth rate of 0.55% per year during the 392
observation period, which coincided with the lower growth rate of total CO2 emissions (AAGR: 393
1.37%) (Fig. 4 and Fig. 9). Per capita CO2 emissions represent not only an individual’s lifestyle 394
choices but also the nature of local infrastructure and the structure of the economy in a given 395
geographical region (Hoornweg et al., 2011). Among the six provincial capital cities, the per 396
capita CO2 emissions were consistently above average for Taiyuan and Wuhan and were below 397
average for the other four provincial capitals over the study period (Fig. 9). Taiyuan, the capital 398
city of Shanxi, is the headquarters of the China National Coal Group Corporation. In addition, 399
Wuhan is a critical industrial base in China and is home to many industries, including iron and 400
steel, automobile, electronics, chemical industry, metallurgy, textiles, shipbuilding, manufacturing, 401
medicine and other industrial sectors. Consequently, these two cities have the highest CO2 402
emissions. Although Taiyuan and Wuhan emitted the largest amounts of CO2 in 2014, and these 403
amounts were approximately the same at 183.53 Mt and 167.77 Mt (Fig. 2; Table S2), respectively, 404
the population of Wuhan was 2.8 times larger than that of Taiyuan (Table 1). In addition, the per 405
capita emissions from Taiyuan were 3 times higher than those from Wuhan (Fig. 9). Interestingly, 406
the per capita CO2 emissions in Taiyuan decreased from a peak of 58.15 metric tons in 2008, 407
which was 3 times higher than the average level in 2014 (Fig. 9). However, the per capita CO2 408

MANUSCRIP
T
ACCEPTED
ACCEPTED MANUSCRIPT
emissions in other foreign cities decreased. For example, the average rate of reduction in the per 409
capita emissions for six cities, including Berlin, Boston, Greater Toronto, London, New York City 410
and Seattle, was 0.27 t CO2e/capita per year for the period of 2004-2009. In addition, this decrease 411
appeared in these six cities mainly due to changes in stationary combustion sources (Kennedy et 412
al., 2012). 413
Per
cap
ita C
O 2 em
issi
on
(t/p
er c
apita
)
0
20
40
60
80
100
AA
GR
of
Pe
r ca
pita
CO 2
em
issi
ons
(%)
0
6
12
18
Ta
iyua
n
Xin
zhou
Ya
ngqu
an
Zhe
ngzh
ou
Jia
ozuo
Luoy
ang
He
fei
Anq
ing
Chu
zhou
Cha
ngsh
a
Xia
ngta
n
Cha
ngde
Wuh
an
Xia
nnin
g
Hua
ngsh
i
Na
ncha
ng
Jiuj
iang
Sha
ngra
o
CO
2 e
mis
sion
s in
tens
ity (
t/1,
000
Yu
an)
0
1
2
3
4
5
AA
GR
of
CO
2 em
issi
ons
inte
nsity
(%
)
-12
-6
0
6
2000 2005 2010 2014 AAGR
414
Fig. 9. The per capita CO2 emissions, and CO2 emissions intensity, and AAGR of these two factors for 18 central 415
Chinese cities with the years of 2000, 2005, 2010, and 2014. 416
The emissions intensity and AAGR for individual cities are shown in Fig. 9. Although total 417
CO2 emissions have increased over the past 15 years, the average CO2 emission intensity 418
decreased from 0.8 metric tons/1,000 Yuan in 2000 to 0.52 metric tons/1,000 Yuan in 2014, with 419
some fluctuations (Fig. 9). The primary reason for the reduction in emission intensity is that the 420
GDP grew faster than emissions (Fig. 10). The total GDP and CO2 emissions increased by 454.61% 421
and 188.71%, with annual growth rates of 13.02% and 7.87%, respectively, during the period from 422
2000 to 2014 (Fig. 10). With the exception of the TYUA, the average CO2 emission intensity 423
appeared to be lower than 0.5 metric tons/1,000 Yuan in the other 15 cities in 2014 (Fig. 9), with 424
MANUSCRIP
T
ACCEPTED
ACCEPTED MANUSCRIPT
values ranging from 0.11 to 0.45 metric tons/1,000 Yuan. The TYUA, located in Shanxi province, 425
was recognized as the largest coal producing region. However, instead of retaining large profits, 426
the TYUA supplied coal to the other regions; therefore, although the GDP of this region was not 427
very high, the TYUA had the largest amount of coal consumption and consequently the highest 428
CO2 intensity (Geng et al., 2011b). The results presented in this study align with those of Liu et al. 429
(2015a), who illustrated that developed regions possess both higher total emissions and per capita 430
emissions with lower emission intensity. The national average CO2 emission intensity in 2012 was 431
0.15 metric tons/1,000 Yuan, and the value in the central region was 0.2 metric tons/1,000 Yuan 432
(Shan et al., 2016c). However, the value in this study was 0.46 metric tons/1,000 Yuan, which was 433
higher than that of the central region and of China as a whole. Consequently, more efforts should 434
be taken to increase the use of low-carbon energy and clean energy and to reduce the carbon 435
emission intensity in these 18 cities, such as changing energy consumption. The emission 436
intensities of the PI, SI, and TI decreased from 2000 to 2014, especially for the SI in Wuhan and 437
Zhengzhou, which had AAGRs of -10.58% and -10.29%, respectively (Fig. S1). 438
1998 2000 2002 2004 2006 2008 2010 2012 2014 2016
0
1
2
3
4
5
6
Total CO2 emissions
GDP Per capita CO2 emissions
CO2 emissions intensity
439 Fig. 10. The changes of total CO2 emissions, GDP, per capita CO2 emissions, and CO2 emission intensity from 440
2000 to 2014. Levels for 2000 are set to 1 for all indicators. 441
Previous research has illustrated that different emission intensities in different regions are the 442
result of critical differences in technology (Li et al., 2010; Liu et al., 2012a). Industrial structure 443
and energy efficiency have also been found to be the primary factors determining emission 444
intensity (Su et al., 2014). The share of tertiary industry has a positive effect in curbing carbon 445
emission intensity (Zhang et al., 2014). The average CO2 emission intensity in Taiyuan (1.53 446
metric tons/1,000 Yuan) was approximately 10 times higher than that of Changsha (0.14 metric 447
tons/1,000 Yuan). As discussed above, the dependence on coal and oil and the utilization of clean 448

MANUSCRIP
T
ACCEPTED
ACCEPTED MANUSCRIPT
energy together resulted in higher CO2 emissions in Taiyuan. In this study, the sectoral CO2 449
emissions from “coal mining and dressing” and “petroleum processing and coking” amounted to 450
581 and 502 Mt for Taiyuan and 4.4 and 0.1 Mt for Changsha, respectively, in 2014 (Fig. 6). 451
China has adopted the target of reducing the CO2 emissions per 1,000 Yuan of GDP by 40-45% 452
relative to 2005 levels by 2020 (xinhua, 2015). Previous research found that the CO2 emissions 453
per unit GDP fell by 28.5% from 2005 to 2013 (Liu et al., 2015b). In addition, the achievement of 454
the carbon emission reduction targets proposed by national governments relies on provincial, state, 455
city and regional allocations and their actions (Bai et al., 2014). In this study, the average CO2 456
intensity decreased from 0.75 metric tons/1,000 Yuan in 2005 to 0.52 metric tons/1,000 Yuan in 457
2014, a decrease of approximately 30% (Fig. 9). The national’s CO2 emission reduction targets 458
have not been achieved ahead of time across the 18 cities. In fact, eight of the 18 cities were above 459
the national average (40%). 460
4. Policy implications and conclusions 461
This study applies a practical methodology to construct territorial CO2 emissions inventories 462
of 18 central Chinese cities located in six urban agglomerations for the period from 2000 to 2014. 463
The reasons for choosing central China are summarized as follows. First, with the proposal and 464
implementation of the Rise of Central China Strategy after 2004, the central region experienced 465
rapid economic development. However, this region must ask how it can avoid the environmental 466
problems resulting from its extensive development. In other words, methods for controlling the 467
CO2 emissions originating from fossil fuel combustion, especially in Shanxi, which relied heavily 468
on coal, should be taken into consideration. Second, a larger proportion of the population in 469
central China, especially in Henan, consumed more energy. Thus, the development of methods for 470
reducing per capita emissions is both urgent and vital. Based on the above considerations, we 471
found that the population and GDP for the selected 18 cities accounted for an average of 6.57% 472
and 7.91% of China’s total population and GDP, respectively, during the investigation period (Fig. 473
2A). However, the share of the CO2 emissions of these cities in various studies is on average 13.38% 474
of China’s total CO2 emissions (Shan et al., 2016c) , which is higher than the proportions of GDP 475
and population. Although the total CO2 emissions increased from 396.66 Mt in 2000 to 1145.19 476
Mt in 2014 (Fig. 3), the AAGR of total CO2 emissions gradually decreased, with values of 12.23%, 477
5.44% and 5.61% for 2000-2005, 2005-2010, and 2010-2014, respectively (Fig. 3). With respect 478
to the individual capital cities, the AAGR of total CO2 emissions ranged from 17.32% in Hefei to 479
5.25% in Wuhan. The relationships between GDP, population, energy and industrial structures, 480
and CO2 emissions are summarized as follows. 481
Economic development has positive effects on CO2 emissions and vice versa (Guan et al., 482
2017; Wang et al., 2012; Zhang and Da, 2015; Zhang et al., 2014). For example, among the six 483
provincial capital cities, Wuhan has higher cumulative CO2 emissions (Fig. 4), per capita GDP 484
(Table 1), and per capita CO2 emissions (Fig. 9), while Nanchang has lower cumulative CO2 485
emissions (Fig. 3), per capita GDP (Table 1), and per capita CO2 emissions (Fig. 9). The base 486
amount of CO2 emissions in 2000 for Wuhan was approximately 10 times that for Nanchang (Fig. 487
3-5; Table S2), at 82 and 8.85 Mt, while in 2014, the values reached 167.77 and 47.57 Mt, 488
respectively (Fig. 3-5; Table S2). In addition, the CO2 emissions of Nanchang grew faster than 489
MANUSCRIP
T
ACCEPTED
ACCEPTED MANUSCRIPT
those of Wuhan (Table 2). The levels of economic and social activity, as well as the systems and 490
structures that enable such activities, provide data regarding the amount of CO2 emissions (Sugar 491
et al., 2012). Although the contribution of SI-related GDP increased in Wuhan, the SI-related CO2 492
emissions decreased from 94.18% in 2000 to 86.34% in 2014 due to improvements in technology 493
and adjustments in industrial structures, while the share of TI-related CO2 emissions increased 494
from 5.35% in 2000 to 13.11% in 2014. Because of Wuhan’s high-quality higher education, the 495
high-tech and new technology sectors, represented by the Optical Valley, have developed well. 496
Moreover, the number of listed companies within Wuhan reached 50 in 2015, ranking it eleventh 497
among Chinese cities (Yicai, 2016), and these companies contributed the largest share of the GDP 498
of Wuhan. As discussed above, TI plays a significant role in improving energy efficiency and 499
reducing carbon emissions (Guan et al., 2017; Zhang et al., 2014), and the presence of these 500
industries is the reason why the AAGR of emission intensity in Wuhan greatly decreased during 501
the investigation period (9.55%) (Table 2). Consequently, Wuhan was able to maintain or even 502
decrease its CO2 emissions while increasing its economic development and population. Contrary 503
to Wuhan, the industrial structures of Nanchang changed from PI and TI to SI, which increased the 504
share of SI-related CO2 emissions. Furthermore, the AAGR of the GDP of Nanchang was also 505
lower compared to the other six capital cities. Thus, Nanchang was focused on quickly developing 506
its economy while controlling the growth of CO2 emissions. 507
Table 2 The AAGR of total CO2 emissions, GDP, population, per capita GDP, Per capita emissions, and CO2 508
emission intensity for six provincial capital cities during 2000 to 2014. 509
Total CO2
emissions
GDP Population Per capita
GDP
Per capita
emission
CO2 emission
intensity
Taiyuan 11.14 14.16 1.27 11.40 9.75 -2.64
Zhengzhou 5.85 17.16 2.48 14.31 3.30 -9.65
Hefei 17.32 20.76 4.10 16.57 12.69 -2.85
Changsha 15.08 18.63 1.01 17.18 13.93 -3.00
Wuhan 5.25 16.36 1.80 14.30 3.39 -9.55
Nanchang 12.76 15.89 1.29 14.28 11.33 -2.70
Economic development has a negative relationship with CO2 emissions (Zhang and Cheng, 510
2009). For example, Taiyuan had higher CO2 emissions (Fig. 3-5; Table S2) and per capita 511
emissions (Fig. 9) but a lower per capita GDP (Table 1). In contrast with Taiyuan, Changsha had 512
lower CO2 emissions (Fig. 3-5; Table S2) and per capita emissions (Fig. 9) but a higher per capita 513
GDP (Table 1). The cumulative CO2 emissions of Taiyuan were 4.7 times higher than those of 514
Changsha (Fig. 4), and in 2014, these two cities emitted 183.53 and 53.61 Mt (Table S2), while 515
the GDP and permanent resident population were 3.1 and 1.8 times lower, respectively, than those 516
of Changsha (Table 1). Therefore, higher emission intensity and higher per capita CO2 emissions 517
were found in Taiyuan (Fig. 9). The average SI-related CO2 emissions in Taiyuan were largest 518
among the six provincial capital cities at 95.01%. The economic activities of Taiyuan relied 519
heavily on intensive resource mining, such as coal (97.44%; Fig. S2), resulting in the largest 520
amount of CO2 emissions in the central region (Liu et al., 2012a). Thus, it is necessary to change 521
the energy structure and accelerate the process of industrial upgrades in Shanxi. For example, 522
shifting energy consumption from coal to a greater share of clean energy, such as natural gas, 523
MANUSCRIP
T
ACCEPTED
ACCEPTED MANUSCRIPT
hydropower, and solar, has been effective in controlling CO2 emissions (Geng et al., 2011a; Li et 524
al., 2010; Sugar et al., 2012). Additionally, large-scale coal mine construction should be 525
encouraged, electricity and grid construction should be accelerated and raw materials processing 526
should be vigorously developed. 527
From the perspective of industry, the number of listed companies is one of the most important 528
indicators for measuring the competitiveness of a city and promoting the growth of GDP. In 2015, 529
Changsha was home to 49 listed companies, ranking 12th in China followed by Wuhan. However, 530
Taiyuan ranked out of 50th (Yicai, 2016). Consequently, although the share of SI-related GDP for 531
Changsha increased from 40.8% in 2001 to 54.2% in 2014, the contribution of SI-related CO2 532
emissions decreased from 81.23% to 76.92%. Therefore, although the total CO2 emissions were 533
not as high as those for Taiyuan, this city still needs to control the growth of total CO2 emissions 534
(Table 2) resulting from the concentration of the population into the provincial capital city (Fig. 535
2). 536
In terms of cumulative CO2 emissions, Zhengzhou ranked third among the 18 selected cities, 537
contributing 8.26% of the total CO2 emissions, followed by Taiyuan and Wuhan (Fig. 4). The GDP 538
in Zhengzhou also ranked third in 2014, followed by Wuhan and Changsha (Table 1). As the 539
capital city of the most populous province, the permanent resident population of Zhengzhou 540
reached 9.38 million, ranked second among the 18 cities in 2014 (Table 1). Despite the lower 541
AAGR of the CO2 emissions of Zhengzhou (Table 2), the base amount of CO2 emissions in 2000 542
was still high (Fig. 3; Table S1). Thus, Zhengzhou still needs to control its total amount of CO2 543
emissions. The total amount of CO2 emissions from coal use increased, with the share dropping 544
from 94.14% in 2000 to 85.69% in 2014 due to energy and industrial restructuring (Fig. S1). The 545
three industry structures for Zhengzhou changed from 3.1:54.5:42.4 in 2010 to 2.1:49.5:48.4 in 546
2015, indicating that TI continued to rise, while the PI and SI declined to a certain degree. 547
Furthermore, the proportion of industrial value added for six energy-intensive industries to the 548
industrial enterprises above decreased from 51.4% in 2010 to 40.2% in 2015 (Zhengzhou, 2016). 549
In addition, in this study, the share of SI-related CO2 emissions decreased from 94.09% in 2000 to 550
89.09% in 2014. The increasing share of tertiary industry and decreasing share of energy-intensive 551
industry together contributed to lower coal-related CO2 emissions(Guan et al., 2017). Formally 552
approved by the state council, Wuhan and Zhengzhou were recognized as the national central 553
cities in 2016 (xinhua, 2017), likely because the per capita emissions grew slowly and because 554
their CO2 emission intensities rapidly decreased from 2000 to 2014 (Table 2). 555
The AAGRs of total CO2 emissions, GDP, and population appeared to be the highest in Hefei 556
among the six provincial capital cities (Table 2). Avoiding the fast growth of CO2 emissions was 557
clearly a primary objective for Hefei. The coal-related CO2 emissions of Hefei increased from 7.9 558
Mt in 2000 to 63.67 Mt in 2014, among which raw coal contributed most. However, the share of 559
raw coal increased until 2003, with a peak value of 96.96%, and then began to decrease. In 2014, 560
the percentage contribution of raw coal was 87.65%. Conversely, the contribution of CO2 561
emissions from gas increased over the investigation period (Fig. S2). 562
With regarding to the cities, like Zhengzhou and Wuhan, the baseline of CO2 emissions were 563
higher and the AAGR of CO2 emissions were lower in the central regions. The primary mission 564
was to further shift industry structure from second industry to tertiary industry, and adjust the 565
energy types from coal to the clean energy types in order to keep the economy healthy growing 566
under the premise of controlling the rapid growth of CO2 emissions. For Changsha and Hefei, how 567
MANUSCRIP
T
ACCEPTED
ACCEPTED MANUSCRIPT
to control the vigorous growth of CO2 emissions, was the main task. Consequently, it was urgent 568
to improve the energy efficiency, change the extensive development pattern into intensive pattern. 569
With respect to Taiyuan, high energy consumable industries should be effectively control, 570
small-scale coal mine construction should be prohibited, electricity and grid construction should 571
be accelerated and raw materials processing should be vigorously developed. 572
Acknowledgments 573
This work was supported by the Natural Science Foundation of China (71533005), the State 574
Key Laboratory of Urban and Regional Ecology, Chinese Academy of Sciences (SKLURE 575
2015-2-6), the joint Leverhulme Trust and Social Sciences Faculty Postgraduate Studentships at 576
the University of East Anglia. 577
References 578
Allinson, D., Irvine, K.N., Edmondson, J.L., Tiwary, A., Hill, G., Morris, J., Bell, M., Davies, Z.G., 579
Firth, S.K., Fisher, J., Gaston, K.J., Leake, J.R., McHugh, N., Namdeo, A., Rylatt, M., Lomas, K., 580
2016. Measurement and analysis of household carbon: The case of a UK city. Applied Energy 164, 581
871-881. 582
Bai, H., Zhang, Y., Wang, H., Huang, Y., Xu, H., 2014. A hybrid method for provincial scale 583
energy-related carbon emission allocation in China. Environ Sci Technol 48, 2541-2550. 584
Bi, J., Zhang, R., Wang, H., Liu, M., Wu, Y., 2011. The benchmarks of carbon emissions and policy 585
implications for China's cities: Case of Nanjing. Energy Policy 39, 4785-4794. 586
BP, 2016. BP Statistical Review 2016. China's energy market in 2015. http://www.bp.com/cont587
ent/dam/bp/pdf/energy-economics/statistical-review-2016/bp-statistical-review-of-world-energy-20588
16-china-insights.pdf. 589
Cai, B., Zhang, L., 2014. Urban CO2 emissions in China: Spatial boundary and performance 590
comparison. Energy Policy 66, 557-567. 591
Chavez, A., Ramaswami, A., 2014. Progress toward low carbon cities: approaches for transboundary 592
GHG emissions’ footprinting. Carbon Management 2, 471-482. 593
Dhakal, S., 2010. GHG emissions from urbanization and opportunities for urban carbon mitigation. 594
Current Opinion in Environmental Sustainability 2, 277-283. 595
Feng, C., Gao, X., Wu, J., Tang, Y., He, J., Qi, Y., Zhang, Y., 2015. Greenhouse gas emissions 596
investigation for towns in China: a case study of Xiaolan. Journal of Cleaner Production 103, 597
130-139. 598
Feng, K., Siu, Y.L., Guan, D., Hubacek, K., 2012. Analyzing Drivers of Regional Carbon Dioxide 599
Emissions for China. Journal of Industrial Ecology 16, 600-611. 600
Geng, Y., Peng, C., Tian, M., 2011a. Energy Use and CO2 Emission Inventories in the Four 601
Municipalities of China. Energy Procedia 5, 370-376. 602
Geng, Y., Tian, M., Zhu, Q., Zhang, J., Peng, C., 2011b. Quantification of provincial-level carbon 603
emissions from energy consumption in China. Renewable and Sustainable Energy Reviews 15, 604
MANUSCRIP
T
ACCEPTED
ACCEPTED MANUSCRIPT
3658-3668. 605
Guan, D., Hubacek, K., Weber, C.L., Peters, G.P., Reiner, D.M., 2008. The drivers of Chinese CO2 606
emissions from 1980 to 2030. Global Environmental Change 18, 626-634. 607
Guan, Y., Kang, L., Shao, C., Wang, P., Ju, M., 2017. Measuring county-level heterogeneity of CO2 608
emissions attributed to energy consumption: A case study in Ningxia Hui Autonomous Region, 609
China. Journal of Cleaner Production 142, 3471-3481. 610
Guo, S., Shao, L., Chen, H., Li, Z., Liu, J.B., Xu, F.X., Li, J.S., Han, M.Y., Meng, J., Chen, Z.-M., Li, 611
S.C., 2012. Inventory and input–output analysis of CO2 emissions by fossil fuel consumption in 612
Beijing 2007. Ecological Informatics 12, 93-100. 613
He, Z., Xu, S., Shen, W., Long, R., Chen, H., 2017. Impact of urbanization on energy related CO2 614
emission at different development levels: Regional difference in China based on panel estimation. 615
Journal of Cleaner Production 140, 1719-1730. 616
Hillman, T., Ramaswami, A., 2010. Greenhouse Gas Emission Footprints and Energy Use Benchmarks 617
for Eight U.S. Cities. Environ Sci Technol 44, 1902-1910. 618
Hoornweg, D., Sugar, L., Trejos Gomez, C.L., 2011. Cities and greenhouse gas emissions: moving 619
forward. Environment and Urbanization 23, 207-227. 620
IPCC, 2006. IPCC Guidelines for National Greenhouse Gas Inventories. Institute for Global 621
Environmental Strate-gies (IGES), Hayama, Japan. 622
Kennedy, C., Demoullin, S., Mohareb, E., 2012. Cities reducing their greenhouse gas emissions. 623
Energy Policy 49, 774-777. 624
Kennedy, C., Steinberger, J., Gasson, B., Hansen, Y., Hillman, T., Havranek, M., Pataki, D., Phdungsilp, 625
A., Ramaswami, A., Mendez, G.V., 2010. Methodology for inventorying greenhouse gas emissions 626
from global cities. Energy Policy 38, 4828-4837. 627
Li, A., Hu, M., Wang, M., Cao, Y., 2016. Energy consumption and CO2 emissions in Eastern and 628
Central China: A temporal and a cross-regional decomposition analysis. Technological Forecasting 629
and Social Change 103, 284-297. 630
Li, L., Chen, C.H., Xie, S.C., Huang, C., Cheng, Z., Wang, H.L., Wang, Y.J., Huang, H.Y., Lu, J., 631
Dhakal, S., 2010. Energy demand and carbon emissions under different development scenarios for 632
Shanghai, China. Energy Policy 38, 4797-4807. 633
Liu, M., Wang, H., Wang, H., Oda, T., Zhao, Y., Yang, X., Zang, R., Zang, B., Bi, J., Chen, J., 2013. 634
Refined estimate of China's CO2 emissions in spatiotemporal distributions. Atmospheric Chemistry 635
and Physics 13, 10873-10882. 636
Liu, Z., Dong, H., Geng, Y., Lu, C., Ren, W., 2014. Insights into the Regional Greenhouse Gas (GHG) 637
Emission of Industrial Processes: A Case Study of Shenyang, China. Sustainability 6, 3669-3685. 638
Liu, Z., Feng, K., Hubacek, K., Liang, S., Anadon, L.D., Zhang, C., Guan, D., 2015a. Four system 639
boundaries for carbon accounts. Ecological Modelling 318, 118-125. 640
Liu, Z., Geng, Y., Lindner, S., Guan, D., 2012a. Uncovering China’s greenhouse gas emission from 641
regional and sectoral perspectives. Energy 45, 1059-1068. 642
Liu, Z., Guan, D., Scott, M., Henry, L., Z., L., Jun, S., Zhang, Q., D., G., 2015b. Steps to China's 643
carbon peak. Nature 522, 279-281. 644
Liu, Z., Guan, D., Wei, W., Davis, S.J., Ciais, P., Bai, J., Peng, S., Zhang, Q., Hubacek, K., Marland, G., 645
Andres, R.J., Crawford-Brown, D., Lin, J., Zhao, H., Hong, C., Boden, T.A., Feng, K., Peters, G.P., 646
Xi, F., Liu, J., Li, Y., Zhao, Y., Zeng, N., He, K., 2015c. Reduced carbon emission estimates from 647
fossil fuel combustion and cement production in China. Nature 524, 335-338. 648

MANUSCRIP
T
ACCEPTED
ACCEPTED MANUSCRIPT
Liu, Z., Liang, S., Geng, Y., Xue, B., Xi, F., Pan, Y., Zhang, T., Fujita, T., 2012b. Features, trajectories 649
and driving forces for energy-related GHG emissions from Chinese mega cites: The case of Beijing, 650
Tianjin, Shanghai and Chongqing. Energy 37, 245-254. 651
Mi, Z., Wei, Y.-M., Wang, B., Meng, J., Liu, Z., Shan, Y., Liu, J., Guan, D., 2017. Socioeconomic 652
impact assessment of China's CO2 emissions peak prior to 2030. Journal of Cleaner Production 142, 653
Part 4, 2227-2236. 654
NDRC, 2010. Guidance on promoting the development of urban agglomerations in the central regio. 655
http://www.gov.cn/gzdt/att/att/site1/20100826/001aa04acfdf0ddff91601.pdf (in Chinese). 656
Olivier, j.G.J., Janssens-Maenhout, G., Muntean, M., Peters, J.A.H.W., 2013. Trends in Global CO2 657
Emissions: 2013 Report. 658
Satterthwaite, D., 2008. Cities' contribution to global warming: notes on the allocation of greenhouse 659
gas emissions. Environment and Urbanization 20, 539-549. 660
Shan, Y., Guan, D., Liu, J., Mi, Z., Liu, Z., Liu, J., Schroeder, H., Cai, B., Chen, Y., Shao, S., Zhang, Q., 661
2017. Methodology and applications of city level CO2 emission accounts in China. Journal of 662
Cleaner Production. 663
Shan, Y., Liu, J., Liu, Z., Xu, X., Shao, S., Wang, P., Guan, D., 2016a. New provincial CO2 emission 664
inventories in China based on apparent energy consumption data and updated emission factors. 665
Applied Energy 184, 742-750. 666
Shan, Y., Liu, Z., Guan, D., 2016b. CO2 emissions from China’s lime industry. Applied Energy 166, 667
245-252. 668
Shan, Y.L., Liu, J.H., Liu, Z., Xu, X.W.H., Shao, S., Wang, P., Guan, D.B., 2016c. New provincial CO2 669
emission inventories in China based on apparent energy consumption data and updated emission 670
factors. Applied Energy 184, 742-750. 671
Shao, L., Guan, D., Zhang, N., Shan, Y., Chen, G.Q., 2016. Carbon emissions from fossil fuel 672
consumption of Beijing in 2012. Environmental Research Letters 11. 673
Song, D., Su, M., Yang, J., Chen, B., 2012. Greenhouse gas emission accounting and management of 674
low-carbon community. ScientificWorldJournal 2012, 613721. 675
Su, Y., Chen, X., Li, Y., Liao, J., Ye, Y., Zhang, H., Huang, N., Kuang, Y., 2014. China ׳s 19-year 676
city-level carbon emissions of energy consumptions, driving forces and regionalized mitigation 677
guidelines. Renewable and Sustainable Energy Reviews 35, 231-243. 678
Sugar, L., Kennedy, C., Leman, E., 2012. Greenhouse Gas Emissions from Chinese Cities. Journal of 679
Industrial Ecology 16, 552-563. 680
Wang, A., Lin, B., 2017. Assessing CO2 emissions in China’s commercial sector: Determinants and 681
reduction strategies. Journal of Cleaner Production 164, 1542-1552. 682
Wang, H., Zhang, R., Liu, M., Bi, J., 2012. The carbon emissions of Chinese cities. Atmospheric 683
Chemistry and Physics 12, 6197-6206. 684
Wang, M., Cai, B., 2017. A two-level comparison of CO2 emission data in China: Evidence from three 685
gridded data sources. Journal of Cleaner Production 148, 194-201. 686
Wu, J., Kang, Z.-Y., Zhang, N., 2017. Carbon emission reduction potentials under different polices in 687
Chinese cities: A scenario-based analysis. Journal of Cleaner Production 161, 1226-1236. 688
xinhua, 2015. Enhanced actions on climate change: China's intended nationally determined 689
contributions http://news.xinhuanet.com/2015-06/30/c_1115774759.htm. 690
xinhua, 2017. NDRC: Supporting the construction of wuhan, zhengzhou national center city. 691
http://news.xinhuanet.com/fortune/2017-01/26/c_1120384031.htm (In Chinese). 692
MANUSCRIP
T
ACCEPTED
ACCEPTED MANUSCRIPT
Yicai, 2016. Which city will be the leader in the new round of rise strategy of central China, Wuhan, 693
Zhengzhou, Hefei, Changsha? http://www.yicai.com/news/5193544.html (In Chinese). 694
Yu, W., Pagani, R., Huang, L., 2012. CO2 emission inventories for Chinese cities in highly urbanized 695
areas compared with European cities. Energy Policy 47, 298-308. 696
Zhang, H., Sun, X., Wang, W., 2017a. Study on the spatial and temporal differentiation and influencing 697
factors of carbon emissions in Shandong province. Natural Hazards 87, 973-988. 698
Zhang, X.-P., Cheng, X.-M., 2009. Energy consumption, carbon emissions, and economic growth in 699
China. Ecological Economics 68, 2706-2712. 700
Zhang, Y.-J., Bian, X.-J., Tan, W., Song, J., 2017b. The indirect energy consumption and CO2 emission 701
caused by household consumption in China: an analysis based on the input–output method. Journal 702
of Cleaner Production 163, 69-83. 703
Zhang, Y.-J., Da, Y.-B., 2015. The decomposition of energy-related carbon emission and its decoupling 704
with economic growth in China. Renewable and Sustainable Energy Reviews 41, 1255-1266. 705
Zhang, Y.-J., Liu, Z., Zhang, H., Tan, T.-D., 2014. The impact of economic growth, industrial structure 706
and urbanization on carbon emission intensity in China. Natural Hazards 73, 579-595. 707
Zhengzhou, 2016. The analysis of Zhengzhou industrial structure adjustment in the period of 1708
2th Five-Year. Zhengzhou Statistics Bureau http://www.zhengzhou.gov.cn/html/www/news4/20709
160503/172933.html (in Chinese). 710
711