Pathways Analysis: Modeling Results
59
Pathways Analysis: Modeling Results Presentation to Vermont Climate Council November 2, 2021 Photo Source
Transcript of Pathways Analysis: Modeling Results

Pathways Analysis: Modeling ResultsPresentation to Vermont Climate Council
November 2, 2021
Photo Source

2
Agenda
Modeling Overview Sector-Specific Results
Transportation
Buildings
Non-Energy
Electricity
Conclusions

3
Scope of Modeling Task• Integrate Cross-Sector Mitigation (CSM) priorities into the Low Emissions Analysis Platform (LEAP)
model, initially developed by the Stockholm Environment Institute for Vermont’s Comprehensive Energy Plan
• Report initial and final results on GHG reduction pathways and associated costs to inform CSM and Vermont Climate Council deliberations about final CAP recommendations
• Summarize key insights to inform future policy development
Key Considerations • The LEAP model is not predictive
• It is an accounting tool that enables decision-makers to compare options for meeting requirements and visualize scope of the transition required
• Results illustrate the level of activity by sector necessary to meet the GWSA requirements utilizing the approaches recommended by CSM and its stakeholders
• Emissions reductions are generated by the adoption and delivery of technologies that are present in the market today, but at a significantly accelerated pace and scale relative to today
Modeling Overview

4
Economy-Wide Results
7,380 GWSA Requirement
5,180 GWSA Requirement
1,730 GWSA Requirement

5
Transition Investments and SavingsNear-term investments in transportation and buildings…,
…are offset by fossil fuel savings in medium- to long-term
…followed by increasing investments in electric generation in later years...

Transportation
7
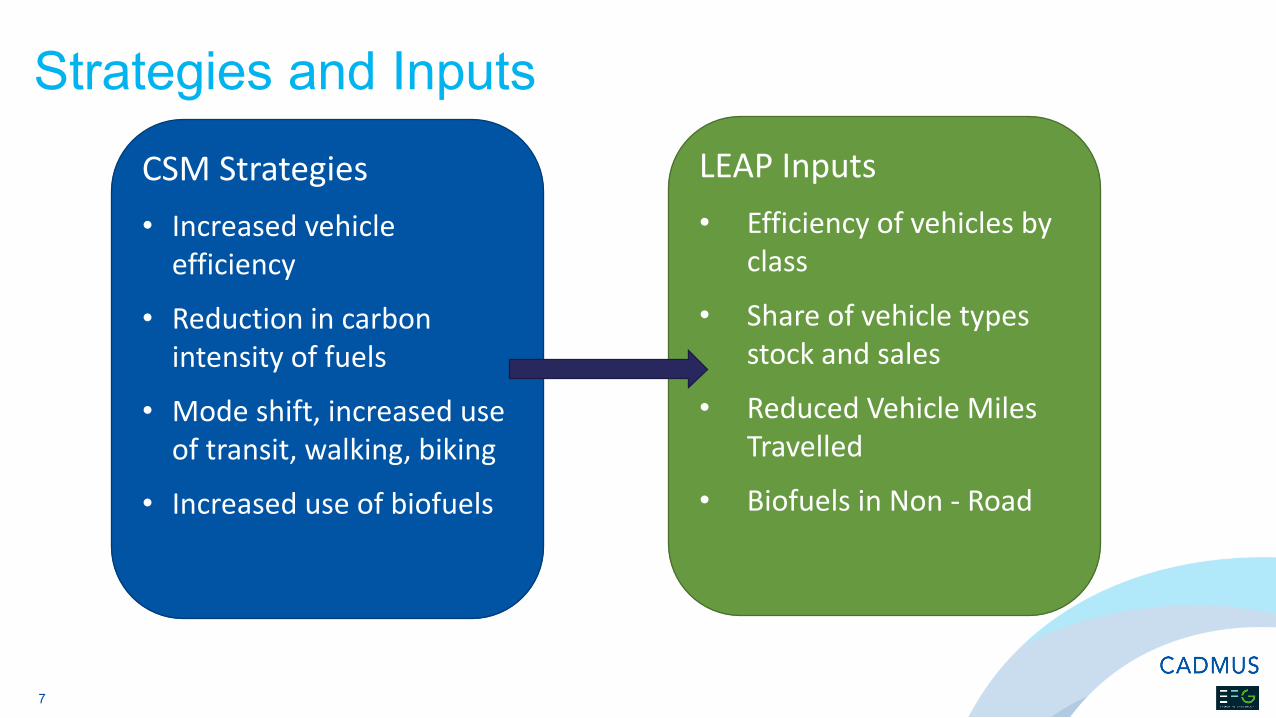
Strategies and Inputs
CSM Strategies• Increased vehicle
efficiency
• Reduction in carbon intensity of fuels
• Mode shift, increased use of transit, walking, biking
• Increased use of biofuels
LEAP Inputs • Efficiency of vehicles by
class
• Share of vehicle types stock and sales
• Reduced Vehicle Miles Travelled
• Biofuels in Non - Road

Transportation Sector Transition
8

Transportation Sector Key Indicators
9
Key LEAP Outputs 2025 2030
EVs 43,000 166,000
EV share of sales 40% >80%VMT Reduction from Baseline
1.9% 3.5%
EV share of VMTs 8% 29%
EV Managed Charging
27% 50%

Transportation Sector Key Indicators
10
Key LEAP Outputs 2025 2030
EVs 43,000 166,000
EV share of sales 40% >80%VMT Reduction from Baseline
1.9% 3.5%
EV share of VMTs 8% 29%
EV Managed Charging
27% 50%

11
• As Vermont’s largest source of emissions, required pace of change in the transportation sector is significant, but
essential for meeting the GWSA requirements
• Fortunately, national and regional initiatives are already creating major impacts in the market that Vermont can
and should leverage
• Modeling indicates that these solutions alone are not enough to drive the pace of change needed; Vermont will
likely need to invest in additional strategies, such as
• Incentives for more fuel efficient and electric vehicles
• Public messaging and promotion to support rapid adoption
• Charging infrastructure deployment
• The Transportation Climate Initiative, in addition to helping reduce emissions, can create an important source of
revenue for these additional approaches
• To not over-burden the electric grid, managed charging is needed
• Attention to equity and reducing transportation energy burden for Vermonters
Transportation Sector Insights

Buildings

13
Strategies and Inputs
CSM Strategies• Increased shell efficiency
• Increased equipment efficiency
• Decrease in carbon intensity of fuels
• Coordinated loads
• Role of biofuels in future requirements
LEAP Inputs • Reduce building energy
use intensity
• High efficiency equipment replacement (i.e., heat pumps)
• Electricity replacing combustion fuels
• Alter proportion of biofuels utilized

14
Building Sector Transition Emissions by Building Type

15
Key LEAP Output -Residential
2025 2030
Homes Weatherized 63,599 108,160Heat Pumps Installed 78,041 142,851Heat Pump Water Heaters Installed
63,247 136,558
Homes with Biofuels 19,324 29,823
Residential Building Emissions by End Use
Building Sector Key Indicators

16
Key LEAP Output -Residential
2025 2030
Homes Weatherized 63,599 108,160Heat Pumps Installed 78,041 142,851Heat Pump Water Heaters Installed
63,247 136,558
Homes with Biofuels 19,324 29,823
Equipment Installations by 2025
Building Sector Key Indicators

17
• Model utilizes commercially available and proven technologies, meaning delivery mechanisms and organizations are already in place but must scale rapidly.
• The pace of change in the modeling is greater than the natural level of market turnover, meaning new interventions are necessary to accelerate adoption.
• The scale of installations is significant, making work force development and training essential.
• Incentives and extensive public messaging and promotion to support rapid adoption.
• Weatherization reduces impacts on the electric system, reducing household and system-wide costs.
• Particular attention to equity and reducing energy burden is required. Supporting navigation and financing assistance for customers, as well as strategies and assistance to help consumers "bundle" building performance upgrades should be encouraged
Building Sector Insights
Non-Energy

19
Strategies and Inputs
CSM Strategies• Reduce direct agriculture
emissions
• Increase agriculture sequestration
• Reduce direct emissions from refrigerants
• Address direct industrial direct emissions
LEAP Inputs• Reduce enteric fermentation
• Increase manure management
• Increase soil carbon sequestration
• Align ODS substitutes with HFC Rule and refrigerant management plans.
• Reduce semi-conductor manufacturing emissions

20
Non-Energy Sector Transition
Emissions Reductions Relative to 2020
2025 2030
ODS Substitutes 25% 41%Semi-Conductor Manufacturing
4% 8%

21
Emissions Reductions Relative to 2020
2025 2030
Enteric Fermentation 20% 39%Manure Management 29% 57%Agricultural Soils 9% 19%
Non-Energy Sector Key Indicators
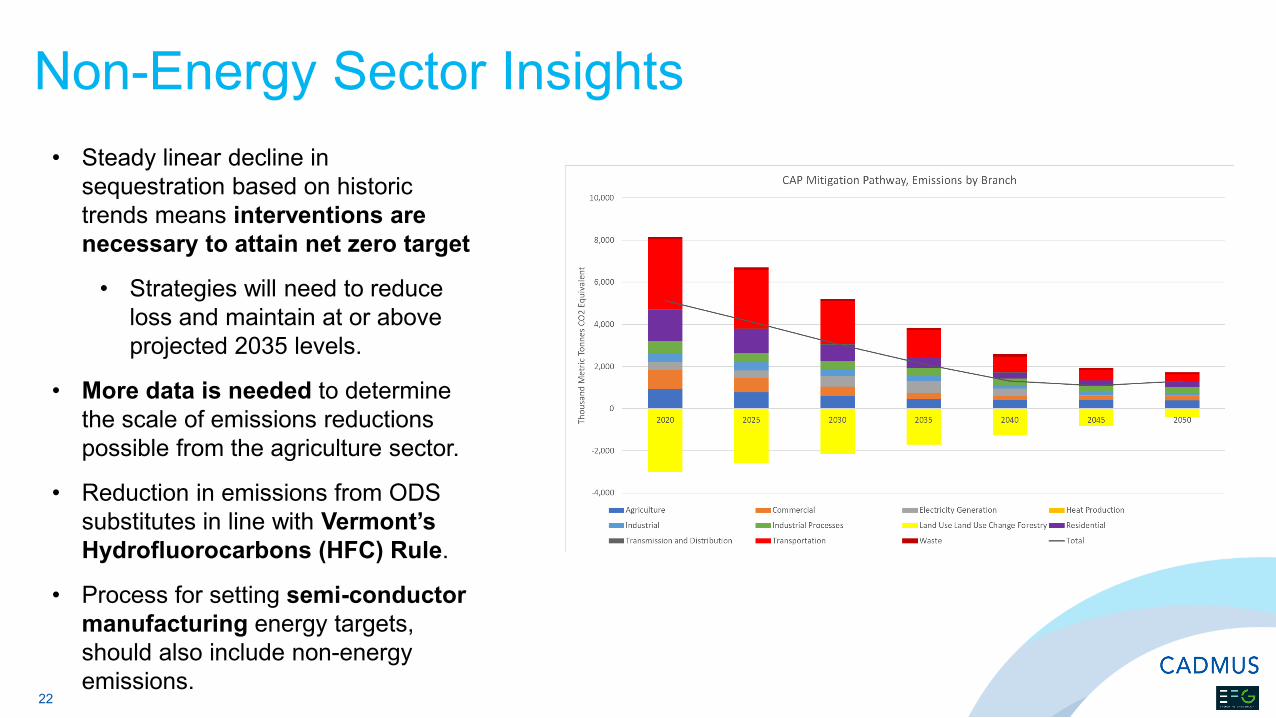
22
• Steady linear decline in sequestration based on historic trends means interventions are necessary to attain net zero target
• Strategies will need to reduce loss and maintain at or above projected 2035 levels.
• More data is needed to determine the scale of emissions reductions possible from the agriculture sector.
• Reduction in emissions from ODS substitutes in line with Vermont’s Hydrofluorocarbons (HFC) Rule.
• Process for setting semi-conductor manufacturing energy targets, should also include non-energy emissions.
Non-Energy Sector Insights

Electricity

Key Modeling Considerations
• LEAP is a “demand-driven” model, meaning:
• Outputs are a response to the inputs from the other sectors
• The LEAP model optimizes the electric generation technologies and resourcesavailable to meet the new demand in each time period.
• LEAP cannot and should not replace the more granular modeling and planning work that Vermont’s transmission and distribution utilities undertake
• Detailed analyses will be essential for coordinating load management and ensuring that technology advances (for example, battery performance and cost) are captured to reduce costs
24

25
Strategies and Inputs
CSM Strategies• Meet Increasing Electric
Demand from Transport and Buildings
• Increase Renewable Generation
• Flexible Load Management
• Storage• Electrification for All
LEAP Inputs• Electricity demands
from demand module by time period
• Costs and Performance for Electric Generation Systems
• Regional Electric Grid energy mix

26
Electricity Key Indicators
Key LEAP Output 2025 2030Electricity as Share of Total Energy
20% 30%
Total Demand (GWh)
6,416 7,911
Peak Demand (MW)
1,441 1,777
Share of EV Managed Charging
27.3% 50%

27
• The emphasis on electrification in the transportation and building sectors requires that Vermont plans for and seeks to actively manage increasing electric demands
• This will require flexible load management and coordination of multiple loads at multiple sites and active planning to address transmission and distribution system needs
• This is particularly important to address system costs
• Vermont is fortunate to have one of the cleanest electric supplies in the county, but will need to expand renewable resources
Electric Sector Insights
Conclusions

Policy Implications
• LEAP modeling results are consistent with the CSM recommendations and provide insights on scale, scope, and pace of the transitions that should be considered during implementation of CAP pathways, strategies, and actions
• The transitions are significant, particularly in the near-term, but necessary to achieve the requirements set forth in the GWSA and required by the science of climate change
• While the scale of technology and market changes may feel daunting:• The modeling utilizes existing technology, meaning implementation can begin immediately • Disruptive technology is often not linear• Policy can drive market innovation
• It will be important to address workforce needs and equity impacts to ensure the benefits of this transition are available to all Vermonters
• CSM has already begun this important work with the support in development of CAP strategies• It will need to be carried on through the next phases of implementation by other actors
29

Questions and Discussion

Thank You!

Appendix: Full Modeling Details

All Pathways Reflect Deep Multi-Sectoral Action
33
Click to add text

Economic: Net costs of $22 to $6/tonne CO2e
34
Economic Summary: Cumulative Costs-Benefits 2015-2050, Relative to BaselineDiscounted 2% to year 2019, Units Billion 2019 US Dollars

Economic: All Pathways Strong Net Economic Benefits including Social Cost of Greenhouse Gases
35
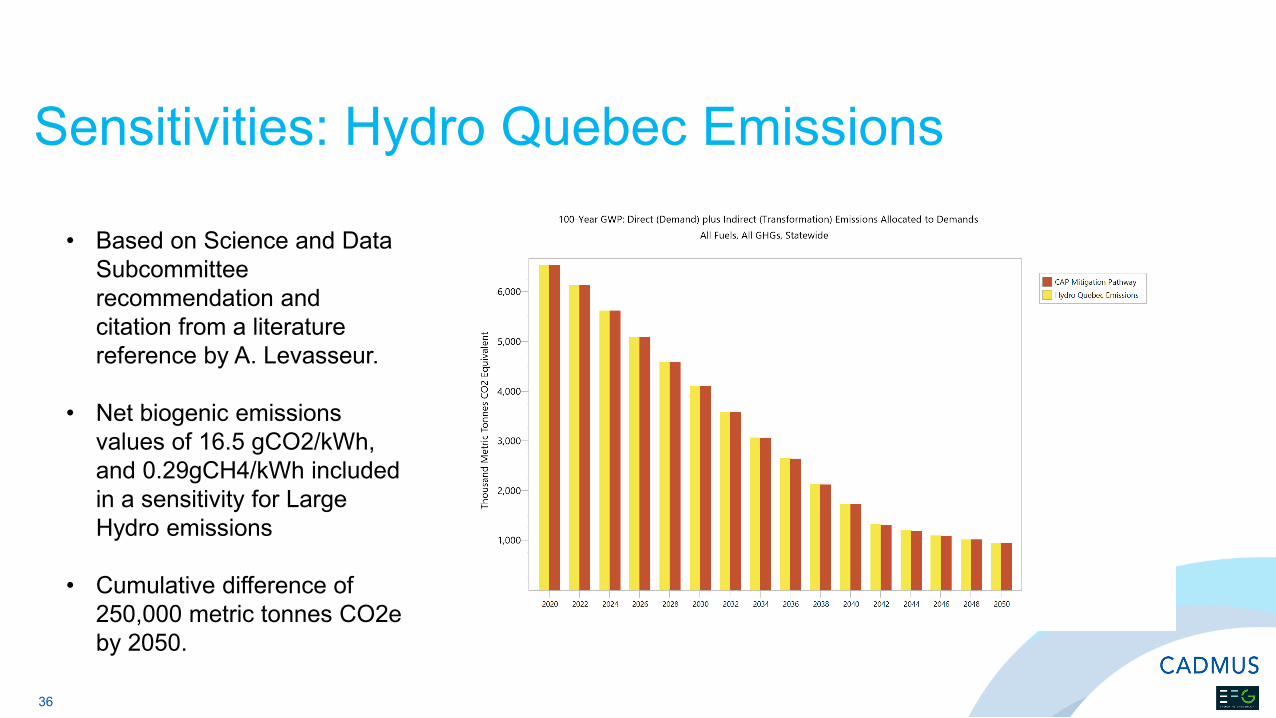
Sensitivities: Hydro Quebec Emissions
36
• Based on Science and Data Subcommittee recommendation and citation from a literature reference by A. Levasseur.
• Net biogenic emissions values of 16.5 gCO2/kWh, and 0.29gCH4/kWh included in a sensitivity for Large Hydro emissions
• Cumulative difference of 250,000 metric tonnes CO2e by 2050.

Sensitivities: Biogenic CO2
37
• Based on Science and Data Subcommittee recommendation report on Biogenic C02 for CAP mitigation Pathway.
• Net cumulative reductions decrease from 77 million tonnes if biogenic is not counted (top graph) to 74 million metric tonnes if it is included (bottom graph).
-
50.0
100.0
150.0
200.0
250.0
2020 2025 2030 2035 2040 2045 2050
Cum
ulat
ive
milli
on m
etric
tonn
es C
O2
Comparative CO2 emissions (biogenic and nonbiogenic)
CAP Mitigation Pathway Baseline

Transport Sector – CAP Mitigation Pathway
38
By 2025: • 43,400 EVs, increase of more than 39,000
over today. • By 2025 EVs are almost 40% share of light
duty vehicle sales.
• All major automakers have invested in EV technology and are expected to release additional EV models in the next three years, including new electric pickup trucks and sports utility vehicles, which are currently under-represented in the vehicle market.
• Precedes California Advanced Clean Cars II –which would require manufacturers to deliver increasing share of Light Duty Evs in 2026, ramping up to 100% in 2035.

Transport Sector – CAP Mitigation Pathway
39
By 2030: • 166,000 EVs, almost 4x greater than baseline
projection of 43,000. • By 2030 EVs account for 29% of vehicle miles
travelled.
• Vehicle mile demand management initiatives result in 3.5% reduction in vehicle miles travelled compared to baseline.
• 50% of EV charging is managed to reduce peak impacts.
• Sales of new ICE vehicles phased out by 2033.
40
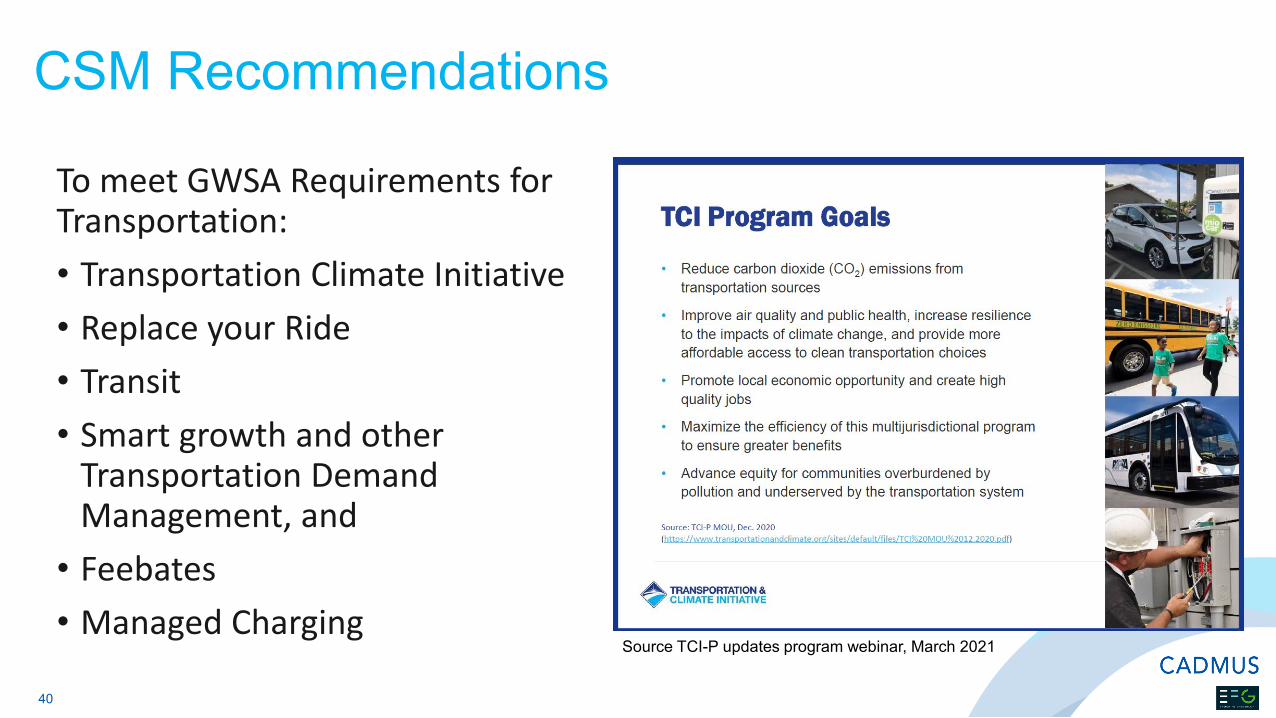
To meet GWSA Requirements for Transportation:• Transportation Climate Initiative• Replace your Ride • Transit• Smart growth and other
Transportation Demand Management, and
• Feebates• Managed Charging
Source TCI-P updates program webinar, March 2021
CSM Recommendations

Buildings Sector – CAP Mitigation Pathway
41
Emissions reductions from 2020 to 2030 45%, and by 2050 80%.
~55% from residential, 33% Commercial, 12% Industrial

Buildings Sector – CAP Mitigation Pathway
42
Residential, primarily space heating
Heat pumps, shell efficiency.
Phase out of fossil cooking and water heating
Blended heating oil and increased RNG blending
Commercial, primarily space heating
Heat pumps, phase out of water and cooking fossil
Blended heating oil and increased RNG blending

Residential Buildings CAP Mitigation Pathway
43
By 2025:
• Nearly 80,000 heat pumps, almost 50,000 above baseline.
• More than 60,000 heat pump water heaters.
• More than 60,000 Weatherized units - more than 2x baseline.
• 1.9 Trillion Btu’s of biofuels, equivalent to meeting the needs of almost 20,000 average single-family units.

Buildings CAP Mitigation Pathway
44
By 2025:
• Support income qualified heat pumps and weatherization.
• Heat pumps gaining rapid market share, more than 11,000 in 2020, but continued rapid adoption required.
• Workforce development essential to scale activity in building sector – wages and training.
• Coaching and financing important supports.

Buildings CAP Mitigation Pathway
45
By 2030:
• More than 142,000 residential heat pumps – an increase of 84,000 above baseline.
• Phasing out of water heating and cooking underway.
• Weatherization of 120,000 units.
• Biofuels increasing contribution to reductions.
Cumulative Emissions Reduction by Element Compared to Baseline

Residential Buildings Weatherization and Heat Pumps – CAP Mitigation Pathway
46

Commercial Buildings CAP Mitigation Pathway
47
Commercial Emissions by End Use Commercial Emissions by Heating System Type

Industry CAP Mitigation Pathway
48
Industry Final Energy Demand Biogas and Biodiesel All Sectors

Buildings CAP Mitigation Pathway
49
By 2050:
• Modernized building infrastructure.
• Electrified end uses• Grid interactive and
connected buildings to coordinate multiple loads across multiple sites.
• Storage for resilience.• Reduced energy burdens for
buildings.• Greater on-site generation.
Discounted Social Costs by Element Compared to Baseline

Key Policies, Strategies & Actions
50
To Meet GWSA Requirements in the Building Sector:• Clean Heat Standard, • Rental Efficiency Initiative, • Weatherization at scale, • Net zero new construction
standards for residential and commercial,
• Increased demand response and coordinated load management

Non-Energy Sector – CAP Mitigation Pathway
51
Emissions reductions from 2020 to 2030 32%, and by 2050 53%.
~2/3rds of the reductions are from Agriculture, 1/3rd Industrial Processes

CAP Mitigation Non-Energy Agriculture
52
By 2030:
• Adoption of alternative feed practices to reduce emissions from enteric fermentation.
• Adoption of manure management practices.
• Increased sequestration by agricultural soils.
• Value of reduced emissions of 350,000 Metric Tonnes CO2e by 2030 has social cost of carbon value of more than $40 million.
• Increased research on feasibility, adoption and impacts all required.
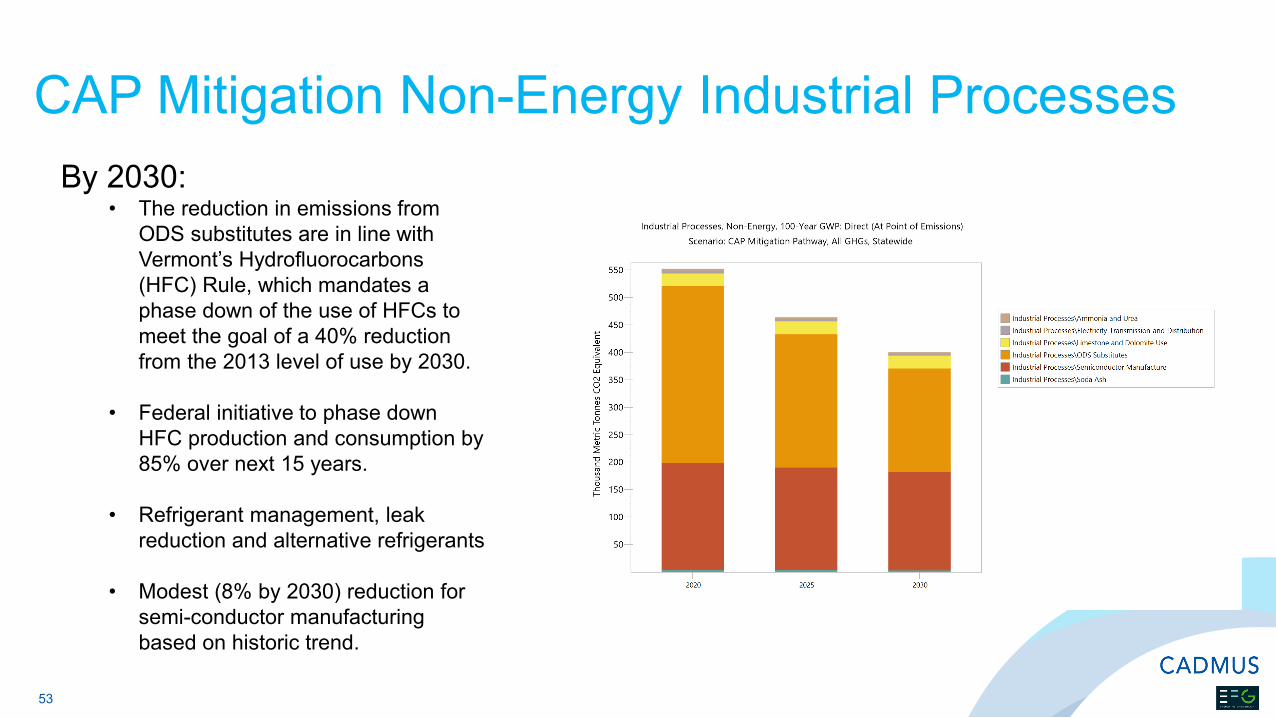
CAP Mitigation Non-Energy Industrial Processes
53
By 2030:• The reduction in emissions from
ODS substitutes are in line with Vermont’s Hydrofluorocarbons (HFC) Rule, which mandates a phase down of the use of HFCs to meet the goal of a 40% reduction from the 2013 level of use by 2030.
• Federal initiative to phase down HFC production and consumption by 85% over next 15 years.
• Refrigerant management, leak reduction and alternative refrigerants
• Modest (8% by 2030) reduction for semi-conductor manufacturing based on historic trend.

Pathway Key Policies, Strategies & Actions
54
To Meet GWSA Requirements for Non-Energy:• Increased research and implementation
support• Practices to reduce enteric fermentation
emissions,• Manure management initiative, • Practices to increase soil carbon
sequestration, • ODS substitutes including refrigerant
management,• Target reductions for semi-conductor
manufacturing• Maintain and enhance sequestration to
achieve net zero in 2050.

Electricity Sector – CAP Mitigation Pathway
55
Significant increase in electricity demand to meet the electrification demands from transportation and buildings.
Electric Generation mix continues trend toward renewables, and 100% Renewable Energy Standard by 2050.
Load management, flexible and coordinated loads and storage all key strategies.

Electricity Sector – CAP Mitigation Pathway
56
By 2025: • Increase of electric demand over baseline of
796,000 MWh.
• Electricity meeting 20% of final demands by 2025, reaching more than 55% by 2050
• Potential upgrades to serve close to 80,000 heat pumps, 60,000 heat pump water heaters, and more than 40,000 EVs.
• Equity and access to electrification for all.
• Continued growth of customer sited solar, 600 GWh by 2025.

Electricity CAP Mitigation Pathway
57
By 2030:
• Peak power requirements increase by more than 40% over baseline.
• Offshore wind providing more than 2,000 GWh, Onshore wind 1,200 GWh.
• 50% of EV charging is managed.

Electricity CAP Mitigation Pathway
58
By 2050:
• 8,000 GWh of “export” or curtailed power in order to meet demand in all time slices.
• Opportunities for coordinated and flexible load management to reduce the over-generation.
• May also provide strategic electrification for industry.

Key Policies, Strategies & Actions
59
Meeting the GWSA Requirements for Electricity: • Expansion of renewable energy
standard to reach 100% by 2050• Participation in regional market and
shift to renewables• Investigation of demand response,
flexible load management, and storage to address curtailment
• Potential for additional strategic electrification in industry