
Modeling managed aquifer recharge processes in a highly ...texture recharge pathways occur, results...
20
PAPER Modeling managed aquifer recharge processes in a highly heterogeneous, semi-confined aquifer system Received: 30 January 2019 /Accepted: 22 August 2019 # The Author(s) 2019 Abstract Widespread groundwater overdraft in alluvial aquifer systems like the Central Valley (CV) in California, USA, has increased interest in managed aquifer recharge (MAR). Like most clastic sedimentary basins, recharge to the productive semi-confined CV aquifer system remains a challenge due to the presence of nearly ubiquitous, multiple confining units (silt and clay) that limit recharge pathways. Previous studies suggest the presence of interconnected networks of coarse-texture sand and gravel deposits that bypass regional confining units over a small fraction of the CV near the American and Cosumnes rivers. Here, variably saturated infiltration and recharge processes were simulated across a domain that includes high-resolution representation of the heterogeneous alluvial geologic architecture in this area. Results show that recharge potential is highly dependent on subsurface geologic architecture, with a nearly 2 order-of-magnitude range of recharge across the domain. Where interconnected coarse- texture recharge pathways occur, results show that these features can (1) accommodate rapid, high-volume MAR and (2) propagate widespread and rapid pressure responses over multi-kilometer distances in the semi-confined aquifer system. For all MAR simulations, results show that the majority of MAR is accommodated by filling unsaturated-zone (UZ) pore volume. Results also show that coarse-texture UZ facies (where present) accommodate the majority of MAR volume during early time, but fine-texture facies ultimately accommodate the majority of the total MAR volume, even for coarse-dominated sites. These findings highlight the large variability of MAR potential across the landscape and demonstrate the importance of fine-texture facies for accommodating MAR in alluvial aquifer systems. Keywords Groundwater management . Groundwater recharge/water budget . Numerical modeling . Managed aquifer recharge . USA Introduction Civilizations have typically obtained water from natural and constructed surface-water resources throughout most of hu- man history. Only during the last 50–70 years has a significant quantity of water for humans been obtained through pumping from wells (Alley et al. 2002). During this short time, alarming levels of groundwater depletion have been observed in many regions, especially in semi-arid and arid areas that rely heavily on groundwater pumping from clastic sedimentary basins (Konikow 2013; Taylor et al. 2013; Wada et al. 2010, 2012). Groundwater has commonly been a source of high-quality freshwater and an important safeguard against uncertain inter-annual and inter-decadal shortfalls in precipitation and surface-water supplies (Hanson et al. 2012). However, over- draft of this important resource has only accelerated during the twenty-first century (Wada et al. 2011) and is further threat- ened by future climate uncertainty (Milly et al. 2008; Mirchi et al. 2013). Despite continued unsustainable groundwater abstraction in many areas, water policy efforts continue to respond to near-term crises and fail to anticipate long-term future conditions (Karl et al. 2009). Large inter-annual variability of precipitation and streamflow (Dettinger et al. 2011) and heavy reliance on groundwater pumping for agricultural irrigation (Scanlon et al. 2012) has created an especially precarious scenario for water management in California’ s Central Valley (CV) aquifer Stephen R. Maples 1 . Graham E. Fogg 1 . Reed M. Maxwell 2 * Stephen R. Maples [email protected] 1 Department of Land, Air, and Water Resources, University of California, 1 Shields Ave., Davis, CA 95616, USA 2 Hydrologic Science and Engineering Program, Colorado School of Mines, 1500 Illinois St., Golden, CO 80401, USA https://doi.org/10.1007/s10040-019-02033-9 Hydrogeology Journal (2019) 27:2869–2888 /Published online: 17 October 2019
Transcript of Modeling managed aquifer recharge processes in a highly ...texture recharge pathways occur, results...

PAPER
Modeling managed aquifer recharge processes in a highlyheterogeneous, semi-confined aquifer system
Stephen R. Maples1 & Graham E. Fogg1& Reed M. Maxwell2
Received: 30 January 2019 /Accepted: 22 August 2019# The Author(s) 2019
AbstractWidespread groundwater overdraft in alluvial aquifer systems like the Central Valley (CV) in California, USA, has increasedinterest in managed aquifer recharge (MAR). Like most clastic sedimentary basins, recharge to the productive semi-confined CVaquifer system remains a challenge due to the presence of nearly ubiquitous, multiple confining units (silt and clay) that limitrecharge pathways. Previous studies suggest the presence of interconnected networks of coarse-texture sand and gravel depositsthat bypass regional confining units over a small fraction of the CV near the American and Cosumnes rivers. Here, variablysaturated infiltration and recharge processes were simulated across a domain that includes high-resolution representation of theheterogeneous alluvial geologic architecture in this area. Results show that recharge potential is highly dependent on subsurfacegeologic architecture, with a nearly 2 order-of-magnitude range of recharge across the domain. Where interconnected coarse-texture recharge pathways occur, results show that these features can (1) accommodate rapid, high-volume MAR and (2)propagate widespread and rapid pressure responses over multi-kilometer distances in the semi-confined aquifer system. For allMAR simulations, results show that the majority of MAR is accommodated by filling unsaturated-zone (UZ) pore volume.Results also show that coarse-texture UZ facies (where present) accommodate the majority of MAR volume during early time,but fine-texture facies ultimately accommodate the majority of the total MAR volume, even for coarse-dominated sites. Thesefindings highlight the large variability of MAR potential across the landscape and demonstrate the importance of fine-texturefacies for accommodating MAR in alluvial aquifer systems.
Keywords Groundwater management . Groundwater recharge/water budget . Numerical modeling . Managed aquifer recharge .
USA
Introduction
Civilizations have typically obtained water from natural andconstructed surface-water resources throughout most of hu-man history. Only during the last 50–70 years has a significantquantity of water for humans been obtained through pumpingfromwells (Alley et al. 2002). During this short time, alarminglevels of groundwater depletion have been observed in manyregions, especially in semi-arid and arid areas that rely heavily
on groundwater pumping from clastic sedimentary basins(Konikow 2013; Taylor et al. 2013; Wada et al. 2010, 2012).Groundwater has commonly been a source of high-qualityfreshwater and an important safeguard against uncertaininter-annual and inter-decadal shortfalls in precipitation andsurface-water supplies (Hanson et al. 2012). However, over-draft of this important resource has only accelerated during thetwenty-first century (Wada et al. 2011) and is further threat-ened by future climate uncertainty (Milly et al. 2008; Mirchiet al. 2013). Despite continued unsustainable groundwaterabstraction in many areas, water policy efforts continue torespond to near-term crises and fail to anticipate long-termfuture conditions (Karl et al. 2009).
Large inter-annual variability of precipitation andstreamflow (Dettinger et al. 2011) and heavy reliance ongroundwater pumping for agricultural irrigation (Scanlonet al. 2012) has created an especially precarious scenario forwater management in California’s Central Valley (CV) aquifer
Stephen R. Maples1 . Graham E. Fogg1 . Reed M. Maxwell2
* Stephen R. [email protected]
1 Department of Land, Air, and Water Resources, University ofCalifornia, 1 Shields Ave., Davis, CA 95616, USA
2 Hydrologic Science and Engineering Program, Colorado School ofMines, 1500 Illinois St., Golden, CO 80401, USA
https://doi.org/10.1007/s10040-019-02033-9Hydrogeology Journal (2019) 27:2869–2888
/Published online: 17 October 2019

system, which has had overdraft conditions in its southernportion for decades (Brush et al. 2013; Faunt et al. 2009;Konikow 2013; Scanlon et al. 2012). Historically abundantsnowmelt runoff from the Sierra Nevada provides an estimat-ed 54% of water for CV crops, on average (Faunt et al. 2009),with the remainder provided by direct precipitation andgroundwater. Average temperatures in California (CA) areexpected to increase by 1.5–4.5 °C by the end of the twenty-first century (Cayan et al. 2008), which will decrease the pro-portion of precipitation as snow and initiate earlier springsnowmelt and runoff (Cayan et al. 2008, 2010; Vicuña andDracup 2007), increase evapotranspiration (ET) and decreaselate-season baseflow (Hayhoe et al. 2007; Huntington andNiswonger 2012), and likely increase the likelihood of co-occurring flooding and water-shortages in the same water year(Knowles et al. 2006; Swain et al. 2018). Future populationgrowth and land-use change in CA, USA, and will likelyincrease drought risk (Barnett et al. 2008; Cayan et al.2010), and elevate competition for existing water resources(Gleick 2000). These stressors are not unique to CA, but aresymptomatic of increasing vulnerability of water resourcesworldwide (Stewart et al. 2005; Vicuña et al. 2011), especiallyin snowmelt-fed semi-arid and arid regions (Konikow 2013).
To reverse the negative effects of overexploitation ofgroundwater resources, groundwater must transition from be-ing treated mainly as an extractive resource to one in whichrecharge and subsurface storage are pursued more aggressive-ly. This remains a challenge because unlike surface-water res-ervoirs that are typically replenished on annual timescales, theclastic sedimentary aquifer systems are replenished on muchlonger time scales (Taylor et al. 2013), especially if no partic-ular effort is devoted to augmenting groundwater recharge.Managed aquifer recharge (MAR) has been used for decadesto supplement natural recharge and to strategically store sur-face water in groundwater aquifer systems for future watersupply (Bouwer 2002), often as part of a conjunctive use(Bredehoeft and Young 1983) and/or water market framework(Israel and Lund 1995), including in select groundwater basinsin CA (e.g., Asano 2016; Kletzing 1987), elsewhere in theSouthwestern US (e.g., Jacobs and Holway 2004), and glob-ally (e.g., Dillon et al. 2019). There is interest in expandinguse of MAR in CA, both to offset overdraft and to hedgeagainst future decreases in snowpack-water storage andchanges in the timing and volume of surface-water availabil-ity. Established MAR projects commonly use dedicated infil-tration basins located over locally coarse-texture geologicaldeposits to increase recharge, but increasingly, MAR on agri-cultural fields during nongrowing seasons (Ag-MAR) hasbeen proposed as an alternative to infiltration basins (Dahlkeet al. 2018; Harter and Dahlke 2014; Niswonger et al. 2017).Studies have noted that even during periods of water scarcity,wet-season high-magnitude streamflows (HMF) can oftenprovide ample unmanaged surface water for MAR during
nongrowing seasons in CA (Beganskas and Fisher 2017;Kocis and Dahlke 2017) and elsewhere (Chinnasamy et al.2018). The largest quantity of winter HMF in CA are in theCV, where most of the statewide groundwater overdraft oc-curs. HMF in the CV typically occur during episodic 5–7 daywindows (Kocis and Dahlke 2017), and can be quite large(3.2 km3 annual average during years with HMF). However,augmenting groundwater recharge with ephemeral HMF re-mains a challenge in the CV because the sedimentary aquifersystem is composed of mostly silt and clay sediments (Fauntet al. 2009) that form nearly ubiquitous, multiple confininglayers that create semiconfined conditions and limit infiltra-tion rates over most of the landscape.
Geologic heterogeneity is ubiquitous across scales andstrongly affects movement of water and solutes through thesubsurface; however, seldom are enough subsurface dataavailable to represent heterogeneous features explicitly inmodels (De Marsily et al. 2005; Koltermann and Gorelick1996). As a result, development of groundwater models ofteninvolves simplifying or up-scaling heterogeneity to enableadequate representation of regional groundwater flows forpurposes of regional water resources management. For exam-ple, in models of sedimentary aquifer systems (e.g., Phillipsand Belitz 1991; Fogg 1986) where the aquifer sedimentsamount to 20–50% of the aquifer systems (the remainder be-ing aquitard sediments), effects of the ubiquitous aquitardbeds are approximated by regionally reducing the vertical hy-draulic conductivity (Kv) relative to the horizontal hydraulicconductivity (Kh) by several orders of magnitude in order tomatch both horizontal and vertical hydraulic gradients. Thisapproach is capable of producing good approximations ofregional flows and groundwater budget components, but tendsto smooth any local variations in recharge and vertical flow inthe sedimentary connected network (e.g., Fogg et al. 2000;Fleckenstein et al. 2006). Stochastic methods like transition-probability-based-indicator geostatistics provide opportunityfor realistically representing subsurface heterogeneity of themajor aquifer and aquitard facies while honoring measureddata (Carle and Fogg 1996; Weissmann and Fogg 1999;Weissmann et al. 1999). Results from studies implementingthese methods show strong influence of subsurface heteroge-neity on groundwater/surface-water interactions (Engdahlet al. 2010; Fleckenstein et al. 2006; Liu 2014).
A number of studies have measured infiltration and re-charge processes in porous media in field settings (e.g.,Batlle-Aguilar and Cook 2012; Bresciani et al. 2018) andlaboratory settings (e.g., Fichtner et al. 2019). Other workhas demonstrated the importance of geologic heterogeneityon infiltration processes and stream–aquifer interactions, in-cluding the often-significant contribution of focused streamleakage in arid and semi-arid areas (e.g., de Vries andSimmers 2002; Bresciani et al. 2018; Irvine et al. 2012), in-cluding the CV (Fleckenstein et al. 2006). Geologic
Hydrogeol J (2019) 27:2869–28882870

heterogeneity is also important for natural recharge processesandMAR in karst systems (Hartmann et al. 2017; Xanke et al.2017). In heterogeneous clastic sedimentary systems, even asmall fraction of permeable hydrofacies in correlated randommedia tend to be interconnected in three dimensions (Fogget al. 2000; Harter 2005), especially in the absence of spatiallypersistent geologic unconformities, providing potential re-charge pathways to semi-confined aquifer systems.Interconnected, highly permeable sand and gravel depositshave been shown to occur in select locations in the southernCV that are potentially conducive to considerably higher ratesof regional recharge thanwould be possible over the rest of thelandscape (Weissmann et al. 2004). Studies have suggestedthe presence of these features in the northern CV (Meirovitz2010; Shlemon 1967), compelling further study of MAR dy-namics in this system. Several studies have focused on syn-thesizing MAR suitability characteristics from a combinationof spatial data, including remote-sensed imagery, geologicmaps, and soil surveys to identify favorable surface site char-acteristics for MAR in CA (O’Geen et al. 2015), and else-where (Adham et al. 2010; Ghayoumian et al. 2007). Thesestudies provide a valuable initial survey of site suitability, butdo not account for deeper subsurface geologic heterogeneitythat has been shown to be important for recharge (e.g.,Weissmann et al. 2004).
This research aims to explicitly simulate variably satu-rated water-flow dynamics in a highly resolved represen-tation of complex subsurface geologic heterogeneity ofthe CV that includes both interconnected, highly perme-able sand and gravel deposits and more typical silt- andclay-dominated sediments. Additionally, the goal of thisresearch is to (1) gain insight into infiltration and rechargephenomena that are challenging to observe and have notbeen included in regional-scale groundwater models, and(2) guide MAR strategies for regions reliant ondiminishing snowpack water storage and in overdraftedgroundwater basins.
Materials and methods
Domain extent and local hydrostratigraphy
The model domain (Fig. 1) covers about 1,640 km2 of low-elevation alluvial fan topography typical of the CV, CA. Theclimate of the area is Mediterranean, with 75% of annual pre-cipitation occurring between November and March. The do-main comprises the lower portions of the American andCosumnes River watersheds on the east side of the northernCV, CA (i.e., the Sacramento Valley), where previous studieshave shown the presence of massive, interconnected highlypermeable sand and gravel deposits embedded in a matrix offine-grained sediments (Meirovitz 2010; Shlemon 1967).
Such localized stratigraphic features have been shown to bepotentially conducive to considerably higher rates of regionalrecharge than would be possible over the rest of the landscape(Weissmann et al. 2004), and likely occur throughout the CVbut are mostly still undiscovered (e.g., Weissmann et al.2005).
The hydrostratigraphy of the domain area includes theoverlapping American River and Cosumnes River alluvialfans, each of which havemarkedly different depositional char-acteristics. The northern portion of the domain is dominatedby the American River fan, which drains a large catchment(>4,000 km2) that extends to the Sierra Nevada crest—>3,000 m above mean sea level (amsl). Because of its highcatchment elevation, deposition of the American River fanwas significantly influenced by cyclic Plio-Pleistocene cli-mate variation and episodic Sierra Nevada glaciation, whichdeposited relat ively coarse-grained sediments inpaleochannels (Shlemon 1967; Ford and Chee 1974). Somedeep coarse-texture paleochannels, called incised valley fill(IVF; Weissmann et al. 2004, 2005), have been identified inthe domain area (Meirovitz 2010). Incised valley fill are theresult of a combination of interglacial river incision and sub-sequent glacially derived, dominantly coarse-grained sedi-ment deposition in an aquifer system that otherwise containsmostly horizontally stratified fine-grained deposits. Plio-Pleistocene Sierra Nevada glacial cyclicity resulted inmultipleIVF depositional events, which, in places, overlap and inter-connect within the fan sequence from land surface into thedeeper aquifer system to provide a relatively high permeabil-ity conduit for groundwater recharge that can bypass localconfining units to depths >30 m (Meirovitz 2010). Incisedvalley fill associated with recent glaciation are especially im-portant for recharge because they extend from near-surface,mainly just below the surface soil profile, downward into thesubsurface. The most recent major glacial advance affectingthe American River watershed, referred to as the Recess Peak,occurred approximately 13,000 years ago (Moore and Moring2013). Importantly, all the major rivers draining high-elevation catchments on the west side of the Sierra Nevadalikely have IVF deposits, but few have been documented: e.g.,the American River (Meirovitz 2010), Tuolumne River(Weissmann et al. 2005), and Kings River (Weissmann andFogg 1999; Weissmann et al. 2004). The southern part of thedomain is intersected by the Cosumnes River, which is the lastmajor undammed river in CA, and drains a smaller (900 km2)lower-elevation catchment, which was much less influencedby glaciation, and hence lacks a shallow IVF deposits. As aresult, the Cosumnes River fan is typically much finer in tex-ture. Recent research suggests that some American Riverpaleochannels have been shown to flow across and under-neath the current path of the Cosumnes River in theHolocene and Quaternary due to a more southwest course ofthe ancestral American River when sea level was lower,
Hydrogeol J (2019) 27:2869–2888 2871
creating complex, overlapping stratigraphy and multi-scalegeologic heterogeneity (Meirovitz 2010).
Previous studies have identified the main groundwater-bearing units within the American-Cosumnes fan as theLaguna-Riverbank complex, and Mehrten formation (Fordand Chee 1974; Fleckenstein et al. 2006). The lithology ofboth units is an assemblage of granitic sand, silt, and clay,along with gravel bodies that are each up to 100 m thick inthe domain area. Whereas the Laguna-Riverbank complex isPleistocene/Pliocene in age and mostly granitic in origin, theunderlying Mehrten formation is Miocene in age and primar-ily volcanic in origin. Studies have identified the presence oflow-permeability paleosols in portions of the domain area,which can be difficult to differentiate from fine-grained siltsand clays and can act as laterally persistent confining units,except when intersected by IVF (Niswonger and Fogg 2008).
The complex overlapping fan network and cross-cuttingIVF in the domain area results in an aquifer system that, atshallow depths, is unconfined (and sometimes perched) orsemi-confined and increasingly confined with depth(Fleckenstein et al. 2006; Liu 2014; Niswonger and Fogg2008). Groundwater pumping in the region typically occursin the deeper (>30 m depth) semi-confined/confined portionof the aquifer system (Liu 2014).
Hydrofacies model development
A transition probability Markov-chain geostatistical (TPROGS)model (Carle and Fogg 1996, 1997; Carle 1999) was used tosimulate the distribution of subsurface hydrofacies in the domainarea. Development of the facies model with TPROGS is
described in detail by Meirovitz (2010). Roughly 1,200 welllogs, soil surveys, geologic cross-sections, and mappedpaleochannels were used as conditioning data for the model.Subsurface sediments were parsed into four textural categories:gravel, sand, muddy sand, and mud (undifferentiated silt and/orclay)—Table 1 (Fleckenstein et al. 2004; Meirovitz 2010). Thekey parameters for developing the model include the proportionof each hydrofacies, the mean lengths of each hydrofacies alongthe principal directions, and the embedded transition probabilitiesto represent cross-correlation between different facies.Differences in depositional environment for the American andCosumnes River fans resulted in important differences in theseparameters for each region, requiring development of separatefacies models for the northern and southern portions of the do-main (i.e., for American and Cosumnes River fans, respectively).These models were subsequently combined to represent the se-quence stratigraphy of overlapping fans and resultant multi-scaleheterogeneity (Fig. 2). Meirovitz (2010) provides a detailed pro-cedure for developing and combining themodels. This process issummarized in section ‘Hydrofacies model development withTPROGS’.
The model uses an orthogonal grid with the x- and y-directions rotated 17.85° counterclockwise from the car-dinal directions, and with the z-direction oriented vertical-ly. A grid cell size of 200 × 200 × 1mwas chosen to reflect thehydrofacies mean lengths in the x-, y-, and z-directions, re-spectively. The total domain size is 36.2 km × 45.4 km ×265 m in the x-, y-, and z-directions, respectively (i.e.,181 × 227 × 265 cells). Cells located above the landsurface elevation are designated as inactive in the model,resulting in about 7.3 million active cells in the domain.
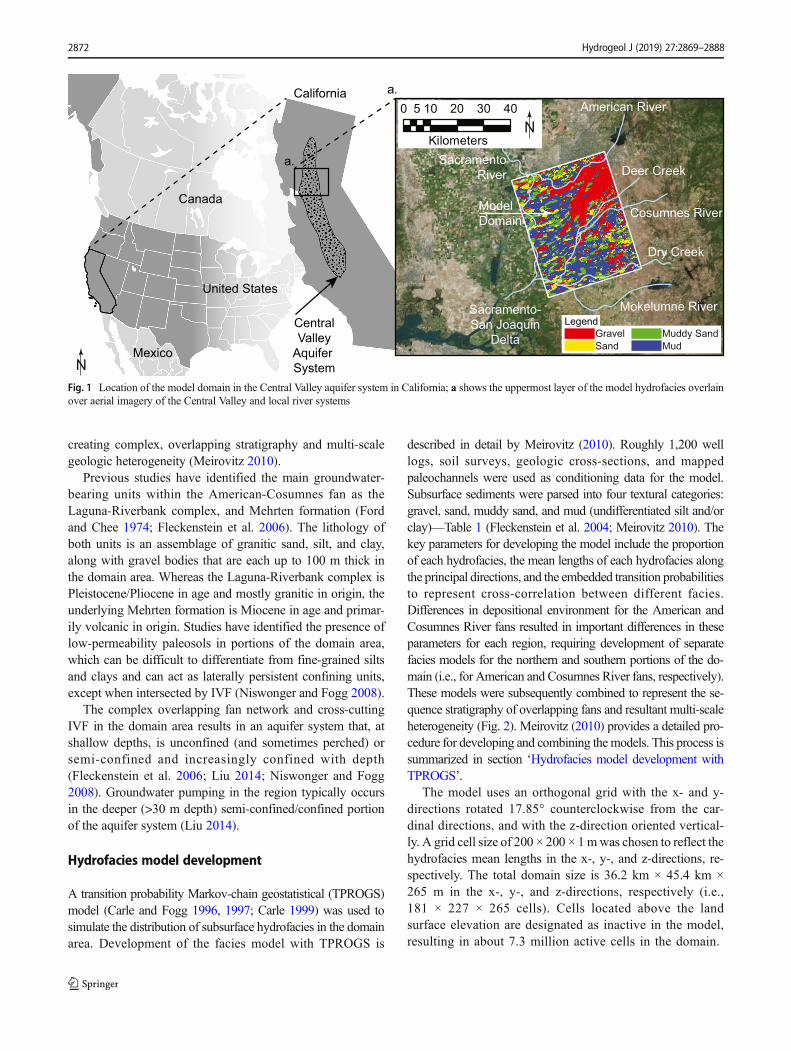
Fig. 1 Location of the model domain in the Central Valley aquifer system in California; a shows the uppermost layer of the model hydrofacies overlainover aerial imagery of the Central Valley and local river systems
California
Canada
United States
Mexico
American River
Cosumnes River
Sacramento-San Joaquin
Delta
Mokelumne River
SacramentoRiver
ModelDomain
a.
GravelSand
Muddy SandMud
CentralValley
Aquifer System
a.
Dry Creek
N
Legend
Deer Creek
0 10 20 30 405
KilometersN
Hydrogeol J (2019) 27:2869–28882872

Hydrologic model development
Governing equations
To simulate variably-saturated water flow dynamics in this high-ly heterogeneous alluvial system, a three-dimensional (3D), var-iably saturated, integrated hydrologic modeling code, ParFlow(PF), was used (Ashby and Falgout 1996; Jones and Woodward2001; Kollet andMaxwell 2006). Themodel couples surface andsubsurface flow with the two-dimensional (2D) diffusive or ki-nematic wave equation, and solves the 3D mixed form ofRichards’ equation for variably saturated subsurface flow:
SsSw ψð Þ ∂ψ∂t
þ ϕ∂Sw ψð Þ
∂t¼ ∇ � qþ qr x; zð Þ ð1Þ
where
q ¼ ϕSw ψð Þv ¼ −Ks xð Þkr ψð Þ∇ ψþ zð Þ ð2Þ
In these equations, Ss is specific storage [L−1], Sw is relative
saturation [−],ψ is pressure head [L],ϕ is porosity [−],q is Darcyflux [LT−1], qr is a source/sink term [T−1], z is elevation [L], v isthe subsurface flow velocity [L T−1], Ks(x) is the saturated hy-draulic conductivity tensor [LT−1], and kr is relative permeability[−]. The vanGenuchten relations (VanGenuchten 1980) describe
Sw and kr as a function of ψ in the unsaturated zone, with param-eters for air entry pressure α [L−1], pore size distribution n [−],and residual saturation Sres [−].
Boundary conditions
Domain boundaries were chosen with the interest of simplify-ing the assignment of boundary conditions for the flowmodel.Model boundary conditions are discussed in greater detail inLiu (2014). The eastern boundary roughly coincides with theSierra Nevada foothills, and the northern, southern, and west-ern boundaries roughly coincide with the American River,Dry Creek, and the Sacramento River, respectively (Fig. 1).A specified head boundary condition was applied for the east-ern boundary, where heads were estimated from local moni-toring well data (Liu 2014). A general head boundary condi-tion was applied to the western boundary, which roughly co-incides with the Sacramento River and Sacramento-SanJoaquin Delta along the northwestern, and southwestern por-tions of the western boundary, respectively. A general headvalue of 0 m amsl was set 1 km beyond the western boundaryto approximate these features. Because the groundwater flowdirection is generally from east to west, no-flow boundaryconditions were applied along the northern, southern, and
Site 1
Site 2
Site 3
Site 4
Site 536.2 km
45.4 km
XY
Z
30X Vertical Exaggeration
a.
b.
c.
a
b
c
2400 m2400 mDeep Aquifer
GravelSand
Muddy SandMud
N
Legend
Fig. 2 Three-dimensionalrepresentation of the modeldomain (Meirovitz 2010; Liu2014) with insets of a sites 1–3, bsite 4, and c site 5, where thesemi-transparent gray boxes out-line the locations of the rechargesites
Table 1 Textural classification ofthe major hydrofacies(Fleckenstein et al. 2004)
Hydrofacies designation Geologic interpretation Texture
Gravel Channel deposits Gravel and coarse sand
Sand Near channel/levee Sand (fine to coarse)
Muddy sand Proximal floodplain Silty and clayey sand, sandy clay, and silt
Mud Floodplain Clay, silty clay, shale
Hydrogeol J (2019) 27:2869–2888 2873

bottom boundaries. Combinations of specified-flux andspecified-head upper boundary conditions were assigned bothfor model spin-up and for the recharge simulations, and aredescribed in greater detail in subsequent sections.
Hydrofacies hydraulic properties
Hydraulic properties for each facies category (Table 2) werecalibrated manually to simulate observed well hydrographs inboth the shallow and deeper aquifer system; the calibrationprocess is described in detail in Liu (2014) and is summarizedin section ‘Hydrologic model calibration’. To simulate thedeeper aquifer system where geologic conditioning data arelimited, a separate, uniform facies designation (‘deep aquifer’;Table 2) with upscaled hydraulic properties was designated forthe lower portion of the domain (Liu 2014). The anisotropyratio (R) of verticalKs to horizontalKswas considered equal tounity (i.e., no anisotropy) for all facies except for the deepaquifer facies because it was assumed that the high-resolution juxtaposition tendencies of facies, which is pre-served by the geostatistical method, represents the true anisot-ropy of the system (Weissmann and Fogg 1999). A value ofR = 0.003 was specified for the deep aquifer facies to reflectupscaled alluvial aquifer properties calculated by model sim-ulation experiments of Liu (2014). Calibrated hydraulic prop-erties are consistent with the range of literature values for theCV, CA, and for similar alluvial systems (Anderson et al.2015; Botros et al. 2009; Fleckenstein et al. 2004; Frei et al.2009; Maserjian 1993; Niswonger and Fogg 2008; Sager2012).
Model spin-up
A 16-year simulation period reflecting water years 1970–1985 was used to bring the simulated hydrology into dy-namic equilibrium and generate a realistic water-tableconfiguration and vertical groundwater gradients withinthe domain is described in detail in Liu (2014). An initialpotentiometric surface was specified using interpolatedgroundwater level data. Monthly estimated urban and
agricultural groundwater pumping rates were applied asspecified fluxes representing wells screened in lower por-tions of the domain that coincide with typical screenedintervals of municipal and agricultural pumping wells inthe region. Dominant sources of recharge for the regioninclude stream recharge from the American River,Cosumnes River, and Deer Creek, and from deep perco-lation of agricultural and urban return flows, while re-charge from precipitation is minimal. Estimated monthlyurban and agricultural recharge volumes were applied asspecified-flux boundary condition across the top of thedomain based on groundwater model development bythe Sacramento County Groundwater Agency (RMC2011). Weekly estimates of spatially distributed riverstage for the American River, Cosumnes River, andDeer Creek were applied as specified heads along landsurface cells coincident with each of these features. Eachof these water budget components were adjusted manuallyalong with hydraulic properties as part of the model cal-ibration process and are described in detail by (Liu 2014)and summarized in section ‘Hydrologic model calibra-tion’. An additional 1-year spin-up period was simulatedin which a uniform 1 mm day−1 specified-flux boundarycondition was applied across the domain to equilibratesoil moisture conditions in the near-surface UZ cells.This additional period was necessary to facilitate modelconvergence during the initial time steps of subsequentrecharge simulations. The spin-up period was shown tobe sufficient to equilibrate soil-moisture storage accordingto qualitative metrics described by Ajami et al. (2014).
Recharge simulation experimental design
Site selection
Five 5.76 km2 recharge sites (Fig. 2), each encompassing 144upper-boundary cells, were chosen to approximate hypothet-ical MAR infiltration basins. The size of each site was chosento reflect a regional-scale MAR site. In CA alone, MAR sitesrange from individual infiltration basins over several hectares
Table 2 Hydrofaciescharacteristics and hydraulicproperties (Meirovitz 2010; Liu2014)
Hydrofaciesdesignation
Modeled
hydrofacies
fractionsa
Observed
hydrofacies
fractionsb
Ks (mday−1)
Ss (m−1) ϕ α n Sres
Gravel 0.23 0.20 67.5 4.0 × 10⁻⁵ 0.35 3.55 3.16 0.1
Sand 0.14 0.12 41.2 8.0 × 10⁻⁵ 0.35 3.55 3.16 0.1
Muddy sand 0.18 0.27 0.2 1.0 × 10⁻⁴ 0.40 2.69 2.00 0.1
Mud 0.45 0.41 0.0017 1.0 × 10⁻³ 0.45 1.62 2.00 0.2
Deep aquifer – – 45.0 4.8 × 10⁻⁴ 0.35 3.55 3.16 0.1
a Proportion of each hydrofacies within the domainb Proportion of each hydrofacies within the observed well log data
Hydrogeol J (2019) 27:2869–28882874
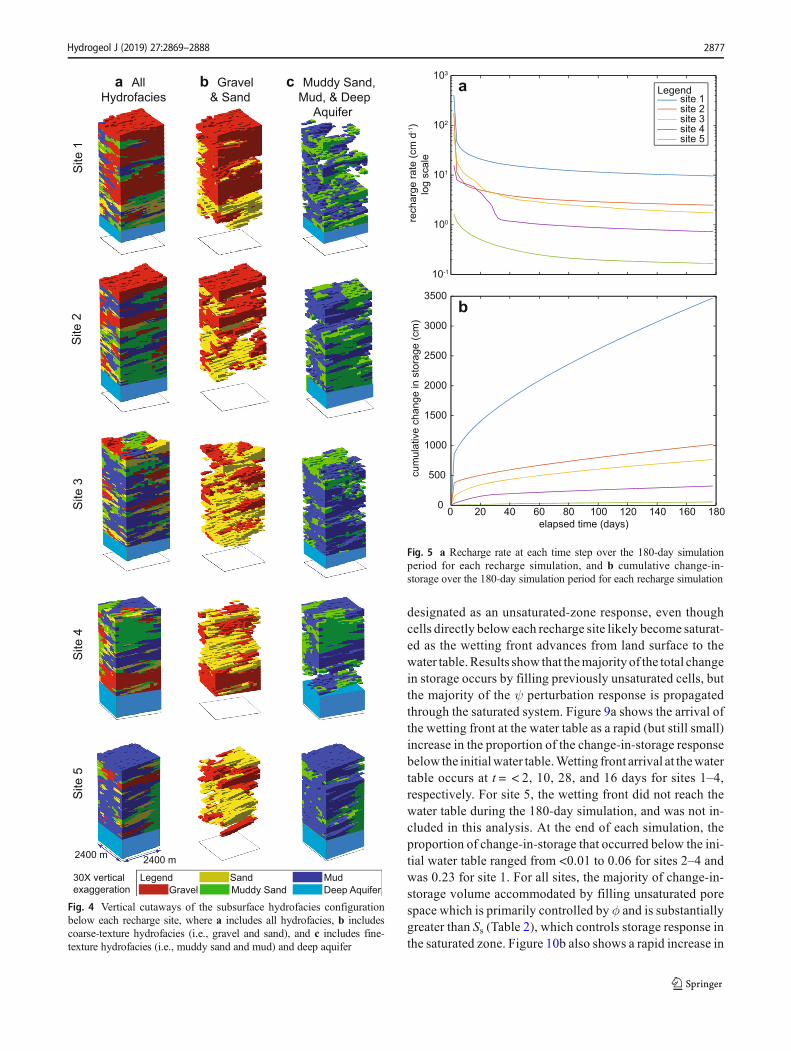
(e.g., Beganskas and Fisher 2017) to large networks of basins>25 km2 in size (e.g., Kern Water Bank Authority 2018). Sitelocations were chosen ad hoc to maximize a range of sitecharacteristics favorable for MAR, including the initialdepth-to-water, proportion of coarse-texture hydrofacies (i.e.,sand and gravel) at the land surface and in the unsaturated-zone below each site, and effective vertical Ks of UZ coarse-texture hydrofacies, as approximated by the geometric meanof Ks for vertically coincident UZ cells (Fogg et al. 2000;Table 3; Fig. 3). All sites were chosen to minimize interactionwith lateral boundary conditions. Sites 1–5 range from char-acteristically most favorable (site 1) to least favorable (site 5)for recharge. Vertical cutaways of hydrofacies distributionsare shown in Fig. 4, which illustrate the relative proportions,and local degree of interconnection of coarse-texture faciesbeneath each recharge site.
Recharge scenarios
Two sets of numerical experiments (i.e., recharge scenar-ios) were simulated for each of the five sites: (1) a 180-day recharge scenario was simulated for each site to eval-uate the system response to recharge stress over aprolonged recharge period, and (2) a 3-year simulationwas run for each site, wherein recharge was simulatedfor the initial 90 days of each year, followed by 275 dayswithout recharge to evaluate the effects of successive,ephemeral recharge stresses on system response. The 90-day recharge periods chosen for the 3-year simulationscorrespond with the January–March peak wet season forthe Cosumnes River catchment (Booth et al. 2006). Forall recharge simulations, surface ponding was approximat-ed by a specified head boundary condition representing10 cm of ponding at each recharge site, with no rechargespecified for the remaining upper-boundary cells. Finally,two additional 180-day and 3-year simulations were runin which no recharge was specified for all upper-boundary
cells, i.e., as no-recharge scenarios. Results were output at2-day and 5-day intervals for the 180-day and 3-year sim-ulations, respectively.
Model superposition and post-processing
The spatiotemporal distribution of ψ, and total subsurface wa-ter storage (TSS) from recharge stress was isolated from othermodel stimuli with a model superposition approach. At eachtime step, the spatial distribution of ψ, and TSS for the no-recharge simulation was subtracted from the distribution of ψand TSS for each recharge simulation. In this way, perturba-tions in ψ and TSS from the recharge stress are isolated fromother model stimuli at each model cell, including transientmodel response to regional boundary condition effects. Foreach recharge simulation, the pressure response of the re-charge pulse was quantified by determining the number ofmodel cells with ψ perturbations above 1-cm, 10-cm, and 1-m thresholds. To isolate system response in both saturated-and unsaturated-zones, ψ and TSS perturbation responseswere further delineated according to whether the response ina given model cell occurred above or below the initial watertable (i.e., Sw < 1 or Sw = 1 for each cell, respectively).
Results
Domain-wide pressure and recharge response
Temporal variation of recharge rates and differences in meanrecharge rates and volumes
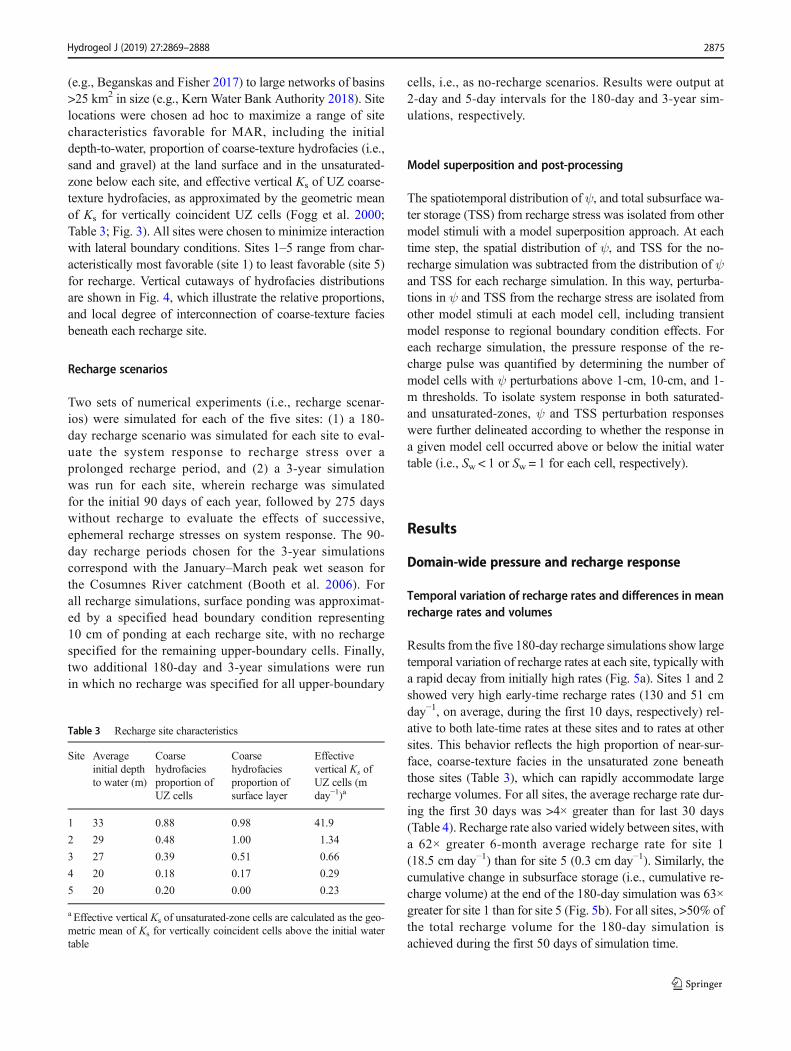
Results from the five 180-day recharge simulations show largetemporal variation of recharge rates at each site, typically witha rapid decay from initially high rates (Fig. 5a). Sites 1 and 2showed very high early-time recharge rates (130 and 51 cmday−1, on average, during the first 10 days, respectively) rel-ative to both late-time rates at these sites and to rates at othersites. This behavior reflects the high proportion of near-sur-face, coarse-texture facies in the unsaturated zone beneaththose sites (Table 3), which can rapidly accommodate largerecharge volumes. For all sites, the average recharge rate dur-ing the first 30 days was >4× greater than for last 30 days(Table 4). Recharge rate also varied widely between sites, witha 62× greater 6-month average recharge rate for site 1(18.5 cm day−1) than for site 5 (0.3 cm day−1). Similarly, thecumulative change in subsurface storage (i.e., cumulative re-charge volume) at the end of the 180-day simulation was 63×greater for site 1 than for site 5 (Fig. 5b). For all sites, >50% ofthe total recharge volume for the 180-day simulation isachieved during the first 50 days of simulation time.
Table 3 Recharge site characteristics
Site Averageinitial depthto water (m)
Coarsehydrofaciesproportion ofUZ cells
Coarsehydrofaciesproportion ofsurface layer
Effectivevertical Ks ofUZ cells (mday−1)a
1 33 0.88 0.98 41.9
2 29 0.48 1.00 1.34
3 27 0.39 0.51 0.66
4 20 0.18 0.17 0.29
5 20 0.20 0.00 0.23
a Effective vertical Ks of unsaturated-zone cells are calculated as the geo-metric mean of Ks for vertically coincident cells above the initial watertable
Hydrogeol J (2019) 27:2869–2888 2875

Pressure response at 1-cm, 10-cm, and 1-m thresholds
The pressure response of the recharge pulse was quantified bydetermining the number of cells withψ perturbations above 1-cm, 10-cm, and 1-m thresholds, at each timestep for all fivesites (Fig. 6). Results show that at the end of the 180-daysimulation, site 1 has 2.4×, 5.1×, 9.5× more cells perturbedat 1-cm, 10-cm, and 1-m thresholds, respectively, than for sites2–5 combined. Differences between site 1 and the remainingsites were less for lower (1-cm) thresholds and greater forhigher (1-m) thresholds. For site 1, >907,000 cells wereperturbed at a 1-cm threshold at the end of the 180-day sim-ulation, which is ~12% of the active domain volume. For site5, only 496 cells were perturbed at a 1-cm threshold (i.e., >3orders-of-magnitude fewer than for site 1) because propaga-tion of the recharge pulse did not extend beyond the upper-most several meters of unsaturated facies during the 180-daysimulation window. This response reflects the fact that theuppermost surface layer of site 5 is comprised entirely ofmud facies, which impede recharge.
Pressure propagation distances
Figure 7a shows the maximum distance of ψ perturbation at a1-cm threshold from the center of each recharge site for eachtimestep. Results show the maximum distance of ψ perturba-tion propagation is >4 km at the end of the 180-day simulationfor sites 1–4, and > 10 km for site 1. For all sites, half of themaximum distance at 1-cm threshold was achieved during thefirst 40 days. Figure 7b shows the spatial distribution of ψperturbation propagation for each site at 1-cm, 10-cm, and 1-m thresholds in plan view.
Influence of geologic heterogeneity on domain-wideresponse
Visualizations of the ψ perturbation response of each rechargepulse throughout the domain after 180 days are shown inFig. 8. The relatively large area of influence of ψ perturbationresponse for site 1 (Fig. 8a) reflects the large proportion of UZcoarse texture facies (0.88) and the relatively greater averageeffective vertical Ks for UZ facies (42.2 m day−1) compared toother sites (Table 3). The complex, non-uniform ψ perturba-tion response at each site reflects the influence of subsurfacehydrofacies heterogeneity on recharge pulse propagation. Forexample, Fig. 8f highlights the influence of a ‘choke point’ atsite 2, wherein the recharge pathway is reduced to a narrownetwork of interconnected high-K facies at ~10-m depth, de-spite the upper-most surface layers being comprised entirelyof gravel. Minimal propagation ofψ perturbation observed forsite 5 (Fig. 8g) reflects the absence of any coarse-texture faciesat land surface (Table 3), which impedes infiltration, and con-fines the response to the uppermost several meters of near-surface facies.
Unsaturated- vs. saturated-zone behavior
Pressure response and change-in-storage above andbelow the initial water table
Further analysis of the recharge response included parsingthe ψ and TSS perturbations according to whether the re-sponse occurred in the unsaturated zone or in saturated zone.This designation was delineated by the initial water-tableconfiguration at t = 0 of the simulation. For example, a re-sponse in any cells above the initial water table was
Fig. 3 a Simulated initial depth-to-water, along with red boxesrepresenting recharge site locations, b vertical saturated hydraulicconductivity (Ks) of surface facies, and c geometric mean of vertical
Ks for unsaturated zone (UZ) facies (i.e., in cells above the initial watertable) along with red dots showing locations of well conditioning data
0-5
5-10
10-15
15-20
20-25
25-30
30-40
40-50
50-60
60-70
>70
a
0.003
0.01
0.03
0.1
0.3
1.0
3.2
10
31.667.5
0.001
45.4
km
36.2 km50 100 150
20
80
140
200
model column
b c
Initi
al d
epth
-to-w
ater
(m)
mod
el ro
w
Ks (
m d
-1)
site 1site 2
site 3site 4
site 5
Hydrogeol J (2019) 27:2869–28882876
designated as an unsaturated-zone response, even thoughcells directly below each recharge site likely become saturat-ed as the wetting front advances from land surface to thewater table.Results show that themajority of the total changein storage occurs by filling previously unsaturated cells, butthe majority of the ψ perturbation response is propagatedthrough the saturated system. Figure 9a shows the arrival ofthe wetting front at the water table as a rapid (but still small)increase in the proportion of the change-in-storage responsebelow the initialwater table.Wetting front arrival at thewatertable occurs at t = < 2, 10, 28, and 16 days for sites 1–4,respectively. For site 5, the wetting front did not reach thewater table during the 180-day simulation, and was not in-cluded in this analysis. At the end of each simulation, theproportion of change-in-storage that occurred below the ini-tial water table ranged from <0.01 to 0.06 for sites 2–4 andwas 0.23 for site 1. For all sites, the majority of change-in-storage volume accommodated by filling unsaturated porespace which is primarily controlled by ϕ and is substantiallygreater than Ss (Table 2), which controls storage response inthe saturated zone. Figure 10b also shows a rapid increase in
Fig. 4 Vertical cutaways of the subsurface hydrofacies configurationbelow each recharge site, where a includes all hydrofacies, b includescoarse-texture hydrofacies (i.e., gravel and sand), and c includes fine-texture hydrofacies (i.e., muddy sand and mud) and deep aquifer
Fig. 5 a Recharge rate at each time step over the 180-day simulationperiod for each recharge simulation, and b cumulative change-in-storage over the 180-day simulation period for each recharge simulation
Site
3Si
te 4
Site
5
2400 m2400 m
30X verticalexaggeration Muddy Sand
MudSandGravel
Site
1Si
te 2
a All Hydrofacies
b Gravel & Sand
c Muddy Sand, Mud, & Deep
Aquifer
Deep AquiferLegend
0 20 40 60 80 100 120 140 160 1800
500
1000
1500
2000
2500
3000
3500
elapsed time (days)
cum
ulat
ive
chan
ge in
sto
rage
(cm
)
10-1
100
101
102
103
rech
arge
rate
(cm
d-1)
log
scal
e
a
b
site 1site 2site 3site 4site 5
Legend
Hydrogeol J (2019) 27:2869–2888 2877

the proportion ψ perturbation that occurred below the initialwater table upon the arrival of the wetting front at the watertable. Unlike change-in-storage, however, the proportion oftheψ perturbation response occurring below the initial watertable was >0.90 for sites 1–4 at the end of each 180-daysimulation. Results show that while the majority of rechargevolume is accommodated by filling partially-saturated porevolume, the majority of the ψ perturbation response occursby propagating through the semi-confined (and saturated)aquifer system.
Fines vs. coarse behavior
By hydrofacies
Recharge response for each 180-day simulation was parsedaccording to whether change-in-storage was accommodatedby coarse-texture (i.e., gravel, sand) or fine-texture (i.e., mud-dy sand, mud) facies. Figure 10 shows the proportion of thechange-in-storage accommodated by fine-texture facies foreach simulation, both cumulatively over the 180-day simula-tion (Fig. 10a) and during each 2-day time step (Fig. 10b).Results show that the cumulative change in storage accommo-dated by fine-texture facies at the end of the 180-day simula-tion was >0.35 for all sites, and >0.50 for sites 3–5.Interestingly, the change-in-storage accommodated by fine-texture facies at each time step for all sites was >0.50 after
t = 90 days. Results show that fine-texture facies accommo-date a substantial portion of the recharge volume, especiallyduring late-time, even for coarse-dominated sites (i.e., sites 1–2). These findings demonstrate that while fine-texture faciesmay not facilitate widespread or rapid transmission of watervolume or pressure response, these facies do in fact contributesubstantially to the overall aquifer storage due to the relativelygreater ϕ and Ss for fine-texture facies than for coarse-texturefacies (Table 2). Results suggest that these results are mini-mally influenced by parameter choice (see section ‘Parametersensitivity on storage accommodated by fine-texture facies’).These findings are consistent with other research that hasshown that simplified aquifer-system conceptualizationswhich treat fine-texture facies or confining units asnoncontributing to overall aquifer storage are often inadequate(Konikow and Neuzil 2007).
Multi-year simulations
Domain-wide recharge rates and volumes
Recharge rate and cumulative change-in-storage during each90-day recharge period in the 3-year simulation were com-pared (Fig. 11a,b, respectively). Results show nearly 2× great-er average recharge rate during the 1st 90-day recharge period(year 1) as compared to the 3rd 90-day recharge period(year 3; Table 5). Results show the cumulative recharge
Fig. 6 Cumulative number of model cells over a 1-cm, b 10-cm, and c 1-m pressure head (ψ) perturbation thresholds for each 180-day simulation. Site 5not shown due to minimal ψ perturbation
Table 4 Average recharge rate forsites 1–5 during each 180-daysimulation
Average recharge rate (cm day−1)
Month 1 Month 2 Month 3 Month 4 Month 5 Month 6 Months 1–6
Site 1 53.1 12 11.1 10.6 10.2 9.9 18.5
Site 2 18.4 3.0 2.8 2.7 2.6 2.5 5.4
Site 3 13 2.4 2.2 2.0 1.9 1.8 4.0
Site 4 6.0 0.9 0.8 0.8 0.8 0.7 1.7
Site 5 0.7 0.2 0.2 0.2 0.2 0.2 0.3
0 20 40 60 80 100 120 140 160 180elapsed time (days)
0 20 40 60 80 100 120 140 160 180012345678
x 105
0 20 40 60 80 100 120 140 160 180
x 105
cum
ulat
ive
num
ber o
f cel
ls p
ertu
rbed a 1-cm threshold b 10-cm threshold
0
2.5
3 x 10⁵
c 1-m threshold
site 1site 2site 3site 4
0.5
1
1.5
2
910
0123456789
10
Legend
Hydrogeol J (2019) 27:2869–28882878

volume for site 1 is 3.4× greater than for the next largest (site2) and 74× larger than for the smallest (site 5). The 90-daycumulative recharge volume for each 90-day recharge periodsimilarly showed an average 2× greater volume during year 1than during year 3 (Fig. 11a). This response reflects bothgroundwater mounding (i.e., local increases in groundwaterlevels) and increases in Sw in UZ cells below each rechargesite after successive recharge periods, which reduce theunsaturated-zone pore volume that can be filled during subse-quent recharge periods. Additionally, results were parsed ac-cording to whether the change-in-storage occurred in coarse-
or fine-texture facies (Fig. 11c). For sites 1–2, results showmost recharge volume is accommodated by coarse-texturefacies during the initial 90-day recharge period, after whichthe volume decreases as infiltrated water is then slowlyaccommodated by fine-texture facies during the recoveryperiod. This behavior is repeated for subsequent rechargeperiods, but the relative contribution of fine texture faciesincreases steadily with time. For all sites, the contributionof fine-texture facies to the cumulative recharge volumeexceeds that for coarse-texture facies at the end of each3-year simulation.
Fig. 8 Three-dimensional pressure head (ψ) perturbation snapshots forsites 1–5 (a–g) at the end of each 180-day simulation, where opaque colorcutaways represent pressure perturbation above 1-mm threshold and
semi-transparent cutaways represent domain geology. Cutaways are ori-ented at the center of each recharge site
Fig. 7 a Maximum distance of pressure head (ψ) perturbation from thecenter of recharge sites 1–4 at 1-cm threshold for each 180-day simula-tion. Site 5 not shown due to minimal ψ propagation. b Pressure head (ψ)perturbation snapshots (plan view) for sites 1–5 at the end of each 180-
day simulation. Orange, red, and dark-blue outlines are the maximumlateral extent of ψ perturbation at 1-cm, 10-cm, and 1-m thresholds, re-spectively. Square black boxes represent the lateral extent of the rechargesite for each simulation
Site 1 Site 2
Site 3 Site 4 Site 5
36.2 km
1-m10-cm1-cm threshold
50 100 15020
80
140
200
45.4 km
model column
mod
el ro
w
20 40 60 80 100 120 140 160 180elapsed time (days)
max
imum
dis
tanc
e (m
) of p
ress
ure
pertu
rbat
ion
from
Site
cen
ter a
t 1-c
m th
resh
old
12,000
10,000
8000
6000
4000
2000
0
site 1site 2site 3site 4
a b
Legend
40 m10
1
0.1
0.01
0.001
a Site 1 b Site 2 c Site 3
d Site 4 e Site 5
g Site 5 inset
f Site 2 inset
g.
f.
Legend
36.2 km
45.4 km
30X vertical exaggeration
Hydrogeol J (2019) 27:2869–2888 2879

Proportion split between coarse and fine hydrofacies
The proportion of recharge volume accommodated by fine-texture facies for each site during the 3-year simulation is shownin Fig. 12. Results for sites 1–3 show similar behavior, whereinthe proportion of recharge volume in fine-texture facies generallyincreases with time, except during the second and third 90-dayrecharge periods (i.e., during years 2 and 3, respectively), duringwhich time the proportion decreases due to rapid recharge intocoarse-texture facies. In general, the proportion of recharge vol-ume accommodated by fine-texture facies increases more rapidlyduring nonrecharge periods. For sites 1–3, each recharge inunda-tion is initially accommodated by filling partially saturated,coarse-texture facies, which creates a large vertical pressure stressthat is then transmitted rapidly through interconnected networksof coarse-texture facies into the saturated zone. Subsequently, thepressurization of the interconnected network of coarse-texturefacies then ‘bleeds into’ adjacent fine-texture facies. For sites4–5, which are dominated by locally high proportions of fine-texture facies, the proportion of recharge volume accommodatedby fine-texture facies generally decreases with time, reflecting
spreading and interception of recharge by adjacent coarse facies.For all sites, the proportion accommodated by fines exceeds 0.50between years 2 and 3. These results suggest that fine-texturefacies are the largest subsurface reservoir for this system, evenfor recharge areas with coarse-dominated interconnected alluvialaquifers. However, muchmore time is required to add or removewater from this reservoir than for coarse-texture aquifer systems,which can be readily pumped and/or recharged over muchshorter timescales.
Pressure propagation distances
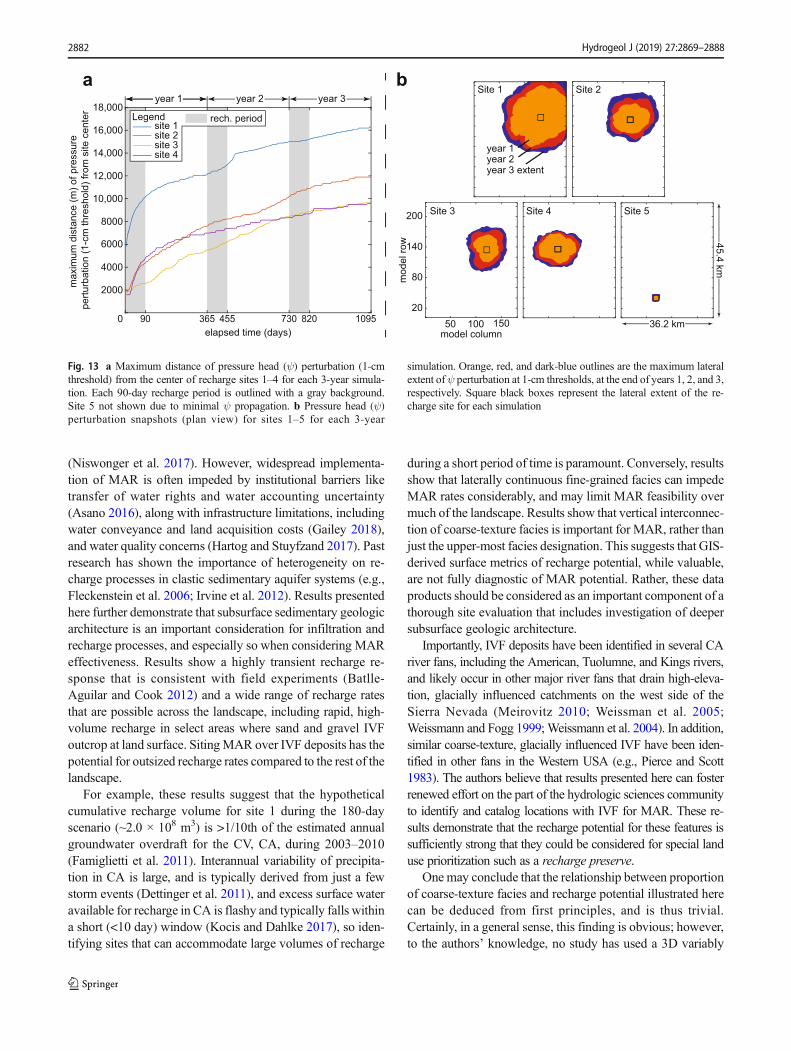
Figure 13a shows that the maximum distance of ψ pertur-bation at a 1-cm threshold from the center of each rechargesite for each time step. Results show that the maximumdistance of ψ perturbation propagation is >9 km at theend of the 3-year simulation for sites 1–4, and >16 kmfor site 1. For all sites, half of the maximum distance wasachieved during the first year. For site 1, this distance wasachieved within the first 90 days. Figure 13b shows the
Fig. 10 a Cumulative proportion of change-in-storage accommodated byfine-texture hydrofacies (i.e., muddy sand and mud), and b proportion ofchange-in-storage accommodated by fine-texture hydrofacies for eachtime step, for each 180-day simulation. Site 5 not shown due to minimalpropagation of the recharge pulse
Fig. 9 Cumulative proportion of a change-in-storage, and b pressurehead (ψ) perturbation below the initial water table for each 180-day sim-ulation. Site 5 not shown because recharge pulse never reached the watertable
10-4
10-3
10-2
10-1
100
elbat retaw l aiti ni
wol eb det adom
mocca
0 20 40 60 80 100 120 140 160 1800
0.1
0.2
0.3
0.4
0.5
0.6
0.7
0.8
0.9
1
cum
ulat
ive
prop
ortio
n
acco
mm
odat
ed b
elow
initi
al w
ater
tabl
e b
a
Legend
0 20 40 60 80 100 120 140 160 1800
0.1
0.2
0.3
0.4
0.5
0.6
0.7
0.8
0.9
1
elapsed time (days)
acco
mm
odat
ed b
y fin
e hy
drof
acie
s fo
r eac
h tim
este
p
0
0.1
0.2
0.3
0.4
0.5
0.6
0.7
0.8
0.9
1
cum
ulat
ive
prop
ortio
n of
cha
nge
inst
orag
eac
com
mod
ated
by
fine
hydr
ofac
ies
a
b
site 1site 2site 3site 4
Legend
Hydrogeol J (2019) 27:2869–28882880

maximum lateral extent of ψ perturbation propagation at a1-cm threshold at the end of years 1, 2, and 3.
Discussion
Increasing water scarcity has accelerated overdraft of ground-water resources in CA (Scanlon et al. 2012) and globally(Wada et al. 2011) and has created newfound interest in
replenishing overdrafted aquifer systems with MAR. Studieshave shown that thoughtful implementation ofMAR practicescan increase sustainability of groundwater resources
Fig. 11 a Recharge rate for each 90-day recharge period in each 3-yearsimulation, b cumulative change-in-storage for all facies for each 90-dayrecharge period in each 3-year simulation, and c cumulative change-in-
storage in coarse, fine, and all facies for each 3-year recharge simulation,where each 90-day recharge period is outlined with a gray background
Fig. 12 Cumulative proportion of change-in-storage that is accommodat-ed by fine hydrofacies (i.e., muddy sand and mud) during the 3-yearsimulation period for each recharge simulation. Each 90-day rechargeperiod is outlined with a gray background
Table 5 Average recharge rates for sites 1–5 during each 3-yearsimulation
Site Average recharge rate (cm day−1) for each 90-day recharge period
Year 1 Year 2 Year 3
1 26.2 19.1 17.0
2 8.1 5.4 4.6
3 6.1 3.4 2.6
4 2.6 1.4 1.3
5 0.4 0.2 0.2
0 30 60 90 0 30 60 90 0 30 60 90 0 30 60 90 0 30 60
rech
arge
rate
(cm
d-1)
durin
g ea
ch re
char
ge p
erio
dlo
g sc
ale
elapsed time (days)
10-1
100
101
102
103
10-1
100
101
102
10-1
100
101
102
10-1
100
101
102
10-1
100
101
year 1year 2year 3
Legend
cum
ulat
ive
chan
ge in
sto
rage
(cm
)du
ring
each
rech
arge
per
iod
30 60 90 30 60 90 30 60 90 30 60 90 30 60 90
1000
1500
2000
2500
500
0
400
600
800
1000
200
0
400
600
800
1000
200
0
100
200
250
300
50
0
20
30
40
50
10
0
102030405060708090100
Site 5
50100150200250300350400450500
Site 4
200400600800100012001400160018002000
Site 3
200400600800100012001400160018002000
Site 2
0 365 730 1095
1000
2000
3000
4000
5000
6000
Site 1cu
mul
ativ
e ch
ange
in s
tora
ge(c
m) d
urin
g 3-
yr s
imul
atio
n
0 365 730 10950 365 730 1095 0 365 730 1095 0 365 730 1095 0 365 730 1095
all facies coarse facies fine facies 90-day recharge periodLegend
90
year 1 year 2 year 3
a
b
c
00
0.1
0.2
0.3
0.4
0.5
0.6
0.7
0.8
0.9
1
elapsed time (days)
cum
ulat
ive
prop
ortio
n of
cha
nge
inst
orag
eac
com
mod
ated
by
fine
hydr
ofac
ies
90 365 455 730 820 1095
site 1site 2site 3site 4site 5
periodrech.
Legend
site 5year 1year 1 year 2 year 3
Hydrogeol J (2019) 27:2869–2888 2881
(Niswonger et al. 2017). However, widespread implementa-tion of MAR is often impeded by institutional barriers liketransfer of water rights and water accounting uncertainty(Asano 2016), along with infrastructure limitations, includingwater conveyance and land acquisition costs (Gailey 2018),and water quality concerns (Hartog and Stuyfzand 2017). Pastresearch has shown the importance of heterogeneity on re-charge processes in clastic sedimentary aquifer systems (e.g.,Fleckenstein et al. 2006; Irvine et al. 2012). Results presentedhere further demonstrate that subsurface sedimentary geologicarchitecture is an important consideration for infiltration andrecharge processes, and especially so when considering MAReffectiveness. Results show a highly transient recharge re-sponse that is consistent with field experiments (Batlle-Aguilar and Cook 2012) and a wide range of recharge ratesthat are possible across the landscape, including rapid, high-volume recharge in select areas where sand and gravel IVFoutcrop at land surface. SitingMAR over IVF deposits has thepotential for outsized recharge rates compared to the rest of thelandscape.
For example, these results suggest that the hypotheticalcumulative recharge volume for site 1 during the 180-dayscenario (~2.0 × 10⁸ m3) is >1/10th of the estimated annualgroundwater overdraft for the CV, CA, during 2003–2010(Famiglietti et al. 2011). Interannual variability of precipita-tion in CA is large, and is typically derived from just a fewstorm events (Dettinger et al. 2011), and excess surface wateravailable for recharge in CA is flashy and typically falls withina short (<10 day) window (Kocis and Dahlke 2017), so iden-tifying sites that can accommodate large volumes of recharge
during a short period of time is paramount. Conversely, resultsshow that laterally continuous fine-grained facies can impedeMAR rates considerably, and may limit MAR feasibility overmuch of the landscape. Results show that vertical interconnec-tion of coarse-texture facies is important for MAR, rather thanjust the upper-most facies designation. This suggests that GIS-derived surface metrics of recharge potential, while valuable,are not fully diagnostic of MAR potential. Rather, these dataproducts should be considered as an important component of athorough site evaluation that includes investigation of deepersubsurface geologic architecture.
Importantly, IVF deposits have been identified in several CAriver fans, including the American, Tuolumne, and Kings rivers,and likely occur in other major river fans that drain high-eleva-tion, glacially influenced catchments on the west side of theSierra Nevada (Meirovitz 2010; Weissman et al. 2005;Weissmann and Fogg 1999;Weissmann et al. 2004). In addition,similar coarse-texture, glacially influenced IVF have been iden-tified in other fans in the Western USA (e.g., Pierce and Scott1983). The authors believe that results presented here can fosterrenewed effort on the part of the hydrologic sciences communityto identify and catalog locations with IVF for MAR. These re-sults demonstrate that the recharge potential for these features issufficiently strong that they could be considered for special landuse prioritization such as a recharge preserve.
One may conclude that the relationship between proportionof coarse-texture facies and recharge potential illustrated herecan be deduced from first principles, and is thus trivial.Certainly, in a general sense, this finding is obvious; however,to the authors’ knowledge, no study has used a 3D variably
Fig. 13 a Maximum distance of pressure head (ψ) perturbation (1-cmthreshold) from the center of recharge sites 1–4 for each 3-year simula-tion. Each 90-day recharge period is outlined with a gray background.Site 5 not shown due to minimal ψ propagation. b Pressure head (ψ)perturbation snapshots (plan view) for sites 1–5 for each 3-year
simulation. Orange, red, and dark-blue outlines are the maximum lateralextent ofψ perturbation at 1-cm thresholds, at the end of years 1, 2, and 3,respectively. Square black boxes represent the lateral extent of the re-charge site for each simulation
Site 1 Site 2
Site 3 Site 4 Site 5
36.2 km50 100 15020
80
140
200
45.4 km
model column
mod
el ro
w
year 1year 2year 3 extent
90 365 455 730 820 10950
2000
4000
6000
8000
10,000
12,000
14,000
16,000
18,000
max
imum
dis
tanc
e (m
) of p
ress
ure
pertu
rbat
ion
(1-c
m th
resh
old)
from
site
cen
ter
elapsed time (days)
site 1site 2site 3site 4
rech. period
year 1year 1 year 2 year 3a b
Legend
Hydrogeol J (2019) 27:2869–28882882

saturated water flow code to explicitly simulate MAR dynam-ics through a highly heterogeneous domain. This approachcouples a detailed representation of subsurface geology withphysically realistic water flow physics to elucidate importantprocesses that can (1) help improve representation of rechargeprocesses in coarse-resolution, management-focused ground-water models, (2) help prioritize site investigation and datacollection for proposed MAR projects, and (3) inform man-agement entities to the potential impacts of MAR.
Results illustrate an important dichotomy between changein storage and pressure response in the aquifer system. Indeed,results show that a pressure response can be registered in wellsscreened in the semi-confined aquifer system several kilome-ters from the origin of the recharge stress. Of course, the in-crease in pressure is not related to physical water from therecharge site entering that well, and these results illustrate thisimportant concept, which can be a challenging to convey tolaypersons, and has important implications for water rightsand water management. For example, recently-passed ground-water management legislation in CA requires the creation oflocal groundwater sustainability agencies (GSAs) to limit boththe “chronic lowering of groundwater levels” and “significantand unreasonable reductions in groundwater storage”(Kiparsky et al. 2016). Results presented here demonstratethat MAR can help mitigate both of these impacts. While thebenefit of physical change in storage occurs locally, the in-crease in groundwater heads can be regionally beneficial, po-tentially benefitting adjacent jurisdictions outside of the im-mediate GSA.
These results also suggest that while networks of intercon-nected coarse-texture facies provide a conduit for rapid infil-tration and widespread pressure response, the fine-texture fa-cies accommodate a substantial fraction of the total rechargevolume. This finding is consistent with other work showingthe importance of fine-texture facies storage in aquifer sys-tems (e.g., Konikow and Neuzil 2007), and challenges com-mon aquifer-system conceptual frameworks, wherein fine-texture facies are often considered a non or minimally contrib-uting component of the aquifer system. These findings sug-gest that fine-texture facies may in fact be the largest reservoirin this alluvial aquifer system. Preliminary sensitivity analysesindicate this response is fairly robust to parameter uncertainty(see section ‘Parameter sensitivity on storage accommodatedby fine-texture facies’). Importantly, these findings supportconceptual models of groundwater flow and storage in alluvialaquifer systems that include fine-texture facies as an importantstorage reservoir (e.g., Konikow andNeuzil 2007). In essence,the connected network of coarse-texture facies provide forrelatively fast flow and recharge phenomena, while the fine-texture facies end up accommodating most of the changes instorage but on longer time scales. The storage depletion andreplenishment can be viewed as a two-stage process, in whichrapid declines in storage occur in the coarse-texture aquifer
network followed by slow drainage (leakage) from the fines.Conversely, during storage augmentation, the immediate in-creases occur in the aquifer network on time scales of days tomonths, followed by much slower but pervasive increases instorage in the fine-texture facies on time scales of months toyears. From a whole-watershed perspective, one can deducefine-texture facies to be the largest (but least accessible) res-ervoir within this system, followed by coarse-texture facies,and finally surface-water reservoirs, which are the most read-ily accessible and replenishable. In general, these results aresomewhat reminiscent of the leaky aquifer analytical modeldevelopment byNeuman andWitherspoon (1972), who point-ed out an investigation bias toward the hydrology of aquifersand suggested that future work should focus on the aquifer-aquitard complexes that compose aquifer systems.
The authors acknowledge some limitations to theapproach—for example, the TPROGS technique for de-veloping the geologic domain is informed by ampleconditioning data; however, the approach is inherentlystochastic, which can limit the robustness of facies pre-diction in areas of the domain with sparse conditioningdata. In addition, only a single TPROGS realization wasused for these simulations, and the authors acknowledgethat a more rigorous ensemble approach could providegreater insight into potential facies distributions withinthe domain. In addition, the model spin-up included adomain-wide 1 mm day−1 recharge flux during the finalyear to facilitate model convergence for subsequentMAR simulations. This boundary condition may be un-realistic with respect to recharge rates reported for thissemi-arid area (25–275 mm year−1; Fleckenstein et al.2006) and may contribute to some overestimation ofantecedent soil-moisture conditions in the uppermostmodel cells and influence recharge rates for subsequentMAR simulations. Importantly, this study should not betreated as a thorough site investigation for MAR in thisregion. Rather, the authors present these findings as aproof-of-concept to demonstrate the influence of geolog-ic heterogeneity on MAR dynamics in a hypotheticalbut physically realistic domain. Moreover, the simula-tions presented here do not consider several surface pro-cesses that influence real-world MAR feasibility anddynamics, including topographic site limitations, evapo-rative losses, and clogging effects (Bouwer 2002). Inaddition, the authors acknowledge that a more detailedinvestigation of the role of geologic heterogeneity on Kupscaling and a rigorous uncertainty or sensitivity anal-yses of hydraulic properties would permit broader inter-pretation of these findings, and thus warrants furtherstudy. Despite these limitations, these findings have im-plications for understanding MAR dynamics and forassessing MAR feasibility in clastic alluvial groundwa-ter basins in CA and globally.
Hydrogeol J (2019) 27:2869–2888 2883

Conclusions
This research explores variably-saturated water flow dy-namics in a highly heterogeneous geologic domain thatreflects the complex alluvial geologic architecture on theeast side of the Northern Central Valley, CA. The re-search objectives are to inform MAR implementation inCA and elsewhere by (1) highlighting the role of sub-surface geology for recharge dynamics and (2) identify-ing important recharge phenomena that are not easilyobserved or simulated by typically coarse-resolution re-gional groundwater models. The approach uses the var-iably saturated water-flow code, ParFlow, to simulaterecharge over a range of configurations of unconsolidat-ed alluvial geology, including over sand and gravel IVFdeposits that interconnect from land surface to thedeeper semi-confined aquifer system. Two sets of re-charge scenarios were simulated at five sites to evaluatesystem response to both prolonged, and shorter succes-sive recharge stress.
Results show a large (nearly 2 order-of-magnitude) rangeof cumulative recharge volumes between sites that is depen-dent primarily on the configuration of subsurface geologicfacies. Recharge rates were highly variable in time, with allsites showing relatively high initial rates (e.g., >100and >50 cm day−1 during the first 10 days of simulation timefor sites 1 and 2, respectively) followed by rapid decay to aquasi-constant recharge rate. Results demonstrate that theoverall subsurface geologic architecture, rather than just theupper-most soils or facies designation, is important for re-charge. All sites showed >4× reduction in average rechargerates for the last 30 days compared to the first 30 days of the180-day simulation, and a ~2× reduction in cumulative re-charge for year 3 compared to year 1 for the multi-year sim-ulations. This behavior reflects the effect of groundwatermounding that limits rapid filling of coarse-texture UZ facies.
Results suggest that the majority of recharge volume isaccommodated by filling unsaturated-zone facies, but wherethere is sufficient hydraulic communication between land sur-face and the deeper aquifer system, the majority of the pres-sure response is propagated through the saturated aquifer sys-tem once the recharge wetting front intersects the water table.Results show that if there is sufficient hydraulic connectionbetween the recharge site and the semi-confined aquifer sys-tem, the recharge pressure response can be widespread andrapid, propagating over several kilometers over a period ofdays or weeks. These results provide a valuable illustrationof two physically distinct benefits of recharge: (1) local in-creases in groundwater storage and (2) the possibility of amore widespread re-pressurization effect in the regional aqui-fer system. The distinction between these responses has im-portant implications for water rights, groundwater manage-ment regulations, and other water-policy issues.
Results also suggest that while the majority of water vol-ume and pressure response is transmitted through coarse-texture facies, the majority of the recharge volume is eventu-ally stored in fine-texture facies, even for sites that havedisproportionally large fractions of coarse-texture facies.This result suggests that fine-texture facies are the largest,albeit least accessible, reservoir for recharge in this system.This finding has important implications for aquifer conceptu-alization, because fine-texture facies are often considered asaquitards (or aquicludes) that do not appreciably participate aspart of the overall aquifer system.
Acknowledgements The authors gratefully thank Yunjie Liu, KatherineMarkovich, Lauren Foster, Lauren Thatch, Mary Michael Forester, NickEngdahl, and Dick Valent for modeling assistance, along with ThomasHarter, Laura Foglia, and anonymous reviewers for helpful comments onthe manuscript. The authors would like to acknowledge high-performance computing support from Cheyenne (https://doi.org/10.5065/D6RX99HX) provided by NCAR’s Computational andInformation Systems Laboratory, sponsored by NSF. All data used inthe analysis can be made available by SM ([email protected]).
Funding information Support for this research was provided by theNational Science Foundation (NSF) Climate Change, Water, andSociety (CCWAS) Integrated Graduate Education and ResearchTraineeship (IGERT) program at the University of California, Davisand Colorado School of Mines (http://ccwas.ucdavis.edu, DGE-10693333) (SM, GF, RM), the NSF Graduate Research Fellowship(SM), the University of California Water (UC Water) Security andSustainability Research Initiative (SM, GF).
Appendix
Hydrofacies model development with TPROGS
A combination of hard and soft data (Carle et al. 2006)from roughly 1,200 well logs, soil surveys, geologic cross-sections and mapped paleochannels were used as condi-tioning data for the TPROGS model (Meirovitz 2010). Asdescribed by Carle et al. (2006), ‘hardness’ is a probabi-listic description of the degree of certainty of the data. Ahardness value equal to unity describes certain (but likelyless abundant) data, whereas lesser degrees of hardnessreflect greater data uncertainty. As described byMeirovitz (2010), hardness values were assigned usingsubjective judgment of the accuracy of the data—for ex-ample, when assessing well-log data, higher hardnessvalues (0.7–0.8) were assigned to water-bearing sand andgravel than to muddy sand and mud (0.5) because it canreasonably be expected that drillers log coarse-texture,water-bearing facies more accurately than fine-texture fa-cies. Well logs provided ample data to estimate verticalmean lengths and transition probabilities, but inherentlysparse data in the lateral directions required greater reli-ance on other sources (e.g., soil maps, inferred geologic
Hydrogeol J (2019) 27:2869–28882884

cross sections) to calculate lateral mean lengths and tran-sition probabilities. Ten statistically similar domain realiza-tions were generated by Meirovitz (2010). Only small var-iations in volumetric proportions and regional connectivityof facies were noted between realizations. For these rea-sons, and because of the significant time and computation-al resources required for model spin-up, as described insection ‘Model spin-up’, a single realization was chosenfor the recharge simulations described herein (Fig. 2).
Hydrologic model calibration
The calibration effort by Liu (2014) was aimed at constrainingmodel uncertainty and avoiding equifinality of parameter sets.In summary, estimates of water budget terms and aquifer prop-erties were first gathered from previous studies (e.g., RMC2011; Sager 2012) and used as preliminary model parametervalues. Select parameters were adjusted manually within ex-pected ranges to match transient groundwater-level observa-tions within the domain area. Because coarse-texture aquiferproperties were considered relatively well constrained byaquifer test data (RMC 2011), particular effort was made toestimate fine-texture facies Ks by adjusting these values tomatch transient groundwater-level observations in the semi-confined and confined portions of the aquifer system wherelarge, seasonal fluctuations in heads are very sensitive toKs ofthe fine-texture aquitard facies. Aquifer system configurationwas considered adequately constrained by the ample well logdata used to develop the geologic model (>1,000 well logs;Meirovitz 2010), wherein strong lateral connectivity of high-Kfacies was observed virtually throughout the domain area. Anumber of previous studies conducted within the area and insimilar alluvial aquifer systems helped in the estimation ofregional water budget terms as well as the expected rangesof aquifer properties for each facies type (Anderson et al.2015; Botros et al. 2009; Fleckenstein et al. 2004; Frei et al.2009; Maserjian 1993; Niswonger and Fogg 2008; Sager2012).
Specifically, regional agricultural pumping and rechargevolumes were adjusted moderately by Liu (2014) to approxi-mate average groundwater levels and changes in storage dur-ing a 16-year calibration period. Then, Ks values of the fine-texture facies (Table 2) were adjusted to approximate the ap-propriate seasonal fluctuations in heads which ranged system-atically from small fluctuations at the water table to muchlarger fluctuations in deeper intervals, owing to greater con-finement. Because the geologic model is a single stochasticrealization, some local-scale deviation between simulated andobserved heads was expected. Nevertheless, the strong lateralconnectivity of the high-K facies in this model would producevery similar system behavior among different realizations(e.g., LaBolle and Fogg 2001; Fogg et al. 2000), obviatingthe need for multiple realizations in a study of this type.
Thirty-nine monitoring well locations distributed roughlyevenly throughout the domain, including both ‘shallow’(<20 m) semi-confined and ‘deep’ (>30 m) confined aquiferlevels, were chosen to assess correspondence with measuredwater levels. Goodness of fit was evaluated both with rootmean square error (RMSE) of water level residuals and withPearson’s r of simulated and observed water levels. AverageRMSE and Pearson’s r were 1.6 m and 0.97, respectively, forthe calibrated model. During the calibration process, monthlyregional agricultural pumping rates were adjusted within±15% of initial literature values.Ks values were adjusted with-in ±65%, on average, from initial values. Adjustments of Ks
were small relative the five order-of-magnitude range ofKs forfacies designations within the domain.
Parameter sensitivity on storage accommodatedby fine-texture facies
Seven additional numerical experiments were run to eval-uate the influence of parameter choice on the proportionof storage accommodated by fine-texture facies for site 3.Six runs in which parameters describing hydraulic proper-ties of fine-texture muddy sand and mud facies wereperturbed and compared with a baseline run with the orig-inal model parameters (see Table 6). Each numerical ex-periment included a 90-day simulation with an initial 30-day recharge period in which 10 cm of ponded water wassimulated over the site, followed by a 60-day recoveryperiod in which no recharge was specified over the entiredomain. An additional 90-day no-recharge simulation wasperformed with identical parameters, and the outputs fromthe recharge and no-recharge runs were differenced follow-ing procedures described in section ‘Model superpositionand post-processing’. The proportion of storage accommo-dated by fine-texture facies was compared against thebaseline run at the end of each 90-day simulation.Shorter-duration 90-day simulations were chosen to repre-sent the recharge and fines-storage phenomena while min-imizing computational expense. Similarly, parameter sensi-tivities were evaluated at a single site; site 3 was chosenbecause its recharge potential was balanced between theother high- and low-recharge sites (sites 1–2 and sites 4–5, respectively). Parameter perturbations were 10% of aparameter range proposed by Sager (2012). Results forthe baseline run show that 60% of the recharge volumewas accommodated by fine-textured facies at the end ofthe 90-day simulation, and ranged between 59 and 64%for each of the six runs in which parameters wereperturbed (Table 6). Results indicate that the high propor-tion of storage accommodated by fine-textured facies isminimally influenced by parameter choice and is fairlyrobust to parameter uncertainty.
Hydrogeol J (2019) 27:2869–2888 2885

Open Access This article is distributed under the terms of the CreativeCommons At t r ibut ion 4 .0 In te rna t ional License (h t tp : / /creativecommons.org/licenses/by/4.0/), which permits unrestricted use,distribution, and reproduction in any medium, provided you giveappropriate credit to the original author(s) and the source, provide a linkto the Creative Commons license, and indicate if changes were made.
References
Adham M, Jahan C, Mazumder Q, Haque AM (2010) Study on ground-water recharge potentiality of Barind Tract, Rajshahi District,Bangladesh using GIS and remote sensing technique. J Geol SocIndia 75:432–438. https://doi.org/10.1007/s12594-010-0039-3
Ajami H, McCabeMF, Evans JP, Stisen S (2014) Assessing the impact ofmodel spin-up on surface water–groundwater interactions using anintegrated hydrologic model. Water Resour Res 50:2636–2656.https://doi.org/10.1002/2013WR014258
Alley WM, Healy RW, LaBaugh JW, Reilly TE (2002) Flow and storagein groundwater systems. Science 296:1985–1990. https://doi.org/10.1126/science.1067123
Anderson MP, Woessner WW, Hunt RJ (2015) Applied groundwatermodeling: simulation of flow and advective transport. Academic,Amsterdam
Asano T (2016) Artificial recharge of groundwater. Elsevier, AmsterdamAshby SF, Falgout RD (1996) A parallel multigrid preconditioned con-
jugate gradient algorithm for groundwater flow simulations. NuclSci Eng 124:145–159. https://doi.org/10.13182/NSE96-A24230
Barnett TP, Pierce DW, Hidalgo HG, Bonfils C, Santer BD, Das T, BalaG, Wood AW, Nozawa T, Mirin AA et al (2008) Human-inducedchanges in the hydrology of the western United States. Science 319:1080–1083. https://doi.org/10.1126/science.1152538
Batlle-Aguilar J, Cook PG (2012) Transient infiltration from ephemeralstreams: a field experiment at the reach scale. Water Resour Res 48:11518–11530. https://doi.org/10.1029/2012WR012009
Beganskas S, Fisher AT (2017) Coupling distributed stormwater collec-tion and managed aquifer recharge: field application and implica-tions. J Environ Manag 200:366–379. https://doi.org/10.1016/j.jenvman.2017.05.058
Booth E, Mount J, Viers JH (2006) Hydrologic variability of theCosumnes River floodplain, San Francisco. Estuary Watershed Sci4:1–19
Botros FE, Harter T, Onsoy YS, Tuli A, Hopmans JW (2009) Spatialvariability of hydraulic properties and sediment characteristics in a
deep alluvial unsaturated zone. Vadose Zone J 8:276–289. https://doi.org/10.2136/vzj2008.0087
Bouwer H (2002) Artificial recharge of groundwater: hydrogeology andengineering. Hydrogeol J 10:121–142. https://doi.org/10.1007/s10040-001-0182-4
Bredehoeft JD, Young RA (1983) Conjunctive use of groundwater andsurface water for irrigated agriculture: risk aversion. Water ResourRes 19:1111–1121. https://doi.org/10.1029/WR019i005p01111
Bresciani E, Cranswick RH, Banks EW, Batlle-Aguilar J, Cook PG,Batelaan O (2018) Using hydraulic head, chloride and electricalconductivity data to distinguish between mountain-front andmountain-block recharge to basin aquifers. Hydrol Earth Syst Sci22:1629–1648. https://doi.org/10.5194/hess-22-1629-2018
Brush CF, Dogrul EC, Kadir TN (2013) Development and calibration ofthe California Central Valley groundwater–surface water simulationmodel (C2VSim), version 3.02-cg. Bay-Delta Office, CaliforniaDepartment of Water Resources, Sacramento, CA
Carle SF (1999) T-ProGS: Transition Probability Geostatistical Software,vol 84. University of California, Davis, CA
Carle SF, Fogg GE (1996) Transition probability-based indicatorgeostatistics. Math Geol 28:453–476. https://doi.org/10.1007/BF02083656
Carle SF, Fogg GE (1997) Modeling spatial variability with one andmultidimensional continuous-lag Markov chains. Math Geol 29:891–918. https://doi.org/10.1023/A:102230370
Carle SF, Esser BK, Moran JE (2006) High-resolution simulation ofbasin-scale nitrate transport considering aquifer system heterogene-ity. Geosphere 2:195–209. https://doi.org/10.1130/GES00032.1
Cayan DR, Maurer EP, Dettinger MD, Tyree M, Hayhoe K (2008)Climate change scenarios for the California region. Clim Chang87:21–42. https://doi.org/10.1007/s10584-007-9377-6
Cayan DR, Das T, Pierce DW, Barnett TP, TyreeM, Gershunov A (2010)Future dryness in the Southwest US and the hydrology of the early21st century drought. Proc Natl Acad Sci 107:21271–21276. https://doi.org/10.1073/pnas.0912391107
Chinnasamy P, Muthuwatta L, Eriyagama N, Pavelic P, Lagudu S (2018)Modeling the potential for floodwater recharge to offset groundwa-ter depletion: a case study from the Ramganga basin, India. SustainWater Resour Manag 4:331–344. https://doi.org/10.1007/s40899-017-0168-6
Dahlke H, Brown A, Orloff S, Putnam D, O’Geen T (2018) Managedwinter flooding of alfalfa recharges groundwater with minimal cropdamage. Calif Agric 72:65–75. https://doi.org/10.3733/ca.2018a0001
Table 6 Fraction of change-in-storage accommodated by fine-texture facies and parameter perturbations for site 3 parameter sensitivity runs
Run number Perturbedparameter
Hydrofaciesdesignation
Parameter range(Sager 2012)
Baseline parameter choice Perturbed parameterchoice
Fraction of storage accommodatedby fine-texture facies
1 (baseline) – – – – – 0.602 Ks (m day−1) Muddy sand 0.089–0.89 0.20 0.28 0.66
Mud 0.0023–0.023 0.0017 0.00383 Ss (m
−1) Muddy sand 0.0001–0.001 0.0001 0.0002 0.60Mud 0.0001–0.001 0.0010 0.0011
4 ϕ Muddy sand 0.35–0.45 0.40 0.39 0.59Mud 0.35–0.45 0.45 0.44
5 α Muddy sand 2.69–3.55 2.69 2.78 0.60Mud 1.62–3.55 1.62 1.81
6 n Muddy sand 1.44–2.00 2.00 1.94 0.60Mud 1.32–2.00 2.00 1.93
7 Sres Muddy sand 0.10–0.25 0.10 0.12 0.59Mud 0.16–0.23 0.20 0.21
Hydrogeol J (2019) 27:2869–28882886

DeMarsily G, Delay F, Gonçalvès J, Renard P, Teles V, Violette S (2005)Dealing with spatial heterogeneity. Hydrogeol J 13:161–183. https://doi.org/10.1007/s10040-004-0432-3
de Vries JJ, Simmers I (2002) Groundwater recharge: an overview ofprocesses and challenges. Hydrogeol J 10:5–17. https://doi.org/10.1007/s10040-001-0171-7
Dettinger MD, Ralph FM, Das T, Neiman PJ, Cayan DR (2011)Atmospheric rivers, floods and the water resources of California.Water 3:445–478. https://doi.org/10.3390/w3020445
Dillon P, Stuyfzand P, Grischek T, Lluria M, Pyne RDG, Jain RC, Bear J,Schwarz J, Wang W, Fernandez E, Stefan C, Pettenati M, van derGun J, Sprenger C, Massmann G, Scanlon BR, Xanke J, Jokela P,Zheng Y, Rossetto R, Shamrukh M, Pavelic P, Murray E, Ross A,Bonilla Valverde JP, Palma Nava A, Ansems N, Posavec K, Ha K,Martin R, Sapiano M (2019) Sixty years of global progress in man-aged aquifer recharge. Hydrogeol J 27:1–30. https://doi.org/10.1007/s10040-018-1841-z
Engdahl NB, Vogler ET, Weissmann GS (2010) Evaluation of aquiferheterogeneity effects on river flow loss using a transition probabilityframework. Water Resour Res 46:W01506. https://doi.org/10.1029/2009WR007903
Famiglietti J, Lo M, Ho S, Bethune J, Anderson K, Syed T, Swenson S,De Linage C, Rodell M (2011) Satellites measure recent rates ofgroundwater depletion in California’s Central Valley. Geophys ResLett 38:L03403. https://doi.org/10.1029/2010GL046442
Faunt CC, Hanson R, Belitz K (2009) Groundwater availability of theCentral Valley aquifer, California. US Geological Survey. Reston,VA
Fichtner T, Barquero F, Sallwey J, Stefan C (2019) Assessing managedaquifer recharge processes under three physical model concepts.Water 11:107–121. https://doi.org/10.3390/w11010107
Fleckenstein J, Anderson M, Fogg G, Mount J (2004) Managing surfacewater-groundwater to restore fall flows in the Cosumnes River. JWater Resour Plan Manag 130:301–310. https://doi.org/10.1061/(ASCE)0733-9496(2004)130:4(301)
Fleckenstein JH, Niswonger RG, Fogg GE (2006) River–aquifer interac-tions, geologic heterogeneity, and low-flow management.Groundwater 44:837–852. https://doi.org/10.1111/j.1745-6584.2006.00190.x
Fogg GE (1986) Groundwater flow and sand body interconnectedness ina thick, multiple-aquifer system. Water Resour Res 22:679–694.https://doi.org/10.1029/WR022i005p00679
Fogg GE, Carle SF, Green C (2000) Connected-network paradigm for thealluvial aquifer system. Geol Soc Am Spec Pap 348:25–42
Ford RS, Chee L (1974) Evaluation of ground water resources,Sacramento County. Report, California Department of WaterResources, Sacramento, CA
Frei S, Fleckenstein J, Kollet S,Maxwell R (2009) Patterns and dynamicsof river–aquifer exchange with variably-saturated flow using a fully-coupled model. J Hydrol 375:383–393. https://doi.org/10.1016/j.jhydrol.2009.06.038
Gailey RM (2018) In: University of California (ed) Approaches forgroundwater management in times of depletion and regulatorychange. PhD Thesis, Univ. of California, Davis, CA
Ghayoumian J, Saravi MM, Feiznia S et al (2007) Application of GIStechniques to determine areas most suitable for artificial groundwa-ter recharge in a coastal aquifer in southern Iran. J Asian Earth Sci30:364–374. https://doi.org/10.1016/j.jseaes.2006.11.002
Gleick PH (2000) A look at twenty-first century water resources devel-opment. Water Int 25:127–138. https://doi.org/10.1080/02508060008686804
Hanson R, Flint L, Flint A, Dettinger M, Faunt C, Cayan D, Schmid W(2012) Amethod for physically based model analysis of conjunctiveuse in response to potential climate changes. Water Resour Res 48:W00L08. https://doi.org/10.1029/2011WR010774
Harter T (2005) Finite-size scaling analysis of percolation in three-dimensional correlated binary Markov chain random fields. PhysRev E 72:026120. https://doi.org/10.1103/PhysRevE.72.026120
Harter T, Dahlke H (2014) Out of sight but not out of mind: Californiarefocuses on groundwater. Calif Agric 68:54–55. https://doi.org/10.3733/ca.v068n03p54
Hartmann A, Gleeson T, Wada Y, Wagener T (2017) Enhanced ground-water recharge rates and altered recharge sensitivity to climate var-iability through subsurface heterogeneity. Proc Natl Acad Sci 114:2842–2847. https://doi.org/10.1073/pnas.1614941114
Hartog N, Stuyfzand PJ (2017)Water quality considerations on the rise asthe use of managed aquifer recharge systems widens. Water 9:808.https://doi.org/10.3390/w9100808
Hayhoe K, Wake CP, Huntington TG, Luo L, Schwartz MD, Sheffield J,Wood E, Anderson B, Bradbury J, DeGaetano A et al (2007) Pastand future changes in climate and hydrological indicators in the USnortheast. Clim Dyn 28:381–407. https://doi.org/10.1007/s00382-006-0187-8
Huntington JL, Niswonger RG (2012) Role of surface-water and ground-water interactions on projected summertime streamflow in snowdominated regions: an integrated modeling approach. WaterResour Res 48:W11524. https://doi.org/10.1029/2012WR012319
Irvine DJ, Brunner P, Franssen HJH, Simmons CT (2012) Heterogeneousor homogeneous? Implications of simplifying heterogeneousstreambeds in models of losing streams. J Hydrol 424:16–23.https://doi.org/10.1016/j.jhydrol.2011.11.051
Israel M, Lund JR (1995) Recent California water transfers: implicationsfor water management. Nat Resour J 35:1–32
Jacobs KL, Holway JM (2004) Managing for sustainability in an aridclimate: lessons learned from 20 years of groundwater managementin arizona, usa. Hydrogeol J 12:52–65. https://doi.org/10.1007/s10040-003-0308-y
Jones JE, Woodward CS (2001) Newton–Krylov-multigrid solvers forlarge-scale, highly heterogeneous, variably saturated flow problems.Adv Water Resour 24:763–774. https://doi.org/10.1016/S0309-1708(00)00075-0
Karl TR, Melillo JM, Peterson TC, Hassol SJ (2009) Global climatechange impacts in the united states. Cambridge University Press,Cambridge
Kern Water Bank Authority (2018) Water bank frequently asked ques-tions. http://www.kwb.org/index.cfm/fuseaction/Pages.Page/id/352.Accessed 5 Sept 2018
Kiparsky M, Owen D, Green Nylen N, Doremus H, Christian-Smith J,Cosens B, Fisher A, Milman A (2016) Designing effective ground-water sustainability agencies: criteria for evaluation of local gover-nance options. Center for Law, Energy and the Environment, UCBerkeley School of Law. www.law.berkeley.edu/groundwater-governance-criteria. Accessed 5 Sept 2018
Kletzing R (1987) Imported groundwater banking: The Kern WaterBank–a case study. Pac Law J 19:1225
Knowles N, Dettinger MD, Cayan DR (2006) Trends in snowfall versusrainfall in the western united states. J Clim 19:4545–4559. https://doi.org/10.1175/JCLI3850.1
Kocis TN, Dahlke HE (2017) Availability of high-magnitude streamflowfor groundwater banking in the Central Valley, California. EnvironRes Lett 12:084009. https://doi.org/10.1088/1748-9326/aa7b1b
Kollet SJ, Maxwell RM (2006) Integrated surface–groundwater flowmodeling: a free-surface overland flow boundary condition in aparallel groundwater flow model. Adv Water Resour 29:945–958.https://doi.org/10.1016/j.advwatres.2005.08.006
Koltermann CE, Gorelick SM (1996) Heterogeneity in sedimentary de-posits: a review of structure-imitating, process-imitating, and de-scriptive approaches. Water Resour Res 32:2617–2658. https://doi.org/10.1029/96WR00025
Hydrogeol J (2019) 27:2869–2888 2887

Konikow LF (2013) Groundwater depletion in the United States (1900–2008). US Geol Surv Sci Invest Rep 2013-5079. https://doi.org/10.3133/sir20135079
Konikow LF, Neuzil CE (2007) A method to estimate groundwater de-pletion from confining layers. Water Resour Res 43:7417–7432.https://doi.org/10.1029/2006WR005597
LaBolle EM, FoggGE (2001) Role of molecular diffusion in contaminantmigration and recovery in an alluvial aquifer system. Transp PorousMedia 42:155–179. https://doi.org/10.1023/A:1006772716244
Liu Y (2014) Modeling study of groundwater and surface water interac-tion using high resolution integrated model. MSc Thesis, Universityof California, Davis, CA
Maserjian LA (1993) Hydrogeologic analysis of the unsaturated zone,northern Salinas Valley, California. MSc Thesis, University ofCalifornia, Davis, CA
Meirovitz CD (2010) Influence of American River incised valley fill onSacramento county hydrogeology. MSc Thesis, University ofCalifornia, Davis, CA
Milly PC, Betancourt J, Falkenmark M, Hirsch RM, Kundzewicz ZW,Lettenmaier DP, Stouffer RJ (2008) Stationarity is dead: whitherwater management? Science 319:573–574. https://doi.org/10.1126/science.1151915
Mirchi A, Madani K, Roos M, Watkins DW (2013) Climate changeimpacts on California’s water resources. In: Drought in arid andsemi-arid regions. Springer, Heidelberg, Germany, pp 301–319
Moore JG, Moring BC (2013) Rangewide glaciation in the SierraNevada, California. Geosphere 9:1804–1818. https://doi.org/10.1130/GES00891.1
Neuman SP, Witherspoon PA (1972) Field determination of the hydraulicproperties of leaky multiple aquifer systems. Water Resour Res 8:1284–1298. https://doi.org/10.1029/WR008i005p01284
Niswonger RG, Fogg GE (2008) Influence of perched groundwater onbase flow. Water Resour Res 44:W03405. https://doi.org/10.1029/2007WR006160
Niswonger RG, Morway ED, Triana E, Huntington JL (2017) Managedaquifer recharge through off-season irrigation in agricultural regions.Water Resour Res 53:6970–6992. https://doi.org/10.1002/2017WR020458
O’GeenA, SaalM, Dahlke H, Doll D, Elkins R, FultonA, FoggG, HarterT, Hopmans J, Ingels C et al (2015) Soil suitability index identifiespotential areas for groundwater banking on agricultural lands. CalifAgric 69:75–84. https://doi.org/10.3733/ca.v069n02p75
Phillips SP, Belitz K (1991) Calibration of a texture-based model of aground-water flow system, western San Joaquin Valley, California.Groundwater 29:702–715. https://doi.org/10.1111/j.1745-6584.1991.tb00562.x
Pierce KL, Scott WE (1983) Pleistocene episodes of alluvial-gravel de-position, southeastern Idaho. Idaho Bureau of Mines Geology.http://geology.isu.edu/Digital_Geology_Idaho/papers/B-26ch13-2.pdf. Accessed September 2019
RMC (2011) Sacramento Area Integrated Water resources Model(SacIWRM). https://www.scgah2o.saccounty.net/Documents/Recharge%20Mapping%20and%20Field%20Study_SCGA_Task%203%20TM_121615_final.pdf. Accessed 04 March 2018
Sager JC (2012) Effects of subsurface heterogeneity on floodplain re-charge and subsurface storage of water. MSc Thesis, University ofCalifornia, Davis, CA
Scanlon BR, Faunt CC, Longuevergne L, Reedy RC, Alley WM,McGuire VL, McMahon PB (2012) Groundwater depletion andsustainability of irrigation in the US High Plains and CentralValley. Proc Natl Acad Sci 109:9320–9325. https://doi.org/10.1073/pnas.1200311109
Shlemon R (1967) Landform-soil relationships in northern Sacramentocounty, California. PhD Thesis, University of California, Berkeley,CA
Stewart IT, Cayan DR, Dettinger MD (2005) Changes toward earlierstreamflow timing across Western North America. J Clim 18:1136–1155. https://doi.org/10.1175/JCLI3321.1
Swain DL, Langenbrunner B, Neelin JD, Hall A (2018) Increasing pre-cipitation volatility in twenty-first-century California. Nat ClimChang 8:427. https://doi.org/10.1038/s41558-018-0140-y
Taylor RG, Scanlon B, Döll P et al (2013) Ground water and climatechange. Nat Clim Chang 3:322. https://doi.org/10.1038/NCLIMATE1744
Van Genuchten MT (1980) A closed-form equation for predicting thehydraulic conductivity of unsaturated soils 1. Soil Sci Soc Am J4 4 : 8 9 2 – 8 9 8 . h t t p s : / / d o i . o r g / 1 0 . 2 1 3 6 / s s s a j 1 9 8 0 .03615995004400050002x
Vicuña S, Dracup J (2007) The evolution of climate change impact stud-ies on hydrology and water resources in California. Clim Chang 82:327–350. https://doi.org/10.1007/s10584-006-9207-2
Vicuña S, Garreaud RD,McPhee J (2011) Climate change impacts on thehydrology of a snowmelt driven basin in semiarid Chile. ClimChang 105:469–488. https://doi.org/10.1007/s10584-010-9888-4
WadaY, van Beek LP, vanKempen CM, Reckman JW, Vasak S, BierkensMF (2010) Global depletion of groundwater resources. GeophysRes Lett 37:L20402
Wada Y, Van Beek L, Bierkens MF (2011) Modelling global water stressof the recent past: on the relative importance of trends in waterdemand and climate variability. Hydrol Earth Syst Sci 15:3785–3805. https://doi.org/10.5194/hess-15-3785-2011
Wada Y, Beek L, Bierkens MF (2012) Nonsustainable groundwater sus-taining irrigation: a global assessment. Water Resour Res 48:W00L06. https://doi.org/10.1029/2011WR010562
Weissmann GS, Fogg GE (1999) Multi-scale alluvial fan heterogeneitymodeled with transition probability geostatistics in a sequence strat-igraphic framework. J Hydrol 226:48–65. https://doi.org/10.1016/S0022-1694(99)00160-2
Weissmann GS, Carle SF, Fogg GE (1999) Three-dimensionalhydrofacies modeling based on soil surveys and transition probabil-ity geostatistics. Water Resour Res 35:1761–1770. https://doi.org/10.1029/1999WR900048
Weissmann GS, Zhang Y, Fogg GE, Mount JF (2004) Influence ofincised-valley-fill deposits on hydrogeology of a stream-dominatedalluvial fan. In: Aquifer characterization. SEPM Spec Pub, vol 80.https://doi.org/10.2110/pec.04.80.0015
Weissmann G, Bennett G, Lansdale A (2005) Factors controlling se-quence development on quaternary fluvial fans, San Joaquin basin,California, USA. Geol Soc Lond Spec Publ 251:169
Xanke J, Liesch T, Goeppert N, Klinger J, Gassen N (2017)Contamination risk and drinking water protection for a large-scalemanaged aquifer recharge site in a semi-arid karst region, Jordan.Hydrogeol J 25:1795–1809. https://doi.org/10.1007/s10040-017-1586-0
Hydrogeol J (2019) 27:2869–28882888


