Pascack Valley Regional High School · PDF filePascack Valley Regional High School District...
29
Pascack Valley Regional High School District Pascack Hills High School, Montvale, New Jersey Pascack Valley High School, Hillsdale, New Jersey Course Name: Algebra/Algebra 1 (MA2200, 2300, 2500)
Transcript of Pascack Valley Regional High School · PDF filePascack Valley Regional High School District...
Pascack Valley Regional High School District
Pascack Hills High School, Montvale, New Jersey Pascack Valley High School, Hillsdale, New Jersey
Course Name: Algebra/Algebra 1 (MA2200, 2300, 2500)

Page 2 of 29
COURSE DESCRIPTION
Algebra-I (MA2300) and Algebra (MA2200/2500) are full year college preparatory, five-credit courses designed for students who are
skilled in fundamental arithmetic operations, and typical pre-algebra topics (as outlined in the Common Core State Standards (CCSS)
implemented in NJ public schools September 2013). Students should have successfully completed a Pre-Algebra course (or equivalent). Algebra
(MA2200/2500) presents comparable material but with a greater emphasis on mastering prerequisite pre-algebra skills, and improving reading
comprehension, note-taking, organizational skills and problem-solving strategies. It is also recommended that students who score ”Partially
Proficient” on their grade-8 New Jersey NJASK 8 be assigned to a remedial Mathlab9 course.
In Algebra-I the student is encouraged to become an independent learner in a student-centered classroom. The objective of the course is
to have students develop mastering in developing relationships between quantities, finding linear relationships, developing and observing
exponential and quadratic relationships, working with advanced functions and equations and working with basic data analysis (measures of
spread, simulations, combinations, permutations and parameters.)
Through the use of scientific calculators, graphing calculators, specialized software, and various Internet programs and subscriptions
technology is integrated into the curriculum. Topics such as statistics, probability and discrete mathematics are related to each other and applied
to real-world situations through problem solving.
Student Text:
Algebra 1, Glencoe McGraw Hill 2014 (ISBN: 978-0-07-663924-3) an online textbook with online resources
Supplemental Materials:
Dolciani, Mary and others. Algebra: Structure and Method, Book I. Boston: Houghton Mifflin Company, 1986
Marcy, Steve and Janis. Algebra with Pizzazz! Palo Alto, California: Creative Publications, 1983
Let’s Prepare for the New Jersey HSPA, by Arendt, Barron’s, 2003 (ISBN: 0-7641-2185-5)
Preparing for the New Jersey HSPA, by Glatzer and Glatzer, Amsco 2001 (ISBN: 1-56765-544-0)
Measuring Up to the New Jersey Core Curriculum Content Standards and Success Strategies for the HSPA, Final Preparation, Peoples
Publishing Group, 2005 (ISBN: 1-4138-0479-9)
Conquering the New SAT Math, Postman and Postman, McGraw-Hill, 2006, (ISBN: 0-07-145288-5)
Exploring Algebra 1 with The Geometer’s Sketchpad, version 4, Kunkel, Chanan, Steketee,Key Curriculum Press, 2006 (ISBN: 978-1-55953-
798-8)
Algebra 1, by McDougall Littell, 2000

Page 3 of 29
Calculators:
Graphing calculators
-Virtual calculator (http://www.coolmath.com/graphit/index.html)
-Online tutorials (http://education.ti.com/educationportal/sites/US/nonProductMulti/training_online_tutorials.html)
Scientific calculators
- Virtual calculators (http://www.csgnetwork.com/csgscicalc.html )
(http://www.calculator.org/jcalc98.html)
- Online tutorials (http://www.tutorio.com/tutorial/scientific-calculator)
Tools and Manipulatives:
Students have access to concrete and virtual tools and manipulatives:
(Virtual manipulatives - http://www.ct4me.net/math_manipulatives.htm.)
(Interactive tools- http://www.shodor.org/interactivate/tools/)
Computer Software:
(The listed software is installed on all teacher and student laptops for use 24/7, in school or out of school):
Grapher (Mac software: http://www.chimoosoft.com/products/apgrapher/)
(online virtual grapher: http://nces.ed.gov/nceskids/createagraph/default.aspx)
Geometer’s Sketchpad (software-http://www.keypress.com/x5521.xml) and (resource center- http://www.dynamicgeometry.com/)
MathType-Equation Editor
MSOffice: MSWord, MSExcel, MSPowerPoint
(tutorials: http://www.fgcu.edu/support/office2007/ppt/index.asp)
The Macintosh iLife Suite: Keynote, iBook, iMovie, (http://www.apple.com/imac/software/)
Internet Resources:
Updated annually and often used for independent and group projects or to model or simulate real-world applications of Algebra-I curriculum
concepts.
o QUIA http://www.quia.com/
o SASinSCHOOLS http://www.sasinschool.com/
o Explore Learning Gizmos (available for mathematics and science) http://www.explorelearning.com/
o BrainPop (videos/quizzes) http://www.brainpop.com/
o Glencoe Algebra 1 http://www.algebra1.com
o Regents Prep http://www.regentsprep.org
o See Appendix I for a more detailed list of activities and websites used throughout the curriculum.

Page 4 of 29
Teacher Resources:
- Beginning with the 2013-14 school year, each math course will include an official department created pre-test (given early September)
and a posttest (given later in June). These are resources teachers will use to compare results, analyze student growth, and share
successful strategies, resources and activities.
- Each year, all math teachers collaborate and share appropriate online-activities that align with specific goals, objectives and sub-topics
of each high school math course. These lists are updated regularly and are available online for access by district teachers for use with
their students.
Student Resources:
- Each teacher’s Website has a page for each course. These contain both online sites and links to hardcopy resources specific to each
course. More generic sites are also linked so students can easily access online tutorials, self-check quizzes, problem-based tasks,
games, puzzles, multi-media presentations, interactive investigations, podcasts, blogs, teacher-made Jing tutorials, listservs,
Webquests, etc.
- There is a Data Exchange drive on a district server with an input/output arrangement; teachers save documents here for student use;
students can access these documents and submit documents to their teacher. Students cannot access another student’s document.
- The Math Department Website has resources about standardized tests (such as the HSPA, SAT, NJ End-of-Course Tests), State
Core-Curriculum Content Standards for all levels of high school mathematics, and other education-related sites that are helpful to
students, parents and teachers.
- The District’s Web Site is http://www.pascack.k12.nj.us; if you then select a [school] (Pascack Valley or Pascack Hills), then select
[Department] (Mathematics), you will be at the Math Department Website and can link to any math teacher’s homepage.

Page 5 of 29
MATHEMATICAL PRACTICES (K-12)
The Standards for Mathematical Practice describe varieties of expertise that mathematics educators at all levels should seek to develop in their students. These practices rest on important “processes and proficiencies” with longstanding importance in mathematics education. The first of these are the NCTM process standards of problem solving, reasoning and proof, communication, representations, and connections. The second are the strands of mathematical proficiency specified in the national Research Council’s report Adding it Up: adaptive reasoning, strategic competence, conceptual understanding (comprehension of mathematical concepts, operations and relations), procedural fluency (skill in carrying out procedures flexibly, accurately, efficiently and appropriately), and productive disposition (habitual inclination to see mathematics as mathematics as sensible, useful, and worthwhile, coupled with a belief in diligence and one’s own efficacy)
1. CCSS.Math.Practice.MP1 Make sense of problems and persevere in solving them.
Mathematically proficient students start by explaining to themselves the meaning of a problem and looking for entry points to its solution. They analyze givens, constraints, relationships, and goals. They make conjectures about the form and meaning of the solution and plan a solution pathway rather than simply jumping into a solution attempt. They consider analogous problems, and try special cases and simpler forms of the original problem in order to gain insight into its solution. They monitor and evaluate their progress and change course if necessary. Older students might, depending on the context of the problem, transform algebraic expressions or change the viewing window on their graphing calculator to get the information they need. Mathematically proficient students can explain correspondences between equations, verbal descriptions, tables, and graphs or draw diagrams of important features and relationships, graph data, and search for regularity or trends. Younger students might rely on using concrete objects or pictures to help conceptualize and solve a problem. Mathematically proficient students check their answers to problems using a different method, and they continually ask themselves, “Does this make sense?” They can understand the approaches of others to solving complex problems and identify correspondences between different approaches.
2. CCSS.Math.Practice.MP2 Reason abstractly and quantitatively.
Mathematically proficient students make sense of quantities and their relationships in problem situations. They bring two complementary abilities to bear on problems involving quantitative relationships: the ability to decontextualize—to abstract a given situation and represent it symbolically and manipulate the representing symbols as if they have a life of their own, without necessarily attending to their referents—and the ability to contextualize, to pause as needed during the manipulation process in order to probe into the referents for the symbols involved. Quantitative reasoning entails habits of creating a coherent representation of the problem at hand; considering the units involved; attending to the meaning of quantities, not just how to compute them; and knowing and flexibly using different properties of operations and objects.
Page 6 of 29
3. CCSS.Math.Practice.MP3 Construct viable arguments and critique the reasoning of others.
Mathematically proficient students understand and use stated assumptions, definitions, and previously established results in constructing arguments. They make conjectures and build a logical progression of statements to explore the truth of their conjectures. They are able to analyze situations by breaking them into cases, and can recognize and use counterexamples. They justify their conclusions, communicate them to others, and respond to the arguments of others. They reason inductively about data, making plausible arguments that take into account the context from which the data arose. Mathematically proficient students are also able to compare the effectiveness of two plausible arguments, distinguish correct logic or reasoning from that which is flawed, and—if there is a flaw in an argument—explain what it is. Elementary students can construct arguments using concrete referents such as objects, drawings, diagrams, and actions. Such arguments can make sense and be correct, even though they are not generalized or made formal until later grades. Later, students learn to determine domains to which an argument applies. Students at all grades can listen or read the arguments of others, decide whether they make sense, and ask useful questions to clarify or improve the arguments.
4. CCSS.Math.Practice.MP4 Model with mathematics.
Mathematically proficient students can apply the mathematics they know to solve problems arising in everyday life, society, and the workplace. In early grades, this might be as simple as writing an addition equation to describe a situation. In middle grades, a student might apply proportional reasoning to plan a school event or analyze a problem in the community. By high school, a student might use geometry to solve a design problem or use a function to describe how one quantity of interest depends on another. Mathematically proficient students who can apply what they know are comfortable making assumptions and approximations to simplify a complicated situation, realizing that these may need revision later. They are able to identify important quantities in a practical situation and map their relationships using such tools as diagrams, two-way tables, graphs, flowcharts and formulas. They can analyze those relationships mathematically to draw conclusions. They routinely interpret their mathematical results in the context of the situation and reflect on whether the results make sense, possibly improving the model if it has not served its purpose.
5. CCSS.Math.Practice.MP5 Use appropriate tools strategically.
Mathematically proficient students consider the available tools when solving a mathematical problem. These tools might include pencil and paper, concrete models, a ruler, a protractor, a calculator, a spreadsheet, a computer algebra system, a statistical package, or dynamic geometry software. Proficient students are sufficiently familiar with tools appropriate for their grade or course to make sound decisions about when each of these tools might be helpful, recognizing both the insight to be gained and their limitations. For example, mathematically proficient high school students analyze graphs of functions and solutions generated using a graphing calculator. They detect possible errors by strategically using estimation and other mathematical knowledge. When making
Page 7 of 29
mathematical models, they know that technology can enable them to visualize the results of varying assumptions, explore consequences, and compare predictions with data. Mathematically proficient students at various grade levels are able to identify relevant external mathematical resources, such as digital content located on a website, and use them to pose or solve problems. They are able to use technological tools to explore and deepen their understanding of concepts.
6. CCSS.Math.Practice.MP6 Attend to precision.
Mathematically proficient students try to communicate precisely to others. They try to use clear definitions in discussion with others and in their own reasoning. They state the meaning of the symbols they choose, including using the equal sign consistently and appropriately. They are careful about specifying units of measure, and labeling axes to clarify the correspondence with quantities in a problem. They calculate accurately and efficiently, express numerical answers with a degree of precision appropriate for the problem context. In the elementary grades, students give carefully formulated explanations to each other. By the time they reach high school they have learned to examine claims and make explicit use of definitions.
7. CCSS.Math.Practice.MP7 Look for and make use of structure.
Mathematically proficient students look closely to discern a pattern or structure. Young students, for example, might notice that three and seven more is the same amount as seven and three more, or they may sort a collection of shapes according to how many sides the shapes have. Later, students will see 7 × 8 equals the well remembered 7 × 5 + 7 × 3, in preparation for learning about the distributive property. In the expression x2 + 9x + 14, older students can see the 14 as 2 × 7 and the 9 as 2 + 7. They recognize the significance of an existing line in a geometric figure and can use the strategy of drawing an auxiliary line for solving problems. They also can step back for an overview and shift perspective. They can see complicated things, such as some algebraic expressions, as single objects or as being composed of several objects. For example, they can see 5 – 3(x – y)2 as 5 minus a positive number times a square and use that to realize that its value cannot be more than 5 for any real numbers x and y.
8. CCSS.Math.Practice.MP8 Look for and express regularity in repeated reasoning.
Mathematically proficient students notice if calculations are repeated, and look both for general methods and for shortcuts. Upper elementary students might notice when dividing 25 by 11 that they are repeating the same calculations over and over again, and conclude they have a repeating decimal. By paying attention to the calculation of slope as they repeatedly check whether points are on the line through (1, 2) with slope 3, middle school students might abstract the equation (y – 2)/(x– 1) = 3. Noticing the regularity in the way terms cancel when expanding (x – 1)(x + 1), (x – 1)(x2 +x + 1), and (x – 1)(x3 + x2 + x + 1) might lead them to the general formula for the sum of a geometric series. As they work to solve a problem, mathematically proficient students maintain oversight of the process, while attending to the details. They continually evaluate the reasonableness of their intermediate results.

Page 8 of 29
Connecting the Standards for Mathematical Practice to the Standards for Mathematical Content
The Standards for Mathematical Practice describe ways in which developing student practitioners of the discipline of mathematics increasingly ought to engage with the subject matter as they grow in mathematical maturity and expertise throughout the elementary, middle and high school years. Designers of curricula, assessments, and professional development should all attend to the need to connect the mathematical practices to mathematical content in mathematics instruction.
The Standards for Mathematical Content are a balanced combination of procedure and understanding. Expectations that begin with the word “understand” are often especially good opportunities to connect the practices to the content. Students who lack understanding of a topic may rely on procedures too heavily. Without a flexible base from which to work, they may be less likely to consider analogous problems, represent problems coherently, justify conclusions, apply the mathematics to practical situations, use technology mindfully to work with the mathematics, explain the mathematics accurately to other students, step back for an overview, or deviate from a known procedure to find a shortcut. In short, a lack of understanding effectively prevents a student from engaging in the mathematical practices.
In this respect, those content standards, which set an expectation of understanding, are potential “points of intersection” between the Standards for Mathematical Content and the Standards for Mathematical Practice. These points of intersection are intended to be weighted toward central and generative concepts in the school mathematics curriculum that most merit the time, resources, innovative energies, and focus necessary to qualitatively improve the curriculum, instruction, assessment, professional development, and student achievement in mathematics.
In this respect, those content standards, which set an expectation of understanding, are potential “points of intersection” between the Standards for Mathematical Content and the Standards for Mathematical Practice. These points of intersection are intended to be weighted toward central and generative concepts in the school mathematics curriculum that most merit the time, resources, innovative energies, and focus necessary to qualitatively improve the curriculum, instruction, assessment, professional development, and student achievement in mathematics.

Page 9 of 29
Selected Opportunities for Connection to Mathematical Practices (apply to all units)
1. Make sense of problems and persevere in solving them. * 2. Reason abstractly and quantitatively. SLO 1 Analyze expressions by examining their parts in context. 3. Construct viable arguments and critique the reasoning of others.
SLO 7 Examine the steps in the derivation of the quadratic formula to determine if they are logical and ask questions to improve the clarify.
4. Model with mathematics. * 5. Use appropriate tools strategically. 6. Attend to precision. 7. Look for and make use of structure.
SLO 2 Look for structural similarities when writing equivalent expressions. 8. Look for and express regularity in repeated reasoning.
SLO 4 Determine the relationship between quantities over time and express the relationship in a general algebraic abstract expression
*MP.1 and MP.4 are overarching practices relevant to Algebra 1. (PARCC Model Content Frameworks) All of the content presented in this course has connections to the standards for mathematical practices.
Unit 1 – Solving Equations and Inequalities in One Variable
# STUDENT LEARNING
OBJECTIVES CCSS
Instructional Strategies, Resources, Projects, Integration of Technology
1
Create linear equations and inequalities in one variable and use them to solve problems. Justify each step in the process and the solution.
A.CED.1 A.REI.1 A.REI.3
1. Always, sometimes never activity involving equations with one variable: http://map.mathshell.org/materials/download.php?fileid=1286 2. Types of example problems of linear inequalities in one variable: http://www.jmap.org/JMAP/RegentsExamsandQuestions/PDF/WorksheetsByPI-Topic/IntegratedAlgebra/Algebra/A.A.24.SolvingInequalities.pdf
2
Create equations and inequalities in one variable and use them to solve problems. Include equations arising from linear and quadratic functions, simple rational and exponential functions and highlighting a quantity of interest in a formula.
A.CED.1, A.CED.4
1. Basic application of creating a one variable equation: http://www.khanacademy.org/math/algebra/solving-linear-equations-and-inequalities/equations_beginner/v/application-problems-with-equation-in-one-variable
Page 10 of 29
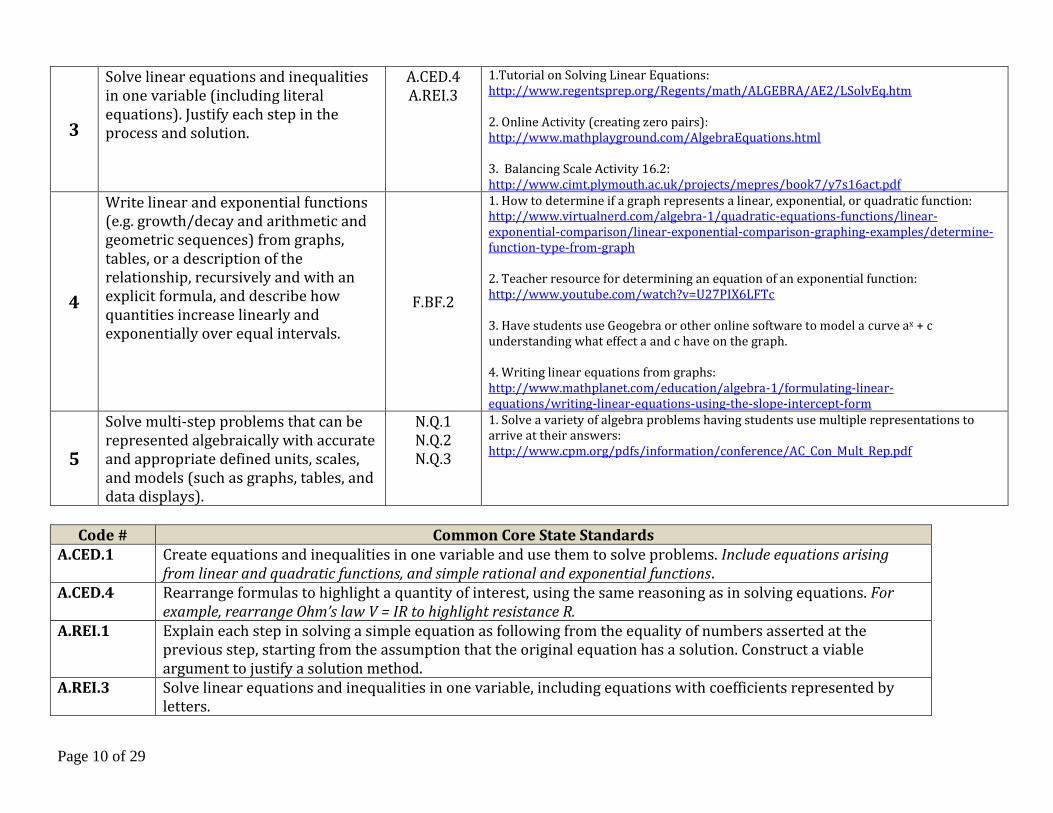
3
Solve linear equations and inequalities in one variable (including literal equations). Justify each step in the process and solution.
A.CED.4 A.REI.3
1.Tutorial on Solving Linear Equations: http://www.regentsprep.org/Regents/math/ALGEBRA/AE2/LSolvEq.htm 2. Online Activity (creating zero pairs): http://www.mathplayground.com/AlgebraEquations.html 3. Balancing Scale Activity 16.2: http://www.cimt.plymouth.ac.uk/projects/mepres/book7/y7s16act.pdf
4
Write linear and exponential functions (e.g. growth/decay and arithmetic and geometric sequences) from graphs, tables, or a description of the relationship, recursively and with an explicit formula, and describe how quantities increase linearly and exponentially over equal intervals.
F.BF.2
1. How to determine if a graph represents a linear, exponential, or quadratic function: http://www.virtualnerd.com/algebra-1/quadratic-equations-functions/linear-exponential-comparison/linear-exponential-comparison-graphing-examples/determine-function-type-from-graph 2. Teacher resource for determining an equation of an exponential function: http://www.youtube.com/watch?v=U27PIX6LFTc 3. Have students use Geogebra or other online software to model a curve ax + c understanding what effect a and c have on the graph. 4. Writing linear equations from graphs: http://www.mathplanet.com/education/algebra-1/formulating-linear-equations/writing-linear-equations-using-the-slope-intercept-form
5
Solve multi-step problems that can be represented algebraically with accurate and appropriate defined units, scales, and models (such as graphs, tables, and data displays).
N.Q.1 N.Q.2 N.Q.3
1. Solve a variety of algebra problems having students use multiple representations to arrive at their answers: http://www.cpm.org/pdfs/information/conference/AC_Con_Mult_Rep.pdf
Code # Common Core State Standards
A.CED.1 Create equations and inequalities in one variable and use them to solve problems. Include equations arising from linear and quadratic functions, and simple rational and exponential functions.
A.CED.4 Rearrange formulas to highlight a quantity of interest, using the same reasoning as in solving equations. For example, rearrange Ohm’s law V = IR to highlight resistance R.
A.REI.1 Explain each step in solving a simple equation as following from the equality of numbers asserted at the previous step, starting from the assumption that the original equation has a solution. Construct a viable argument to justify a solution method.
A.REI.3 Solve linear equations and inequalities in one variable, including equations with coefficients represented by letters.

Page 11 of 29
F.BF.2 Write arithmetic and geometric sequences both recursively and with an explicit formula, use them to model
situations, and translate between the two forms.★
N.Q.1 Use units as a way to understand problems and to guide the solution of multi-step problems; choose and interpret units consistently in formulas; choose and interpret the scale and the origin in graphs and data displays.
N.Q.2 Define appropriate quantities for the purpose of descriptive modeling. N.Q.3 Choose a level of accuracy appropriate to limitations on measurement when reporting quantities.
Unit 2 – Intro to Functions
# STUDENT LEARNING
OBJECTIVES CCSS
Instructional Strategies, Resources, Projects, Integration of Technology
1 Determine if a function has an inverse, and if so, write the expression for it.
F.BF.4 Purple Math: finding the inverse of a function http://www.purplemath.com/modules/invrsfcn3.htm Math is Fun: finding and verifying inverses http://www.mathsisfun.com/sets/function-inverse.html Cool Math: using the vertical line test http://www.coolmath.com/algebra/15-functions/03-vertical-line-test-01.htm
2
Explain and interpret the definition of functions including domain and range and how they are related; correctly use function notation in a context and evaluate functions for inputs and their corresponding outputs.
F.IF.1 F.IF.2
1. Understanding domain and range in relation to function notation http://www.coolmath.com/algebra/15-functions/05-domain-range-01.htm 2. Pinterest ideas for all things function/function notation related: http://pinterest.com/andi_cath/algebra-functions/
3
Compare properties of two functions each represented in a different way (algebraically, graphically, numerically in tables, or by verbal descriptions).
F.IF.9
1. Who shares my function? (Give students different representations of one function and have them find the other people in the class that share their same function) https://wikis.uit.tufts.edu/confluence/pages/viewpage.action?pageId=32413608 2. Multiple representations video: http://projectsharetexas.org/resource/connecting-multiple-representations-linear-functions 3. Good opportunity for a jigsaw activity creating groups for each representation

Page 12 of 29
4 Compare (using graphs and tables) linear, quadratic, and exponential models to determine that a quantity increasing exponentially eventually exceeds a quantity increasing linearly, quadratically, or (more generally) as a polynomial function, include interpretation of parameters in terms of a context.
F.LE.3 F.LE.5
TI.com: comparing linear to exponential models http://education.ti.com/en/timathnspired/us/detail?id=DEF0603B173F4EDBBD5421888C18310E&sa=2D7AB06424004125A392EB9A075CABC0&t=655EACD6D73F40D7B49EE840D89DA06A Virtual Nerd.com: comparing linear, quadratic and exponential graphs http://www.virtualnerd.com/algebra-1/quadratic-equations-functions/linear-exponential-comparison/linear-exponential-comparison-graphing-examples/determine-function-type-from-graph Analyze Math.com: applying parameters to polynomial functions http://www.analyzemath.com/polynomial2/polynomial2.htm
Code # Common Core State Standards
F.BF.4 Find inverse functions. Solve an equation of the form f(x) = c for a simple function f that has an inverse and write an expression for the inverse. For example, f(x) = 2 x3 or f(x) = (x+1)/(x-1) for x ≠ 1.
F.IF.1 Understand that a function from one set (called the domain) to another set (called the range) assigns to each element of the domain exactly one element of the range. If f is a function and x is an element of its domain, then f(x) denotes the output of f corresponding to the input x. The graph of f is the graph of the equation y = f(x).
F.IF.2 Use function notation, evaluate functions for inputs in their domains, and interpret statements that use function notation in terms of a context.
F.IF.9 Compare properties of two functions each represented in a different way (algebraically, graphically, numerically in tables, or by verbal descriptions). For example, given a graph of one quadratic function and an algebraic expression for another, say which has the larger maximum.
F.LE.3 Observe using graphs and tables that a quantity increasing exponentially eventually exceeds a quantity increasing linearly, quadratically, or (more generally) as a polynomial function.
F.LE.5 Interpret the parameters in a linear or exponential function in terms of a context.

Page 13 of 29
Unit 3 – Linear Equations and Inequalities (2 variables)
# STUDENT LEARNING
OBJECTIVES CCSS
Instructional Strategies, Resources, Projects, Integration of Technology
1
Model and describe constraints with linear equations and inequalities and systems of equations and/or inequalities to determine if solutions are viable or non-viable.
A.CED.3 A.REI.1
1. Understanding context between variables of linear equations: http://map.mathshell.org/materials/download.php?fileid=673 2. Understanding a feasible region pictorially (inequalities): http://www.regentsprep.org/Regents/math/ALGEBRA/AE9/GrIneqTR.htm 3. Systems of inequalities examples: http://www.regentsprep.org/Regents/math/ALGEBRA/AE9/GrIneqTR.htm 4. Solving systems whose solution is in the first quadrant (Put problems in context to ensure students understand they want a Q1 solution): http://www.math-drills.com/algebra/algebra_systems_of_equations_solve_by_graphing_001.html
2
Graph equations, inequalities, and systems of inequalities in two variables and explain that the solution to an equation is all points along the curve, the solution to a system of linear functions is the point of intersection, and the solution to a system of inequalities is the intersection of the corresponding half-planes. ★
A.REI.10 A.REI.11 A.REI.12
1. Understanding systems of Linear Inequalities: http://www.purplemath.com/modules/syslneq.htm 2. Be sure to bridge gap between old method of solving for something like x > 3 on a number line to the new way of representing on the Cartesian plane. (relate the shaded regions) 3. Compare and contrast the three options for answers of solving systems of equations and what they look like to the possible options of solutions when solving systems of inequalities.
3 Write linear and exponential functions (e.g. growth/decay and arithmetic and geometric sequences) from graphs, tables, or a description of the relationship, recursively and with an explicit formula, and describe how quantities increase linearly and exponentially over equal intervals.
F.BF.2 F.LE.1 F.LE.2
Cherry Math: equations of exponential functions http://wcherry.math.unt.edu/math1650/exponential.pdf Regentsprep.org: Equations of Straight Lines Lesson: http://www.regentsprep.org/Regents/math/ALGEBRA/AC1/EqLines.htm Practice: http://www.regentsprep.org/Regents/math/ALGEBRA/AC1/pracEq.htm RegentsPrep: exponential growth and decay http://www.regentsprep.org/Regents/math/ALGEBRA/AE7/ExpDecayL.htm

Page 14 of 29
4 Sketch the graph of a function that models a relationship between two quantities (expressed symbolically or from a verbal description) showing key features ( including intercepts, minimums/maximums, domain, and rate of change) by hand in simple cases and using technology in more complicated cases and relate the domain of the function to its graph. ★
F.IF.4 F.IF.5 F.1F.7
Explorelearning.com: Standard From of a Linear Equation (interactive investigation) http://www.explorelearning.com/index.cfm?method=cResource.dspView&ResourceID=159 Regentsprep.org: Equations and Graphing Lesson: http://www.regentsprep.org/Regents/math/ALGEBRA/AC1/EqLines2.htm Practice: http://www.regentsprep.org/Regents/math/ALGEBRA/AC1/PracLine.htm Math.com: Graphing Linear Equations (lesson, practice) http://www.math.com/school/subject2/lessons/S2U4L3GL.html Gomath.com: Slope, equation, and Y-intercept (summary with interactive example, links to lesson, worksheet) http://www.gomath.com/exercises/SlopeEquationYintercept.php Interactive Slope Demonstration (analyze line by changing m and b) (interactive demonstration) http://strader.cehd.tamu.edu/Mathematics/Algebra/Cartesian/slope2.html NLVM: Grapher – tool for graphing and exploring functions (interactive exploration) http://nlvm.usu.edu/en/nav/frames_asid_109_g_4_t_2.html?open=activities
5 Calculate (over a specified period if presented symbolically or as a table) or estimate (if presented graphically) and interpret the average rate of change of a function. ★
F.IF.6, Regentsprep.org: Slope and Rate of Change (lesson) http://www.regentsprep.org/Regents/math/ALGEBRA/AC1/Rate.htm Regentsprep.org: Straight Lines and Slope (lesson) http://www.regentsprep.org/Regents/math/ALGEBRA/AC1/Llines.htm Regentsprep.org: Direct Variation (lesson, practice) http://www.regentsprep.org/Regents/math/ALGEBRA/AO4/indexAO4.htm Keymath.com: Direct Variation (dynamic algebra exploration) http://www.keymath.com/x7041.xml
Code # Common Core State Standards
A.CED.3 Represent constraints by equations or inequalities, and by systems of equations and/or inequalities, and interpret solutions as viable or non-viable options in a modeling context. For example, represent inequalities describing nutritional and cost constraints on combinations of different foods.
A.REI.1 Explain each step in solving a simple equation as following from the equality of numbers asserted at the previous step, starting from the assumption that the original equation has a solution. Construct a viable argument to justify a solution method.

Page 15 of 29
A.REI.10 Understand that the graph of an equation in two variables is the set of all its solutions plotted in the coordinate plane, often forming a curve (which could be a line).
A.REI.11
Explain why the x-coordinates of the points where the graphs of the equations y = f(x) and y = g(x) intersect are the solutions of the equation f(x) = g(x); find the solutions approximately, e.g., using technology to graph the functions, make tables of values, or find successive approximations. Include cases where f(x) and/or g(x) are
linear, polynomial, rational, absolute value, exponential, and logarithmic functions.★
A.REI.12 Graph the solutions to a linear inequality in two variables as a half-plane (excluding the boundary in the case of a strict inequality), and graph the solution set to a system of linear inequalities in two variables as the intersection of the corresponding half-planes.
F.BF.2 Write arithmetic and geometric sequences both recursively and with an explicit formula, use them to model
situations, and translate between the two forms.★
F.LE.1 Distinguish between situations that can be modeled with linear functions and with exponential functions. a. Prove that linear functions grow by equal differences over equal intervals;
and that exponential functions grow by equal factors over equal intervals. b. Recognize situations in which one quantity changes at a constant rate per unit interval relative to
another. Recognize situations in which a quantity grows or decays by a constant percent rate per unit interval relative another.
F.LE.2 Construct linear and exponential functions, including arithmetic and geometric sequences, given a graph, a description of a relationship, or two input-output pairs (include reading these from a table).
F.IF.4 For a function that models a relationship between two quantities, interpret key features of graphs and tables in terms of the quantities, and sketch graphs showing key features given a verbal description of the relationship. Key features include: intercepts; intervals where the function is increasing, decreasing, positive, or negative;
relative maximums and minimums; symmetries; end behavior; and periodicity.★
F.IF.5 Relate the domain of a function to its graph and, where applicable, to the quantitative relationship it describes. For example, if the function h(n) gives the number of person-hours it takes to assemble n engines in a factory, then
the positive integers would be an appropriate domain for the function.★
F.IF.6 Calculate and interpret the average rate of change of a function (presented symbolically or as a table) over a
specified interval. Estimate the rate of change from a graph.★
F.IF.7
Graph functions expressed symbolically and show key features of the graph, by hand in simple cases and using
technology for more complicated cases.★
a. Graph linear functions.

Page 16 of 29
Unit 4 – Systems of Equations and Inequalities (2 x 2)
# STUDENT LEARNING
OBJECTIVES CCSS
Instructional Strategies, Resources, Projects, Integration of Technology
1
Interpret terms, factors, coefficients, and expressions (including complex linear and exponential expressions) in terms of context.
A.SSE.1 1. System of equations word problems (have students set up equations to describe each sentence stressing the use of variables and coefficients): http://www.regentsprep.org/Regents/math/ALGEBRA/AE3/PracWord.htm 2. For interpreting and understanding exponential equations use the “magic penny” activity: http://www.google.com/url?sa=t&rct=j&q=&esrc=s&source=web&cd=1&ved=0CC0QFjAA&url=http%3A%2F%2Fteachers.northwestschool.org%2Fnws%2Farabeya%2Fdocuments%2Fdownload%2Fmagic-penny.pptx%3Fid%3D1650&ei=RCcNUsHWCor54AO6u4HIBg&usg=AFQjCNFqqrbV5BjAexPb0gESa2H-hVoUXQ&sig2=ehL5YEZ2A_wOXHkvUbxT-A&bvm=bv.50768961,d.dmg
2
Find approximate solutions of linear equations by making a table of values, using technology to graph and successive approximations.
A.REI.11
1. Online tutorial on how to solve a linear system using the TI: http://www.tncurriculumcenter.org/learning_expectation/2751 2. Have students plug values in by hand and then use calculator/excel to show the increased precision.
3
Create linear equations in two or more variables to represent relationships between quantities; graph equations on coordinate axes with labels and scales.
A.CED.2 1. Examples of system of equation word problems (have students define variables and set up equations): http://www.kutasoftware.com/FreeWorksheets/Alg1Worksheets/Systems%20of%20Equations%20Word%20Problems.pdf 2. Understanding independent vs. dependent variables, range, and scale of a relationship: http://mathbench.umd.edu/modules/visualization_graph/page01.htm 3. Various examples of relationships between two variables explained in a table. Have students graph the data to see the relationship (focus on proper scaling). An extension could be creating line of best fit/prediction line. http://www.mathgoodies.com/lessons/graphs/line.html

Page 17 of 29
4
Model and describe constraints with linear equations and inequalities and systems of equations and/or inequalities to determine if solutions are viable or non-viable.
A.CED.3 A.REI.1
1. Understanding context between variables of linear equations: http://map.mathshell.org/materials/download.php?fileid=673 2. Understanding a feasible region pictorially (inequalities): http://www.regentsprep.org/Regents/math/ALGEBRA/AE9/GrIneqTR.htm 3. Systems of inequalities examples: http://www.regentsprep.org/Regents/math/ALGEBRA/AE9/GrIneqTR.htm 4. Solving systems whose solution is in the first quadrant (Put problems in context to ensure students understand they want a Q1 solution): http://www.math-drills.com/algebra/algebra_systems_of_equations_solve_by_graphing_001.html
5
Graph equations, inequalities, and systems of inequalities in two variables and explain that the solution to an equation is all points along the curve, the solution to a system of linear functions is the point of intersection, and the solution to a system of inequalities is the intersection of the corresponding half-planes. ★
A.REI.10 A.REI.11 A.REI.12
1. Understanding systems of Linear Inequalities: http://www.purplemath.com/modules/syslneq.htm 2. Be sure to bridge gap between old method of solving for something like x > 3 on a number line to the new way of representing on the Cartesian plane. (relate the shaded regions) 3. Compare and contrast the three options for answers of solving systems of equations and what they look like to the possible options of solutions when solving systems of inequalities.
6
Solve systems of linear equations in two variables graphically and algebraically. Include solutions that have been found by replacing one equation by the sum of that equation and a multiple of the other.
A.REI.5 A.REI.6
1. Good tutorial on the multiple ways of solving systems: http://www.regentsprep.org/Regents/math/ALGEBRA/AE3/indexAE3.htm 2. Potential lesson plan on understanding the possible number of solutions to a system: http://www.learner.org/workshops/algebra/workshop3/lessonplan1.html
Code # Common Core State Standards
A.SSE.1 Interpret expressions that represent a quantity in terms of its context.★
a. Interpret parts of an expression, such as terms, factors, and coefficients. b. Interpret complicated expressions by viewing one or more of their parts as a single entity. For example, interpret P(1+r)n as the product of P and a factor not depending on P.
A.CED.2 Create equations in two or more variables to represent relationships between quantities; graph equations on coordinate axes with labels and scales.

Page 18 of 29

Page 19 of 29
A.CED.3 Represent constraints by equations or inequalities, and by systems of equations and/or inequalities, and interpret solutions as viable or non-viable options in a modeling context. For example, represent inequalities describing nutritional and cost constraints on combinations of different foods.
A.REI.1 Explain each step in solving a simple equation as following from the equality of numbers asserted at the previous step, starting from the assumption that the original equation has a solution. Construct a viable argument to justify a solution method.
A.REI.5 Prove that, given a system of two equations in two variables, replacing one equation by the sum of that equation and a multiple of the other produces a system with the same solutions.
A.REI.6 Solve systems of linear equations exactly and approximately (e.g., with graphs), focusing on pairs of linear equations in two variables.
A.REI.10 Understand that the graph of an equation in two variables is the set of all its solutions plotted in the coordinate plane, often forming a curve (which could be a line).
A.REI.11
Explain why the x-coordinates of the points where the graphs of the equations y = f(x) and y = g(x) intersect are the solutions of the equation f(x) = g(x); find the solutions approximately, e.g., using technology to graph the functions, make tables of values, or find successive approximations. Include cases where f(x) and/or g(x) are
linear, polynomial, rational, absolute value, exponential, and logarithmic functions.★
A.REI.12 Graph the solutions to a linear inequality in two variables as a half-plane (excluding the boundary in the case of a strict inequality), and graph the solution set to a system of linear inequalities in two variables as the intersection of the corresponding half-planes.
Unit 5 – Quadratic Equations (Solving)
# STUDENT LEARNING
OBJECTIVES CCSS
Instructional Strategies, Resources, Projects, Integration of Technology
1
Perform addition, subtraction and multiplication with polynomials and relate it to arithmetic operations with integers. A.APR.1
1. Basic polynomial operations: http://www.kutasoftware.com/FreeWorksheets/Alg2Worksheets/Polynomial%20Basics.pdf 2. Multiplying polynomials with a graphic organizer: http://www.mathguide.com/lessons/Polynomials.html 3. Tutorials of operations with polynomials: http://www.virtualnerd.com/algebra-2/polynomials/operations

Page 20 of 29
2 Use properties of integer exponents to explain and convert between expressions involving radicals and rational exponents, using correct notation. For example, we define 51/3 to be the cube root of 5 because we want (51/3)3 = 5(1/3)3 to hold, so (51/3)3 must equal 5.
N.RN.1 N.RN.2
Regentsprep.org: Exponents—includes exponent rules (lessons, practice) http://www.regentsprep.org/Regents/math/ALGEBRA/AO5/indexAO5.htm Math.com: Exponents – includes exponent rules (lesson, practice) http://www.math.com/school/subject2/lessons/S2U2L2GL.html Gomath.com: Laws of Exponents (summary with interactive example, links to lesson, worksheet) http://www.gomath.com/exercises/exponents.php Powers and Exponents (summary, practice, word search, calculator tutorial) http://argyll.epsb.ca/jreed/math7/strand1/1101.htm Regentsprep.org: Exponents—includes exponent rules (lessons, practice) http://www.regentsprep.org/Regents/math/ALGEBRA/AO5/indexAO5.htm
3
Derive the quadratic formula by completing the square and recognize when there are no real solutions.
A.REI.4
1. Derive the quadratic formula: http://www.mathsisfun.com/algebra/quadratic-equation-derivation.html 2. Understanding the discriminant: http://www.mathwarehouse.com/quadratic/discriminant-in-quadratic-equation.php 3. Practice with the discriminant: http://www.kutasoftware.com/FreeWorksheets/Alg2Worksheets/The%20Discriminant.pdf
4
Solve quadratic equations in one variable using a variety of methods [including inspection (e.g. x2 = 81), factoring, completing the square, and the quadratic formula].
A.REI.4
1. Methods to solving a quadratic equation: http://www.mathwarehouse.com/quadratic/solve-quadratic-equation.php 2. Practice with quadratics: http://regentsprep.org/Regents/math/algtrig/ATE3/quadpractice.htm
5
Interpret parts of expressions in terms of context including those that represent square and cube roots; use the structure of an expression to identify ways to rewrite it. ★
A.SSE.1 A.SSE.2
1. Real world examples of quadratic functions: http://www.mathsisfun.com/algebra/quadratic-equation-real-world.html

Page 21 of 29
6
Manipulate expressions using factoring, completing the square and properties of exponents to produce equivalent forms that highlight particular properties such as the zeros or the maximum or minimum value of the function. ★
A.SSE.3
1. Properties of exponents: http://www.mathplanet.com/education/algebra-1/exponents-and-exponential-functions/properties-of-exponents 2. Completing the square: http://www.mathsisfun.com/algebra/completing-square.html 3. Completing the square to find the vertex: http://www.purplemath.com/modules/sqrvertx.htm 4. Have students “find their match” of their equation in an alternate form
7 Write a function that describes a linear or quadratic relationship between two quantities given in context using an explicit expression, a recursive process, or steps for calculation (include contexts that require a combination of various function types). ★For example, build a function that models the temperature of a cooling body by adding a constant function to a decaying exponential, and relate these functions to the model.
F.BF.1 Regentsprep.org: Equations of Straight Lines Lesson: http://www.regentsprep.org/Regents/math/ALGEBRA/AC1/EqLines.htm Practice: http://www.regentsprep.org/Regents/math/ALGEBRA/AC1/pracEq.htm Explorelearning.com: Defining a Line with Two Points (interactive investigation) http://www.explorelearning.com/index.cfm?method=cResource.dspView&ResourceID=63 Regentsprep.org: Parallels and Perpendiculars (lesson, practice) http://www.regentsprep.org/Regents/math/ALGEBRA/AC3/indexAC3.htm Regentsprep.org: Scatter Plots and Lines of Best Fit (lessons, practice) http://www.regentsprep.org/Regents/math/ALGEBRA/AD4/indexAD4.htm NLVM: Scatter Plot (interactive exploration) http://nlvm.usu.edu/en/nav/frames_asid_144_g_4_t_5.html?open=activities
8 Write functions in different but equivalent forms by manipulating quadratic expressions using methods such as factoring and completing the square, or exponential expressions using the properties of exponents, to reveal and explain properties of the function.
F.IF. 8 Regentsprep.org: Literal Equations (lesson, practice) http://www.regentsprep.org/Regents/math/ALGEBRA/AE4/indexAE4.htm Math.com: Formulas (lesson, practice) http://www.math.com/school/subject2/lessons/S2U3L5GL.html Explorelearning.com: Solving Formulas for Any Variable (interactive practice) http://www.explorelearning.com/index.cfm?method=cResource.dspView&ResourceID=309 Math is fun: How to Complete the Square http://www.mathsisfun.com/algebra/completing-square.html
Regentsprep.org: Scientific Notation (lessons, practice) http://www.regentsprep.org/Regents/math/ALGEBRA/AO2/indexAO2.htm Math.com: Exponents – includes scientific notation (lesson, practice) http://www.math.com/school/subject1/lessons/S1U1L8GL.html
Page 22 of 29
Code # Common Core State Standards
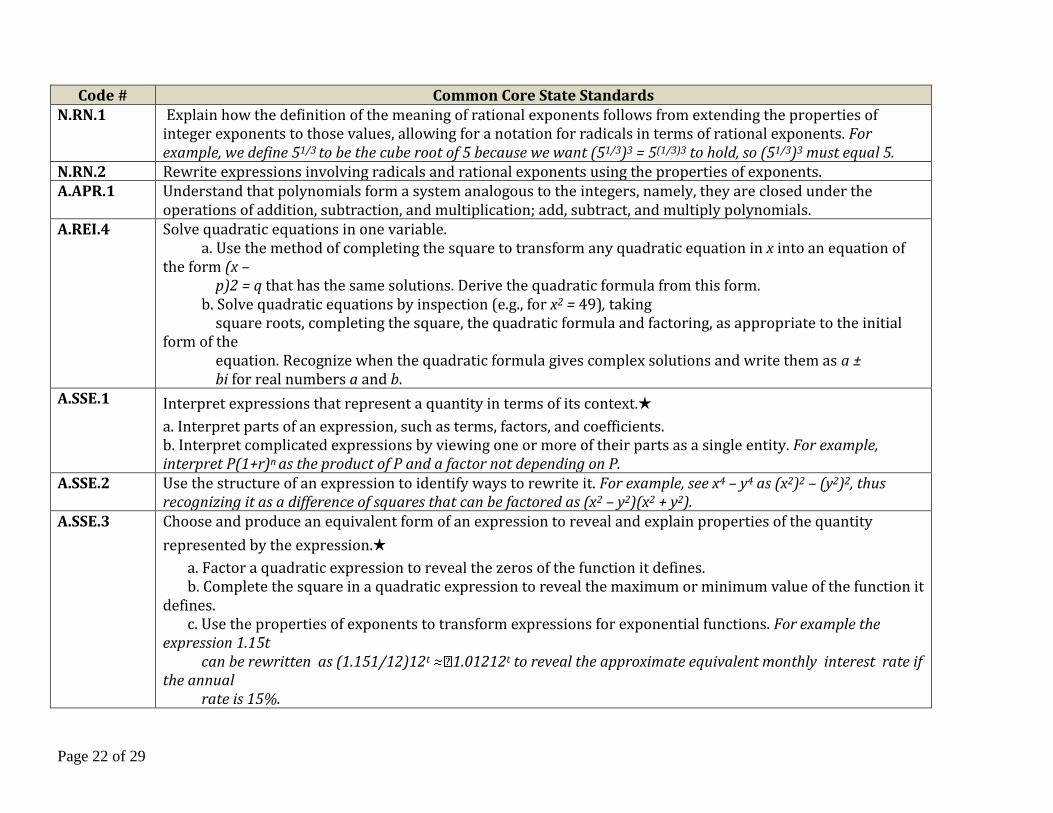
N.RN.1 Explain how the definition of the meaning of rational exponents follows from extending the properties of integer exponents to those values, allowing for a notation for radicals in terms of rational exponents. For example, we define 51/3 to be the cube root of 5 because we want (51/3)3 = 5(1/3)3 to hold, so (51/3)3 must equal 5.
N.RN.2 Rewrite expressions involving radicals and rational exponents using the properties of exponents. A.APR.1 Understand that polynomials form a system analogous to the integers, namely, they are closed under the
operations of addition, subtraction, and multiplication; add, subtract, and multiply polynomials. A.REI.4 Solve quadratic equations in one variable.
a. Use the method of completing the square to transform any quadratic equation in x into an equation of the form (x – p)2 = q that has the same solutions. Derive the quadratic formula from this form. b. Solve quadratic equations by inspection (e.g., for x2 = 49), taking square roots, completing the square, the quadratic formula and factoring, as appropriate to the initial form of the equation. Recognize when the quadratic formula gives complex solutions and write them as a ± bi for real numbers a and b.
A.SSE.1 Interpret expressions that represent a quantity in terms of its context.★
a. Interpret parts of an expression, such as terms, factors, and coefficients. b. Interpret complicated expressions by viewing one or more of their parts as a single entity. For example, interpret P(1+r)n as the product of P and a factor not depending on P.
A.SSE.2 Use the structure of an expression to identify ways to rewrite it. For example, see x4 – y4 as (x2)2 – (y2)2, thus recognizing it as a difference of squares that can be factored as (x2 – y2)(x2 + y2).
A.SSE.3 Choose and produce an equivalent form of an expression to reveal and explain properties of the quantity
represented by the expression.★
a. Factor a quadratic expression to reveal the zeros of the function it defines. b. Complete the square in a quadratic expression to reveal the maximum or minimum value of the function it defines. c. Use the properties of exponents to transform expressions for exponential functions. For example the expression 1.15t can be rewritten as (1.151/12)12t 1.01212t to reveal the approximate equivalent monthly interest rate if the annual rate is 15%.

Page 23 of 29
F.BF.1 Write a function that describes a relationship between two quantities.★
a. Determine an explicit expression, a recursive process, or steps for calculation from a context. b. Combine standard function types using arithmetic operations. For example, build a function that models the temperature of a cooling body by adding a constant function to a decaying exponential, and relate these functions to the model.
F.IF.8 F.IF.8 Write a function defined by an expression in different but equivalent forms to reveal and explain different properties of the function. a. Use the process of factoring and completing the square in a quadratic function to show zeros, extreme values, and symmetry of the graph, and interpret these in terms of a context.
a. Use the properties of exponents to interpret expressions for exponential functions. For example, identify percent rate of change in functions such as y = (1.02)t, y = (0.97)t, y = (1.01)12t, y = (1.2)t/10, and classify them as
representing exponential growth or decay.
Unit 6 – Graphing Functions: Quadratic, Exponential and Other
# STUDENT LEARNING
OBJECTIVES CCSS
Instructional Strategies, Resources, Projects, Integration of Technology
1
Create linear and quadratic equations that represent a relationship between two or more variables. Graph equations on the coordinate axes with labels and scale.
A.CED.2,
1. Graphing quadratic functions: http://www.purplemath.com/modules/grphquad.htm
2 Write linear and exponential functions (e.g. growth/decay and arithmetic and geometric sequences) from graphs, tables, or a description of the relationship, recursively and with an explicit formula, and describe how quantities increase linearly and exponentially over equal intervals.
F.BF.2 F.LE.1 F.LE.2
Cherry Math: equations of exponential functions http://wcherry.math.unt.edu/math1650/exponential.pdf Regentsprep.org: Equations of Straight Lines Lesson: http://www.regentsprep.org/Regents/math/ALGEBRA/AC1/EqLines.htm Practice: http://www.regentsprep.org/Regents/math/ALGEBRA/AC1/pracEq.htm RegentsPrep: exponential growth and decay http://www.regentsprep.org/Regents/math/ALGEBRA/AE7/ExpDecayL.htm

Page 24 of 29
3
Write linear and exponential functions (e.g. growth/decay and arithmetic and geometric sequences) from graphs, tables, or a description of the relationship, recursively and with an explicit formula, and describe how quantities increase linearly and exponentially over equal intervals.
F.BF.2
1. How to determine if a graph represents a linear, exponential, or quadratic function: http://www.virtualnerd.com/algebra-1/quadratic-equations-functions/linear-exponential-comparison/linear-exponential-comparison-graphing-examples/determine-function-type-from-graph 2. Teacher resource for determining an equation of an exponential function: http://www.youtube.com/watch?v=U27PIX6LFTc 3. Have students use Geogebra or other online software to model a curve ax + c understanding what effect a and c have on the graph. 4. Writing linear equations from graphs: http://www.mathplanet.com/education/algebra-1/formulating-linear-equations/writing-linear-equations-using-the-slope-intercept-form
4 Identify the effects of translations [ f(x) + k, k f(x), f(kx), and f(x + k)] on a function and find the value of k given the graphs.
F.BF.3 F.BF.4
PurpleMath.com: shifting of graphs of functions http://www.purplemath.com/modules/fcntrans.htm For Dummies.com: how to shift graphs of functions http://www.dummies.com/how-to/content/how-to-translate-a-functions-graph.html
5
Write a function for a geometric sequence defined recursively, whose domain is a subset of the integers.
F.IF.3
1. Understanding arithmetic vs. Geometric sequences: http://www.purplemath.com/modules/series3.htm 2. Geometric sequences: http://www.regentsprep.org/Regents/math/algtrig/ATP2/GeoSeq.htm 3. Geometric sequences example problems: http://www.kutasoftware.com/FreeWorksheets/Alg2Worksheets/Geometric%20Sequences.pdf
6 Graph functions by hand (in simple cases) and with technology (in complex cases) to describe linear relationships between two quantities and identify, describe, and compare domain and other key features in one or multiple representations. ★
F.IF.5 F.IF.7 F.IF.9,
A.REI.11
1. Give grouped students a word problem that can be described using a linear equation. Have students graph this linear equation and identify the important components in context (domain, range, slope, y-intercept). Then have students compare their graph with others encouraging discussion about why their graphs differ from other groups and what within their word problems indicated such a difference.

Page 25 of 29
7 Sketch the graph of a function that models a relationship between two quantities (expressed symbolically or from a verbal description) showing key features ( including intercepts, minimums/maximums, domain, and rate of change) by hand in simple cases and using technology in more complicated cases and relate the domain of the function to its graph. ★
F.IF.4 F.IF.5 F.1F.7
Explorelearning.com: Standard From of a Linear Equation (interactive investigation) http://www.explorelearning.com/index.cfm?method=cResource.dspView&ResourceID=159 Regentsprep.org: Equations and Graphing Lesson: http://www.regentsprep.org/Regents/math/ALGEBRA/AC1/EqLines2.htm Practice: http://www.regentsprep.org/Regents/math/ALGEBRA/AC1/PracLine.htm Math.com: Graphing Linear Equations (lesson, practice) http://www.math.com/school/subject2/lessons/S2U4L3GL.html Gomath.com: Slope, equation, and Y-intercept (summary with interactive example, links to lesson, worksheet) http://www.gomath.com/exercises/SlopeEquationYintercept.php Interactive Slope Demonstration (analyze line by changing m and b) (interactive demonstration) http://strader.cehd.tamu.edu/Mathematics/Algebra/Cartesian/slope2.html NLVM: Grapher – tool for graphing and exploring functions (interactive exploration) http://nlvm.usu.edu/en/nav/frames_asid_109_g_4_t_2.html?open=activities
8 Compare properties of two functions each represented in a different way (algebraically, graphically, numerically in tables, or by verbal descriptions). For example, given a graph of one quadratic function and an algebraic expression for another, say which has the larger maximum.
F.IF.9 Mathnets.net: Solving Quadratic Equations (interactive practice) http://www.mathsnet.net/algebra/e31.html Mathnets.net: Factorising (factoring) (interactive practice) http://www.mathsnet.net/algebra/e21.html Regentsprep.org: Definition of a Function (lesson, practice) http://www.regentsprep.org/Regents/math/ALGEBRA/AP3/indexAP3.htm NLVM: Function Machine (interactive & visual demonstration of input/output concept) http://nlvm.usu.edu/en/nav/frames_asid_191_g_4_t_2.html Explorelearning.com: Linear Functions – determining whether a relation represented multiple ways is a function http://www.explorelearning.com/index.cfm?method=cResource.dspView&ResourceID=216
Code # Common Core State Standards
A.CED.2 Create equations in two or more variables to represent relationships between quantities; graph equations on coordinate axes with labels and scales.

Page 26 of 29
F.BF.2 Write arithmetic and geometric sequences both recursively and with an explicit formula, use them to model
situations, and translate between the two forms.★
F.BF.3 Identify the effect on the graph of replacing f(x) by f(x) + k, k f(x), f(kx), and f(x + k) for specific values of k (both positive and negative); find the value of k given the graphs. Experiment with cases and illustrate an explanation of the effects on the graph using technology. Include recognizing even and odd functions from their graphs and algebraic expressions for them.
F.BF.4 Find inverse functions. Solve an equation of the form f(x) = c for a simple function f that has an inverse and write an expression for the inverse. For example, f(x) = 2 x3 or f(x) = (x+1)/(x-1) for x ≠ 1.
F.LE.1 Distinguish between situations that can be modeled with linear functions and with exponential functions. c. Prove that linear functions grow by equal differences over equal intervals;
and that exponential functions grow by equal factors over equal intervals. d. Recognize situations in which one quantity changes at a constant rate per unit interval relative to
another. Recognize situations in which a quantity grows or decays by a constant percent rate per unit interval relative another.
F.LE.2 Construct linear and exponential functions, including arithmetic and geometric sequences, given a graph, a description of a relationship, or two input-output pairs (include reading these from a table).
F.IF.3 Recognize that sequences are functions, sometimes defined recursively, whose domain is a subset of the integers. For example, the Fibonacci sequence is defined recursively by f(0) = f(1) = 1, f(n+1) = f(n) + f(n-1) for n ≥ 1.
F.IF.4 For a function that models a relationship between two quantities, interpret key features of graphs and tables in terms of the quantities, and sketch graphs showing key features given a verbal description of the relationship. Key features include: intercepts; intervals where the function is increasing, decreasing, positive, or negative;
relative maximums and minimums; symmetries; end behavior; and periodicity.★
F.IF.5 Relate the domain of a function to its graph and, where applicable, to the quantitative relationship it describes. For example, if the function h(n) gives the number of person-hours it takes to assemble n engines in a factory, then
the positive integers would be an appropriate domain for the function.★
F.IF.7 Graph functions expressed symbolically and show key features of the graph, by hand in simple cases and using
technology for more complicated cases.★
b. Graph linear and quadratic functions and show intercepts, maxima, and minima. c. Graph square root, cube root, and piecewise-defined functions, including step functions and absolute
value functions. Exponential, growth or decay. e. Graph exponential and logarithmic functions, showing intercepts and end behavior, and trigonometric

Page 27 of 29
functions, showing period, midline, and amplitude
F.IF.9 Compare properties of two functions each represented in a different way (algebraically, graphically, numerically in tables, or by verbal descriptions). For example, given a graph of one quadratic function and an algebraic expression for another, say which has the larger maximum.
A.REI.11
Explain why the x-coordinates of the points where the graphs of the equations y = f(x) and y = g(x) intersect are the solutions of the equation f(x) = g(x); find the solutions approximately, e.g., using technology to graph the functions, make tables of values, or find successive approximations. Include cases where f(x) and/or g(x) are
linear, polynomial, rational, absolute value, exponential, and logarithmic functions.★
Unit 7 – Statistics
# STUDENT LEARNING
OBJECTIVES CCSS
Instructional Strategies, Resources, Projects, Integration of Technology
1 Represent data on the real number line (i.e. dot plots, histograms, and box plots) and use statistics to compare and interpret differences in shape, center, and spread in the context of the data (account for effects of outliers).
S.ID.1 S.ID.2 S.ID.3
Laerd Statistics: measures of spread https://statistics.laerd.com/statistical-guides/measures-of-spread-range-quartiles.php Math is Fun: Dot Plots, Histograms http://www.mathsisfun.com/data/dot-plots.html http://www.mathsisfun.com/data/histograms.html Shodor: Box Plots (interactive) http://www.shodor.org/interactivate/activities/BoxPlot/
2 Summarize and interpret categorical data for two categories in two-way frequency tables; recognize associations and trends in the data.
S.ID.5 Math is Fun: Frequency Tables http://www.mathsisfun.com/data/mean-frequency-table.html Internet Retailer: Real-World application of data trends http://www.internetretailer.com/trends/
3 Represent and describe data for two variables on a scatter plot, fit a function to the data, analyze residuals (in order to informally assess fit), and use the function to solve problems.
Uses a given function or choose a function suggested by the context. Emphasize linear and exponential models.
S.ID.6
Regentsprep.org: Scatter Plots and Lines of Best Fit (lessons, practice) http://www.regentsprep.org/Regents/math/ALGEBRA/AD4/indexAD4.htm NLVM: Scatter Plot (interactive exploration) http://nlvm.usu.edu/en/nav/frames_asid_144_g_4_t_5.html?open=activities Fitting Functions to Data http://people.hofstra.edu/stefan_waner/realworld/calctopic1/regression.html

Page 28 of 29
Page 29 of 29
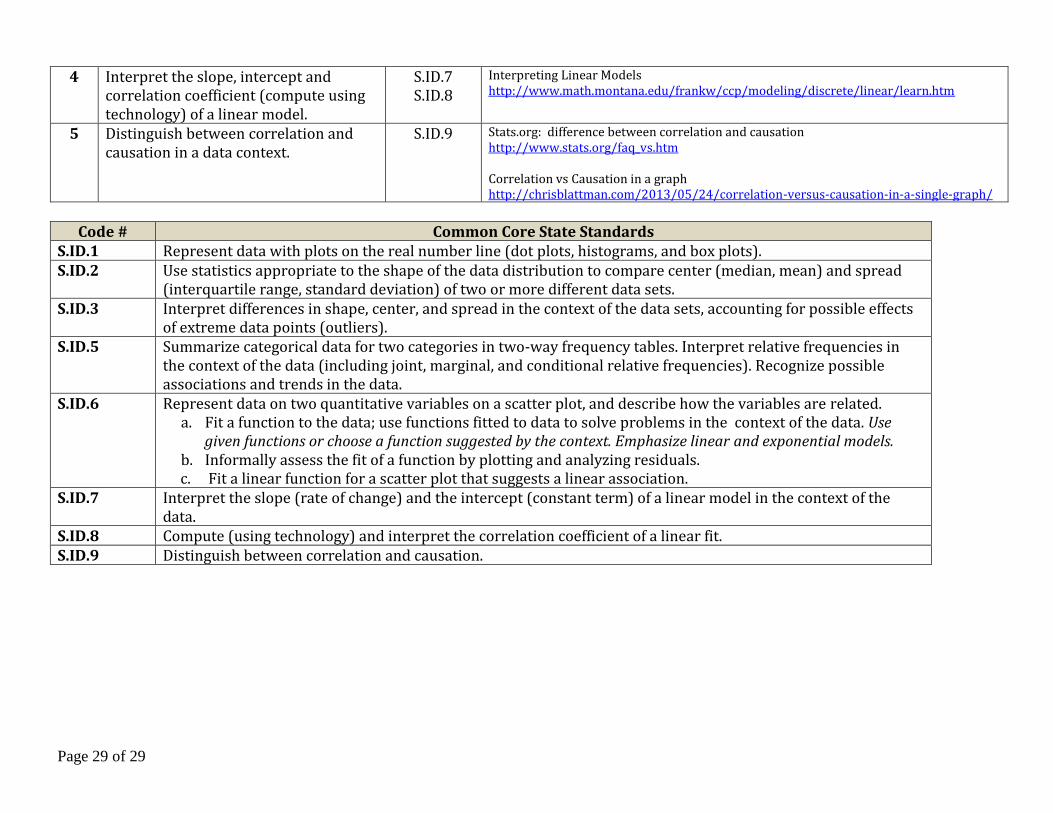
4 Interpret the slope, intercept and correlation coefficient (compute using technology) of a linear model.
S.ID.7 S.ID.8
Interpreting Linear Models http://www.math.montana.edu/frankw/ccp/modeling/discrete/linear/learn.htm
5 Distinguish between correlation and causation in a data context.
S.ID.9 Stats.org: difference between correlation and causation http://www.stats.org/faq_vs.htm Correlation vs Causation in a graph http://chrisblattman.com/2013/05/24/correlation-versus-causation-in-a-single-graph/
Code # Common Core State Standards
S.ID.1 Represent data with plots on the real number line (dot plots, histograms, and box plots). S.ID.2 Use statistics appropriate to the shape of the data distribution to compare center (median, mean) and spread
(interquartile range, standard deviation) of two or more different data sets. S.ID.3 Interpret differences in shape, center, and spread in the context of the data sets, accounting for possible effects
of extreme data points (outliers). S.ID.5 Summarize categorical data for two categories in two-way frequency tables. Interpret relative frequencies in
the context of the data (including joint, marginal, and conditional relative frequencies). Recognize possible associations and trends in the data.
S.ID.6 Represent data on two quantitative variables on a scatter plot, and describe how the variables are related. a. Fit a function to the data; use functions fitted to data to solve problems in the context of the data. Use
given functions or choose a function suggested by the context. Emphasize linear and exponential models. b. Informally assess the fit of a function by plotting and analyzing residuals.
c. Fit a linear function for a scatter plot that suggests a linear association. S.ID.7 Interpret the slope (rate of change) and the intercept (constant term) of a linear model in the context of the
data. S.ID.8 Compute (using technology) and interpret the correlation coefficient of a linear fit. S.ID.9 Distinguish between correlation and causation.